Embed Size (px)
Citation preview
Bridging the Macro and Micro: A Computing Intensive Earthquake Study Using Discovery Net
Y. Guo1, J. G. Liu2, M. Ghanem1, K. Mish3, V. Curcin1, C. Haselwimmer2, D. Sotiriou1, K.K Muraleetharan3 and L. Taylor4 1 Department of Computing, Imperial College London, UK.
2 Department of Earth Science and Engineering, Imperial College London, UK 3 School of Civil Engineering and Environmental Science, University of Oklahoma, USA
4 Terascale LLC, Cedar Crest, New Mexico, USA
ABSTRACT We present the development and use of a novel distributed geo-hazard modeling environment for the analysis and interpretation of large scale earthquake data sets. Our work demonstrates, for the first time, how earthquake-related surface deformation measured from satellite images using imageodesy algorithms is coupled with analysis and simulation using finite-element numerical models. Our work realises a real time distributed analytical environment where analysis and simulation are closely coupled; integrating high performance implementations of image mining components executing on dedicated Discovery Net servers at Imperial College London, UK and high performance implementations of finite-element models executing at specialised servers at the University of Oklahoma, USA. Novel scientific results produced using our data sets provide a valuable insight into earthquake analysis. In addition, our informatics work provides a novel high performance computing framework and methods for the application of complex knowledge discovery methods to understanding earthquake dynamics. Furthermore, the realisation of our distributed computing platform is based on the implementation of a set of open standards, making its results accessible over the Grid to the wider scientific community.
General Terms Algorithms, Measurement.
Keywords Imageodesy, Remote Sensing, Grid computing, Finite Element Modeling, Earthquakes, Tectonics.
1. INTRODUCTION Solid earth science is increasingly reliant on the use of high-performance models to investigate a variety of geophysical processes. In the context of this study, these processes include the evolution of tectonics stresses along fault zones, the dynamics of earthquake generation and fault rupture, and the propagation of earthquake-induced seismic waves. Recent developments in
remote sensing have also allowed investigation of the deformation and surface effects associated with earthquakes with unprecedented detail and spatial coverage. This tremendous work has significantly enriched our understanding of the underlying mechanisms that lead to earthquake activity, the dynamics of rupturing and the surface effects associated with earthquakes.
The application of Grid-based distributed computing to understanding these processes has until now been limited to individual, ad-hoc calculations. The work we demonstrate in this challenge is a first step towards constructing a fully-fledged geoinformatics Grid platform. The core infrastructure used is based on extending the Discovery Net’s [1] generic services for high performance computational and data service composition with domain-specific geoinformatics computational services and knowledge discovery services. The combined infrastructure allows end users to analyse and interpret large-scale earthquake data sets and present these analysis results within a fault and rupture data annotation standard, together with their associated analytical models. The geoinformatics platform developed also publishes the results of the analysis as Grid services through the combination of Discovery Net service authoring mechanisms and KML (Keyhole Mark-up Language), enabling users to visualise results through a variety of tools, including the Google Earth visualisation toolset.
2. BRIDGING MACRO AND MICRO ANALYSIS FOR EARTHQUAKE STUDIES An earthquake is a macro scale tectonic process that produces significant deformation and other earth surface effects. Most earthquake studies that use either field observation, data analysis or model simulation, are usually conducted at the macro scale. However, the macro phenomena of earthquakes are often composed of micro scale displacement features and kinematic indicators (e.g. shear and extensional fracture patterns) showing the dynamic nature of the deformation. An example of this phenomena can be seen with the micro stress field of a rock sample which can bear remarkable similarity to the regional picture of deformation associated with an earthquake.
The macro scale earthquake analysis method that we employ is conducted by analysing satellite images using imageodesy algorithms. Such algorithms map the lateral deformation associated with an earthquake by measuring the differences in the position of corresponding image features between a pre- and post-event image using normalised cross-correlation (NCC). Micro scale analysis of earthquakes is typically conducted by mapping ruptures and faults to define boundary and contact conditions within a finite-element analysis. Such analyses may incorporate other physical parameters, including accurate geometric
Permission to make digital or hard copies of all or part of this work for personal or classroom use is granted without fee provided that copies are not made or distributed for profit or commercial advantage, and that copies bear this notice and the full citation on the first page. To copy otherwise, to republish, to post on servers or to redistribute to lists, requires prior specific permission and/or a fee. SC|05 November 12-18, 2005, Seattle, Washington, USA (c) 2005 ACM 1-59593-061-2/05/0011…$5.00
information for the region, and estimates of local material parameters. More advanced finite-element analyses may deploy coupled physical principles (e.g., the interaction of thermal and mechanical response) to more accurately simulate the underlying geological response. In all cases, the goal of the microscale model is to develop a locally-refined analysis of the underlying geological structure that incorporates appropriate kinematics, physical conservation laws, and constitutive relations for the geologic materials. The future of research into effective earthquake prediction and mitigation may lie on our ability to bridge macro and micro earthquake studies. To date, no attempt has been made to investigate how this can be achieved effectively. The success of such research relies on the ability of scientists to effectively share algorithms, simulations and interpretations.
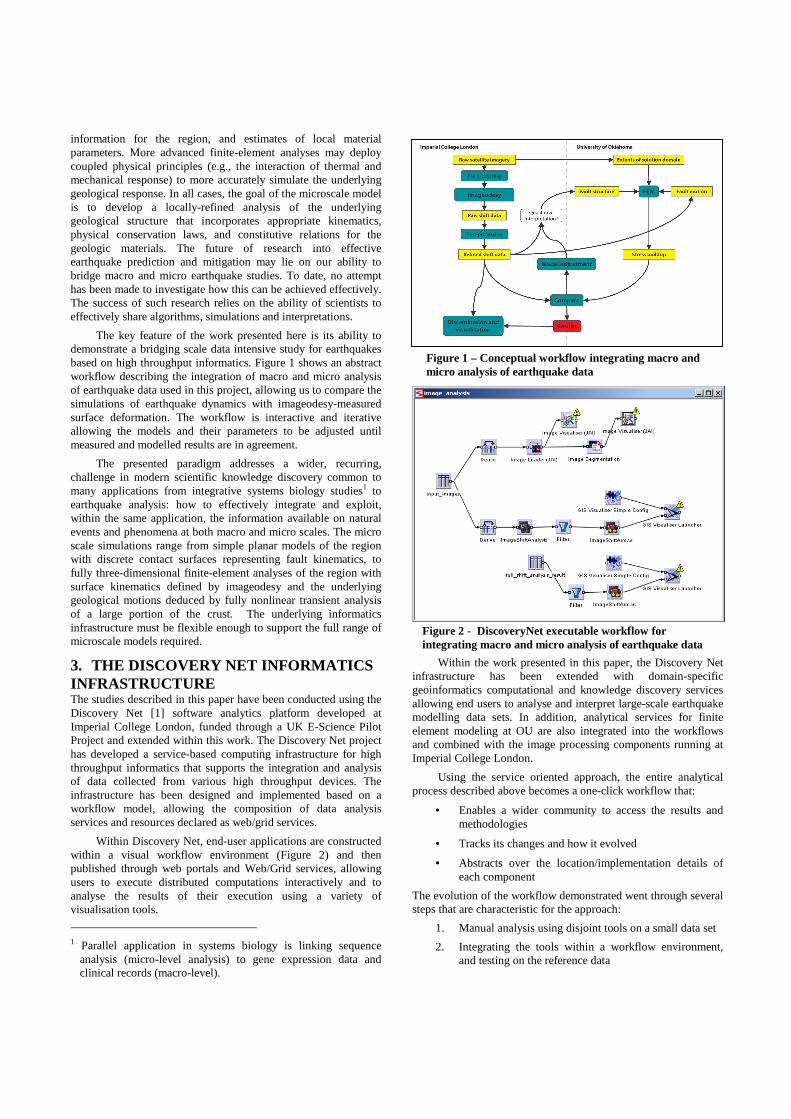
The key feature of the work presented here is its ability to demonstrate a bridging scale data intensive study for earthquakes based on high throughput informatics. Figure 1 shows an abstract workflow describing the integration of macro and micro analysis of earthquake data used in this project, allowing us to compare the simulations of earthquake dynamics with imageodesy-measured surface deformation. The workflow is interactive and iterative allowing the models and their parameters to be adjusted until measured and modelled results are in agreement.
The presented paradigm addresses a wider, recurring, challenge in modern scientific knowledge discovery common to many applications from integrative systems biology studies1 to earthquake analysis: how to effectively integrate and exploit, within the same application, the information available on natural events and phenomena at both macro and micro scales. The micro scale simulations range from simple planar models of the region with discrete contact surfaces representing fault kinematics, to fully three-dimensional finite-element analyses of the region with surface kinematics defined by imageodesy and the underlying geological motions deduced by fully nonlinear transient analysis of a large portion of the crust. The underlying informatics infrastructure must be flexible enough to support the full range of microscale models required.
3. THE DISCOVERY NET INFORMATICS INFRASTRUCTURE The studies described in this paper have been conducted using the Discovery Net [1] software analytics platform developed at Imperial College London, funded through a UK E-Science Pilot Project and extended within this work. The Discovery Net project has developed a service-based computing infrastructure for high throughput informatics that supports the integration and analysis of data collected from various high throughput devices. The infrastructure has been designed and implemented based on a workflow model, allowing the composition of data analysis services and resources declared as web/grid services.
Within Discovery Net, end-user applications are constructed within a visual workflow environment (Figure 2) and then published through web portals and Web/Grid services, allowing users to execute distributed computations interactively and to analyse the results of their execution using a variety of visualisation tools.
1 Parallel application in systems biology is linking sequence
analysis (micro-level analysis) to gene expression data and clinical records (macro-level).
Within the work presented in this paper, the Discovery Net infrastructure has been extended with domain-specific geoinformatics computational and knowledge discovery services allowing end users to analyse and interpret large-scale earthquake modelling data sets. In addition, analytical services for finite element modeling at OU are also integrated into the workflows and combined with the image processing components running at Imperial College London.
Using the service oriented approach, the entire analytical process described above becomes a one-click workflow that:
• Enables a wider community to access the results and methodologies
• Tracks its changes and how it evolved
• Abstracts over the location/implementation details of each component
The evolution of the workflow demonstrated went through several steps that are characteristic for the approach:
1. Manual analysis using disjoint tools on a small data set
2. Integrating the tools within a workflow environment, and testing on the reference data
Figure 2 - DiscoveryNet executable workflow for integrating macro and micro analysis of ear thquake data
Figure 1 – Conceptual workflow integrating macro and micro analysis of ear thquake data
3. Running high-volume data through the workflow
4. Publishing the workflow itself as a service
4. THE KUNLUN EARTHQUAKE Our demonstration is focused on a concrete case study for the analysis of data sets from an Ms 8.1 earthquake that occurred in Nov 2001 in a vast uninhabited area along the eastern Kunlun Mountains in China. The novelty of the approach presented in this paper lies in combining the imageodesy macro-analysis results, as retrieved from large-scale 15 m resolution Landsat-7 ETM+ images, with the finite element micro-analysis, to enable investigation of the physical processes and geological constraints which led to deformation during the earthquake.
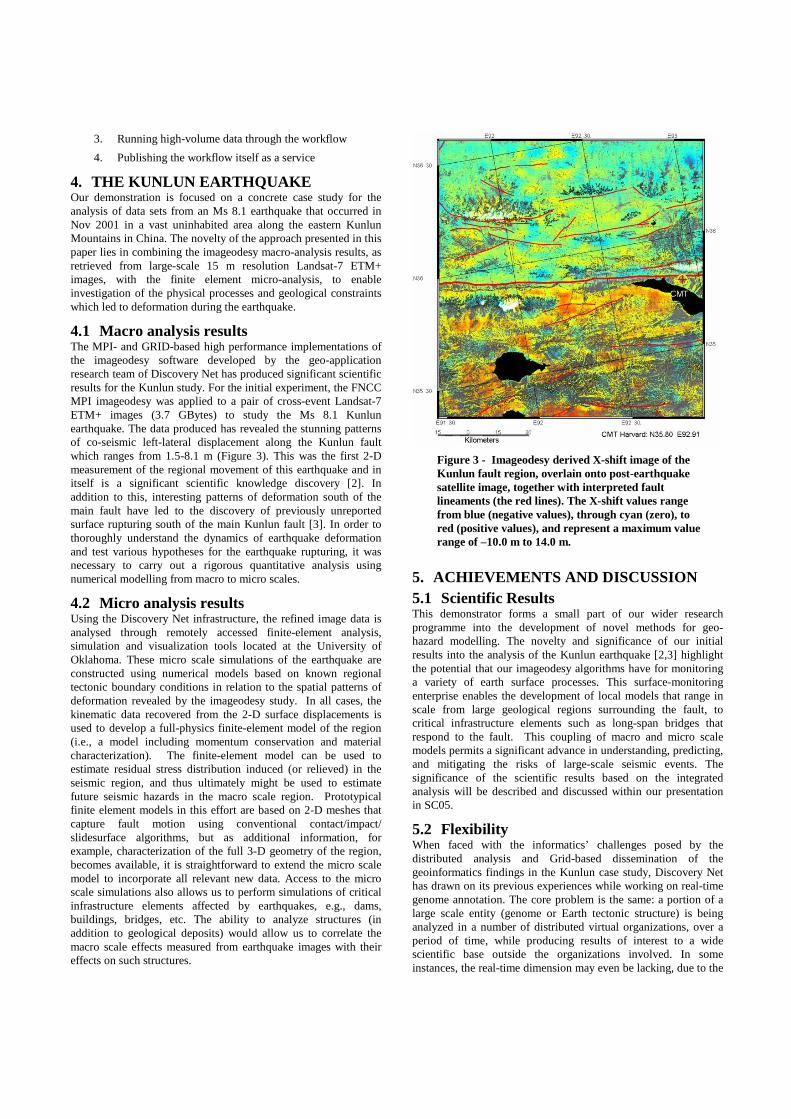
4.1 Macro analysis results The MPI- and GRID-based high performance implementations of the imageodesy software developed by the geo-application research team of Discovery Net has produced significant scientific results for the Kunlun study. For the initial experiment, the FNCC MPI imageodesy was applied to a pair of cross-event Landsat-7 ETM+ images (3.7 GBytes) to study the Ms 8.1 Kunlun earthquake. The data produced has revealed the stunning patterns of co-seismic left-lateral displacement along the Kunlun fault which ranges from 1.5-8.1 m (Figure 3). This was the first 2-D measurement of the regional movement of this earthquake and in itself is a significant scientific knowledge discovery [2]. In addition to this, interesting patterns of deformation south of the main fault have led to the discovery of previously unreported surface rupturing south of the main Kunlun fault [3]. In order to thoroughly understand the dynamics of earthquake deformation and test various hypotheses for the earthquake rupturing, it was necessary to carry out a rigorous quantitative analysis using numerical modelling from macro to micro scales.
4.2 Micro analysis results Using the Discovery Net infrastructure, the refined image data is analysed through remotely accessed finite-element analysis, simulation and visualization tools located at the University of Oklahoma. These micro scale simulations of the earthquake are constructed using numerical models based on known regional tectonic boundary conditions in relation to the spatial patterns of deformation revealed by the imageodesy study. In all cases, the kinematic data recovered from the 2-D surface displacements is used to develop a full-physics finite-element model of the region (i.e., a model including momentum conservation and material characterization). The finite-element model can be used to estimate residual stress distribution induced (or relieved) in the seismic region, and thus ultimately might be used to estimate future seismic hazards in the macro scale region. Prototypical finite element models in this effort are based on 2-D meshes that capture fault motion using conventional contact/impact/ slidesurface algorithms, but as additional information, for example, characterization of the full 3-D geometry of the region, becomes available, it is straightforward to extend the micro scale model to incorporate all relevant new data. Access to the micro scale simulations also allows us to perform simulations of critical infrastructure elements affected by earthquakes, e.g., dams, buildings, bridges, etc. The ability to analyze structures (in addition to geological deposits) would allow us to correlate the macro scale effects measured from earthquake images with their effects on such structures.
5. ACHIEVEMENTS AND DISCUSSION 5.1 Scientific Results This demonstrator forms a small part of our wider research programme into the development of novel methods for geo- hazard modelling. The novelty and significance of our initial results into the analysis of the Kunlun earthquake [2,3] highlight the potential that our imageodesy algorithms have for monitoring a variety of earth surface processes. This surface-monitoring enterprise enables the development of local models that range in scale from large geological regions surrounding the fault, to critical infrastructure elements such as long-span bridges that respond to the fault. This coupling of macro and micro scale models permits a significant advance in understanding, predicting, and mitigating the risks of large-scale seismic events. The significance of the scientific results based on the integrated analysis will be described and discussed within our presentation in SC05.
5.2 Flexibility When faced with the informatics’ challenges posed by the distributed analysis and Grid-based dissemination of the geoinformatics findings in the Kunlun case study, Discovery Net has drawn on its previous experiences while working on real-time genome annotation. The core problem is the same: a portion of a large scale entity (genome or Earth tectonic structure) is being analyzed in a number of distributed virtual organizations, over a period of time, while producing results of interest to a wide scientific base outside the organizations involved. In some instances, the real-time dimension may even be lacking, due to the
Figure 3 - Imageodesy der ived X-shift image of the Kunlun fault region, over lain onto post-ear thquake satellite image, together with interpreted fault lineaments (the red lines). The X-shift values range from blue (negative values), through cyan (zero), to red (positive values), and represent a maximum value range of –10.0 m to 14.0 m.

computationally intensive finite-element analysis, but the central issues always remain the same: analysis management over distributed resources, integrated data model and publishing of analysis workflows and their results to the community.
5.3 Analytics Techniques The macroscale imageodesy analysis used both phase shifting and Fast Normalised Cross Correlation algorithms and was computationally intensive when applied to the 3.5 GByte dataset for the Kunlun earthquake. To execute these successfully, the Grid nodes at London E-Science Centre, Imperial College London were used and a dynamic data farming scheme was designed to make full use of the Grid resources. Of the two algorithms used, phase shifting produced better results (due to its use of frame processing) but FNCC (based on neighbourhood processing) also offered some valuable insights.
The finite-element analysis and visualization tools developed at Oklahoma University allow studying static and dynamic behaviour of solid materials with various boundary conditions. These algorithms have been designed from the start to be able to handle the requisite ubiquitous interoperability that is required to handle fusion of data from a broad spectrum of results.
A large number of 2D and 3D (both proprietary and 3rd party) visualisation tools are integrated to enable integrative data and model analysis. A novel tectonic annotation language based on Keyhole Mark-up Language (KML) from Google [6] has been developed to capture the model results in KML and represent them inside the Google Earth visualiser. The finite element results are readily visualized using off-the-shelf visualization tools that support unstructured datatypes
5.4 Scalability and Robustness With respect to the size of the data, the experiment using ETM+ panchromatic band image indicated that for a 3.7 GByte dataset (1/5 sub-pixel), it takes 24 MPI processor to complete the imageodesy processing in 12 hours [4]. The execution of the finite-element modelling is in the same order of magnitude based on the resolution and parameter set used. Combining the Grid resources from the London E-Science Centre at Imperial College London and the University of Oklahoma’s OSCER Supercomputer Center, the Discovery Net infrastructure was used to orchestrate the execution of analysis workflows that captured the intricacies of results and enabled the interactive invocation of the components to allow interactive knowledge discovery to be conducted. The results of intermediate runs are stored within a dedicated data warehouse. The finite element micro scale analyses range in size from a few thousand elements (for 2-D static response) to much larger datasets required for fully 3-D transient response. Thus coarse micro scale analyses can be run on desktop workstations in order to circumscribe the range of simulations that required the large-scale 3-D.
5.5 Knowledge Discovery It is our view that the infrastructure developed for this study is a first step towards developing the Earth geome – a Grid- based warehouse of tectonic features, geodetic and remote sensing data, and associated modeling results which will be similar in concept to the Human Genome Project [5]. We will be actively seeking collaborators who are interested in using this infrastructure for their own Macro to Micro analysis of earthquake data and also to facilitate the dissemination of their existing research results. This
will provide a valuable resource to the earth sciences’ community and education and will faciliate open collaboration on research into earthquake/tectonic modeling and monitoring.
6. FUTURE WORK Future work will seek to improve the accuracy and resolution of both macro scale monitoring and micro scale modeling. Along side this will need to be improvements in the informatics infrastructure in order to accommodate increasingly computationally intensive tasks. Future work on the macro scale imageodesy analysis will seek to improve the computation times by development of improved and more efficient algorithms. We also aim to apply imageodesy to a range of geohazards involving land surface movement. The use of a variety of other optical remote sensing data is also a priority for future work. In particular the application of macro scale imageodesy analysis to very high resolution satellite imagery (<1m pixels) will enable measurement of local scale lateral deformation associated with earthquakes. Ultimately, the micro scale simulations will be enlarged in scope to permit virtual experiments in crustal dynamics, where more accurate data on geometric, kinematic, and material characterization of the crust can be utilized to estimate future seismic risk over large regions of the earth.
Acknowledgments This work is funded under various grants from the UK e-Science programme. In particular, the work associated with the demonstrator portion of this work is supported by EPSRC grant EP/D50189X/1: Bridging the Macro and Micro: a Computing Intensive Earthquake Study with the specific aim to participate in the SC05 HPC Analytics Challenge.
References [1] S. Al Sairafi, F. S. Emmanouil, M. Ghanem, N. Giannadakis,
Y. Guo, D. Kalaitzopolous, M. Osmond, A. Rowe, J. Syed and P. Wendel. The Design of Discovery Net: Towards Open Grid Services for Knowledge Discovery. International Journal of High Performance Computing Applications. Vol 17 Issue 3. 2003.
[2] J. G. Liu, P. Mason, F. Hilton and H. Lee. Detection of Rapid Erosion in SE SPAIN: A GIS Approach Based on ERS SAR Coherence Imagery. Journal of the American Society for Photogrammetry and Remote Sensing. Vol. 70, No.10 Pages 117-118.
[3] J. G. Liu, C. Haselwimmer and J. W. Cosgrove, 2005. Ruptures found up to 60km south of the major fault zone after 14 Nov 2001 Kunlun earthquake using Landsat-7 ETM+ imagery. IGARSS 2005, 25-29 July 2005, Seoul, Korea.
[4] J. G. Liu and J. Ma. Imageodesy on MPI & grid for co-seismic shift study using satellite imagery In Proceedings of the 3rd UK e-Science All-hands Conference AHM 2004, Pages 232-240. Nottingham UK, September 2004.
[5] Human Genome Project Information: http://www.ornl.gov/sci/techresources/Human_Genome/home.shtml
[6] Google Earth and Keyhole Markup Language: http://earth.google.com/