Embed Size (px)
Citation preview
BRIEF CALCULUS
WITH INTEGRATED PRECALCULUSby
JOSEPH COLLISON
Copyright © 2003, 2004, 2006, 2007, 2008, 2009 by Joseph Collison
All rights reserved
Reproduction or translation of any part of this work beyond that permitted by Sections 107 and108 of the 1976 United States Copyright Act without the permission of the copyright owner isunlawful.
Permission is granted to post this document on all web sites of the City University of New York(CUNY). All students, faculty and staff members of any accredited college or high school mayuse this text in its pdf format and print one copy for personal use free of charge. Sale of the pdffile and any copies printed is prohibited.
Requests for permission to use this document for purposes other than those indicated in theprevious paragraph should be addressed to the author by email directed [email protected].
TABLE OF CONTENTS
CHAPTER ONE: RATE OF CHANGE - AN INTRODUCTION
1.1 Functional Notation 1 - 1 1.2 Average Rate of Change 1 - 3 1.3 Constant Rate of Change - The Straight Line 1 - 10 1.4 Supply and Demand 1 - 18
CHAPTER TWO: BASIC ALGEBRA AND GRAPHING WITH THE TI-89
2.1 Calculator Preliminaries 2 - 1 2.2 Basic Algebra 2 - 5 2.3 Graphing Polynomials 2 - 8 2.4 Mathematical Models and Regression 2 - 18
CHAPTER THREE: THE DERIVATIVE AND POLYNOMIALS
3.1 Instantaneous Rate of Change - The Derivative 3 - 1 3.2 Derivative Formulas for Polynomials 3 - 11 3.3 Polynomial Extrema 3 - 13 3.4 The First Derivative Test 3 - 23 3.5 Cost, Revenue, Profit and Marginal Functions 3 - 26 3.6 Differentials 3 - 33
CHAPTER FOUR: THE SECOND DERIVATIVE
4.1 The Second Derivative and Concavity 4 - 1 4.2 Points of Inflection 4 - 11 4.3 The Second Derivative Test 4 - 18
CHAPTER FIVE: POLYNOMIALS COMPLETED
5.1 Basic Power Functions 5 - 1 5.2 Limits at Infinity for Polynomials 5 - 4 5.3 Intercepts and Summary for Polynomials 5 - 7 5.4 Absolute Extrema 5 - 12 5.5 The Chain Rule 5 - 17 5.6 One Sided Limits and Continuity 5 - 24 5.7 The Product Rule 5 - 28
CHAPTER SIX: RATIONAL FUNCTIONS
6.1 One Sided Limits and Continuity 6 - 1 6.2 Behavior at Infinity 6 - 10 6.3 The Quotient Rule 6 - 18 6.4 Graphing Rational Functions 6 - 24 6.5 General Applications and Average Cost 6 - 32
CHAPTER SEVEN: RADICALS AND PIECEWISE DEFINED FUNCTIONS
7.1 Functions Involving Radicals 7 - 1 7.2 Piecewise Defined Functions 7 - 7 7.3 Implicit Differentiation 7 - 13 7.4 Related Rates 7 - 16
CHAPTER EIGHT: EXPONENTIAL FUNCTIONS
8.1 Exponential Growth and Decay 8 - 1 8.2 Compound Interest and the base e 8 - 8 8.3 Graphs and Derivatives Involving Exponential Functions 8 - 13 8.4 Regression Models and the Logistic Function 8 - 23
CHAPTER NINE: LOGARITHMIC FUNCTIONS
9.1 Inverse Functions 9 - 1 9.2 Logarithmic Functions 9 - 6 9.3 Derivatives Involving the Natural Logarithm 9 - 10 9.4 Graphs Involving the Natural Logarithm 9 - 15
CHAPTER TEN: INTEGRATION
10.1 Differential Equations and the Indefinite Integral 10 - 1 10.2 Integration Formulas 10 - 7 10.3 Accumulated Change - The Definite Integral 10 - 15 10.4 Summation Notation and Area 10 - 21 10.5 The Fundamental Theorem of Calculus 10-29 10.6 Area Between Two Curves 10 - 34 10.7 Applications 10 - 39
CHAPTER ELEVEN: FUNCTIONS OF SEVERAL VARIABLES
11.1 Tables and Contour Graphs 11 - 1 11.2 Partial Derivatives 11 - 6 11.3 Relative Extrema 11 - 17 11.4 Method of Lagrange Multipliers 11 - 23
APPENDIX A: ANSWERS A - 1
Chapter One of Brief Calculus with Integrated Precalculus - Spring 2007.wpd Page 1 - 1
CHAPTER ONERATE OF CHANGE - AN INTRODUCTION
Calculus involves the study of the rate of change of things in the world. People move about andthey speed up, slow down and stand still. The money in a savings account increases anddecreases. Chemical reactions proceed at varying speeds. In order to understand and model ratesof change, it is essential to first understand the most basic rate of change, the average rate ofchange. Before doing that, however, it is desirable to discuss the mathematical notation that willbe used very frequently to describe how one variable behaves in terms of another variable.
1.1 FUNCTIONAL NOTATION
If a ball is dropped from a building that is 1000 feet high, then its height t seconds after it isdropped is given by 1000 - 16t2. This means that the height of the ball is a function of the timeelapsed since it was dropped and the notation that is used is
.h f t t= = −( ) 1000 16 2
Thus, 2 seconds after release the ball is f (2) = 1000 - 16(2)2 = 936 feet high; after 3 seconds itis f (3) = 1000 - 16(3)2 = 856 feet high; after 5 seconds, f (5) = 1000 - 16(5)2 = 600 feet high. Notice that f is not a variable. If it were, then f (2) = 936 would tell you that the value of f was468 and this would mean f (3) should equal 468(3) = 1404, and this is clearly not correct. Alsonotice that f (2 + 3) means f (5) = 600 whereas f (2) + f (3) = 936 + 856 = 1792. The usualdistributive law for multiplication does not work for functions:
f (a) + f (b) usually does NOT equal f (a + b).
The formula for the height of the ball shown above states that, in order to find the height, squarethe time elapsed, multiply it by 16, and then subtract the result from 16. For the example beingconsidered, if t = a seconds represents the time elapsed, then the height is f (a) = 1000 - 16a2. Likewise, the height after b seconds has elapsed is f (b) = 1000 - 16b2. Therefore,f (a) + f (b) = (1000 - 16a2) + (1000 - 16b2) = 2000 - 16a2 - 16b2. However, f (a + b) is the heightof the ball after a + b seconds, that is, since (a + b)2 = (a + b)(a + b) = a2 + 2ab + b2,
f (a + b) = 1000 - 16(a + b)2 = 1000 - 16(a2 + 2ab + b2) = 1000 - 16a2 - 32ab - 16b2.The conceptual difficulty increases when it is desired to know the height 0.1 seconds after time t,that is the height at time t + 0.1. The answer is that 16 times the square of the time should besubtracted from 1000. So the height 0.1 seconds after time t is given by
f (t + 0.1) = 1000 - 16(t + 0.1)2 = 1000 - 16(t2 + 0.2t + 0.01) = 1000 - 16t2 - 3.2t - 0.16.Observe how different this is from both f (t) + f (0.1) = (1000 - 16t2) + (1000 - 16(0.1)2 =2000 - 0.16 - 16t2 = 1999.84 - 16t2 and f (t) + 0.1 = 1000 - 16t2 + 0.1 = 1000.1 - 16t2.
Chapter One of Brief Calculus with Integrated Precalculus - Spring 2007.wpd Page 1 - 2
Whenever there is a risk of confusion, the safest way to proceed is to first rewrite the functionwithout the variable, f ( ) = 1000 - 16( )2 in this case, and then substitute inside all of theparentheses whatever is supposed to appear inside the parentheses. Thus, for example,f (t + t) = 1000 - 16(t + t)2 = 1000 - 16(4t2) = 1000 - 64t2, which, of course, is the same asf (2t) = 1000 - 16(2t)2 = 1000 - 64t2. However, this is much different from both of the following:2 f (t) = 2(1000 - 16t2) = 2000 - 32t2 and f (t) + f (t) = (1000 - 16t2) + (1000 - 16t2) =2000 - 32t2.
Example 1.1: Given , findf x x( ) = +3 5(a) f (4) (b) f (7) (c) f (a) (d) f (4a) (e) 4f (a) (f) f (a + 4)(g) f (a) + f (4) (h) f (a) + 4 (i) f (x + 2) (j) f (x + 2) - f (x)
(k) f (x + h) (l) f (x + h) - f (x) (m) f x h f x
h( ) ( )+ −
Solution:For all parts the desired expression is substituted into f ( ) = 3( ) + 5.
(a) f (4) = 3(4) + 5 = 17 (b) f (7) = 3(7) + 5 = 26 (c) f (a) = 3(a) + 5 = 3a + 5
(d) f (4a) = 3(4a) + 5 = 12a + 5 (e) 4f (a) = 4(3a + 5) = 12a + 20 (see part (c))
(f) f (a + 4) = 3(a + 4) + 5 = 3a + 17 (g) f (a) + f (4) = (3a + 5) + (17) = 3a + 22
(h) f (a) + 4 = (3a + 5) + 4 = 3a + 9 (i) f (x + 2) = 3(x + 2) + 5 = 3x + 11
(j) f (x + 2) - f (x) = (3x + 11) - (3x + 5) = 6 (see part (i))
(k) f (x + h) = 3(x + h) + 5 = 3x + 3h + 5 (l) f (x + h) - f (x) = (3x + 3h + 5) - (3x + 5) = 3h
(m) f x h f x
hhh
( ) ( )+ −= =
3 3
Example 1.2: Given find f x x x( ) = + −3 5 72
Solution:Since f ( ) = 3( )2 + 5( ) - 7, it follows that
= f x h x h x h( ) ( ) ( )+ = + + + −3 5 72 3 2 5 5 72 2( )x xh h x h+ + + + −
so that = f x h f x( ) ( )+ − ( ) ( )3 6 3 5 5 7 3 5 72 2 2x xh h x h x x+ + + + − − + −
= 6 3 52xh h h+ +
and hence = f x h f x
h( ) ( )+ − 3 3 5 3 3 5 3 3 5
2xh h hh
h x hh
x h+ +=
+ += + +
( )
Chapter One of Brief Calculus with Integrated Precalculus - Spring 2007.wpd Page 1 - 3
Exercise Set 1.1
For each of the following: 1. f (x) = 4x - 92. f (x) = 3x2
3. f (x) = 2x2 - 5x + 1
Find (a) f (3) (b) 5f (x) (c) f (5x) (d) f (x + 5) (e) f (x) + f (5)
(f) f (x) + 5 (g) f (2x - 7) (h) f (x + 5) - f (x) (i) f (x + h) - f (x)
4. Given , find f (x + h) - f (x).f xx
( ) =3
2
1.2 AVERAGE RATE OF CHANGE
If a person walks 21 miles in 7 hours, then she is said to have walked at an average speed of
. There is no claim here that she walked 3 miles every hour. It is21 miles7 hours
3 miles per hour=
very likely that she took some breaks and had lunch and during some hours traveled 4 milesinstead of 3 miles. All that is being said is that if she had walked 3 miles in every hour, then shewould have covered the same 21 miles that she actually covered. In more general terminology,the average rate of change of distance with respect to time is 3 miles per hour.
There is a distinction between the average velocity, the average of two (or more) velocities, andthe average speed. The distinction is best illustrated by an example. Suppose a person startswalking at a speed of 3 miles per hour away from her house at 1 pm, travels 10 miles in thatdirection (not necessarily at 3 mph for the entire time), then travels 2 miles back towards home,and then travels another 8 miles away from home, at the end of which she is traveling 2 mph andit is 5 pm. Since she traveled 10 + 2 + 8 = 20 miles and the time elapsed is 5 pm - 1 pm = 4hours, her average speed is 20 miles/ 4 hours = 5 mph. The average of the two velocities given is(3 mph + 2 mph) /2 = 2.5 mph. The average velocity is found by noting that although shetraveled 20 miles, she did not end up 20 miles from where she started. Due to the backtrackingfor 2 miles, she ended up (10 - 2) + 8 = 16 miles from where she started. This distance is used tocompute the average velocity of 16 miles/4 hours = 4 mph. This textbook is concerned only withthe average velocity:
Average velocity = Ending distance - Starting distance
Time elapsed
Chapter One of Brief Calculus with Integrated Precalculus - Spring 2007.wpd Page 1 - 4
Example 1.3: A ball is thrown upwards from the top of a building. Its height above theground below t seconds after it is thrown upwards is given by f (t) = -16t2 + 48t + 160.(a) How high is the building?(b) How many seconds does it take for the ball to hit the ground below?(c) What is the average velocity during the first two seconds?(d) What is the average velocity between 1 and 4 seconds after its release?
Solution: (a) The height of the building is the height of the ball when it is released. Since t = 0
corresponds to when the ball is released, that height is f (0) = 160 feet high. (b) When the ball hits the ground the height of the ball above the ground is 0 feet high. So
the value of t that is desired is the value for which f (t) = 0 feet high. That is, we arelooking for the solution to 0 = f (t) = -16t2 + 48t + 160. In order to solve this quadraticequation, the right hand side must be factored. Recall that the first step in factoring is tofirst factor any number that is common to all the terms. In this case 16 is common to allof the terms. Since it is desirable to have a positive coefficient for t2, -16 should befactored:0 = -16(t2 - 3t - 10). Since the coefficient of t2 in the expression inside the parentheses isone, two numbers whose product is -10 and whose sum is -3 are needed to finish thefactoring. The numbers +2 and -5 work: 0 = -16(t2 - 3t - 10) = -16(t + 2)(t - 5). Since theproduct of (t + 2) and (t - 5) must be 0, one of those factors must equal 0. Either t + 2 = 0or t - 5 = 0, so that either t = -2 or t = 5. Since -2 seconds does not make sense for theproblem as worded, the answer must be 5 seconds.
(c) In part (a) it was shown that when the ball was released it was 160 feet above the ground. In order to answer the question, the height above ground 2 seconds after its release isneeded. That height is f (2) = -16(2)2 + 48(2) + 160 = 192 feet. So the average velocityis (192 feet - 160 feet)/ 2 seconds = 16 feet per second.
(d) One second after release the ball is -16(1)2 + 48(1) + 160 = 192 feet high. Four secondsafter release it is -16(4)2 + 48(4) + 160 = 96 feet high. So the average velocity is(96 feet - 192 feet)/(4 seconds - 1 second) = -96 feet/ 3 seconds = -32 feet per second,where the negative result indicates that, overall, the ball is traveling towards the groundrather than away from it. Notice that the ball is at the same height at 1 second afterrelease as it is at 2 seconds after release. That is due to the fact that it is on its way up at 1second but on its way down at 2 seconds.
Note: It is assumed that you are familiar with the method of solution reviewed in part (b). Thatis, in many cases an equation is solved by first making sure all terms are on one side and0 is on the other side; then factor; then set each factor equal to 0 and solve. For example,in order to solve 8x2 = 2x3 + 6x, you would first move the 8x2 to the right side (to get 0 onthe left), arrange the terms in order according to the power of x, and then factor:0 = 2x3 - 8x2 + 6x = 2x(x2 - 4x + 3) = 2x(x - 1)(x - 3). The possible solutions are thenx = 0, 1 and 3. Make sure you do not overlook the fact that the factor 2x can equal 0when x is 0.
Chapter One of Brief Calculus with Integrated Precalculus - Spring 2007.wpd Page 1 - 5
Figure 1.1
Figure 1.2
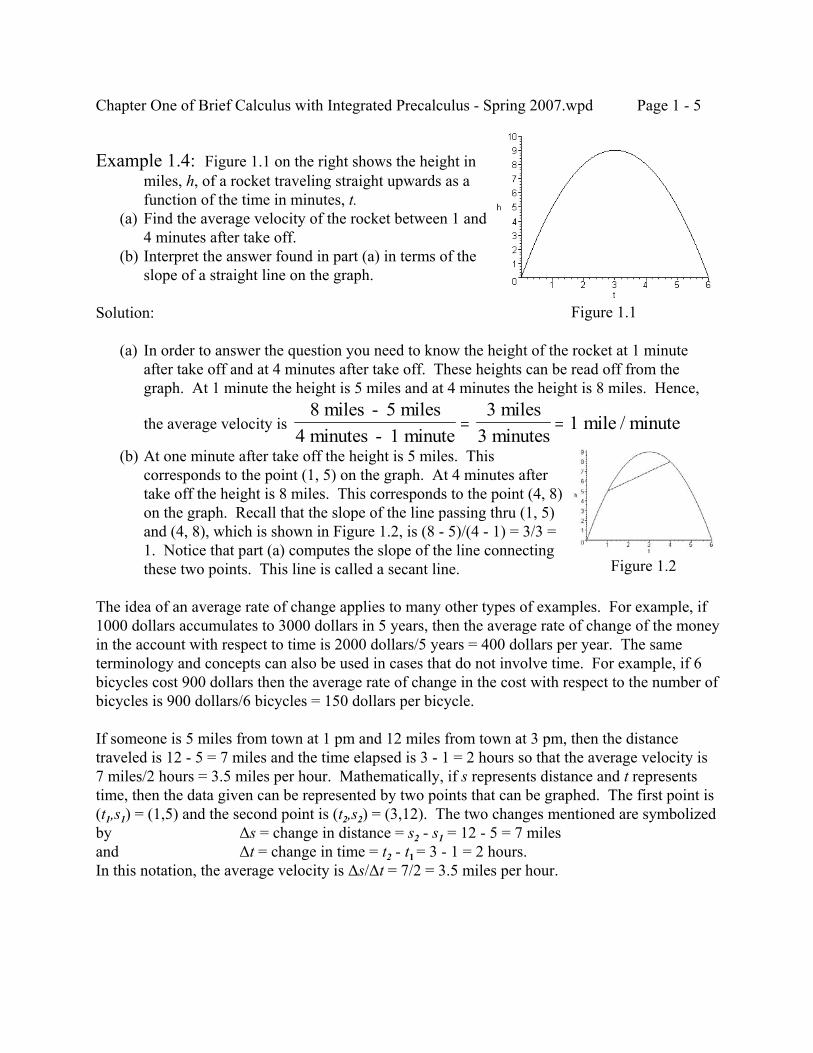
Example 1.4: Figure 1.1 on the right shows the height inmiles, h, of a rocket traveling straight upwards as afunction of the time in minutes, t.
(a) Find the average velocity of the rocket between 1 and4 minutes after take off.
(b) Interpret the answer found in part (a) in terms of theslope of a straight line on the graph.
Solution:
(a) In order to answer the question you need to know the height of the rocket at 1 minuteafter take off and at 4 minutes after take off. These heights can be read off from thegraph. At 1 minute the height is 5 miles and at 4 minutes the height is 8 miles. Hence,
the average velocity is 8 miles - 5 miles
4 minutes - 1 minute3 miles
3 minutes1 mile / minute= =
(b) At one minute after take off the height is 5 miles. Thiscorresponds to the point (1, 5) on the graph. At 4 minutes aftertake off the height is 8 miles. This corresponds to the point (4, 8)on the graph. Recall that the slope of the line passing thru (1, 5)and (4, 8), which is shown in Figure 1.2, is (8 - 5)/(4 - 1) = 3/3 =1. Notice that part (a) computes the slope of the line connectingthese two points. This line is called a secant line.
The idea of an average rate of change applies to many other types of examples. For example, if1000 dollars accumulates to 3000 dollars in 5 years, then the average rate of change of the moneyin the account with respect to time is 2000 dollars/5 years = 400 dollars per year. The sameterminology and concepts can also be used in cases that do not involve time. For example, if 6bicycles cost 900 dollars then the average rate of change in the cost with respect to the number ofbicycles is 900 dollars/6 bicycles = 150 dollars per bicycle.
If someone is 5 miles from town at 1 pm and 12 miles from town at 3 pm, then the distancetraveled is 12 - 5 = 7 miles and the time elapsed is 3 - 1 = 2 hours so that the average velocity is7 miles/2 hours = 3.5 miles per hour. Mathematically, if s represents distance and t representstime, then the data given can be represented by two points that can be graphed. The first point is(t1,s1) = (1,5) and the second point is (t2,s2) = (3,12). The two changes mentioned are symbolizedby ∆s = change in distance = s2 - s1 = 12 - 5 = 7 milesand ∆t = change in time = t2 - t1 = 3 - 1 = 2 hours.In this notation, the average velocity is ∆s/∆t = 7/2 = 3.5 miles per hour.
Chapter One of Brief Calculus with Integrated Precalculus - Spring 2007.wpd Page 1 - 6
Fact 1.1: If the position (distance) of an object at time t1 is s1 and the position ofthe object at time t2 is s2, then
Average velocity =change in distance
change in time= =
−−
∆∆
st
s st t
2 1
2 1
Given two points (x1, y1) and (x2, y2), the average rate of change of thevariable y with respect to the variable x is
Average rate = change in change in
yx
yx
y yx x
= =−−
∆∆
2 1
2 1
This is also called the slope of the secant line that connects the points. Infunctional notation, if y = f (x) then, since y1 = f (x1) and
y2 = f (x2), Average rate =f x f x
x x( ) ( )2 1
2 1
−−
Example 1.5: According to The 1999 World Almanac, the median age (in years) for the firstmarriage of females in the United States is shown in the table below.
Year 1960 1970 1980 1990Age 20.3 20.8 22.0 23.9
Find the average rate of change in this median age between:(a) 1960 and 1990 (b) 1960 and 1970 (c) 1980 and 1990
Solution: (a) years (of median age) per (calendar) year.239 20 3
1990 19603630
012. . .
.−−
= =
(b) years (of median age) per (calendar) year.208 20 3
1970 19600 05
. ..
−−
=
(c) years (of median age) per (calendar) year.239 22 0
1990 1980019
. ..
−−
=
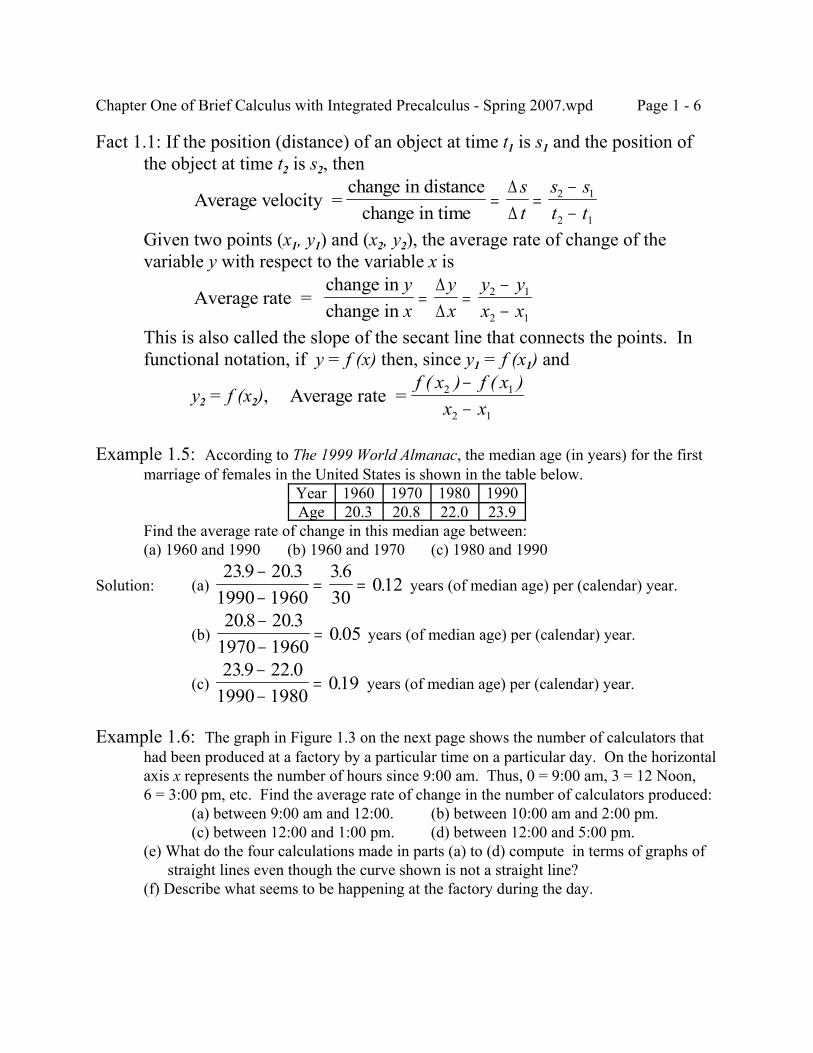
Example 1.6: The graph in Figure 1.3 on the next page shows the number of calculators thathad been produced at a factory by a particular time on a particular day. On the horizontalaxis x represents the number of hours since 9:00 am. Thus, 0 = 9:00 am, 3 = 12 Noon,6 = 3:00 pm, etc. Find the average rate of change in the number of calculators produced:
(a) between 9:00 am and 12:00. (b) between 10:00 am and 2:00 pm.(c) between 12:00 and 1:00 pm. (d) between 12:00 and 5:00 pm.
(e) What do the four calculations made in parts (a) to (d) compute in terms of graphs of straight lines even though the curve shown is not a straight line?(f) Describe what seems to be happening at the factory during the day.
Chapter One of Brief Calculus with Integrated Precalculus - Spring 2007.wpd Page 1 - 7
Figure 1.3
Figure 1.4
Solution:
(a) As of 9:00 am (t = 0) no calculators have been produced. By 12:00 (t = 3) approximately450 calculators have been produced. Since 450 calculators were produced in 3 hours, theaverage rate of change is 450/3 = 150 calculators per hour.
(b) At 10:00 am (t = 1) about 50 calculators have been produced. At 2:00 pm (t = 5) about540 have been produced. So the average rate is
(540 - 50) calculators/(5 - 1) hours = 490/4 = 122.5 calculators per hour. (c) For t = 3, N . 450; for t = 4, N . 450. So the average rate is 0 calculators per hour. (d) For t = 3, N . 450; for t = 8, N . 1000. So the average rate is
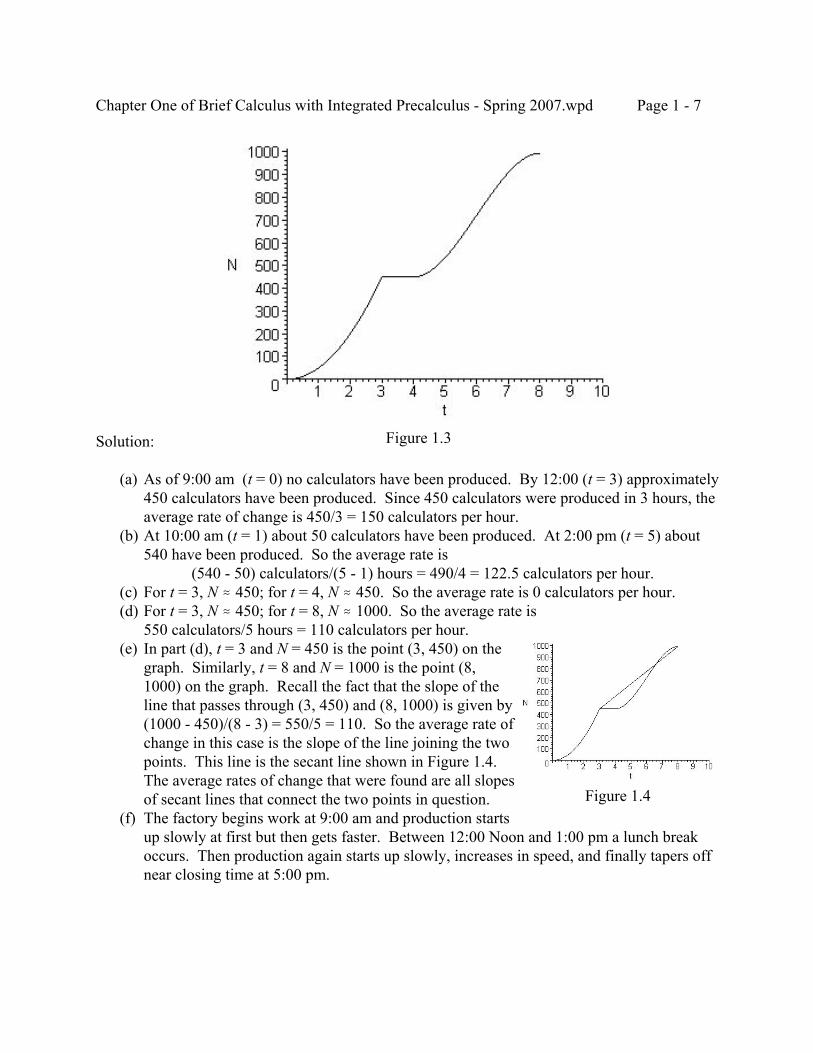
550 calculators/5 hours = 110 calculators per hour. (e) In part (d), t = 3 and N = 450 is the point (3, 450) on the
graph. Similarly, t = 8 and N = 1000 is the point (8,1000) on the graph. Recall the fact that the slope of theline that passes through (3, 450) and (8, 1000) is given by(1000 - 450)/(8 - 3) = 550/5 = 110. So the average rate ofchange in this case is the slope of the line joining the twopoints. This line is the secant line shown in Figure 1.4. The average rates of change that were found are all slopesof secant lines that connect the two points in question.
(f) The factory begins work at 9:00 am and production startsup slowly at first but then gets faster. Between 12:00 Noon and 1:00 pm a lunch breakoccurs. Then production again starts up slowly, increases in speed, and finally tapers offnear closing time at 5:00 pm.
Chapter One of Brief Calculus with Integrated Precalculus - Spring 2007.wpd Page 1 - 8
Figure 1.5
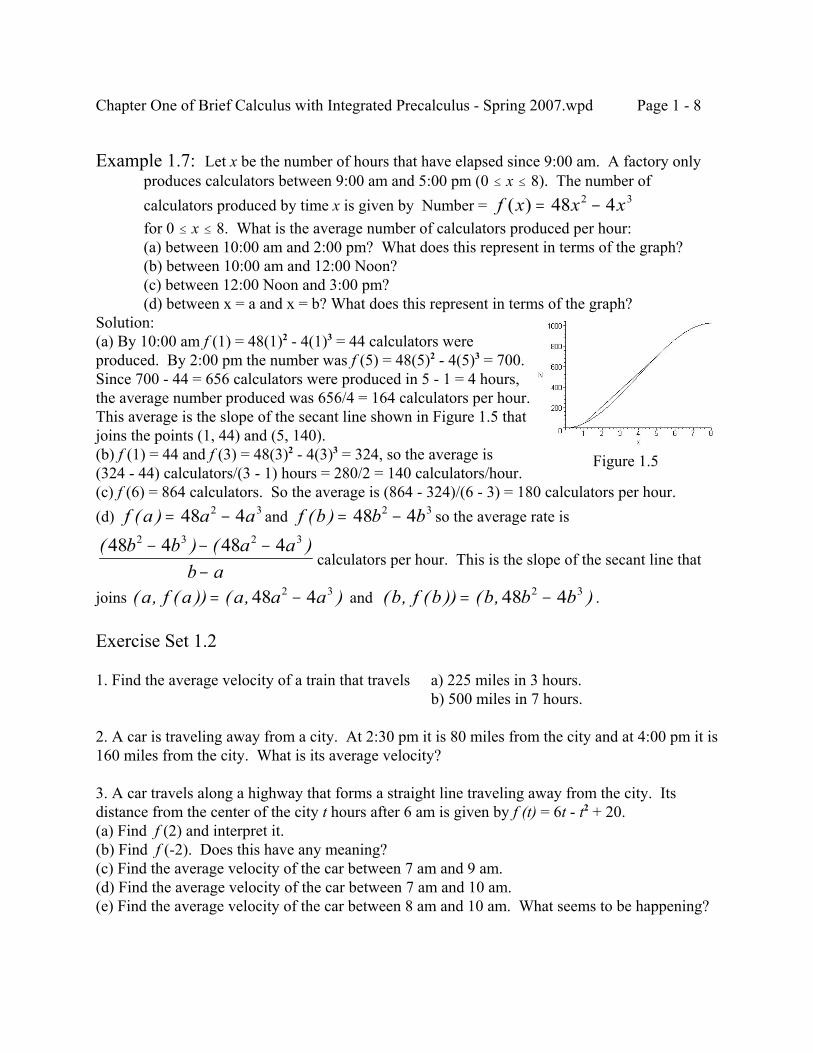
Example 1.7: Let x be the number of hours that have elapsed since 9:00 am. A factory onlyproduces calculators between 9:00 am and 5:00 pm (0 # x # 8). The number ofcalculators produced by time x is given by Number = f x x x( ) = −48 42 3
for 0 # x # 8. What is the average number of calculators produced per hour:(a) between 10:00 am and 2:00 pm? What does this represent in terms of the graph?(b) between 10:00 am and 12:00 Noon?(c) between 12:00 Noon and 3:00 pm?(d) between x = a and x = b? What does this represent in terms of the graph?
Solution:(a) By 10:00 am f (1) = 48(1)2 - 4(1)3 = 44 calculators wereproduced. By 2:00 pm the number was f (5) = 48(5)2 - 4(5)3 = 700. Since 700 - 44 = 656 calculators were produced in 5 - 1 = 4 hours,the average number produced was 656/4 = 164 calculators per hour. This average is the slope of the secant line shown in Figure 1.5 thatjoins the points (1, 44) and (5, 140).(b) f (1) = 44 and f (3) = 48(3)2 - 4(3)3 = 324, so the average is(324 - 44) calculators/(3 - 1) hours = 280/2 = 140 calculators/hour.(c) f (6) = 864 calculators. So the average is (864 - 324)/(6 - 3) = 180 calculators per hour.(d) and so the average rate isf a a a( ) = −48 42 3 f b b b( ) = −48 42 3
calculators per hour. This is the slope of the secant line that( ) ( )48 4 48 42 3 2 3b b a a
b a− − −
−joins and .( , ( )) ( , )a f a a a a= −48 42 3 ( , ( )) ( , )b f b b b b= −48 42 3
Exercise Set 1.2
1. Find the average velocity of a train that travels a) 225 miles in 3 hours.b) 500 miles in 7 hours.
2. A car is traveling away from a city. At 2:30 pm it is 80 miles from the city and at 4:00 pm it is160 miles from the city. What is its average velocity?
3. A car travels along a highway that forms a straight line traveling away from the city. Itsdistance from the center of the city t hours after 6 am is given by f (t) = 6t - t2 + 20.(a) Find f (2) and interpret it.(b) Find f (-2). Does this have any meaning?(c) Find the average velocity of the car between 7 am and 9 am.(d) Find the average velocity of the car between 7 am and 10 am.(e) Find the average velocity of the car between 8 am and 10 am. What seems to be happening?
Chapter One of Brief Calculus with Integrated Precalculus - Spring 2007.wpd Page 1 - 9
Figure 1.6
Figure 1.7
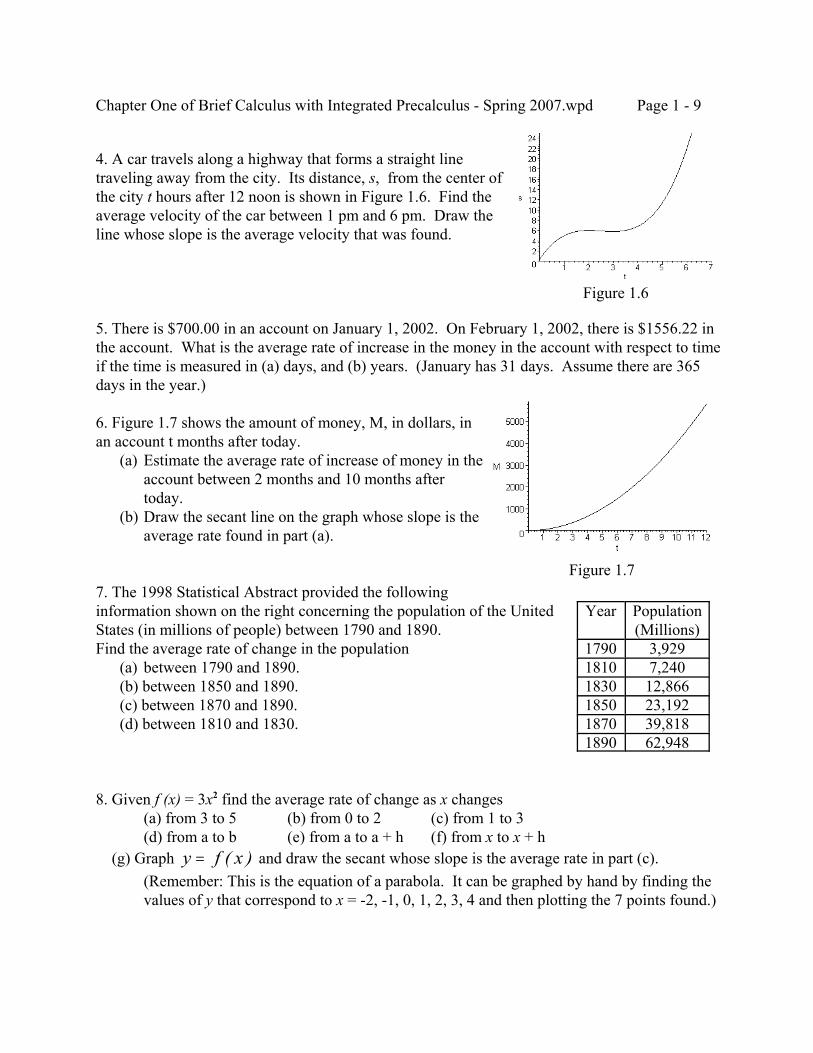
4. A car travels along a highway that forms a straight linetraveling away from the city. Its distance, s, from the center ofthe city t hours after 12 noon is shown in Figure 1.6. Find theaverage velocity of the car between 1 pm and 6 pm. Draw theline whose slope is the average velocity that was found.
5. There is $700.00 in an account on January 1, 2002. On February 1, 2002, there is $1556.22 inthe account. What is the average rate of increase in the money in the account with respect to timeif the time is measured in (a) days, and (b) years. (January has 31 days. Assume there are 365days in the year.)
6. Figure 1.7 shows the amount of money, M, in dollars, inan account t months after today. (a) Estimate the average rate of increase of money in the
account between 2 months and 10 months aftertoday.
(b) Draw the secant line on the graph whose slope is theaverage rate found in part (a).
7. The 1998 Statistical Abstract provided the followinginformation shown on the right concerning the population of the UnitedStates (in millions of people) between 1790 and 1890.Find the average rate of change in the population (a) between 1790 and 1890. (b) between 1850 and 1890. (c) between 1870 and 1890. (d) between 1810 and 1830.
Year Population(Millions)
1790 3,9291810 7,2401830 12,8661850 23,1921870 39,8181890 62,948
8. Given f (x) = 3x2 find the average rate of change as x changes(a) from 3 to 5 (b) from 0 to 2 (c) from 1 to 3(d) from a to b (e) from a to a + h (f) from x to x + h
(g) Graph and draw the secant whose slope is the average rate in part (c).y f x= ( )(Remember: This is the equation of a parabola. It can be graphed by hand by finding thevalues of y that correspond to x = -2, -1, 0, 1, 2, 3, 4 and then plotting the 7 points found.)
Chapter One of Brief Calculus with Integrated Precalculus - Spring 2007.wpd Page 1 - 10
1.3 CONSTANT RATE OF CHANGE - THE STRAIGHT LINE
Many situations in life involve a constant rate of change. A car may be traveling at a constantspeed by using cruise control. The value of a machine may be depreciating at a constant rate fortax purposes. Water might be filling a pool at a constant rate. This section concerns themathematical description of situations such as these where there is a constant rate of change.
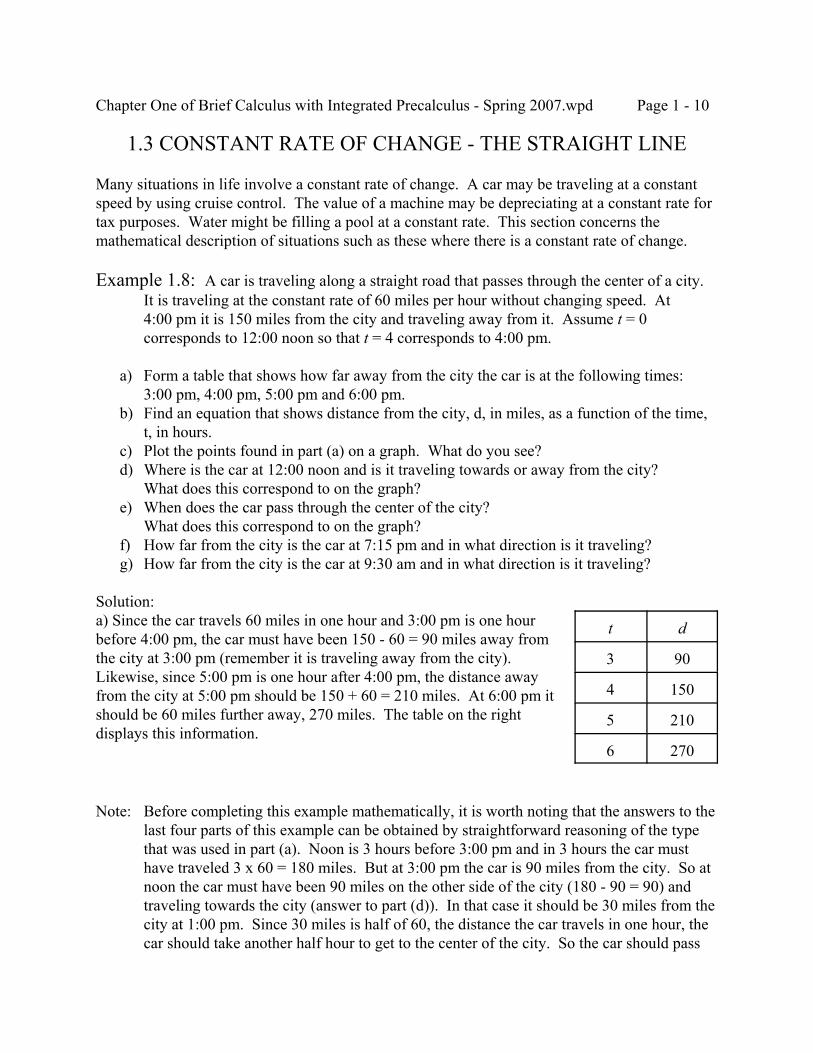
Example 1.8: A car is traveling along a straight road that passes through the center of a city.It is traveling at the constant rate of 60 miles per hour without changing speed. At4:00 pm it is 150 miles from the city and traveling away from it. Assume t = 0corresponds to 12:00 noon so that t = 4 corresponds to 4:00 pm.
a) Form a table that shows how far away from the city the car is at the following times:3:00 pm, 4:00 pm, 5:00 pm and 6:00 pm.
b) Find an equation that shows distance from the city, d, in miles, as a function of the time,t, in hours.
c) Plot the points found in part (a) on a graph. What do you see? d) Where is the car at 12:00 noon and is it traveling towards or away from the city?
What does this correspond to on the graph? e) When does the car pass through the center of the city?
What does this correspond to on the graph? f) How far from the city is the car at 7:15 pm and in what direction is it traveling? g) How far from the city is the car at 9:30 am and in what direction is it traveling?
Solution:a) Since the car travels 60 miles in one hour and 3:00 pm is one hourbefore 4:00 pm, the car must have been 150 - 60 = 90 miles away fromthe city at 3:00 pm (remember it is traveling away from the city). Likewise, since 5:00 pm is one hour after 4:00 pm, the distance awayfrom the city at 5:00 pm should be 150 + 60 = 210 miles. At 6:00 pm itshould be 60 miles further away, 270 miles. The table on the rightdisplays this information.
t d
3 90
4 150
5 210
6 270
Note: Before completing this example mathematically, it is worth noting that the answers to thelast four parts of this example can be obtained by straightforward reasoning of the typethat was used in part (a). Noon is 3 hours before 3:00 pm and in 3 hours the car musthave traveled 3 x 60 = 180 miles. But at 3:00 pm the car is 90 miles from the city. So atnoon the car must have been 90 miles on the other side of the city (180 - 90 = 90) andtraveling towards the city (answer to part (d)). In that case it should be 30 miles from thecity at 1:00 pm. Since 30 miles is half of 60, the distance the car travels in one hour, thecar should take another half hour to get to the center of the city. So the car should pass
Chapter One of Brief Calculus with Integrated Precalculus - Spring 2007.wpd Page 1 - 11
Figure 1.8 Figure 1.9
through the center of the city at 1:30 pm (answer to part (e)). At 6:00 pm the car is 270miles from the city, so at 7:00 pm it should be 270 + 60 = 330 miles from the city. Sincethere are 60 minutes in an hour, the car travels one mile in one minute. So at 7:15 pm itshould be 15 miles further along at a distance of 345 miles from the city (answer topart(f)). You should use the above type of reasoning to confirm that at 9:30 am the car istraveling towards the city and is 240 miles away from it.
b) Notice that multiplying the number of hours elapsed by 60 produces the number of milestraveled. That is, 60 mph x 1 hour = 60 miles, 60 mph x 2 hours = 120 miles, 60 mph x 3 hours= 180 miles, etc.. So we would like to use as the desired function d = 60t. However, this is notcorrect since, for t = 4, the distance should be d = 150 but 60 x 4 = 240. This suggests that theformula could be made correct by subtracting 90 since 240 - 90 = 150. So d = 60t - 90 is areasonable choice for a function. Its correctness can be verified by substituting t = 3, 4, 5 and 6and observing that it produces the desired result: the entries in the table of part (a) are obtainedand the car moves 60 miles every hour.
An alternate (more mathematical) way to obtain the correct function is as follows. The speed ofthe car is equal to the number of miles traveled divided by the time elapsed. Since the car is 150miles from the city at t = 4, if the car is d miles from the city at time t, then the distance traveledbetween 4:00 pm (t = 4) and time t is d - 150 miles and the time elapsed is t - 4 hours.
As a result, . Cross multiplying produces60 mph = distance traveled
time elapsed=
−−
dt
1504
d - 150 = 60(t - 4) so that d - 150 = 60t - 240. Adding 150 to both sides provides the final result d = 60t - 90.
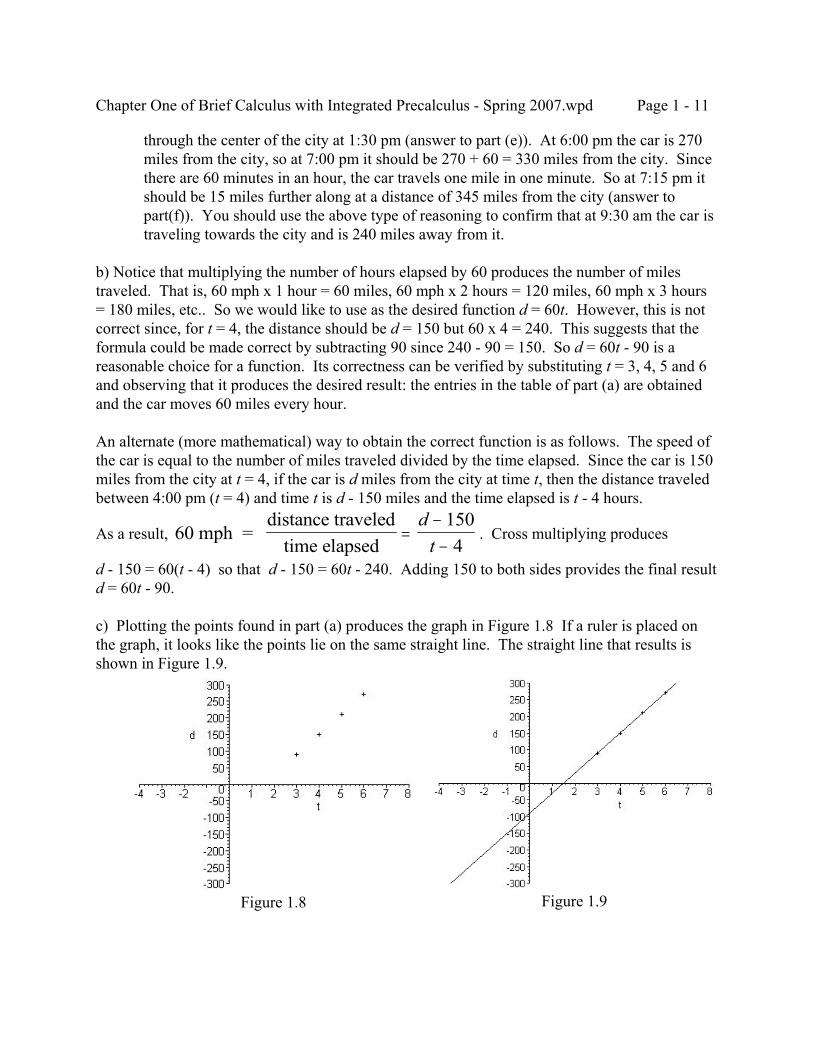
c) Plotting the points found in part (a) produces the graph in Figure 1.8 If a ruler is placed onthe graph, it looks like the points lie on the same straight line. The straight line that results isshown in Figure 1.9.
Chapter One of Brief Calculus with Integrated Precalculus - Spring 2007.wpd Page 1 - 12
d) Noon corresponds to t = 0. Hence, the distance is d = 60(0) - 90 = -90. The negative valueindicates the car has not gotten to the city yet and the car is traveling towards the city at that time. On the graph this corresponds to the point where the straight line intersects the vertical axis sincethat is the point for which t = 0.e) At the center of the city the car is 0 miles from the center, so d = 0. Hence 0 = d = 60t - 90. The solution to this is t = 90/60 = 3/2 = 1.5 hours. Since 0.5 hours corresponds to half an hour,the time at which the car is at the center of the city is 1:30 pm. On the graph this corresponds tothe point where the straight line intersects the horizontal axis since that is the point for whichd = 0.f) 7:15 pm is 7 and one quarter hours after noom, so it corresponds to t = 7.25. The distancefrom the city is d = 60(7.25) - 90 = 345 miles and the car is traveling away from the city.g) 9:30 am is 2 and a half hours prior to noon, so t = -2.5. The distance is d = 60(-2.5) - 90 = -240 miles, so the car is 240 miles away from the city and traveling towards it.
The following two facts summarize the ideas developed above and provide some additionalinformation that should already be known concerning straight lines.
Fact 1.2: A straight line represents a constant rate of change. If (x1,y1) and (x2,y2)are two points on the straight line, then the constant rate of change of thevariable y with respect to the variable x is the slope of the line and is given
by .myx
y yx x
= = = =−−
Constant Rate of ChangeChange in yChange in x
∆∆
2 1
2 1
The slope indicates how much y changes if x increases by one unit.
Fact 1.3: If the slope of a straight line is known (or has been found by using theprevious fact) and it passes through the point (x0, y0), then the equation ofthe line can be found from the point slope form of the line
y y m x x− = −0 0( )The slope-intercept form of the straight line is
y mx b= +where b is the y-intercept, the value of y when x = 0, the point on thevertical axis that the graph of the straight line passes through.
Note: It is best if the reasoning used to solve part (b) of the previous example is understood. Itis basically the justification for the previous two facts. However, once the previous twofacts are understood, part (b) is usually solved in a more straightforward manner. Sincethere is a constant rate of change of 60 mph so that the equation that models the problemis a straight line with a slope of 60, and the line passes through (4, 150), the equation ofthe line is given by d - 150 = 60(t - 4) from which it follows that d = 60t - 90.
Chapter One of Brief Calculus with Integrated Precalculus - Spring 2007.wpd Page 1 - 13
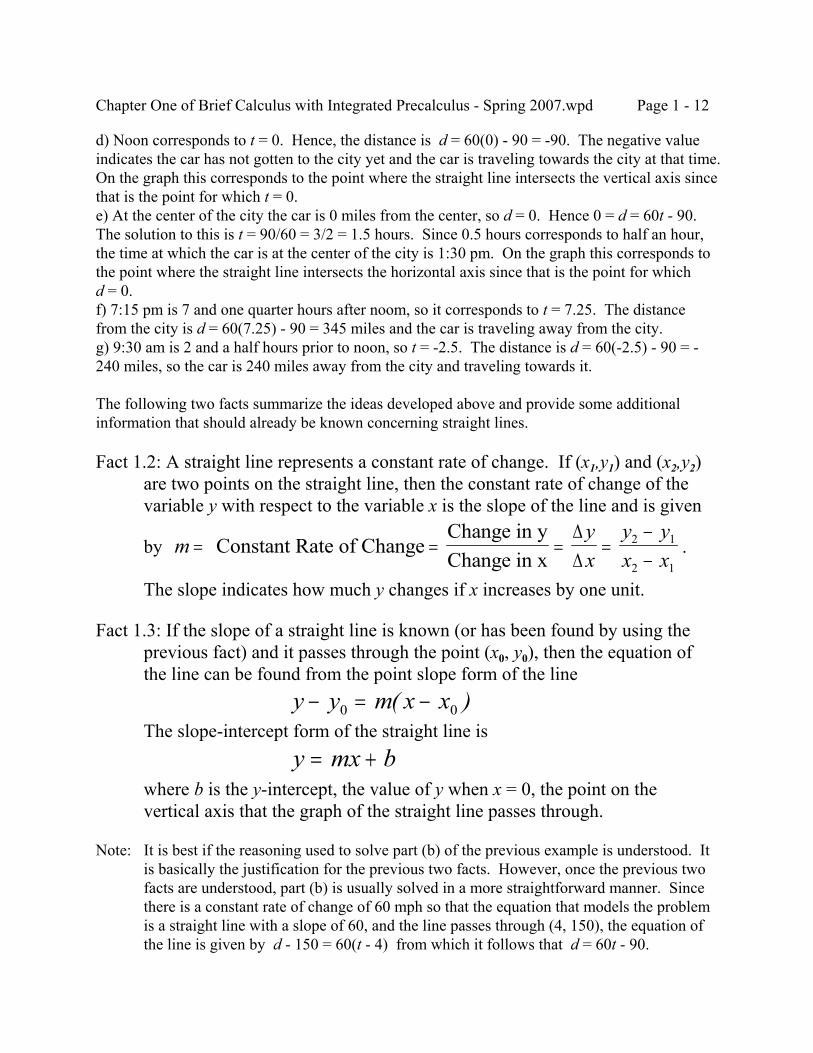
Fact 1.4: The equation of a horizontal line is given by y = b. It has slope 0 and itsy-intercept is b. The equation of a vertical line is given by x = a. Its slopedoes not exist (it is NOT 0) and its x-intercept is a.
Example 1.9: A straight line passes through the point (5, -7). Find its equation ifa) It is a vertical line.b) It is a horizontal line.c) It also passes through (-2, 4).
Solution:a) A vertical line has the form x = a. Since the value of x at the point (5, -7) is 5, the equationmust be x = 5.b) A horizontal line has the form y = b. Since the value of y at the point (5, -7) is -7, the equationmust be y = - 7.
c) The slope must be found first. It is . Therefore, the equation mustm =− −− −
=−
= −4 7
2 511
7117
( )
be so that and hence sincey x− − = − −( ) ( )7 5117 y x+ = − +7 11
7557 y x= − +11
767
.557
557
497
677− = − =
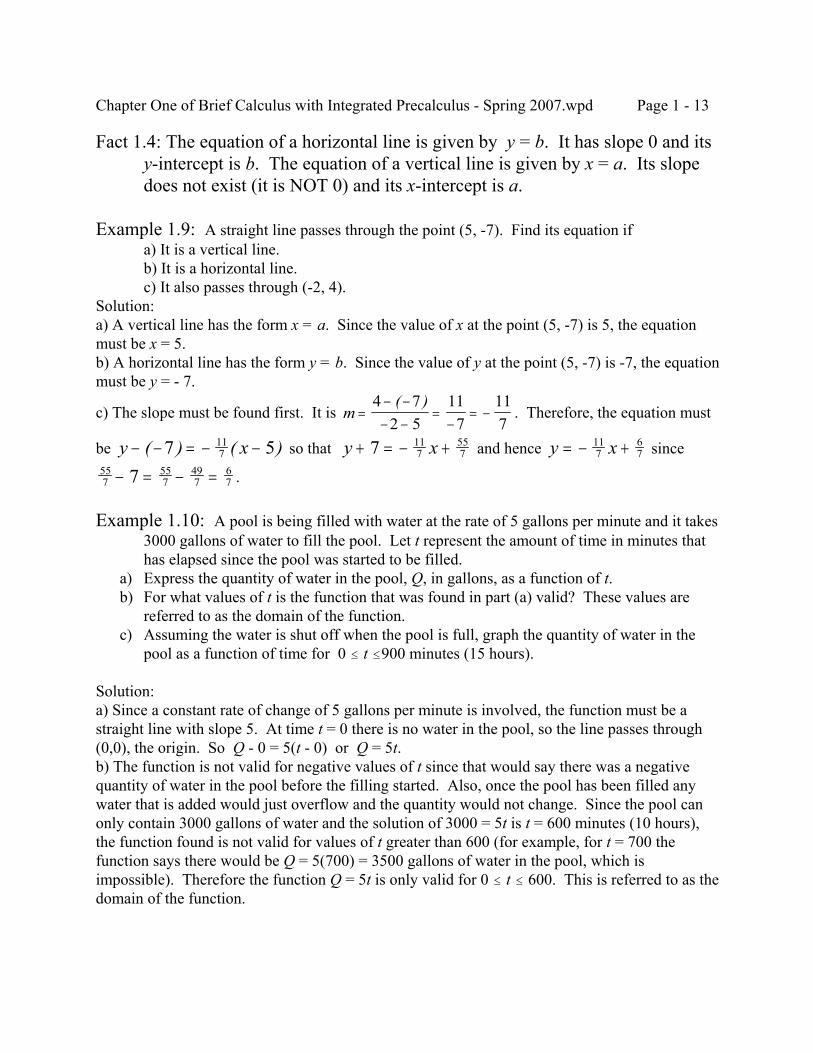
Example 1.10: A pool is being filled with water at the rate of 5 gallons per minute and it takes3000 gallons of water to fill the pool. Let t represent the amount of time in minutes thathas elapsed since the pool was started to be filled.
a) Express the quantity of water in the pool, Q, in gallons, as a function of t. b) For what values of t is the function that was found in part (a) valid? These values are
referred to as the domain of the function. c) Assuming the water is shut off when the pool is full, graph the quantity of water in the
pool as a function of time for 0 # t #900 minutes (15 hours).
Solution:a) Since a constant rate of change of 5 gallons per minute is involved, the function must be astraight line with slope 5. At time t = 0 there is no water in the pool, so the line passes through(0,0), the origin. So Q - 0 = 5(t - 0) or Q = 5t.b) The function is not valid for negative values of t since that would say there was a negativequantity of water in the pool before the filling started. Also, once the pool has been filled anywater that is added would just overflow and the quantity would not change. Since the pool canonly contain 3000 gallons of water and the solution of 3000 = 5t is t = 600 minutes (10 hours),the function found is not valid for values of t greater than 600 (for example, for t = 700 thefunction says there would be Q = 5(700) = 3500 gallons of water in the pool, which isimpossible). Therefore the function Q = 5t is only valid for 0 # t # 600. This is referred to as thedomain of the function.
Chapter One of Brief Calculus with Integrated Precalculus - Spring 2007.wpd Page 1 - 14
Figure 1.10
Figure 1.11
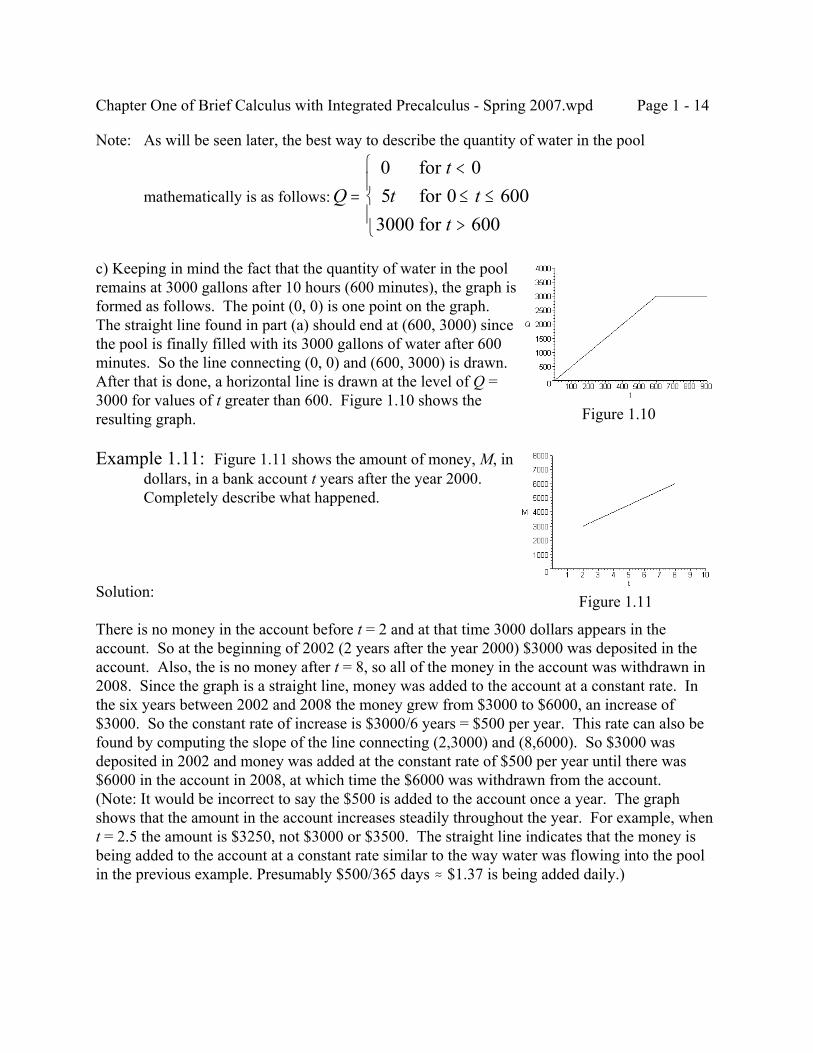
Note: As will be seen later, the best way to describe the quantity of water in the pool
mathematically is as follows: Qt
t tt
=<≤ ≤>
0 for for
3000 for
05 0 600
600
c) Keeping in mind the fact that the quantity of water in the poolremains at 3000 gallons after 10 hours (600 minutes), the graph isformed as follows. The point (0, 0) is one point on the graph. The straight line found in part (a) should end at (600, 3000) since the pool is finally filled with its 3000 gallons of water after 600minutes. So the line connecting (0, 0) and (600, 3000) is drawn. After that is done, a horizontal line is drawn at the level of Q =3000 for values of t greater than 600. Figure 1.10 shows theresulting graph.
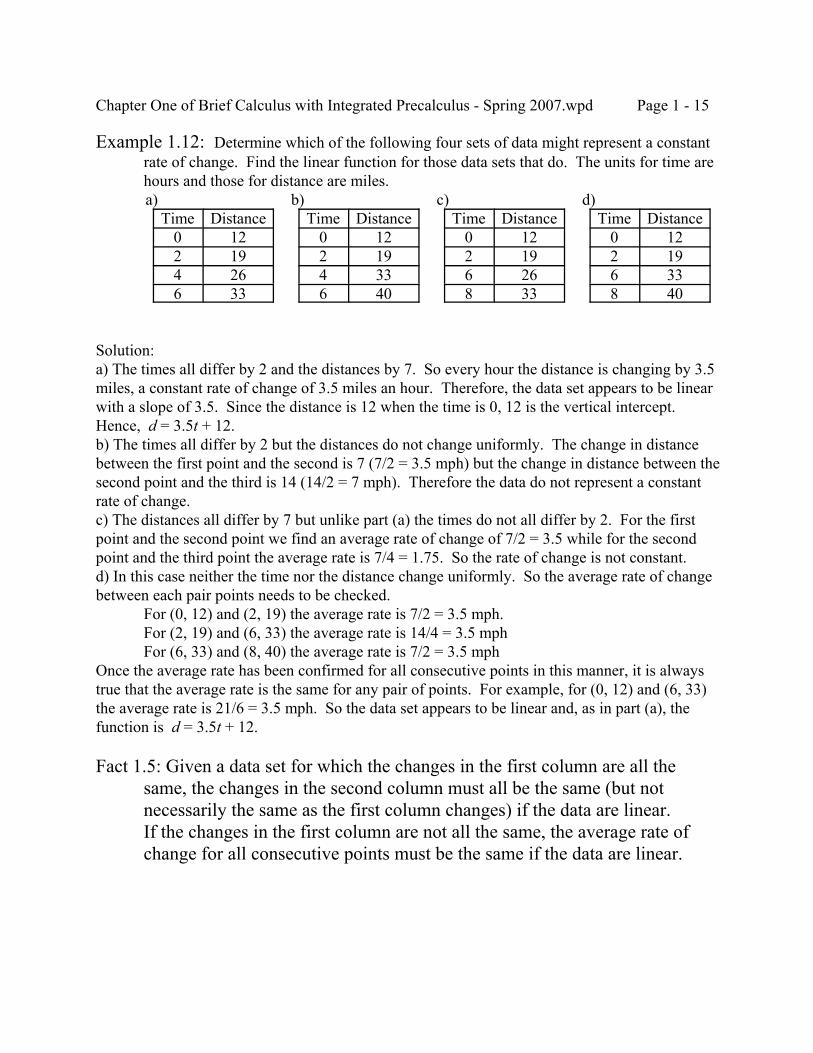
Example 1.11: Figure 1.11 shows the amount of money, M, indollars, in a bank account t years after the year 2000. Completely describe what happened.
Solution:
There is no money in the account before t = 2 and at that time 3000 dollars appears in theaccount. So at the beginning of 2002 (2 years after the year 2000) $3000 was deposited in theaccount. Also, the is no money after t = 8, so all of the money in the account was withdrawn in2008. Since the graph is a straight line, money was added to the account at a constant rate. Inthe six years between 2002 and 2008 the money grew from $3000 to $6000, an increase of$3000. So the constant rate of increase is $3000/6 years = $500 per year. This rate can also befound by computing the slope of the line connecting (2,3000) and (8,6000). So $3000 wasdeposited in 2002 and money was added at the constant rate of $500 per year until there was$6000 in the account in 2008, at which time the $6000 was withdrawn from the account.(Note: It would be incorrect to say the $500 is added to the account once a year. The graphshows that the amount in the account increases steadily throughout the year. For example, whent = 2.5 the amount is $3250, not $3000 or $3500. The straight line indicates that the money isbeing added to the account at a constant rate similar to the way water was flowing into the poolin the previous example. Presumably $500/365 days . $1.37 is being added daily.)
Chapter One of Brief Calculus with Integrated Precalculus - Spring 2007.wpd Page 1 - 15
Example 1.12: Determine which of the following four sets of data might represent a constantrate of change. Find the linear function for those data sets that do. The units for time arehours and those for distance are miles.a)
Time Distance0 122 194 266 33
b)Time Distance
0 122 194 336 40
c)Time Distance
0 122 196 268 33
d)Time Distance
0 122 196 338 40
Solution:a) The times all differ by 2 and the distances by 7. So every hour the distance is changing by 3.5miles, a constant rate of change of 3.5 miles an hour. Therefore, the data set appears to be linearwith a slope of 3.5. Since the distance is 12 when the time is 0, 12 is the vertical intercept. Hence, d = 3.5t + 12.b) The times all differ by 2 but the distances do not change uniformly. The change in distancebetween the first point and the second is 7 (7/2 = 3.5 mph) but the change in distance between thesecond point and the third is 14 (14/2 = 7 mph). Therefore the data do not represent a constantrate of change.c) The distances all differ by 7 but unlike part (a) the times do not all differ by 2. For the firstpoint and the second point we find an average rate of change of 7/2 = 3.5 while for the secondpoint and the third point the average rate is 7/4 = 1.75. So the rate of change is not constant.d) In this case neither the time nor the distance change uniformly. So the average rate of changebetween each pair points needs to be checked.
For (0, 12) and (2, 19) the average rate is 7/2 = 3.5 mph.For (2, 19) and (6, 33) the average rate is 14/4 = 3.5 mphFor (6, 33) and (8, 40) the average rate is 7/2 = 3.5 mph
Once the average rate has been confirmed for all consecutive points in this manner, it is alwaystrue that the average rate is the same for any pair of points. For example, for (0, 12) and (6, 33)the average rate is 21/6 = 3.5 mph. So the data set appears to be linear and, as in part (a), thefunction is d = 3.5t + 12.
Fact 1.5: Given a data set for which the changes in the first column are all thesame, the changes in the second column must all be the same (but notnecessarily the same as the first column changes) if the data are linear.If the changes in the first column are not all the same, the average rate ofchange for all consecutive points must be the same if the data are linear.
Chapter One of Brief Calculus with Integrated Precalculus - Spring 2007.wpd Page 1 - 16
Exercise Set 1.3
1. A machine costs $120,000 and its useful life is 8 years. One method accountants may use todepreciate property for tax purposes is straight line depreciation which assumes the machineloses its value at a constant rate over the 8 year period (i.e. it is assumed the machine is worth $0at the end of 8 years).
a) What is the constant rate of depreciation?b) Write the value of the machine, v, as a function of time t.c) After how many years is the machine worth $75,000?
2. A straight line passes through (1, 4). Find its equation ifa) the line is a horizontal line.b) the line is a vertical line.c) the line also passes through (-2, 5).
3. A straight line has a y-intercept of 7. Find its equation if a) the line is horizontal.b) the line is vertical.c) the line also passes through (3, 13).
4. A straight line has a x-intercept of -2. Find its equation ifa) the line is horizontal.b) the line is vertical.c) the line has a y-intercept of 6.
5. There is $128 in a bank account today and the amount is increasing at the constant rate of $12per day. (a) If t represents the number of days after today, express the amount in the account as afunction of t. (b) When will the amount in the account equal $4076? (c) If the amount in theaccount stops growing when the account reaches $5900 and the entire amount is withdrawn 600days after the initial deposit, determine when the amount reaches $5900 and graph the amount inthe account as a function of time for 0 # t # 700.
6. A rocket is traveling through space at a constant speed. Six days after blast off the rocket is134,000 miles away from Earth. Ten days after blast off the rocket is 230,000 miles away. Let trepresent the number of days after blast off and s the distance from Earth.
a) How fast is the rocket traveling?b) Express the distance s as a function of t.c) Is it reasonable for the function found in part (a) to be accurate for values of t near 0? Explain your answer.d) How far away should the rocket be 20 days after blast off?e) At its closest distance from Earth, Jupiter is approximately 793 million miles away. How many days after blast off would it take the rocket to get that far away?
Chapter One of Brief Calculus with Integrated Precalculus - Spring 2007.wpd Page 1 - 17
Figure 1.13
Figure 1.14
Figure 1.12
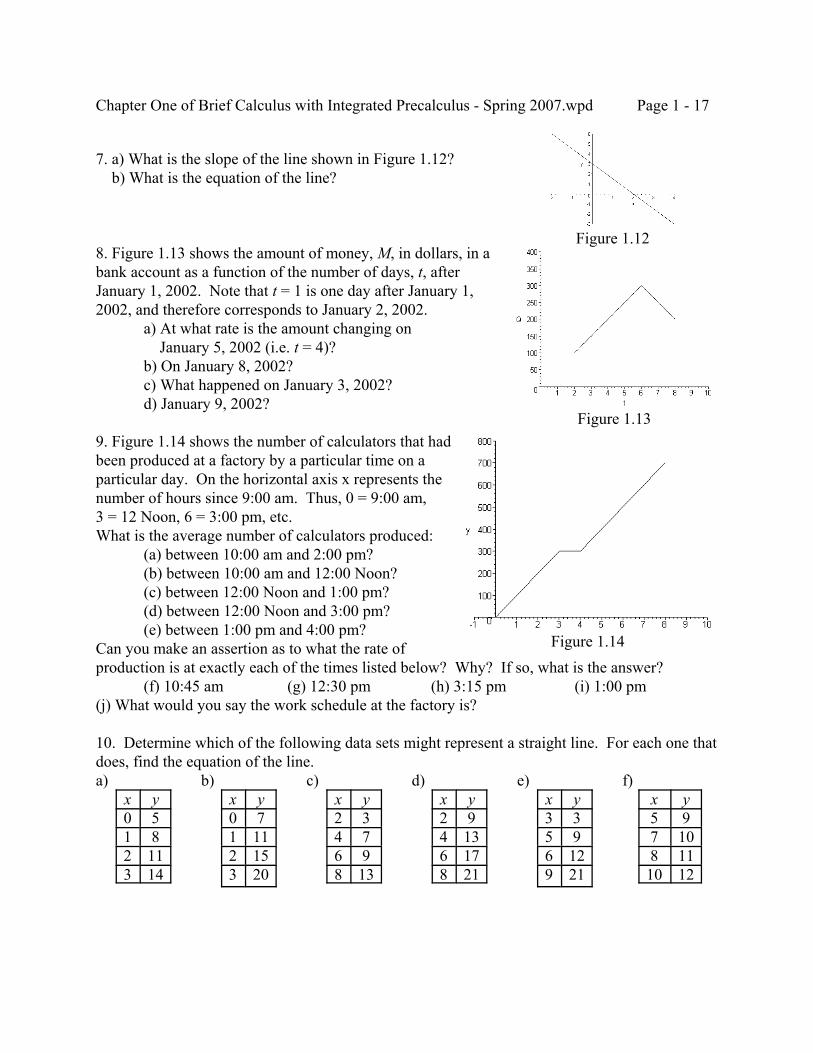
7. a) What is the slope of the line shown in Figure 1.12? b) What is the equation of the line?
8. Figure 1.13 shows the amount of money, M, in dollars, in abank account as a function of the number of days, t, after January 1, 2002. Note that t = 1 is one day after January 1,2002, and therefore corresponds to January 2, 2002.
a) At what rate is the amount changing on January 5, 2002 (i.e. t = 4)?b) On January 8, 2002?c) What happened on January 3, 2002?d) January 9, 2002?
9. Figure 1.14 shows the number of calculators that hadbeen produced at a factory by a particular time on aparticular day. On the horizontal axis x represents thenumber of hours since 9:00 am. Thus, 0 = 9:00 am,3 = 12 Noon, 6 = 3:00 pm, etc.What is the average number of calculators produced:
(a) between 10:00 am and 2:00 pm?(b) between 10:00 am and 12:00 Noon?(c) between 12:00 Noon and 1:00 pm?(d) between 12:00 Noon and 3:00 pm?(e) between 1:00 pm and 4:00 pm?
Can you make an assertion as to what the rate ofproduction is at exactly each of the times listed below? Why? If so, what is the answer?
(f) 10:45 am (g) 12:30 pm (h) 3:15 pm (i) 1:00 pm(j) What would you say the work schedule at the factory is?
10. Determine which of the following data sets might represent a straight line. For each one thatdoes, find the equation of the line.a)
x y0 51 82 113 14
b)x y0 71 112 153 20
c)x y2 34 76 98 13
d)x y2 94 136 178 21
e)x y3 35 96 129 21
f)x y5 97 108 1110 12
Chapter One of Brief Calculus with Integrated Precalculus - Spring 2007.wpd Page 1 - 18
1.4 SUPPLY AND DEMAND
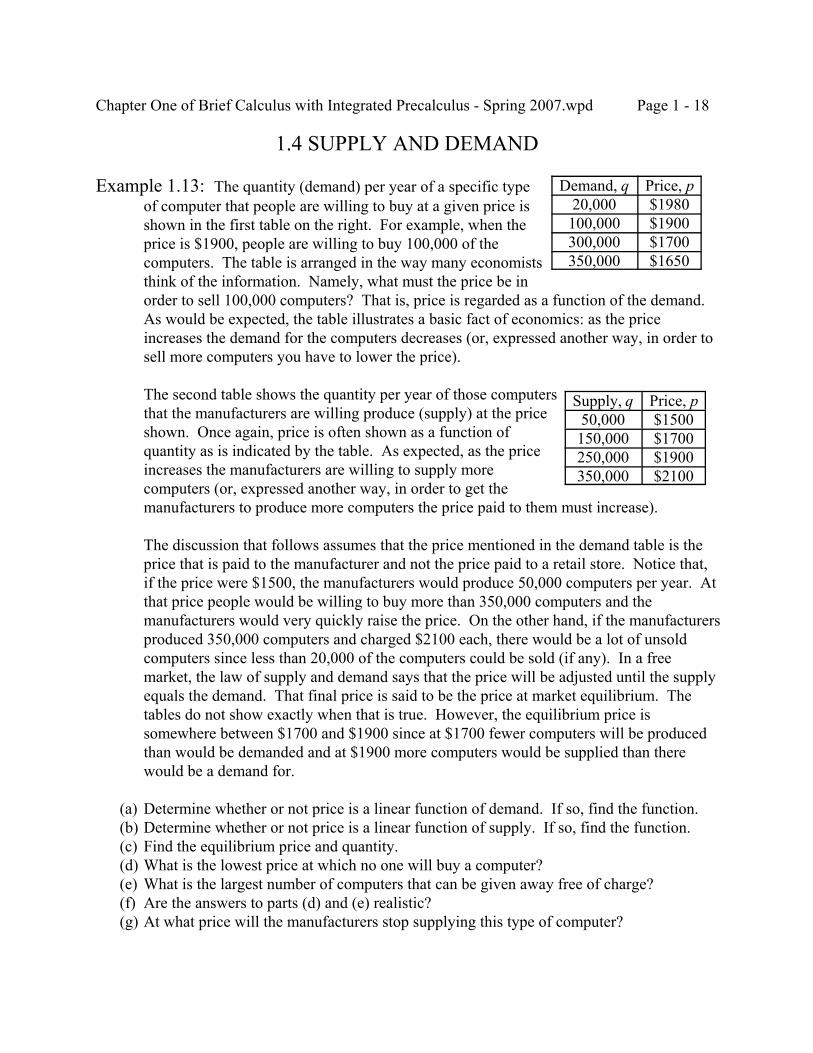
Example 1.13: The quantity (demand) per year of a specific typeof computer that people are willing to buy at a given price isshown in the first table on the right. For example, when theprice is $1900, people are willing to buy 100,000 of thecomputers. The table is arranged in the way many economiststhink of the information. Namely, what must the price be inorder to sell 100,000 computers? That is, price is regarded as a function of the demand. As would be expected, the table illustrates a basic fact of economics: as the priceincreases the demand for the computers decreases (or, expressed another way, in order tosell more computers you have to lower the price).
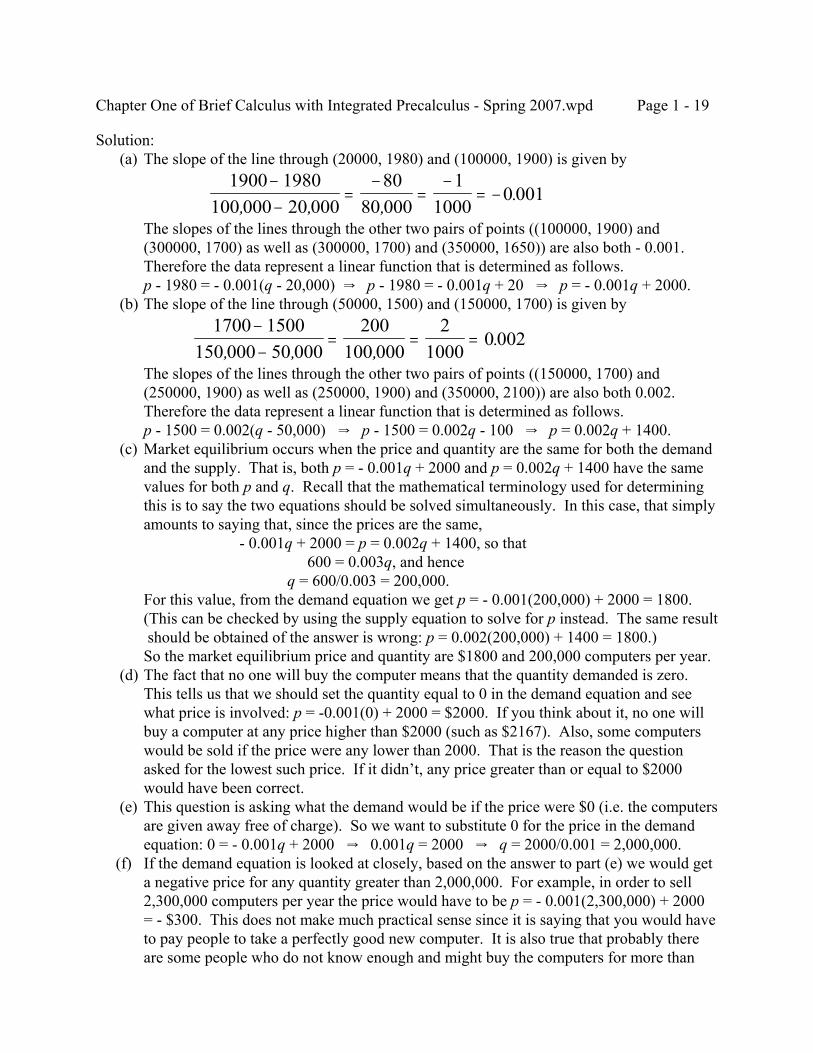
The second table shows the quantity per year of those computersthat the manufacturers are willing produce (supply) at the priceshown. Once again, price is often shown as a function ofquantity as is indicated by the table. As expected, as the priceincreases the manufacturers are willing to supply morecomputers (or, expressed another way, in order to get themanufacturers to produce more computers the price paid to them must increase).
The discussion that follows assumes that the price mentioned in the demand table is theprice that is paid to the manufacturer and not the price paid to a retail store. Notice that,if the price were $1500, the manufacturers would produce 50,000 computers per year. Atthat price people would be willing to buy more than 350,000 computers and themanufacturers would very quickly raise the price. On the other hand, if the manufacturersproduced 350,000 computers and charged $2100 each, there would be a lot of unsoldcomputers since less than 20,000 of the computers could be sold (if any). In a freemarket, the law of supply and demand says that the price will be adjusted until the supplyequals the demand. That final price is said to be the price at market equilibrium. Thetables do not show exactly when that is true. However, the equilibrium price issomewhere between $1700 and $1900 since at $1700 fewer computers will be producedthan would be demanded and at $1900 more computers would be supplied than therewould be a demand for.
(a) Determine whether or not price is a linear function of demand. If so, find the function. (b) Determine whether or not price is a linear function of supply. If so, find the function. (c) Find the equilibrium price and quantity. (d) What is the lowest price at which no one will buy a computer? (e) What is the largest number of computers that can be given away free of charge? (f) Are the answers to parts (d) and (e) realistic? (g) At what price will the manufacturers stop supplying this type of computer?
Demand, q Price, p20,000 $1980100,000 $1900300,000 $1700350,000 $1650
Supply, q Price, p50,000 $1500150,000 $1700250,000 $1900350,000 $2100
Chapter One of Brief Calculus with Integrated Precalculus - Spring 2007.wpd Page 1 - 19
Solution: (a) The slope of the line through (20000, 1980) and (100000, 1900) is given by
1900 1980100 000 20 000
8080 000
11000
0 001−−
=−
=−
= −, , ,
.
The slopes of the lines through the other two pairs of points ((100000, 1900) and(300000, 1700) as well as (300000, 1700) and (350000, 1650)) are also both - 0.001.Therefore the data represent a linear function that is determined as follows.p - 1980 = - 0.001(q - 20,000) Y p - 1980 = - 0.001q + 20 Y p = - 0.001q + 2000.
(b) The slope of the line through (50000, 1500) and (150000, 1700) is given by1700 1500
150 000 50 000200
100 0002
10000 002
−−
= = =, , ,
.
The slopes of the lines through the other two pairs of points ((150000, 1700) and(250000, 1900) as well as (250000, 1900) and (350000, 2100)) are also both 0.002.Therefore the data represent a linear function that is determined as follows.p - 1500 = 0.002(q - 50,000) Y p - 1500 = 0.002q - 100 Y p = 0.002q + 1400.
(c) Market equilibrium occurs when the price and quantity are the same for both the demandand the supply. That is, both p = - 0.001q + 2000 and p = 0.002q + 1400 have the samevalues for both p and q. Recall that the mathematical terminology used for determiningthis is to say the two equations should be solved simultaneously. In this case, that simplyamounts to saying that, since the prices are the same,
- 0.001q + 2000 = p = 0.002q + 1400, so that 600 = 0.003q, and henceq = 600/0.003 = 200,000.
For this value, from the demand equation we get p = - 0.001(200,000) + 2000 = 1800.(This can be checked by using the supply equation to solve for p instead. The same result should be obtained of the answer is wrong: p = 0.002(200,000) + 1400 = 1800.)So the market equilibrium price and quantity are $1800 and 200,000 computers per year.
(d) The fact that no one will buy the computer means that the quantity demanded is zero. This tells us that we should set the quantity equal to 0 in the demand equation and seewhat price is involved: p = -0.001(0) + 2000 = $2000. If you think about it, no one willbuy a computer at any price higher than $2000 (such as $2167). Also, some computerswould be sold if the price were any lower than 2000. That is the reason the questionasked for the lowest such price. If it didn’t, any price greater than or equal to $2000would have been correct.
(e) This question is asking what the demand would be if the price were $0 (i.e. the computersare given away free of charge). So we want to substitute 0 for the price in the demandequation: 0 = - 0.001q + 2000 Y 0.001q = 2000 Y q = 2000/0.001 = 2,000,000.
(f) If the demand equation is looked at closely, based on the answer to part (e) we would geta negative price for any quantity greater than 2,000,000. For example, in order to sell2,300,000 computers per year the price would have to be p = - 0.001(2,300,000) + 2000= - $300. This does not make much practical sense since it is saying that you would haveto pay people to take a perfectly good new computer. It is also true that probably thereare some people who do not know enough and might buy the computers for more than
Chapter One of Brief Calculus with Integrated Precalculus - Spring 2007.wpd Page 1 - 20
$2000. That does not invalidate the mathematics involved in parts (a), (b) and (c). Whathas to be understood is the fact that the equations found in parts (a) and (b) are notnecessarily valid for all values of q. The equations are only considered to be valid in areal life situation for a range of values, usually values reasonably near those shown in thetable.
(g) The price at which the manufacturers will stop supplying computers is the supplyfunction price when the quantity is 0. So p = 0.002(0) + 1400 = $1400.
Demand Equation or Function: An equation that relates the quantity (demand) that can besold to the price, p, at which the item is sold. The price is often written as a function ofthe demand, which is usually represented by q or x. The price is always written as a lowercase p in order to distinguish it from profit, an upper case P. Price and demand move inopposite directions: as one increases the other decreases.
Supply Equation or Function: An equation that relates the quantity (supply), q (or x) thatwill be produced to the price, p, that is paid for it. The price is often written as a functionof q (or x). Price and supply move in the same direction: they increase together (whichcan also be viewed as decreasing together).
Market Equilibrium Price and Quantity: The price and quantity that satisfies both thedemand equation and the supply equation. The equilibrium price and quantity are foundby solving the demand and supply equations simultaneously.
Example 1.14: Each case below shows a demand equation and a supply equation (notnecessarily in that order). The price is in dollars and the value of q in each equationrepresents thousands of items Find the market equilibrium price and number of items. Also, indicate which of the two equations is the demand equation and which is the supplyequation.
(a) p = 0.3q + 12 and p = - 0.2q +18 (b) 4p + 3q = 44 and 6p - 9q = 36Solution: (a) To find the market equilibrium price and quantity we must solve the two equations
simultaneously. So 0.3q + 12 = p = - 0.2q +18 Y 0.5q = 6 Y q = 6/0.5 = 12. The priceat market equilibrium can be found by substituting this value of q in either equation. Sop = 0.3(12) + 12 = 3.6 + 12 = $15.60. At market equilibrium 12,000 items will beproduced and sold at a price of $15.60 each (recall that q represents thousands of items).In the first equation the price increases as the quantity increases (recall that the slope 0.3of the straight line p = 0.3q + 12 tells us that the price increases by $0.30 as q increases byone, i.e. the number of items increases by 1000). Since price and quantity increasetogether, p = 0.3q + 12 is the supply equation.In the second equation, p = - 0.2q +18, the price decreases as the quantity increases (theprice decreases by $0.20 as the number of items increases by one thousand). So thesecond equation, p = - 0.2q +18, is the demand equation.
Chapter One of Brief Calculus with Integrated Precalculus - Spring 2007.wpd Page 1 - 21
Figure 1.15
(b) It would be a mistake to interpret the sign of the coefficient of q in the first equation (+3)in the same way that the coefficient of q was treated in part (a) since in part (a) thecoefficient was the slope but in this problem it is not. We will solve this problem byusing the method of substitution. That is, we will first solve both equations for p andthen proceed as we did in part (a).4p + 3q = 44 Y 4p = -3q + 44 Y , andp q= − +3
4 116p - 9q = 36 Y 6p = 9q + 36 Y p q q= + = +9
6326 6
Now that both equations have been solved for p, we set these results equal to each other. and, since , this becomes . Hence3
2346 11q q+ = − + 3
234
64
34
94+ = + = 9
4 5q =
. Recalling that the value of q represents thousands of items, the numberq = ⋅ =49
2095
of items at market equilibrium is , which is 2,222209
20 00091000 2 222 222⋅ = =, , . ...
rounded to the nearest whole number since you cannot sell a fraction of an item. Theequilibrium price can now be found by substituting 20/9 into any one of the aboveequations. Thus, . At market equilibrium the price isp = ⋅ + = + =3
2209
1036 6 33$9.
$9.33 and the number of items produced and sold is 2,222.Since shows that p decreases as q increases, 4p + 3q = 44 is the demandp q= − +3
4 11equation. Also, since shows that p increases as q increases, 6p - 9q = 36 isp q= +3
2 6the supply equation.
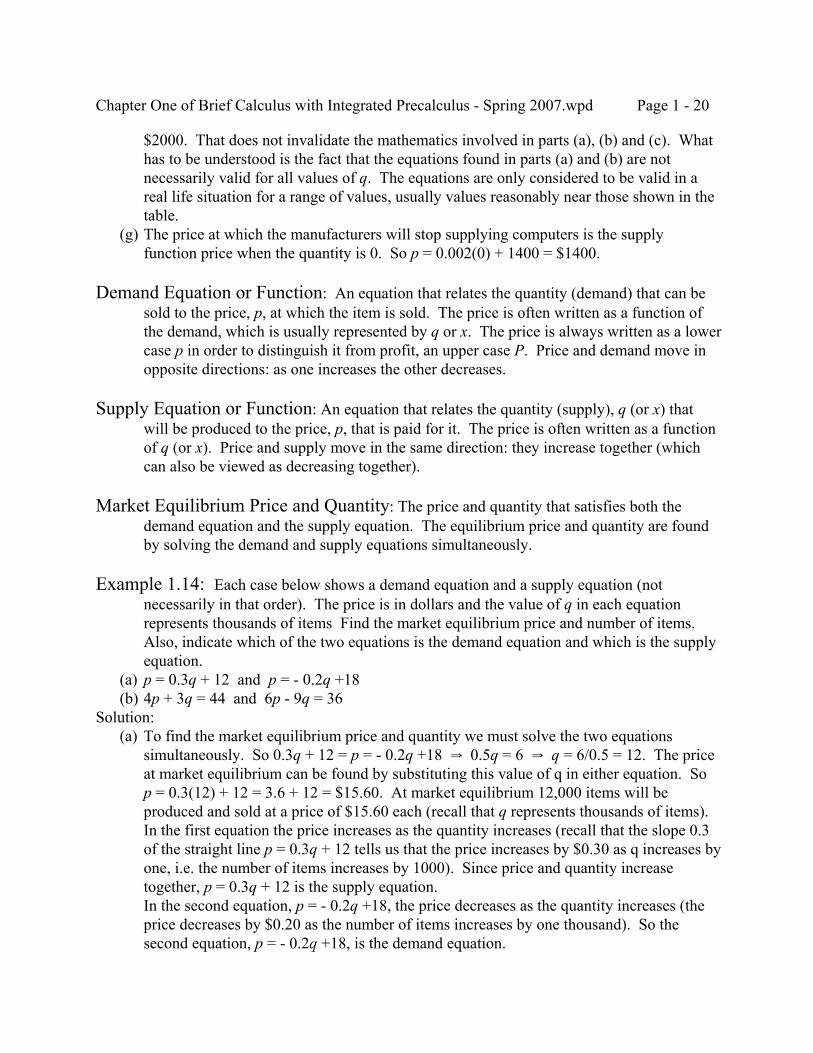
Example 1.15: Figure 1.15 shows a supply curve anda demand curve. The price, p, is in dollars and the Iquantity, q, represents thousands of items.
(a) Which curve (I or II) is the supply curve? (b) Which curve is the demand curve? (c) At market equilibrium, what is the price? II (d) At market equilibrium, how many items
are produced and sold? (e) At what price will the manufacturers stop
producing items? (f) At what price will consumers stop
buying the items?Solution: (a) Curve II shows the price increasing while the quantity increases. It is the supply curve. (b) Curve I shows the price decreasing while the quantity increases. It is the demand curve. (c) There is only one point on the graph where the supply and demand curves have the same
price for the same quantity. That is the point where the two curves intersect. At thatpoint q = 7 and p =5. So the equilibrium price is $5.00.
(d) 7000 items (q = 7 thousand items). (e) This is the price on the supply curve (II) where the quantity is 0. So the price is $2.00. (f) This is the price on the demand curve (I) where the quantity is 0. So the price is $9.00.
Chapter One of Brief Calculus with Integrated Precalculus - Spring 2007.wpd Page 1 - 22
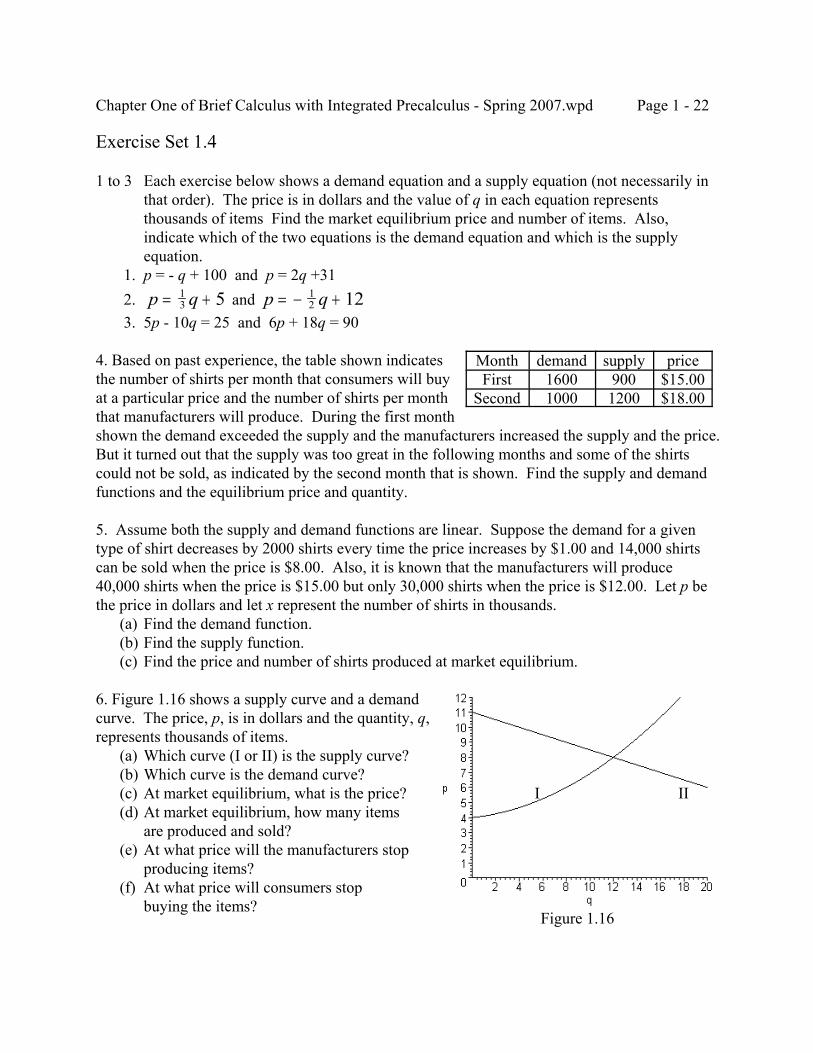
Month demand supply priceFirst 1600 900 $15.00
Second 1000 1200 $18.00
Figure 1.16
Exercise Set 1.4
1 to 3 Each exercise below shows a demand equation and a supply equation (not necessarily inthat order). The price is in dollars and the value of q in each equation representsthousands of items Find the market equilibrium price and number of items. Also,indicate which of the two equations is the demand equation and which is the supplyequation.
1. p = - q + 100 and p = 2q +31 2. and p q= +1
3 5 p q= − +12 12
3. 5p - 10q = 25 and 6p + 18q = 90
4. Based on past experience, the table shown indicatesthe number of shirts per month that consumers will buyat a particular price and the number of shirts per monththat manufacturers will produce. During the first monthshown the demand exceeded the supply and the manufacturers increased the supply and the price. But it turned out that the supply was too great in the following months and some of the shirtscould not be sold, as indicated by the second month that is shown. Find the supply and demandfunctions and the equilibrium price and quantity.
5. Assume both the supply and demand functions are linear. Suppose the demand for a giventype of shirt decreases by 2000 shirts every time the price increases by $1.00 and 14,000 shirtscan be sold when the price is $8.00. Also, it is known that the manufacturers will produce40,000 shirts when the price is $15.00 but only 30,000 shirts when the price is $12.00. Let p bethe price in dollars and let x represent the number of shirts in thousands. (a) Find the demand function. (b) Find the supply function. (c) Find the price and number of shirts produced at market equilibrium.
6. Figure 1.16 shows a supply curve and a demandcurve. The price, p, is in dollars and the quantity, q,represents thousands of items. (a) Which curve (I or II) is the supply curve? (b) Which curve is the demand curve? (c) At market equilibrium, what is the price? I II (d) At market equilibrium, how many items
are produced and sold? (e) At what price will the manufacturers stop
producing items? (f) At what price will consumers stop
buying the items?
Chapter Two of Brief Calculus with Integrated Precalculus - Spring 2007.wpd Page 2 - 1
Figure 2.1
Figure 2.2
CHAPTER TWOBASIC ALGEBRA AND GRAPHING WITH THE TI-89
2.1 CALCULATOR PRELIMINARIES
On the upper left side of the calculator there are three keys labeled 2nd (yellow), — (green) andalpha (purple). These keys are used to access the commands that appear above the other keys. Thus, in order to access the function ex, you would first press the green — key and then press xsince the function ex appears in green above the x key.
The backspace key ³ to the left of the CLEAR key is used to delete the previous characterentered. The four blue cursor keys that appear above the CLEAR key are used to move in one ofthe directions indicated.
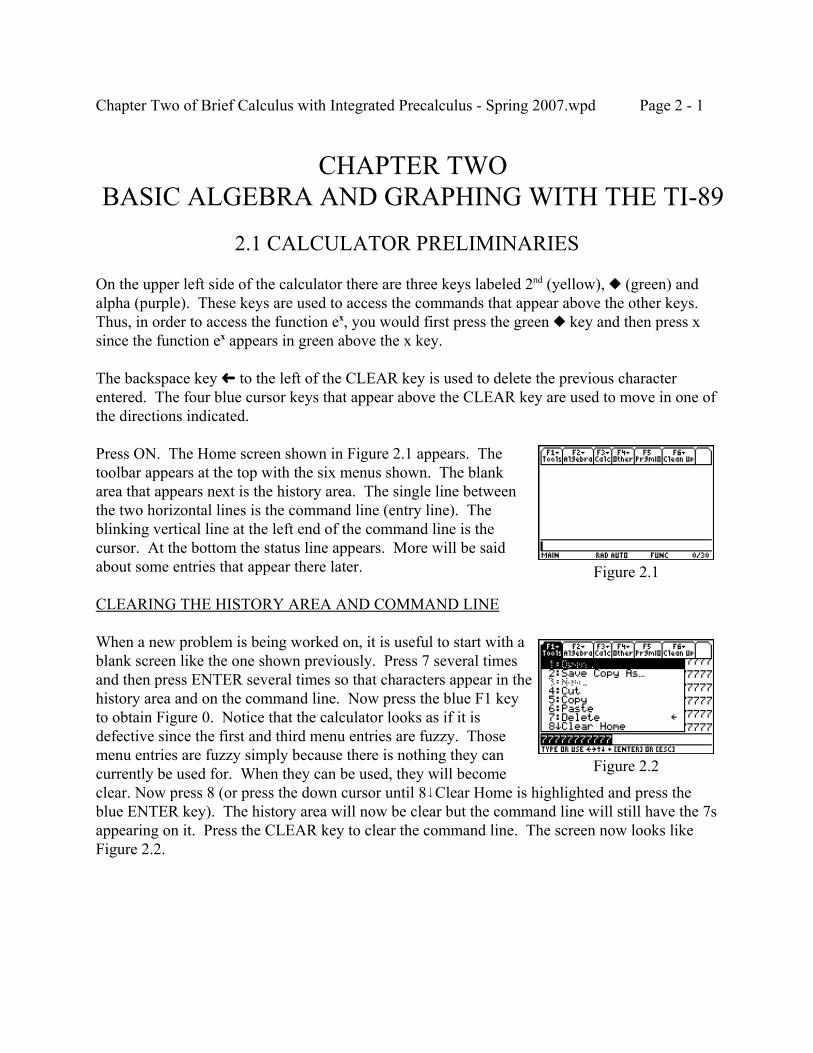
Press ON. The Home screen shown in Figure 2.1 appears. Thetoolbar appears at the top with the six menus shown. The blankarea that appears next is the history area. The single line betweenthe two horizontal lines is the command line (entry line). Theblinking vertical line at the left end of the command line is thecursor. At the bottom the status line appears. More will be saidabout some entries that appear there later.
CLEARING THE HISTORY AREA AND COMMAND LINE
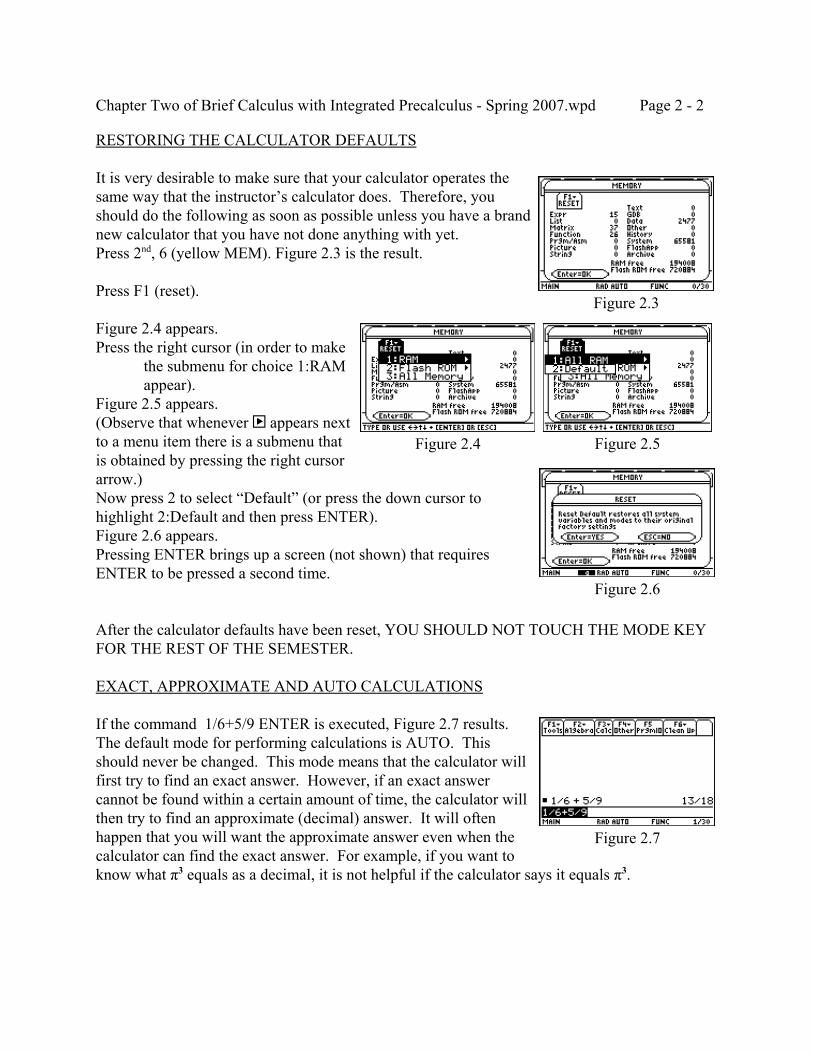
When a new problem is being worked on, it is useful to start with ablank screen like the one shown previously. Press 7 several timesand then press ENTER several times so that characters appear in thehistory area and on the command line. Now press the blue F1 keyto obtain Figure 0. Notice that the calculator looks as if it isdefective since the first and third menu entries are fuzzy. Thosemenu entries are fuzzy simply because there is nothing they cancurrently be used for. When they can be used, they will becomeclear. Now press 8 (or press the down cursor until 89Clear Home is highlighted and press theblue ENTER key). The history area will now be clear but the command line will still have the 7sappearing on it. Press the CLEAR key to clear the command line. The screen now looks likeFigure 2.2.
Chapter Two of Brief Calculus with Integrated Precalculus - Spring 2007.wpd Page 2 - 2
Figure 2.4 Figure 2.5
Figure 2.6
Figure 2.7
Figure 2.3
RESTORING THE CALCULATOR DEFAULTS
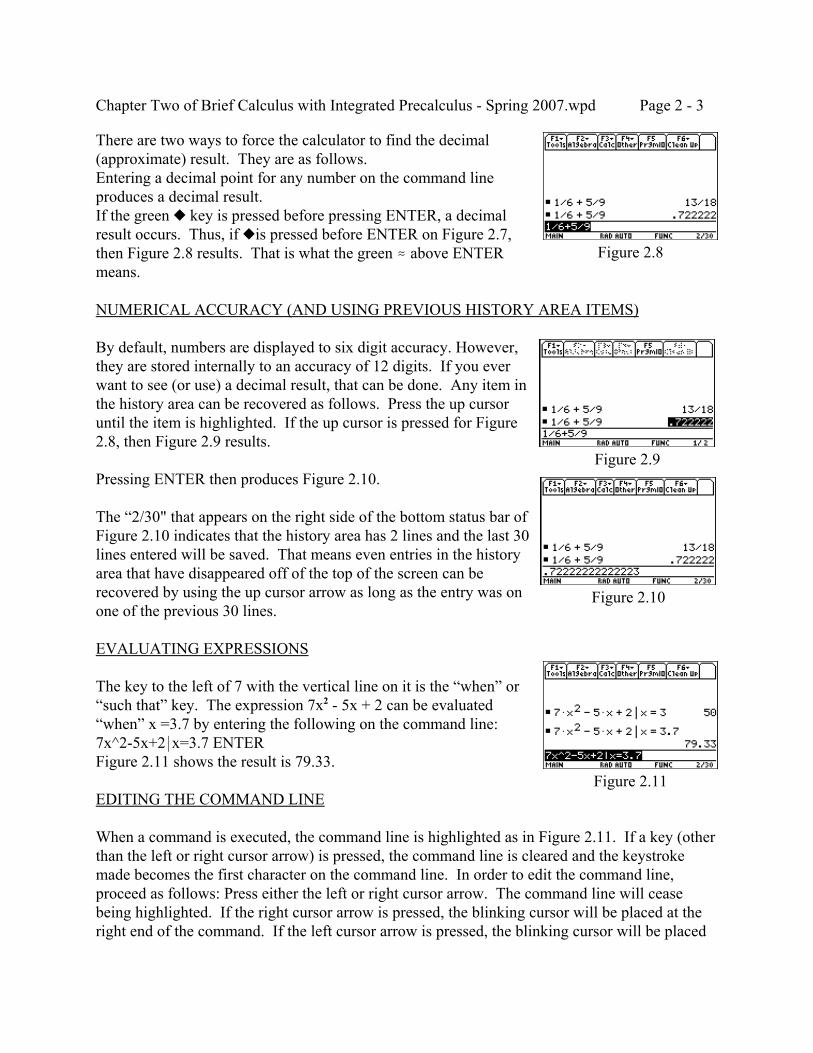
It is very desirable to make sure that your calculator operates thesame way that the instructor’s calculator does. Therefore, youshould do the following as soon as possible unless you have a brandnew calculator that you have not done anything with yet.Press 2nd, 6 (yellow MEM). Figure 2.3 is the result.
Press F1 (reset).
Figure 2.4 appears.Press the right cursor (in order to make
the submenu for choice 1:RAMappear).
Figure 2.5 appears.(Observe that whenever | appears nextto a menu item there is a submenu thatis obtained by pressing the right cursorarrow.)Now press 2 to select “Default” (or press the down cursor tohighlight 2:Default and then press ENTER).Figure 2.6 appears.Pressing ENTER brings up a screen (not shown) that requiresENTER to be pressed a second time.
After the calculator defaults have been reset, YOU SHOULD NOT TOUCH THE MODE KEYFOR THE REST OF THE SEMESTER.
EXACT, APPROXIMATE AND AUTO CALCULATIONS
If the command 1/6+5/9 ENTER is executed, Figure 2.7 results.The default mode for performing calculations is AUTO. Thisshould never be changed. This mode means that the calculator willfirst try to find an exact answer. However, if an exact answercannot be found within a certain amount of time, the calculator willthen try to find an approximate (decimal) answer. It will oftenhappen that you will want the approximate answer even when thecalculator can find the exact answer. For example, if you want toknow what π3 equals as a decimal, it is not helpful if the calculator says it equals π3.
Chapter Two of Brief Calculus with Integrated Precalculus - Spring 2007.wpd Page 2 - 3
Figure 2.8
Figure 2.9
Figure 2.10
Figure 2.11
There are two ways to force the calculator to find the decimal(approximate) result. They are as follows.Entering a decimal point for any number on the command lineproduces a decimal result.If the green — key is pressed before pressing ENTER, a decimalresult occurs. Thus, if —is pressed before ENTER on Figure 2.7,then Figure 2.8 results. That is what the green . above ENTERmeans.
NUMERICAL ACCURACY (AND USING PREVIOUS HISTORY AREA ITEMS)
By default, numbers are displayed to six digit accuracy. However,they are stored internally to an accuracy of 12 digits. If you everwant to see (or use) a decimal result, that can be done. Any item inthe history area can be recovered as follows. Press the up cursoruntil the item is highlighted. If the up cursor is pressed for Figure2.8, then Figure 2.9 results.
Pressing ENTER then produces Figure 2.10.
The “2/30" that appears on the right side of the bottom status bar ofFigure 2.10 indicates that the history area has 2 lines and the last 30lines entered will be saved. That means even entries in the historyarea that have disappeared off of the top of the screen can berecovered by using the up cursor arrow as long as the entry was onone of the previous 30 lines.
EVALUATING EXPRESSIONS
The key to the left of 7 with the vertical line on it is the “when” or“such that” key. The expression 7x2 - 5x + 2 can be evaluated“when” x =3.7 by entering the following on the command line:7x^2-5x+2*x=3.7 ENTERFigure 2.11 shows the result is 79.33.
EDITING THE COMMAND LINE
When a command is executed, the command line is highlighted as in Figure 2.11. If a key (otherthan the left or right cursor arrow) is pressed, the command line is cleared and the keystrokemade becomes the first character on the command line. In order to edit the command line,proceed as follows: Press either the left or right cursor arrow. The command line will ceasebeing highlighted. If the right cursor arrow is pressed, the blinking cursor will be placed at theright end of the command. If the left cursor arrow is pressed, the blinking cursor will be placed
Chapter Two of Brief Calculus with Integrated Precalculus - Spring 2007.wpd Page 2 - 4
at the beginning of the command line. The left and right cursor arrows can now be used to movethe cursor to any location on the command line. At any given location the character to the left ofthe cursor can be deleted by pressing the backspace key (³). The character to the right of thecursor can be deleted by pressing — ³ (del = delete).
Exercise Set 2.1
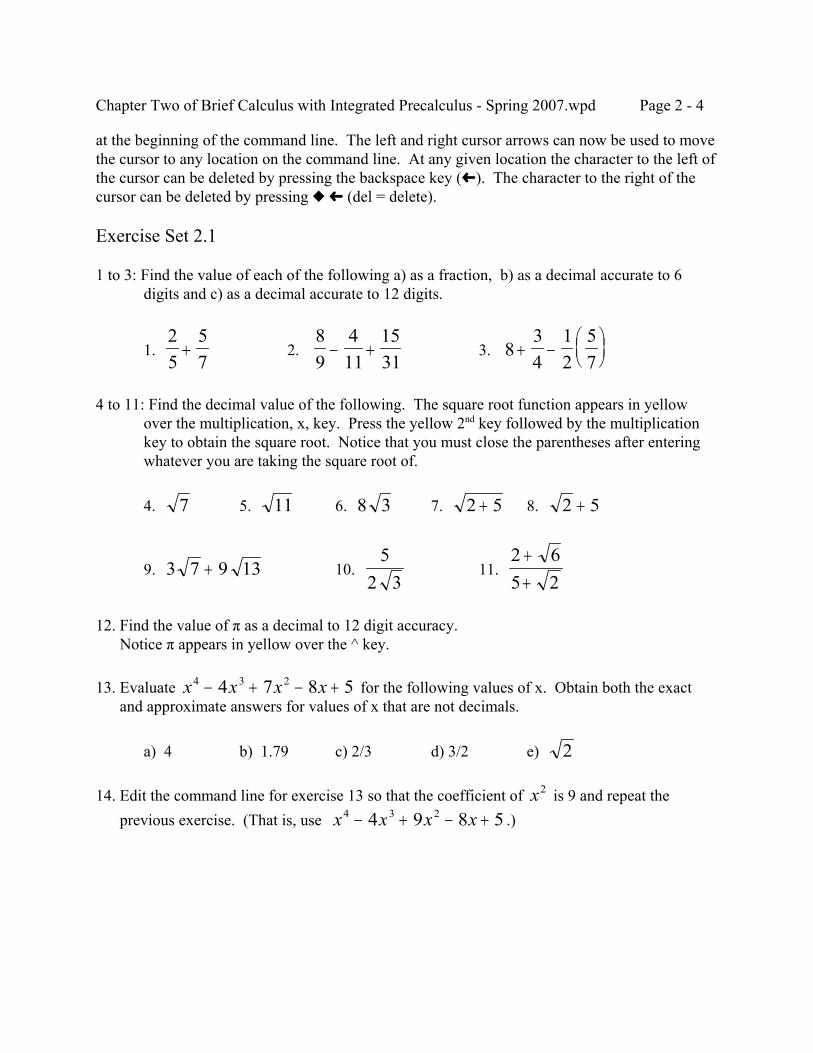
1 to 3: Find the value of each of the following a) as a fraction, b) as a decimal accurate to 6digits and c) as a decimal accurate to 12 digits.
1. 2. 3. 25
57
+89
411
1531
− + 834
12
57
+ −
4 to 11: Find the decimal value of the following. The square root function appears in yellowover the multiplication, x, key. Press the yellow 2nd key followed by the multiplicationkey to obtain the square root. Notice that you must close the parentheses after enteringwhatever you are taking the square root of.
4. 5. 6. 7. 8. 7 11 8 3 2 5+ 2 5+
9. 10. 11. 3 7 9 13+5
2 32 65 2++
12. Find the value of π as a decimal to 12 digit accuracy. Notice π appears in yellow over the ^ key.
13. Evaluate for the following values of x. Obtain both the exactx x x x4 3 24 7 8 5− + − + and approximate answers for values of x that are not decimals.
a) 4 b) 1.79 c) 2/3 d) 3/2 e) 2
14. Edit the command line for exercise 13 so that the coefficient of is 9 and repeat thex2
previous exercise. (That is, use .)x x x x4 3 24 9 8 5− + − +
Chapter Two of Brief Calculus with Integrated Precalculus - Spring 2007.wpd Page 2 - 5
Figure 2.12
Figure 2.13
Figure 2.14
Figure 2.15
2.2 BASIC ALGEBRA
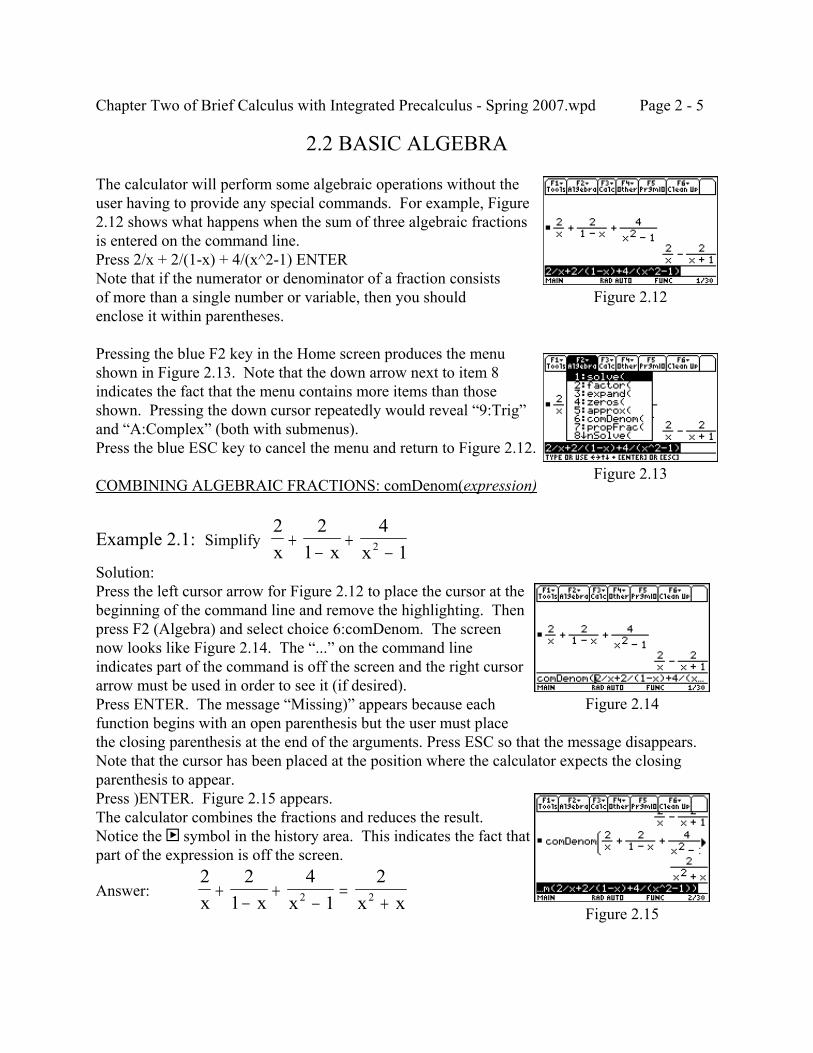
The calculator will perform some algebraic operations without theuser having to provide any special commands. For example, Figure2.12 shows what happens when the sum of three algebraic fractionsis entered on the command line.Press 2/x + 2/(1-x) + 4/(x^2-1) ENTERNote that if the numerator or denominator of a fraction consistsof more than a single number or variable, then you shouldenclose it within parentheses.
Pressing the blue F2 key in the Home screen produces the menushown in Figure 2.13. Note that the down arrow next to item 8indicates the fact that the menu contains more items than thoseshown. Pressing the down cursor repeatedly would reveal “9:Trig”and “A:Complex” (both with submenus).Press the blue ESC key to cancel the menu and return to Figure 2.12.
COMBINING ALGEBRAIC FRACTIONS: comDenom(expression)
Example 2.1: Simplify 2 2
14
12x x x+
−+
−Solution:Press the left cursor arrow for Figure 2.12 to place the cursor at thebeginning of the command line and remove the highlighting. Thenpress F2 (Algebra) and select choice 6:comDenom. The screennow looks like Figure 2.14. The “...” on the command lineindicates part of the command is off the screen and the right cursorarrow must be used in order to see it (if desired).Press ENTER. The message “Missing)” appears because eachfunction begins with an open parenthesis but the user must placethe closing parenthesis at the end of the arguments. Press ESC so that the message disappears. Note that the cursor has been placed at the position where the calculator expects the closingparenthesis to appear. Press )ENTER. Figure 2.15 appears.The calculator combines the fractions and reduces the result.Notice the | symbol in the history area. This indicates the fact thatpart of the expression is off the screen.
Answer: 2 2
14
12
2 2x x x x x+
−+
−=
+
Chapter Two of Brief Calculus with Integrated Precalculus - Spring 2007.wpd Page 2 - 6
Figure 2.17
Figure 2.19
Figure 2.16
Figure 2.18
Press the up cursor arrow twice to highlight the line and then pressthe right cursor arrow until you can see the end of the line as inFigure 2.16.Press any digit. Nothing happens because you are not on thecommand line.Press the down cursor arrow twice to return to the command line.Clear the Home screen (F1, 8, CLEAR).
SOLVING EQUATIONS: solve(equation,variable)
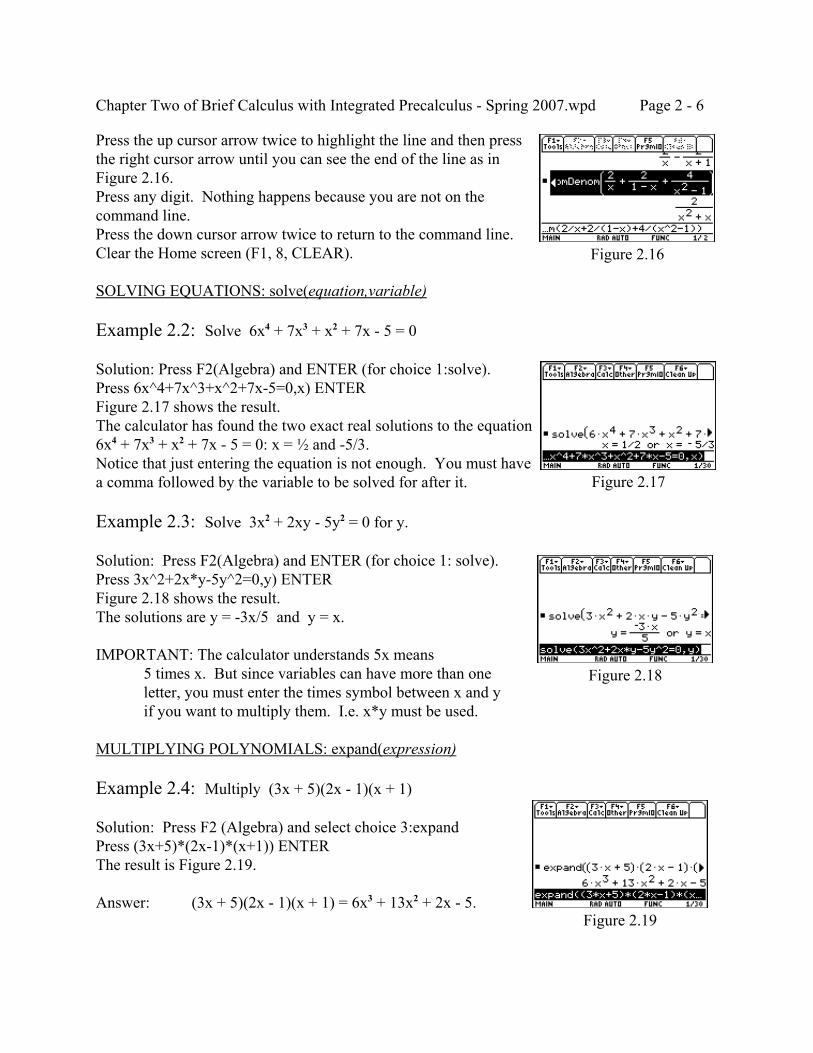
Example 2.2: Solve 6x4 + 7x3 + x2 + 7x - 5 = 0
Solution: Press F2(Algebra) and ENTER (for choice 1:solve).Press 6x^4+7x^3+x^2+7x-5=0,x) ENTERFigure 2.17 shows the result.The calculator has found the two exact real solutions to the equation6x4 + 7x3 + x2 + 7x - 5 = 0: x = ½ and -5/3.Notice that just entering the equation is not enough. You must havea comma followed by the variable to be solved for after it.
Example 2.3: Solve 3x2 + 2xy - 5y2 = 0 for y.
Solution: Press F2(Algebra) and ENTER (for choice 1: solve).Press 3x^2+2x*y-5y^2=0,y) ENTERFigure 2.18 shows the result.The solutions are y = -3x/5 and y = x.
IMPORTANT: The calculator understands 5x means5 times x. But since variables can have more than oneletter, you must enter the times symbol between x and yif you want to multiply them. I.e. x*y must be used.
MULTIPLYING POLYNOMIALS: expand(expression)
Example 2.4: Multiply (3x + 5)(2x - 1)(x + 1)
Solution: Press F2 (Algebra) and select choice 3:expandPress (3x+5)*(2x-1)*(x+1)) ENTERThe result is Figure 2.19.
Answer: (3x + 5)(2x - 1)(x + 1) = 6x3 + 13x2 + 2x - 5.
Chapter Two of Brief Calculus with Integrated Precalculus - Spring 2007.wpd Page 2 - 7
Figure 2.20
FACTORING: factor(expression)
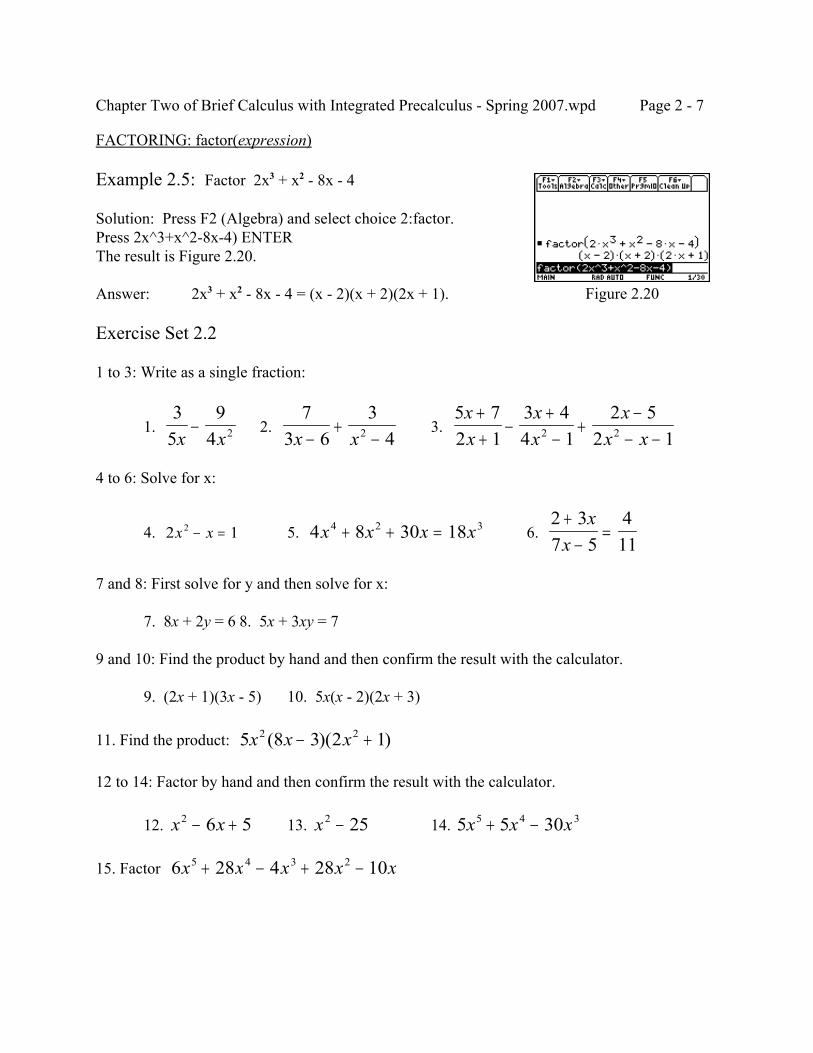
Example 2.5: Factor 2x3 + x2 - 8x - 4
Solution: Press F2 (Algebra) and select choice 2:factor.Press 2x^3+x^2-8x-4) ENTERThe result is Figure 2.20.
Answer: 2x3 + x2 - 8x - 4 = (x - 2)(x + 2)(2x + 1).
Exercise Set 2.2
1 to 3: Write as a single fraction:
1. 2. 3. 3
59
4 2x x−
73 6
342x x−
+−
5 72 1
3 44 1
2 52 12 2
xx
xx
xx x
++
−+−
+−
− −
4 to 6: Solve for x:
4. 5. 6. 2 12x x− = 4 8 30 184 2 3x x x x+ + =2 37 5
411
+−
=x
x
7 and 8: First solve for y and then solve for x:
7. 8x + 2y = 6 8. 5x + 3xy = 7
9 and 10: Find the product by hand and then confirm the result with the calculator.
9. (2x + 1)(3x - 5) 10. 5x(x - 2)(2x + 3)
11. Find the product: 5 3 2 12 2x x x(8 )( )− +
12 to 14: Factor by hand and then confirm the result with the calculator.
12. 13. 14. x x2 6 5− + x2 25− 5 5 305 4 3x x x+ −
15. Factor 6 28 4 28 105 4 3 2x x x x x+ − + −
Chapter Two of Brief Calculus with Integrated Precalculus - Spring 2007.wpd Page 2 - 8
Figure 2.21
Figure 2.24
Figure 2.22: a > 0 Figure 2.23: a < 0
2.3 GRAPHING POLYNOMIALS
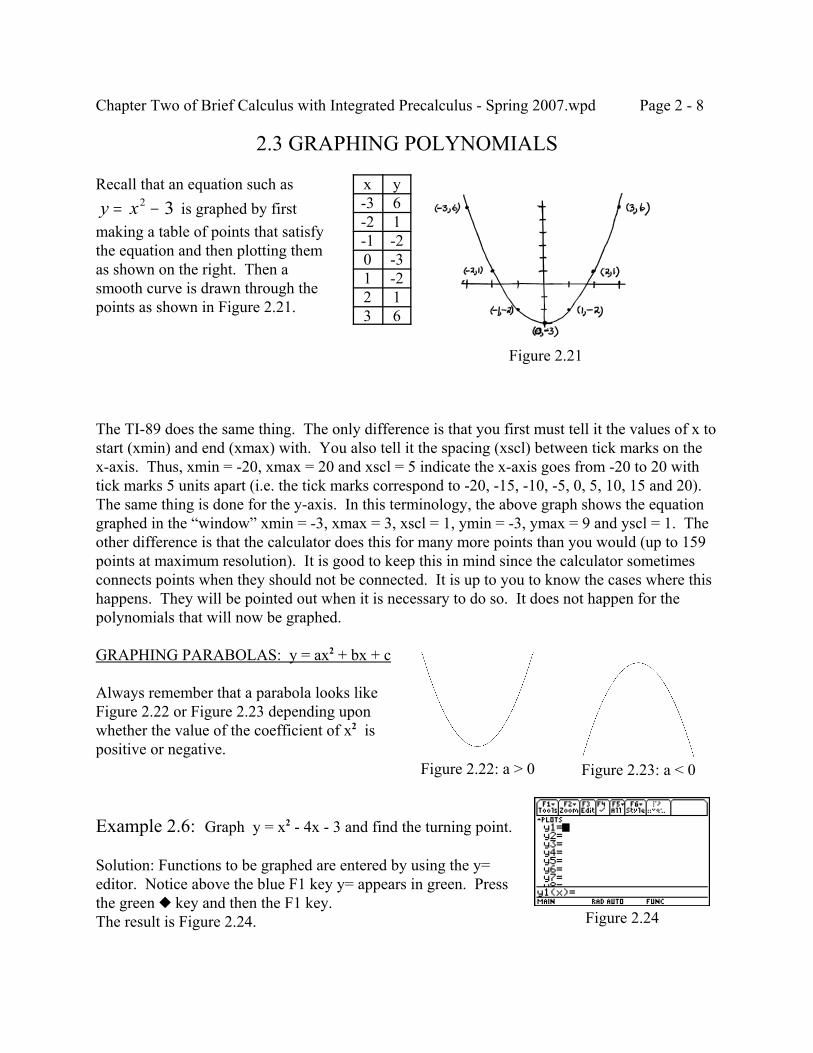
Recall that an equation such as is graphed by firsty x= −2 3
making a table of points that satisfythe equation and then plotting themas shown on the right. Then asmooth curve is drawn through thepoints as shown in Figure 2.21.
x y-3 6-2 1-1 -20 -31 -22 13 6
The TI-89 does the same thing. The only difference is that you first must tell it the values of x tostart (xmin) and end (xmax) with. You also tell it the spacing (xscl) between tick marks on thex-axis. Thus, xmin = -20, xmax = 20 and xscl = 5 indicate the x-axis goes from -20 to 20 withtick marks 5 units apart (i.e. the tick marks correspond to -20, -15, -10, -5, 0, 5, 10, 15 and 20). The same thing is done for the y-axis. In this terminology, the above graph shows the equationgraphed in the “window” xmin = -3, xmax = 3, xscl = 1, ymin = -3, ymax = 9 and yscl = 1. Theother difference is that the calculator does this for many more points than you would (up to 159points at maximum resolution). It is good to keep this in mind since the calculator sometimesconnects points when they should not be connected. It is up to you to know the cases where thishappens. They will be pointed out when it is necessary to do so. It does not happen for thepolynomials that will now be graphed.
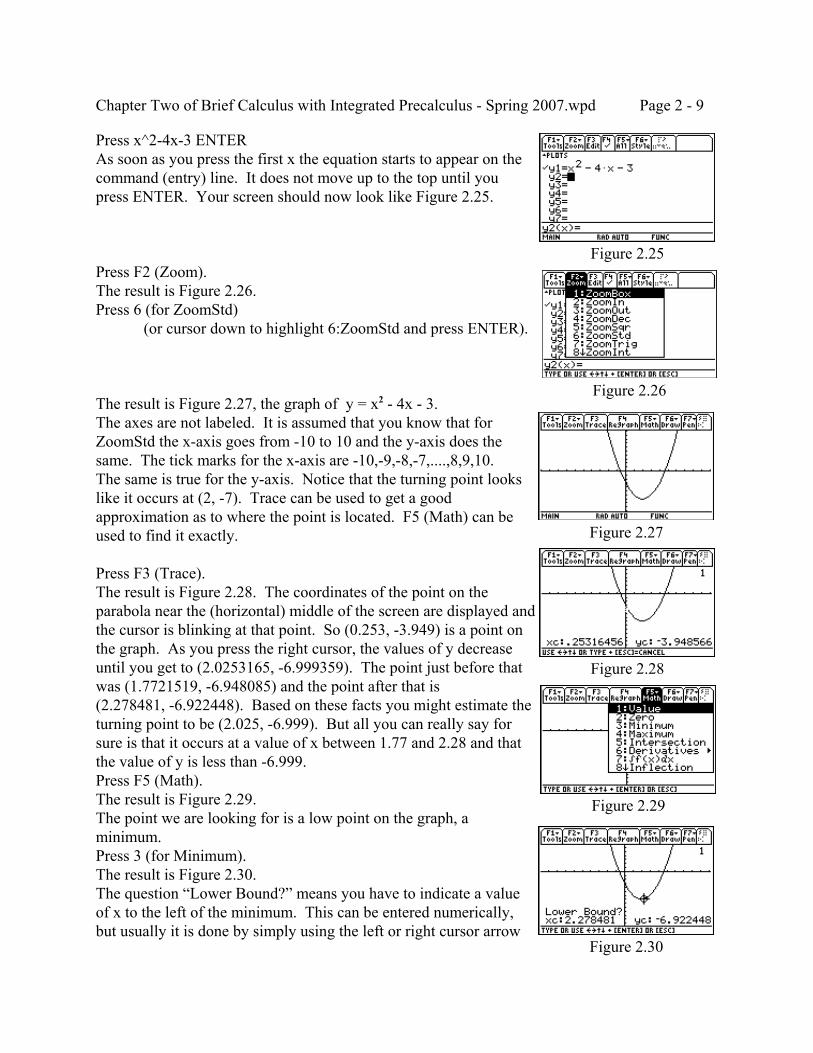
GRAPHING PARABOLAS: y = ax2 + bx + c
Always remember that a parabola looks likeFigure 2.22 or Figure 2.23 depending uponwhether the value of the coefficient of x2 ispositive or negative.
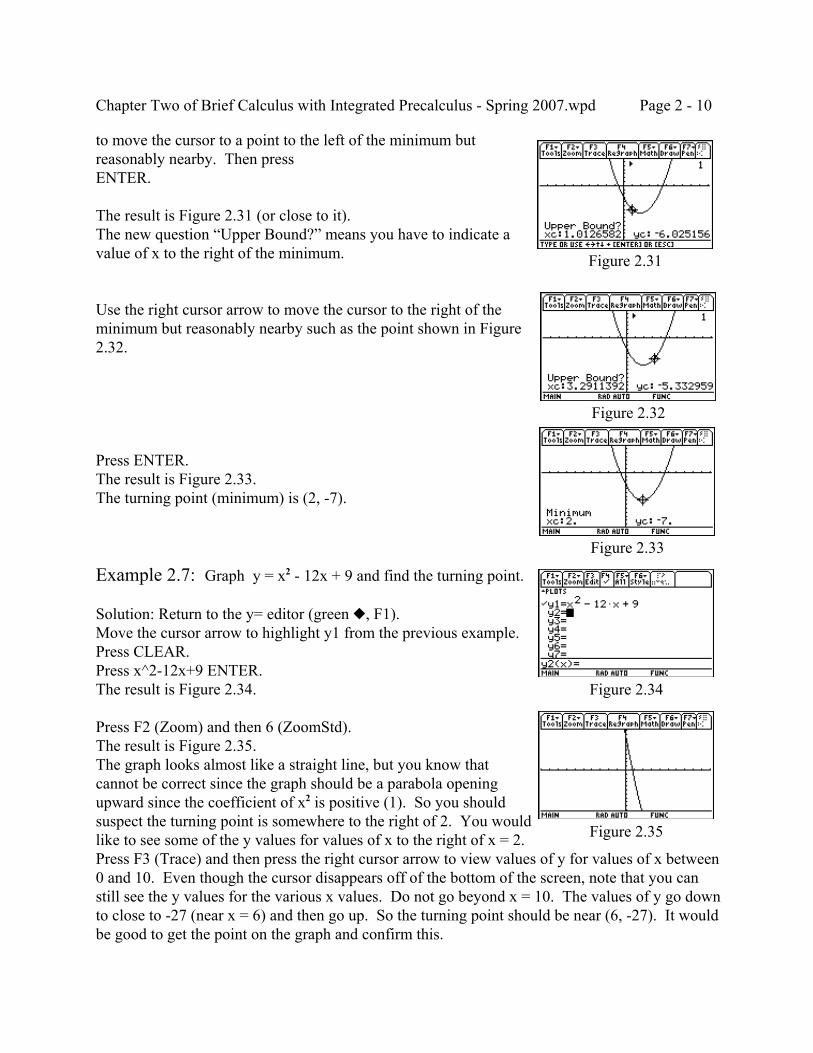
Example 2.6: Graph y = x2 - 4x - 3 and find the turning point.
Solution: Functions to be graphed are entered by using the y=editor. Notice above the blue F1 key y= appears in green. Pressthe green — key and then the F1 key.The result is Figure 2.24.
Chapter Two of Brief Calculus with Integrated Precalculus - Spring 2007.wpd Page 2 - 9
Figure 2.27
Figure 2.28
Figure 2.29
Figure 2.25
Figure 2.30
Figure 2.26
Press x^2-4x-3 ENTERAs soon as you press the first x the equation starts to appear on thecommand (entry) line. It does not move up to the top until youpress ENTER. Your screen should now look like Figure 2.25.
Press F2 (Zoom).The result is Figure 2.26.Press 6 (for ZoomStd)
(or cursor down to highlight 6:ZoomStd and press ENTER).
The result is Figure 2.27, the graph of y = x2 - 4x - 3.The axes are not labeled. It is assumed that you know that forZoomStd the x-axis goes from -10 to 10 and the y-axis does thesame. The tick marks for the x-axis are -10,-9,-8,-7,....,8,9,10.The same is true for the y-axis. Notice that the turning point lookslike it occurs at (2, -7). Trace can be used to get a goodapproximation as to where the point is located. F5 (Math) can beused to find it exactly.
Press F3 (Trace).The result is Figure 2.28. The coordinates of the point on theparabola near the (horizontal) middle of the screen are displayed andthe cursor is blinking at that point. So (0.253, -3.949) is a point onthe graph. As you press the right cursor, the values of y decreaseuntil you get to (2.0253165, -6.999359). The point just before thatwas (1.7721519, -6.948085) and the point after that is(2.278481, -6.922448). Based on these facts you might estimate theturning point to be (2.025, -6.999). But all you can really say forsure is that it occurs at a value of x between 1.77 and 2.28 and thatthe value of y is less than -6.999.Press F5 (Math).The result is Figure 2.29.The point we are looking for is a low point on the graph, aminimum.Press 3 (for Minimum).The result is Figure 2.30.The question “Lower Bound?” means you have to indicate a valueof x to the left of the minimum. This can be entered numerically,but usually it is done by simply using the left or right cursor arrow
Chapter Two of Brief Calculus with Integrated Precalculus - Spring 2007.wpd Page 2 - 10
Figure 2.33
Figure 2.34
Figure 2.35
Figure 2.31
Figure 2.32
to move the cursor to a point to the left of the minimum butreasonably nearby. Then pressENTER.
The result is Figure 2.31 (or close to it).The new question “Upper Bound?” means you have to indicate avalue of x to the right of the minimum.
Use the right cursor arrow to move the cursor to the right of theminimum but reasonably nearby such as the point shown in Figure2.32.
Press ENTER.The result is Figure 2.33.The turning point (minimum) is (2, -7).
Example 2.7: Graph y = x2 - 12x + 9 and find the turning point.
Solution: Return to the y= editor (green —, F1).Move the cursor arrow to highlight y1 from the previous example.Press CLEAR.Press x^2-12x+9 ENTER.The result is Figure 2.34.
Press F2 (Zoom) and then 6 (ZoomStd).The result is Figure 2.35.The graph looks almost like a straight line, but you know thatcannot be correct since the graph should be a parabola openingupward since the coefficient of x2 is positive (1). So you shouldsuspect the turning point is somewhere to the right of 2. You wouldlike to see some of the y values for values of x to the right of x = 2.Press F3 (Trace) and then press the right cursor arrow to view values of y for values of x between0 and 10. Even though the cursor disappears off of the bottom of the screen, note that you canstill see the y values for the various x values. Do not go beyond x = 10. The values of y go downto close to -27 (near x = 6) and then go up. So the turning point should be near (6, -27). It wouldbe good to get the point on the graph and confirm this.
Chapter Two of Brief Calculus with Integrated Precalculus - Spring 2007.wpd Page 2 - 11
Figure 2.37
Figure 2.38
Figure 2.39
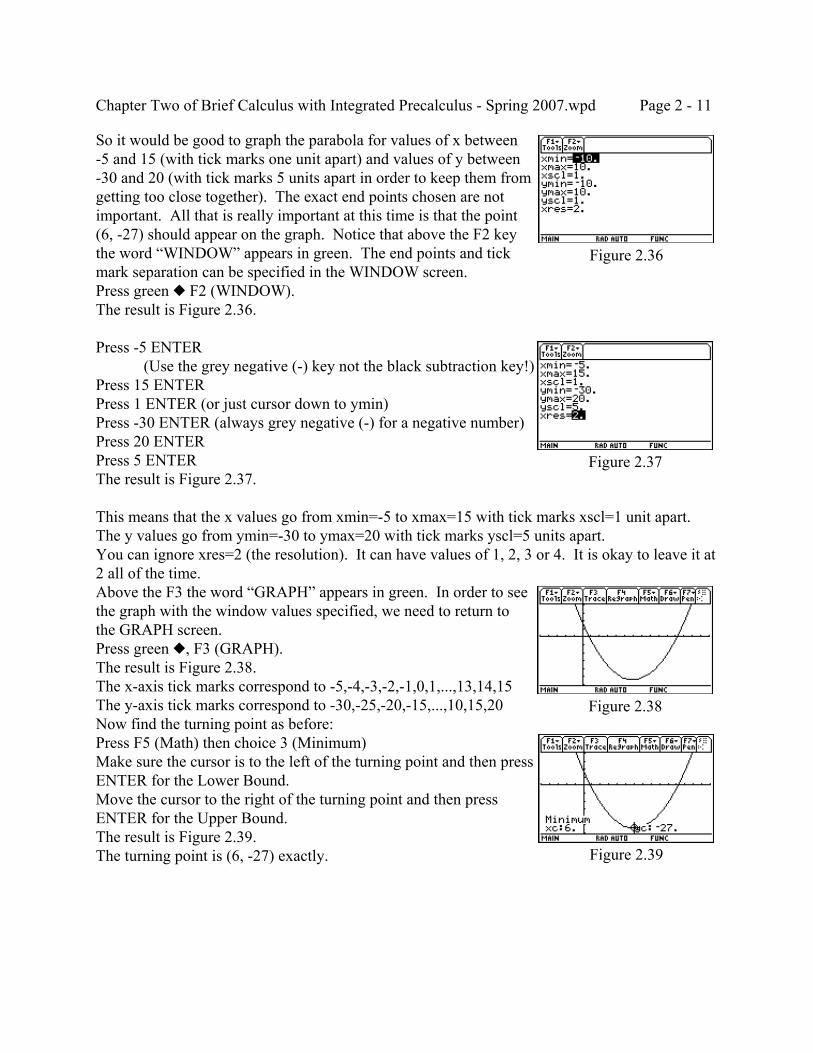
Figure 2.36
So it would be good to graph the parabola for values of x between-5 and 15 (with tick marks one unit apart) and values of y between-30 and 20 (with tick marks 5 units apart in order to keep them fromgetting too close together). The exact end points chosen are notimportant. All that is really important at this time is that the point(6, -27) should appear on the graph. Notice that above the F2 keythe word “WINDOW” appears in green. The end points and tickmark separation can be specified in the WINDOW screen.Press green — F2 (WINDOW).The result is Figure 2.36.
Press -5 ENTER(Use the grey negative (-) key not the black subtraction key!)
Press 15 ENTERPress 1 ENTER (or just cursor down to ymin)Press -30 ENTER (always grey negative (-) for a negative number)Press 20 ENTERPress 5 ENTERThe result is Figure 2.37.
This means that the x values go from xmin=-5 to xmax=15 with tick marks xscl=1 unit apart. The y values go from ymin=-30 to ymax=20 with tick marks yscl=5 units apart.You can ignore xres=2 (the resolution). It can have values of 1, 2, 3 or 4. It is okay to leave it at2 all of the time.Above the F3 the word “GRAPH” appears in green. In order to seethe graph with the window values specified, we need to return tothe GRAPH screen.Press green —, F3 (GRAPH).The result is Figure 2.38.The x-axis tick marks correspond to -5,-4,-3,-2,-1,0,1,...,13,14,15The y-axis tick marks correspond to -30,-25,-20,-15,...,10,15,20Now find the turning point as before:Press F5 (Math) then choice 3 (Minimum)Make sure the cursor is to the left of the turning point and then pressENTER for the Lower Bound.Move the cursor to the right of the turning point and then pressENTER for the Upper Bound.The result is Figure 2.39.The turning point is (6, -27) exactly.
Chapter Two of Brief Calculus with Integrated Precalculus - Spring 2007.wpd Page 2 - 12
Figure 2.41
Figure 2.42
Figure 2.40
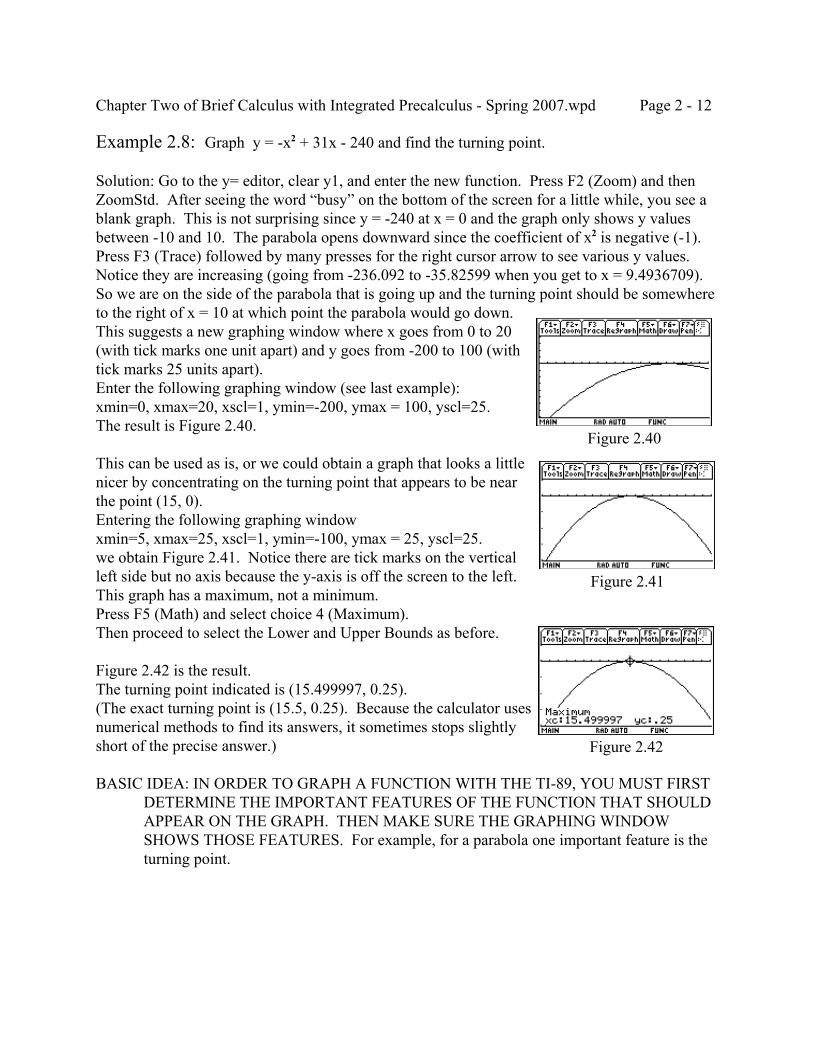
Example 2.8: Graph y = -x2 + 31x - 240 and find the turning point.
Solution: Go to the y= editor, clear y1, and enter the new function. Press F2 (Zoom) and thenZoomStd. After seeing the word “busy” on the bottom of the screen for a little while, you see ablank graph. This is not surprising since y = -240 at x = 0 and the graph only shows y valuesbetween -10 and 10. The parabola opens downward since the coefficient of x2 is negative (-1). Press F3 (Trace) followed by many presses for the right cursor arrow to see various y values. Notice they are increasing (going from -236.092 to -35.82599 when you get to x = 9.4936709). So we are on the side of the parabola that is going up and the turning point should be somewhereto the right of x = 10 at which point the parabola would go down. This suggests a new graphing window where x goes from 0 to 20(with tick marks one unit apart) and y goes from -200 to 100 (withtick marks 25 units apart).Enter the following graphing window (see last example):xmin=0, xmax=20, xscl=1, ymin=-200, ymax = 100, yscl=25.The result is Figure 2.40.
This can be used as is, or we could obtain a graph that looks a littlenicer by concentrating on the turning point that appears to be nearthe point (15, 0).Entering the following graphing windowxmin=5, xmax=25, xscl=1, ymin=-100, ymax = 25, yscl=25.we obtain Figure 2.41. Notice there are tick marks on the verticalleft side but no axis because the y-axis is off the screen to the left.This graph has a maximum, not a minimum.Press F5 (Math) and select choice 4 (Maximum).Then proceed to select the Lower and Upper Bounds as before.
Figure 2.42 is the result.The turning point indicated is (15.499997, 0.25).(The exact turning point is (15.5, 0.25). Because the calculator usesnumerical methods to find its answers, it sometimes stops slightlyshort of the precise answer.)
BASIC IDEA: IN ORDER TO GRAPH A FUNCTION WITH THE TI-89, YOU MUST FIRSTDETERMINE THE IMPORTANT FEATURES OF THE FUNCTION THAT SHOULDAPPEAR ON THE GRAPH. THEN MAKE SURE THE GRAPHING WINDOWSHOWS THOSE FEATURES. For example, for a parabola one important feature is theturning point.
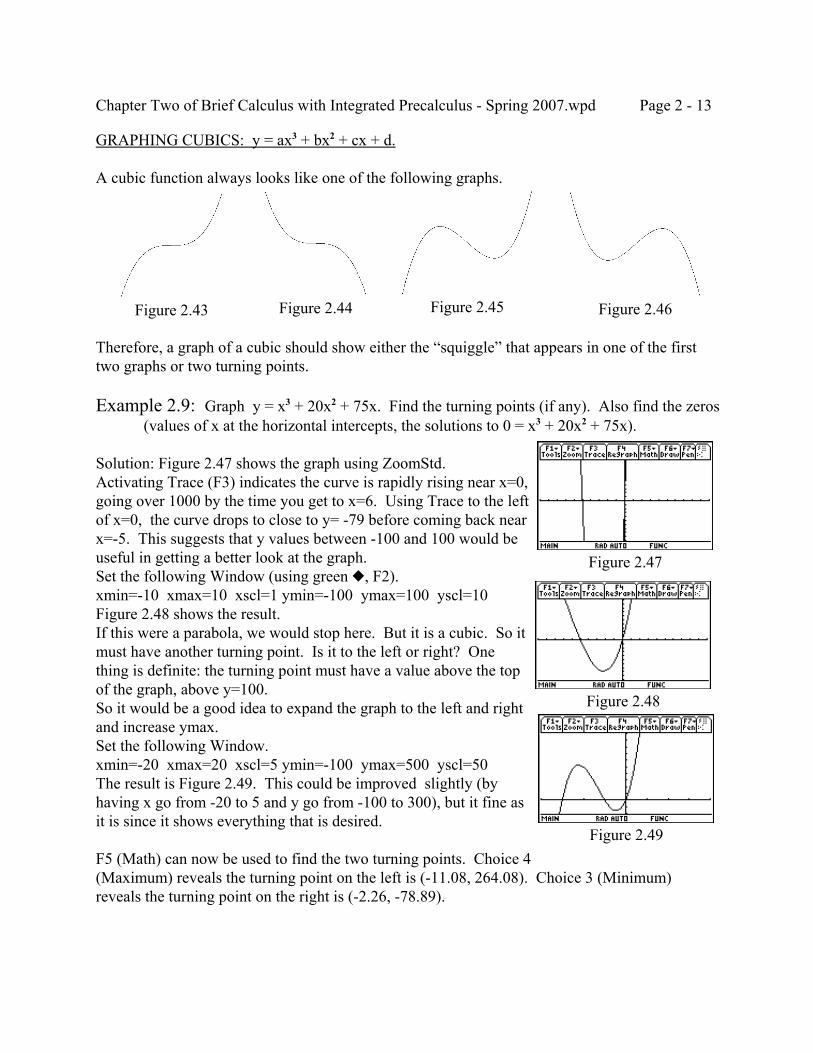
Chapter Two of Brief Calculus with Integrated Precalculus - Spring 2007.wpd Page 2 - 13
Figure 2.48
Figure 2.49
Figure 2.43 Figure 2.44 Figure 2.45 Figure 2.46
Figure 2.47
GRAPHING CUBICS: y = ax3 + bx2 + cx + d.
A cubic function always looks like one of the following graphs.
Therefore, a graph of a cubic should show either the “squiggle” that appears in one of the firsttwo graphs or two turning points.
Example 2.9: Graph y = x3 + 20x2 + 75x. Find the turning points (if any). Also find the zeros(values of x at the horizontal intercepts, the solutions to 0 = x3 + 20x2 + 75x).
Solution: Figure 2.47 shows the graph using ZoomStd.Activating Trace (F3) indicates the curve is rapidly rising near x=0,going over 1000 by the time you get to x=6. Using Trace to the leftof x=0, the curve drops to close to y= -79 before coming back nearx=-5. This suggests that y values between -100 and 100 would beuseful in getting a better look at the graph.Set the following Window (using green —, F2).xmin=-10 xmax=10 xscl=1 ymin=-100 ymax=100 yscl=10Figure 2.48 shows the result.If this were a parabola, we would stop here. But it is a cubic. So itmust have another turning point. Is it to the left or right? Onething is definite: the turning point must have a value above the topof the graph, above y=100.So it would be a good idea to expand the graph to the left and rightand increase ymax.Set the following Window.xmin=-20 xmax=20 xscl=5 ymin=-100 ymax=500 yscl=50The result is Figure 2.49. This could be improved slightly (byhaving x go from -20 to 5 and y go from -100 to 300), but it fine asit is since it shows everything that is desired.
F5 (Math) can now be used to find the two turning points. Choice 4(Maximum) reveals the turning point on the left is (-11.08, 264.08). Choice 3 (Minimum)reveals the turning point on the right is (-2.26, -78.89).
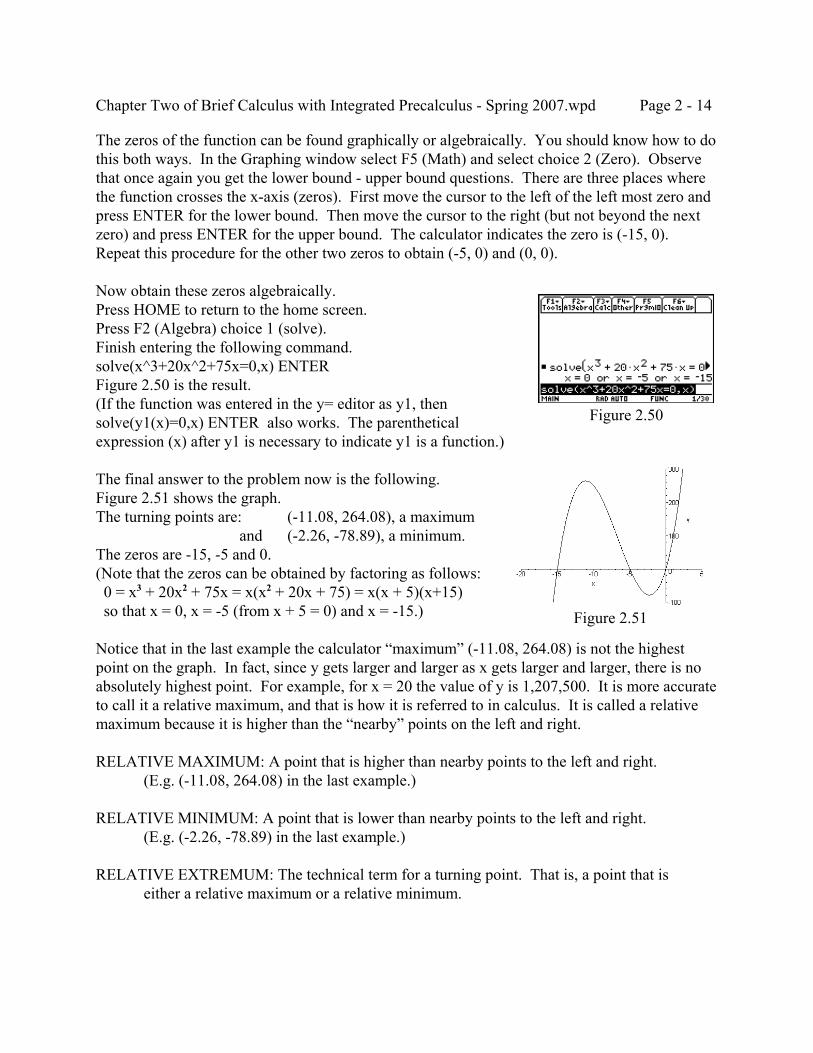
Chapter Two of Brief Calculus with Integrated Precalculus - Spring 2007.wpd Page 2 - 14
Figure 2.50
Figure 2.51
The zeros of the function can be found graphically or algebraically. You should know how to dothis both ways. In the Graphing window select F5 (Math) and select choice 2 (Zero). Observethat once again you get the lower bound - upper bound questions. There are three places wherethe function crosses the x-axis (zeros). First move the cursor to the left of the left most zero andpress ENTER for the lower bound. Then move the cursor to the right (but not beyond the nextzero) and press ENTER for the upper bound. The calculator indicates the zero is (-15, 0). Repeat this procedure for the other two zeros to obtain (-5, 0) and (0, 0).
Now obtain these zeros algebraically.Press HOME to return to the home screen.Press F2 (Algebra) choice 1 (solve).Finish entering the following command.solve(x^3+20x^2+75x=0,x) ENTERFigure 2.50 is the result.(If the function was entered in the y= editor as y1, thensolve(y1(x)=0,x) ENTER also works. The parentheticalexpression (x) after y1 is necessary to indicate y1 is a function.)
The final answer to the problem now is the following.Figure 2.51 shows the graph.The turning points are: (-11.08, 264.08), a maximum
and (-2.26, -78.89), a minimum.The zeros are -15, -5 and 0.(Note that the zeros can be obtained by factoring as follows: 0 = x3 + 20x2 + 75x = x(x2 + 20x + 75) = x(x + 5)(x+15) so that x = 0, x = -5 (from x + 5 = 0) and x = -15.)
Notice that in the last example the calculator “maximum” (-11.08, 264.08) is not the highestpoint on the graph. In fact, since y gets larger and larger as x gets larger and larger, there is noabsolutely highest point. For example, for x = 20 the value of y is 1,207,500. It is more accurateto call it a relative maximum, and that is how it is referred to in calculus. It is called a relativemaximum because it is higher than the “nearby” points on the left and right.
RELATIVE MAXIMUM: A point that is higher than nearby points to the left and right.(E.g. (-11.08, 264.08) in the last example.)
RELATIVE MINIMUM: A point that is lower than nearby points to the left and right.(E.g. (-2.26, -78.89) in the last example.)
RELATIVE EXTREMUM: The technical term for a turning point. That is, a point that iseither a relative maximum or a relative minimum.
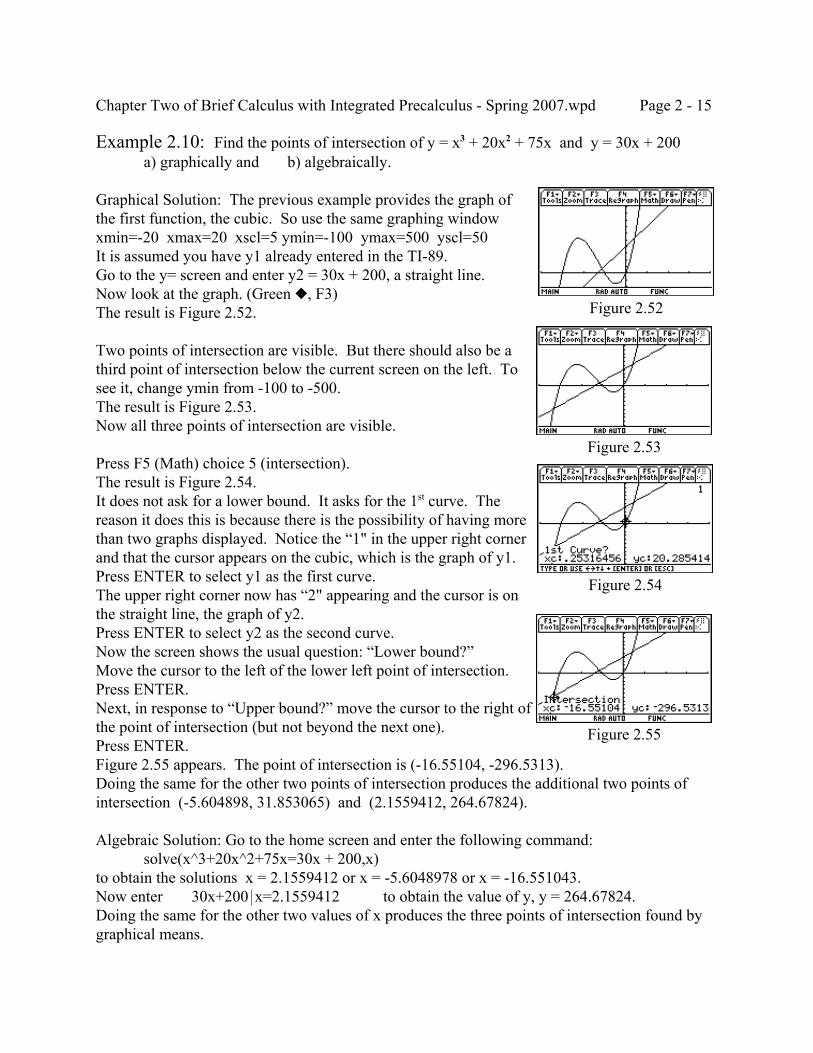
Chapter Two of Brief Calculus with Integrated Precalculus - Spring 2007.wpd Page 2 - 15
Figure 2.52
Figure 2.53
Figure 2.54
Figure 2.55
Example 2.10: Find the points of intersection of y = x3 + 20x2 + 75x and y = 30x + 200a) graphically and b) algebraically.
Graphical Solution: The previous example provides the graph ofthe first function, the cubic. So use the same graphing windowxmin=-20 xmax=20 xscl=5 ymin=-100 ymax=500 yscl=50It is assumed you have y1 already entered in the TI-89.Go to the y= screen and enter y2 = 30x + 200, a straight line.Now look at the graph. (Green —, F3)The result is Figure 2.52.
Two points of intersection are visible. But there should also be athird point of intersection below the current screen on the left. Tosee it, change ymin from -100 to -500.The result is Figure 2.53.Now all three points of intersection are visible.
Press F5 (Math) choice 5 (intersection).The result is Figure 2.54.It does not ask for a lower bound. It asks for the 1st curve. Thereason it does this is because there is the possibility of having morethan two graphs displayed. Notice the “1" in the upper right cornerand that the cursor appears on the cubic, which is the graph of y1.Press ENTER to select y1 as the first curve.The upper right corner now has “2" appearing and the cursor is onthe straight line, the graph of y2.Press ENTER to select y2 as the second curve.Now the screen shows the usual question: “Lower bound?”Move the cursor to the left of the lower left point of intersection.Press ENTER.Next, in response to “Upper bound?” move the cursor to the right ofthe point of intersection (but not beyond the next one).Press ENTER.Figure 2.55 appears. The point of intersection is (-16.55104, -296.5313).Doing the same for the other two points of intersection produces the additional two points ofintersection (-5.604898, 31.853065) and (2.1559412, 264.67824).
Algebraic Solution: Go to the home screen and enter the following command:solve(x^3+20x^2+75x=30x + 200,x)
to obtain the solutions x = 2.1559412 or x = -5.6048978 or x = -16.551043.Now enter 30x+200*x=2.1559412 to obtain the value of y, y = 264.67824.Doing the same for the other two values of x produces the three points of intersection found bygraphical means.
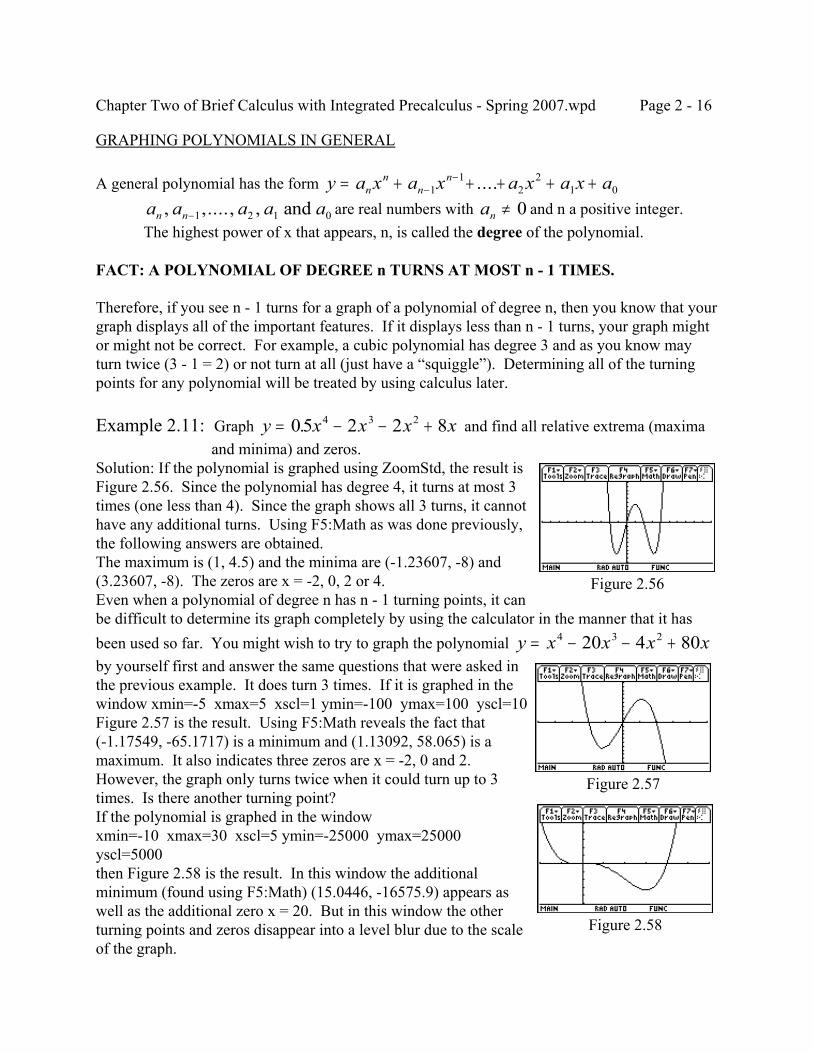
Chapter Two of Brief Calculus with Integrated Precalculus - Spring 2007.wpd Page 2 - 16
Figure 2.56
Figure 2.57
Figure 2.58
GRAPHING POLYNOMIALS IN GENERAL
A general polynomial has the form y a x a x a x a x ann
nn= + + + + +−−
11
22
1 0....are real numbers with and n a positive integer.a a a a an n, ,...., ,−1 2 1 0 and an ≠ 0
The highest power of x that appears, n, is called the degree of the polynomial.
FACT: A POLYNOMIAL OF DEGREE n TURNS AT MOST n - 1 TIMES.
Therefore, if you see n - 1 turns for a graph of a polynomial of degree n, then you know that yourgraph displays all of the important features. If it displays less than n - 1 turns, your graph mightor might not be correct. For example, a cubic polynomial has degree 3 and as you know mayturn twice (3 - 1 = 2) or not turn at all (just have a “squiggle”). Determining all of the turningpoints for any polynomial will be treated by using calculus later.
Example 2.11: Graph and find all relative extrema (maximay x x x x= − − +05 2 2 84 3 2. and minima) and zeros.
Solution: If the polynomial is graphed using ZoomStd, the result isFigure 2.56. Since the polynomial has degree 4, it turns at most 3times (one less than 4). Since the graph shows all 3 turns, it cannothave any additional turns. Using F5:Math as was done previously,the following answers are obtained.The maximum is (1, 4.5) and the minima are (-1.23607, -8) and(3.23607, -8). The zeros are x = -2, 0, 2 or 4.Even when a polynomial of degree n has n - 1 turning points, it canbe difficult to determine its graph completely by using the calculator in the manner that it hasbeen used so far. You might wish to try to graph the polynomial y x x x x= − − +4 3 220 4 80by yourself first and answer the same questions that were asked inthe previous example. It does turn 3 times. If it is graphed in thewindow xmin=-5 xmax=5 xscl=1 ymin=-100 ymax=100 yscl=10Figure 2.57 is the result. Using F5:Math reveals the fact that(-1.17549, -65.1717) is a minimum and (1.13092, 58.065) is amaximum. It also indicates three zeros are x = -2, 0 and 2.However, the graph only turns twice when it could turn up to 3times. Is there another turning point?If the polynomial is graphed in the windowxmin=-10 xmax=30 xscl=5 ymin=-25000 ymax=25000 yscl=5000then Figure 2.58 is the result. In this window the additionalminimum (found using F5:Math) (15.0446, -16575.9) appears aswell as the additional zero x = 20. But in this window the otherturning points and zeros disappear into a level blur due to the scaleof the graph.
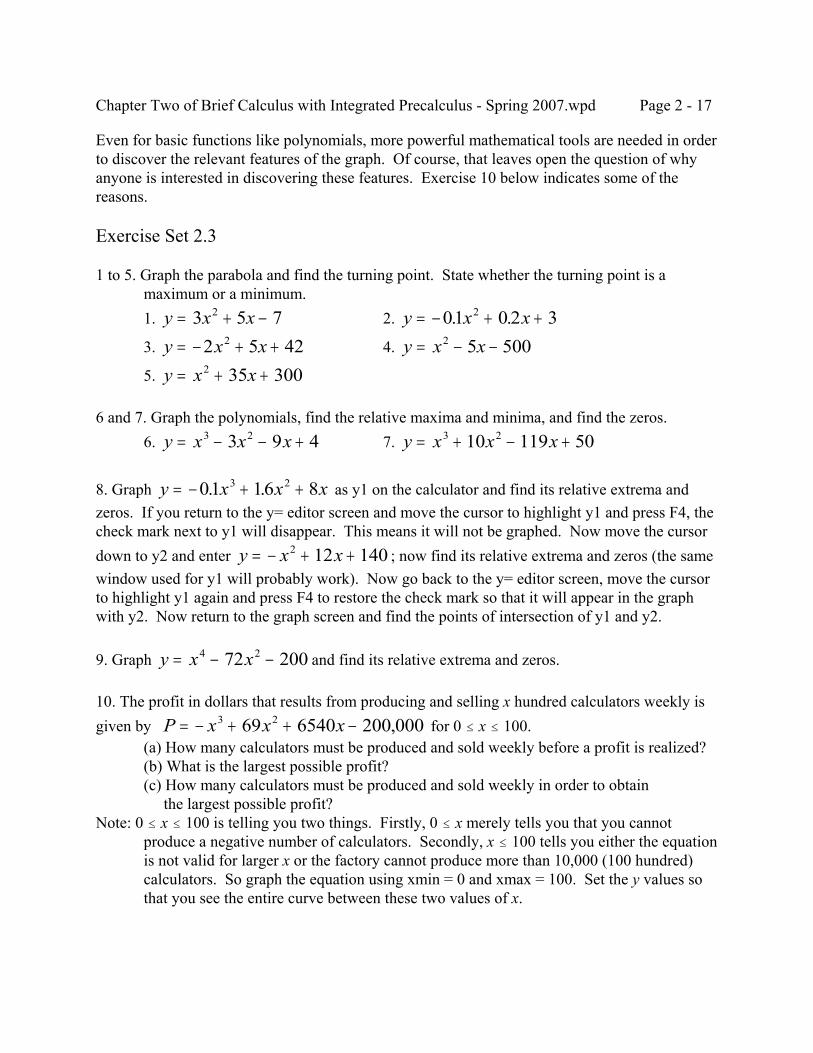
Chapter Two of Brief Calculus with Integrated Precalculus - Spring 2007.wpd Page 2 - 17
Even for basic functions like polynomials, more powerful mathematical tools are needed in orderto discover the relevant features of the graph. Of course, that leaves open the question of whyanyone is interested in discovering these features. Exercise 10 below indicates some of thereasons.
Exercise Set 2.3
1 to 5. Graph the parabola and find the turning point. State whether the turning point is amaximum or a minimum.1. 2. y x x= + −3 5 72 y x x= − + +01 0 2 32. .3. 4. y x x= − + +2 5 422 y x x= − −2 5 5005. y x x= + +2 35 300
6 and 7. Graph the polynomials, find the relative maxima and minima, and find the zeros.6. 7. y x x x= − − +3 23 9 4 y x x x= + − +3 210 119 50
8. Graph as y1 on the calculator and find its relative extrema andy x x x= − + +01 16 83 2. .zeros. If you return to the y= editor screen and move the cursor to highlight y1 and press F4, thecheck mark next to y1 will disappear. This means it will not be graphed. Now move the cursordown to y2 and enter ; now find its relative extrema and zeros (the samey x x= − + +2 12 140window used for y1 will probably work). Now go back to the y= editor screen, move the cursorto highlight y1 again and press F4 to restore the check mark so that it will appear in the graphwith y2. Now return to the graph screen and find the points of intersection of y1 and y2.
9. Graph and find its relative extrema and zeros.y x x= − −4 272 200
10. The profit in dollars that results from producing and selling x hundred calculators weekly isgiven by for 0 # x # 100.P x x x= − + + −3 269 6540 200 000,
(a) How many calculators must be produced and sold weekly before a profit is realized?(b) What is the largest possible profit?(c) How many calculators must be produced and sold weekly in order to obtain the largest possible profit?
Note: 0 # x # 100 is telling you two things. Firstly, 0 # x merely tells you that you cannotproduce a negative number of calculators. Secondly, x # 100 tells you either the equationis not valid for larger x or the factory cannot produce more than 10,000 (100 hundred)calculators. So graph the equation using xmin = 0 and xmax = 100. Set the y values sothat you see the entire curve between these two values of x.
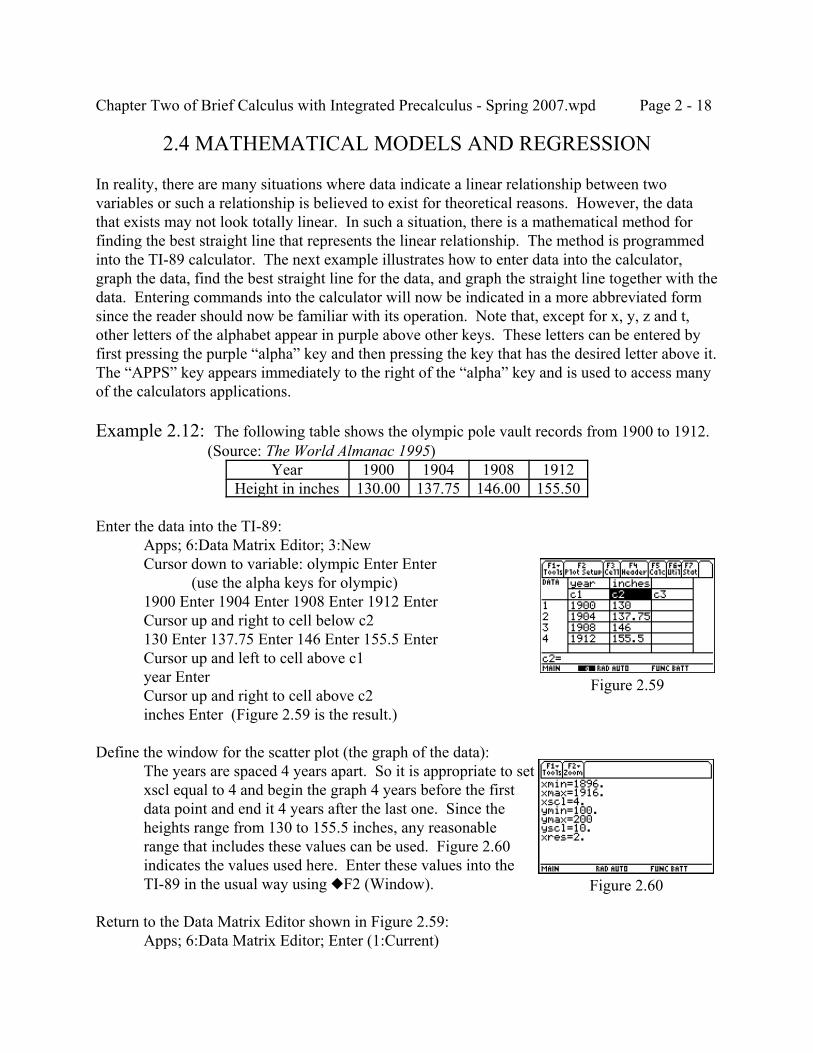
Chapter Two of Brief Calculus with Integrated Precalculus - Spring 2007.wpd Page 2 - 18
Figure 2.59
Figure 2.60
2.4 MATHEMATICAL MODELS AND REGRESSION
In reality, there are many situations where data indicate a linear relationship between twovariables or such a relationship is believed to exist for theoretical reasons. However, the datathat exists may not look totally linear. In such a situation, there is a mathematical method forfinding the best straight line that represents the linear relationship. The method is programmedinto the TI-89 calculator. The next example illustrates how to enter data into the calculator,graph the data, find the best straight line for the data, and graph the straight line together with thedata. Entering commands into the calculator will now be indicated in a more abbreviated formsince the reader should now be familiar with its operation. Note that, except for x, y, z and t,other letters of the alphabet appear in purple above other keys. These letters can be entered byfirst pressing the purple “alpha” key and then pressing the key that has the desired letter above it. The “APPS” key appears immediately to the right of the “alpha” key and is used to access manyof the calculators applications.
Example 2.12: The following table shows the olympic pole vault records from 1900 to 1912. (Source: The World Almanac 1995)
Year 1900 1904 1908 1912Height in inches 130.00 137.75 146.00 155.50
Enter the data into the TI-89:Apps; 6:Data Matrix Editor; 3:NewCursor down to variable: olympic Enter Enter
(use the alpha keys for olympic)1900 Enter 1904 Enter 1908 Enter 1912 EnterCursor up and right to cell below c2130 Enter 137.75 Enter 146 Enter 155.5 EnterCursor up and left to cell above c1year EnterCursor up and right to cell above c2inches Enter (Figure 2.59 is the result.)
Define the window for the scatter plot (the graph of the data):The years are spaced 4 years apart. So it is appropriate to setxscl equal to 4 and begin the graph 4 years before the firstdata point and end it 4 years after the last one. Since theheights range from 130 to 155.5 inches, any reasonablerange that includes these values can be used. Figure 2.60indicates the values used here. Enter these values into theTI-89 in the usual way using —F2 (Window).
Return to the Data Matrix Editor shown in Figure 2.59:Apps; 6:Data Matrix Editor; Enter (1:Current)
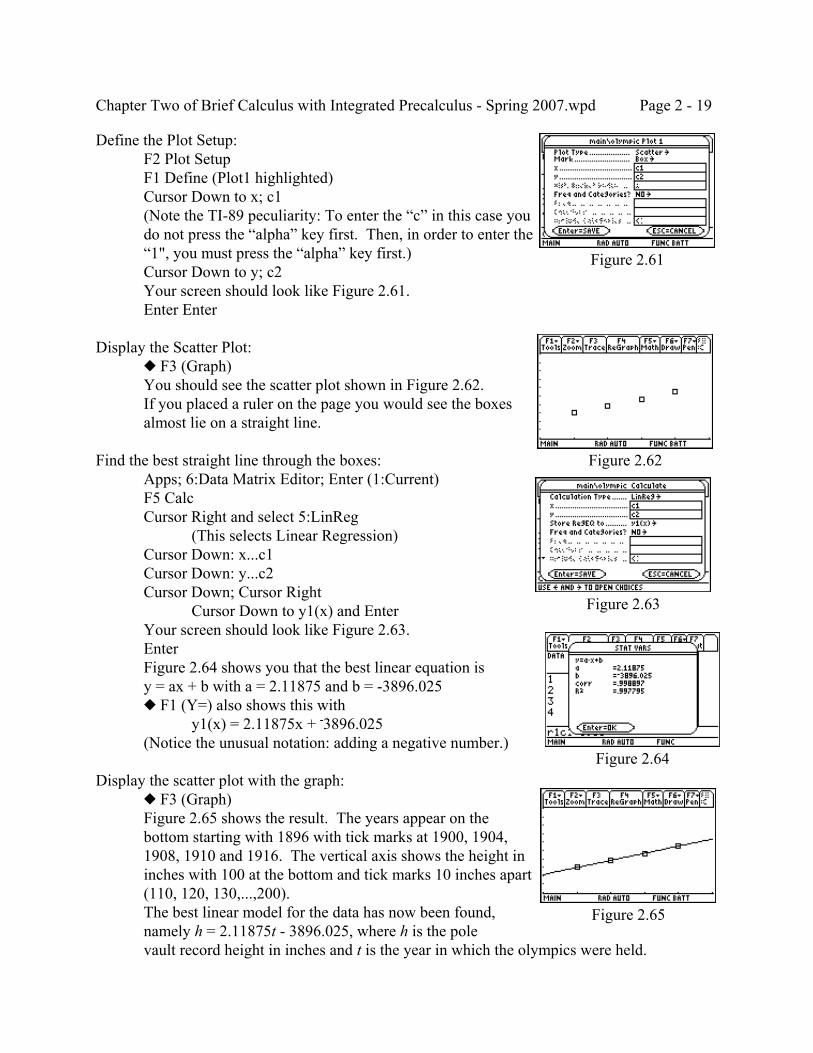
Chapter Two of Brief Calculus with Integrated Precalculus - Spring 2007.wpd Page 2 - 19
Figure 2.61
Figure 2.62
Figure 2.63
Figure 2.65
Figure 2.64
Define the Plot Setup:F2 Plot SetupF1 Define (Plot1 highlighted)Cursor Down to x; c1(Note the TI-89 peculiarity: To enter the “c” in this case youdo not press the “alpha” key first. Then, in order to enter the“1", you must press the “alpha” key first.)Cursor Down to y; c2Your screen should look like Figure 2.61.Enter Enter
Display the Scatter Plot:— F3 (Graph)You should see the scatter plot shown in Figure 2.62.If you placed a ruler on the page you would see the boxesalmost lie on a straight line.
Find the best straight line through the boxes:Apps; 6:Data Matrix Editor; Enter (1:Current)F5 CalcCursor Right and select 5:LinReg
(This selects Linear Regression)Cursor Down: x...c1Cursor Down: y...c2Cursor Down; Cursor Right
Cursor Down to y1(x) and EnterYour screen should look like Figure 2.63.EnterFigure 2.64 shows you that the best linear equation isy = ax + b with a = 2.11875 and b = -3896.025— F1 (Y=) also shows this with
y1(x) = 2.11875x + -3896.025(Notice the unusual notation: adding a negative number.)
Display the scatter plot with the graph:— F3 (Graph)Figure 2.65 shows the result. The years appear on thebottom starting with 1896 with tick marks at 1900, 1904,1908, 1910 and 1916. The vertical axis shows the height ininches with 100 at the bottom and tick marks 10 inches apart(110, 120, 130,...,200).The best linear model for the data has now been found,namely h = 2.11875t - 3896.025, where h is the polevault record height in inches and t is the year in which the olympics were held.
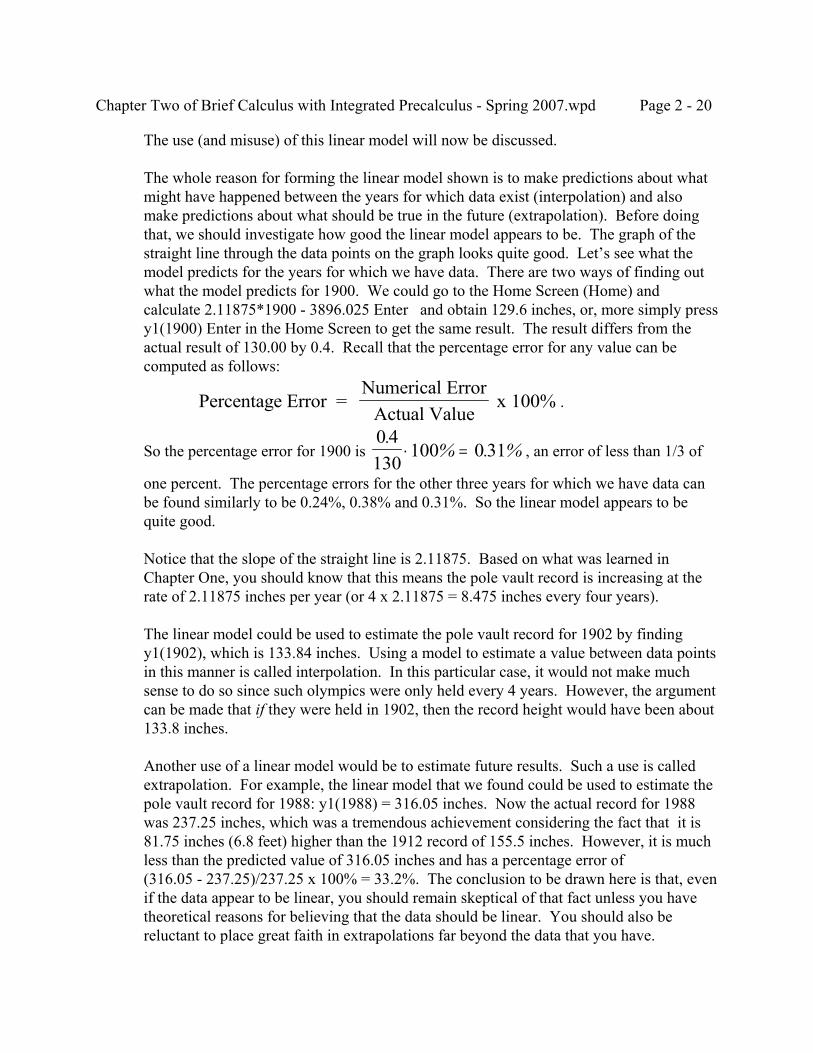
Chapter Two of Brief Calculus with Integrated Precalculus - Spring 2007.wpd Page 2 - 20
The use (and misuse) of this linear model will now be discussed.
The whole reason for forming the linear model shown is to make predictions about whatmight have happened between the years for which data exist (interpolation) and alsomake predictions about what should be true in the future (extrapolation). Before doingthat, we should investigate how good the linear model appears to be. The graph of thestraight line through the data points on the graph looks quite good. Let’s see what themodel predicts for the years for which we have data. There are two ways of finding outwhat the model predicts for 1900. We could go to the Home Screen (Home) andcalculate 2.11875*1900 - 3896.025 Enter and obtain 129.6 inches, or, more simply pressy1(1900) Enter in the Home Screen to get the same result. The result differs from theactual result of 130.00 by 0.4. Recall that the percentage error for any value can becomputed as follows:
.Percentage Error = Numerical Error
Actual Value x 100%
So the percentage error for 1900 is , an error of less than 1/3 of0 4130
100 0 31.
% . %⋅ =
one percent. The percentage errors for the other three years for which we have data canbe found similarly to be 0.24%, 0.38% and 0.31%. So the linear model appears to bequite good.
Notice that the slope of the straight line is 2.11875. Based on what was learned inChapter One, you should know that this means the pole vault record is increasing at therate of 2.11875 inches per year (or 4 x 2.11875 = 8.475 inches every four years).
The linear model could be used to estimate the pole vault record for 1902 by findingy1(1902), which is 133.84 inches. Using a model to estimate a value between data pointsin this manner is called interpolation. In this particular case, it would not make muchsense to do so since such olympics were only held every 4 years. However, the argumentcan be made that if they were held in 1902, then the record height would have been about133.8 inches.
Another use of a linear model would be to estimate future results. Such a use is calledextrapolation. For example, the linear model that we found could be used to estimate thepole vault record for 1988: y1(1988) = 316.05 inches. Now the actual record for 1988was 237.25 inches, which was a tremendous achievement considering the fact that it is81.75 inches (6.8 feet) higher than the 1912 record of 155.5 inches. However, it is muchless than the predicted value of 316.05 inches and has a percentage error of(316.05 - 237.25)/237.25 x 100% = 33.2%. The conclusion to be drawn here is that, evenif the data appear to be linear, you should remain skeptical of that fact unless you havetheoretical reasons for believing that the data should be linear. You should also bereluctant to place great faith in extrapolations far beyond the data that you have.
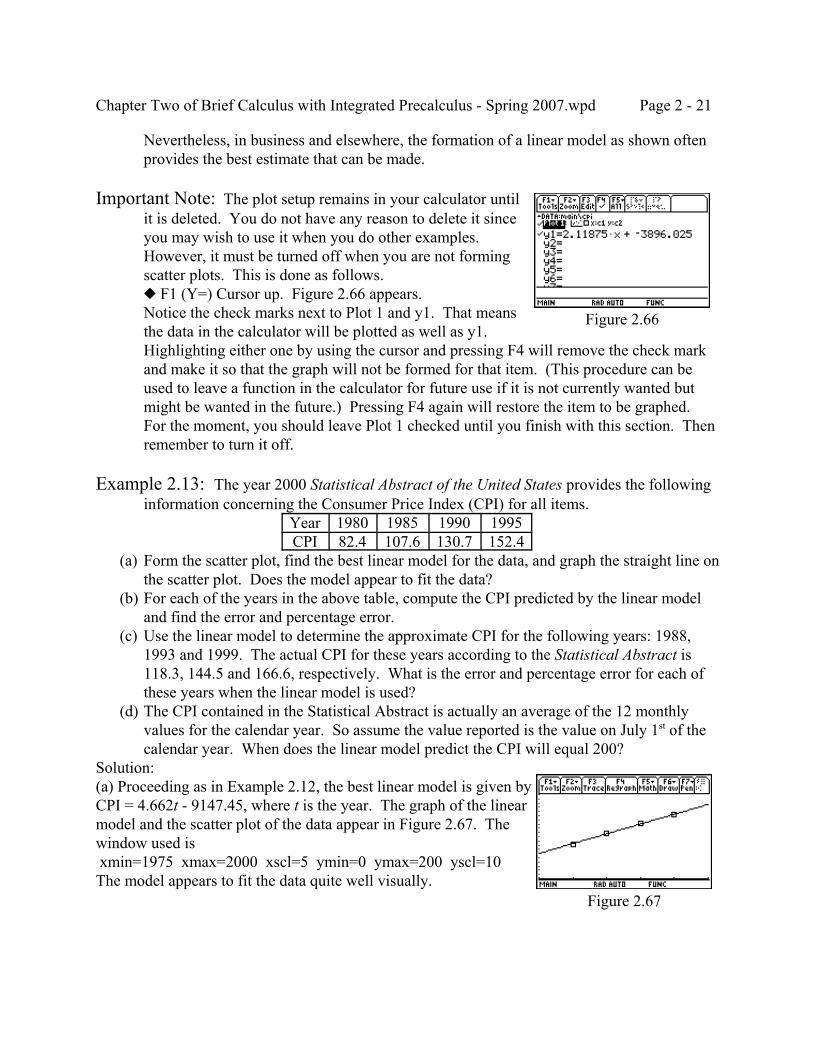
Chapter Two of Brief Calculus with Integrated Precalculus - Spring 2007.wpd Page 2 - 21
Figure 2.66
Figure 2.67
Nevertheless, in business and elsewhere, the formation of a linear model as shown oftenprovides the best estimate that can be made.
Important Note: The plot setup remains in your calculator untilit is deleted. You do not have any reason to delete it sinceyou may wish to use it when you do other examples. However, it must be turned off when you are not formingscatter plots. This is done as follows.— F1 (Y=) Cursor up. Figure 2.66 appears.Notice the check marks next to Plot 1 and y1. That meansthe data in the calculator will be plotted as well as y1. Highlighting either one by using the cursor and pressing F4 will remove the check markand make it so that the graph will not be formed for that item. (This procedure can beused to leave a function in the calculator for future use if it is not currently wanted butmight be wanted in the future.) Pressing F4 again will restore the item to be graphed. For the moment, you should leave Plot 1 checked until you finish with this section. Thenremember to turn it off.
Example 2.13: The year 2000 Statistical Abstract of the United States provides the followinginformation concerning the Consumer Price Index (CPI) for all items.
Year 1980 1985 1990 1995CPI 82.4 107.6 130.7 152.4
(a) Form the scatter plot, find the best linear model for the data, and graph the straight line onthe scatter plot. Does the model appear to fit the data?
(b) For each of the years in the above table, compute the CPI predicted by the linear modeland find the error and percentage error.
(c) Use the linear model to determine the approximate CPI for the following years: 1988,1993 and 1999. The actual CPI for these years according to the Statistical Abstract is118.3, 144.5 and 166.6, respectively. What is the error and percentage error for each ofthese years when the linear model is used?
(d) The CPI contained in the Statistical Abstract is actually an average of the 12 monthlyvalues for the calendar year. So assume the value reported is the value on July 1st of thecalendar year. When does the linear model predict the CPI will equal 200?
Solution:(a) Proceeding as in Example 2.12, the best linear model is given byCPI = 4.662t - 9147.45, where t is the year. The graph of the linearmodel and the scatter plot of the data appear in Figure 2.67. Thewindow used is xmin=1975 xmax=2000 xscl=5 ymin=0 ymax=200 yscl=10The model appears to fit the data quite well visually.
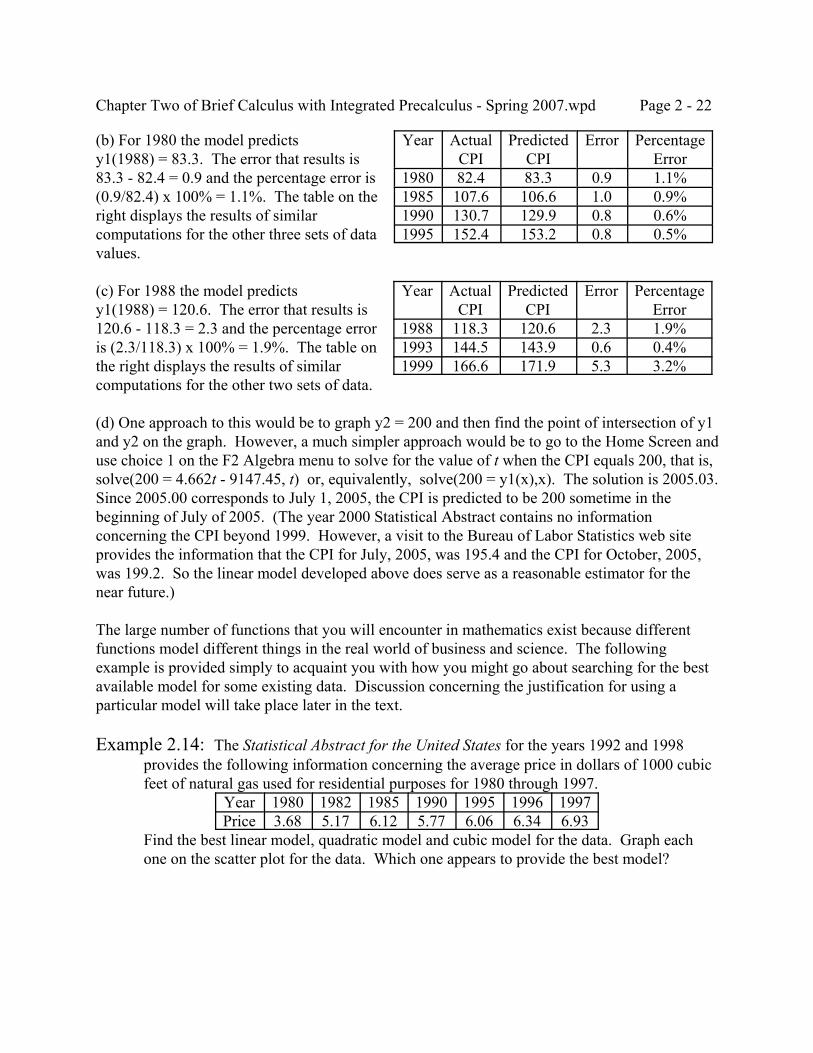
Chapter Two of Brief Calculus with Integrated Precalculus - Spring 2007.wpd Page 2 - 22
(b) For 1980 the model predictsy1(1988) = 83.3. The error that results is83.3 - 82.4 = 0.9 and the percentage error is(0.9/82.4) x 100% = 1.1%. The table on theright displays the results of similarcomputations for the other three sets of datavalues.
Year ActualCPI
PredictedCPI
Error PercentageError
1980 82.4 83.3 0.9 1.1%1985 107.6 106.6 1.0 0.9%1990 130.7 129.9 0.8 0.6%1995 152.4 153.2 0.8 0.5%
(c) For 1988 the model predictsy1(1988) = 120.6. The error that results is120.6 - 118.3 = 2.3 and the percentage erroris (2.3/118.3) x 100% = 1.9%. The table onthe right displays the results of similarcomputations for the other two sets of data.
Year ActualCPI
PredictedCPI
Error PercentageError
1988 118.3 120.6 2.3 1.9%1993 144.5 143.9 0.6 0.4%1999 166.6 171.9 5.3 3.2%
(d) One approach to this would be to graph y2 = 200 and then find the point of intersection of y1and y2 on the graph. However, a much simpler approach would be to go to the Home Screen anduse choice 1 on the F2 Algebra menu to solve for the value of t when the CPI equals 200, that is,solve(200 = 4.662t - 9147.45, t) or, equivalently, solve(200 = y1(x),x). The solution is 2005.03. Since 2005.00 corresponds to July 1, 2005, the CPI is predicted to be 200 sometime in thebeginning of July of 2005. (The year 2000 Statistical Abstract contains no informationconcerning the CPI beyond 1999. However, a visit to the Bureau of Labor Statistics web siteprovides the information that the CPI for July, 2005, was 195.4 and the CPI for October, 2005,was 199.2. So the linear model developed above does serve as a reasonable estimator for thenear future.)
The large number of functions that you will encounter in mathematics exist because differentfunctions model different things in the real world of business and science. The followingexample is provided simply to acquaint you with how you might go about searching for the bestavailable model for some existing data. Discussion concerning the justification for using aparticular model will take place later in the text.
Example 2.14: The Statistical Abstract for the United States for the years 1992 and 1998provides the following information concerning the average price in dollars of 1000 cubicfeet of natural gas used for residential purposes for 1980 through 1997.
Year 1980 1982 1985 1990 1995 1996 1997Price 3.68 5.17 6.12 5.77 6.06 6.34 6.93
Find the best linear model, quadratic model and cubic model for the data. Graph eachone on the scatter plot for the data. Which one appears to provide the best model?
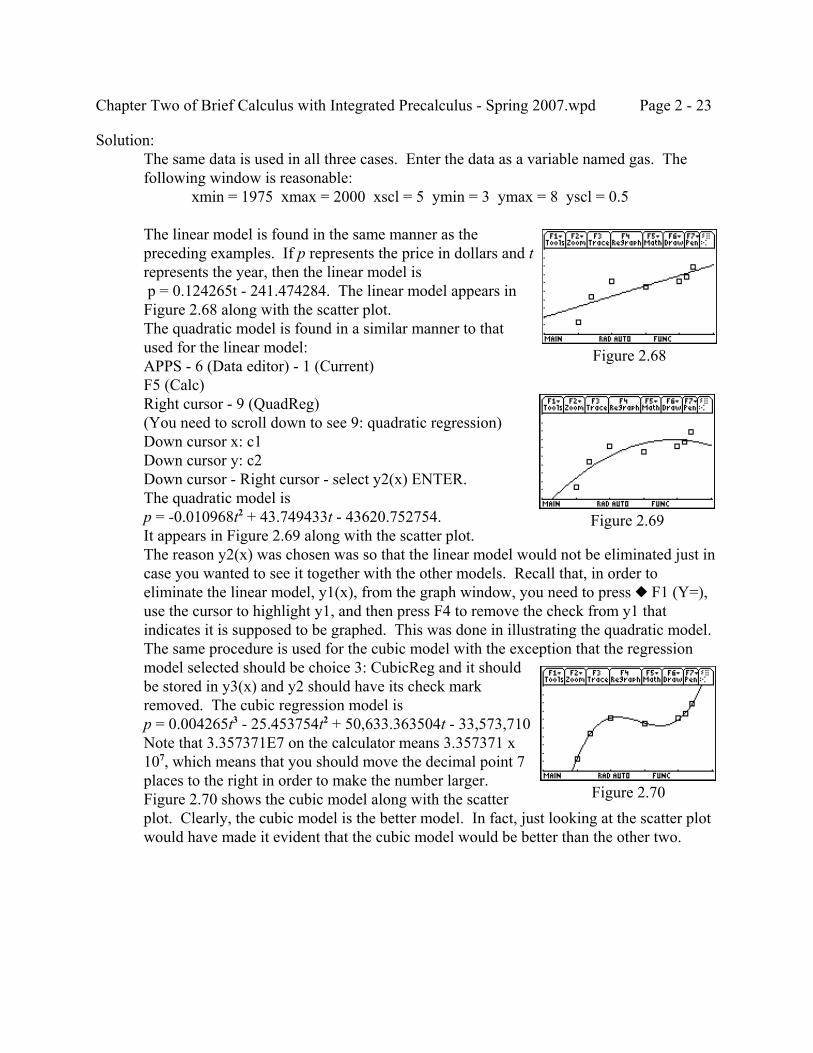
Chapter Two of Brief Calculus with Integrated Precalculus - Spring 2007.wpd Page 2 - 23
Figure 2.68
Figure 2.69
Figure 2.70
Solution:The same data is used in all three cases. Enter the data as a variable named gas. Thefollowing window is reasonable:
xmin = 1975 xmax = 2000 xscl = 5 ymin = 3 ymax = 8 yscl = 0.5
The linear model is found in the same manner as thepreceding examples. If p represents the price in dollars and trepresents the year, then the linear model is p = 0.124265t - 241.474284. The linear model appears inFigure 2.68 along with the scatter plot.The quadratic model is found in a similar manner to thatused for the linear model:APPS - 6 (Data editor) - 1 (Current)F5 (Calc)Right cursor - 9 (QuadReg)(You need to scroll down to see 9: quadratic regression)Down cursor x: c1Down cursor y: c2Down cursor - Right cursor - select y2(x) ENTER.The quadratic model isp = -0.010968t2 + 43.749433t - 43620.752754.It appears in Figure 2.69 along with the scatter plot.The reason y2(x) was chosen was so that the linear model would not be eliminated just incase you wanted to see it together with the other models. Recall that, in order toeliminate the linear model, y1(x), from the graph window, you need to press — F1 (Y=),use the cursor to highlight y1, and then press F4 to remove the check from y1 thatindicates it is supposed to be graphed. This was done in illustrating the quadratic model.The same procedure is used for the cubic model with the exception that the regressionmodel selected should be choice 3: CubicReg and it shouldbe stored in y3(x) and y2 should have its check markremoved. The cubic regression model isp = 0.004265t3 - 25.453754t2 + 50,633.363504t - 33,573,710Note that 3.357371E7 on the calculator means 3.357371 x10⁷, which means that you should move the decimal point 7places to the right in order to make the number larger.Figure 2.70 shows the cubic model along with the scatterplot. Clearly, the cubic model is the better model. In fact, just looking at the scatter plotwould have made it evident that the cubic model would be better than the other two.
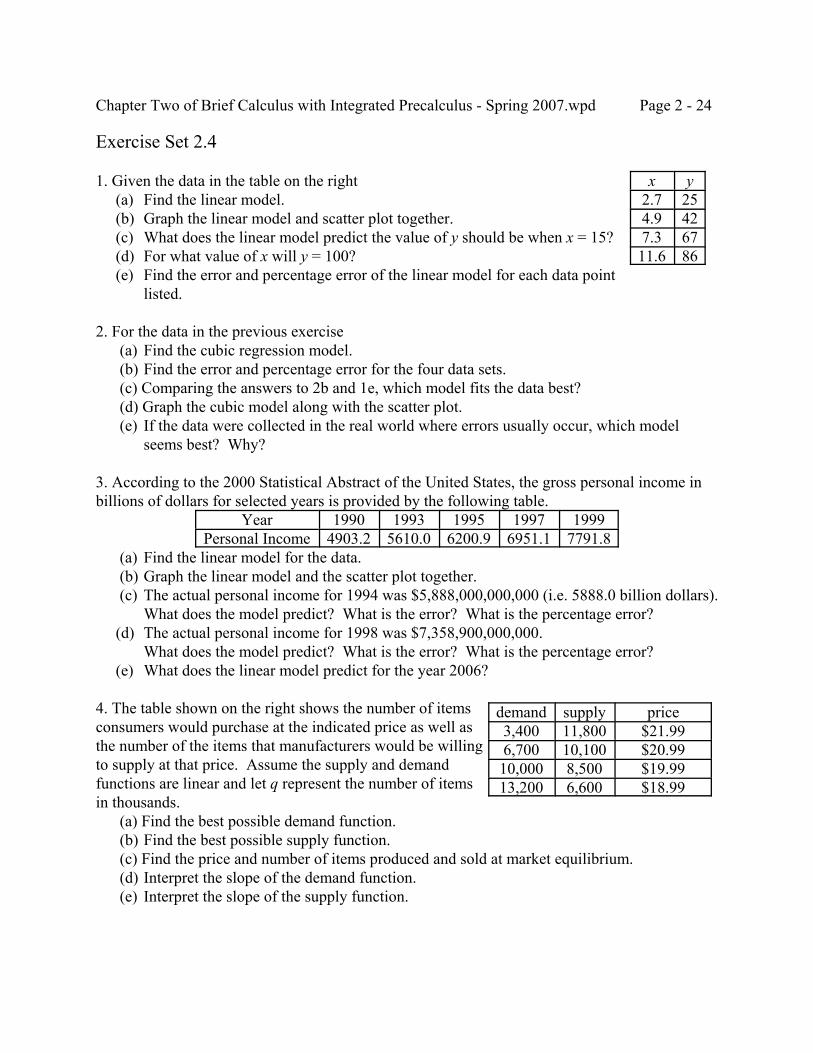
Chapter Two of Brief Calculus with Integrated Precalculus - Spring 2007.wpd Page 2 - 24
Exercise Set 2.4
1. Given the data in the table on the right (a) Find the linear model. (b) Graph the linear model and scatter plot together. (c) What does the linear model predict the value of y should be when x = 15? (d) For what value of x will y = 100? (e) Find the error and percentage error of the linear model for each data point
listed.
x y2.7 254.9 427.3 6711.6 86
2. For the data in the previous exercise (a) Find the cubic regression model. (b) Find the error and percentage error for the four data sets. (c) Comparing the answers to 2b and 1e, which model fits the data best? (d) Graph the cubic model along with the scatter plot. (e) If the data were collected in the real world where errors usually occur, which model
seems best? Why?
3. According to the 2000 Statistical Abstract of the United States, the gross personal income inbillions of dollars for selected years is provided by the following table.
Year 1990 1993 1995 1997 1999Personal Income 4903.2 5610.0 6200.9 6951.1 7791.8
(a) Find the linear model for the data. (b) Graph the linear model and the scatter plot together. (c) The actual personal income for 1994 was $5,888,000,000,000 (i.e. 5888.0 billion dollars).
What does the model predict? What is the error? What is the percentage error? (d) The actual personal income for 1998 was $7,358,900,000,000.
What does the model predict? What is the error? What is the percentage error? (e) What does the linear model predict for the year 2006?
4. The table shown on the right shows the number of itemsconsumers would purchase at the indicated price as well asthe number of the items that manufacturers would be willingto supply at that price. Assume the supply and demandfunctions are linear and let q represent the number of itemsin thousands. (a) Find the best possible demand function. (b) Find the best possible supply function. (c) Find the price and number of items produced and sold at market equilibrium. (d) Interpret the slope of the demand function. (e) Interpret the slope of the supply function.
demand supply price3,400 11,800 $21.996,700 10,100 $20.9910,000 8,500 $19.9913,200 6,600 $18.99
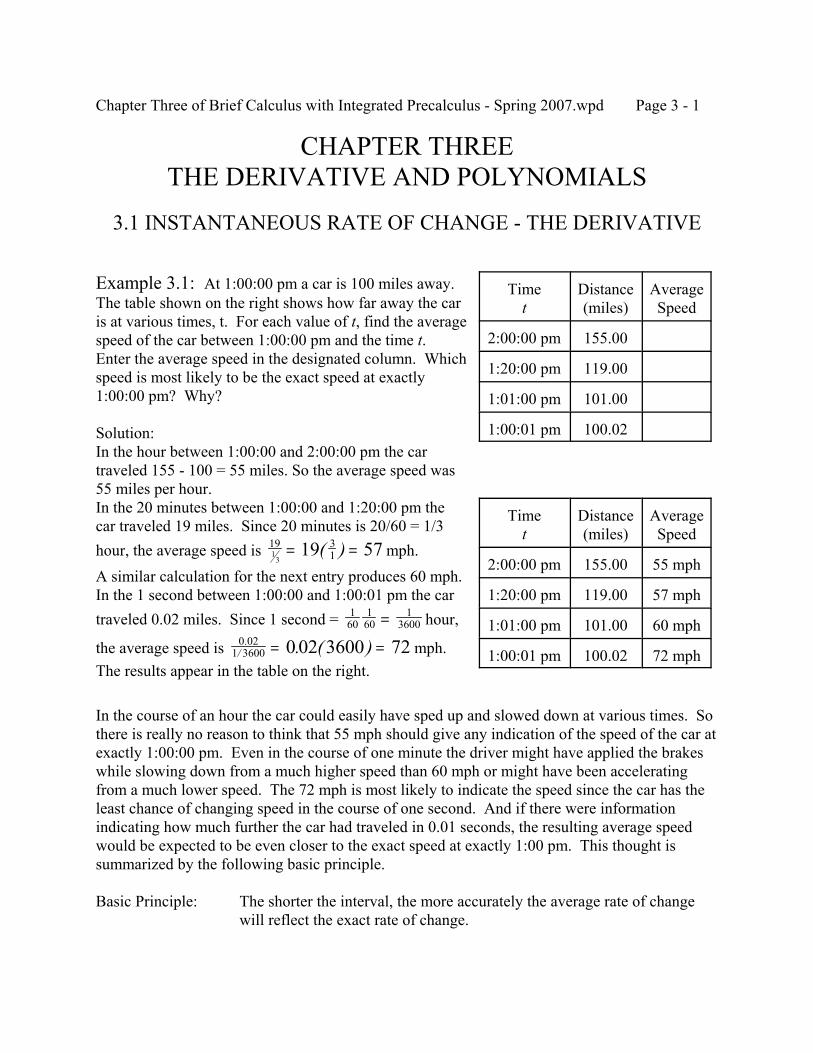
Chapter Three of Brief Calculus with Integrated Precalculus - Spring 2007.wpd Page 3 - 1
CHAPTER THREETHE DERIVATIVE AND POLYNOMIALS
3.1 INSTANTANEOUS RATE OF CHANGE - THE DERIVATIVE
Example 3.1: At 1:00:00 pm a car is 100 miles away. The table shown on the right shows how far away the caris at various times, t. For each value of t, find the averagespeed of the car between 1:00:00 pm and the time t. Enter the average speed in the designated column. Whichspeed is most likely to be the exact speed at exactly1:00:00 pm? Why?
Solution:In the hour between 1:00:00 and 2:00:00 pm the cartraveled 155 - 100 = 55 miles. So the average speed was55 miles per hour.In the 20 minutes between 1:00:00 and 1:20:00 pm thecar traveled 19 miles. Since 20 minutes is 20/60 = 1/3hour, the average speed is mph.19 3
113
19 57= =( )A similar calculation for the next entry produces 60 mph.In the 1 second between 1:00:00 and 1:00:01 pm the cartraveled 0.02 miles. Since 1 second = hour,1
60160
13600=
the average speed is mph.0 021 3600 0 02 3600 72.
/ . ( )= =The results appear in the table on the right.
Timet
Distance(miles)
AverageSpeed
2:00:00 pm 155.00
1:20:00 pm 119.00
1:01:00 pm 101.00
1:00:01 pm 100.02
Timet
Distance(miles)
AverageSpeed
2:00:00 pm 155.00 55 mph
1:20:00 pm 119.00 57 mph
1:01:00 pm 101.00 60 mph
1:00:01 pm 100.02 72 mph
In the course of an hour the car could easily have sped up and slowed down at various times. Sothere is really no reason to think that 55 mph should give any indication of the speed of the car atexactly 1:00:00 pm. Even in the course of one minute the driver might have applied the brakeswhile slowing down from a much higher speed than 60 mph or might have been acceleratingfrom a much lower speed. The 72 mph is most likely to indicate the speed since the car has theleast chance of changing speed in the course of one second. And if there were informationindicating how much further the car had traveled in 0.01 seconds, the resulting average speedwould be expected to be even closer to the exact speed at exactly 1:00 pm. This thought issummarized by the following basic principle.
Basic Principle: The shorter the interval, the more accurately the average rate of changewill reflect the exact rate of change.
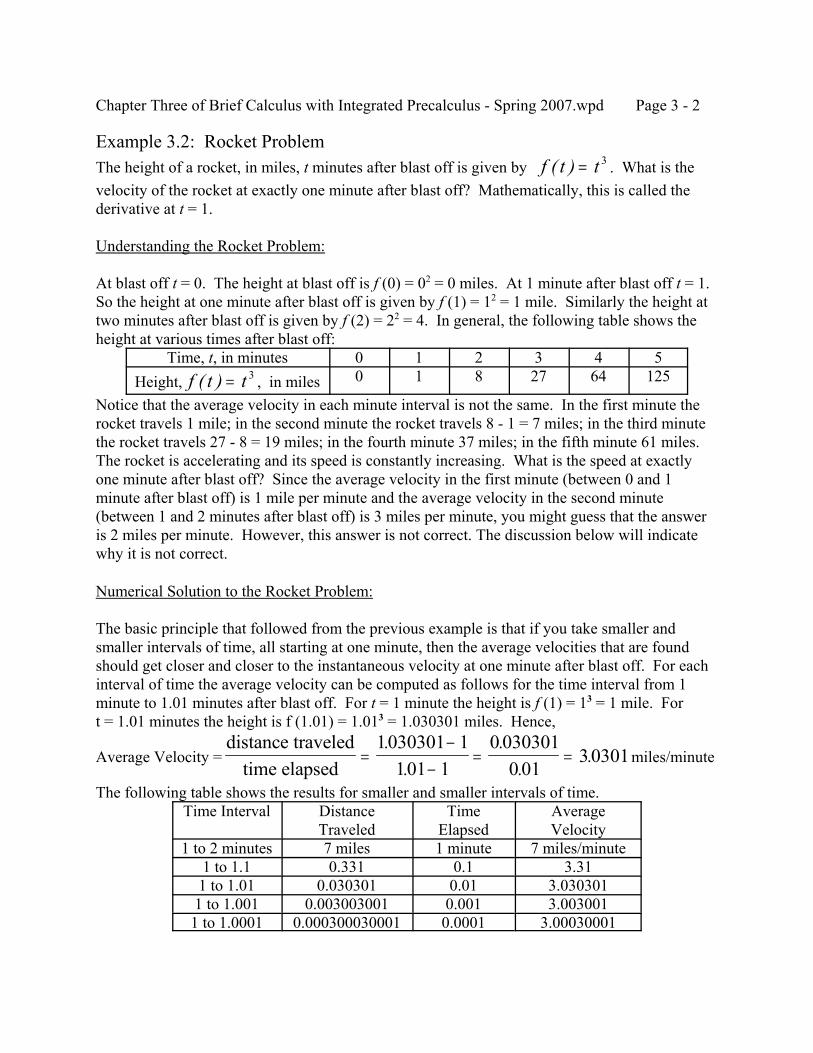
Chapter Three of Brief Calculus with Integrated Precalculus - Spring 2007.wpd Page 3 - 2
Example 3.2: Rocket ProblemThe height of a rocket, in miles, t minutes after blast off is given by . What is thef t t( ) = 3
velocity of the rocket at exactly one minute after blast off? Mathematically, this is called thederivative at t = 1.
Understanding the Rocket Problem:
At blast off t = 0. The height at blast off is f (0) = 02 = 0 miles. At 1 minute after blast off t = 1. So the height at one minute after blast off is given by f (1) = 12 = 1 mile. Similarly the height attwo minutes after blast off is given by f (2) = 22 = 4. In general, the following table shows theheight at various times after blast off:
Time, t, in minutes 0 1 2 3 4 5Height, , in milesf t t( ) = 3 0 1 8 27 64 125
Notice that the average velocity in each minute interval is not the same. In the first minute therocket travels 1 mile; in the second minute the rocket travels 8 - 1 = 7 miles; in the third minutethe rocket travels 27 - 8 = 19 miles; in the fourth minute 37 miles; in the fifth minute 61 miles. The rocket is accelerating and its speed is constantly increasing. What is the speed at exactlyone minute after blast off? Since the average velocity in the first minute (between 0 and 1minute after blast off) is 1 mile per minute and the average velocity in the second minute(between 1 and 2 minutes after blast off) is 3 miles per minute, you might guess that the answeris 2 miles per minute. However, this answer is not correct. The discussion below will indicatewhy it is not correct.
Numerical Solution to the Rocket Problem:
The basic principle that followed from the previous example is that if you take smaller andsmaller intervals of time, all starting at one minute, then the average velocities that are foundshould get closer and closer to the instantaneous velocity at one minute after blast off. For eachinterval of time the average velocity can be computed as follows for the time interval from 1minute to 1.01 minutes after blast off. For t = 1 minute the height is f (1) = 13 = 1 mile. Fort = 1.01 minutes the height is f (1.01) = 1.013 = 1.030301 miles. Hence,
Average Velocity = miles/minutedistance traveled
time elapsed=
−−
= =1030301 1
101 10 030301
0 0130301
..
..
.
The following table shows the results for smaller and smaller intervals of time.Time Interval Distance
TraveledTime
ElapsedAverageVelocity
1 to 2 minutes 7 miles 1 minute 7 miles/minute1 to 1.1 0.331 0.1 3.311 to 1.01 0.030301 0.01 3.0303011 to 1.001 0.003003001 0.001 3.0030011 to 1.0001 0.000300030001 0.0001 3.00030001
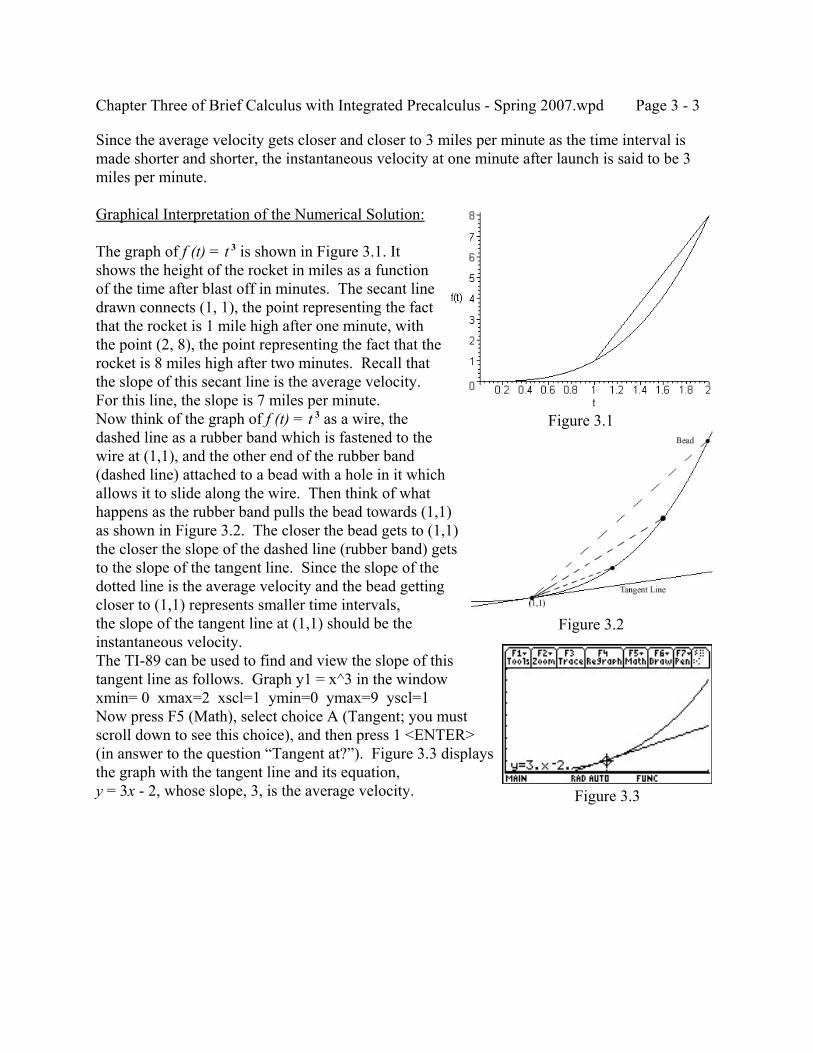
Chapter Three of Brief Calculus with Integrated Precalculus - Spring 2007.wpd Page 3 - 3
Figure 3.2
Figure 3.1
Figure 3.3
Since the average velocity gets closer and closer to 3 miles per minute as the time interval ismade shorter and shorter, the instantaneous velocity at one minute after launch is said to be 3miles per minute.
Graphical Interpretation of the Numerical Solution:
The graph of f (t) = t 3 is shown in Figure 3.1. Itshows the height of the rocket in miles as a functionof the time after blast off in minutes. The secant linedrawn connects (1, 1), the point representing the factthat the rocket is 1 mile high after one minute, withthe point (2, 8), the point representing the fact that therocket is 8 miles high after two minutes. Recall thatthe slope of this secant line is the average velocity. For this line, the slope is 7 miles per minute.Now think of the graph of f (t) = t 3 as a wire, thedashed line as a rubber band which is fastened to thewire at (1,1), and the other end of the rubber band(dashed line) attached to a bead with a hole in it whichallows it to slide along the wire. Then think of whathappens as the rubber band pulls the bead towards (1,1)as shown in Figure 3.2. The closer the bead gets to (1,1)the closer the slope of the dashed line (rubber band) getsto the slope of the tangent line. Since the slope of thedotted line is the average velocity and the bead gettingcloser to (1,1) represents smaller time intervals,the slope of the tangent line at (1,1) should be theinstantaneous velocity.The TI-89 can be used to find and view the slope of thistangent line as follows. Graph y1 = x^3 in the windowxmin= 0 xmax=2 xscl=1 ymin=0 ymax=9 yscl=1Now press F5 (Math), select choice A (Tangent; you mustscroll down to see this choice), and then press 1 <ENTER>(in answer to the question “Tangent at?”). Figure 3.3 displaysthe graph with the tangent line and its equation,y = 3x - 2, whose slope, 3, is the average velocity.
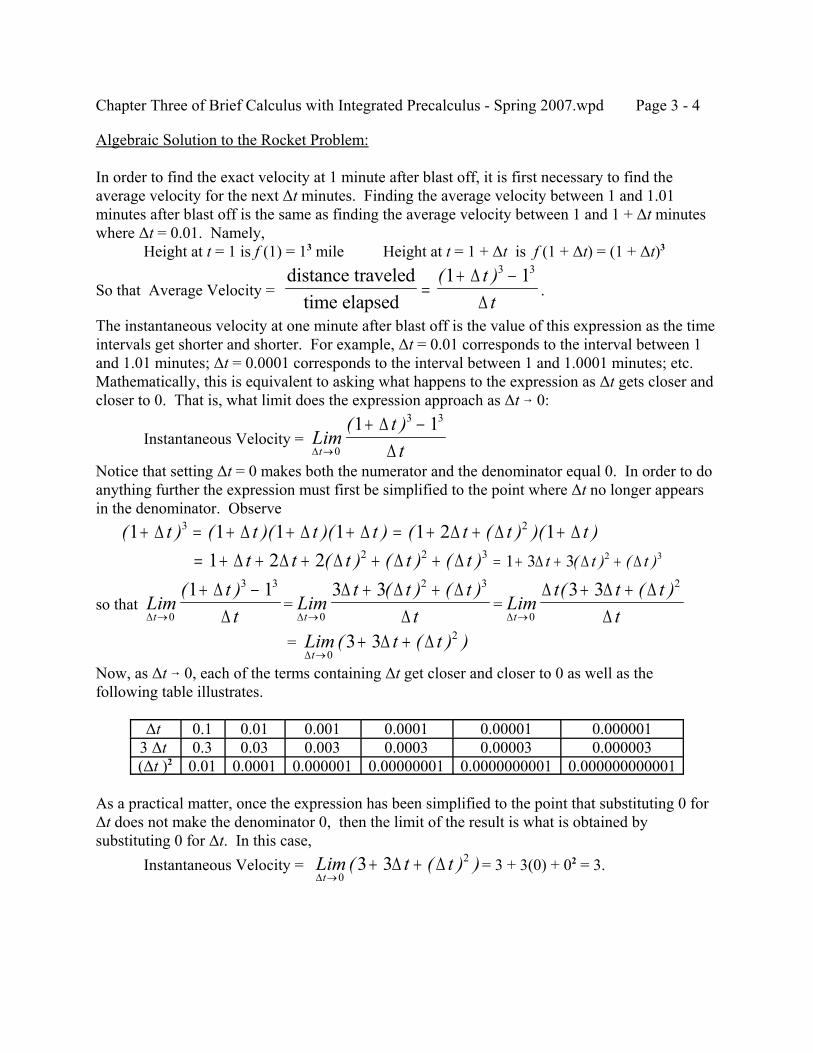
Chapter Three of Brief Calculus with Integrated Precalculus - Spring 2007.wpd Page 3 - 4
Algebraic Solution to the Rocket Problem:
In order to find the exact velocity at 1 minute after blast off, it is first necessary to find theaverage velocity for the next ∆t minutes. Finding the average velocity between 1 and 1.01minutes after blast off is the same as finding the average velocity between 1 and 1 + ∆t minuteswhere ∆t = 0.01. Namely,
Height at t = 1 is f (1) = 13 mile Height at t = 1 + ∆t is f (1 + ∆t) = (1 + ∆t)3
So that Average Velocity = .distance traveled
time elapsed=
+ −( )1 13 3∆∆tt
The instantaneous velocity at one minute after blast off is the value of this expression as the timeintervals get shorter and shorter. For example, ∆t = 0.01 corresponds to the interval between 1and 1.01 minutes; ∆t = 0.0001 corresponds to the interval between 1 and 1.0001 minutes; etc. Mathematically, this is equivalent to asking what happens to the expression as ∆t gets closer andcloser to 0. That is, what limit does the expression approach as ∆t 6 0:
Instantaneous Velocity = Limttt∆
∆∆→
+ −0
3 31 1( )
Notice that setting ∆t = 0 makes both the numerator and the denominator equal 0. In order to doanything further the expression must first be simplified to the point where ∆t no longer appearsin the denominator. Observe ( ) ( )( )( )1 1 1 13+ = + + +∆ ∆ ∆ ∆t t t t = + + +( ( ) )( )1 2 12∆ ∆ ∆t t t
= + + + + +1 2 2 2 2 3∆ ∆ ∆ ∆ ∆t t t t t( ) ( ) ( ) = + + +1 3 3 2 3∆ ∆ ∆t t t( ) ( )
so that = =Limttt∆
∆∆→
+ −0
3 31 1( )Lim
t t ttt∆
∆ ∆ ∆∆→
+ +0
2 33 3( ) ( )Lim
t t ttt∆
∆ ∆ ∆∆→
+ +0
23 3( ( )
= Lim t tt∆
∆ ∆→
+ +0
23 3( ( ) )Now, as ∆t 6 0, each of the terms containing ∆t get closer and closer to 0 as well as thefollowing table illustrates.
∆t 0.1 0.01 0.001 0.0001 0.00001 0.0000013 ∆t 0.3 0.03 0.003 0.0003 0.00003 0.000003(∆t )2 0.01 0.0001 0.000001 0.00000001 0.0000000001 0.000000000001
As a practical matter, once the expression has been simplified to the point that substituting 0 for∆t does not make the denominator 0, then the limit of the result is what is obtained bysubstituting 0 for ∆t. In this case,
Instantaneous Velocity = = 3 + 3(0) + 02 = 3.Lim t tt∆
∆ ∆→
+ +0
23 3( ( ) )
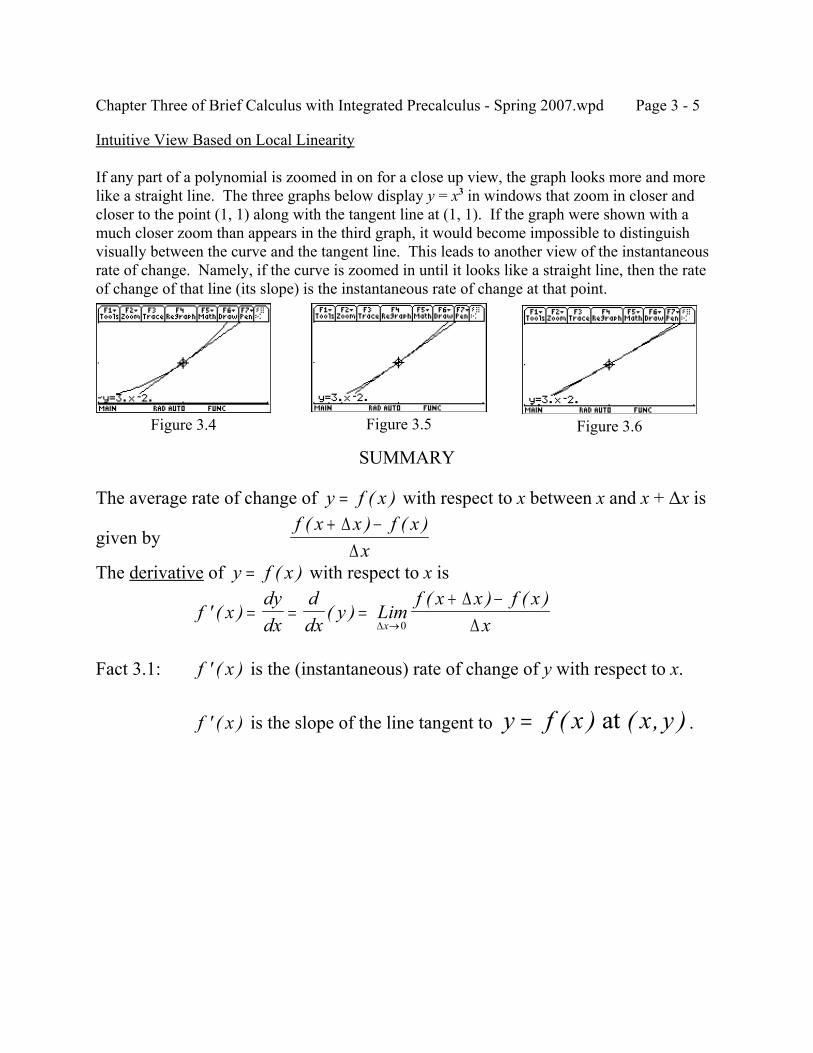
Chapter Three of Brief Calculus with Integrated Precalculus - Spring 2007.wpd Page 3 - 5
Figure 3.4 Figure 3.5 Figure 3.6
Intuitive View Based on Local Linearity
If any part of a polynomial is zoomed in on for a close up view, the graph looks more and morelike a straight line. The three graphs below display y = x3 in windows that zoom in closer andcloser to the point (1, 1) along with the tangent line at (1, 1). If the graph were shown with amuch closer zoom than appears in the third graph, it would become impossible to distinguishvisually between the curve and the tangent line. This leads to another view of the instantaneousrate of change. Namely, if the curve is zoomed in until it looks like a straight line, then the rateof change of that line (its slope) is the instantaneous rate of change at that point.
SUMMARY
The average rate of change of with respect to x between x and x + ∆x isy f x= ( )
given byf x x f x
x( ) ( )+ −∆
∆The derivative of with respect to x isy f x= ( )
f xdydx
ddx
y' ( ) ( )= = = Limf x x f x
xx∆
∆∆→
+ −0
( ) ( )
Fact 3.1: is the (instantaneous) rate of change of y with respect to x.f x' ( )
is the slope of the line tangent to .f x' ( ) y f x x y= ( ) ( , ) at
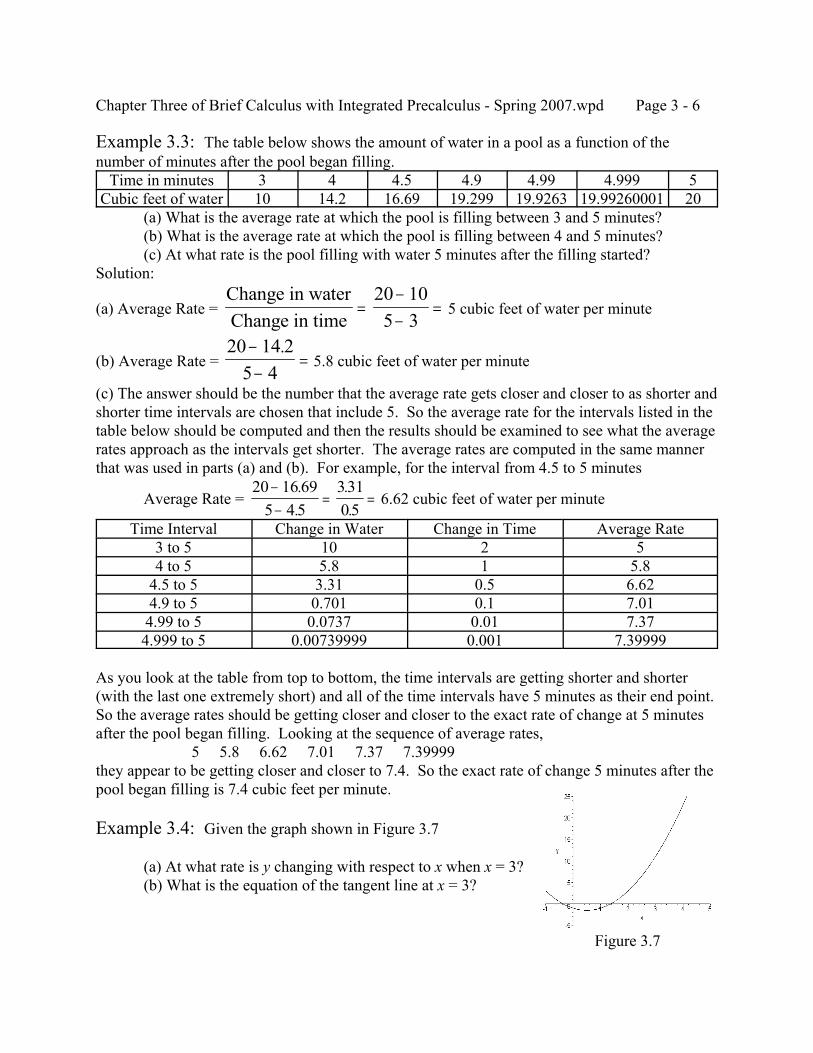
Chapter Three of Brief Calculus with Integrated Precalculus - Spring 2007.wpd Page 3 - 6
Figure 3.7
Example 3.3: The table below shows the amount of water in a pool as a function of thenumber of minutes after the pool began filling.
Time in minutes 3 4 4.5 4.9 4.99 4.999 5Cubic feet of water 10 14.2 16.69 19.299 19.9263 19.99260001 20
(a) What is the average rate at which the pool is filling between 3 and 5 minutes?(b) What is the average rate at which the pool is filling between 4 and 5 minutes?(c) At what rate is the pool filling with water 5 minutes after the filling started?
Solution:
(a) Average Rate = 5 cubic feet of water per minuteChange in waterChange in time
=−−
=20 105 3
(b) Average Rate = 5.8 cubic feet of water per minute20 14 2
5 4−−
=.
(c) The answer should be the number that the average rate gets closer and closer to as shorter andshorter time intervals are chosen that include 5. So the average rate for the intervals listed in thetable below should be computed and then the results should be examined to see what the averagerates approach as the intervals get shorter. The average rates are computed in the same mannerthat was used in parts (a) and (b). For example, for the interval from 4.5 to 5 minutes
Average Rate = 6.62 cubic feet of water per minute20 16 69
5 4 533105
−−
= =..
..
Time Interval Change in Water Change in Time Average Rate3 to 5 10 2 54 to 5 5.8 1 5.8
4.5 to 5 3.31 0.5 6.624.9 to 5 0.701 0.1 7.014.99 to 5 0.0737 0.01 7.374.999 to 5 0.00739999 0.001 7.39999
As you look at the table from top to bottom, the time intervals are getting shorter and shorter(with the last one extremely short) and all of the time intervals have 5 minutes as their end point. So the average rates should be getting closer and closer to the exact rate of change at 5 minutesafter the pool began filling. Looking at the sequence of average rates,
5 5.8 6.62 7.01 7.37 7.39999they appear to be getting closer and closer to 7.4. So the exact rate of change 5 minutes after thepool began filling is 7.4 cubic feet per minute.
Example 3.4: Given the graph shown in Figure 3.7
(a) At what rate is y changing with respect to x when x = 3?(b) What is the equation of the tangent line at x = 3?
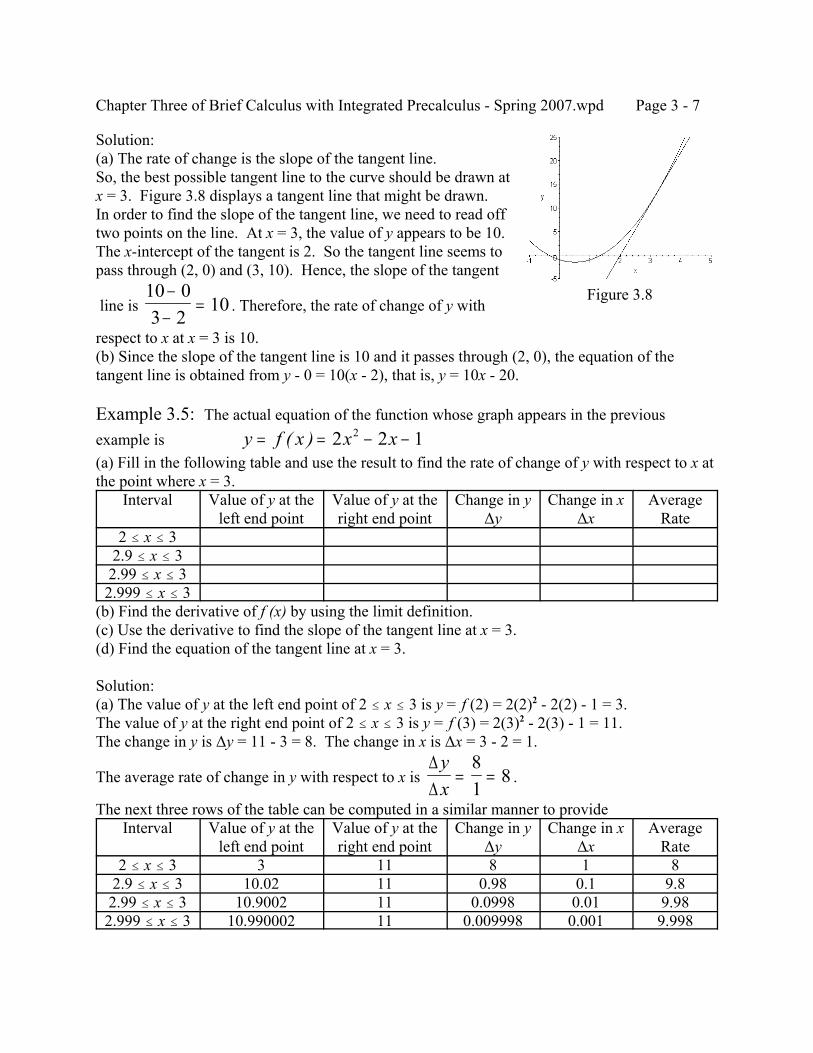
Chapter Three of Brief Calculus with Integrated Precalculus - Spring 2007.wpd Page 3 - 7
Figure 3.8
Solution:(a) The rate of change is the slope of the tangent line.So, the best possible tangent line to the curve should be drawn atx = 3. Figure 3.8 displays a tangent line that might be drawn.In order to find the slope of the tangent line, we need to read offtwo points on the line. At x = 3, the value of y appears to be 10. The x-intercept of the tangent is 2. So the tangent line seems topass through (2, 0) and (3, 10). Hence, the slope of the tangent
line is . Therefore, the rate of change of y with10 03 2
10−−
=
respect to x at x = 3 is 10.(b) Since the slope of the tangent line is 10 and it passes through (2, 0), the equation of thetangent line is obtained from y - 0 = 10(x - 2), that is, y = 10x - 20.
Example 3.5: The actual equation of the function whose graph appears in the previousexample is y f x x x= = − −( ) 2 2 12
(a) Fill in the following table and use the result to find the rate of change of y with respect to x atthe point where x = 3.
Interval Value of y at theleft end point
Value of y at theright end point
Change in y∆y
Change in x∆x
AverageRate
2 # x # 32.9 # x # 32.99 # x # 32.999 # x # 3
(b) Find the derivative of f (x) by using the limit definition.(c) Use the derivative to find the slope of the tangent line at x = 3.(d) Find the equation of the tangent line at x = 3.
Solution:(a) The value of y at the left end point of 2 # x # 3 is y = f (2) = 2(2)2 - 2(2) - 1 = 3.The value of y at the right end point of 2 # x # 3 is y = f (3) = 2(3)2 - 2(3) - 1 = 11.The change in y is ∆y = 11 - 3 = 8. The change in x is ∆x = 3 - 2 = 1.
The average rate of change in y with respect to x is .∆∆
yx= =
81
8
The next three rows of the table can be computed in a similar manner to provideInterval Value of y at the
left end pointValue of y at theright end point
Change in y∆y
Change in x∆x
AverageRate
2 # x # 3 3 11 8 1 82.9 # x # 3 10.02 11 0.98 0.1 9.82.99 # x # 3 10.9002 11 0.0998 0.01 9.982.999 # x # 3 10.990002 11 0.009998 0.001 9.998
Chapter Three of Brief Calculus with Integrated Precalculus - Spring 2007.wpd Page 3 - 8
Since the average rate is getting closer and closer to 10 as the interval gets smaller and smaller,the rate of change at x = 3 should be 10.
(b) The limit definition of the derivative is f x Limf x x f x
xx' ( )
( ) ( )=
+ −→∆
∆∆0
Using f ( ) = 2( )2 - 2( ) - 1, it follows that = f x x x x x x( ) ( ) ( )+ = + − + −∆ ∆ ∆2 2 12 2 4 2 2 2 12 2x x x x x+ + − − −∆ ∆ ∆( )
Hence, f x Limx x x x x x x
xx' ( )
( ( ) ) ( )=
+ + − − − − − −→∆
∆ ∆ ∆∆0
2 2 22 4 2 2 2 1 2 2 1
= Limx x x x
xLim
x x xxx x∆ ∆
∆ ∆ ∆∆
∆ ∆∆→ →
+ −=
+ −0
2
0
4 2 2 4 2 2( ) ( )
= Lim x xx∆
∆→
+ −0
4 2 2( )Since ∆x is no longer in the denominator, this limit is the result that is obtained by replacing ∆xby 0. Hence, the derivative is .f x x' ( ) = −4 2(c) The derivative is the slope of the tangent. So at x = 3 the slope of the tangent is
f N(3) = 4(3) - 2 = 10.(d) The slope of the tangent line at x = 3 is 10. In order to find the equation, a point that thetangent line passes through is needed. We know that at x = 3 the value of y is 11 and the tangentline passes therefore passes through (3, 11). Hence, y - 11 = 10(x - 3) so that y = 10x - 19.
Note: The answers obtained in the last example are exact. The answers obtained in the examplebefore that are usually only close to the correct answer since two inaccuracies usuallyoccur: the value of y at the point of tangency is often not read off correctly and drawingthe tangent line itself is usually not perfect.
Example 3.6: The profit in dollars that results from selling x widgets is given byP = for 0 # x # 8.f x x x( ) = − −2 4 8
(a) Find the average rate of change in profit that results from increasing production from 1 widget to 6 widgets.(b) Graph f (x) by hand and draw the line on the graph whose slope represents the average rate of change. Then find the equation of the line found.(c) Draw the line on the graph that represents the instantaneous rate of change in profit when 3 widgets are produced. Estimate the slope of the line and then find its equation.(d) On the calculator, graph f (x) and find the exact equation of the line referred to in part (c).(e) What does part (d) tell you the derivative at x = 3, f N(3), is equal to?
(f) Find .f x x f x
x( ) ( )+ −∆
∆(g) Use the result of part (f) to find the derivative, f N(x).(h) Find the derivative of f (x) at x = 3, f N(3), by using the result of part (g). Compare this with part (e).
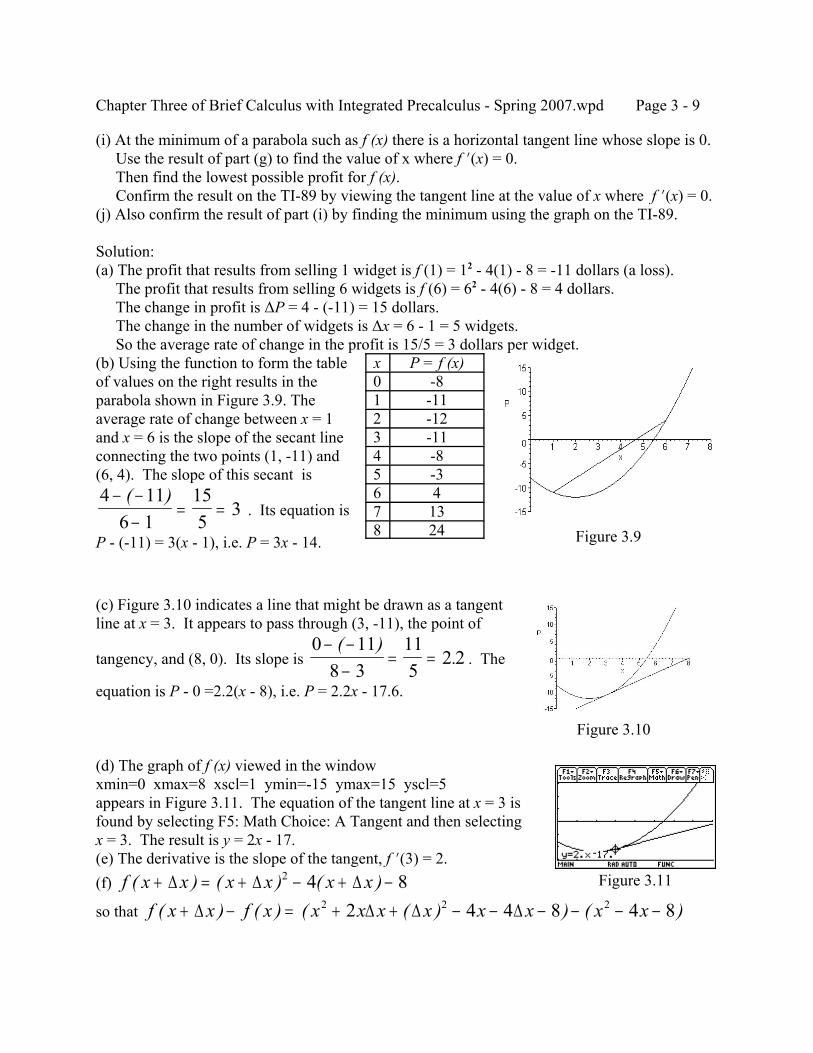
Chapter Three of Brief Calculus with Integrated Precalculus - Spring 2007.wpd Page 3 - 9
Figure 3.9
Figure 3.10
Figure 3.11
(i) At the minimum of a parabola such as f (x) there is a horizontal tangent line whose slope is 0. Use the result of part (g) to find the value of x where f N(x) = 0. Then find the lowest possible profit for f (x). Confirm the result on the TI-89 by viewing the tangent line at the value of x where f N(x) = 0.(j) Also confirm the result of part (i) by finding the minimum using the graph on the TI-89.
Solution:(a) The profit that results from selling 1 widget is f (1) = 12 - 4(1) - 8 = -11 dollars (a loss). The profit that results from selling 6 widgets is f (6) = 62 - 4(6) - 8 = 4 dollars. The change in profit is ∆P = 4 - (-11) = 15 dollars. The change in the number of widgets is ∆x = 6 - 1 = 5 widgets. So the average rate of change in the profit is 15/5 = 3 dollars per widget.(b) Using the function to form the tableof values on the right results in theparabola shown in Figure 3.9. Theaverage rate of change between x = 1and x = 6 is the slope of the secant lineconnecting the two points (1, -11) and(6, 4). The slope of this secant is
. Its equation is4 11
6 1155
3− −
−= =
( )
P - (-11) = 3(x - 1), i.e. P = 3x - 14.
x P = f (x)0 -81 -112 -123 -114 -85 -36 47 138 24
(c) Figure 3.10 indicates a line that might be drawn as a tangentline at x = 3. It appears to pass through (3, -11), the point of
tangency, and (8, 0). Its slope is . The0 11
8 3115
2 2− −
−= =
( ).
equation is P - 0 =2.2(x - 8), i.e. P = 2.2x - 17.6.
(d) The graph of f (x) viewed in the windowxmin=0 xmax=8 xscl=1 ymin=-15 ymax=15 yscl=5appears in Figure 3.11. The equation of the tangent line at x = 3 isfound by selecting F5: Math Choice: A Tangent and then selectingx = 3. The result is y = 2x - 17.(e) The derivative is the slope of the tangent, f N(3) = 2.(f) f x x x x x x( ) ( ) ( )+ = + − + −∆ ∆ ∆2 4 8so that f x x f x( ) ( )+ − =∆ ( ( ) ) ( )x x x x x x x x2 2 22 4 4 8 4 8+ + − − − − − −∆ ∆ ∆
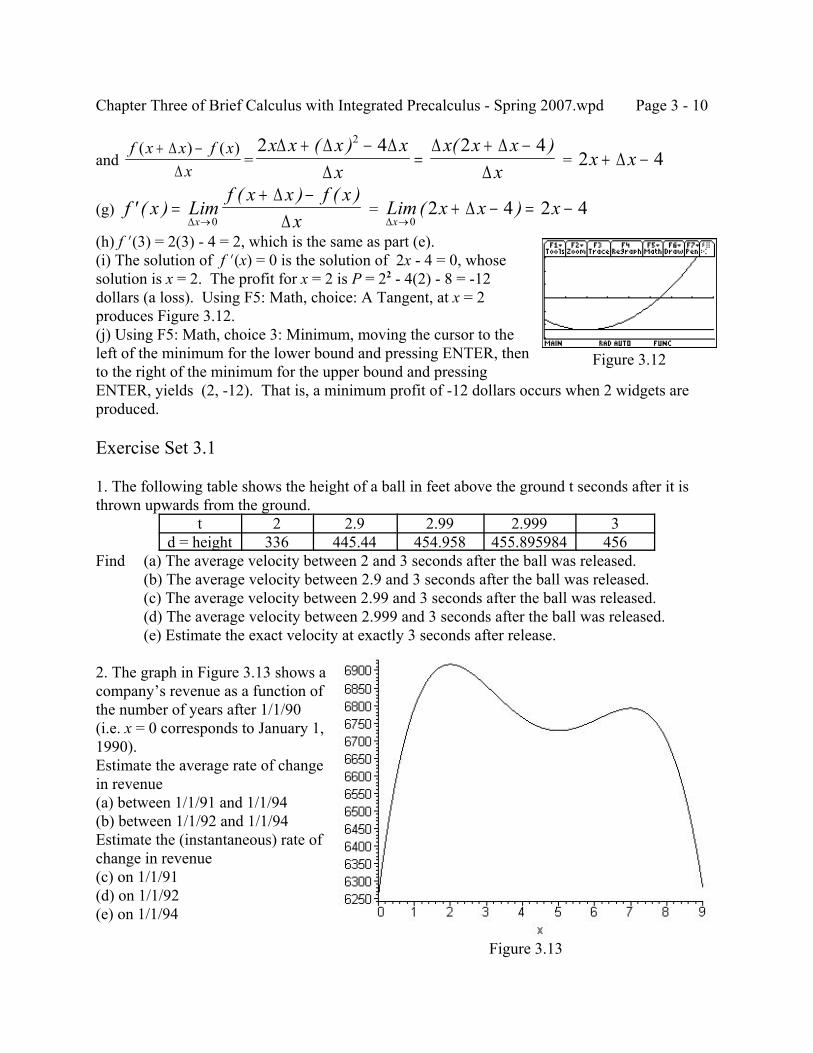
Chapter Three of Brief Calculus with Integrated Precalculus - Spring 2007.wpd Page 3 - 10
Figure 3.13
Figure 3.12
and = = f x x f x
x( ) ( )+ −∆
∆
2 4 2 42x x x xx
x x xx
∆ ∆ ∆∆
∆ ∆∆
+ −=
+ −( ) ( )2 4x x+ −∆
(g) = f x Limf x x f x
xx' ( )
( ) ( )=
+ −→∆
∆∆0
Lim x x xx∆
∆→
+ − = −0
2 4 2 4( )
(h) f N(3) = 2(3) - 4 = 2, which is the same as part (e).(i) The solution of f N(x) = 0 is the solution of 2x - 4 = 0, whosesolution is x = 2. The profit for x = 2 is P = 22 - 4(2) - 8 = -12dollars (a loss). Using F5: Math, choice: A Tangent, at x = 2produces Figure 3.12.(j) Using F5: Math, choice 3: Minimum, moving the cursor to theleft of the minimum for the lower bound and pressing ENTER, thento the right of the minimum for the upper bound and pressingENTER, yields (2, -12). That is, a minimum profit of -12 dollars occurs when 2 widgets areproduced.
Exercise Set 3.1
1. The following table shows the height of a ball in feet above the ground t seconds after it isthrown upwards from the ground.
t 2 2.9 2.99 2.999 3d = height 336 445.44 454.958 455.895984 456
Find (a) The average velocity between 2 and 3 seconds after the ball was released.(b) The average velocity between 2.9 and 3 seconds after the ball was released.(c) The average velocity between 2.99 and 3 seconds after the ball was released.(d) The average velocity between 2.999 and 3 seconds after the ball was released.(e) Estimate the exact velocity at exactly 3 seconds after release.
2. The graph in Figure 3.13 shows acompany’s revenue as a function ofthe number of years after 1/1/90(i.e. x = 0 corresponds to January 1,1990).Estimate the average rate of changein revenue(a) between 1/1/91 and 1/1/94(b) between 1/1/92 and 1/1/94Estimate the (instantaneous) rate ofchange in revenue(c) on 1/1/91(d) on 1/1/92(e) on 1/1/94
Chapter Three of Brief Calculus with Integrated Precalculus - Spring 2007.wpd Page 3 - 11
3. Repeat Example 3.6 using the function for 0 # x # 7.f x x x( ) = − −2 2 1
4. Repeat Example 3.6 using the function for 0 # x # 8.f x x x( ) = − −4 20 52
3.2 DERIVATIVE FORMULAS FOR POLYNOMIALS
In the previous section it was found that the derivative of f (x) = x3 was f N(x) = 3x2. Notice thatthis can be obtained by multiplying x by the exponent 3 and then reducing the exponent by one,that is, f N(x) = 3x3 - 1 = 3x2. It was also observed that the derivative of f (x) = 2x2 - 2x - 1 wasf N(x) = 4x - 2. Notice that if the formula mentioned (multiply by the exponent of x and reducethe exponent by one) were used on each of the three terms, then the derivative of the functionf (x) = 2x2 - 2x1 - 1x0 would be 2(2)x2 - 1 - 2(1)x1 - 1 - 1(0)x0 - 1 = 4x1 - 2x0 - 0x -1 = 4x - 2, thecorrect answer. While the formula works for -2x - 1, it is inconvenient to use it for those casessince that requires always first remembering that x has an exponent 1 and that 1 can be thoughtof as 1x0. Also, there is a far more basic reason why the derivative of -2x - 1 should be -2. Namely,y = -2x - 1 is a straight line whose constant rate of change is its slope, -2 (and the derivative isthe rate of change).
Notation: represents the derivative with respect to x of y = f (x),dydx
ddx
y= ( )
i.e. f N(x). is not the quotient of d times y divided by d times x. It shoulddydx
be viewed as consisting of two separate parts. One part is , whichddx
represents “the derivative with respect to x.” The other part is y, the functionfor which the derivative is being found.
Fact 3.2: If c is any constant then
for positive integers nddx
cx cnxn n= −1
andddx
cx c=
Chapter Three of Brief Calculus with Integrated Precalculus - Spring 2007.wpd Page 3 - 12
ddx
c = 0
Fact 3.3: The derivative of the sum of two functions is the sum of thederivatives of the functions, that is
ddx
f x g xddx
f xddx
g x( ( ) ( )) ( ( )) ( ( ))+ = +
Example 3.7: Illustrate the basic ideas contained in the formulas shown above by proving
that follows from the limit definition of the derivativeddx
ax bx c ax b( )2 2+ + = +
where a, b and c are constants.
Solution: The limit definition of the derivative of y = f (x) is
f x Limf x x f x
xx' ( )
( ) ( )=
+ −→∆
∆∆0
If , then .f x ax bx c( ) = + +2 f x x a x x b x x c( ) ( ) ( )+ = + + + +∆ ∆ ∆2
So f x x f x( ) ( )+ − =∆ ( ( ) ) ( )ax ax x a x bx b x c ax bx c2 2 22+ + + + + − + +∆ ∆ ∆ = .2 2ax x a x b x∆ ∆ ∆+ +( ) )
Hence, .f x Limx ax a x b
xLim ax a x b ax b
x x' ( )
( )( )=
+ += + + = +
→ →∆ ∆
∆ ∆∆
∆0 0
22 2
Example 3.8:
8x5 = 8(5)x5 - 1 = 40x4ddx
7x3 = 7(3)x3 - 1 = 21x2ddx
9x = 9ddx
5 = 0ddx
(8x5 - 7x3 + 9x - 5) = 8x5 - 7x3 + 9x - 5 = 40x4 - 21x2 + 9ddx
ddx
ddx
ddx
ddx
Chapter Three of Brief Calculus with Integrated Precalculus - Spring 2007.wpd Page 3 - 13
Example 3.9: Find the derivative.
(a) f (x) = 15x4 + x3 - 8x + 3 (b) g(s) = 3s8 - 9s2 + 7s (c) h(t) = t5 + t2 - 11(d) y = 7x4 - 2x + 8 (e) s = 4t2 + 9t - 5
Solution:(a) f N(x) = 15(4)x3 + 3x2 - 8 + 0 = 60x3 + 3x2 - 8(b) gN(s) = 3(8)s7 - 9(2)s1 + 7 = 24s7 - 18s + 7(c) hN(t) = 5t4 + 2t - 0 = 5t4 + 2t
(d) dydx
x x= − + = −7 4 2 0 28 23 3( )
(e) dsdt
t t= + − = +4 2 9 0 8 9( )
Exercise Set 3.2
1. Prove the derivative of equals , where c is a constant, by usingf x cx( ) = 4 f x cx' ( ) = 4 3
the limit definition of the derivative. Rather than spend the time expanding (x + ∆x)4, you mayuse the formula , which is what is obtained if ( )a b a a b a b ab b+ = + + + +4 4 3 2 2 3 44 6 4(a + b)(a + b)(a + b)(a + b) is multiplied out.
2. Find the derivative by using the formulas.(a) f (x) = x4 (b) f (x) = x2 (c) f (x) = x(d) f (x) = 1 (e) y = 7x11 (f) y = 5x(g) y = 19 (h) f (x) = 4x5 - 8x (i) y = 9x2 + 3(j) g(s) = 7s3 - 6s2 + 2s - 5 (k) h(t) = 9t10 + 5t2 + 7 (l) s = 4t9 + t - 1
3.3 POLYNOMIAL EXTREMA
Recall that a polynomial whose highest power is 8 can turn at most 7 times (one less than 8) andthat in general a polynomial of degree n can turn at most n - 1 times. Finding the relativeextrema (turning points) of functions will be seen to be very important in economics, scienceand elsewhere. Therefore there are two important questions: how can you determine the relativeextrema of polynomials so that you can be sure to include them in your graph on the TI-89, andhow can you graph a polynomial without the aid of technology?
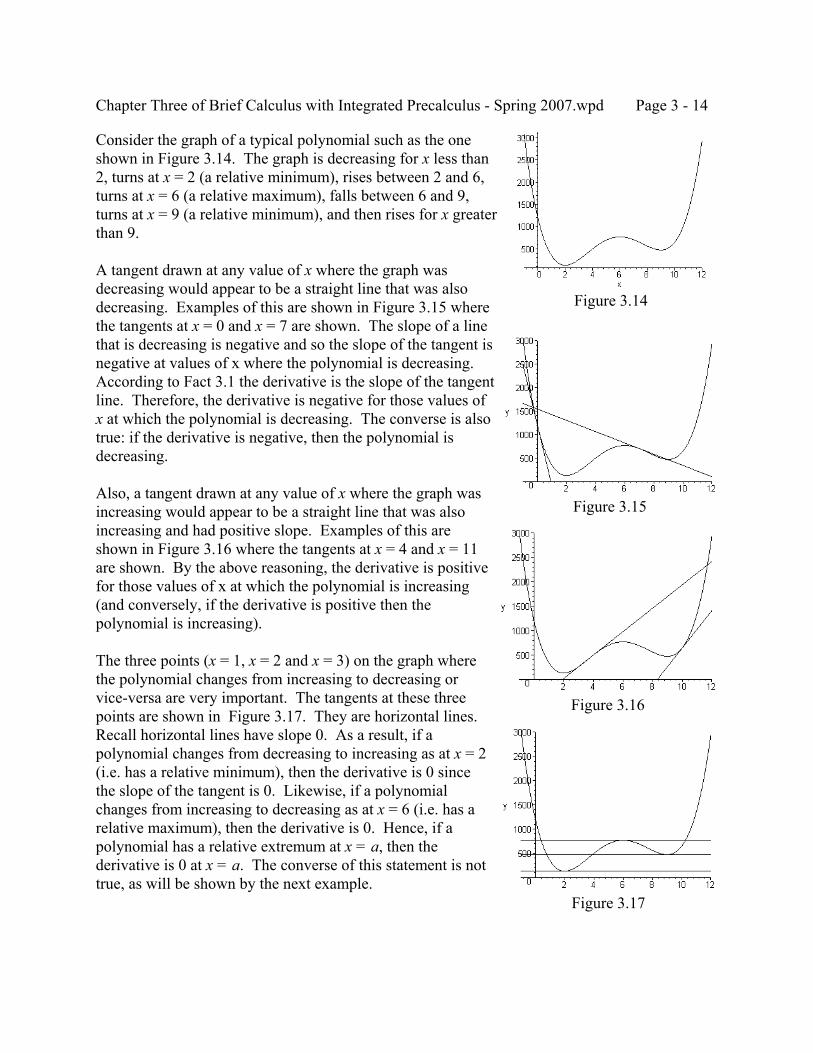
Chapter Three of Brief Calculus with Integrated Precalculus - Spring 2007.wpd Page 3 - 14
Figure 3.14
Figure 3.15
Figure 3.16
Figure 3.17
Consider the graph of a typical polynomial such as the oneshown in Figure 3.14. The graph is decreasing for x less than2, turns at x = 2 (a relative minimum), rises between 2 and 6,turns at x = 6 (a relative maximum), falls between 6 and 9,turns at x = 9 (a relative minimum), and then rises for x greaterthan 9.
A tangent drawn at any value of x where the graph wasdecreasing would appear to be a straight line that was alsodecreasing. Examples of this are shown in Figure 3.15 wherethe tangents at x = 0 and x = 7 are shown. The slope of a linethat is decreasing is negative and so the slope of the tangent isnegative at values of x where the polynomial is decreasing.According to Fact 3.1 the derivative is the slope of the tangentline. Therefore, the derivative is negative for those values ofx at which the polynomial is decreasing. The converse is alsotrue: if the derivative is negative, then the polynomial isdecreasing.
Also, a tangent drawn at any value of x where the graph wasincreasing would appear to be a straight line that was alsoincreasing and had positive slope. Examples of this areshown in Figure 3.16 where the tangents at x = 4 and x = 11are shown. By the above reasoning, the derivative is positivefor those values of x at which the polynomial is increasing(and conversely, if the derivative is positive then thepolynomial is increasing).
The three points (x = 1, x = 2 and x = 3) on the graph wherethe polynomial changes from increasing to decreasing orvice-versa are very important. The tangents at these threepoints are shown in Figure 3.17. They are horizontal lines. Recall horizontal lines have slope 0. As a result, if apolynomial changes from decreasing to increasing as at x = 2(i.e. has a relative minimum), then the derivative is 0 sincethe slope of the tangent is 0. Likewise, if a polynomialchanges from increasing to decreasing as at x = 6 (i.e. has arelative maximum), then the derivative is 0. Hence, if apolynomial has a relative extremum at x = a, then thederivative is 0 at x = a. The converse of this statement is nottrue, as will be shown by the next example.
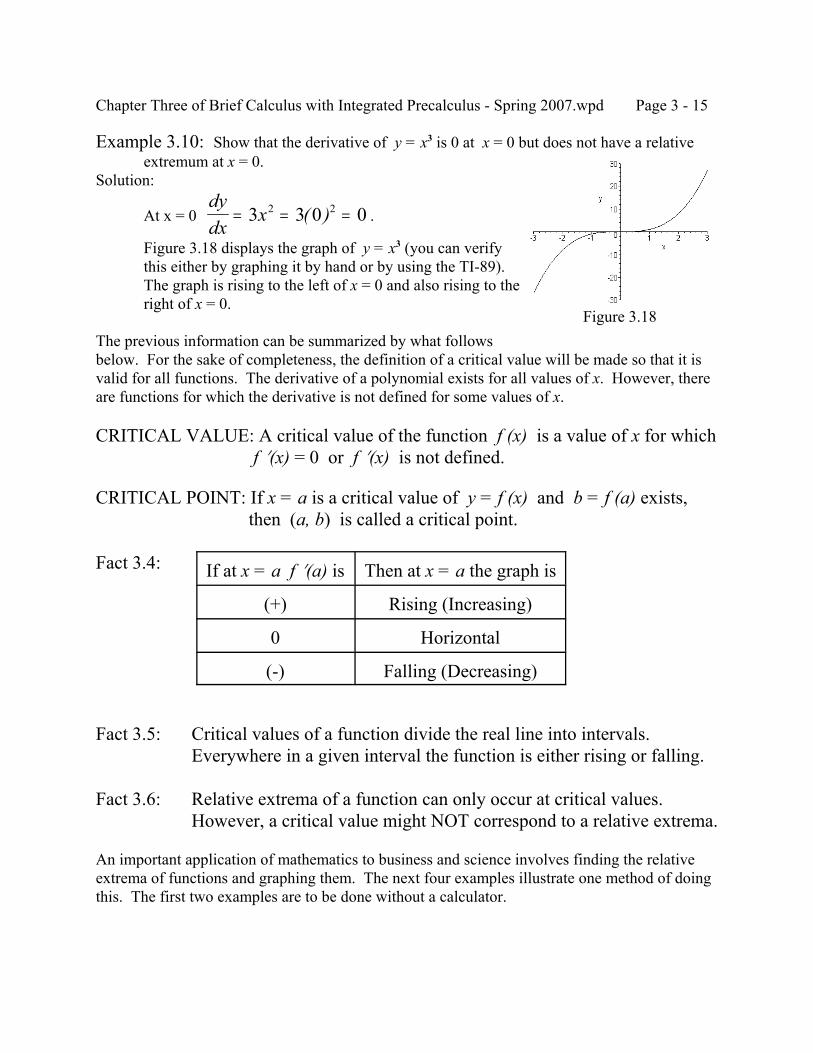
Chapter Three of Brief Calculus with Integrated Precalculus - Spring 2007.wpd Page 3 - 15
Figure 3.18
Example 3.10: Show that the derivative of y = x3 is 0 at x = 0 but does not have a relativeextremum at x = 0.
Solution:
At x = 0 .dydx
x= = =3 3 0 02 2( )
Figure 3.18 displays the graph of y = x3 (you can verifythis either by graphing it by hand or by using the TI-89).The graph is rising to the left of x = 0 and also rising to theright of x = 0.
The previous information can be summarized by what followsbelow. For the sake of completeness, the definition of a critical value will be made so that it isvalid for all functions. The derivative of a polynomial exists for all values of x. However, thereare functions for which the derivative is not defined for some values of x.
CRITICAL VALUE: A critical value of the function f (x) is a value of x for which f N(x) = 0 or f N(x) is not defined.
CRITICAL POINT: If x = a is a critical value of y = f (x) and b = f (a) exists, then (a, b) is called a critical point.
Fact 3.4: If at x = a f N(a) is Then at x = a the graph is
(+) Rising (Increasing)
0 Horizontal
(-) Falling (Decreasing)
Fact 3.5: Critical values of a function divide the real line into intervals.Everywhere in a given interval the function is either rising or falling.
Fact 3.6: Relative extrema of a function can only occur at critical values.However, a critical value might NOT correspond to a relative extrema.
An important application of mathematics to business and science involves finding the relativeextrema of functions and graphing them. The next four examples illustrate one method of doingthis. The first two examples are to be done without a calculator.
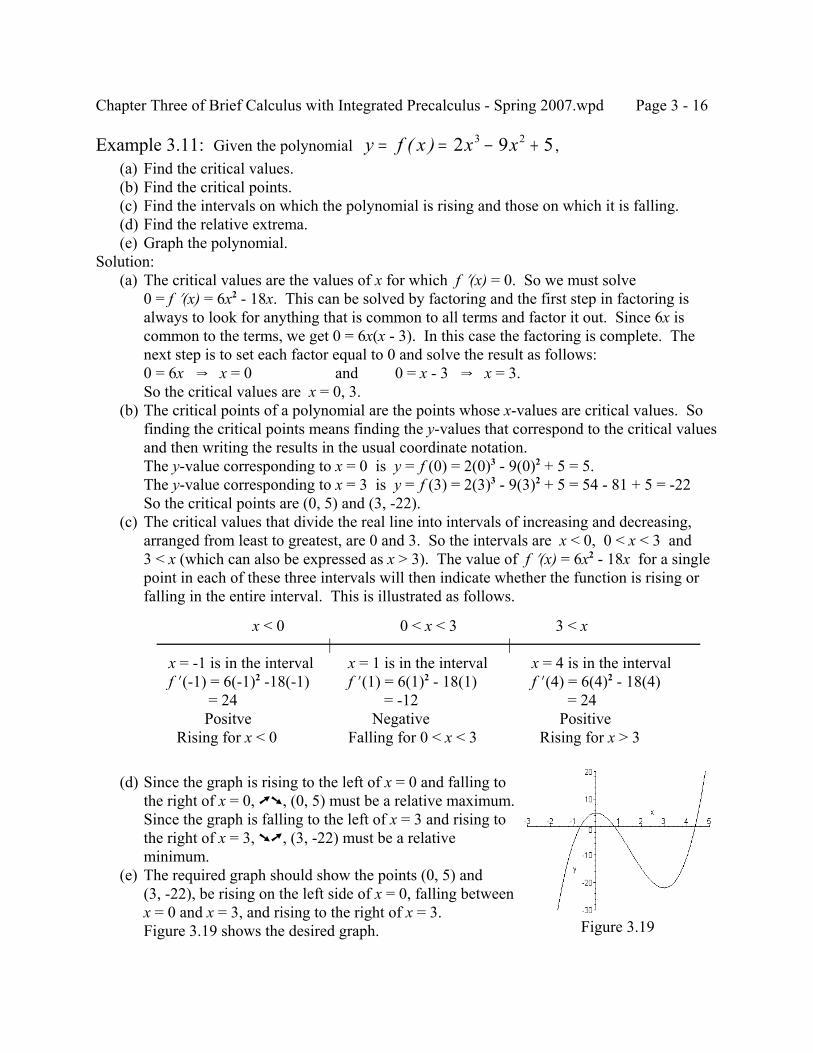
Chapter Three of Brief Calculus with Integrated Precalculus - Spring 2007.wpd Page 3 - 16
Figure 3.19
Example 3.11: Given the polynomial ,y f x x x= = − +( ) 2 9 53 2
(a) Find the critical values. (b) Find the critical points. (c) Find the intervals on which the polynomial is rising and those on which it is falling. (d) Find the relative extrema. (e) Graph the polynomial.Solution: (a) The critical values are the values of x for which f N(x) = 0. So we must solve
0 = f N(x) = 6x2 - 18x. This can be solved by factoring and the first step in factoring isalways to look for anything that is common to all terms and factor it out. Since 6x iscommon to the terms, we get 0 = 6x(x - 3). In this case the factoring is complete. Thenext step is to set each factor equal to 0 and solve the result as follows:0 = 6x Y x = 0 and 0 = x - 3 Y x = 3.So the critical values are x = 0, 3.
(b) The critical points of a polynomial are the points whose x-values are critical values. Sofinding the critical points means finding the y-values that correspond to the critical valuesand then writing the results in the usual coordinate notation.The y-value corresponding to x = 0 is y = f (0) = 2(0)3 - 9(0)2 + 5 = 5.The y-value corresponding to x = 3 is y = f (3) = 2(3)3 - 9(3)2 + 5 = 54 - 81 + 5 = -22So the critical points are (0, 5) and (3, -22).
(c) The critical values that divide the real line into intervals of increasing and decreasing,arranged from least to greatest, are 0 and 3. So the intervals are x < 0, 0 < x < 3 and3 < x (which can also be expressed as x > 3). The value of f N(x) = 6x2 - 18x for a singlepoint in each of these three intervals will then indicate whether the function is rising orfalling in the entire interval. This is illustrated as follows.
(d) Since the graph is rising to the left of x = 0 and falling tothe right of x = 0, üú, (0, 5) must be a relative maximum. Since the graph is falling to the left of x = 3 and rising tothe right of x = 3, úü, (3, -22) must be a relativeminimum.
(e) The required graph should show the points (0, 5) and(3, -22), be rising on the left side of x = 0, falling betweenx = 0 and x = 3, and rising to the right of x = 3.Figure 3.19 shows the desired graph.
x < 0 0 < x < 3 3 < x | |
x = -1 is in the interval x = 1 is in the interval x = 4 is in the interval f N(-1) = 6(-1)2 -18(-1) f N(1) = 6(1)2 - 18(1) f N(4) = 6(4)2 - 18(4)
= 24 = -12 = 24Positve Negative Positive
Rising for x < 0 Falling for 0 < x < 3 Rising for x > 3
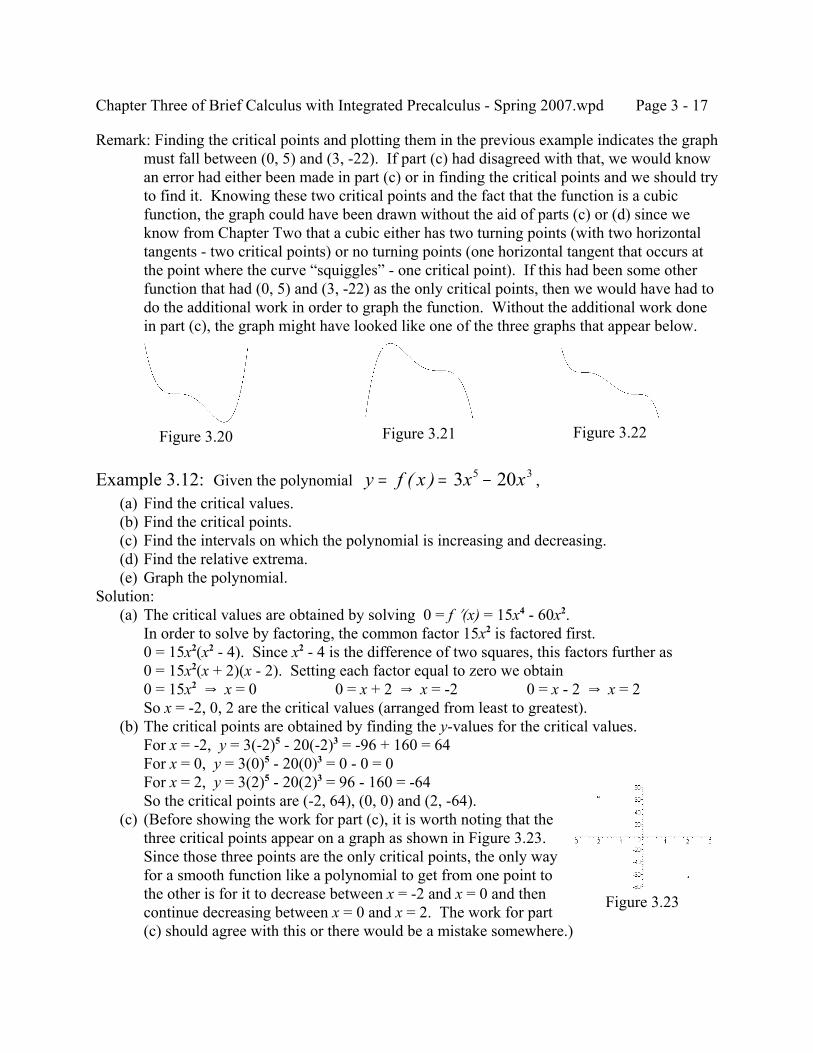
Chapter Three of Brief Calculus with Integrated Precalculus - Spring 2007.wpd Page 3 - 17
Figure 3.20 Figure 3.21 Figure 3.22
Figure 3.23
Remark: Finding the critical points and plotting them in the previous example indicates the graphmust fall between (0, 5) and (3, -22). If part (c) had disagreed with that, we would knowan error had either been made in part (c) or in finding the critical points and we should tryto find it. Knowing these two critical points and the fact that the function is a cubicfunction, the graph could have been drawn without the aid of parts (c) or (d) since weknow from Chapter Two that a cubic either has two turning points (with two horizontaltangents - two critical points) or no turning points (one horizontal tangent that occurs atthe point where the curve “squiggles” - one critical point). If this had been some otherfunction that had (0, 5) and (3, -22) as the only critical points, then we would have had todo the additional work in order to graph the function. Without the additional work donein part (c), the graph might have looked like one of the three graphs that appear below.
Example 3.12: Given the polynomial ,y f x x x= = −( ) 3 205 3
(a) Find the critical values. (b) Find the critical points. (c) Find the intervals on which the polynomial is increasing and decreasing. (d) Find the relative extrema. (e) Graph the polynomial.Solution: (a) The critical values are obtained by solving 0 = f N(x) = 15x4 - 60x2.
In order to solve by factoring, the common factor 15x2 is factored first.0 = 15x2(x2 - 4). Since x2 - 4 is the difference of two squares, this factors further as0 = 15x2(x + 2)(x - 2). Setting each factor equal to zero we obtain0 = 15x2 Y x = 0 0 = x + 2 Y x = -2 0 = x - 2 Y x = 2So x = -2, 0, 2 are the critical values (arranged from least to greatest).
(b) The critical points are obtained by finding the y-values for the critical values.For x = -2, y = 3(-2)5 - 20(-2)3 = -96 + 160 = 64For x = 0, y = 3(0)5 - 20(0)3 = 0 - 0 = 0For x = 2, y = 3(2)5 - 20(2)3 = 96 - 160 = -64So the critical points are (-2, 64), (0, 0) and (2, -64).
(c) (Before showing the work for part (c), it is worth noting that thethree critical points appear on a graph as shown in Figure 3.23. Since those three points are the only critical points, the only wayfor a smooth function like a polynomial to get from one point tothe other is for it to decrease between x = -2 and x = 0 and thencontinue decreasing between x = 0 and x = 2. The work for part(c) should agree with this or there would be a mistake somewhere.)
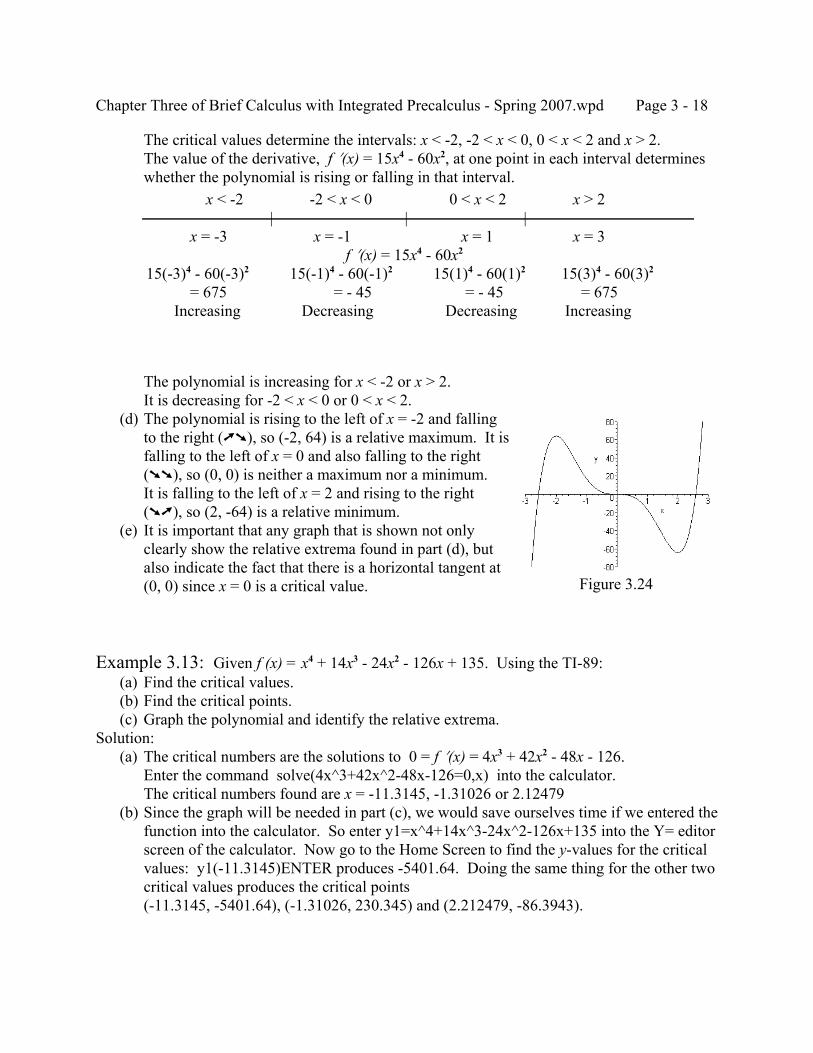
Chapter Three of Brief Calculus with Integrated Precalculus - Spring 2007.wpd Page 3 - 18
Figure 3.24
The critical values determine the intervals: x < -2, -2 < x < 0, 0 < x < 2 and x > 2.The value of the derivative, f N(x) = 15x4 - 60x2, at one point in each interval determineswhether the polynomial is rising or falling in that interval.
The polynomial is increasing for x < -2 or x > 2.It is decreasing for -2 < x < 0 or 0 < x < 2.
(d) The polynomial is rising to the left of x = -2 and fallingto the right (üú), so (-2, 64) is a relative maximum. It isfalling to the left of x = 0 and also falling to the right(úú), so (0, 0) is neither a maximum nor a minimum.It is falling to the left of x = 2 and rising to the right(úü), so (2, -64) is a relative minimum.
(e) It is important that any graph that is shown not onlyclearly show the relative extrema found in part (d), butalso indicate the fact that there is a horizontal tangent at(0, 0) since x = 0 is a critical value.
Example 3.13: Given f (x) = x4 + 14x3 - 24x2 - 126x + 135. Using the TI-89: (a) Find the critical values. (b) Find the critical points. (c) Graph the polynomial and identify the relative extrema.Solution: (a) The critical numbers are the solutions to 0 = f N(x) = 4x3 + 42x2 - 48x - 126.
Enter the command solve(4x^3+42x^2-48x-126=0,x) into the calculator.The critical numbers found are x = -11.3145, -1.31026 or 2.12479
(b) Since the graph will be needed in part (c), we would save ourselves time if we entered thefunction into the calculator. So enter y1=x^4+14x^3-24x^2-126x+135 into the Y= editorscreen of the calculator. Now go to the Home Screen to find the y-values for the criticalvalues: y1(-11.3145)ENTER produces -5401.64. Doing the same thing for the other twocritical values produces the critical points(-11.3145, -5401.64), (-1.31026, 230.345) and (2.212479, -86.3943).
x < -2 -2 < x < 0 0 < x < 2 x > 2 | | |
x = -3 x = -1 x = 1 x = 3 f N(x) = 15x4 - 60x2
15(-3)4 - 60(-3)2 15(-1)4 - 60(-1)2 15(1)4 - 60(1)2 15(3)4 - 60(3)2 = 675 = - 45 = - 45 = 675
Increasing Decreasing Decreasing Increasing
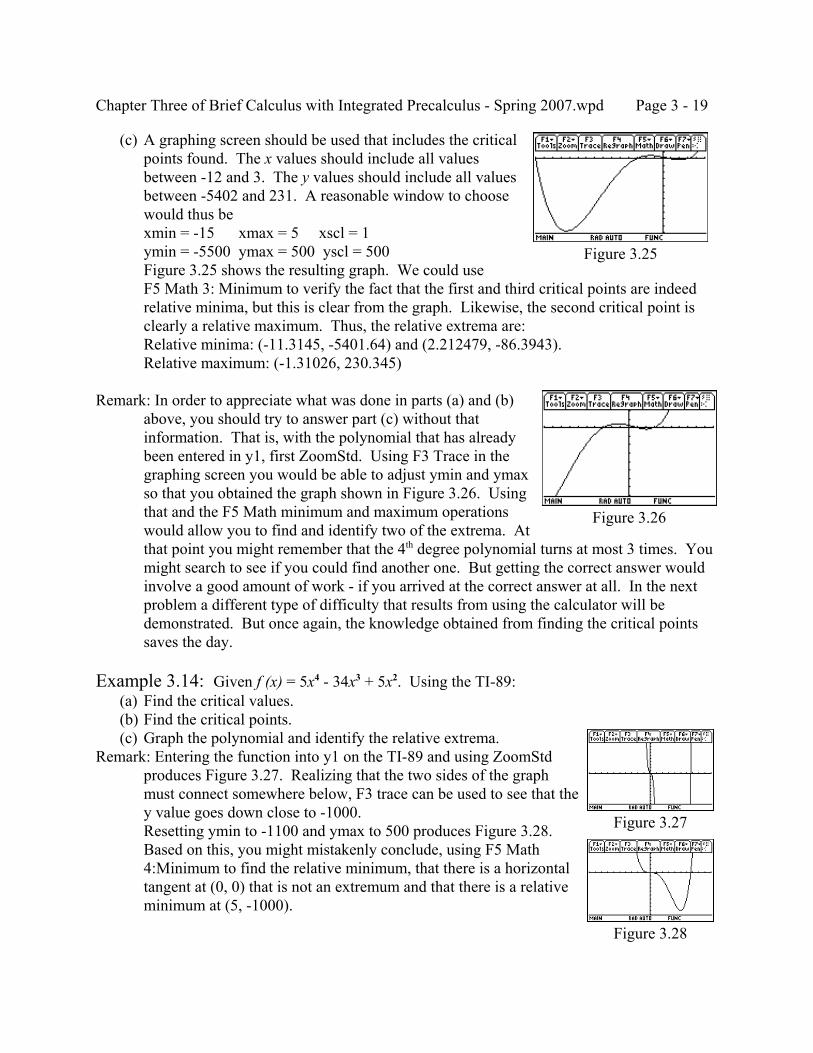
Chapter Three of Brief Calculus with Integrated Precalculus - Spring 2007.wpd Page 3 - 19
Figure 3.26
Figure 3.27
Figure 3.28
Figure 3.25
(c) A graphing screen should be used that includes the criticalpoints found. The x values should include all valuesbetween -12 and 3. The y values should include all valuesbetween -5402 and 231. A reasonable window to choosewould thus bexmin = -15 xmax = 5 xscl = 1ymin = -5500 ymax = 500 yscl = 500Figure 3.25 shows the resulting graph. We could useF5 Math 3: Minimum to verify the fact that the first and third critical points are indeedrelative minima, but this is clear from the graph. Likewise, the second critical point isclearly a relative maximum. Thus, the relative extrema are:Relative minima: (-11.3145, -5401.64) and (2.212479, -86.3943).Relative maximum: (-1.31026, 230.345)
Remark: In order to appreciate what was done in parts (a) and (b)above, you should try to answer part (c) without thatinformation. That is, with the polynomial that has alreadybeen entered in y1, first ZoomStd. Using F3 Trace in thegraphing screen you would be able to adjust ymin and ymaxso that you obtained the graph shown in Figure 3.26. Usingthat and the F5 Math minimum and maximum operationswould allow you to find and identify two of the extrema. Atthat point you might remember that the 4th degree polynomial turns at most 3 times. Youmight search to see if you could find another one. But getting the correct answer wouldinvolve a good amount of work - if you arrived at the correct answer at all. In the nextproblem a different type of difficulty that results from using the calculator will bedemonstrated. But once again, the knowledge obtained from finding the critical pointssaves the day.
Example 3.14: Given f (x) = 5x4 - 34x3 + 5x2. Using the TI-89: (a) Find the critical values. (b) Find the critical points. (c) Graph the polynomial and identify the relative extrema.Remark: Entering the function into y1 on the TI-89 and using ZoomStd
produces Figure 3.27. Realizing that the two sides of the graphmust connect somewhere below, F3 trace can be used to see that they value goes down close to -1000.Resetting ymin to -1100 and ymax to 500 produces Figure 3.28. Based on this, you might mistakenly conclude, using F5 Math4:Minimum to find the relative minimum, that there is a horizontaltangent at (0, 0) that is not an extremum and that there is a relativeminimum at (5, -1000).
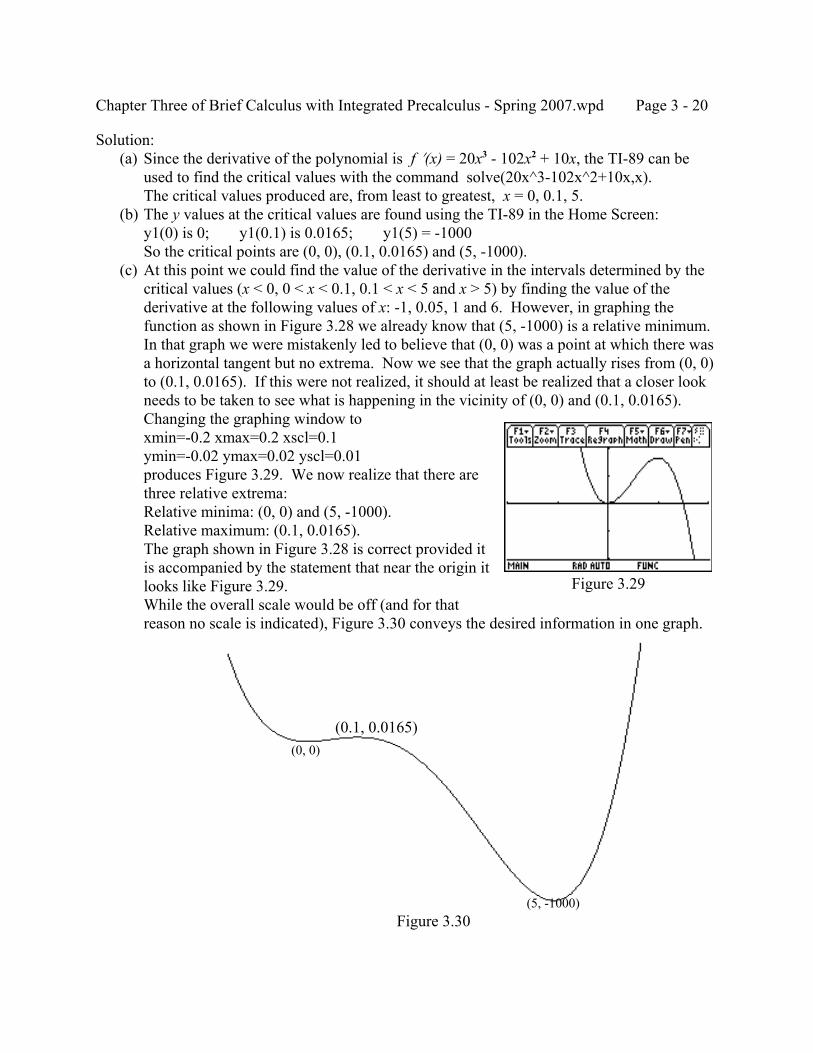
Chapter Three of Brief Calculus with Integrated Precalculus - Spring 2007.wpd Page 3 - 20
Figure 3.29
Figure 3.30
Solution: (a) Since the derivative of the polynomial is f N(x) = 20x3 - 102x2 + 10x, the TI-89 can be
used to find the critical values with the command solve(20x^3-102x^2+10x,x).The critical values produced are, from least to greatest, x = 0, 0.1, 5.
(b) The y values at the critical values are found using the TI-89 in the Home Screen:y1(0) is 0; y1(0.1) is 0.0165; y1(5) = -1000So the critical points are (0, 0), (0.1, 0.0165) and (5, -1000).
(c) At this point we could find the value of the derivative in the intervals determined by thecritical values (x < 0, 0 < x < 0.1, 0.1 < x < 5 and x > 5) by finding the value of thederivative at the following values of x: -1, 0.05, 1 and 6. However, in graphing thefunction as shown in Figure 3.28 we already know that (5, -1000) is a relative minimum.In that graph we were mistakenly led to believe that (0, 0) was a point at which there wasa horizontal tangent but no extrema. Now we see that the graph actually rises from (0, 0)to (0.1, 0.0165). If this were not realized, it should at least be realized that a closer lookneeds to be taken to see what is happening in the vicinity of (0, 0) and (0.1, 0.0165). Changing the graphing window toxmin=-0.2 xmax=0.2 xscl=0.1ymin=-0.02 ymax=0.02 yscl=0.01produces Figure 3.29. We now realize that there arethree relative extrema:Relative minima: (0, 0) and (5, -1000).Relative maximum: (0.1, 0.0165).The graph shown in Figure 3.28 is correct provided itis accompanied by the statement that near the origin itlooks like Figure 3.29.While the overall scale would be off (and for thatreason no scale is indicated), Figure 3.30 conveys the desired information in one graph.
(0.1, 0.0165) (0, 0)
(5, -1000)
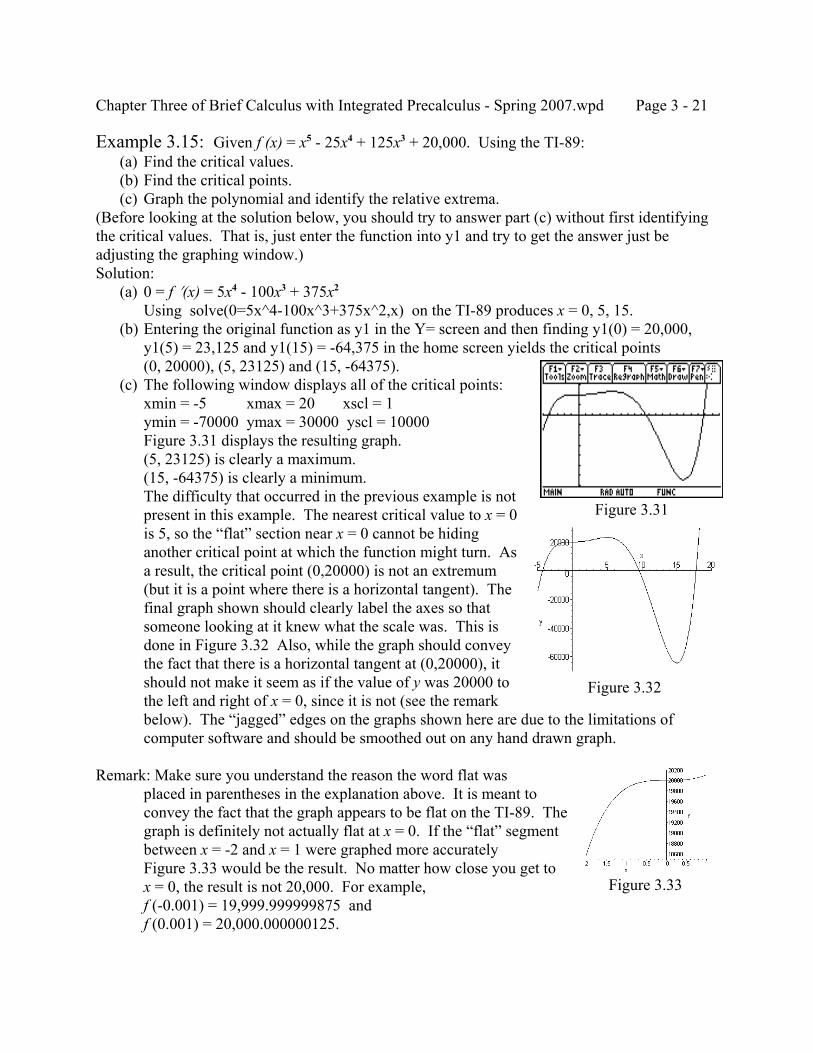
Chapter Three of Brief Calculus with Integrated Precalculus - Spring 2007.wpd Page 3 - 21
Figure 3.31
Figure 3.32
Figure 3.33
Example 3.15: Given f (x) = x5 - 25x4 + 125x3 + 20,000. Using the TI-89: (a) Find the critical values. (b) Find the critical points. (c) Graph the polynomial and identify the relative extrema.(Before looking at the solution below, you should try to answer part (c) without first identifyingthe critical values. That is, just enter the function into y1 and try to get the answer just beadjusting the graphing window.)Solution: (a) 0 = f N(x) = 5x4 - 100x3 + 375x2
Using solve(0=5x^4-100x^3+375x^2,x) on the TI-89 produces x = 0, 5, 15. (b) Entering the original function as y1 in the Y= screen and then finding y1(0) = 20,000,
y1(5) = 23,125 and y1(15) = -64,375 in the home screen yields the critical points(0, 20000), (5, 23125) and (15, -64375).
(c) The following window displays all of the critical points:xmin = -5 xmax = 20 xscl = 1ymin = -70000 ymax = 30000 yscl = 10000Figure 3.31 displays the resulting graph.(5, 23125) is clearly a maximum.(15, -64375) is clearly a minimum.The difficulty that occurred in the previous example is notpresent in this example. The nearest critical value to x = 0is 5, so the “flat” section near x = 0 cannot be hidinganother critical point at which the function might turn. Asa result, the critical point (0,20000) is not an extremum(but it is a point where there is a horizontal tangent). Thefinal graph shown should clearly label the axes so thatsomeone looking at it knew what the scale was. This isdone in Figure 3.32 Also, while the graph should conveythe fact that there is a horizontal tangent at (0,20000), itshould not make it seem as if the value of y was 20000 tothe left and right of x = 0, since it is not (see the remarkbelow). The “jagged” edges on the graphs shown here are due to the limitations ofcomputer software and should be smoothed out on any hand drawn graph.
Remark: Make sure you understand the reason the word flat wasplaced in parentheses in the explanation above. It is meant toconvey the fact that the graph appears to be flat on the TI-89. Thegraph is definitely not actually flat at x = 0. If the “flat” segmentbetween x = -2 and x = 1 were graphed more accuratelyFigure 3.33 would be the result. No matter how close you get tox = 0, the result is not 20,000. For example,f (-0.001) = 19,999.999999875 andf (0.001) = 20,000.000000125.
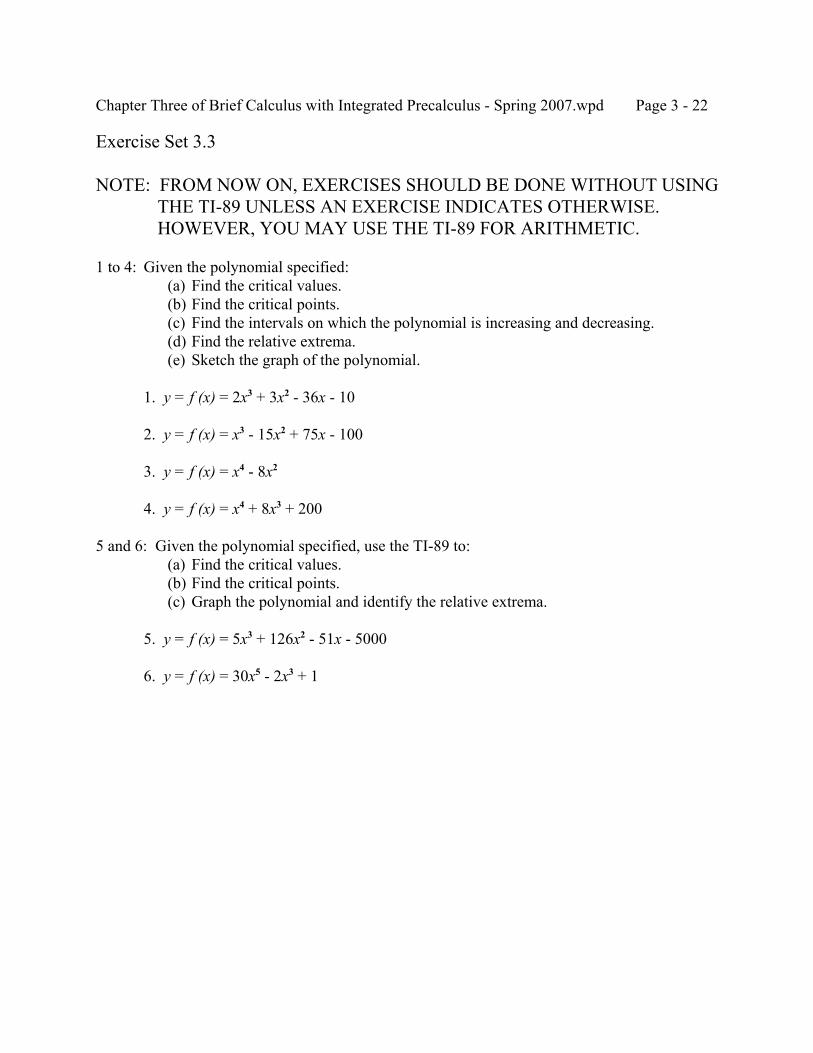
Chapter Three of Brief Calculus with Integrated Precalculus - Spring 2007.wpd Page 3 - 22
Exercise Set 3.3
NOTE: FROM NOW ON, EXERCISES SHOULD BE DONE WITHOUT USING THE TI-89 UNLESS AN EXERCISE INDICATES OTHERWISE. HOWEVER, YOU MAY USE THE TI-89 FOR ARITHMETIC.
1 to 4: Given the polynomial specified: (a) Find the critical values. (b) Find the critical points. (c) Find the intervals on which the polynomial is increasing and decreasing. (d) Find the relative extrema. (e) Sketch the graph of the polynomial.
1. y = f (x) = 2x3 + 3x2 - 36x - 10
2. y = f (x) = x3 - 15x2 + 75x - 100
3. y = f (x) = x4 - 8x2
4. y = f (x) = x4 + 8x3 + 200
5 and 6: Given the polynomial specified, use the TI-89 to: (a) Find the critical values. (b) Find the critical points. (c) Graph the polynomial and identify the relative extrema.
5. y = f (x) = 5x3 + 126x2 - 51x - 5000
6. y = f (x) = 30x5 - 2x3 + 1
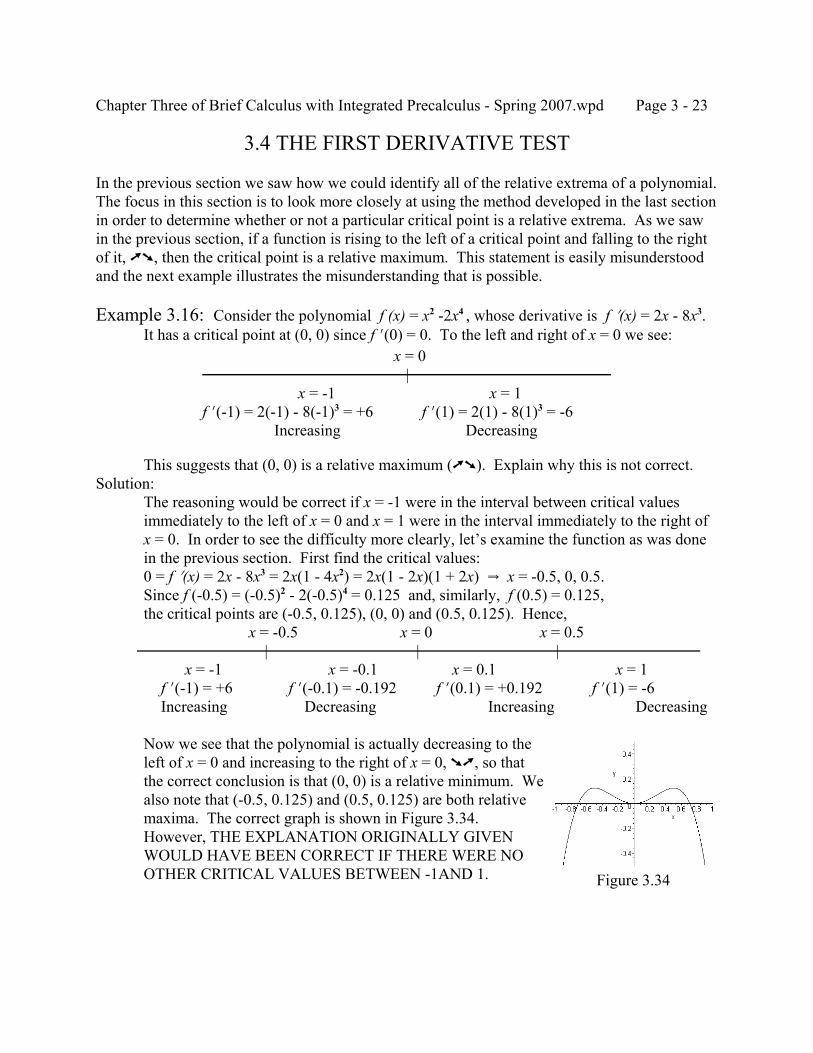
Chapter Three of Brief Calculus with Integrated Precalculus - Spring 2007.wpd Page 3 - 23
Figure 3.34
3.4 THE FIRST DERIVATIVE TEST
In the previous section we saw how we could identify all of the relative extrema of a polynomial. The focus in this section is to look more closely at using the method developed in the last sectionin order to determine whether or not a particular critical point is a relative extrema. As we sawin the previous section, if a function is rising to the left of a critical point and falling to the rightof it, üú, then the critical point is a relative maximum. This statement is easily misunderstoodand the next example illustrates the misunderstanding that is possible.
Example 3.16: Consider the polynomial f (x) = x2 -2x4 , whose derivative is f N(x) = 2x - 8x3.It has a critical point at (0, 0) since f N(0) = 0. To the left and right of x = 0 we see:
This suggests that (0, 0) is a relative maximum (üú). Explain why this is not correct.Solution:
The reasoning would be correct if x = -1 were in the interval between critical valuesimmediately to the left of x = 0 and x = 1 were in the interval immediately to the right ofx = 0. In order to see the difficulty more clearly, let’s examine the function as was donein the previous section. First find the critical values:0 = f N(x) = 2x - 8x3 = 2x(1 - 4x2) = 2x(1 - 2x)(1 + 2x) Y x = -0.5, 0, 0.5.Since f (-0.5) = (-0.5)2 - 2(-0.5)4 = 0.125 and, similarly, f (0.5) = 0.125,the critical points are (-0.5, 0.125), (0, 0) and (0.5, 0.125). Hence,
Now we see that the polynomial is actually decreasing to theleft of x = 0 and increasing to the right of x = 0, úü, so thatthe correct conclusion is that (0, 0) is a relative minimum. Wealso note that (-0.5, 0.125) and (0.5, 0.125) are both relativemaxima. The correct graph is shown in Figure 3.34. However, THE EXPLANATION ORIGINALLY GIVENWOULD HAVE BEEN CORRECT IF THERE WERE NOOTHER CRITICAL VALUES BETWEEN -1AND 1.
x = 0 |
x = -1 x = 1f N(-1) = 2(-1) - 8(-1)3 = +6 f N(1) = 2(1) - 8(1)3 = -6
Increasing Decreasing
x = -0.5 x = 0 x = 0.5 | | |
x = -1 x = -0.1 x = 0.1 x = 1 f N(-1) = +6 f N(-0.1) = -0.192 f N(0.1) = +0.192 f N(1) = -6 Increasing Decreasing Increasing Decreasing
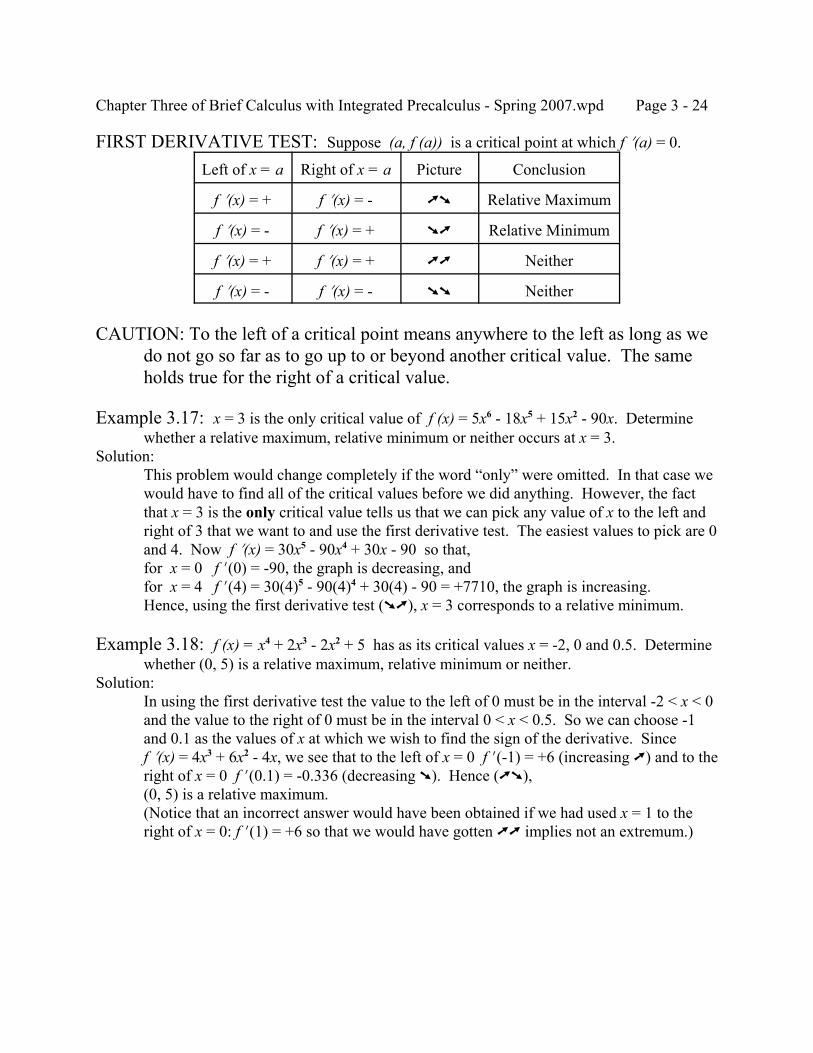
Chapter Three of Brief Calculus with Integrated Precalculus - Spring 2007.wpd Page 3 - 24
FIRST DERIVATIVE TEST: Suppose (a, f (a)) is a critical point at which f N(a) = 0.
Left of x = a Right of x = a Picture Conclusion
f N(x) = + f N(x) = - üú Relative Maximum
f N(x) = - f N(x) = + úü Relative Minimum
f N(x) = + f N(x) = + üü Neither
f N(x) = - f N(x) = - úú Neither
CAUTION: To the left of a critical point means anywhere to the left as long as wedo not go so far as to go up to or beyond another critical value. The sameholds true for the right of a critical value.
Example 3.17: x = 3 is the only critical value of f (x) = 5x6 - 18x5 + 15x2 - 90x. Determinewhether a relative maximum, relative minimum or neither occurs at x = 3.
Solution:This problem would change completely if the word “only” were omitted. In that case wewould have to find all of the critical values before we did anything. However, the factthat x = 3 is the only critical value tells us that we can pick any value of x to the left andright of 3 that we want to and use the first derivative test. The easiest values to pick are 0and 4. Now f N(x) = 30x5 - 90x4 + 30x - 90 so that,for x = 0 f N(0) = -90, the graph is decreasing, andfor x = 4 f N(4) = 30(4)5 - 90(4)4 + 30(4) - 90 = +7710, the graph is increasing.Hence, using the first derivative test (úü), x = 3 corresponds to a relative minimum.
Example 3.18: f (x) = x4 + 2x3 - 2x2 + 5 has as its critical values x = -2, 0 and 0.5. Determinewhether (0, 5) is a relative maximum, relative minimum or neither.
Solution:In using the first derivative test the value to the left of 0 must be in the interval -2 < x < 0and the value to the right of 0 must be in the interval 0 < x < 0.5. So we can choose -1and 0.1 as the values of x at which we wish to find the sign of the derivative. Sincef N(x) = 4x3 + 6x2 - 4x, we see that to the left of x = 0 f N(-1) = +6 (increasing ü) and to theright of x = 0 f N(0.1) = -0.336 (decreasing ú). Hence (üú),(0, 5) is a relative maximum.(Notice that an incorrect answer would have been obtained if we had used x = 1 to theright of x = 0: f N(1) = +6 so that we would have gotten üü implies not an extremum.)
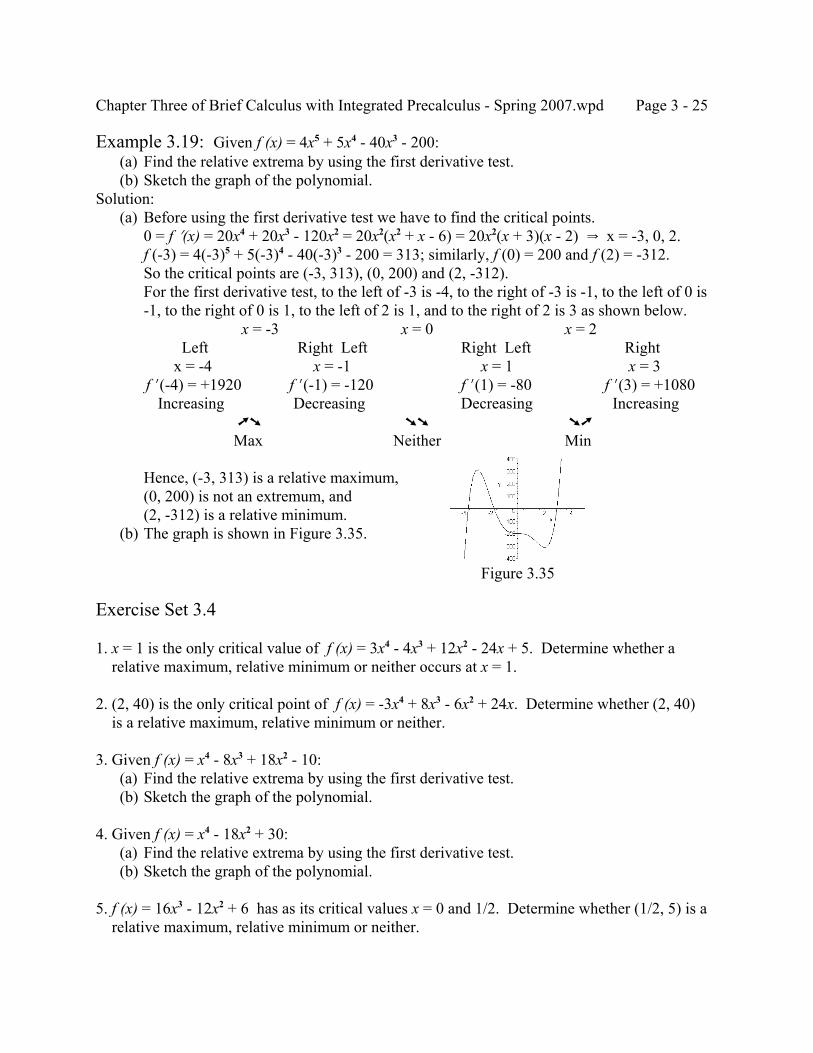
Chapter Three of Brief Calculus with Integrated Precalculus - Spring 2007.wpd Page 3 - 25
Figure 3.35
Example 3.19: Given f (x) = 4x5 + 5x4 - 40x3 - 200: (a) Find the relative extrema by using the first derivative test. (b) Sketch the graph of the polynomial.Solution: (a) Before using the first derivative test we have to find the critical points.
0 = f N(x) = 20x4 + 20x3 - 120x2 = 20x2(x2 + x - 6) = 20x2(x + 3)(x - 2) Y x = -3, 0, 2.f (-3) = 4(-3)5 + 5(-3)4 - 40(-3)3 - 200 = 313; similarly, f (0) = 200 and f (2) = -312.So the critical points are (-3, 313), (0, 200) and (2, -312).For the first derivative test, to the left of -3 is -4, to the right of -3 is -1, to the left of 0 is-1, to the right of 0 is 1, to the left of 2 is 1, and to the right of 2 is 3 as shown below.
Hence, (-3, 313) is a relative maximum,(0, 200) is not an extremum, and(2, -312) is a relative minimum.
(b) The graph is shown in Figure 3.35.
Exercise Set 3.4
1. x = 1 is the only critical value of f (x) = 3x4 - 4x3 + 12x2 - 24x + 5. Determine whether a relative maximum, relative minimum or neither occurs at x = 1.
2. (2, 40) is the only critical point of f (x) = -3x4 + 8x3 - 6x2 + 24x. Determine whether (2, 40) is a relative maximum, relative minimum or neither.
3. Given f (x) = x4 - 8x3 + 18x2 - 10: (a) Find the relative extrema by using the first derivative test. (b) Sketch the graph of the polynomial.
4. Given f (x) = x4 - 18x2 + 30: (a) Find the relative extrema by using the first derivative test. (b) Sketch the graph of the polynomial.
5. f (x) = 16x3 - 12x2 + 6 has as its critical values x = 0 and 1/2. Determine whether (1/2, 5) is a relative maximum, relative minimum or neither.
x = -3 x = 0 x = 2Left Right Left Right Left Right
x = -4 x = -1 x = 1 x = 3 f N(-4) = +1920 f N(-1) = -120 f N(1) = -80 f N(3) = +1080 Increasing Decreasing Decreasing Increasing
üú úú úü Max Neither Min
Chapter Three of Brief Calculus with Integrated Precalculus - Spring 2007.wpd Page 3 - 26
3.5 COST, REVENUE, PROFIT AND MARGINAL FUNCTIONS
The basic idea of cost, revenue and profit is fairly simple. If it costs $5000.00 to produce 1000items and each item can be sold for $7.00, then the amount of money obtained from selling theitems is 1000 x $7.00 = $7000.00 and the profit is $7000.00 - $5000.00 = $2000.00. There arevarious factors that complicate this simple picture, of which we will consider a few. The totalcost is often viewed in connection with two components, the fixed cost and the variable cost. The fixed cost involves expenditures that must be made even if no items are produced such asrent and taxes. The variable cost is a cost for each item. Such things as the cost of materials andthe cost of the time a worker spends making each item are included in the variable cost. So thetotal cost of $5000.00 mentioned above might involve a fixed cost of $3000.00 and a variablecost of $2.00 per item (so that the total cost is $3000.00 + 1000 items x $2.00 = $5000.00). It isalso true that you cannot sell any number of items at any price you want. In order to sell moreitems you have to lower the price. We have encountered this idea in Chapter One. The demandfunction provides the relationship between the price and the number of items sold. Beforelooking at an example that puts these ideas together, we state the ideas provided so far.
x = the number of items sold, the quantityp = the price of each item
C = C(x) = Total Cost = Cost of producing the x items = fixed cost + (variable cost) times x
(but sometimes the function is more complicated)
R = R(x) = Revenue = price times quantity = px, where p and x are related by the demand equation.
P = P(x) = Profit = Revenue - Cost = R - C
Example 3.20: The monthly fixed cost of producing tables is $10,000 and the variable cost is$200 per table. When the tables are sold for $300 each, 250 tables can be sold per month. When the tables are sold for $270 each, 400 tables can be sold per month. Assume thedemand function is linear.
(a) Find the total cost function. (b) Find the demand function. (c) Find the revenue function. (d) Find the profit function. (e) Find the number of tables that should be sold per month in order to maximize revenue
and explain why the revenue stops increasing and begins to decrease at that sales rate. (f) Find the number of tables that should be sold in order to maximize the profit and find the
maximum profit.
Chapter Three of Brief Calculus with Integrated Precalculus - Spring 2007.wpd Page 3 - 27
Solution: (a) C = Fixed cost + variable cost times the number sold
C = 10,000 + 200x (b) We are looking for the straight line through the points (x1, p1) = (250, 300) and
(x2, p2) = (400, 270) (recall from Chapter One that it is customary in most cases toexpress the price as a function of the quantity - so the pairs should be arranged as
(quantity, price)). Hence, slope = and270 300400 250
30150
15
0 2−−
=−
= − = − .
p - 300 = - 0.2(x - 250) Y p - 300 = - 0.2x + 50 Y p = - 0.2x + 350. (c) R = px = (- 0.2x + 350)x = - 0.2x2 + 350x.
(Whenever you are asked for the revenue function it is implicitly understood that the result is desired as a function of one variable as shown here.)
(d) Profit = revenue - costP = R - C = (- 0.2x2 + 350x) - (10,000 + 200x) = - 0.2x2 + 350x - 10,000 - 200x(Make sure you notice the minus sign for the cost applies to 200x as well as 10,000.)P = - 0.2x2 + 150x - 10,000
(e) Observe the revenue function R = - 0.2x2 + 350x is a parabola that opens downward.As a result, it has its maximum value at the value of x where the derivative is 0.0 = RN = - 0.4x + 350 Y 0.4x = 350 Y x = 350/0.4 = 875.An acceptable answer to the second part of the question would be to say that in order tosell more and more tables you have to keep lowering the price and at some point theeffect of increasing the quantity is offset by the amount the price had to be lowered. Thisanswer could be made more precise by illustrating this effect by calculating the price andrevenue that occurs when 800, 875 and 950 tables are produced.x = 800 Y p = - 0.2(800) + 350 = -160 + 350 = $190 Y R = $190 x 800 = $152,000x = 875 Y p = - 0.2(875) + 350 = -175 + 350 = $175 Y R = $175 x 875 = $153,125x = 950 Y p = - 0.2(950) + 350 = -190 + 350 = $160 Y R = $160 x 950 = $152,000
(f) The profit function P = - 0.2x2 + 150x - 10,000 is also a parabola that opens downward.So 0 = PN = - 0.4x + 150 Y 0.4x = 150 Y x = 375 tables.The maximum profit obtainable is P = - 0.2(375)2 + 150(375) - 10,000 = $18,125.(Observe that the number of tables needed to maximize the profit is very different fromthe number of tables needed to maximize the revenue. The reason for that is the fact thatmaximizing the revenue ignores the cost completely. When the 875 tables are producedand sold to obtain the maximum revenue of $153,125, the cost of those tables is given byC = 10,000 + 200(875) = $185,000 so that the profit is $153,125 - $185,000 = - $31,875.Consequently, producing the 875 tables maximizes the revenue but produces a loss of$31,875.)
Chapter Three of Brief Calculus with Integrated Precalculus - Spring 2007.wpd Page 3 - 28
Economists use the word “marginal” in many contexts. For example, they would say that themarginal federal tax rate in 2005 for a single person who has a taxable income of $50,000 is25%. Now the federal tax for such a person according to the tax rate schedule is $9,165.00. Notice that this means that the taxes are 18.33% of the income since . So what9 165
50 000 01833,, .=
does the 25% represent? According to the tax rate schedule the federal tax for a person who hasa taxable income of $50,100 is $9,190. So if the persons income increased by $100 from$50,000 to $50,100, then the tax would increase by $25 from $9,165 to $9,190. We see that theextra tax is 25% of the extra income. What is being said here is that the average tax rate is18.33% for a person whose taxable income is $50,000 but the instantaneous rate of change is25% for additional income. The words “instantaneous rate of change” should automaticallytrigger a response in your mind: “the instantaneous rate of change is the slope of the tangent isthe derivative.”
Marginal means rate of change means derivative
Example 3.21: The cost of producing 100 items is $500. If the marginal cost of producing100 items is $2 per item, estimate the cost of producing
(a) 101 items(b) 103 items(c) 220 items
(d) Under what circumstances would you expect all of the above answers to be exactly correct and which answer is most likely to be very incorrect in general?
Solution:Observe that $500 divided by 100 is $5 per item and not $2. The average rate of changein cost for the first 100 items produced is $5 per item. The marginal rate of $2 per itemprovided an estimate of the increase in cost that results in producing additional items.
(a) Cost of 101 items . Cost of 100 items + Cost of one extra item = $500 + $2 = $502. (b) Cost of 103 items .Cost of 100 items + Cost of 3 extra items = $500 + $2(3) = $506. (c) Cost of 220 items .Cost of 100 items + Cost of 120 extra items = $500 + $2(120) = $740 (d) The answers obtained above all assume that the rate of change is constant no matter how
many extra items are produced. That means that it is being assumed that the cost is alinear function of the number of items produced (in this case C = 2x + 300). While it isoften approximately true that cost is linear within a range of values, there are otherfactors that play a role as the number of items increase substantially. For example,skilled workers might be needed and to get enough of them you might have to increasetheir salaries or you might have to rent additional factory space. So the cost of $740 for220 items is most likely to be quite incorrect in general although it could be a goodestimate if the cost were very close to being a linear function.
If the explanation provided in part (d) above was not perfectly understandable to you, thefollowing example might help clarify the issue.
Chapter Three of Brief Calculus with Integrated Precalculus - Spring 2007.wpd Page 3 - 29
Example 3.22: Verify that each of the following cost functions satisfy the conditions of theprevious example (the cost of 100 items is $500 and the marginal cost of 100 items is$2). Then find the actual cost of 101, 103 and 220 items for the function and comparethe results with the estimates found in the previous example by determining the error.
(a) C(x) = 0.01x2 + 400 (b) C(x) = 0.002x2 + 1.6x + 320 (c) C(x) = 2x + 300Solution:
Marginal cost is the rate of change in the cost is the derivative of the cost function, CN(x). (a) The cost of 100 items is C(100) = 0.01(100)2 + 400 = $500.
Since CN(x) = 0.02x, the marginal cost of 100 items is CN(100) = 0.02(100) = $2 per item.The actual cost of 101 items is C(101) = 0.01(101)2 + 400 = $502.01. This differs from
the estimate of $502.00 by $0.01, a very small error.The actual cost of 103 items is C(103) = 0.01(103)2 + 400 = $506.09. This differs from
the estimate of $506.00 by $0.09, which is a relatively small error.The actual cost of 220 items is C(220) = 0.01(220)2 + 400 = $884.00. This differs from
the estimate of $740.00 by $144.00, which is a very substantial error. (b) C(100) = 0.002(100)2 + 1.6(100) + 320 = $500.
Since CN(x) = 0.004x + 1.6, the marginal cost of 100 items isCN(100) = 0.004(100) + 1.6 = $2 per item.
C(101) = 0.002(101)2 + 1.6(101) + 320 = $502.002. This differs fromthe estimate of $502.00 by $0.002, an extremely negligible error.
C(103) = 0.002(103)2 + 1.6(103) + 320 = $506.018. This differs fromthe estimate of $506.00 by $0.018, which is a very small error.
C(220) = 0.002(220)2 + 1.6(220) + 320 = $768.80. This differs fromthe estimate of $740.00 by $28.80, which is a substantial error.
(c) C(100) = 2(100) + 300 = $500.CN(x) = 2 Y CN(100) = 2.C(101) = 2(101) + 300 = $502, no error.C(103) = 2(103) + 300 = $506, no error.C(220) = 2(220) + 300 = $740, no error.
Chapter Three of Brief Calculus with Integrated Precalculus - Spring 2007.wpd Page 3 - 30
Example 3.23: The demand function that indicates the price, p, in dollars when x items aresold weekly is given by p = - 0.05x + 20. The total cost function is C = 4x + 200.
(a) Find the profit function. (b) Find the profit that results from selling 50 items weekly. (c) Find the marginal profit function. (d) Find the marginal profit when 50 items are sold weekly. (e) Use the results of parts (b) and (d) to estimate the profit when 55 items are sold weekly. (f) Find the actual profit when 55 items are sold weekly and compare your answer from
part (e) with this result. (g) Find the number of items that should be sold weekly to maximize the profit. (h) Find the maximum profit. (i) What is the smallest number of items that can be sold and make a profit? (j) Graph the profit function on the TI-89 and use the graph to answer parts (b), (d), (g), (h)
and (i).Solution: (a) Recall P = R - C where R = px. Hence, since R = (- 0.05x + 20)x = - 0.05x2 + 20x,
P = (- 0.05x2 + 20x) - (4x + 200) = - 0.05x2 + 16x - 200. (b) P(50) = - 0.05(50)2 + 16(50) - 200 = $475 weekly (c) PN(x) = - 0.1x + 16 (d) PN(50) = - 0.1(50) + 16 = $11 per item. (e) 55 items is 5 items more than 50 items. An estimate of the additional profit for these
extra items is found by multiplying the 5 items times the estimated $11 per item, whichis $55. So an estimate of the profit resulting from selling 55 items is the profit fromselling 50 items plus the additional profit resulting from selling 5 additional items.This gives a result of $475 + $55 = $530.
(f) P(55) = - 0.05(55)2 + 16(55) - 200 = $528.75.Part (e) is in error by $1.25.
(g) The profit function is a parabola that opens downwards. So its highest point occurswhere there is a horizontal tangent, that is, the derivative is zero.0 = PN(x) = - 0.1x + 16 Y 0.1x = 16 Y x = 160 items.
(h) P(160) = - 0.05(160)2 + 16(160) - 200 = $1080. (i) Due to the fact that the cost of not producing any items is $200 weekly, there is a loss of
$200 weekly if no items are produced (i.e. the profit is negative, P(0) = - $200)). So thequestion is, when does the profit cease being negative and then become positive? Thishappens when the profit is 0. So we must solve 0 = - 0.05x2 + 16x - 200. Using the TI-89solve function we find x = 13.0306 or 306.969. So the profit first becomes 0 when13.0306 items are produced. Technically, the correct answer to the question asked is 14items since you cannot produce 0.0306 items and the profit is very slightly negative when13 items are produced. However, in this context, an answer of 13 items is fine. Thesafest answer is to simply say 13.0306 items and leave it at that.
(j) The graph should include the critical point found in parts (g) and (h), (160, 1080). Also,since the profit can certainly go as low as - 200, values of profit (y-axis) between -500and 1500 are reasonable. It would be of interest to see both zeros found in part (i), so
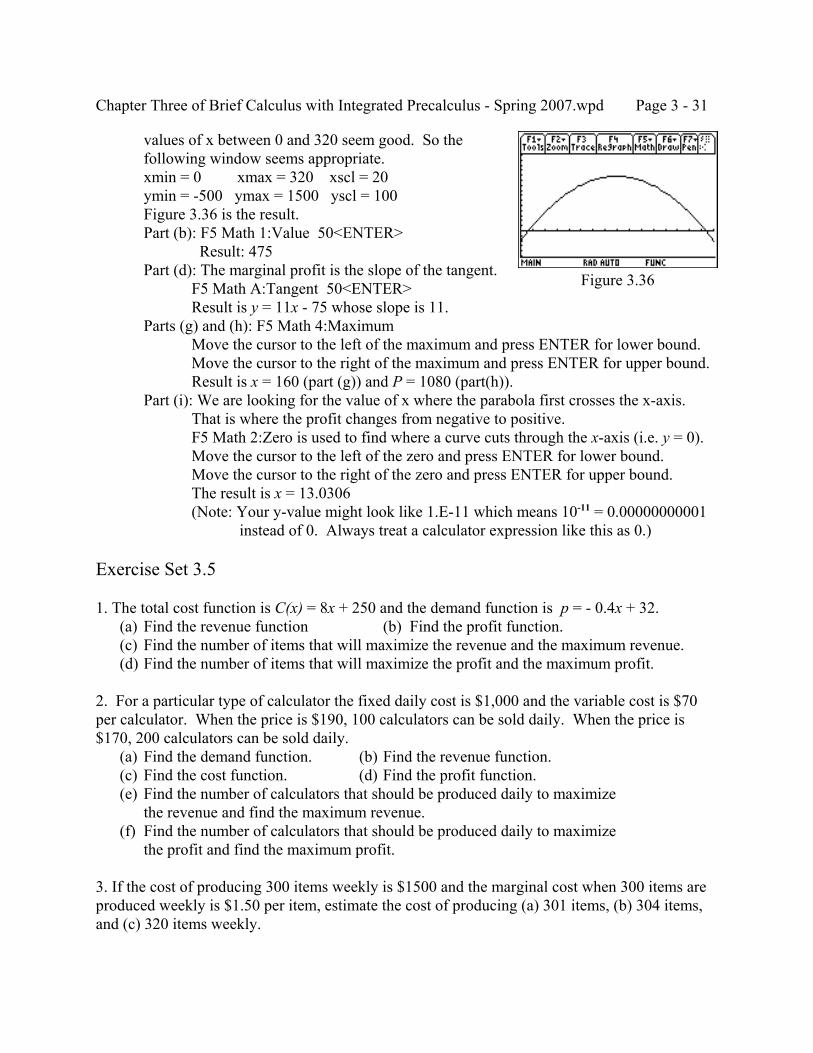
Chapter Three of Brief Calculus with Integrated Precalculus - Spring 2007.wpd Page 3 - 31
Figure 3.36
values of x between 0 and 320 seem good. So thefollowing window seems appropriate.xmin = 0 xmax = 320 xscl = 20ymin = -500 ymax = 1500 yscl = 100Figure 3.36 is the result.Part (b): F5 Math 1:Value 50<ENTER>
Result: 475Part (d): The marginal profit is the slope of the tangent.
F5 Math A:Tangent 50<ENTER>Result is y = 11x - 75 whose slope is 11.
Parts (g) and (h): F5 Math 4:MaximumMove the cursor to the left of the maximum and press ENTER for lower bound.Move the cursor to the right of the maximum and press ENTER for upper bound.Result is x = 160 (part (g)) and P = 1080 (part(h)).
Part (i): We are looking for the value of x where the parabola first crosses the x-axis.That is where the profit changes from negative to positive.F5 Math 2:Zero is used to find where a curve cuts through the x-axis (i.e. y = 0).Move the cursor to the left of the zero and press ENTER for lower bound.Move the cursor to the right of the zero and press ENTER for upper bound.The result is x = 13.0306(Note: Your y-value might look like 1.E-11 which means 10-11 = 0.00000000001
instead of 0. Always treat a calculator expression like this as 0.)
Exercise Set 3.5
1. The total cost function is C(x) = 8x + 250 and the demand function is p = - 0.4x + 32. (a) Find the revenue function (b) Find the profit function. (c) Find the number of items that will maximize the revenue and the maximum revenue. (d) Find the number of items that will maximize the profit and the maximum profit.
2. For a particular type of calculator the fixed daily cost is $1,000 and the variable cost is $70per calculator. When the price is $190, 100 calculators can be sold daily. When the price is$170, 200 calculators can be sold daily. (a) Find the demand function. (b) Find the revenue function. (c) Find the cost function. (d) Find the profit function. (e) Find the number of calculators that should be produced daily to maximize
the revenue and find the maximum revenue. (f) Find the number of calculators that should be produced daily to maximize
the profit and find the maximum profit.
3. If the cost of producing 300 items weekly is $1500 and the marginal cost when 300 items areproduced weekly is $1.50 per item, estimate the cost of producing (a) 301 items, (b) 304 items,and (c) 320 items weekly.
Chapter Three of Brief Calculus with Integrated Precalculus - Spring 2007.wpd Page 3 - 32
4. If the revenue obtained by producing 100 items weekly is $2000 and the marginal revenuewhen 100 items are produced weekly is $25, estimate the revenue obtained by producing(a) 101 items, (b) 104 items, and (c) 109 items weekly.
5. If C(250) = 700 and CN(250) = 10, estimate the value of (a) C(253) and (b) C(255).
6. If P(200) = $300 and PN(200) = $2.50, estimate (a) P(201) and (b) P(210).
7 to 9. For each revenue function listed, x is the number of items sold weekly and the revenue is in dollars. Do the following for each revenue function listed.
(a) Find the revenue obtained by selling 100 items weekly. (b) Find the marginal revenue when 100 items are sold weekly. (c) Use the results of parts (a) and (b) to estimate the revenue that would be obtained
by selling 101 items weekly and 110 items weekly. (d) Find the actual revenue that would be obtained by selling 101 items weekly and
110 items weekly. Compare the results of part (c) with your answers.7. R(x) = 25x - 0.01x2
8. R(x) = 25x - 0.2x2
9. R(x) = 22x
10. Given f (x) = 2x3 + 5x2 +7x + 20 (a) Find f (10) and f N(10) by hand. (b) Use the results of part (a) to estimate the value of f (10.5) by hand. (c) Use a calculator to find the exact value of f (10.5). (d) Find the error that occurred by using part (b).
11 and 12. For each demand function and cost function x represents the number of items sold and p represents the price in dollars.
(a) Find the profit function. (b) Find the profit that results from selling 40 items. (c) Find the marginal profit function. (d) Find the marginal profit when 40 items are sold. (e) Use the results of parts (b) and (d) to estimate the profit when 42 items are sold. (f) Find the actual profit when 42 items are sold and compare your answer from
part (e) with this result. (g) Find the number of items that should be sold to maximize the profit. (h) Find the maximum profit. (i) What is the smallest number of items that can be sold and make a profit?
11. p = - 0.1x + 18 and C(x) = 8x + 130 12. p = -2x + 800 and C(x) = 300x + 9000
Chapter Three of Brief Calculus with Integrated Precalculus - Spring 2007.wpd Page 3 - 33
3.6 DIFFERENTIALS
When the derivative was first introduced it was mentioned that as you zoom in to look closely ata smooth function such as a polynomial it begins to look more and more like a straight line. At agiven point the equation of the line is the tangent line whose slope is the derivative. In theprevious section we noticed that if you take the value of the derivative at a point and multiply ittimes the change in value of x (∆x), then this yields a good estimate of the change in value of y,∆y, if ∆x is small. For example, if the height of a jet at t minutes after takeoff is represented byh(t) and the jet is rising at the rate of 30 feet per minute at 40 minutes after takeoff (hN(40) = 30),then an estimate of how much its height has changed between 40 minutes and 42 minutes aftertakeoff (so that the change in time is ∆t = 2 minutes) is found by multiplying the rate of changetimes the time elapsed, 30 feet/min. x 2 mins. = 60 feet (∆h . hN(40)∆t). This estimate is onlygood for small changes. However, this does lead to a different way of viewing dh/dt = hN(t). Suppose we actually thought of dh/dt as the quotient of dh and dt. What meaning might weassign to them? Notice that, viewed in this manner, dh = hN(t)dt. So if dt were the same as ∆t,then dh would be an estimate for ∆h. This is the idea behind the differential.
Differential: If y = f (x), then the differential dy is defined by ,dy f x dxdydx
dx= ′ =( )
where the differential dx is any real number. If dx = ∆x, then dy is approximately equalto ∆y when ∆x is small in size.
Example 3.24: Find the differential dy for the following functions:(a) y = f (x) = 7x3 (b) y = f (x) = 8x2 - 5x + 3 (c) y = x5 + 4x3 - 9x + 3
Solution: (a) dy = f N(x)dx = 21x2dx (b) dy = f N(x) = (16x - 5)dx
(The parentheses are important since both the 16x and the 5 multiply the dx.) (c) dy = (5x4 + 12x2 - 9)dx
Example 3.25: Find the value of the differential dy if:(a) y = f (x) = x2 - 3x + 5, x = 2 and dx = 4(b) y = f (x) = x3 + 2x - 3 and x changes from 6 to 9.(c) y = f (x) = 5x2 - 7x + 1 and x changes from 4 to 2.
Solution: (a) dy = f N(x) = (2x - 3)dx = (2(2) - 3)(4) = (1)(4) = 4 (b) Whenever x is described as changing “from” “to”, the “from” part always indicates the
value of x for computing the differential dy and the difference of the two numbersprovides the value of dx (the change in x, ∆x). In this example,x = 6 and dx = ∆x = 9 - 6 = 3. So dy = f N(x)dx = (3x2 + 2)dx = (3(6)2 + 2)(3) = 330
(c) In this case x = 4 and dx = 2 - 4 = -2 (notice the negative change). Hence,dy = f N(x) = (10x - 7)dx = (10(4) - 7)(-2) = -66
Chapter Three of Brief Calculus with Integrated Precalculus - Spring 2007.wpd Page 3 - 34
Example 3.26: The cost of producing x items is given by C(x) = 0.01x2 + 400.(a) Use differentials to estimate the cost increase that results from increasing production from 100 items to 103 items.(b) Find the actual change in cost.
Solution: This is the same problem that appeared in the previous section, only worded in termsof differentials. In this problem the estimate of the change in cost is dC and the change inthe number of items is dx.
(a) x = 100 and dx = ∆x = 103 - 100 = 3.dC = (0.02x)dx = (0.02(100))(3) = 6. So an estimate of the change in cost is $6.00.
(b) C(100) = 0.01(100)2 + 400 = 500 and C(103) = 0.01(103)2 + 400 = 506.09So the actual change in cost is ∆C = 506.09 - 500.00 = $6.09.
Example 3.27: The radius of a circle is 5.2 inches. However, there is a possible error of 0.1inches in the measurement. Compute the area of the circle and estimate the possible errorin the area.
Solution:A = πr2 = π(5.2)2 = 84.9487 square inches (by using the calculator).However, the error might be as much as ∆r = 0.1 inches. Using differentials to estimatethe possible change in the area that might result from this (dA is an estimate of ∆A), wefind dA = ANdr = (2πr)dr = (2π(5.2))(0.1) = 3.26726.So the area is 84.95 square inches with a possible error of 3.27 square inches.
Exercise Set 3.6
1. Find the differential dy for the following functions: (a) y = f (x) = 5x4 (b) y = x5 + 4x3 - 9x + 3 (c) y = 3x2 + x - 72. Find the value of the differential dy if:
(a) y = f (x) = 3x2 + x - 7, x = 1 and dx = 2(b) y = f (x) = x3 - 3x + 2 and x changes from 4 to 6.(c) y = f (x) = 5x2 - 7x + 1 and x changes from 5 to 4.
3. Find the value of the differential dx when x = 3, y = 3(2x - 3)3 and dy = 2.
4. The weekly cost of producing x items is C = 5x + 100 dollars and the demand equation isp = -0.01x + 8, where p is the price in dollars. The factory is currently producing 120 itemsweekly. Use differentials to estimate the change in cost, revenue and profit if production wereincreased to 125 items weekly.
5. The side of a square is measured to be 4.23 inches long. Find the area and(a) Estimate the possible error in the area if the length of side has a possible error of 0.04 inches.(b) Estimate the possible error in the length of the side if the area might be in error by 0.09 in.2.
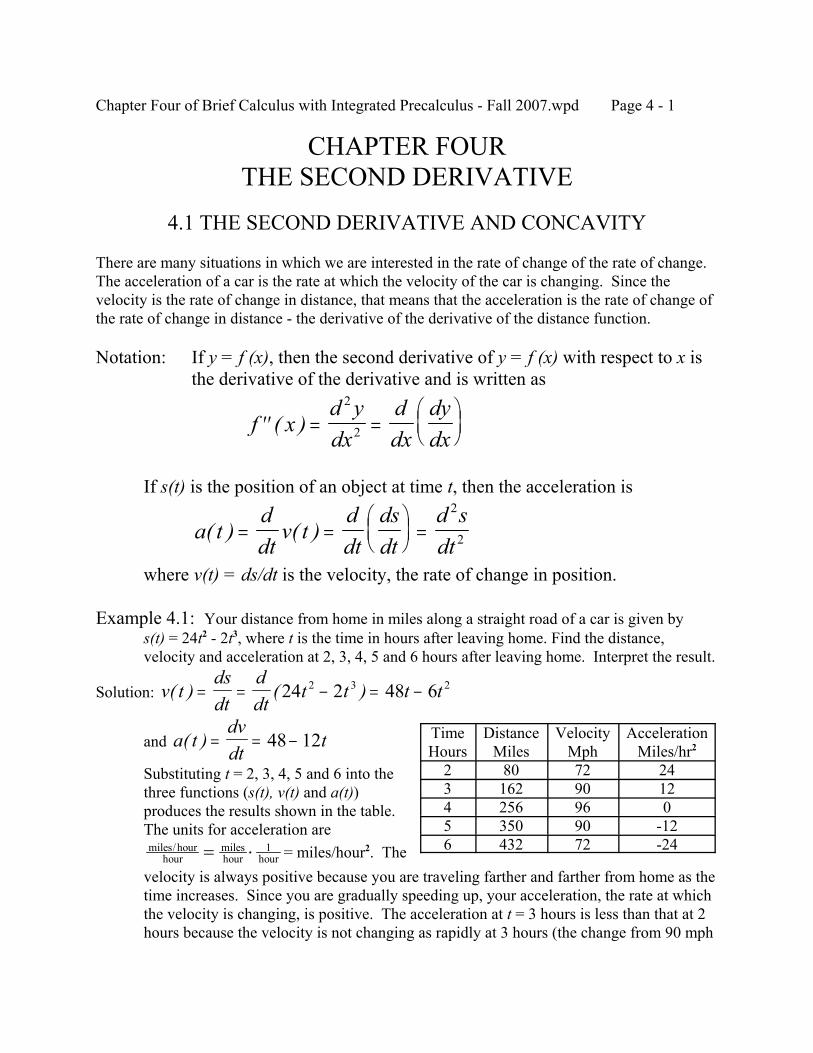
Chapter Four of Brief Calculus with Integrated Precalculus - Fall 2007.wpd Page 4 - 1
CHAPTER FOURTHE SECOND DERIVATIVE
4.1 THE SECOND DERIVATIVE AND CONCAVITY
There are many situations in which we are interested in the rate of change of the rate of change. The acceleration of a car is the rate at which the velocity of the car is changing. Since thevelocity is the rate of change in distance, that means that the acceleration is the rate of change ofthe rate of change in distance - the derivative of the derivative of the distance function.
Notation: If y = f (x), then the second derivative of y = f (x) with respect to x isthe derivative of the derivative and is written as
′′ = =
f x
d ydx
ddx
dydx
( )2
2
If s(t) is the position of an object at time t, then the acceleration is
a tddt
v tddt
dsdt
d sdt
( ) ( )= =
=
2
2
where v(t) = ds/dt is the velocity, the rate of change in position.
Example 4.1: Your distance from home in miles along a straight road of a car is given bys(t) = 24t2 - 2t3, where t is the time in hours after leaving home. Find the distance,velocity and acceleration at 2, 3, 4, 5 and 6 hours after leaving home. Interpret the result.
Solution: v tdsdt
ddt
t t t t( ) ( )= = − = −24 2 48 62 3 2
and a tdvdt
t( ) = = −48 12
Substituting t = 2, 3, 4, 5 and 6 into thethree functions (s(t), v(t) and a(t))produces the results shown in the table. The units for acceleration are
= miles/hour2. Themiles/hourhour
mileshour hour= ⋅ 1
velocity is always positive because you are traveling farther and farther from home as thetime increases. Since you are gradually speeding up, your acceleration, the rate at whichthe velocity is changing, is positive. The acceleration at t = 3 hours is less than that at 2hours because the velocity is not changing as rapidly at 3 hours (the change from 90 mph
TimeHours
DistanceMiles
VelocityMph
AccelerationMiles/hr2
2 80 72 243 162 90 124 256 96 05 350 90 -126 432 72 -24
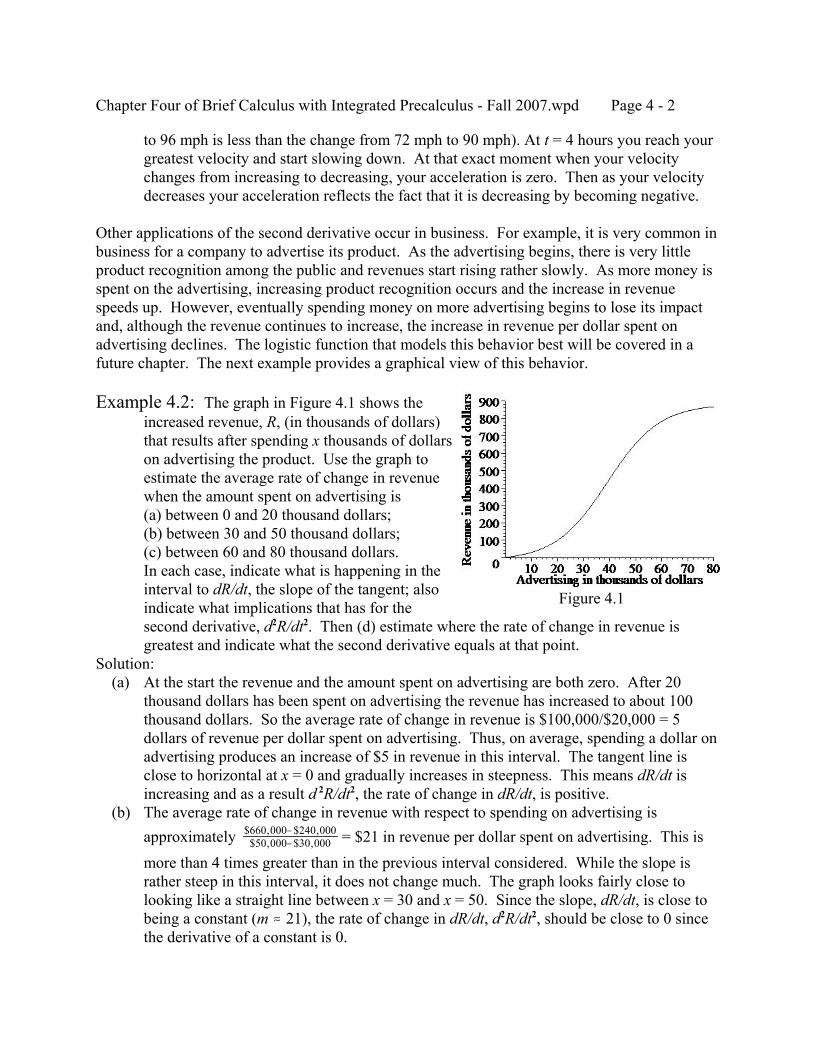
Chapter Four of Brief Calculus with Integrated Precalculus - Fall 2007.wpd Page 4 - 2
Figure 4.1
to 96 mph is less than the change from 72 mph to 90 mph). At t = 4 hours you reach yourgreatest velocity and start slowing down. At that exact moment when your velocitychanges from increasing to decreasing, your acceleration is zero. Then as your velocitydecreases your acceleration reflects the fact that it is decreasing by becoming negative.
Other applications of the second derivative occur in business. For example, it is very common inbusiness for a company to advertise its product. As the advertising begins, there is very littleproduct recognition among the public and revenues start rising rather slowly. As more money isspent on the advertising, increasing product recognition occurs and the increase in revenuespeeds up. However, eventually spending money on more advertising begins to lose its impactand, although the revenue continues to increase, the increase in revenue per dollar spent onadvertising declines. The logistic function that models this behavior best will be covered in afuture chapter. The next example provides a graphical view of this behavior.
Example 4.2: The graph in Figure 4.1 shows theincreased revenue, R, (in thousands of dollars)that results after spending x thousands of dollarson advertising the product. Use the graph toestimate the average rate of change in revenuewhen the amount spent on advertising is(a) between 0 and 20 thousand dollars;(b) between 30 and 50 thousand dollars;(c) between 60 and 80 thousand dollars.In each case, indicate what is happening in theinterval to dR/dt, the slope of the tangent; alsoindicate what implications that has for thesecond derivative, d2R/dt2. Then (d) estimate where the rate of change in revenue isgreatest and indicate what the second derivative equals at that point.
Solution: (a) At the start the revenue and the amount spent on advertising are both zero. After 20
thousand dollars has been spent on advertising the revenue has increased to about 100thousand dollars. So the average rate of change in revenue is $100,000/$20,000 = 5dollars of revenue per dollar spent on advertising. Thus, on average, spending a dollar onadvertising produces an increase of $5 in revenue in this interval. The tangent line isclose to horizontal at x = 0 and gradually increases in steepness. This means dR/dt isincreasing and as a result d 2R/dt2, the rate of change in dR/dt, is positive.
(b) The average rate of change in revenue with respect to spending on advertising isapproximately = $21 in revenue per dollar spent on advertising. This is$660, $240,
$50, $30,000 000000 000
−−
more than 4 times greater than in the previous interval considered. While the slope israther steep in this interval, it does not change much. The graph looks fairly close tolooking like a straight line between x = 30 and x = 50. Since the slope, dR/dt, is close tobeing a constant (m . 21), the rate of change in dR/dt, d2R/dt2, should be close to 0 sincethe derivative of a constant is 0.
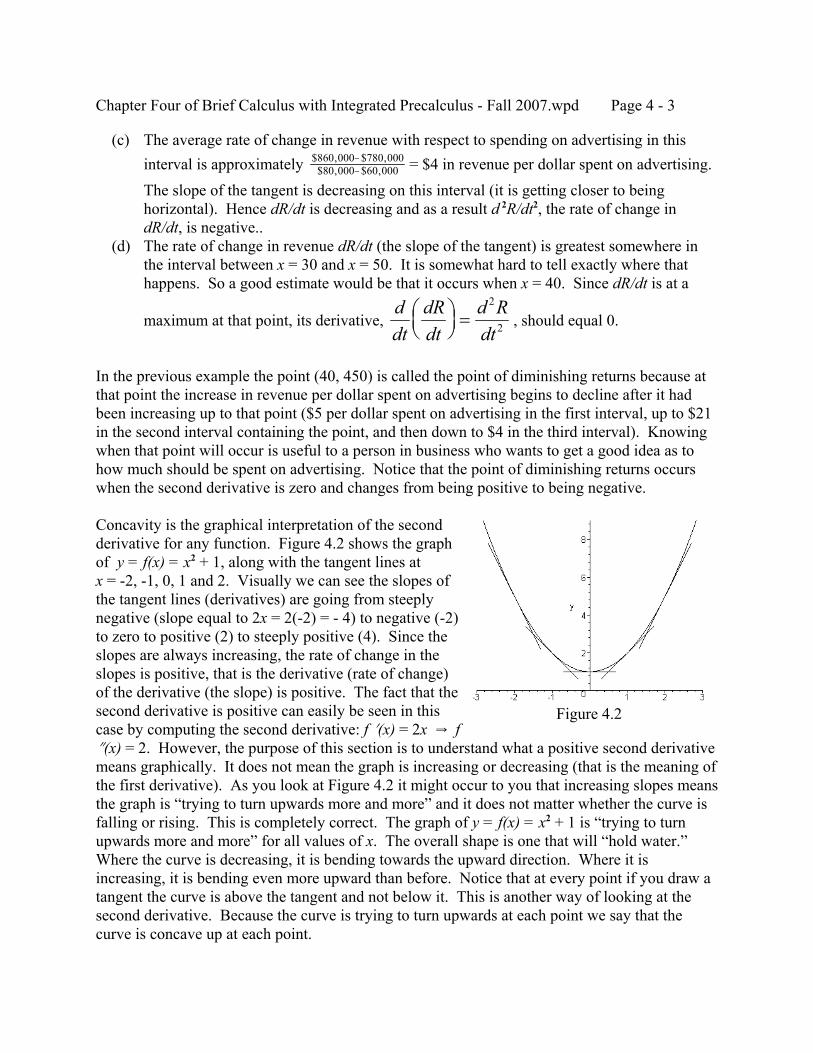
Chapter Four of Brief Calculus with Integrated Precalculus - Fall 2007.wpd Page 4 - 3
Figure 4.2
(c) The average rate of change in revenue with respect to spending on advertising in thisinterval is approximately = $4 in revenue per dollar spent on advertising. $860, $780,
$80, $60,000 000000 000
−−
The slope of the tangent is decreasing on this interval (it is getting closer to beinghorizontal). Hence dR/dt is decreasing and as a result d 2R/dt2, the rate of change indR/dt, is negative..
(d) The rate of change in revenue dR/dt (the slope of the tangent) is greatest somewhere inthe interval between x = 30 and x = 50. It is somewhat hard to tell exactly where thathappens. So a good estimate would be that it occurs when x = 40. Since dR/dt is at a
maximum at that point, its derivative, , should equal 0.ddt
dRdt
d Rdt
=
2
2
In the previous example the point (40, 450) is called the point of diminishing returns because atthat point the increase in revenue per dollar spent on advertising begins to decline after it hadbeen increasing up to that point ($5 per dollar spent on advertising in the first interval, up to $21in the second interval containing the point, and then down to $4 in the third interval). Knowingwhen that point will occur is useful to a person in business who wants to get a good idea as tohow much should be spent on advertising. Notice that the point of diminishing returns occurswhen the second derivative is zero and changes from being positive to being negative.
Concavity is the graphical interpretation of the secondderivative for any function. Figure 4.2 shows the graphof y = f(x) = x2 + 1, along with the tangent lines atx = -2, -1, 0, 1 and 2. Visually we can see the slopes ofthe tangent lines (derivatives) are going from steeplynegative (slope equal to 2x = 2(-2) = - 4) to negative (-2)to zero to positive (2) to steeply positive (4). Since theslopes are always increasing, the rate of change in theslopes is positive, that is the derivative (rate of change)of the derivative (the slope) is positive. The fact that thesecond derivative is positive can easily be seen in thiscase by computing the second derivative: f N(x) = 2x Y fO(x) = 2. However, the purpose of this section is to understand what a positive second derivativemeans graphically. It does not mean the graph is increasing or decreasing (that is the meaning ofthe first derivative). As you look at Figure 4.2 it might occur to you that increasing slopes meansthe graph is “trying to turn upwards more and more” and it does not matter whether the curve isfalling or rising. This is completely correct. The graph of y = f(x) = x2 + 1 is “trying to turnupwards more and more” for all values of x. The overall shape is one that will “hold water.” Where the curve is decreasing, it is bending towards the upward direction. Where it isincreasing, it is bending even more upward than before. Notice that at every point if you draw atangent the curve is above the tangent and not below it. This is another way of looking at thesecond derivative. Because the curve is trying to turn upwards at each point we say that thecurve is concave up at each point.
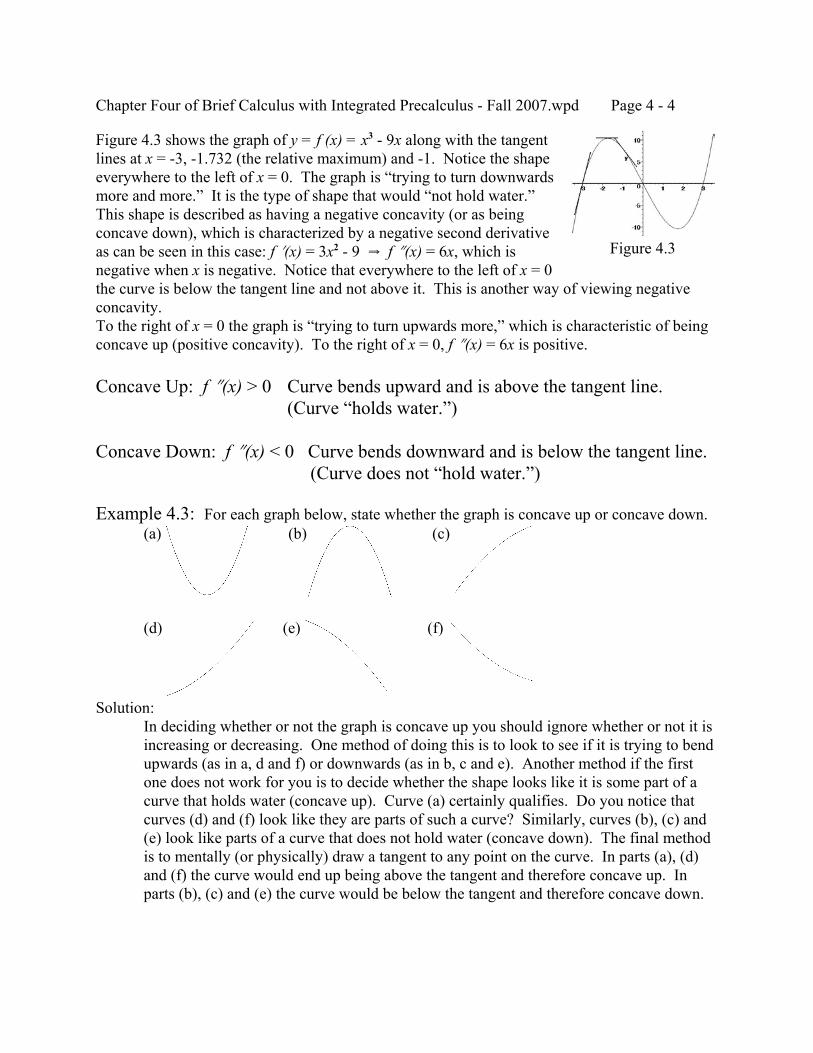
Chapter Four of Brief Calculus with Integrated Precalculus - Fall 2007.wpd Page 4 - 4
Figure 4.3
Figure 4.3 shows the graph of y = f (x) = x3 - 9x along with the tangentlines at x = -3, -1.732 (the relative maximum) and -1. Notice the shapeeverywhere to the left of x = 0. The graph is “trying to turn downwardsmore and more.” It is the type of shape that would “not hold water.” This shape is described as having a negative concavity (or as beingconcave down), which is characterized by a negative second derivativeas can be seen in this case: f N(x) = 3x2 - 9 Y f O(x) = 6x, which isnegative when x is negative. Notice that everywhere to the left of x = 0the curve is below the tangent line and not above it. This is another way of viewing negativeconcavity.To the right of x = 0 the graph is “trying to turn upwards more,” which is characteristic of beingconcave up (positive concavity). To the right of x = 0, f O(x) = 6x is positive.
Concave Up: f O(x) > 0 Curve bends upward and is above the tangent line.(Curve “holds water.”)
Concave Down: f O(x) < 0 Curve bends downward and is below the tangent line. (Curve does not “hold water.”)
Example 4.3: For each graph below, state whether the graph is concave up or concave down.(a) (b) (c)
(d) (e) (f)
Solution:In deciding whether or not the graph is concave up you should ignore whether or not it isincreasing or decreasing. One method of doing this is to look to see if it is trying to bendupwards (as in a, d and f) or downwards (as in b, c and e). Another method if the firstone does not work for you is to decide whether the shape looks like it is some part of acurve that holds water (concave up). Curve (a) certainly qualifies. Do you notice thatcurves (d) and (f) look like they are parts of such a curve? Similarly, curves (b), (c) and(e) look like parts of a curve that does not hold water (concave down). The final methodis to mentally (or physically) draw a tangent to any point on the curve. In parts (a), (d)and (f) the curve would end up being above the tangent and therefore concave up. Inparts (b), (c) and (e) the curve would be below the tangent and therefore concave down.
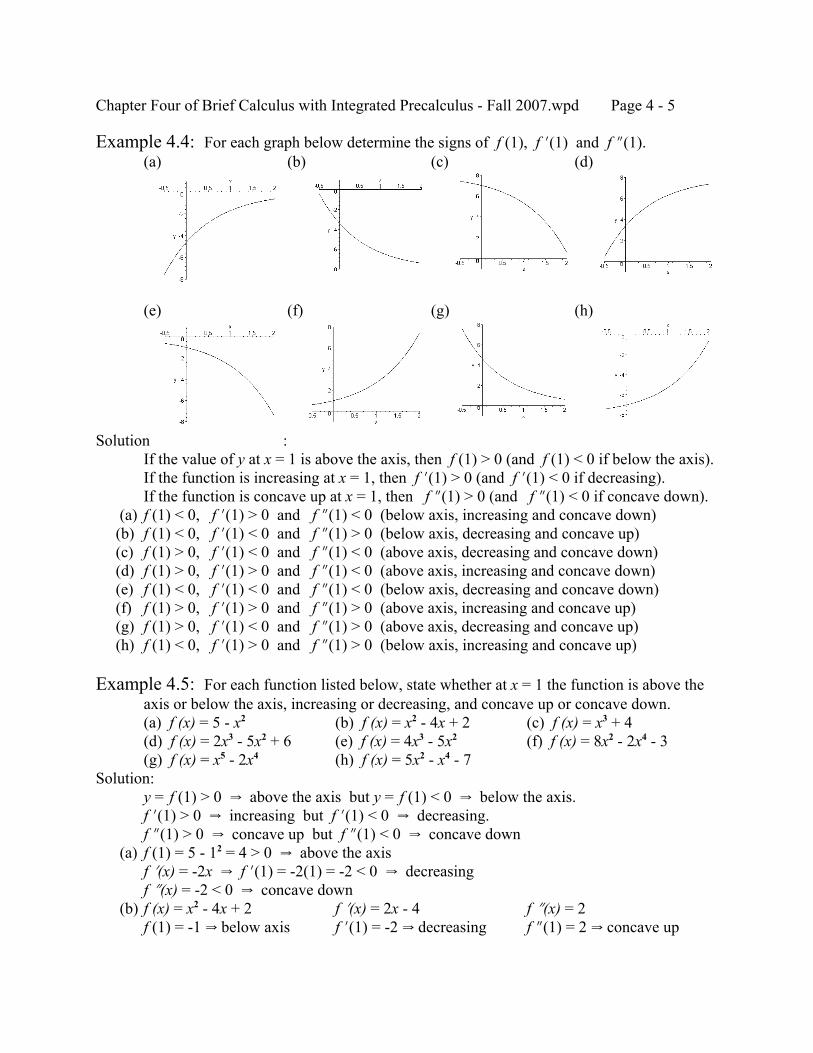
Chapter Four of Brief Calculus with Integrated Precalculus - Fall 2007.wpd Page 4 - 5
Example 4.4: For each graph below determine the signs of f (1), f N(1) and f O(1).(a) (b) (c) (d)
(e) (f) (g) (h)
Solution :If the value of y at x = 1 is above the axis, then f (1) > 0 (and f (1) < 0 if below the axis).If the function is increasing at x = 1, then f N(1) > 0 (and f N(1) < 0 if decreasing).If the function is concave up at x = 1, then f O(1) > 0 (and f O(1) < 0 if concave down).
(a) f (1) < 0, f N(1) > 0 and f O(1) < 0 (below axis, increasing and concave down) (b) f (1) < 0, f N(1) < 0 and f O(1) > 0 (below axis, decreasing and concave up) (c) f (1) > 0, f N(1) < 0 and f O(1) < 0 (above axis, decreasing and concave down) (d) f (1) > 0, f N(1) > 0 and f O(1) < 0 (above axis, increasing and concave down) (e) f (1) < 0, f N(1) < 0 and f O(1) < 0 (below axis, decreasing and concave down) (f) f (1) > 0, f N(1) > 0 and f O(1) > 0 (above axis, increasing and concave up) (g) f (1) > 0, f N(1) < 0 and f O(1) > 0 (above axis, decreasing and concave up) (h) f (1) < 0, f N(1) > 0 and f O(1) > 0 (below axis, increasing and concave up)
Example 4.5: For each function listed below, state whether at x = 1 the function is above theaxis or below the axis, increasing or decreasing, and concave up or concave down.(a) f (x) = 5 - x2 (b) f (x) = x2 - 4x + 2 (c) f (x) = x3 + 4(d) f (x) = 2x3 - 5x2 + 6 (e) f (x) = 4x3 - 5x2 (f) f (x) = 8x2 - 2x4 - 3(g) f (x) = x5 - 2x4 (h) f (x) = 5x2 - x4 - 7
Solution:y = f (1) > 0 Y above the axis but y = f (1) < 0 Y below the axis.f N(1) > 0 Y increasing but f N(1) < 0 Y decreasing.f O(1) > 0 Y concave up but f O(1) < 0 Y concave down
(a) f (1) = 5 - 12 = 4 > 0 Y above the axisf N(x) = -2x Y f N(1) = -2(1) = -2 < 0 Y decreasingf O(x) = -2 < 0 Y concave down
(b) f (x) = x2 - 4x + 2 f N(x) = 2x - 4 f O(x) = 2f (1) = -1 Y below axis f N(1) = -2 Y decreasing f O(1) = 2 Y concave up
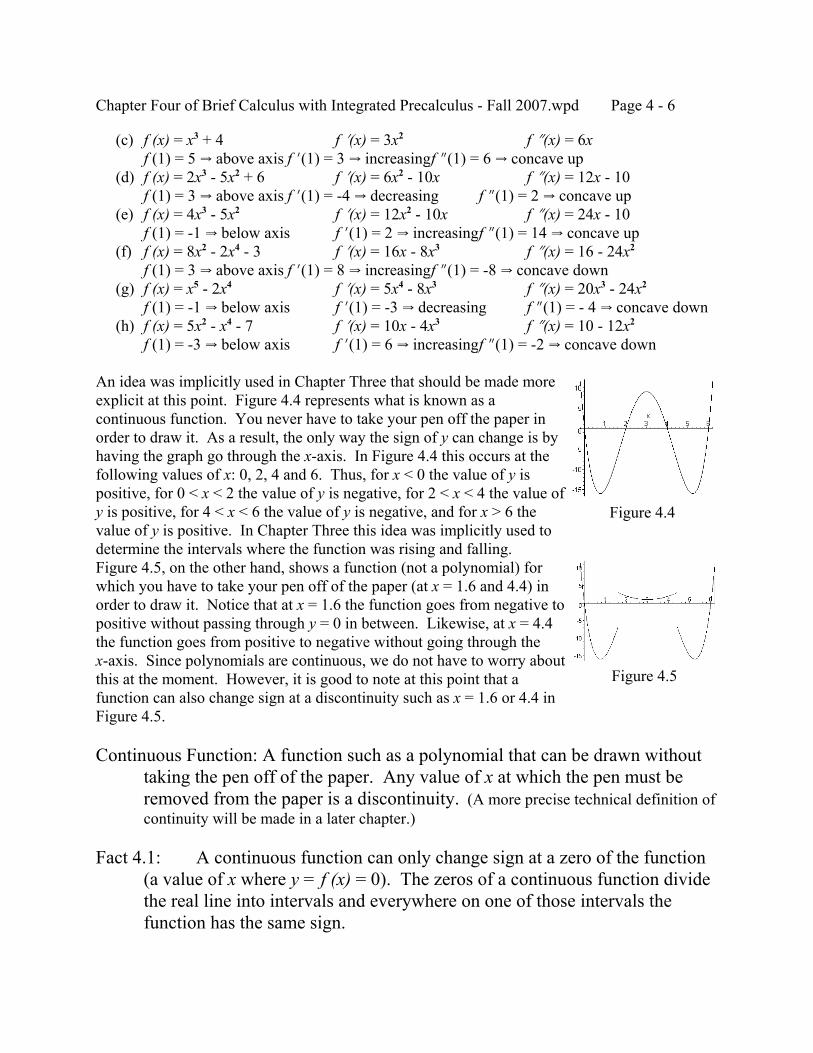
Chapter Four of Brief Calculus with Integrated Precalculus - Fall 2007.wpd Page 4 - 6
Figure 4.4
Figure 4.5
(c) f (x) = x3 + 4 f N(x) = 3x2 f O(x) = 6xf (1) = 5 Y above axis f N(1) = 3 Y increasingf O(1) = 6 Y concave up
(d) f (x) = 2x3 - 5x2 + 6 f N(x) = 6x2 - 10x f O(x) = 12x - 10f (1) = 3 Y above axis f N(1) = -4 Y decreasing f O(1) = 2 Y concave up
(e) f (x) = 4x3 - 5x2 f N(x) = 12x2 - 10x f O(x) = 24x - 10f (1) = -1 Y below axis f N(1) = 2 Y increasingf O(1) = 14 Y concave up
(f) f (x) = 8x2 - 2x4 - 3 f N(x) = 16x - 8x3 f O(x) = 16 - 24x2
f (1) = 3 Y above axis f N(1) = 8 Y increasingf O(1) = -8 Y concave down (g) f (x) = x5 - 2x4 f N(x) = 5x4 - 8x3 f O(x) = 20x3 - 24x2
f (1) = -1 Y below axis f N(1) = -3 Y decreasing f O(1) = - 4 Y concave down (h) f (x) = 5x2 - x4 - 7 f N(x) = 10x - 4x3 f O(x) = 10 - 12x2
f (1) = -3 Y below axis f N(1) = 6 Y increasingf O(1) = -2 Y concave down
An idea was implicitly used in Chapter Three that should be made moreexplicit at this point. Figure 4.4 represents what is known as acontinuous function. You never have to take your pen off the paper inorder to draw it. As a result, the only way the sign of y can change is byhaving the graph go through the x-axis. In Figure 4.4 this occurs at thefollowing values of x: 0, 2, 4 and 6. Thus, for x < 0 the value of y ispositive, for 0 < x < 2 the value of y is negative, for 2 < x < 4 the value ofy is positive, for 4 < x < 6 the value of y is negative, and for x > 6 thevalue of y is positive. In Chapter Three this idea was implicitly used todetermine the intervals where the function was rising and falling.Figure 4.5, on the other hand, shows a function (not a polynomial) forwhich you have to take your pen off of the paper (at x = 1.6 and 4.4) inorder to draw it. Notice that at x = 1.6 the function goes from negative topositive without passing through y = 0 in between. Likewise, at x = 4.4the function goes from positive to negative without going through the x-axis. Since polynomials are continuous, we do not have to worry aboutthis at the moment. However, it is good to note at this point that afunction can also change sign at a discontinuity such as x = 1.6 or 4.4 inFigure 4.5.
Continuous Function: A function such as a polynomial that can be drawn withouttaking the pen off of the paper. Any value of x at which the pen must beremoved from the paper is a discontinuity. (A more precise technical definition ofcontinuity will be made in a later chapter.)
Fact 4.1: A continuous function can only change sign at a zero of the function(a value of x where y = f (x) = 0). The zeros of a continuous function dividethe real line into intervals and everywhere on one of those intervals thefunction has the same sign.
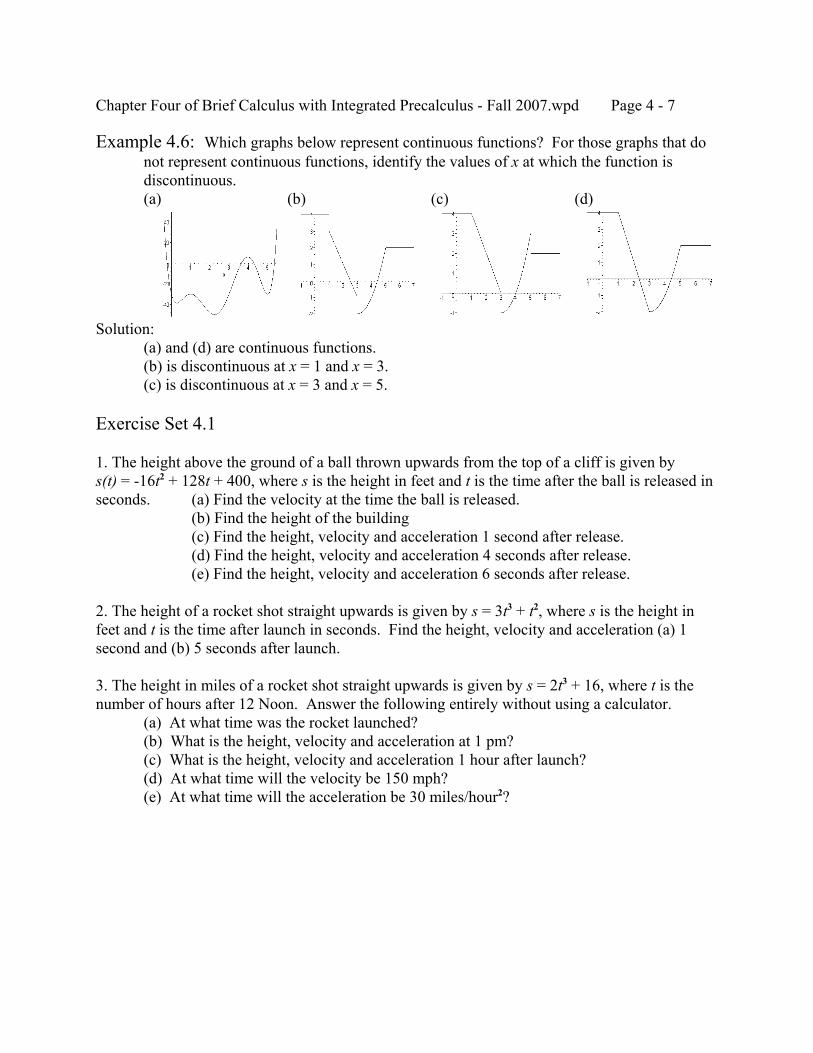
Chapter Four of Brief Calculus with Integrated Precalculus - Fall 2007.wpd Page 4 - 7
Example 4.6: Which graphs below represent continuous functions? For those graphs that donot represent continuous functions, identify the values of x at which the function isdiscontinuous.(a) (b) (c) (d)
Solution:(a) and (d) are continuous functions.(b) is discontinuous at x = 1 and x = 3.(c) is discontinuous at x = 3 and x = 5.
Exercise Set 4.1
1. The height above the ground of a ball thrown upwards from the top of a cliff is given bys(t) = -16t2 + 128t + 400, where s is the height in feet and t is the time after the ball is released inseconds. (a) Find the velocity at the time the ball is released.
(b) Find the height of the building(c) Find the height, velocity and acceleration 1 second after release.(d) Find the height, velocity and acceleration 4 seconds after release.(e) Find the height, velocity and acceleration 6 seconds after release.
2. The height of a rocket shot straight upwards is given by s = 3t3 + t2, where s is the height infeet and t is the time after launch in seconds. Find the height, velocity and acceleration (a) 1second and (b) 5 seconds after launch.
3. The height in miles of a rocket shot straight upwards is given by s = 2t3 + 16, where t is thenumber of hours after 12 Noon. Answer the following entirely without using a calculator.
(a) At what time was the rocket launched?(b) What is the height, velocity and acceleration at 1 pm?(c) What is the height, velocity and acceleration 1 hour after launch?(d) At what time will the velocity be 150 mph?(e) At what time will the acceleration be 30 miles/hour2?
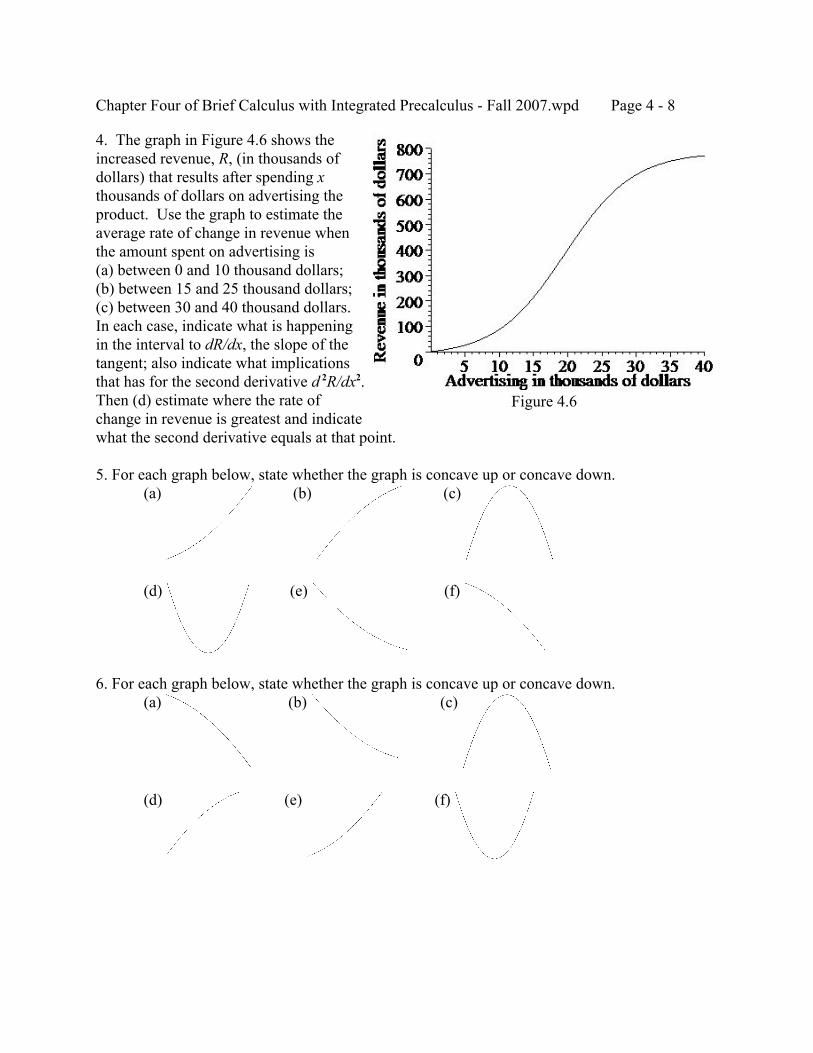
Chapter Four of Brief Calculus with Integrated Precalculus - Fall 2007.wpd Page 4 - 8
Figure 4.6
4. The graph in Figure 4.6 shows theincreased revenue, R, (in thousands ofdollars) that results after spending xthousands of dollars on advertising theproduct. Use the graph to estimate theaverage rate of change in revenue whenthe amount spent on advertising is(a) between 0 and 10 thousand dollars;(b) between 15 and 25 thousand dollars;(c) between 30 and 40 thousand dollars.In each case, indicate what is happeningin the interval to dR/dx, the slope of thetangent; also indicate what implicationsthat has for the second derivative d 2R/dx2. Then (d) estimate where the rate ofchange in revenue is greatest and indicatewhat the second derivative equals at that point.
5. For each graph below, state whether the graph is concave up or concave down.(a) (b) (c)
(d) (e) (f)
6. For each graph below, state whether the graph is concave up or concave down.(a) (b) (c)
(d) (e) (f)
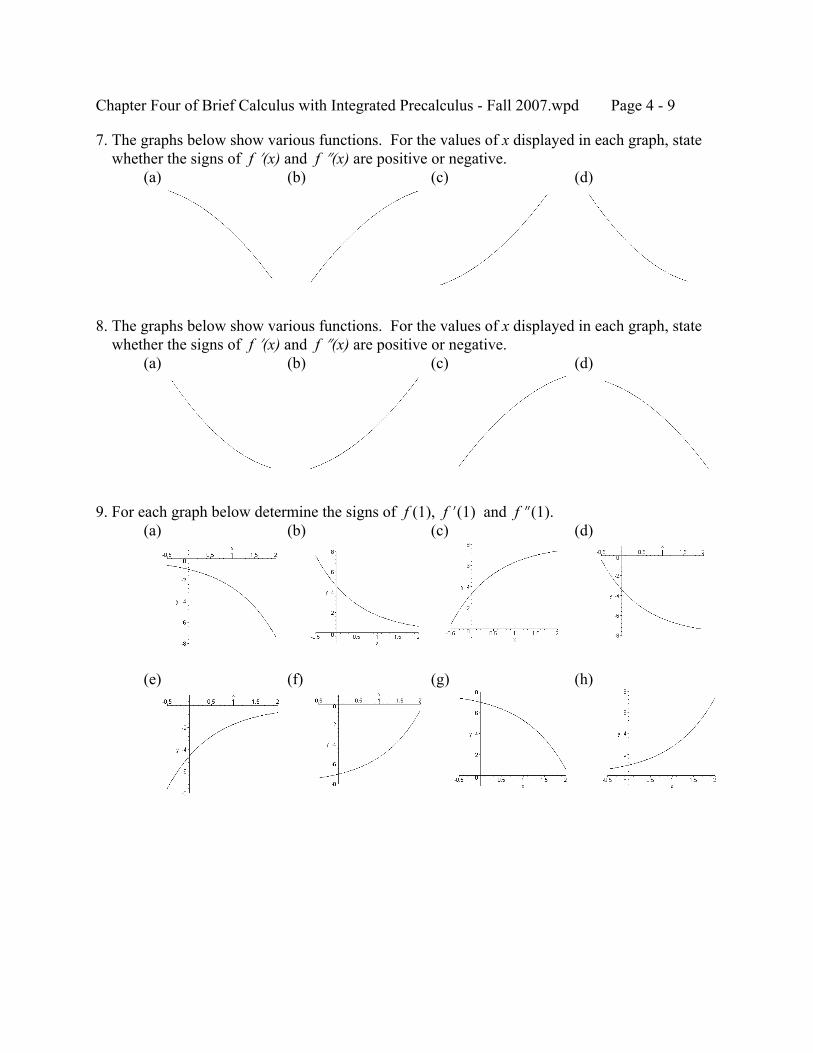
Chapter Four of Brief Calculus with Integrated Precalculus - Fall 2007.wpd Page 4 - 9
7. The graphs below show various functions. For the values of x displayed in each graph, state whether the signs of f N(x) and f O(x) are positive or negative.
(a) (b) (c) (d)
8. The graphs below show various functions. For the values of x displayed in each graph, state whether the signs of f N(x) and f O(x) are positive or negative.
(a) (b) (c) (d)
9. For each graph below determine the signs of f (1), f N(1) and f O(1).(a) (b) (c) (d)
(e) (f) (g) (h)
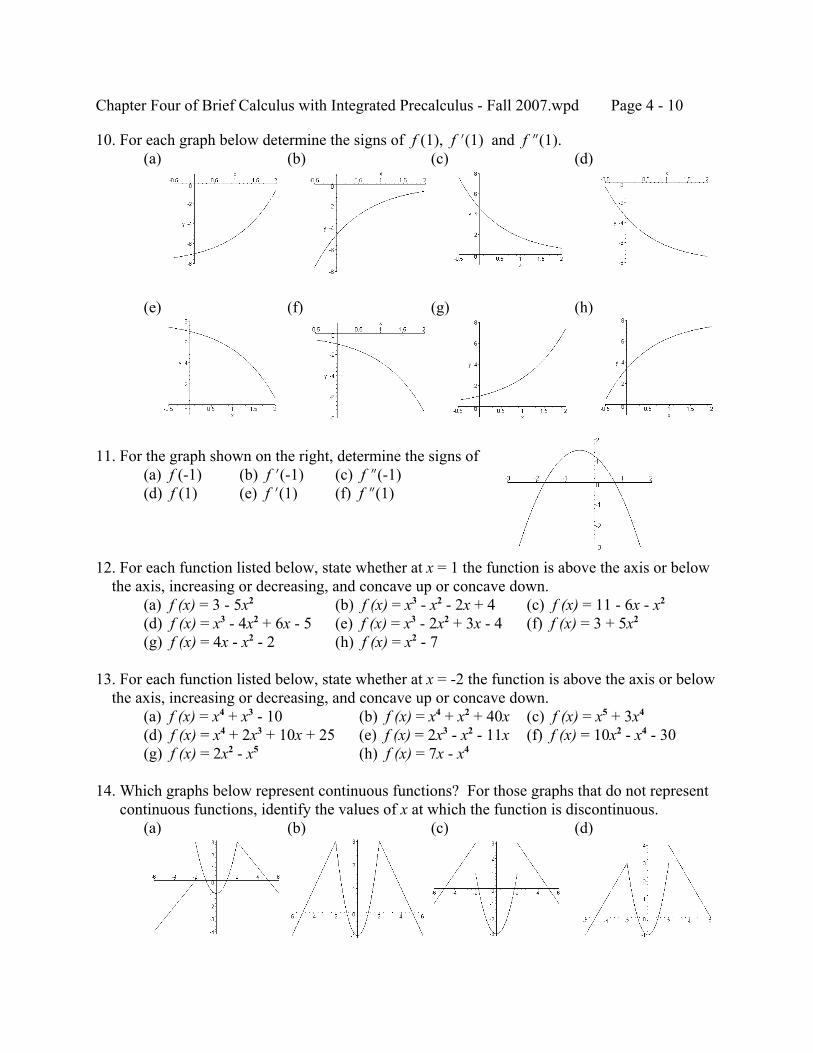
Chapter Four of Brief Calculus with Integrated Precalculus - Fall 2007.wpd Page 4 - 10
10. For each graph below determine the signs of f (1), f N(1) and f O(1).(a) (b) (c) (d)
(e) (f) (g) (h)
11. For the graph shown on the right, determine the signs of (a) f (-1) (b) f N(-1) (c) f O(-1)(d) f (1) (e) f N(1) (f) f O(1)
12. For each function listed below, state whether at x = 1 the function is above the axis or below the axis, increasing or decreasing, and concave up or concave down.
(a) f (x) = 3 - 5x2 (b) f (x) = x3 - x2 - 2x + 4 (c) f (x) = 11 - 6x - x2
(d) f (x) = x3 - 4x2 + 6x - 5 (e) f (x) = x3 - 2x2 + 3x - 4 (f) f (x) = 3 + 5x2
(g) f (x) = 4x - x2 - 2 (h) f (x) = x2 - 7
13. For each function listed below, state whether at x = -2 the function is above the axis or below the axis, increasing or decreasing, and concave up or concave down.
(a) f (x) = x4 + x3 - 10 (b) f (x) = x4 + x2 + 40x (c) f (x) = x5 + 3x4
(d) f (x) = x4 + 2x3 + 10x + 25 (e) f (x) = 2x3 - x2 - 11x (f) f (x) = 10x2 - x4 - 30(g) f (x) = 2x2 - x5 (h) f (x) = 7x - x4
14. Which graphs below represent continuous functions? For those graphs that do not represent continuous functions, identify the values of x at which the function is discontinuous.
(a) (b) (c) (d)
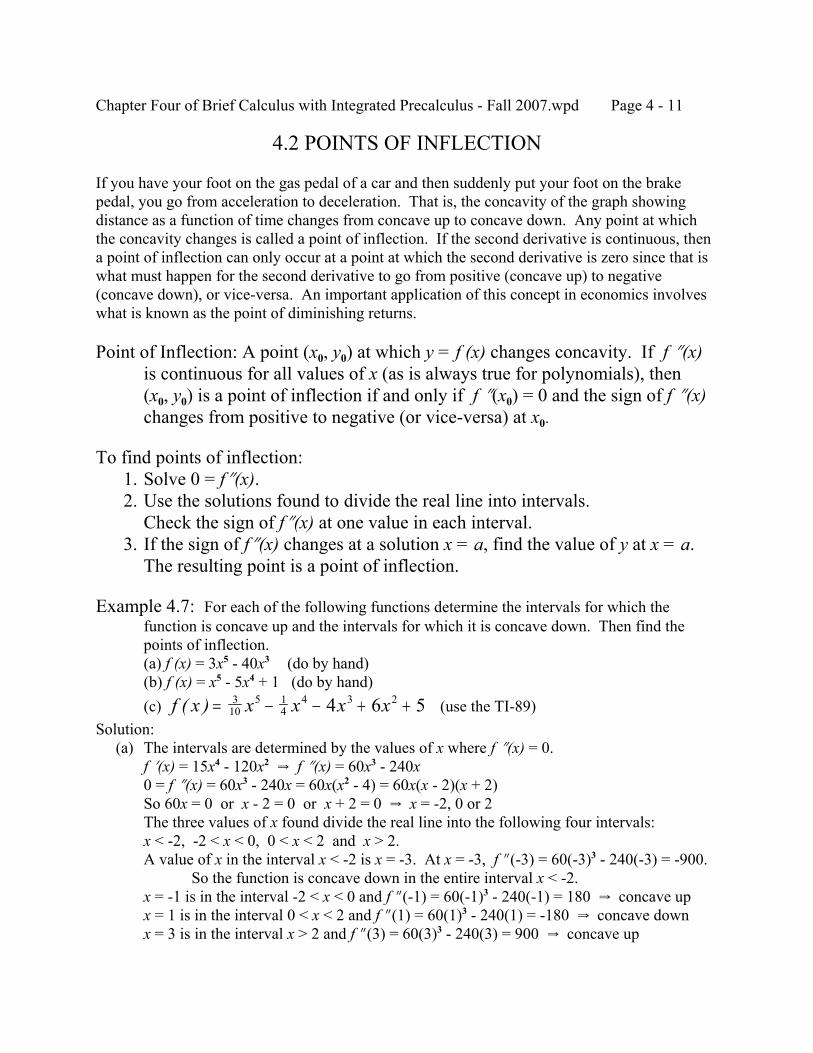
Chapter Four of Brief Calculus with Integrated Precalculus - Fall 2007.wpd Page 4 - 11
4.2 POINTS OF INFLECTION
If you have your foot on the gas pedal of a car and then suddenly put your foot on the brakepedal, you go from acceleration to deceleration. That is, the concavity of the graph showingdistance as a function of time changes from concave up to concave down. Any point at whichthe concavity changes is called a point of inflection. If the second derivative is continuous, thena point of inflection can only occur at a point at which the second derivative is zero since that iswhat must happen for the second derivative to go from positive (concave up) to negative(concave down), or vice-versa. An important application of this concept in economics involveswhat is known as the point of diminishing returns.
Point of Inflection: A point (x0, y0) at which y = f (x) changes concavity. If f O(x)is continuous for all values of x (as is always true for polynomials), then(x0, y0) is a point of inflection if and only if f O(x0) = 0 and the sign of f O(x)changes from positive to negative (or vice-versa) at x0.
To find points of inflection: 1. Solve 0 = fO(x). 2. Use the solutions found to divide the real line into intervals.
Check the sign of fO(x) at one value in each interval. 3. If the sign of fO(x) changes at a solution x = a, find the value of y at x = a.
The resulting point is a point of inflection.
Example 4.7: For each of the following functions determine the intervals for which thefunction is concave up and the intervals for which it is concave down. Then find thepoints of inflection.(a) f (x) = 3x5 - 40x3 (do by hand)(b) f (x) = x5 - 5x4 + 1 (do by hand)(c) (use the TI-89)f x x x x x( ) = − − + +3
105 1
44 3 24 6 5
Solution: (a) The intervals are determined by the values of x where f O(x) = 0.
f N(x) = 15x4 - 120x2 Y f O(x) = 60x3 - 240x0 = f O(x) = 60x3 - 240x = 60x(x2 - 4) = 60x(x - 2)(x + 2)So 60x = 0 or x - 2 = 0 or x + 2 = 0 Y x = -2, 0 or 2The three values of x found divide the real line into the following four intervals:x < -2, -2 < x < 0, 0 < x < 2 and x > 2.A value of x in the interval x < -2 is x = -3. At x = -3, f O(-3) = 60(-3)3 - 240(-3) = -900.
So the function is concave down in the entire interval x < -2.x = -1 is in the interval -2 < x < 0 and f O(-1) = 60(-1)3 - 240(-1) = 180 Y concave upx = 1 is in the interval 0 < x < 2 and f O(1) = 60(1)3 - 240(1) = -180 Y concave downx = 3 is in the interval x > 2 and f O(3) = 60(3)3 - 240(3) = 900 Y concave up
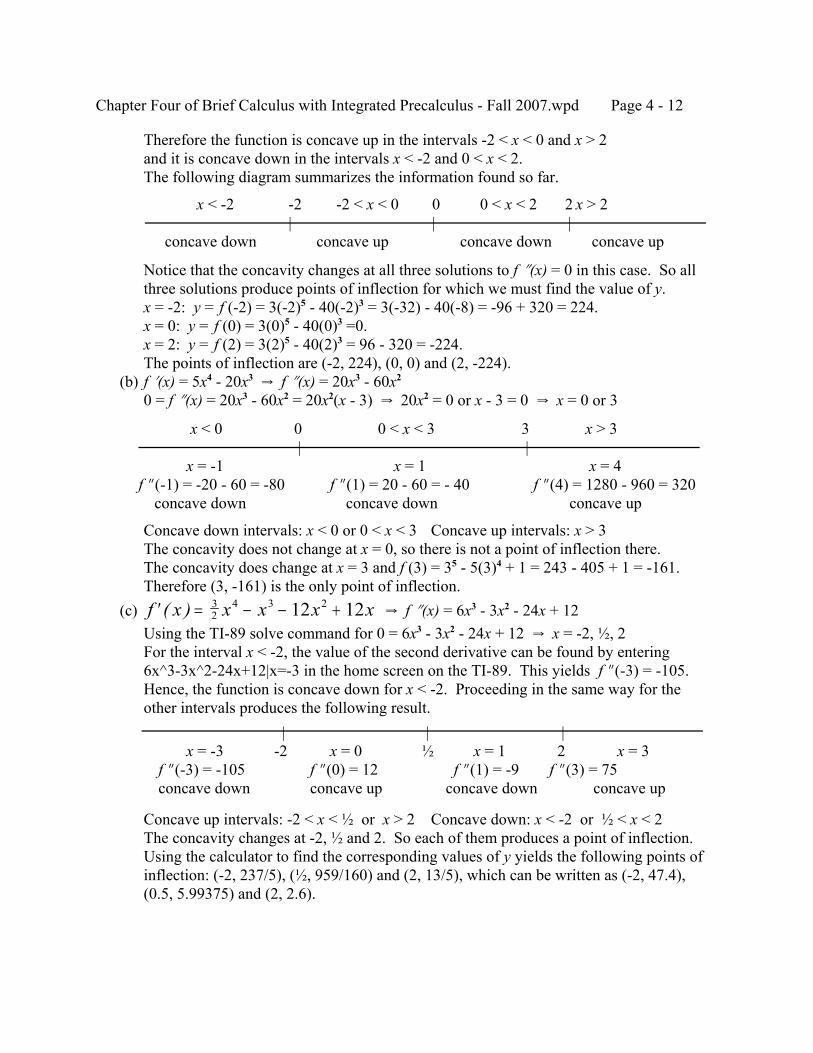
Chapter Four of Brief Calculus with Integrated Precalculus - Fall 2007.wpd Page 4 - 12
Therefore the function is concave up in the intervals -2 < x < 0 and x > 2and it is concave down in the intervals x < -2 and 0 < x < 2.The following diagram summarizes the information found so far.
Notice that the concavity changes at all three solutions to f O(x) = 0 in this case. So allthree solutions produce points of inflection for which we must find the value of y.x = -2: y = f (-2) = 3(-2)5 - 40(-2)3 = 3(-32) - 40(-8) = -96 + 320 = 224.x = 0: y = f (0) = 3(0)5 - 40(0)3 =0.x = 2: y = f (2) = 3(2)5 - 40(2)3 = 96 - 320 = -224.The points of inflection are (-2, 224), (0, 0) and (2, -224).
(b) f N(x) = 5x4 - 20x3 Y f O(x) = 20x3 - 60x2
0 = f O(x) = 20x3 - 60x2 = 20x2(x - 3) Y 20x2 = 0 or x - 3 = 0 Y x = 0 or 3
Concave down intervals: x < 0 or 0 < x < 3 Concave up intervals: x > 3The concavity does not change at x = 0, so there is not a point of inflection there.The concavity does change at x = 3 and f (3) = 35 - 5(3)4 + 1 = 243 - 405 + 1 = -161.Therefore (3, -161) is the only point of inflection.
(c) Y f O(x) = 6x3 - 3x2 - 24x + 12′ = − − +f x x x x x( ) 32
4 3 212 12Using the TI-89 solve command for 0 = 6x3 - 3x2 - 24x + 12 Y x = -2, ½, 2For the interval x < -2, the value of the second derivative can be found by entering6x^3-3x^2-24x+12|x=-3 in the home screen on the TI-89. This yields f O(-3) = -105.Hence, the function is concave down for x < -2. Proceeding in the same way for theother intervals produces the following result.
Concave up intervals: -2 < x < ½ or x > 2 Concave down: x < -2 or ½ < x < 2The concavity changes at -2, ½ and 2. So each of them produces a point of inflection.Using the calculator to find the corresponding values of y yields the following points ofinflection: (-2, 237/5), (½, 959/160) and (2, 13/5), which can be written as (-2, 47.4),(0.5, 5.99375) and (2, 2.6).
x < -2 -2 -2 < x < 0 0 0 < x < 2 2 x > 2| | |
concave down concave up concave down concave up
x < 0 0 0 < x < 3 3 x > 3 | |
x = -1 x = 1 x = 4f O(-1) = -20 - 60 = -80 f O(1) = 20 - 60 = - 40 f O(4) = 1280 - 960 = 320 concave down concave down concave up
| | |x = -3 -2 x = 0 ½ x = 1 2 x = 3
f O(-3) = -105 f O(0) = 12 f O(1) = -9 f O(3) = 75 concave down concave up concave down concave up
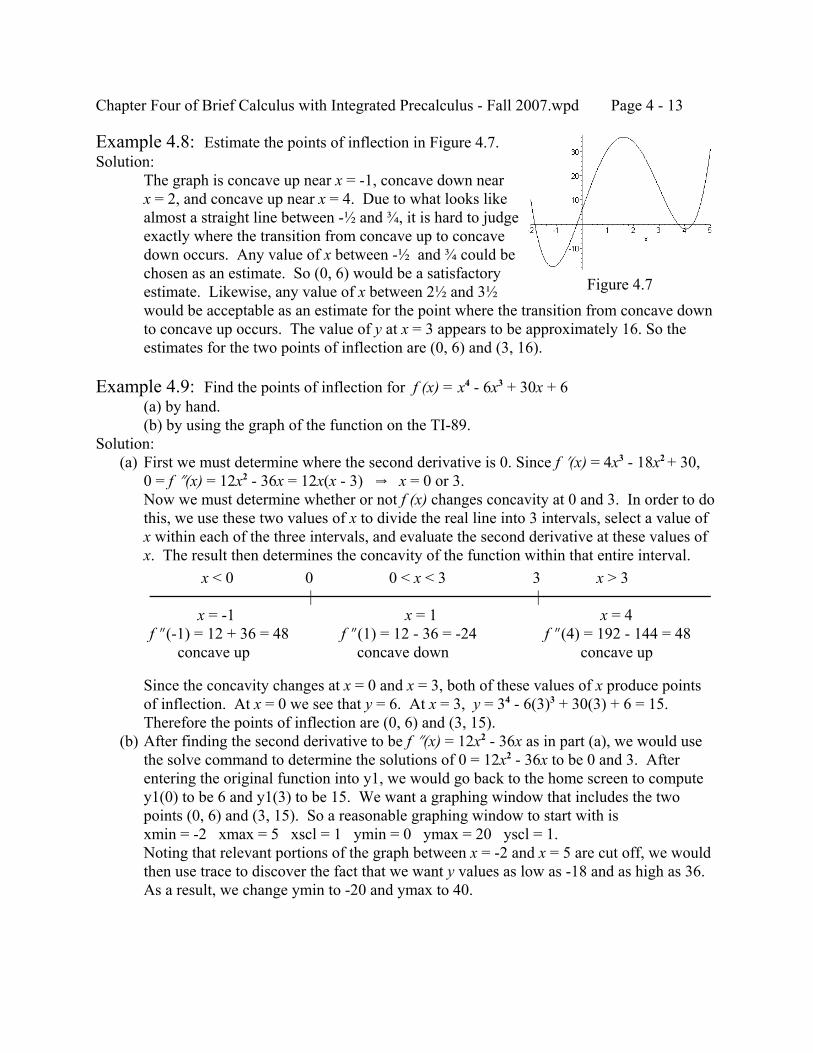
Chapter Four of Brief Calculus with Integrated Precalculus - Fall 2007.wpd Page 4 - 13
Figure 4.7
Example 4.8: Estimate the points of inflection in Figure 4.7.Solution:
The graph is concave up near x = -1, concave down nearx = 2, and concave up near x = 4. Due to what looks likealmost a straight line between -½ and ¾, it is hard to judgeexactly where the transition from concave up to concavedown occurs. Any value of x between -½ and ¾ could bechosen as an estimate. So (0, 6) would be a satisfactoryestimate. Likewise, any value of x between 2½ and 3½would be acceptable as an estimate for the point where the transition from concave downto concave up occurs. The value of y at x = 3 appears to be approximately 16. So theestimates for the two points of inflection are (0, 6) and (3, 16).
Example 4.9: Find the points of inflection for f (x) = x4 - 6x3 + 30x + 6(a) by hand.(b) by using the graph of the function on the TI-89.
Solution: (a) First we must determine where the second derivative is 0. Since f N(x) = 4x3 - 18x2 + 30,
0 = f O(x) = 12x2 - 36x = 12x(x - 3) Y x = 0 or 3.Now we must determine whether or not f (x) changes concavity at 0 and 3. In order to dothis, we use these two values of x to divide the real line into 3 intervals, select a value ofx within each of the three intervals, and evaluate the second derivative at these values ofx. The result then determines the concavity of the function within that entire interval.
Since the concavity changes at x = 0 and x = 3, both of these values of x produce pointsof inflection. At x = 0 we see that y = 6. At x = 3, y = 34 - 6(3)3 + 30(3) + 6 = 15.Therefore the points of inflection are (0, 6) and (3, 15).
(b) After finding the second derivative to be f O(x) = 12x2 - 36x as in part (a), we would usethe solve command to determine the solutions of 0 = 12x2 - 36x to be 0 and 3. Afterentering the original function into y1, we would go back to the home screen to computey1(0) to be 6 and y1(3) to be 15. We want a graphing window that includes the twopoints (0, 6) and (3, 15). So a reasonable graphing window to start with isxmin = -2 xmax = 5 xscl = 1 ymin = 0 ymax = 20 yscl = 1.Noting that relevant portions of the graph between x = -2 and x = 5 are cut off, we wouldthen use trace to discover the fact that we want y values as low as -18 and as high as 36. As a result, we change ymin to -20 and ymax to 40.
x < 0 0 0 < x < 3 3 x > 3 | |
x = -1 x = 1 x = 4f O(-1) = 12 + 36 = 48 f O(1) = 12 - 36 = -24 f O(4) = 192 - 144 = 48 concave up concave down concave up
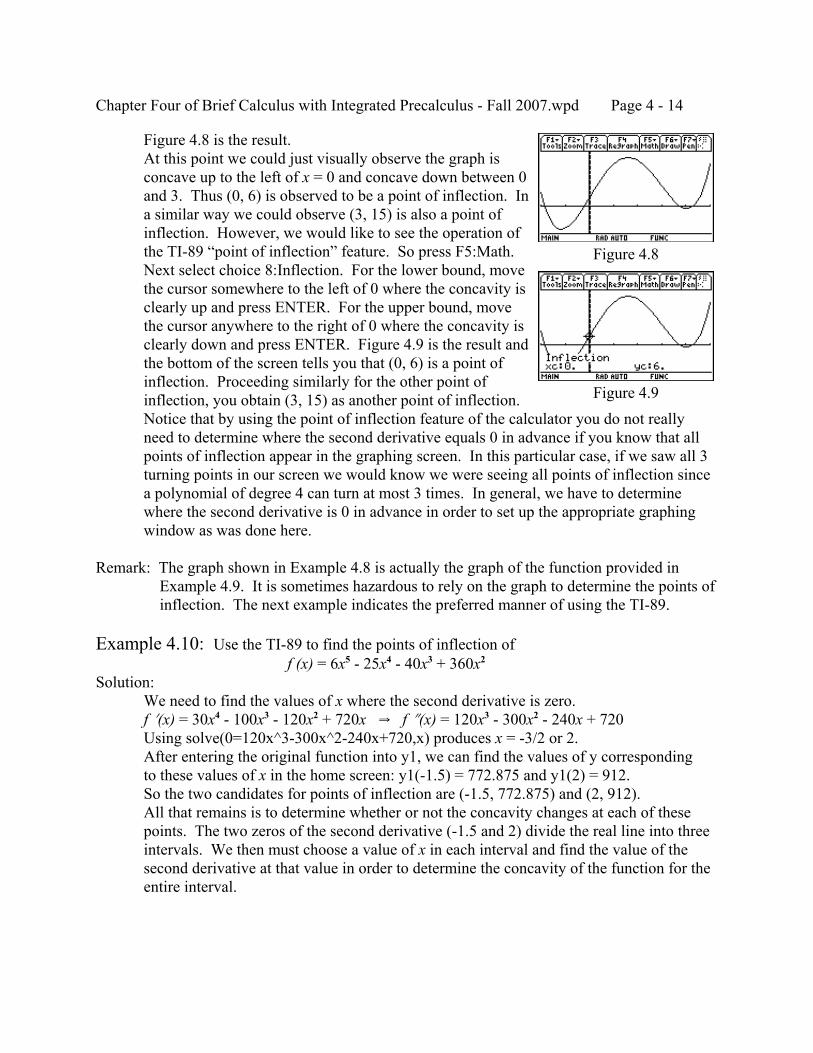
Chapter Four of Brief Calculus with Integrated Precalculus - Fall 2007.wpd Page 4 - 14
Figure 4.8
Figure 4.9
Figure 4.8 is the result.At this point we could just visually observe the graph isconcave up to the left of x = 0 and concave down between 0and 3. Thus (0, 6) is observed to be a point of inflection. Ina similar way we could observe (3, 15) is also a point ofinflection. However, we would like to see the operation ofthe TI-89 “point of inflection” feature. So press F5:Math. Next select choice 8:Inflection. For the lower bound, movethe cursor somewhere to the left of 0 where the concavity isclearly up and press ENTER. For the upper bound, movethe cursor anywhere to the right of 0 where the concavity isclearly down and press ENTER. Figure 4.9 is the result andthe bottom of the screen tells you that (0, 6) is a point ofinflection. Proceeding similarly for the other point ofinflection, you obtain (3, 15) as another point of inflection. Notice that by using the point of inflection feature of the calculator you do not reallyneed to determine where the second derivative equals 0 in advance if you know that allpoints of inflection appear in the graphing screen. In this particular case, if we saw all 3turning points in our screen we would know we were seeing all points of inflection sincea polynomial of degree 4 can turn at most 3 times. In general, we have to determinewhere the second derivative is 0 in advance in order to set up the appropriate graphingwindow as was done here.
Remark: The graph shown in Example 4.8 is actually the graph of the function provided in Example 4.9. It is sometimes hazardous to rely on the graph to determine the points of inflection. The next example indicates the preferred manner of using the TI-89.
Example 4.10: Use the TI-89 to find the points of inflection off (x) = 6x5 - 25x4 - 40x3 + 360x2
Solution:We need to find the values of x where the second derivative is zero.f N(x) = 30x4 - 100x3 - 120x2 + 720x Y f O(x) = 120x3 - 300x2 - 240x + 720Using solve(0=120x^3-300x^2-240x+720,x) produces x = -3/2 or 2.After entering the original function into y1, we can find the values of y correspondingto these values of x in the home screen: y1(-1.5) = 772.875 and y1(2) = 912.So the two candidates for points of inflection are (-1.5, 772.875) and (2, 912).All that remains is to determine whether or not the concavity changes at each of thesepoints. The two zeros of the second derivative (-1.5 and 2) divide the real line into threeintervals. We then must choose a value of x in each interval and find the value of thesecond derivative at that value in order to determine the concavity of the function for theentire interval.
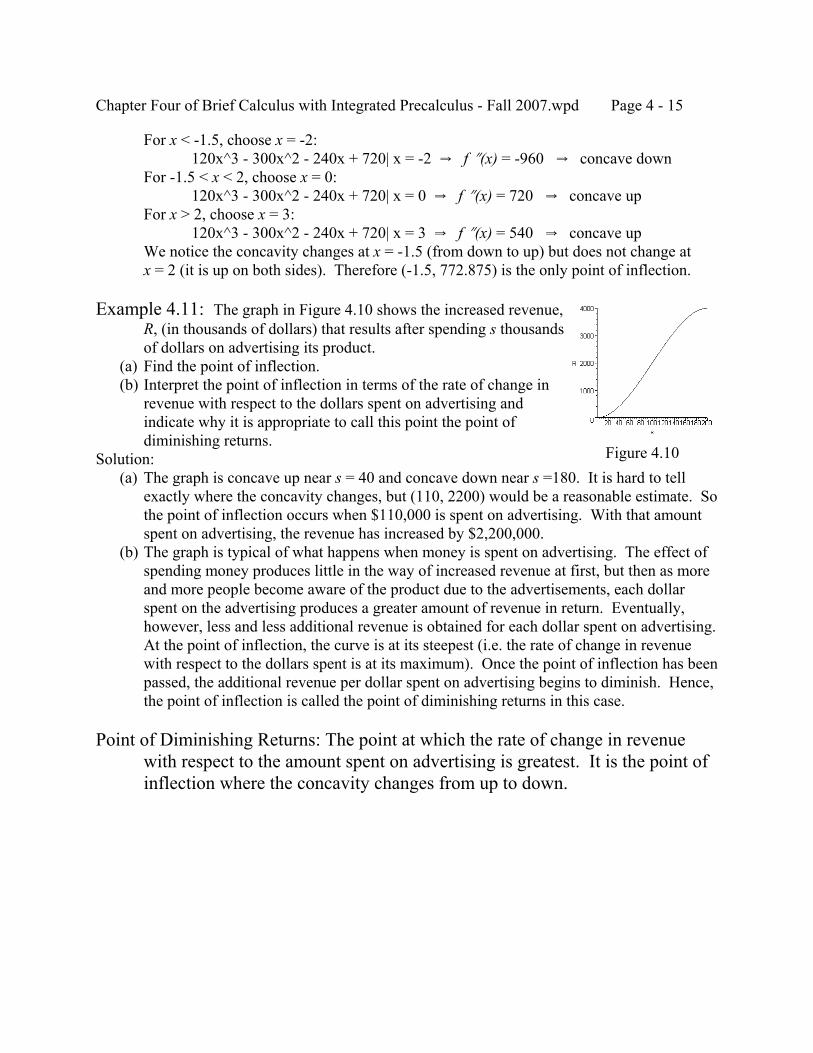
Chapter Four of Brief Calculus with Integrated Precalculus - Fall 2007.wpd Page 4 - 15
Figure 4.10
For x < -1.5, choose x = -2:120x^3 - 300x^2 - 240x + 720| x = -2 Y f O(x) = -960 Y concave down
For -1.5 < x < 2, choose x = 0:120x^3 - 300x^2 - 240x + 720| x = 0 Y f O(x) = 720 Y concave up
For x > 2, choose x = 3:120x^3 - 300x^2 - 240x + 720| x = 3 Y f O(x) = 540 Y concave up
We notice the concavity changes at x = -1.5 (from down to up) but does not change atx = 2 (it is up on both sides). Therefore (-1.5, 772.875) is the only point of inflection.
Example 4.11: The graph in Figure 4.10 shows the increased revenue, R, (in thousands of dollars) that results after spending s thousandsof dollars on advertising its product.
(a) Find the point of inflection. (b) Interpret the point of inflection in terms of the rate of change in
revenue with respect to the dollars spent on advertising andindicate why it is appropriate to call this point the point ofdiminishing returns.
Solution: (a) The graph is concave up near s = 40 and concave down near s =180. It is hard to tell
exactly where the concavity changes, but (110, 2200) would be a reasonable estimate. Sothe point of inflection occurs when $110,000 is spent on advertising. With that amountspent on advertising, the revenue has increased by $2,200,000.
(b) The graph is typical of what happens when money is spent on advertising. The effect ofspending money produces little in the way of increased revenue at first, but then as moreand more people become aware of the product due to the advertisements, each dollarspent on the advertising produces a greater amount of revenue in return. Eventually,however, less and less additional revenue is obtained for each dollar spent on advertising. At the point of inflection, the curve is at its steepest (i.e. the rate of change in revenuewith respect to the dollars spent is at its maximum). Once the point of inflection has beenpassed, the additional revenue per dollar spent on advertising begins to diminish. Hence,the point of inflection is called the point of diminishing returns in this case.
Point of Diminishing Returns: The point at which the rate of change in revenuewith respect to the amount spent on advertising is greatest. It is the point ofinflection where the concavity changes from up to down.
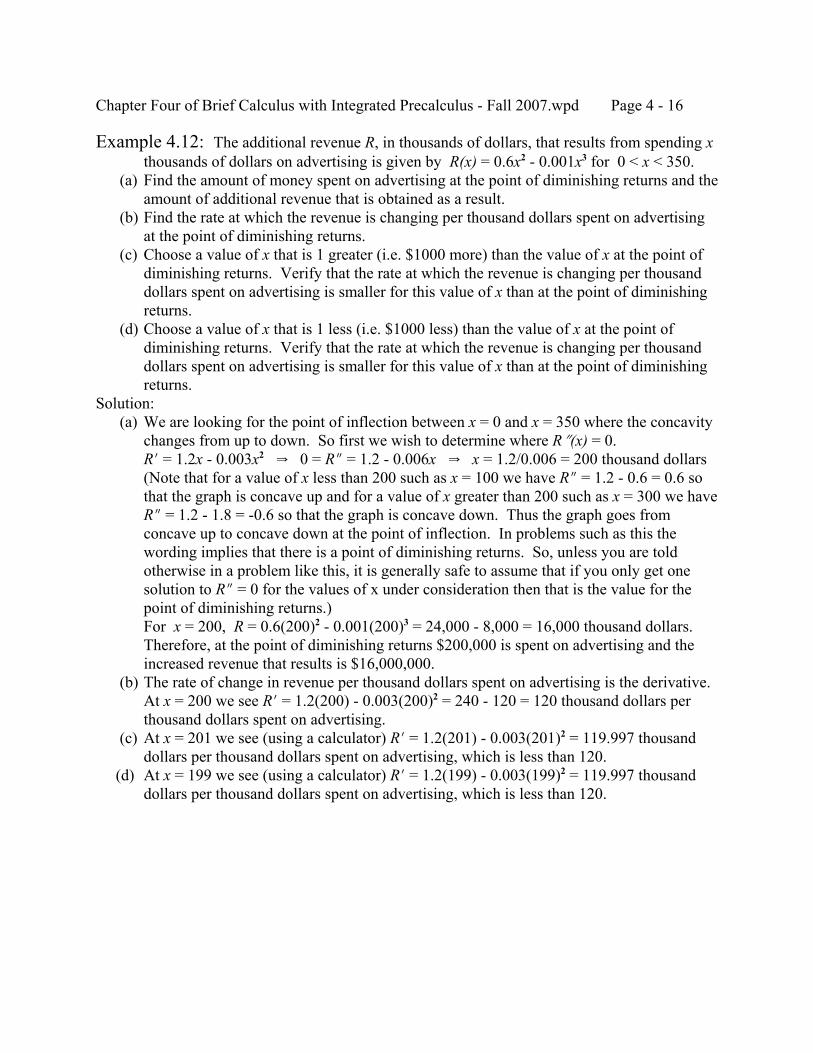
Chapter Four of Brief Calculus with Integrated Precalculus - Fall 2007.wpd Page 4 - 16
Example 4.12: The additional revenue R, in thousands of dollars, that results from spending xthousands of dollars on advertising is given by R(x) = 0.6x2 - 0.001x3 for 0 < x < 350.
(a) Find the amount of money spent on advertising at the point of diminishing returns and theamount of additional revenue that is obtained as a result.
(b) Find the rate at which the revenue is changing per thousand dollars spent on advertisingat the point of diminishing returns.
(c) Choose a value of x that is 1 greater (i.e. $1000 more) than the value of x at the point ofdiminishing returns. Verify that the rate at which the revenue is changing per thousanddollars spent on advertising is smaller for this value of x than at the point of diminishingreturns.
(d) Choose a value of x that is 1 less (i.e. $1000 less) than the value of x at the point ofdiminishing returns. Verify that the rate at which the revenue is changing per thousanddollars spent on advertising is smaller for this value of x than at the point of diminishingreturns.
Solution: (a) We are looking for the point of inflection between x = 0 and x = 350 where the concavity
changes from up to down. So first we wish to determine where RO(x) = 0.RN = 1.2x - 0.003x2 Y 0 = RO = 1.2 - 0.006x Y x = 1.2/0.006 = 200 thousand dollars(Note that for a value of x less than 200 such as x = 100 we have RO = 1.2 - 0.6 = 0.6 sothat the graph is concave up and for a value of x greater than 200 such as x = 300 we haveRO = 1.2 - 1.8 = -0.6 so that the graph is concave down. Thus the graph goes fromconcave up to concave down at the point of inflection. In problems such as this thewording implies that there is a point of diminishing returns. So, unless you are toldotherwise in a problem like this, it is generally safe to assume that if you only get onesolution to RO = 0 for the values of x under consideration then that is the value for thepoint of diminishing returns.)For x = 200, R = 0.6(200)2 - 0.001(200)3 = 24,000 - 8,000 = 16,000 thousand dollars.Therefore, at the point of diminishing returns $200,000 is spent on advertising and theincreased revenue that results is $16,000,000.
(b) The rate of change in revenue per thousand dollars spent on advertising is the derivative. At x = 200 we see RN = 1.2(200) - 0.003(200)2 = 240 - 120 = 120 thousand dollars perthousand dollars spent on advertising.
(c) At x = 201 we see (using a calculator) RN = 1.2(201) - 0.003(201)2 = 119.997 thousanddollars per thousand dollars spent on advertising, which is less than 120.
(d) At x = 199 we see (using a calculator) RN = 1.2(199) - 0.003(199)2 = 119.997 thousanddollars per thousand dollars spent on advertising, which is less than 120.
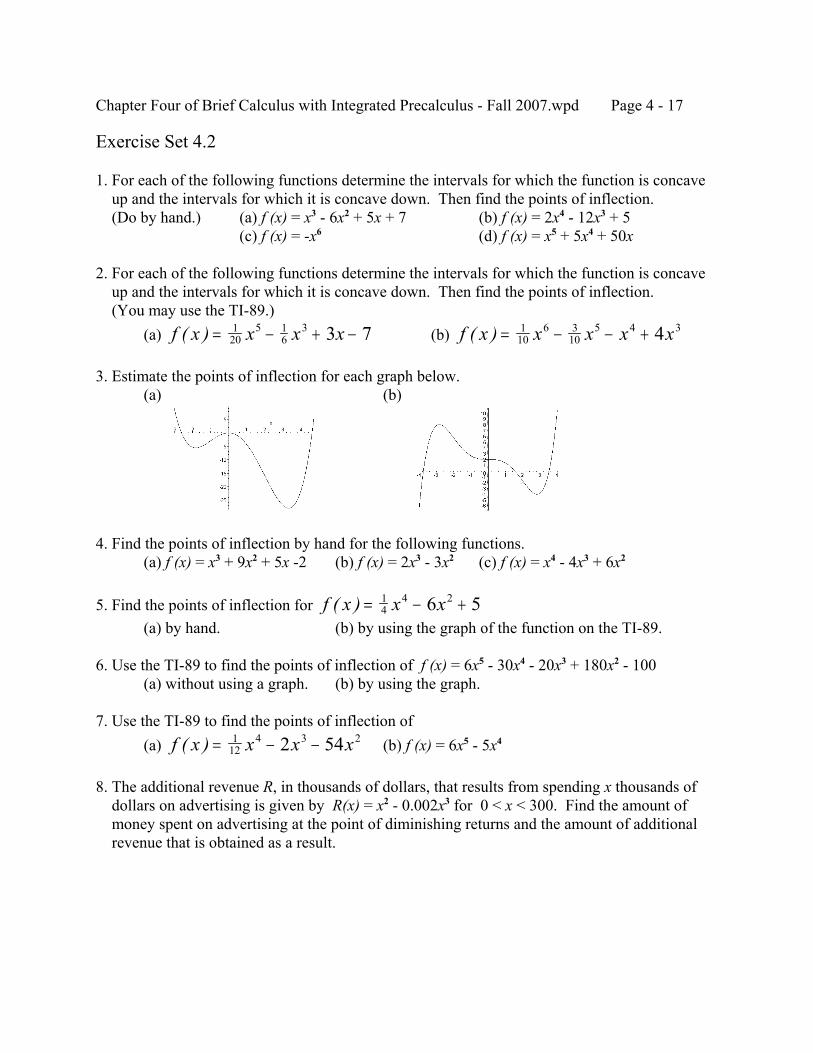
Chapter Four of Brief Calculus with Integrated Precalculus - Fall 2007.wpd Page 4 - 17
Exercise Set 4.2
1. For each of the following functions determine the intervals for which the function is concave up and the intervals for which it is concave down. Then find the points of inflection. (Do by hand.) (a) f (x) = x3 - 6x2 + 5x + 7 (b) f (x) = 2x4 - 12x3 + 5
(c) f (x) = -x6 (d) f (x) = x5 + 5x4 + 50x
2. For each of the following functions determine the intervals for which the function is concave up and the intervals for which it is concave down. Then find the points of inflection. (You may use the TI-89.)
(a) (b) f x x x x( ) = − + −120
5 16
3 3 7 f x x x x x( ) = − − +110
6 310
5 4 34
3. Estimate the points of inflection for each graph below.(a) (b)
4. Find the points of inflection by hand for the following functions.(a) f (x) = x3 + 9x2 + 5x -2 (b) f (x) = 2x3 - 3x2 (c) f (x) = x4 - 4x3 + 6x2
5. Find the points of inflection for f x x x( ) = − +14
4 26 5(a) by hand. (b) by using the graph of the function on the TI-89.
6. Use the TI-89 to find the points of inflection of f (x) = 6x5 - 30x4 - 20x3 + 180x2 - 100(a) without using a graph. (b) by using the graph.
7. Use the TI-89 to find the points of inflection of(a) (b) f (x) = 6x5 - 5x4f x x x x( ) = − −1
124 3 22 54
8. The additional revenue R, in thousands of dollars, that results from spending x thousands of dollars on advertising is given by R(x) = x2 - 0.002x3 for 0 < x < 300. Find the amount of money spent on advertising at the point of diminishing returns and the amount of additional revenue that is obtained as a result.
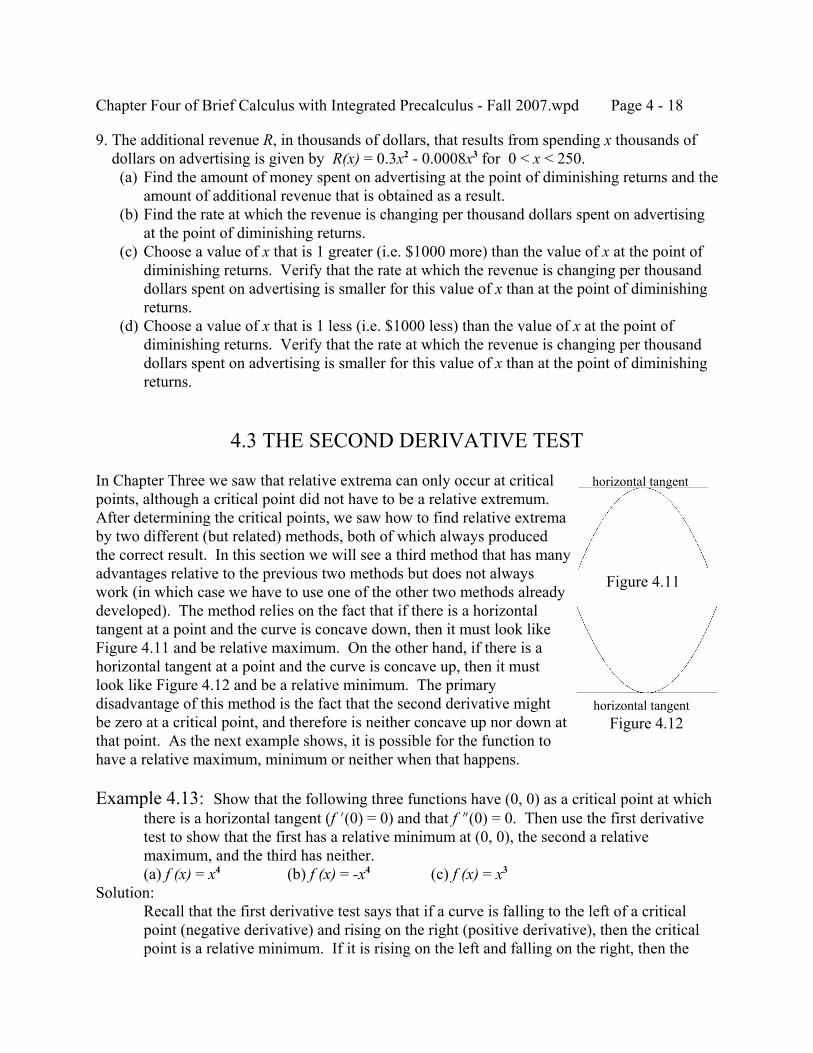
Chapter Four of Brief Calculus with Integrated Precalculus - Fall 2007.wpd Page 4 - 18
Figure 4.11
Figure 4.12
9. The additional revenue R, in thousands of dollars, that results from spending x thousands of dollars on advertising is given by R(x) = 0.3x2 - 0.0008x3 for 0 < x < 250. (a) Find the amount of money spent on advertising at the point of diminishing returns and the
amount of additional revenue that is obtained as a result. (b) Find the rate at which the revenue is changing per thousand dollars spent on advertising
at the point of diminishing returns. (c) Choose a value of x that is 1 greater (i.e. $1000 more) than the value of x at the point of
diminishing returns. Verify that the rate at which the revenue is changing per thousanddollars spent on advertising is smaller for this value of x than at the point of diminishingreturns.
(d) Choose a value of x that is 1 less (i.e. $1000 less) than the value of x at the point ofdiminishing returns. Verify that the rate at which the revenue is changing per thousanddollars spent on advertising is smaller for this value of x than at the point of diminishingreturns.
4.3 THE SECOND DERIVATIVE TEST
In Chapter Three we saw that relative extrema can only occur at criticalpoints, although a critical point did not have to be a relative extremum. After determining the critical points, we saw how to find relative extremaby two different (but related) methods, both of which always producedthe correct result. In this section we will see a third method that has manyadvantages relative to the previous two methods but does not alwayswork (in which case we have to use one of the other two methods alreadydeveloped). The method relies on the fact that if there is a horizontaltangent at a point and the curve is concave down, then it must look likeFigure 4.11 and be relative maximum. On the other hand, if there is ahorizontal tangent at a point and the curve is concave up, then it mustlook like Figure 4.12 and be a relative minimum. The primarydisadvantage of this method is the fact that the second derivative mightbe zero at a critical point, and therefore is neither concave up nor down atthat point. As the next example shows, it is possible for the function tohave a relative maximum, minimum or neither when that happens.
Example 4.13: Show that the following three functions have (0, 0) as a critical point at whichthere is a horizontal tangent (f N(0) = 0) and that f O(0) = 0. Then use the first derivativetest to show that the first has a relative minimum at (0, 0), the second a relativemaximum, and the third has neither.(a) f (x) = x4 (b) f (x) = -x4 (c) f (x) = x3
Solution:Recall that the first derivative test says that if a curve is falling to the left of a criticalpoint (negative derivative) and rising on the right (positive derivative), then the criticalpoint is a relative minimum. If it is rising on the left and falling on the right, then the
horizontal tangent
horizontal tangent
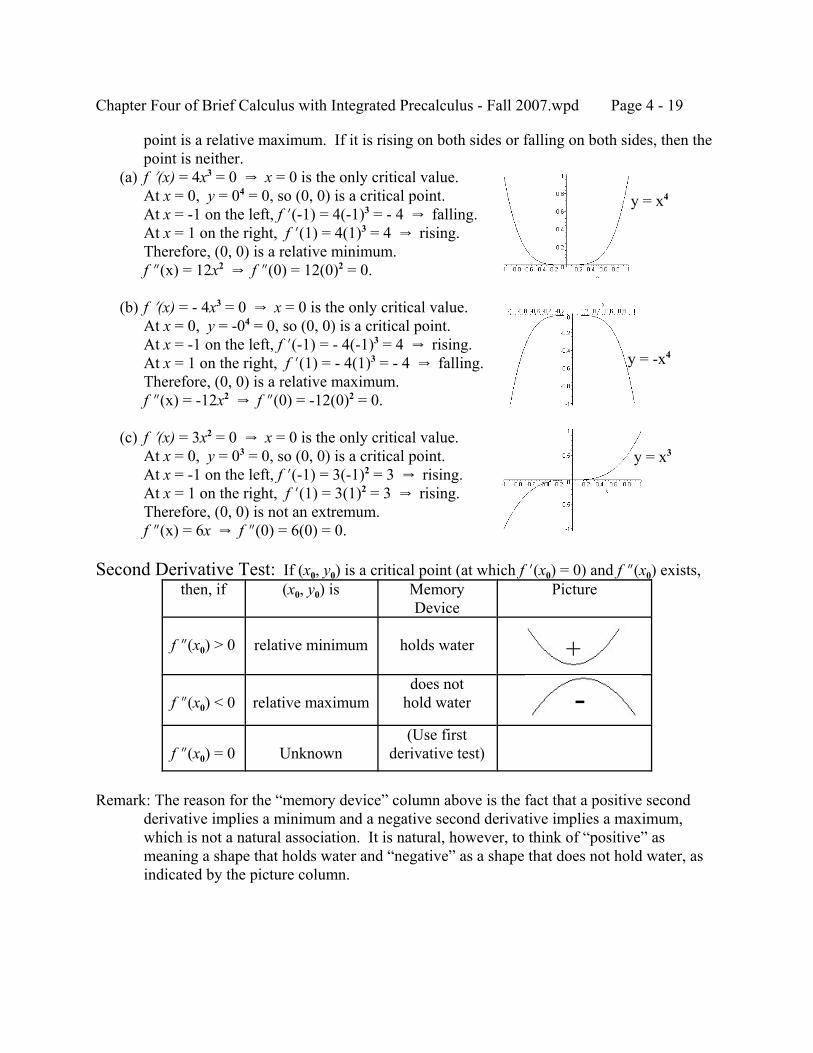
Chapter Four of Brief Calculus with Integrated Precalculus - Fall 2007.wpd Page 4 - 19
point is a relative maximum. If it is rising on both sides or falling on both sides, then thepoint is neither.
(a) f N(x) = 4x3 = 0 Y x = 0 is the only critical value.At x = 0, y = 04 = 0, so (0, 0) is a critical point.At x = -1 on the left, f N(-1) = 4(-1)3 = - 4 Y falling.At x = 1 on the right, f N(1) = 4(1)3 = 4 Y rising.Therefore, (0, 0) is a relative minimum.f O(x) = 12x2 Y f O(0) = 12(0)2 = 0.
(b) f N(x) = - 4x3 = 0 Y x = 0 is the only critical value.At x = 0, y = -04 = 0, so (0, 0) is a critical point.At x = -1 on the left, f N(-1) = - 4(-1)3 = 4 Y rising.At x = 1 on the right, f N(1) = - 4(1)3 = - 4 Y falling.Therefore, (0, 0) is a relative maximum.f O(x) = -12x2 Y f O(0) = -12(0)2 = 0.
(c) f N(x) = 3x2 = 0 Y x = 0 is the only critical value.At x = 0, y = 03 = 0, so (0, 0) is a critical point.At x = -1 on the left, f N(-1) = 3(-1)2 = 3 Y rising.At x = 1 on the right, f N(1) = 3(1)2 = 3 Y rising.Therefore, (0, 0) is not an extremum.f O(x) = 6x Y f O(0) = 6(0) = 0.
Second Derivative Test: If (x0, y0) is a critical point (at which f N(x0) = 0) and f O(x0) exists,then, if (x0, y0) is Memory
DevicePicture
f O(x0) > 0 relative minimum holds water
f O(x0) < 0 relative maximumdoes not
hold water
f O(x0) = 0 Unknown(Use first
derivative test)
Remark: The reason for the “memory device” column above is the fact that a positive secondderivative implies a minimum and a negative second derivative implies a maximum,which is not a natural association. It is natural, however, to think of “positive” asmeaning a shape that holds water and “negative” as a shape that does not hold water, asindicated by the picture column.
y = x4
y = -x4
y = x3
+
-
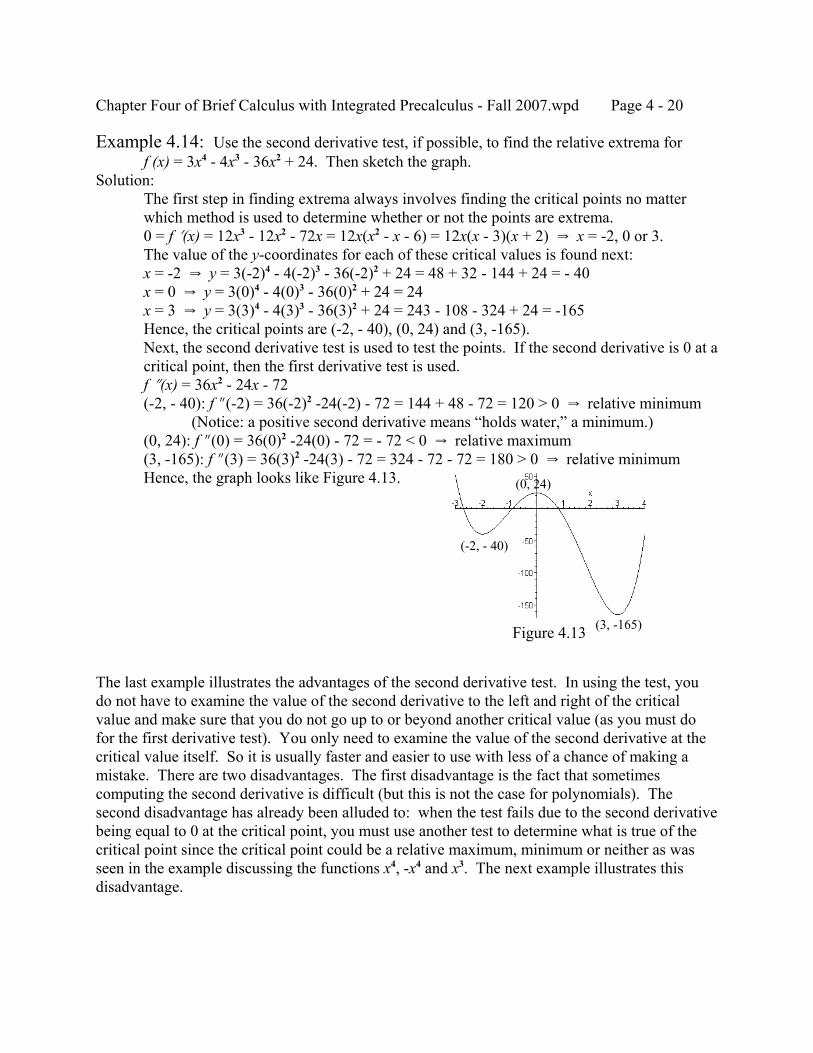
Chapter Four of Brief Calculus with Integrated Precalculus - Fall 2007.wpd Page 4 - 20
Figure 4.13
Example 4.14: Use the second derivative test, if possible, to find the relative extrema forf (x) = 3x4 - 4x3 - 36x2 + 24. Then sketch the graph.
Solution:The first step in finding extrema always involves finding the critical points no matterwhich method is used to determine whether or not the points are extrema.0 = f N(x) = 12x3 - 12x2 - 72x = 12x(x2 - x - 6) = 12x(x - 3)(x + 2) Y x = -2, 0 or 3.The value of the y-coordinates for each of these critical values is found next:x = -2 Y y = 3(-2)4 - 4(-2)3 - 36(-2)2 + 24 = 48 + 32 - 144 + 24 = - 40x = 0 Y y = 3(0)4 - 4(0)3 - 36(0)2 + 24 = 24x = 3 Y y = 3(3)4 - 4(3)3 - 36(3)2 + 24 = 243 - 108 - 324 + 24 = -165Hence, the critical points are (-2, - 40), (0, 24) and (3, -165).Next, the second derivative test is used to test the points. If the second derivative is 0 at acritical point, then the first derivative test is used.f O(x) = 36x2 - 24x - 72 (-2, - 40): f O(-2) = 36(-2)2 -24(-2) - 72 = 144 + 48 - 72 = 120 > 0 Y relative minimum
(Notice: a positive second derivative means “holds water,” a minimum.)(0, 24): f O(0) = 36(0)2 -24(0) - 72 = - 72 < 0 Y relative maximum(3, -165): f O(3) = 36(3)2 -24(3) - 72 = 324 - 72 - 72 = 180 > 0 Y relative minimumHence, the graph looks like Figure 4.13.
The last example illustrates the advantages of the second derivative test. In using the test, youdo not have to examine the value of the second derivative to the left and right of the criticalvalue and make sure that you do not go up to or beyond another critical value (as you must dofor the first derivative test). You only need to examine the value of the second derivative at thecritical value itself. So it is usually faster and easier to use with less of a chance of making amistake. There are two disadvantages. The first disadvantage is the fact that sometimescomputing the second derivative is difficult (but this is not the case for polynomials). Thesecond disadvantage has already been alluded to: when the test fails due to the second derivativebeing equal to 0 at the critical point, you must use another test to determine what is true of thecritical point since the critical point could be a relative maximum, minimum or neither as wasseen in the example discussing the functions x4, -x4 and x3. The next example illustrates thisdisadvantage.
(-2, - 40)
(0, 24)
(3, -165)
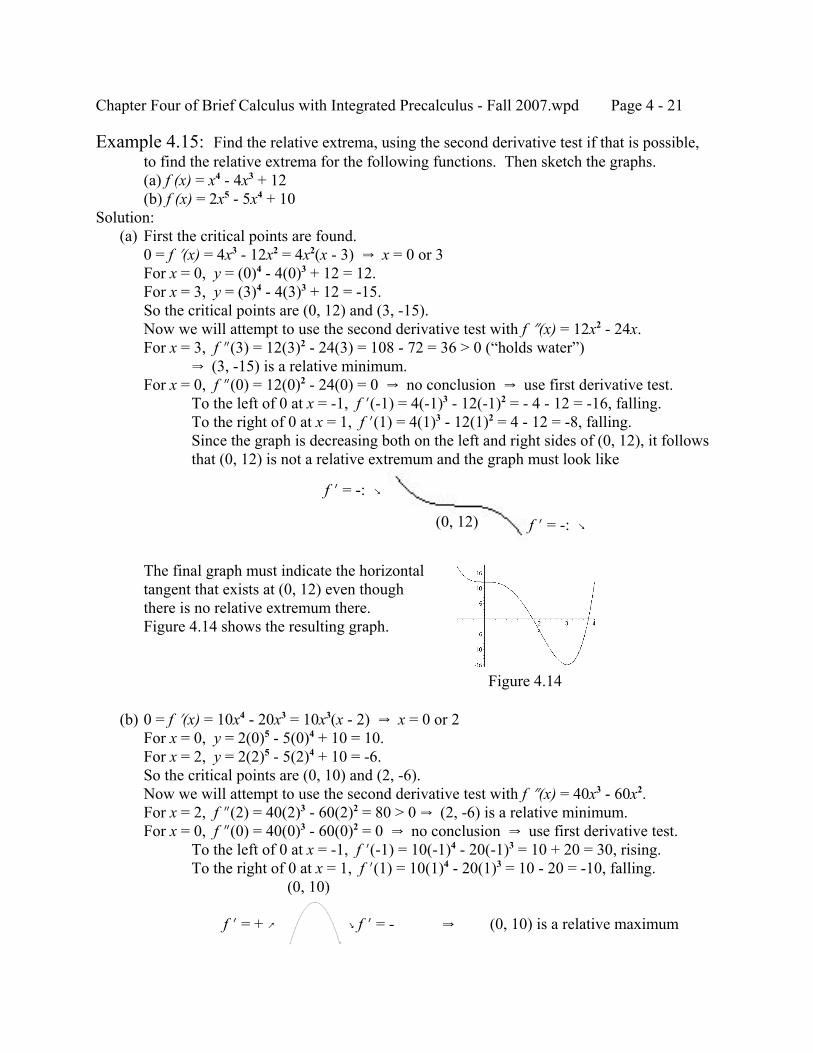
Chapter Four of Brief Calculus with Integrated Precalculus - Fall 2007.wpd Page 4 - 21
Figure 4.14
Example 4.15: Find the relative extrema, using the second derivative test if that is possible,to find the relative extrema for the following functions. Then sketch the graphs.(a) f (x) = x4 - 4x3 + 12(b) f (x) = 2x5 - 5x4 + 10
Solution: (a) First the critical points are found.
0 = f N(x) = 4x3 - 12x2 = 4x2(x - 3) Y x = 0 or 3For x = 0, y = (0)4 - 4(0)3 + 12 = 12.For x = 3, y = (3)4 - 4(3)3 + 12 = -15.So the critical points are (0, 12) and (3, -15).Now we will attempt to use the second derivative test with f O(x) = 12x2 - 24x.For x = 3, f O(3) = 12(3)2 - 24(3) = 108 - 72 = 36 > 0 (“holds water”)
Y (3, -15) is a relative minimum.For x = 0, f O(0) = 12(0)2 - 24(0) = 0 Y no conclusion Y use first derivative test.
To the left of 0 at x = -1, f N(-1) = 4(-1)3 - 12(-1)2 = - 4 - 12 = -16, falling.To the right of 0 at x = 1, f N(1) = 4(1)3 - 12(1)2 = 4 - 12 = -8, falling.Since the graph is decreasing both on the left and right sides of (0, 12), it followsthat (0, 12) is not a relative extremum and the graph must look like
The final graph must indicate the horizontaltangent that exists at (0, 12) even thoughthere is no relative extremum there.Figure 4.14 shows the resulting graph.
(b) 0 = f N(x) = 10x4 - 20x3 = 10x3(x - 2) Y x = 0 or 2For x = 0, y = 2(0)5 - 5(0)4 + 10 = 10.For x = 2, y = 2(2)5 - 5(2)4 + 10 = -6.So the critical points are (0, 10) and (2, -6).Now we will attempt to use the second derivative test with f O(x) = 40x3 - 60x2.For x = 2, f O(2) = 40(2)3 - 60(2)2 = 80 > 0 Y (2, -6) is a relative minimum.For x = 0, f O(0) = 40(0)3 - 60(0)2 = 0 Y no conclusion Y use first derivative test.
To the left of 0 at x = -1, f N(-1) = 10(-1)4 - 20(-1)3 = 10 + 20 = 30, rising.To the right of 0 at x = 1, f N(1) = 10(1)4 - 20(1)3 = 10 - 20 = -10, falling.
(0, 10)
f N = + _ ` f N = - Y (0, 10) is a relative maximum
f N = -: `
f N = -: `(0, 12)
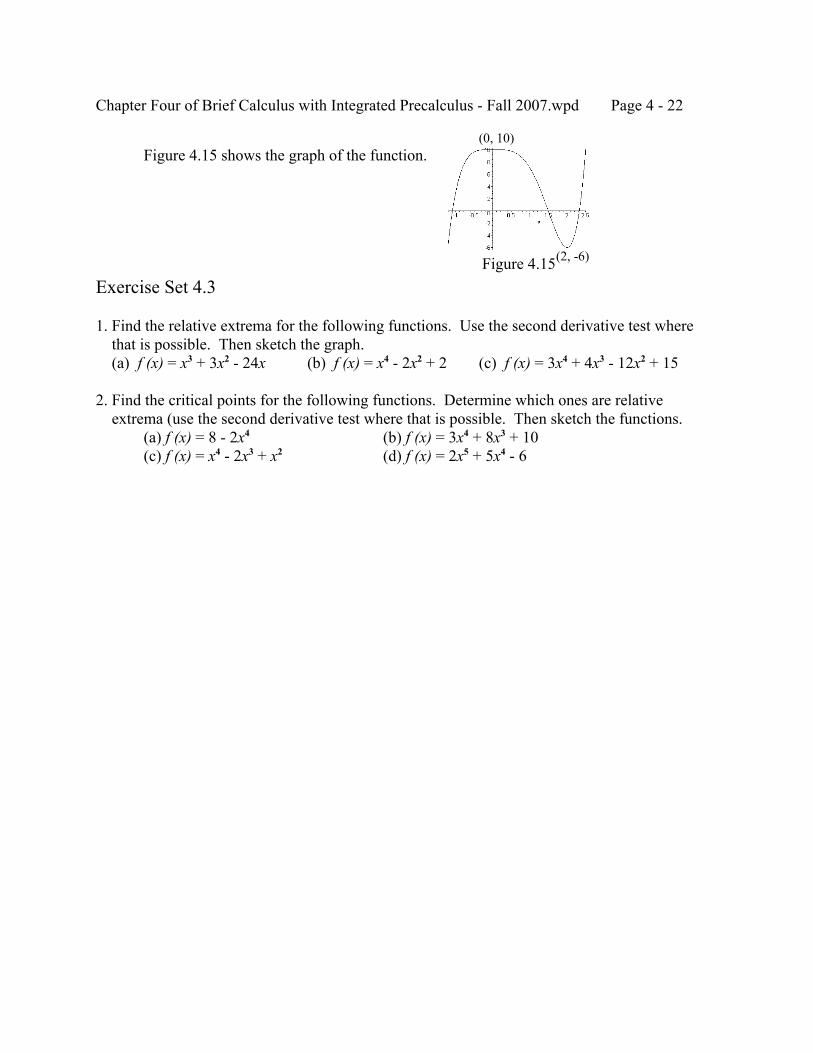
Chapter Four of Brief Calculus with Integrated Precalculus - Fall 2007.wpd Page 4 - 22
Figure 4.15
(0, 10)Figure 4.15 shows the graph of the function.
Exercise Set 4.3
1. Find the relative extrema for the following functions. Use the second derivative test where that is possible. Then sketch the graph. (a) f (x) = x3 + 3x2 - 24x (b) f (x) = x4 - 2x2 + 2 (c) f (x) = 3x4 + 4x3 - 12x2 + 15
2. Find the critical points for the following functions. Determine which ones are relative extrema (use the second derivative test where that is possible. Then sketch the functions.
(a) f (x) = 8 - 2x4 (b) f (x) = 3x4 + 8x3 + 10(c) f (x) = x4 - 2x3 + x2 (d) f (x) = 2x5 + 5x4 - 6
(2, -6)
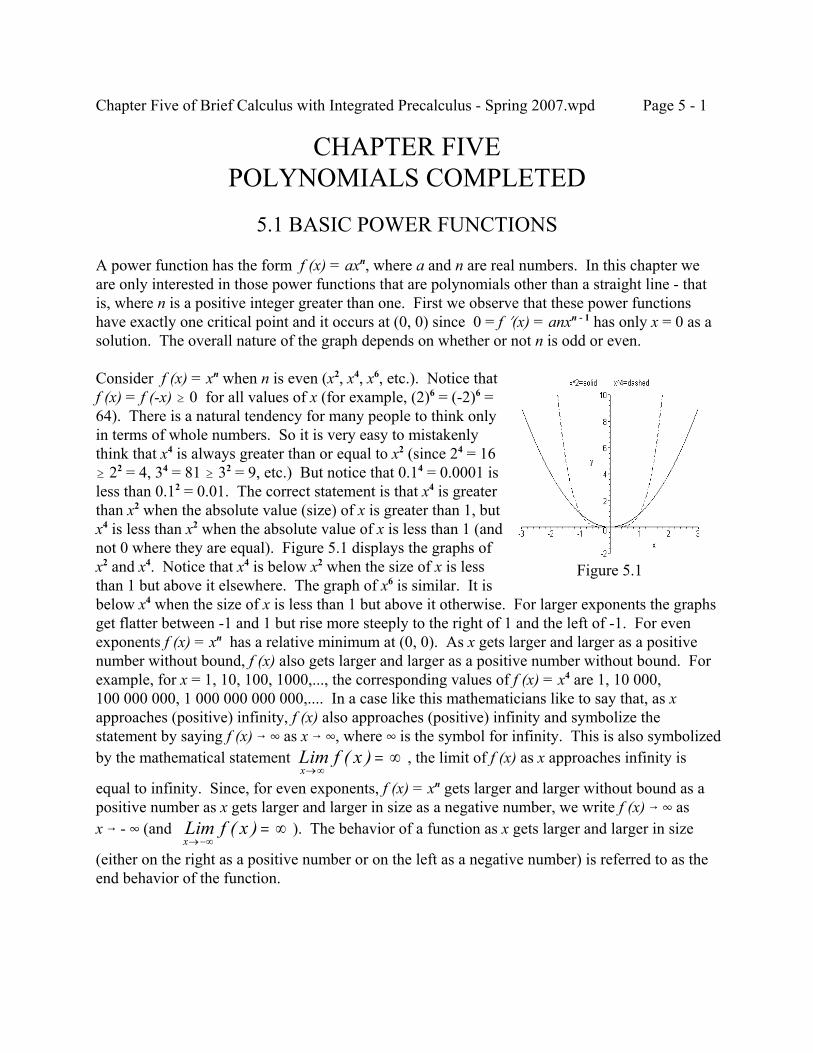
Chapter Five of Brief Calculus with Integrated Precalculus - Spring 2007.wpd Page 5 - 1
Figure 5.1
CHAPTER FIVEPOLYNOMIALS COMPLETED
5.1 BASIC POWER FUNCTIONS
A power function has the form f (x) = axn, where a and n are real numbers. In this chapter weare only interested in those power functions that are polynomials other than a straight line - thatis, where n is a positive integer greater than one. First we observe that these power functionshave exactly one critical point and it occurs at (0, 0) since 0 = f N(x) = anxn - 1 has only x = 0 as asolution. The overall nature of the graph depends on whether or not n is odd or even.
Consider f (x) = xn when n is even (x2, x4, x6, etc.). Notice that f (x) = f (-x) $ 0 for all values of x (for example, (2)6 = (-2)6 =64). There is a natural tendency for many people to think onlyin terms of whole numbers. So it is very easy to mistakenlythink that x4 is always greater than or equal to x2 (since 24 = 16$ 22 = 4, 34 = 81 $ 32 = 9, etc.) But notice that 0.14 = 0.0001 isless than 0.12 = 0.01. The correct statement is that x4 is greaterthan x2 when the absolute value (size) of x is greater than 1, butx4 is less than x2 when the absolute value of x is less than 1 (andnot 0 where they are equal). Figure 5.1 displays the graphs ofx2 and x4. Notice that x4 is below x2 when the size of x is lessthan 1 but above it elsewhere. The graph of x6 is similar. It isbelow x4 when the size of x is less than 1 but above it otherwise. For larger exponents the graphsget flatter between -1 and 1 but rise more steeply to the right of 1 and the left of -1. For evenexponents f (x) = xn has a relative minimum at (0, 0). As x gets larger and larger as a positivenumber without bound, f (x) also gets larger and larger as a positive number without bound. Forexample, for x = 1, 10, 100, 1000,..., the corresponding values of f (x) = x4 are 1, 10 000,100 000 000, 1 000 000 000 000,.... In a case like this mathematicians like to say that, as xapproaches (positive) infinity, f (x) also approaches (positive) infinity and symbolize thestatement by saying f (x) 6 4 as x 6 4, where 4 is the symbol for infinity. This is also symbolizedby the mathematical statement , the limit of f (x) as x approaches infinity isLim f x
x→∞= ∞( )
equal to infinity. Since, for even exponents, f (x) = xn gets larger and larger without bound as apositive number as x gets larger and larger in size as a negative number, we write f (x) 6 4 as x 6 - 4 (and ). The behavior of a function as x gets larger and larger in sizeLim f x
x→−∞= ∞( )
(either on the right as a positive number or on the left as a negative number) is referred to as theend behavior of the function.
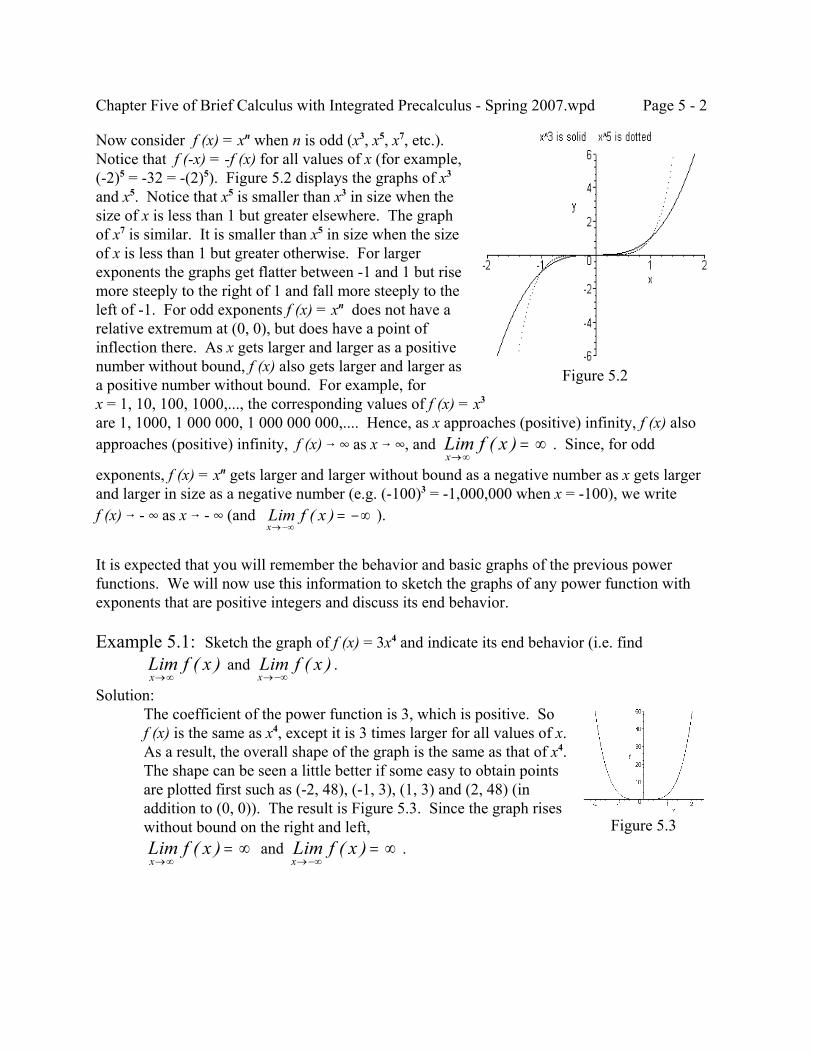
Chapter Five of Brief Calculus with Integrated Precalculus - Spring 2007.wpd Page 5 - 2
Figure 5.3
Figure 5.2
Now consider f (x) = xn when n is odd (x3, x5, x7, etc.). Notice that f (-x) = -f (x) for all values of x (for example,(-2)5 = -32 = -(2)5). Figure 5.2 displays the graphs of x3
and x5. Notice that x5 is smaller than x3 in size when thesize of x is less than 1 but greater elsewhere. The graphof x7 is similar. It is smaller than x5 in size when the sizeof x is less than 1 but greater otherwise. For largerexponents the graphs get flatter between -1 and 1 but risemore steeply to the right of 1 and fall more steeply to theleft of -1. For odd exponents f (x) = xn does not have arelative extremum at (0, 0), but does have a point ofinflection there. As x gets larger and larger as a positivenumber without bound, f (x) also gets larger and larger asa positive number without bound. For example, for x = 1, 10, 100, 1000,..., the corresponding values of f (x) = x3
are 1, 1000, 1 000 000, 1 000 000 000,.... Hence, as x approaches (positive) infinity, f (x) alsoapproaches (positive) infinity, f (x) 6 4 as x 6 4, and . Since, for oddLim f x
x→∞= ∞( )
exponents, f (x) = xn gets larger and larger without bound as a negative number as x gets largerand larger in size as a negative number (e.g. (-100)3 = -1,000,000 when x = -100), we writef (x) 6 - 4 as x 6 - 4 (and ).Lim f x
x→−∞= −∞( )
It is expected that you will remember the behavior and basic graphs of the previous powerfunctions. We will now use this information to sketch the graphs of any power function withexponents that are positive integers and discuss its end behavior.
Example 5.1: Sketch the graph of f (x) = 3x4 and indicate its end behavior (i.e. find and .Lim f x
x→∞( ) Lim f x
x→−∞( )
Solution:The coefficient of the power function is 3, which is positive. So f (x) is the same as x4, except it is 3 times larger for all values of x. As a result, the overall shape of the graph is the same as that of x4. The shape can be seen a little better if some easy to obtain pointsare plotted first such as (-2, 48), (-1, 3), (1, 3) and (2, 48) (inaddition to (0, 0)). The result is Figure 5.3. Since the graph riseswithout bound on the right and left,
and .Lim f xx→∞
= ∞( ) Lim f xx→−∞
= ∞( )
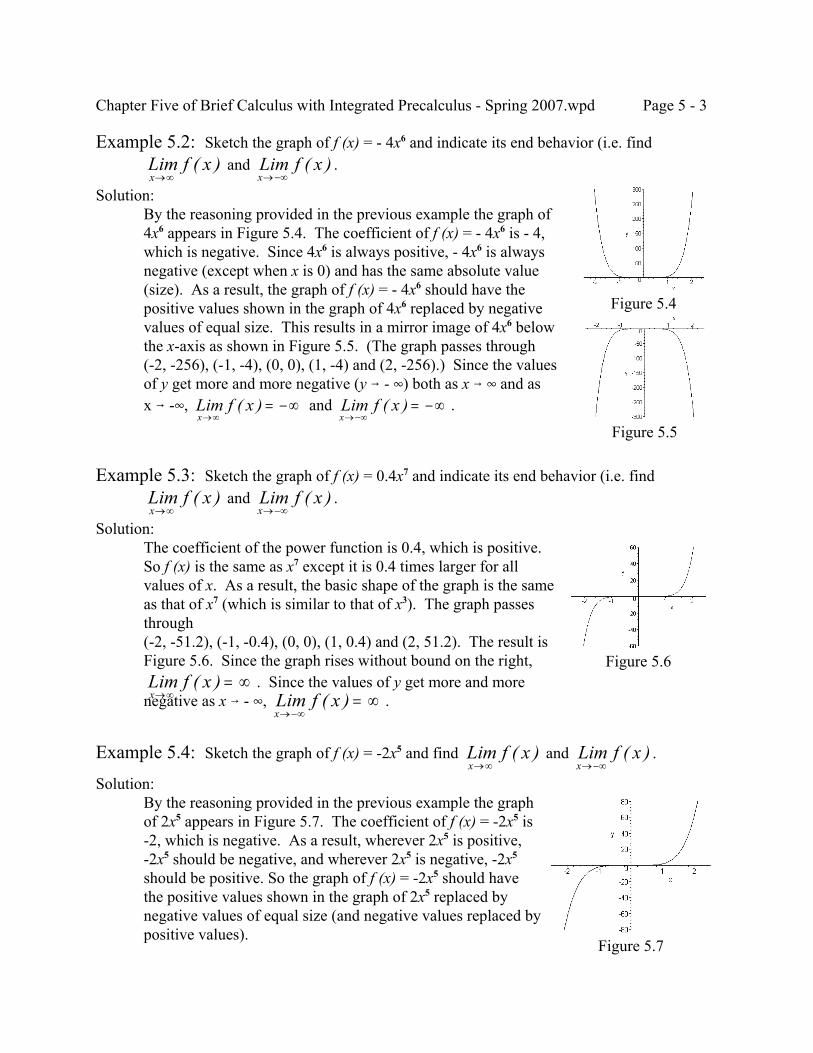
Chapter Five of Brief Calculus with Integrated Precalculus - Spring 2007.wpd Page 5 - 3
Figure 5.4
Figure 5.5
Figure 5.6
Figure 5.7
Example 5.2: Sketch the graph of f (x) = - 4x6 and indicate its end behavior (i.e. find and .Lim f x
x→∞( ) Lim f x
x→−∞( )
Solution:By the reasoning provided in the previous example the graph of4x6 appears in Figure 5.4. The coefficient of f (x) = - 4x6 is - 4,which is negative. Since 4x6 is always positive, - 4x6 is alwaysnegative (except when x is 0) and has the same absolute value(size). As a result, the graph of f (x) = - 4x6 should have thepositive values shown in the graph of 4x6 replaced by negativevalues of equal size. This results in a mirror image of 4x6 belowthe x-axis as shown in Figure 5.5. (The graph passes through(-2, -256), (-1, -4), (0, 0), (1, -4) and (2, -256).) Since the valuesof y get more and more negative (y 6 - 4) both as x 6 4 and asx 6 -4, and .Lim f x
x→∞= −∞( ) Lim f x
x→−∞= −∞( )
Example 5.3: Sketch the graph of f (x) = 0.4x7 and indicate its end behavior (i.e. find and .Lim f x
x→∞( ) Lim f x
x→−∞( )
Solution:The coefficient of the power function is 0.4, which is positive. So f (x) is the same as x7 except it is 0.4 times larger for allvalues of x. As a result, the basic shape of the graph is the sameas that of x7 (which is similar to that of x3). The graph passesthrough(-2, -51.2), (-1, -0.4), (0, 0), (1, 0.4) and (2, 51.2). The result isFigure 5.6. Since the graph rises without bound on the right,
. Since the values of y get more and moreLim f xx→∞
= ∞( )negative as x 6 - 4, .Lim f x
x→−∞= ∞( )
Example 5.4: Sketch the graph of f (x) = -2x5 and find and .Lim f xx→∞
( ) Lim f xx→−∞
( )Solution:
By the reasoning provided in the previous example the graphof 2x5 appears in Figure 5.7. The coefficient of f (x) = -2x5 is -2, which is negative. As a result, wherever 2x5 is positive, -2x5 should be negative, and wherever 2x5 is negative, -2x5
should be positive. So the graph of f (x) = -2x5 should havethe positive values shown in the graph of 2x5 replaced bynegative values of equal size (and negative values replaced bypositive values).
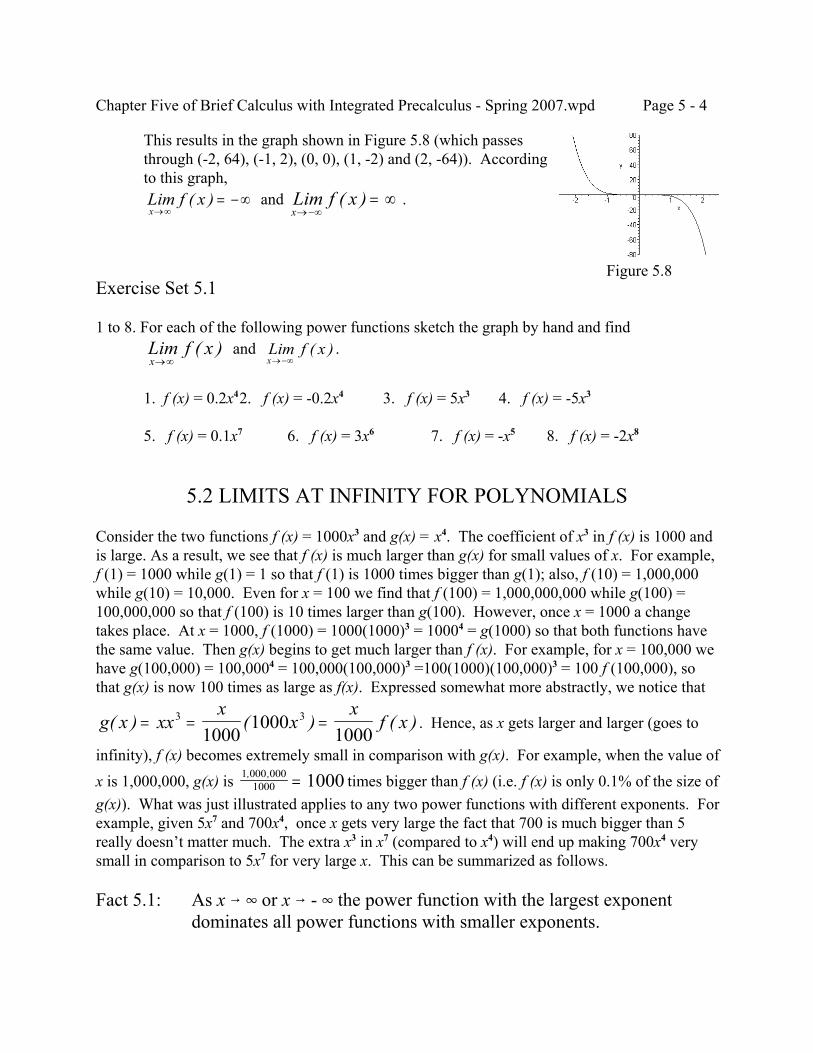
Chapter Five of Brief Calculus with Integrated Precalculus - Spring 2007.wpd Page 5 - 4
Figure 5.8
This results in the graph shown in Figure 5.8 (which passesthrough (-2, 64), (-1, 2), (0, 0), (1, -2) and (2, -64)). Accordingto this graph,
and .Lim f xx→∞
= −∞( ) Lim f xx→−∞
= ∞( )
Exercise Set 5.1
1 to 8. For each of the following power functions sketch the graph by hand and find and .Lim f x
x→∞( ) Lim f x
x→−∞( )
1. f (x) = 0.2x42. f (x) = -0.2x4 3. f (x) = 5x3 4. f (x) = -5x3
5. f (x) = 0.1x7 6. f (x) = 3x6 7. f (x) = -x5 8. f (x) = -2x8
5.2 LIMITS AT INFINITY FOR POLYNOMIALS
Consider the two functions f (x) = 1000x3 and g(x) = x4. The coefficient of x3 in f (x) is 1000 andis large. As a result, we see that f (x) is much larger than g(x) for small values of x. For example,f (1) = 1000 while g(1) = 1 so that f (1) is 1000 times bigger than g(1); also, f (10) = 1,000,000while g(10) = 10,000. Even for x = 100 we find that f (100) = 1,000,000,000 while g(100) =100,000,000 so that f (100) is 10 times larger than g(100). However, once x = 1000 a changetakes place. At x = 1000, f (1000) = 1000(1000)3 = 10004 = g(1000) so that both functions havethe same value. Then g(x) begins to get much larger than f (x). For example, for x = 100,000 wehave g(100,000) = 100,0004 = 100,000(100,000)3 =100(1000)(100,000)3 = 100 f (100,000), sothat g(x) is now 100 times as large as f(x). Expressed somewhat more abstractly, we notice that
. Hence, as x gets larger and larger (goes tog x xxx
xx
f x( ) ( ) ( )= = =3 3
10001000
1000infinity), f (x) becomes extremely small in comparison with g(x). For example, when the value ofx is 1,000,000, g(x) is times bigger than f (x) (i.e. f (x) is only 0.1% of the size of1 000 000
1000 1000, , =g(x)). What was just illustrated applies to any two power functions with different exponents. Forexample, given 5x7 and 700x4, once x gets very large the fact that 700 is much bigger than 5really doesn’t matter much. The extra x3 in x7 (compared to x4) will end up making 700x4 verysmall in comparison to 5x7 for very large x. This can be summarized as follows.
Fact 5.1: As x 6 4 or x 6 - 4 the power function with the largest exponentdominates all power functions with smaller exponents.
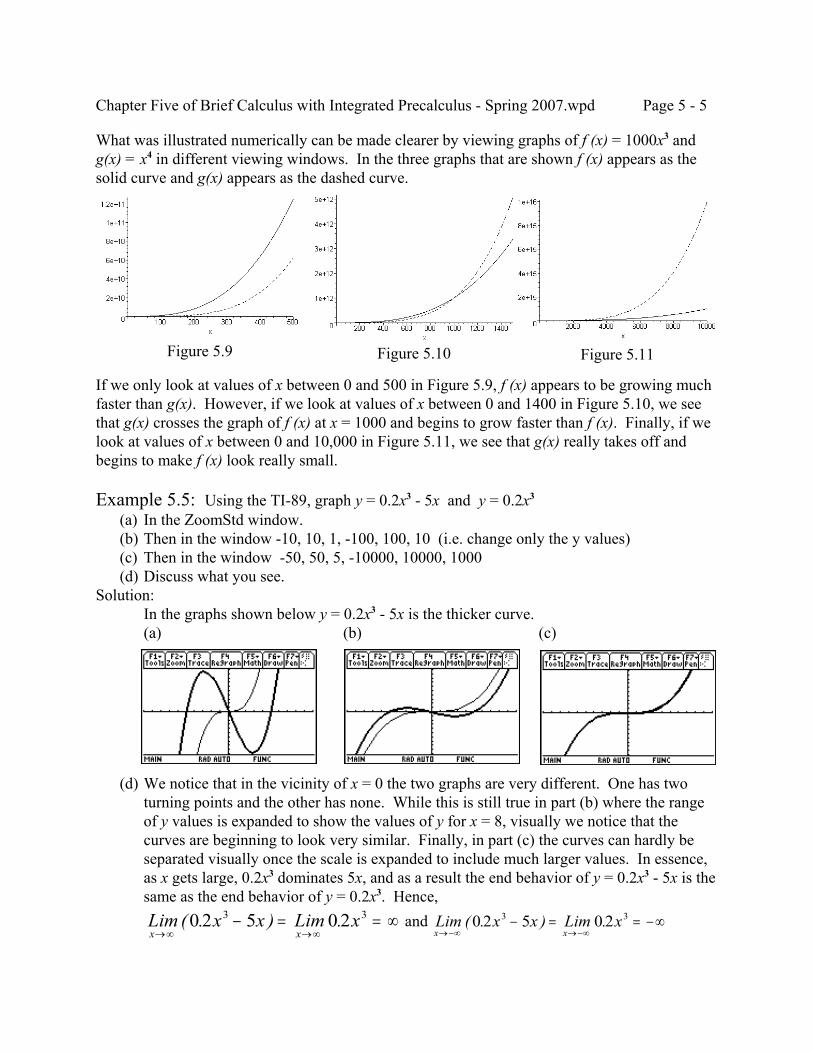
Chapter Five of Brief Calculus with Integrated Precalculus - Spring 2007.wpd Page 5 - 5
Figure 5.9 Figure 5.10 Figure 5.11
What was illustrated numerically can be made clearer by viewing graphs of f (x) = 1000x3 andg(x) = x4 in different viewing windows. In the three graphs that are shown f (x) appears as thesolid curve and g(x) appears as the dashed curve.
If we only look at values of x between 0 and 500 in Figure 5.9, f (x) appears to be growing muchfaster than g(x). However, if we look at values of x between 0 and 1400 in Figure 5.10, we seethat g(x) crosses the graph of f (x) at x = 1000 and begins to grow faster than f (x). Finally, if welook at values of x between 0 and 10,000 in Figure 5.11, we see that g(x) really takes off andbegins to make f (x) look really small.
Example 5.5: Using the TI-89, graph y = 0.2x3 - 5x and y = 0.2x3
(a) In the ZoomStd window. (b) Then in the window -10, 10, 1, -100, 100, 10 (i.e. change only the y values) (c) Then in the window -50, 50, 5, -10000, 10000, 1000 (d) Discuss what you see.Solution:
In the graphs shown below y = 0.2x3 - 5x is the thicker curve.(a) (b) (c)
(d) We notice that in the vicinity of x = 0 the two graphs are very different. One has twoturning points and the other has none. While this is still true in part (b) where the rangeof y values is expanded to show the values of y for x = 8, visually we notice that thecurves are beginning to look very similar. Finally, in part (c) the curves can hardly beseparated visually once the scale is expanded to include much larger values. In essence,as x gets large, 0.2x3 dominates 5x, and as a result the end behavior of y = 0.2x3 - 5x is thesame as the end behavior of y = 0.2x3. Hence,
andLim x x Lim xx x→∞ →∞
− = = ∞( . ) .0 2 5 0 23 3 Lim x x Lim xx x→−∞ →−∞
− = = −∞( . ) .0 2 5 0 23 3
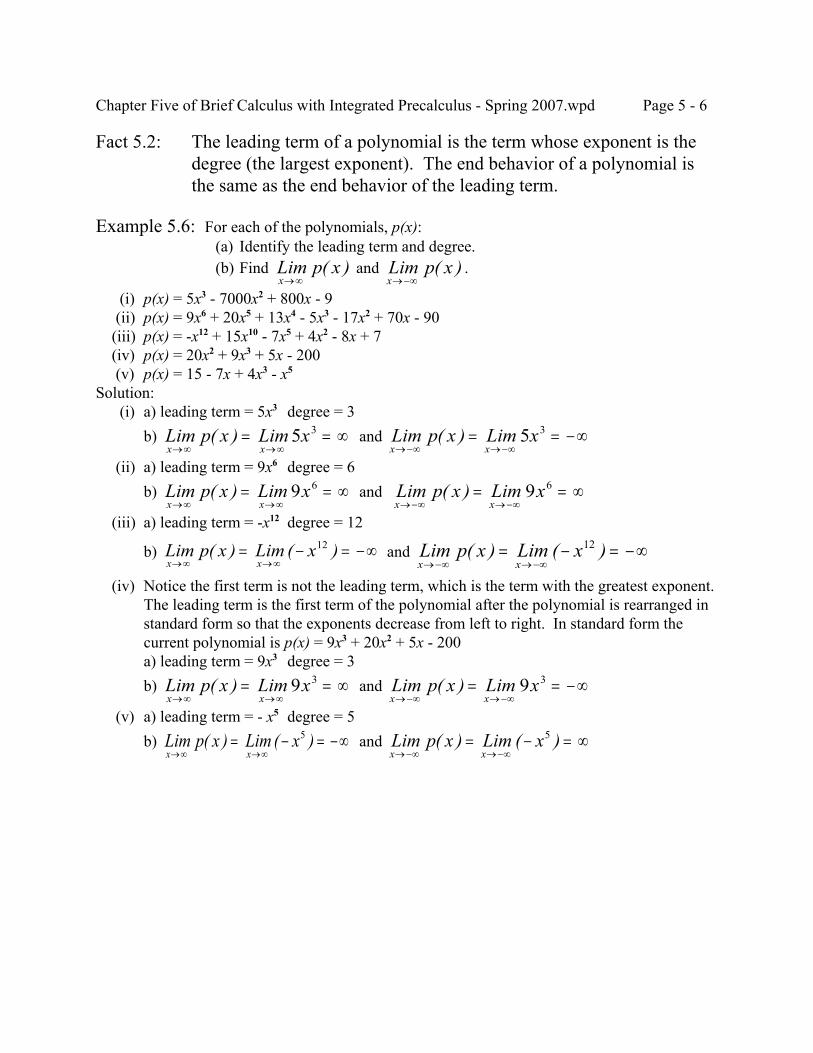
Chapter Five of Brief Calculus with Integrated Precalculus - Spring 2007.wpd Page 5 - 6
Fact 5.2: The leading term of a polynomial is the term whose exponent is thedegree (the largest exponent). The end behavior of a polynomial isthe same as the end behavior of the leading term.
Example 5.6: For each of the polynomials, p(x): (a) Identify the leading term and degree. (b) Find and .Lim p x
x→∞( ) Lim p x
x→−∞( )
(i) p(x) = 5x3 - 7000x2 + 800x - 9 (ii) p(x) = 9x6 + 20x5 + 13x4 - 5x3 - 17x2 + 70x - 90 (iii) p(x) = -x12 + 15x10 - 7x5 + 4x2 - 8x + 7 (iv) p(x) = 20x2 + 9x3 + 5x - 200 (v) p(x) = 15 - 7x + 4x3 - x5
Solution: (i) a) leading term = 5x3 degree = 3
b) and Lim p x Lim xx x→∞ →∞
= = ∞( ) 5 3 Lim p x Lim xx x→−∞ →−∞
= = −∞( ) 5 3
(ii) a) leading term = 9x6 degree = 6b) and Lim p x Lim x
x x→∞ →∞= = ∞( ) 9 6 Lim p x Lim x
x x→−∞ →−∞= = ∞( ) 9 6
(iii) a) leading term = -x12 degree = 12
b) and Lim p x Lim xx x→∞ →∞
= − = −∞( ) ( )12 Lim p x Lim xx x→−∞ →−∞
= − = −∞( ) ( )12
(iv) Notice the first term is not the leading term, which is the term with the greatest exponent.The leading term is the first term of the polynomial after the polynomial is rearranged instandard form so that the exponents decrease from left to right. In standard form thecurrent polynomial is p(x) = 9x3 + 20x2 + 5x - 200a) leading term = 9x3 degree = 3b) and Lim p x Lim x
x x→∞ →∞= = ∞( ) 9 3 Lim p x Lim x
x x→−∞ →−∞= = −∞( ) 9 3
(v) a) leading term = - x5 degree = 5b) and Lim p x Lim x
x x→∞ →∞= − = −∞( ) ( )5 Lim p x Lim x
x x→−∞ →−∞= − = ∞( ) ( )5
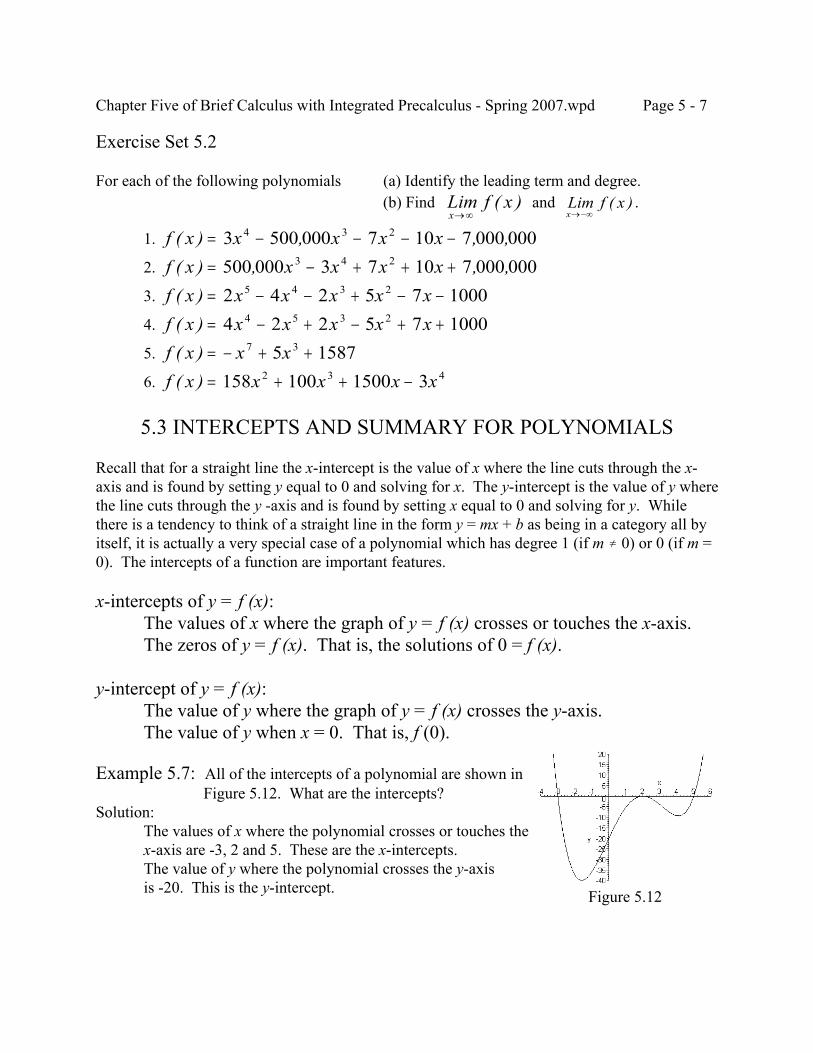
Chapter Five of Brief Calculus with Integrated Precalculus - Spring 2007.wpd Page 5 - 7
Figure 5.12
Exercise Set 5.2
For each of the following polynomials (a) Identify the leading term and degree.(b) Find and .Lim f x
x→∞( ) Lim f x
x→−∞( )
1. f x x x x x( ) , , ,= − − − −3 500 000 7 10 7 000 0004 3 2
2. f x x x x x( ) , , ,= − + + +500 000 3 7 10 7 000 0003 4 2
3. f x x x x x x( ) = − − + − −2 4 2 5 7 10005 4 3 2
4. f x x x x x x( ) = − + − + +4 2 2 5 7 10004 5 3 2
5. f x x x( ) = − + +7 35 15876. f x x x x x( ) = + + −158 100 1500 32 3 4
5.3 INTERCEPTS AND SUMMARY FOR POLYNOMIALS
Recall that for a straight line the x-intercept is the value of x where the line cuts through the x-axis and is found by setting y equal to 0 and solving for x. The y-intercept is the value of y wherethe line cuts through the y -axis and is found by setting x equal to 0 and solving for y. Whilethere is a tendency to think of a straight line in the form y = mx + b as being in a category all byitself, it is actually a very special case of a polynomial which has degree 1 (if m … 0) or 0 (if m =0). The intercepts of a function are important features.
x-intercepts of y = f (x):The values of x where the graph of y = f (x) crosses or touches the x-axis.The zeros of y = f (x). That is, the solutions of 0 = f (x).
y-intercept of y = f (x):The value of y where the graph of y = f (x) crosses the y-axis.The value of y when x = 0. That is, f (0).
Example 5.7: All of the intercepts of a polynomial are shown in Figure 5.12. What are the intercepts?
Solution:The values of x where the polynomial crosses or touches thex-axis are -3, 2 and 5. These are the x-intercepts.The value of y where the polynomial crosses the y-axisis -20. This is the y-intercept.
Chapter Five of Brief Calculus with Integrated Precalculus - Spring 2007.wpd Page 5 - 8
Example 5.8: Find the intercepts of (a) f (x) = 12x3 - 20x2 - 8x and(b) f (x) = 2x2 - 5x - 33
Solution: (a) y-intercept - Set x = 0: y = 12(0)3 - 20(0)2 - 8(0) = 0.
So the y-intercept is 0, or, more precisely, (0, 0).x-intercepts - Set y = 0: 0 = 12x3 - 20x2 - 8x = 4x(3x2 - 5x - 2) = 4x(3x + 1)(x - 2)
Y x = -1/3, 0 or 2. The x-intercepts are (-1/3, 0), (0, 0) and (2, 0). (b) y-intercept - Set x = 0: y = 2(0)2 - 5(0) - 33 = -33.
x-intercepts - Set y = 0: 0 = 2x2 - 5x - 33 = (2x - 11)(x + 3) Y x = -3 or 11/2.The y-intercept is (0, -33). The x-intercepts are (-3, 0) and (5.5, 0).
Example 5.9: Use the TI-89 to find the intercepts off (x) = 9x6 + 20x5 + 13x4 - 5x3 - 17x2 + 70x - 90
Solution:y-intercept - Set x = 0: y = -90. The y-intercept is (0, -90).x-intercepts - Set y = 0: TI-89 solve(0=9x^6+20x^5+13x^4-5x^3-17x^2+70x-90,x)
Y The x-intercepts are (-2.17616, 0) and (1, 0).
A Brief Summary of Facts Concerning Polynomials
A polynomial of degree n turns at most n - 1 times.The y-intercept is found by setting x = 0.The x-intercepts are found by setting y = 0.f N(x) > 0 Y increasing (rising)f N(x) < 0 Y decreasing (falling)f O(x) > 0 Y concave up (part of curve that “holds water”)f O(x) < 0 Y concave down (part of curve that “does not hold water”)Finding relative extrema:
Solve 0 = f N(x). For each solution find y. The resulting point is called a critical point.Test each critical point by one of three methods: 1. Use the critical values to divide the real line into intervals.
Choose a value of x in each interval and find the value of the derivative at it.A positive derivative means the graph rises (increases) in the interval.A negative derivative means the graph falls (decreases) in the interval.
Use this information to determine whether each critical point is a relativeextremum or not. Rising _`Falling Y Relative Maximum
Falling`_Rising Y Relative MinimumRising__Rising Y Not an extremumFalling``Falling Y Not an extremum
2. First derivative test:Choose a value of x to the left of the critical value, but do not go up to or beyond
the next critical value.Evaluate the derivative at that value and interpret in terms of rising or falling.
Chapter Five of Brief Calculus with Integrated Precalculus - Spring 2007.wpd Page 5 - 9
Do the same for a value of x to the left.Interpret as in method 1.
3. Second derivative test:Evaluate the second derivative at the critical point itself.
Positive Y Relative minimum (“holds water”)Negative Y Relative maximum (“does not hold water”)Zero Y One of the other methods must be used to test the point.
Points of Inflection (where curve changes concavity):Solve 0 = f O(x) and find y for each solution.Use the values of x found to divide the real line into intervals.Choose a value of x in each interval and evaluate f O(x) at it.
The result indicates the concavity for the entire interval.If the sign of f O(x) changes at one of the original values of x, then that value
of x determines an inflection point.In economics applications, a point of inflection is called a point of diminishing returns.
End behavior of polynomials that are not horizontal lines (limit of f (x) as x 6 4 or x 6 - 4)Ignore all terms of the polynomial except the term with the greatest exponent.If the term is positive for positive values of x, then , _ for large x > 0.Lim f x
x→∞= ∞( )
(If it is negative, then , ` for large x > 0.)Lim f xx→∞
= −∞( )If the term is positive for negative values of x, then , a for large x < 0.Lim f x
x→−∞= ∞( )
(If it is negative, then , b for large x < 0.)Lim f xx→−∞
= −∞( )
Example 5.10: For each polynomial listed below: (a) Find the intercepts. (b) Find the critical points. (c) Find the relative extrema. (d) Find the points of inflection. (e) Determine the end behavior (find and ).Lim f x
x→∞( ) Lim f x
x→−∞( )
(f) Graph the polynomial.1. f (x) = 12x2 - 2x3 (Do by hand)2. f (x) = 20 - 105x4 + 84x5 + 70x6 - 60x7
(Do parts (a) to (f) by using the TI-89 but without using the TI-89 to graph the function. Then verify the graph that was drawn by choosing a suitable window to view the graph in on the TI-89.)
Solution:1. (a) y-intercept: y = f (0) = 0 Y (0, 0)
x-intercept: y = 0 = 12x2 - 2x3 = 2x2(6 - x) Y x = 0 or 6 Y (0, 0) and (6, 0) (b) 0 = f N(x) = 24x - 6x2 = 6x(4 - x) Y x = 0 or 4
x = 0 Y y = 0 Y (0, 0) is one critical point.x = 4 Y y = 12(4)2 - 2(4)3 = 64 Y (4, 64) is the other critical point.
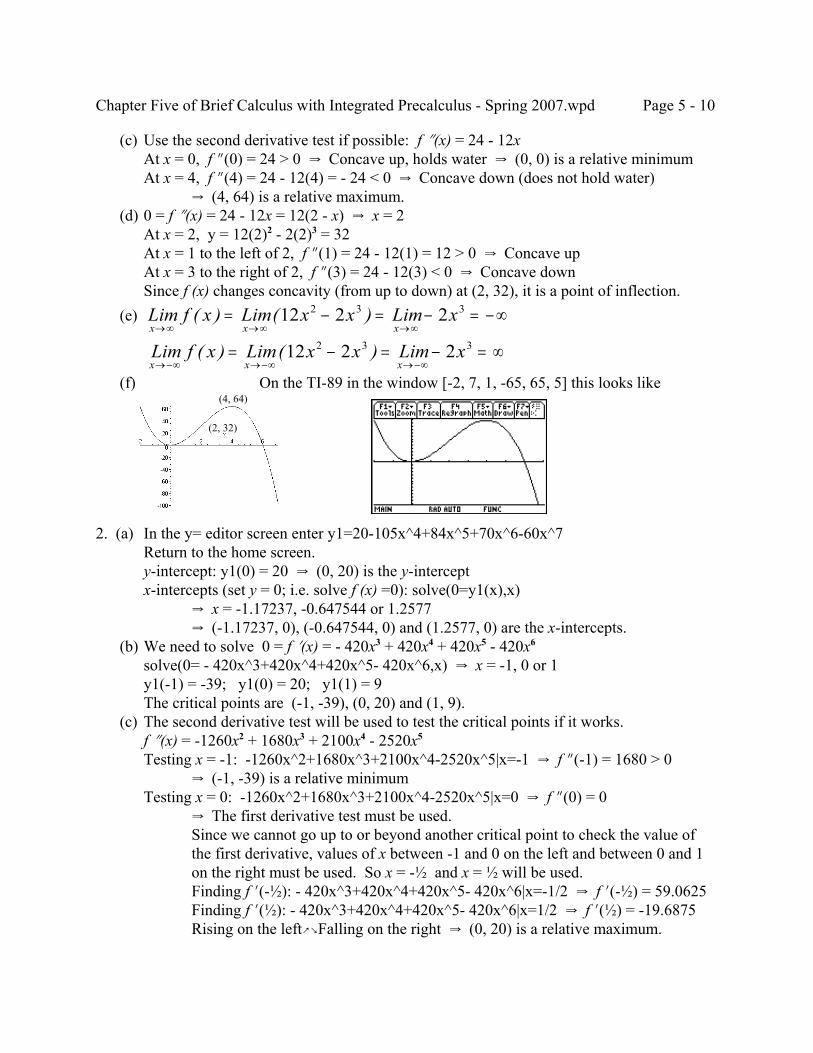
Chapter Five of Brief Calculus with Integrated Precalculus - Spring 2007.wpd Page 5 - 10
(c) Use the second derivative test if possible: f O(x) = 24 - 12xAt x = 0, f O(0) = 24 > 0 Y Concave up, holds water Y (0, 0) is a relative minimumAt x = 4, f O(4) = 24 - 12(4) = - 24 < 0 Y Concave down (does not hold water)
Y (4, 64) is a relative maximum. (d) 0 = f O(x) = 24 - 12x = 12(2 - x) Y x = 2
At x = 2, y = 12(2)2 - 2(2)3 = 32At x = 1 to the left of 2, f O(1) = 24 - 12(1) = 12 > 0 Y Concave upAt x = 3 to the right of 2, f O(3) = 24 - 12(3) < 0 Y Concave downSince f (x) changes concavity (from up to down) at (2, 32), it is a point of inflection.
(e) Lim f x Lim x x Lim xx x x→∞ →∞ →∞
= − = − = −∞( ) ( )12 2 22 3 3
Lim f x Lim x x Lim xx x x→−∞ →−∞ →−∞
= − = − = ∞( ) ( )12 2 22 3 3
(f) On the TI-89 in the window [-2, 7, 1, -65, 65, 5] this looks like
2. (a) In the y= editor screen enter y1=20-105x^4+84x^5+70x^6-60x^7Return to the home screen.y-intercept: y1(0) = 20 Y (0, 20) is the y-interceptx-intercepts (set y = 0; i.e. solve f (x) =0): solve(0=y1(x),x)
Y x = -1.17237, -0.647544 or 1.2577Y (-1.17237, 0), (-0.647544, 0) and (1.2577, 0) are the x-intercepts.
(b) We need to solve 0 = f N(x) = - 420x3 + 420x4 + 420x5 - 420x6
solve(0= - 420x^3+420x^4+420x^5- 420x^6,x) Y x = -1, 0 or 1y1(-1) = -39; y1(0) = 20; y1(1) = 9The critical points are (-1, -39), (0, 20) and (1, 9).
(c) The second derivative test will be used to test the critical points if it works.f O(x) = -1260x2 + 1680x3 + 2100x4 - 2520x5
Testing x = -1: -1260x^2+1680x^3+2100x^4-2520x^5|x=-1 Y f O(-1) = 1680 > 0Y (-1, -39) is a relative minimum
Testing x = 0: -1260x^2+1680x^3+2100x^4-2520x^5|x=0 Y f O(0) = 0Y The first derivative test must be used.Since we cannot go up to or beyond another critical point to check the value ofthe first derivative, values of x between -1 and 0 on the left and between 0 and 1on the right must be used. So x = -½ and x = ½ will be used.Finding f N(-½): - 420x^3+420x^4+420x^5- 420x^6|x=-1/2 Y f N(-½) = 59.0625Finding f N(½): - 420x^3+420x^4+420x^5- 420x^6|x=1/2 Y f N(½) = -19.6875Rising on the left_`Falling on the right Y (0, 20) is a relative maximum.
(2, 32)
(4, 64)
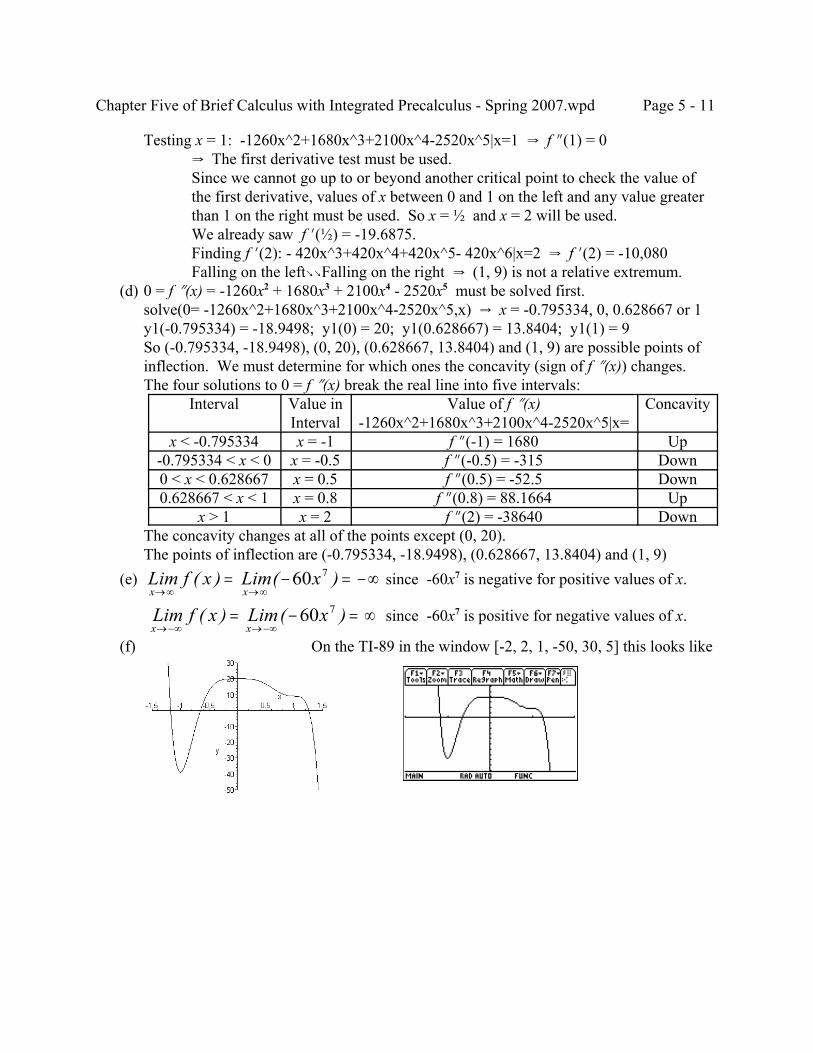
Chapter Five of Brief Calculus with Integrated Precalculus - Spring 2007.wpd Page 5 - 11
Testing x = 1: -1260x^2+1680x^3+2100x^4-2520x^5|x=1 Y f O(1) = 0Y The first derivative test must be used.Since we cannot go up to or beyond another critical point to check the value ofthe first derivative, values of x between 0 and 1 on the left and any value greaterthan 1 on the right must be used. So x = ½ and x = 2 will be used.We already saw f N(½) = -19.6875.Finding f N(2): - 420x^3+420x^4+420x^5- 420x^6|x=2 Y f N(2) = -10,080Falling on the left``Falling on the right Y (1, 9) is not a relative extremum.
(d) 0 = f O(x) = -1260x2 + 1680x3 + 2100x4 - 2520x5 must be solved first.solve(0= -1260x^2+1680x^3+2100x^4-2520x^5,x) Y x = -0.795334, 0, 0.628667 or 1y1(-0.795334) = -18.9498; y1(0) = 20; y1(0.628667) = 13.8404; y1(1) = 9So (-0.795334, -18.9498), (0, 20), (0.628667, 13.8404) and (1, 9) are possible points ofinflection. We must determine for which ones the concavity (sign of f O(x)) changes.The four solutions to 0 = f O(x) break the real line into five intervals:
Interval Value inInterval
Value of f O(x)-1260x^2+1680x^3+2100x^4-2520x^5|x=
Concavity
x < -0.795334 x = -1 f O(-1) = 1680 Up-0.795334 < x < 0 x = -0.5 f O(-0.5) = -315 Down0 < x < 0.628667 x = 0.5 f O(0.5) = -52.5 Down0.628667 < x < 1 x = 0.8 f O(0.8) = 88.1664 Up
x > 1 x = 2 f O(2) = -38640 DownThe concavity changes at all of the points except (0, 20).The points of inflection are (-0.795334, -18.9498), (0.628667, 13.8404) and (1, 9)
(e) since -60x7 is negative for positive values of x.Lim f x Lim xx x→∞ →∞
= − = −∞( ) ( )60 7
since -60x7 is positive for negative values of x.Lim f x Lim xx x→−∞ →−∞
= − = ∞( ) ( )60 7
(f) On the TI-89 in the window [-2, 2, 1, -50, 30, 5] this looks like
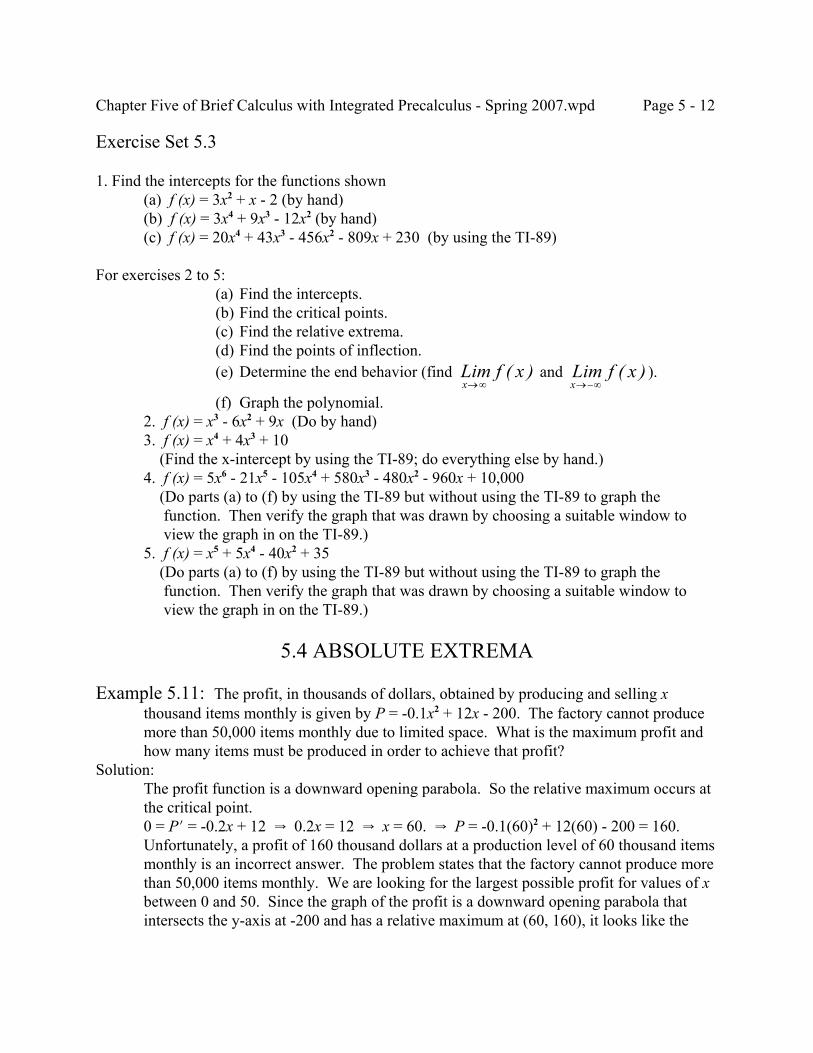
Chapter Five of Brief Calculus with Integrated Precalculus - Spring 2007.wpd Page 5 - 12
Exercise Set 5.3
1. Find the intercepts for the functions shown(a) f (x) = 3x2 + x - 2 (by hand)(b) f (x) = 3x4 + 9x3 - 12x2 (by hand)(c) f (x) = 20x4 + 43x3 - 456x2 - 809x + 230 (by using the TI-89)
For exercises 2 to 5: (a) Find the intercepts. (b) Find the critical points. (c) Find the relative extrema. (d) Find the points of inflection. (e) Determine the end behavior (find and ).Lim f x
x→∞( ) Lim f x
x→−∞( )
(f) Graph the polynomial.2. f (x) = x3 - 6x2 + 9x (Do by hand)3. f (x) = x4 + 4x3 + 10 (Find the x-intercept by using the TI-89; do everything else by hand.)4. f (x) = 5x6 - 21x5 - 105x4 + 580x3 - 480x2 - 960x + 10,000 (Do parts (a) to (f) by using the TI-89 but without using the TI-89 to graph the function. Then verify the graph that was drawn by choosing a suitable window to view the graph in on the TI-89.)5. f (x) = x5 + 5x4 - 40x2 + 35 (Do parts (a) to (f) by using the TI-89 but without using the TI-89 to graph the function. Then verify the graph that was drawn by choosing a suitable window to view the graph in on the TI-89.)
5.4 ABSOLUTE EXTREMA
Example 5.11: The profit, in thousands of dollars, obtained by producing and selling xthousand items monthly is given by P = -0.1x2 + 12x - 200. The factory cannot producemore than 50,000 items monthly due to limited space. What is the maximum profit andhow many items must be produced in order to achieve that profit?
Solution:The profit function is a downward opening parabola. So the relative maximum occurs atthe critical point.0 = PN = -0.2x + 12 Y 0.2x = 12 Y x = 60. Y P = -0.1(60)2 + 12(60) - 200 = 160.Unfortunately, a profit of 160 thousand dollars at a production level of 60 thousand itemsmonthly is an incorrect answer. The problem states that the factory cannot produce morethan 50,000 items monthly. We are looking for the largest possible profit for values of xbetween 0 and 50. Since the graph of the profit is a downward opening parabola thatintersects the y-axis at -200 and has a relative maximum at (60, 160), it looks like the
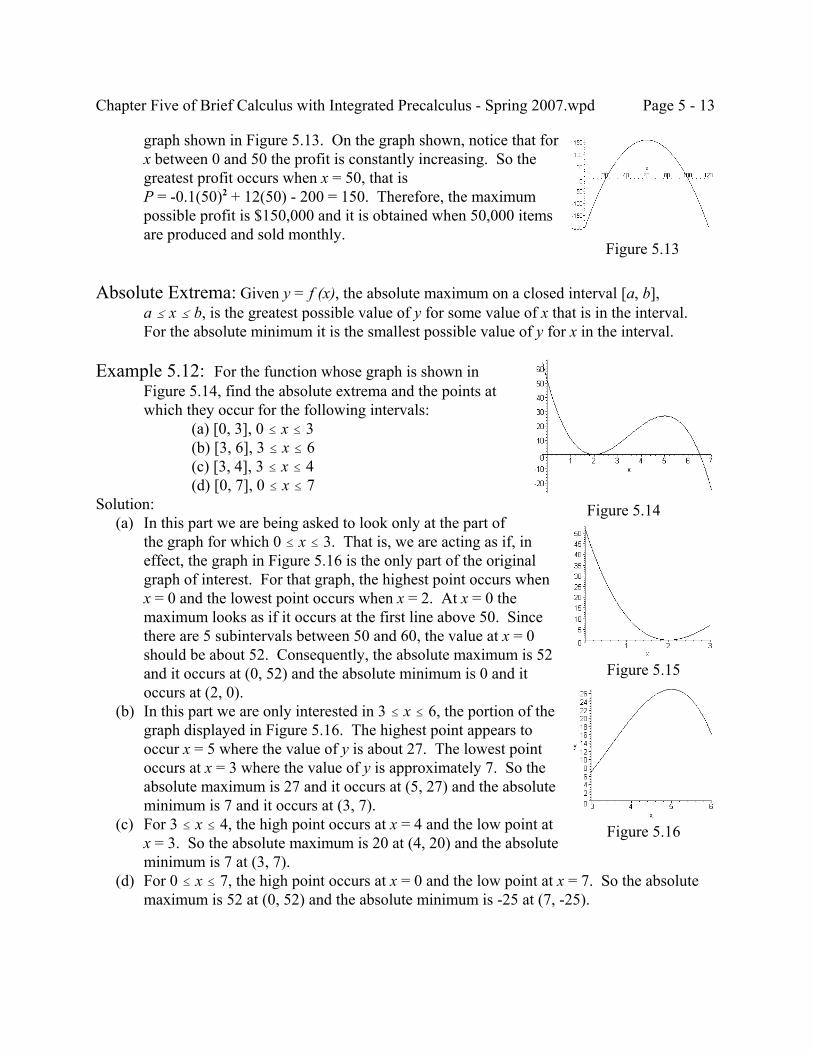
Chapter Five of Brief Calculus with Integrated Precalculus - Spring 2007.wpd Page 5 - 13
Figure 5.13
Figure 5.14
Figure 5.15
Figure 5.16
graph shown in Figure 5.13. On the graph shown, notice that forx between 0 and 50 the profit is constantly increasing. So thegreatest profit occurs when x = 50, that isP = -0.1(50)2 + 12(50) - 200 = 150. Therefore, the maximumpossible profit is $150,000 and it is obtained when 50,000 itemsare produced and sold monthly.
Absolute Extrema: Given y = f (x), the absolute maximum on a closed interval [a, b],a # x # b, is the greatest possible value of y for some value of x that is in the interval.For the absolute minimum it is the smallest possible value of y for x in the interval.
Example 5.12: For the function whose graph is shown inFigure 5.14, find the absolute extrema and the points atwhich they occur for the following intervals:
(a) [0, 3], 0 # x # 3(b) [3, 6], 3 # x # 6(c) [3, 4], 3 # x # 4(d) [0, 7], 0 # x # 7
Solution: (a) In this part we are being asked to look only at the part of
the graph for which 0 # x # 3. That is, we are acting as if, ineffect, the graph in Figure 5.16 is the only part of the originalgraph of interest. For that graph, the highest point occurs whenx = 0 and the lowest point occurs when x = 2. At x = 0 themaximum looks as if it occurs at the first line above 50. Sincethere are 5 subintervals between 50 and 60, the value at x = 0should be about 52. Consequently, the absolute maximum is 52and it occurs at (0, 52) and the absolute minimum is 0 and itoccurs at (2, 0).
(b) In this part we are only interested in 3 # x # 6, the portion of thegraph displayed in Figure 5.16. The highest point appears tooccur x = 5 where the value of y is about 27. The lowest pointoccurs at x = 3 where the value of y is approximately 7. So theabsolute maximum is 27 and it occurs at (5, 27) and the absoluteminimum is 7 and it occurs at (3, 7).
(c) For 3 # x # 4, the high point occurs at x = 4 and the low point atx = 3. So the absolute maximum is 20 at (4, 20) and the absoluteminimum is 7 at (3, 7).
(d) For 0 # x # 7, the high point occurs at x = 0 and the low point at x = 7. So the absolutemaximum is 52 at (0, 52) and the absolute minimum is -25 at (7, -25).
Chapter Five of Brief Calculus with Integrated Precalculus - Spring 2007.wpd Page 5 - 14
Fact 5.3: The absolute extrema on a closed interval [a, b] either occur at one of the endpoints (x = a or x = b) or at a relative extremum contained WITHIN the interval(provided the function is continuous in the interval - can be drawn without takingthe pen off of the paper).
Example 5.13: For the function y = -2x3 + 21x2 - 60x + 52, find the absolute extrema and thepoints at which they occur for the following intervals:(a) [0, 3] (b) [3, 6] (c) [3, 4] (d) [0, 7]
Solution:The function shown is the function that was used to draw the graph in the previousexample. So one possible approach (and it is the safest one) is to first find the relativeextrema and the values of y for each value of x that appears as an end point (0, 3, 4, 6 and7). After doing that you would sketch a graph that shows all of the points found:the relative maximum (5, 27), the relative minimum (2, 0) and the other points: (0, 52),(3, 7), (4, 20), (6, 16) and (7, -25). Then you would proceed as in the previous example(only now you would be certain of the exact value of y at each value of x). As analternate method, you could use the previous fact as indicated below, provided you aresure that you understand what is being done.
(a) First find the points at which relative extrema might occur:0 = yN = -6x2 + 42x - 60 = -6(x2 + 7x - 10) = -6(x - 2)(x - 5) Y x = 2 or 5.At x = 2, y = -2(2)3 + 21(2)2 - 60(2) + 52 = 0.At x = 5, y = -2(5)3 + 21(5)2 - 60(5) + 52 = 27.At the left end point, x = 0, y = 52.At the right end point, x = 3, y = -2(3)3 + 21(3)2 - 60(3) + 52 = 7Since the critical point (5, 27) is not in the interval, we ignore it.So the points that might be absolute extrema are (2, 0) (the critical point in the interval),(0, 52) (the left end point) and (3, 7) (the right end point). The three values of y thatoccur are 0, 52 and 7. The greatest is 52 and the smallest is 0. Therefore, the absolutemaximum is 52 at (0, 52) and the absolute minimum is 0 at (2, 0).
(b) We have already found the two critical points (2, 0) and (5, 27).(2, 0) is not in the interval [3, 6], so we disregard it.The end points are (3, 7) and (6, 16), where the values of y are found by substitution intothe original function. Examining the three possible points (5, 27) (the critical point in theinterval), (3, 7) (the left end point) and (6, 16) (the right end point), we conclude that theabsolute maximum is 27 at (5, 27) and the absolute minimum is 7 at (3, 7).
(c) Neither of the critical points is in the interval [3, 4], so we disregard both.The two end points are (3, 7) and (4, 20). So the absolute maximum is 20 at (4, 20) andthe absolute minimum is 7 at (3, 7).
(d) Both critical points (2, 0) and (5, 27) are in the interval. and the end points are (0, 52)and (7,-25). The absolute maximum is 52 at (0,52) and the absolute minimum is -25 at(7,-25).
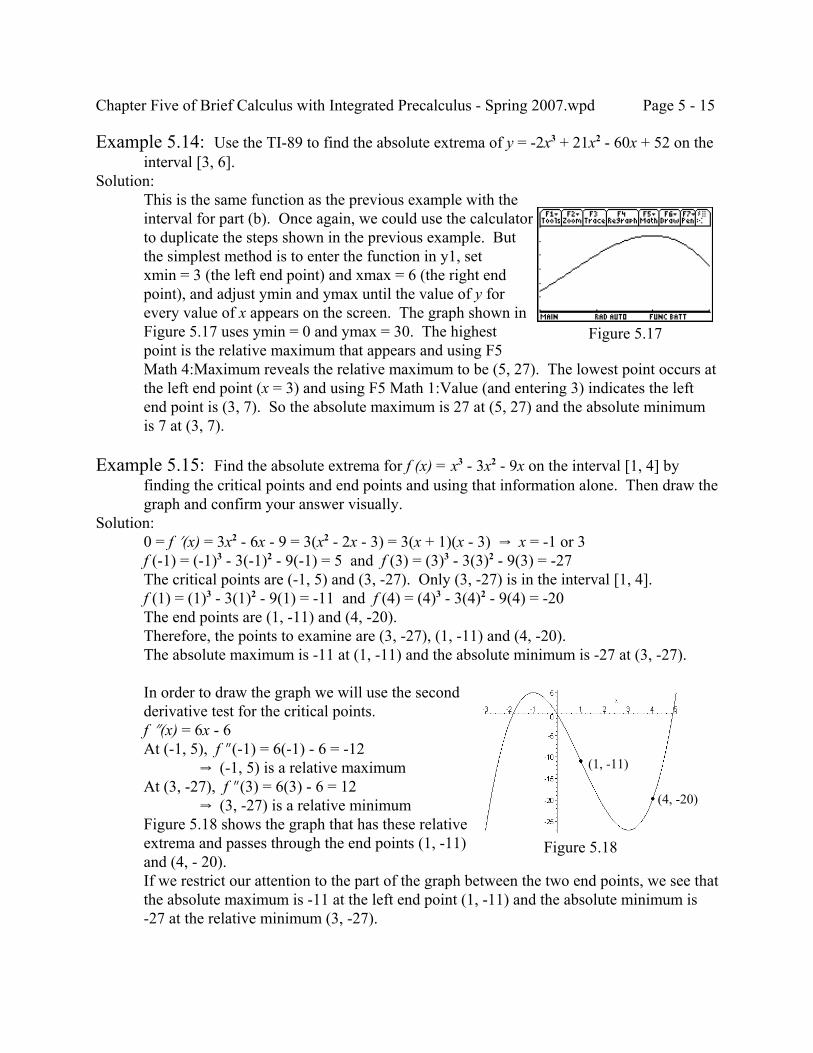
Chapter Five of Brief Calculus with Integrated Precalculus - Spring 2007.wpd Page 5 - 15
Figure 5.17
Figure 5.18
Example 5.14: Use the TI-89 to find the absolute extrema of y = -2x3 + 21x2 - 60x + 52 on theinterval [3, 6].
Solution:This is the same function as the previous example with theinterval for part (b). Once again, we could use the calculatorto duplicate the steps shown in the previous example. Butthe simplest method is to enter the function in y1, setxmin = 3 (the left end point) and xmax = 6 (the right endpoint), and adjust ymin and ymax until the value of y forevery value of x appears on the screen. The graph shown inFigure 5.17 uses ymin = 0 and ymax = 30. The highestpoint is the relative maximum that appears and using F5Math 4:Maximum reveals the relative maximum to be (5, 27). The lowest point occurs atthe left end point (x = 3) and using F5 Math 1:Value (and entering 3) indicates the leftend point is (3, 7). So the absolute maximum is 27 at (5, 27) and the absolute minimumis 7 at (3, 7).
Example 5.15: Find the absolute extrema for f (x) = x3 - 3x2 - 9x on the interval [1, 4] byfinding the critical points and end points and using that information alone. Then draw thegraph and confirm your answer visually.
Solution:0 = f N(x) = 3x2 - 6x - 9 = 3(x2 - 2x - 3) = 3(x + 1)(x - 3) Y x = -1 or 3f (-1) = (-1)3 - 3(-1)2 - 9(-1) = 5 and f (3) = (3)3 - 3(3)2 - 9(3) = -27The critical points are (-1, 5) and (3, -27). Only (3, -27) is in the interval [1, 4].f (1) = (1)3 - 3(1)2 - 9(1) = -11 and f (4) = (4)3 - 3(4)2 - 9(4) = -20The end points are (1, -11) and (4, -20).Therefore, the points to examine are (3, -27), (1, -11) and (4, -20).The absolute maximum is -11 at (1, -11) and the absolute minimum is -27 at (3, -27).
In order to draw the graph we will use the secondderivative test for the critical points.f O(x) = 6x - 6At (-1, 5), f O(-1) = 6(-1) - 6 = -12
Y (-1, 5) is a relative maximumAt (3, -27), f O(3) = 6(3) - 6 = 12
Y (3, -27) is a relative minimumFigure 5.18 shows the graph that has these relativeextrema and passes through the end points (1, -11)and (4, - 20).If we restrict our attention to the part of the graph between the two end points, we see thatthe absolute maximum is -11 at the left end point (1, -11) and the absolute minimum is-27 at the relative minimum (3, -27).
(1, -11)
(4, -20)
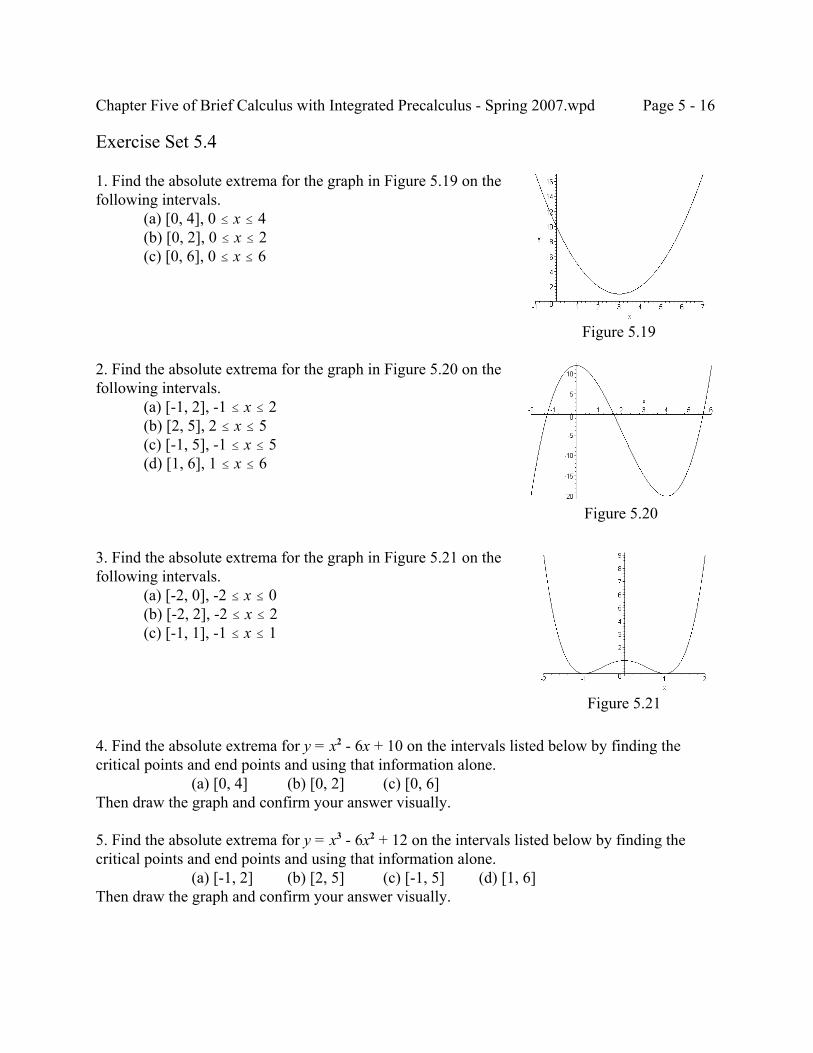
Chapter Five of Brief Calculus with Integrated Precalculus - Spring 2007.wpd Page 5 - 16
Figure 5.19
Figure 5.20
Figure 5.21
Exercise Set 5.4
1. Find the absolute extrema for the graph in Figure 5.19 on thefollowing intervals.
(a) [0, 4], 0 # x # 4(b) [0, 2], 0 # x # 2(c) [0, 6], 0 # x # 6
2. Find the absolute extrema for the graph in Figure 5.20 on thefollowing intervals.
(a) [-1, 2], -1 # x # 2(b) [2, 5], 2 # x # 5(c) [-1, 5], -1 # x # 5(d) [1, 6], 1 # x # 6
3. Find the absolute extrema for the graph in Figure 5.21 on thefollowing intervals.
(a) [-2, 0], -2 # x # 0(b) [-2, 2], -2 # x # 2(c) [-1, 1], -1 # x # 1
4. Find the absolute extrema for y = x2 - 6x + 10 on the intervals listed below by finding thecritical points and end points and using that information alone.
(a) [0, 4] (b) [0, 2] (c) [0, 6]Then draw the graph and confirm your answer visually.
5. Find the absolute extrema for y = x3 - 6x2 + 12 on the intervals listed below by finding thecritical points and end points and using that information alone.
(a) [-1, 2] (b) [2, 5] (c) [-1, 5] (d) [1, 6]Then draw the graph and confirm your answer visually.
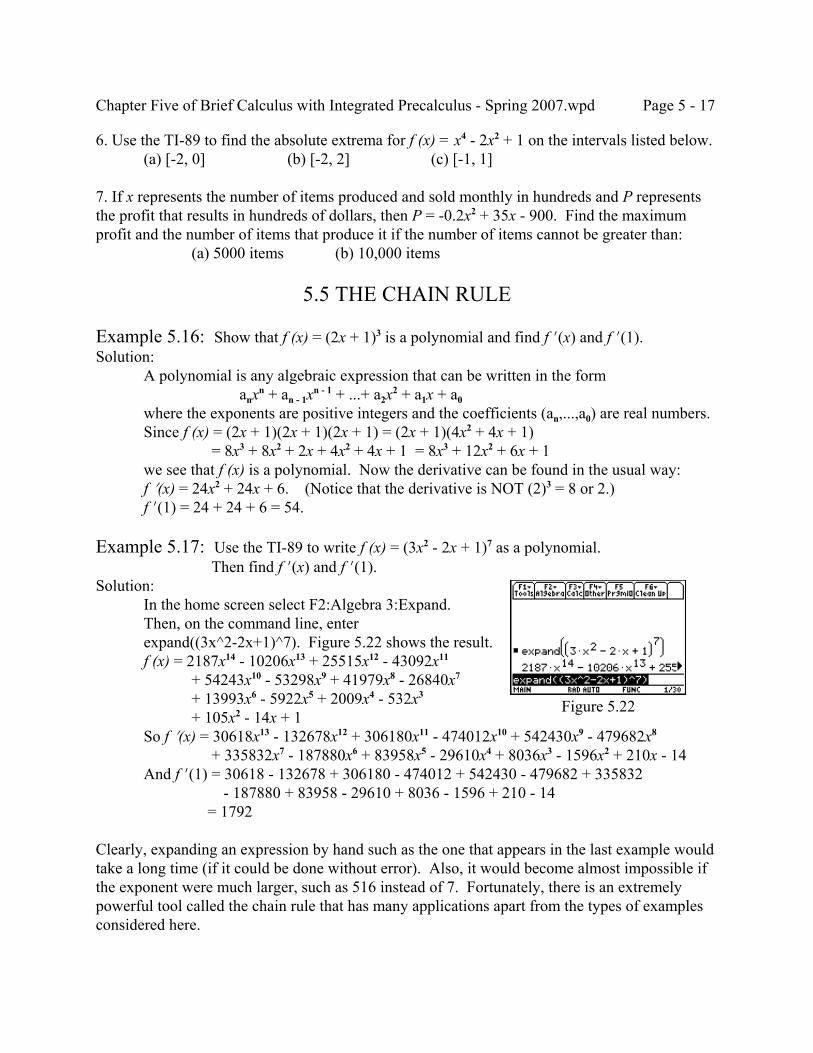
Chapter Five of Brief Calculus with Integrated Precalculus - Spring 2007.wpd Page 5 - 17
Figure 5.22
6. Use the TI-89 to find the absolute extrema for f (x) = x4 - 2x2 + 1 on the intervals listed below.(a) [-2, 0] (b) [-2, 2] (c) [-1, 1]
7. If x represents the number of items produced and sold monthly in hundreds and P representsthe profit that results in hundreds of dollars, then P = -0.2x2 + 35x - 900. Find the maximumprofit and the number of items that produce it if the number of items cannot be greater than:
(a) 5000 items (b) 10,000 items
5.5 THE CHAIN RULE
Example 5.16: Show that f (x) = (2x + 1)3 is a polynomial and find f N(x) and f N(1).Solution:
A polynomial is any algebraic expression that can be written in the formanxn + an - 1xn - 1 + ...+ a2x2 + a1x + a0
where the exponents are positive integers and the coefficients (an,...,a0) are real numbers.Since f (x) = (2x + 1)(2x + 1)(2x + 1) = (2x + 1)(4x2 + 4x + 1)
= 8x3 + 8x2 + 2x + 4x2 + 4x + 1 = 8x3 + 12x2 + 6x + 1we see that f (x) is a polynomial. Now the derivative can be found in the usual way:f N(x) = 24x2 + 24x + 6. (Notice that the derivative is NOT (2)3 = 8 or 2.)f N(1) = 24 + 24 + 6 = 54.
Example 5.17: Use the TI-89 to write f (x) = (3x2 - 2x + 1)7 as a polynomial. Then find f N(x) and f N(1).
Solution:In the home screen select F2:Algebra 3:Expand.Then, on the command line, enterexpand((3x^2-2x+1)^7). Figure 5.22 shows the result.f (x) = 2187x14 - 10206x13 + 25515x12 - 43092x11
+ 54243x10 - 53298x9 + 41979x8 - 26840x7
+ 13993x6 - 5922x5 + 2009x4 - 532x3
+ 105x2 - 14x + 1So f N(x) = 30618x13 - 132678x12 + 306180x11 - 474012x10 + 542430x9 - 479682x8
+ 335832x7 - 187880x6 + 83958x5 - 29610x4 + 8036x3 - 1596x2 + 210x - 14And f N(1) = 30618 - 132678 + 306180 - 474012 + 542430 - 479682 + 335832
- 187880 + 83958 - 29610 + 8036 - 1596 + 210 - 14 = 1792
Clearly, expanding an expression by hand such as the one that appears in the last example wouldtake a long time (if it could be done without error). Also, it would become almost impossible ifthe exponent were much larger, such as 516 instead of 7. Fortunately, there is an extremelypowerful tool called the chain rule that has many applications apart from the types of examplesconsidered here.
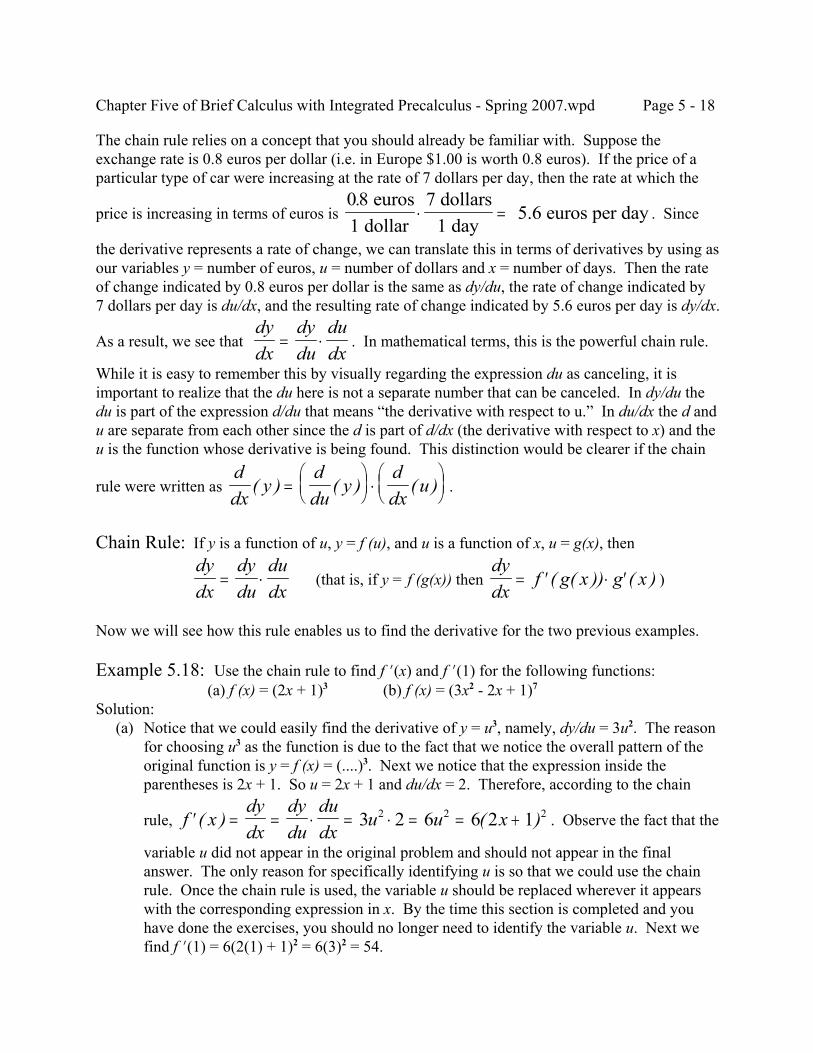
Chapter Five of Brief Calculus with Integrated Precalculus - Spring 2007.wpd Page 5 - 18
The chain rule relies on a concept that you should already be familiar with. Suppose theexchange rate is 0.8 euros per dollar (i.e. in Europe $1.00 is worth 0.8 euros). If the price of aparticular type of car were increasing at the rate of 7 dollars per day, then the rate at which the
price is increasing in terms of euros is . Since08. euros1 dollar
7 dollars1 day
5.6 euros per day⋅ =
the derivative represents a rate of change, we can translate this in terms of derivatives by using asour variables y = number of euros, u = number of dollars and x = number of days. Then the rateof change indicated by 0.8 euros per dollar is the same as dy/du, the rate of change indicated by7 dollars per day is du/dx, and the resulting rate of change indicated by 5.6 euros per day is dy/dx.
As a result, we see that . In mathematical terms, this is the powerful chain rule. dydx
dydu
dudx
= ⋅
While it is easy to remember this by visually regarding the expression du as canceling, it isimportant to realize that the du here is not a separate number that can be canceled. In dy/du thedu is part of the expression d/du that means “the derivative with respect to u.” In du/dx the d andu are separate from each other since the d is part of d/dx (the derivative with respect to x) and theu is the function whose derivative is being found. This distinction would be clearer if the chain
rule were written as .ddx
yddu
yddx
u( ) ( ) ( )=
⋅
Chain Rule: If y is a function of u, y = f (u), and u is a function of x, u = g(x), then
(that is, if y = f (g(x)) then )dydx
dydu
dudx
= ⋅dydx
f g x g x= ′ ⋅ ′( ( )) ( )
Now we will see how this rule enables us to find the derivative for the two previous examples.
Example 5.18: Use the chain rule to find f N(x) and f N(1) for the following functions: (a) f (x) = (2x + 1)3 (b) f (x) = (3x2 - 2x + 1)7
Solution: (a) Notice that we could easily find the derivative of y = u3, namely, dy/du = 3u2. The reason
for choosing u3 as the function is due to the fact that we notice the overall pattern of theoriginal function is y = f (x) = (....)3. Next we notice that the expression inside theparentheses is 2x + 1. So u = 2x + 1 and du/dx = 2. Therefore, according to the chain
rule, . Observe the fact that the′ = = ⋅ = ⋅ = = +f xdydx
dydu
dudx
u u x( ) ( )3 2 6 6 2 12 2 2
variable u did not appear in the original problem and should not appear in the finalanswer. The only reason for specifically identifying u is so that we could use the chainrule. Once the chain rule is used, the variable u should be replaced wherever it appearswith the corresponding expression in x. By the time this section is completed and youhave done the exercises, you should no longer need to identify the variable u. Next wefind f N(1) = 6(2(1) + 1)2 = 6(3)2 = 54.
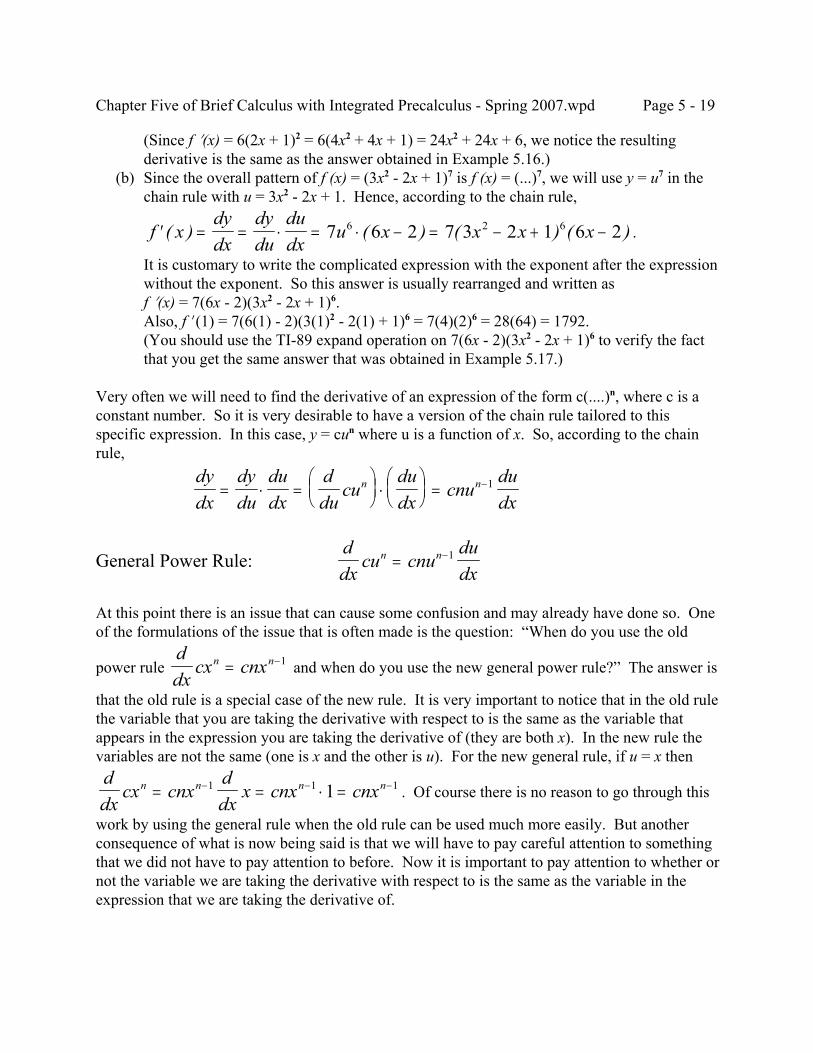
Chapter Five of Brief Calculus with Integrated Precalculus - Spring 2007.wpd Page 5 - 19
(Since f N(x) = 6(2x + 1)2 = 6(4x2 + 4x + 1) = 24x2 + 24x + 6, we notice the resultingderivative is the same as the answer obtained in Example 5.16.)
(b) Since the overall pattern of f (x) = (3x2 - 2x + 1)7 is f (x) = (...)7, we will use y = u7 in thechain rule with u = 3x2 - 2x + 1. Hence, according to the chain rule,
.′ = = ⋅ = ⋅ − = − + −f xdydx
dydu
dudx
u x x x x( ) ( ) ( ) ( )7 6 2 7 3 2 1 6 26 2 6
It is customary to write the complicated expression with the exponent after the expressionwithout the exponent. So this answer is usually rearranged and written asf N(x) = 7(6x - 2)(3x2 - 2x + 1)6.Also, f N(1) = 7(6(1) - 2)(3(1)2 - 2(1) + 1)6 = 7(4)(2)6 = 28(64) = 1792.(You should use the TI-89 expand operation on 7(6x - 2)(3x2 - 2x + 1)6 to verify the factthat you get the same answer that was obtained in Example 5.17.)
Very often we will need to find the derivative of an expression of the form c(....)n, where c is aconstant number. So it is very desirable to have a version of the chain rule tailored to thisspecific expression. In this case, y = cun where u is a function of x. So, according to the chainrule,
dydx
dydu
dudx
ddu
cududx
cnududx
n n= ⋅ =
⋅
= −1
General Power Rule:ddx
cu cnududx
n n= −1
At this point there is an issue that can cause some confusion and may already have done so. Oneof the formulations of the issue that is often made is the question: “When do you use the old
power rule and when do you use the new general power rule?” The answer isddx
cx cnxn n= −1
that the old rule is a special case of the new rule. It is very important to notice that in the old rulethe variable that you are taking the derivative with respect to is the same as the variable thatappears in the expression you are taking the derivative of (they are both x). In the new rule thevariables are not the same (one is x and the other is u). For the new general rule, if u = x then
. Of course there is no reason to go through thisddx
cx cnxddx
x cnx cnxn n n n= = ⋅ =− − −1 1 11
work by using the general rule when the old rule can be used much more easily. But anotherconsequence of what is now being said is that we will have to pay careful attention to somethingthat we did not have to pay attention to before. Now it is important to pay attention to whether ornot the variable we are taking the derivative with respect to is the same as the variable in theexpression that we are taking the derivative of.
Chapter Five of Brief Calculus with Integrated Precalculus - Spring 2007.wpd Page 5 - 20
(because t is not x) butddx
t tdtdx
7 355 4=ddx
x x7 355 4=
(because x is not t) butddt
x xdxdt
7 355 4=ddt
t t7 355 4=
Example 5.19: Find the derivative of each of the following:(a) y = (3x + 7)9 (b) y = 2(5x - 4)11 (c) f (x) = 4(3x2 - 5x + 1)6
Solution:For the first two functions we will explicitly identify what the function u is in the generalchain rule. But then an indication will be given as to how to go about doing the problemwithout explicitly identifying u, which is the goal.
(a) Here y = (...)9, so we choose u = 3x + 7 in order to have y = u9 (and the general power ruleapplies).
dydx
ddx
u ududx
xddx
x x x= = = + + = + = +9 8 8 8 89 9 3 7 3 7 9 3 7 3 27 3 7( ) ( ) ( ) ( ) ( )
Observe u is replaced by the function of x that it is equal to after the general power rulehas been used. It is best, however, to see the fundamental idea of what the general powerrule is saying without explicitly identifying u as follows:ddx
xddx
ddx
xddx
x( ) (... ) (... ) (... ) ( ) ( )3 7 9 9 3 7 3 79 9 8 8+ = = = + +
(b) Here y = 2(...)11, so we choose u = 5x - 4 in order to have y = 2u11.dydx
ddx
u ududx
xddx
x x= = = − − = −2 22 22 5 4 5 4 110 5 411 10 10 10( ) ( ) ( )
Viewed without explicitly identifying u this becomesddx
xddx
ddx
2 5 4 2 2211 11 10( ) (... ) (... ) (... )− = =
= 22 5 4 5 4 22 5 4 5 110 5 410 10 10( ) ( ) ( ) ( )xddx
x x x− − = − ⋅ = −
(c)ddx
x xddx
ddx
4 3 5 1 4 242 6 6 5( ) (... ) (... ) (... )− + = =
= 24 3 5 1 3 5 1 24 3 5 1 6 52 5 2 2 5( ) ( ) ( ) ( )x xddx
x x x x x− + − + = − + −
= 24(6x - 5)(3x2 - 5x + 1)5 (arranged in the customary format)From now on the portion with (...) will be omitted since the idea should now be clear aftersome practice.
Chapter Five of Brief Calculus with Integrated Precalculus - Spring 2007.wpd Page 5 - 21
Example 5.20: Find the equation of the line tangent to y = 3(x3 - 6x + 2)4 at x = 2.Solution:
The slope of the tangent line is the value of the derivative at x = 2.dy/dx = 12(x3 - 6x + 2)3(3x2 - 6)At x = 2 the value of the derivative is 12(8 - 12 + 2)3(3(4) - 6) = 12(-2)3(6) = -576.In order to find the equation of the tangent line at x = 2 we need to know the value of y atx = 2. In order to find this, we need to substitute x = 2 into the original equation.At x = 2, y = 3(23 - 6(2) + 2)4 = 3(-2)4 = 48.So we are looking for the equation of the line with slope -576 that passes through (2, 48).y - 48 = -576(x - 2) Y y - 48 = -576x + 1152 Y y = -576x + 1200
Example 5.21: Find the derivative of f (x) = 3x5 - 2x + 5 - 4(x2 - 9)8
Solution:
f N(x) = ddx
xddx
xddx
ddx
x x xddx
x( ) ( ) ( ) ( ( ) ) ( ) ( )3 2 5 4 9 15 2 0 32 9 95 2 8 4 2 7 2− + − − = − + − − −
= 15x4 - 2 - 32(x2 - 9)7(2x) = 15x4 - 2 - 64x(x2 - 9)7
Example 5.22: For the function y = 3(2x - 2)6, (a) Find the intercepts. (b) Find the critical points. (c) Find the relative extrema. (d) Determine the end behavior (find and ).Lim f x
x→∞( ) Lim f x
x→−∞( )
(e) Graph the polynomial.Solution: (a) y-intercept: set x = 0 y = 3(2(0) - 2)6 = 3(-2)6 = 3(64) = 192 Y (0, 192)
x-intercept: set y = 0 0 = 3(2x - 2)6 Y 2x - 2 = 0 Y x = 1 Y (1, 0)
(b) 0 3 2 2 18 2 2 2 26 5= − = − −ddx
x xddx
x( ) ( ) ( )
= Y 2x - 2 = 0 Y x = 118 2 2 2 36 2 25 5( ) ( ) ( )x x− = −At x = 1 y = 3(2(1) - 2)6 = 3(0)6 = 0 (or use the result from part (a))The only critical point is (1, 0).
(c) We will first try to use the second derivative test.d ydx
ddx
dydx
ddx
x xddx
x2
25 436 2 2 180 2 2 2 2=
= − = − −( ) ( ) ( )
= 180(2x - 2)4(2) = 360(2x - 2)4
At x = 1, d2y/dx2 = 360(2(1) - 2)4 = 360(0) = 0 Y the test fails and the first derivative test must be used.
x = 0 is on the left and dy/dx = 36(2(0) - 2)5 = 36(-2)5 = 36(-32) < 0, decreasingx = 2 is on the right and dy/dx = 36(2(2) - 2)5 = 36(2)5 > 0, increasingSo falling `_rising Y (1, 0) is a relative minimum.
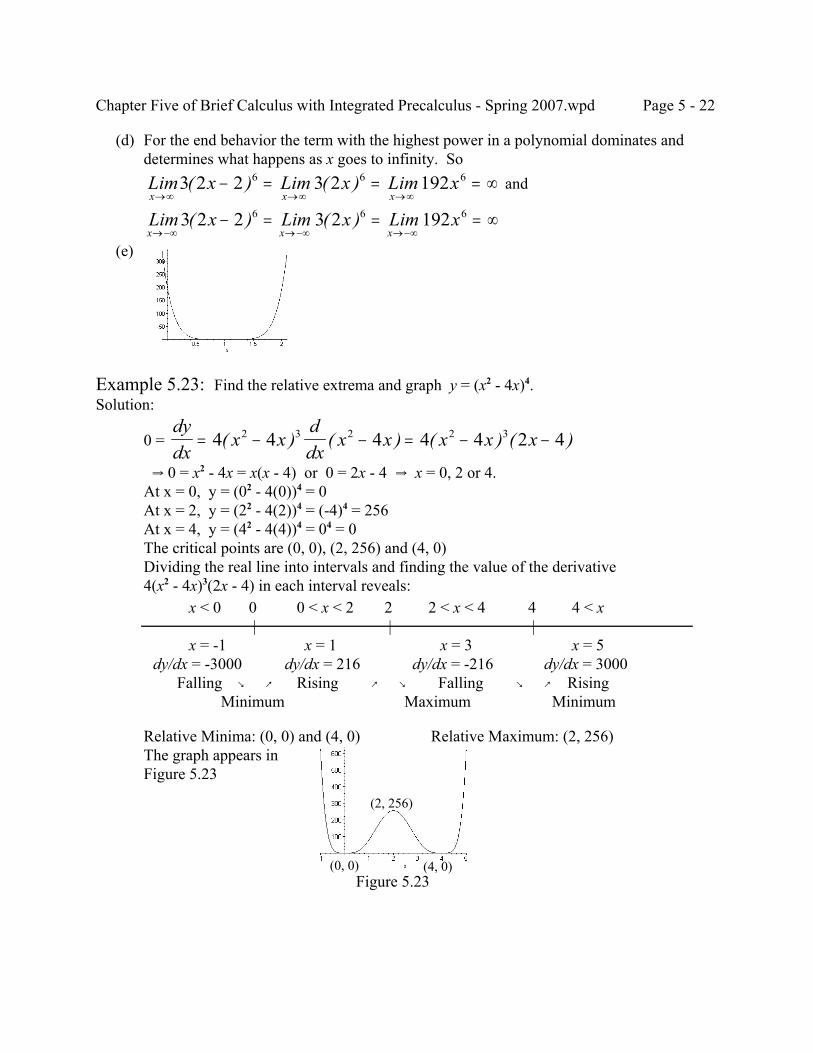
Chapter Five of Brief Calculus with Integrated Precalculus - Spring 2007.wpd Page 5 - 22
Figure 5.23
(d) For the end behavior the term with the highest power in a polynomial dominates anddetermines what happens as x goes to infinity. So
andLim x Lim x Lim xx x x→∞ →∞ →∞
− = = = ∞3 2 2 3 2 1926 6 6( ) ( )
Lim x Lim x Lim xx x x→−∞ →−∞ →−∞
− = = = ∞3 2 2 3 2 1926 6 6( ) ( ) (e)
Example 5.23: Find the relative extrema and graph y = (x2 - 4x)4.Solution:
0 = dydx
x xddx
x x x x x= − − = − −4 4 4 4 4 2 42 3 2 2 3( ) ( ) ( ) ( )
Y 0 = x2 - 4x = x(x - 4) or 0 = 2x - 4 Y x = 0, 2 or 4.At x = 0, y = (02 - 4(0))4 = 0At x = 2, y = (22 - 4(2))4 = (-4)4 = 256At x = 4, y = (42 - 4(4))4 = 04 = 0The critical points are (0, 0), (2, 256) and (4, 0)Dividing the real line into intervals and finding the value of the derivative4(x2 - 4x)3(2x - 4) in each interval reveals:
Relative Minima: (0, 0) and (4, 0) Relative Maximum: (2, 256)The graph appears inFigure 5.23
x < 0 0 0 < x < 2 2 2 < x < 4 4 4 < x | | |
x = -1 x = 1 x = 3 x = 5 dy/dx = -3000 dy/dx = 216 dy/dx = -216 dy/dx = 3000 Falling ` _ Rising _ ` Falling ` _ Rising
Minimum Maximum Minimum
(2, 256)
(0, 0) (4, 0)
Chapter Five of Brief Calculus with Integrated Precalculus - Spring 2007.wpd Page 5 - 23
Figure 5.24
Remark: In the previous example the derivative was not simplified as much as possible since theproblem did not ask for the derivative explicitly and it was fine to work with it as it is. As an answer for a derivative it should at least be rearranged as dy/dx = 4(2x - 4)(x2 - 4x)3.That is acceptable as an answer. A much better answer would result if it were factored alittle bit more. There is no problem factoring a 2 out of 2x - 4 to get 8(x - 2)(x2 - 4x)3.However, be very careful when you factor anything out of an expression with an exponentoutside of the parentheses such as the x that can be factored out of x2 - 4x. Rememberthat the exponent of 3 applies to all factors: (x2 - 4x)3 = (x(x - 4))3 = x3(x - 4)3. Hence, thebest answer would be 8x3(x - 2)(x - 4)3.
Remark: It might happen that your answer to a problem differs fromthat in the back of the book and you do not see that they arethe same. The TI-89 can be used to check to see if youranswer is the same as the one that appears in the book. Forexample, we can use the TI-89 to compare 8x3(x - 2)(x - 4)3
with 4(2x - 4)(x2 - 4x)3 as follows. In the home screen entersolve(8x^3*(x-2)*(x-4)^3=4*(2x-4)*(x^2-4x)^3,x).Figure 5.24 is the result. The answer of “true” means thatthe two expressions agree for every value of x. That is, they are mathematically the same. If you got an answer of “false” or if only specific values of x were given, then the twoexpressions are not mathematically equivalent. Nothing other than “true” will do.
Exercise Set 5.5
1. Write each of the following functions as a polynomial in standard form. Then find f N(x) and f N(2). (a) f (x) = (5x - 7)2 (b) f (x) = 2(x3 + 5x)2
2. Use the TI-89 to write f (x) = (3x2 - 2x + 1)7 as a polynomial. Then find f N(x) and f N(1).
3. For Exercise 1, find f N(x) by using the general power rule and use then find f N(2).
4. For Exercise 2, find f N(x) by hand by using the general power rule and then use the TI-89 toexpand the result and verify it is the same as the result obtained for f N(x) in Exercise 2.
5. Find f N(x) and f N(1) for the following functions: (a) f (x) = (3x - 4)8 (b) f (x) = (x2 + 2)5 (c) f (x) = 4(2x + 3)3 (d) f (x) = (x3 - 6x + 2)4
6. Find the derivative of the following functions: (a) f (x) = (2x2 - 5x + 7)11
(b) f (x) = 3(4x3 + 5x2 - 2)5
7. Find the slope of the line tangent to y = 4(x3 + 6)3 at (-2, -32).
8. Find the equation of the line tangent to y = 5(2x - 3)4 at (2, 5).
Chapter Five of Brief Calculus with Integrated Precalculus - Spring 2007.wpd Page 5 - 24
9. Find the derivative of the following functions: (a) f (x) = 7x - 2 + (3x + 5)12
(b) f (x) = 5x3 + 9x - 3 + 2(x2 + 3)6
10 and 11. For the functions listed below, (a) Find the intercepts. (b) Find the critical points. (c) Find the relative extrema. (d) Determine the end behavior (find and ).Lim f x
x→∞( ) Lim f x
x→−∞( )
(e) Graph the polynomial.10. y = (2 - x)5
11. y = (x2 - 4)3
12. Find the relative extrema and graph y = 2(x2 - 2x - 8)2 - 50.
5.6 ONE SIDED LIMITS AND CONTINUITY
In the previous chapter an intuitive definition of continuity was made. Namely, a function iscontinuous if it can be drawn without taking the pen off the paper. It is now time to examine thenotion of a limit in somewhat more detail and also to provide a more precise definition ofcontinuity. The full implications of the definitions made here will gradually come into full viewwhen rational functions and piecewise defined functions are discussed in future chapters.
Definitions: = Limit of f (x) as x approaches c from the right (positive side)Lim f x
x c→ +( ) = The value of y (if any) that y = f (x) gets closer and closer to as x gets
closer and closer to c on the right.= Limit of f (x) as x approaches c from the left (negative side)Lim f x
x c→ −( ) = The value of y (if any) that y = f (x) gets closer and closer to as x gets
closer and closer to c on the left. If both of the above limits exist and equal each other, then the common value is denoted by
= Limit of f (x) as x approaches cLim f xx c→
( ) = The value of y (if any) that y = f (x) gets closer and closer to as x gets
closer and closer to c.
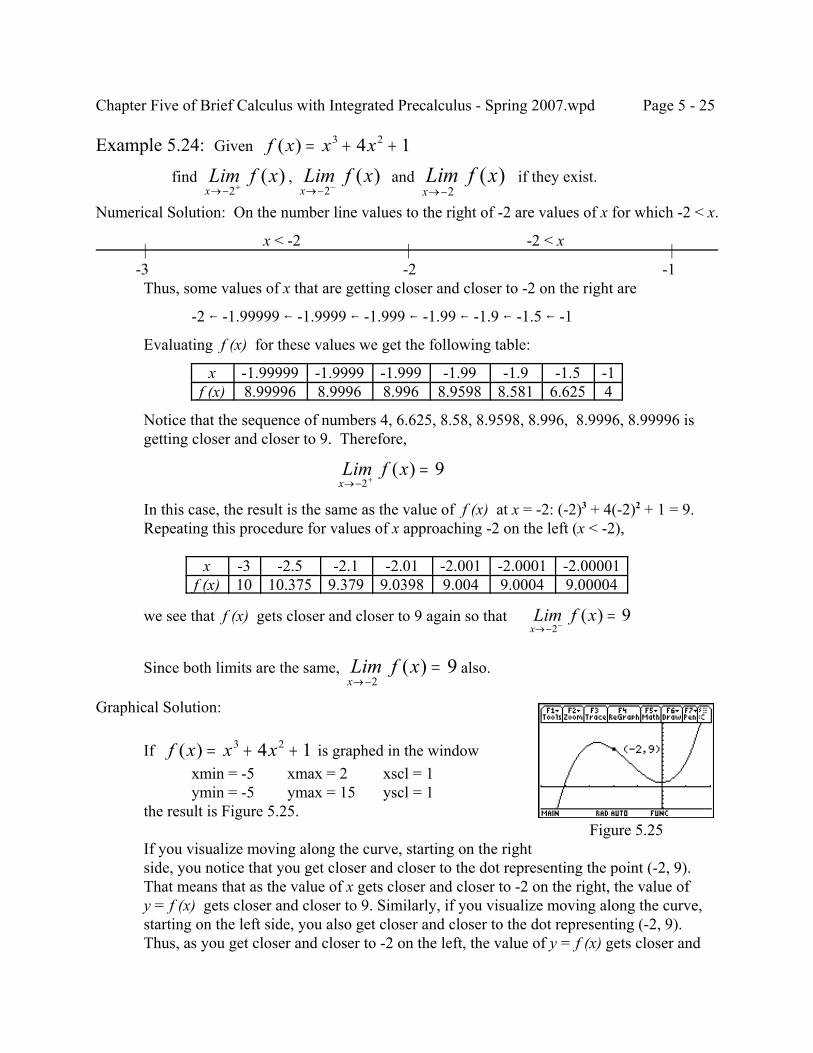
Chapter Five of Brief Calculus with Integrated Precalculus - Spring 2007.wpd Page 5 - 25
Figure 5.25
Example 5.24: Given f x x x( ) = + +3 24 1
find , and if they exist.Lim f xx→− +2
( ) Lim f xx→− −2
( ) Lim f xx→−2
( )
Numerical Solution: On the number line values to the right of -2 are values of x for which -2 < x.
x < -2 -2 < x| | | -3 -2 -1
Thus, some values of x that are getting closer and closer to -2 on the right are
-2 7 -1.99999 7 -1.9999 7 -1.999 7 -1.99 7 -1.9 7 -1.5 7 -1
Evaluating f (x) for these values we get the following table:
x -1.99999 -1.9999 -1.999 -1.99 -1.9 -1.5 -1f (x) 8.99996 8.9996 8.996 8.9598 8.581 6.625 4
Notice that the sequence of numbers 4, 6.625, 8.58, 8.9598, 8.996, 8.9996, 8.99996 isgetting closer and closer to 9. Therefore,
Lim f xx→− +
=2
9( )
In this case, the result is the same as the value of f (x) at x = -2: (-2)3 + 4(-2)2 + 1 = 9.Repeating this procedure for values of x approaching -2 on the left (x < -2),
x -3 -2.5 -2.1 -2.01 -2.001 -2.0001 -2.00001f (x) 10 10.375 9.379 9.0398 9.004 9.0004 9.00004
we see that f (x) gets closer and closer to 9 again so that Lim f xx→− −
=2
9( )
Since both limits are the same, also.Lim f xx→−
=2
9( )
Graphical Solution:
If is graphed in the windowf x x x( ) = + +3 24 1xmin = -5 xmax = 2 xscl = 1ymin = -5 ymax = 15 yscl = 1
the result is Figure 5.25.
If you visualize moving along the curve, starting on the rightside, you notice that you get closer and closer to the dot representing the point (-2, 9). That means that as the value of x gets closer and closer to -2 on the right, the value ofy = f (x) gets closer and closer to 9. Similarly, if you visualize moving along the curve,starting on the left side, you also get closer and closer to the dot representing (-2, 9). Thus, as you get closer and closer to -2 on the left, the value of y = f (x) gets closer and
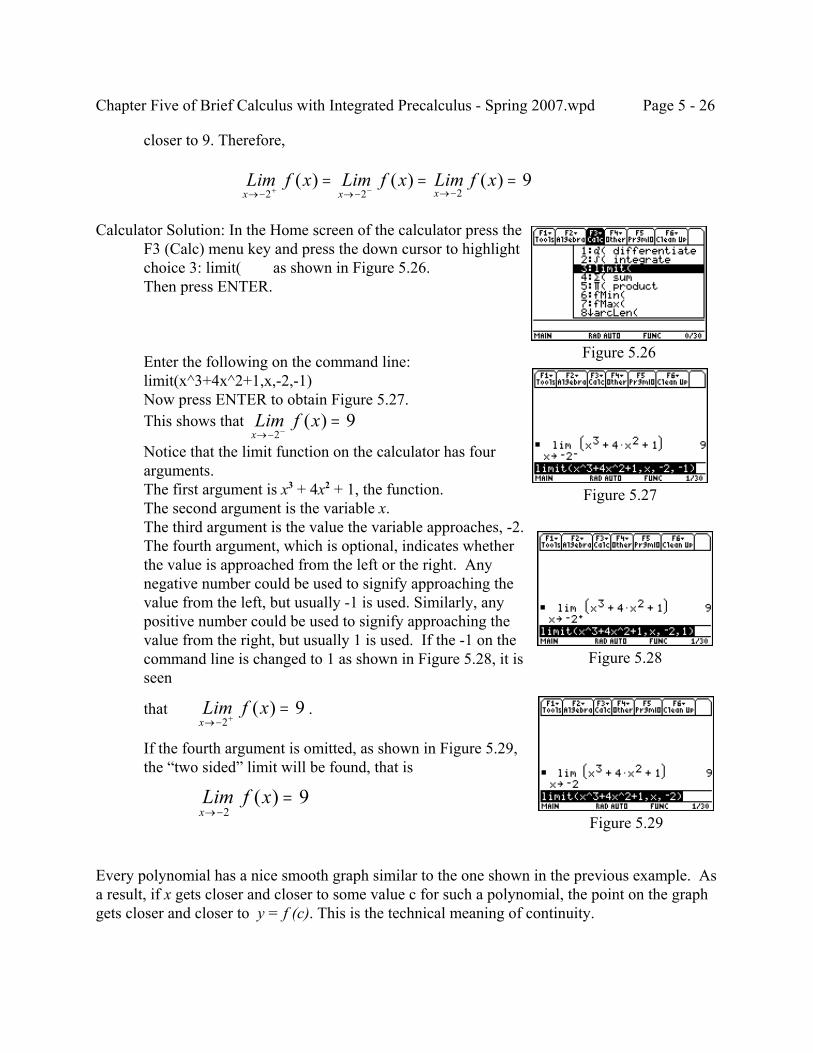
Chapter Five of Brief Calculus with Integrated Precalculus - Spring 2007.wpd Page 5 - 26
Figure 5.26
Figure 5.27
Figure 5.28
Figure 5.29
closer to 9. Therefore,
Lim f x Lim f x Lim f xx x x→− →− →−+ −
= = =2 2 2
9( ) ( ) ( )
Calculator Solution: In the Home screen of the calculator press theF3 (Calc) menu key and press the down cursor to highlightchoice 3: limit( as shown in Figure 5.26.Then press ENTER.
Enter the following on the command line:limit(x^3+4x^2+1,x,-2,-1)Now press ENTER to obtain Figure 5.27.This shows that Lim f x
x→− −=
29( )
Notice that the limit function on the calculator has fourarguments.The first argument is x3 + 4x2 + 1, the function.The second argument is the variable x.The third argument is the value the variable approaches, -2.The fourth argument, which is optional, indicates whetherthe value is approached from the left or the right. Anynegative number could be used to signify approaching thevalue from the left, but usually -1 is used. Similarly, anypositive number could be used to signify approaching thevalue from the right, but usually 1 is used. If the -1 on thecommand line is changed to 1 as shown in Figure 5.28, it isseen
that .Lim f xx→− +
=2
9( )
If the fourth argument is omitted, as shown in Figure 5.29,the “two sided” limit will be found, that is
Lim f xx→−
=2
9( )
Every polynomial has a nice smooth graph similar to the one shown in the previous example. Asa result, if x gets closer and closer to some value c for such a polynomial, the point on the graphgets closer and closer to y = f (c). This is the technical meaning of continuity.
Chapter Five of Brief Calculus with Integrated Precalculus - Spring 2007.wpd Page 5 - 27
Continuous: A function y = f (x) is continuous at x = c iff (c) is defined,
and are defined and finite, andLim f xx c→ +
( ) Lim f xx c→ −
( )
Lim f x Lim f x Lim f x f cx c x c x c→ → →+ −
= = =( ) ( ) ( ) ( )If a function is continuous for all real values of x, then it is said to be continuous.
Fact 5.4: All polynomials are continuous.
Example 5.25: f (x) = x3 + 4x2 + 1 is a polynomial (of degree 3). Therefore,
in general, andLim f x Lim f x Lim f x f c c cx c x c x c→ → →+ −
= = = = + +( ) ( ) ( ) ( ) 3 24 1
Lim f x Lim f x Lim f x f cx x x→− →− →−+ −
= = = = − + − + =2 2 2
3 22 4 2 1 9( ) ( ) ( ) ( ) ( ) ( )
in particular.
Exercise Set 5.6
1. Given the function , fill in the following table.f x x x( ) = − +2 5 33
x 0.9 0.99 0.999 0.999 1 1.0001 1.001 1.01 1.1
f(x) Based on this table, evaluate: (a) , (b) and (c) Lim f x
x→ −1( ) Lim f x
x→ +1( ) Lim f x
x→1( )
2. Given the table below, evaluate: (a) , (b) and (c) Lim f xx→ −1
( ) Lim f xx→ +1
( ) Lim f xx→1
( )
x 0.9 0.99 0.999 0.999 1 1.0001 1.001 1.01 1.1
f(x) 3.4 3.235 3.2006 3.20001 ? 3.19999 3.1905 3.1005 2.9784
3. Given the graph shown on the right, estimate the value of
(a) Lim f xx→−3
( )
(b) Lim f xx→0
( )
(c) Lim f xx→2
( )
Chapter Five of Brief Calculus with Integrated Precalculus - Spring 2007.wpd Page 5 - 28
4. Given the polynomial , findf x x x x( ) = − + −2 9 5 74 3
(a) (b) (c) Lim f xx→−3
( ) Lim f xx→0
( ) Lim f xx→2
( )
5.7 THE PRODUCT RULE
In the last section you might have been puzzled by the fact that the derivative of (x2 + 3)5 was notequal to (2x)5 = 32x5 or some expression other than the one that was found. Also, once it ispointed out that (x2)7 = x14, whose derivative is 14x13, you would at least recognize that this is notthe same as (2x)7 = 128x7 or some other expression that you might think is reasonable. Certainly,using the general power rule, 7(x2)6(2x) = 7(x12)(2x) = 14x13, produces the correct derivative. Theintuitive justification for the chain rule probably made sense to you and the general power rulefollowed from that. The reason for the difficulty is based on the fact that you would like to makesome assumptions that in some cases are correct (the derivative of a sum is the sum of thederivatives) and in other cases are incorrect (think about what you believe the derivative of(x2 + 3)(5x - 7) is if you have not seen it before). Remember that the definition of the derivative
was made the way it was, , precisely because it represented′ =+ −
→f x Lim
f x x f xxx
( )( ) ( )
∆
∆∆0
the instantaneous rate of change that is so important in real world applications. As an isolateddeparture from the overall pattern of this book that avoids proofs, the proof for the rule used tofind the derivative of the product of two functions will be provided along with an explanation ofhow it is developed by a mathematician. But first, let us bury a misconception by means of anexample.
Example 5.26: If f (x) = x2 + 3 and g(x) = 5x - 7,
(a) Find ddx
f x g x( ( ) ( ))⋅
(b) Find f N(x) gN(x).
(c) Does = f N(x) gN(x)?ddx
f x g x( ( ) ( ))⋅
Solution: (a) At this point in the text we know the limit definition of the derivative, the fact that the
derivative of a sum is the sum of the derivatives, the power rule and the general powerrule. So we should not make any assumptions about what the derivative of a product iswithout some justification. Now the product of the two functions under consideration canbe written as a polynomial: f (x) g(x) = (x2 + 3)(5x - 7) = 5x3 - 7x2 + 15x - 21. Therefore,
= .ddx
f x g x( ( ) ( ))⋅ddx
x x x x x( )5 7 15 21 15 14 153 2 2− + − = − +
(b) Since f N(x) = 2x and gN(x) = 5, f N(x) gN(x) = (2x)(5) = 10x. (c) No, (a) and (b) produce different results.
Chapter Five of Brief Calculus with Integrated Precalculus - Spring 2007.wpd Page 5 - 29
Rather than state what the rule is for the product of two functions and then prove it, we will showhow a mathematician arrives at the rule and only then state it as a theorem.
Proof:The limit definition of the derivative of the product f (x) g(x) is
Limf x x g x x f x g x
xx∆
∆ ∆∆→
+ ⋅ + − ⋅0
( ( ) ( )) ( ( ) ( ))
Now a mathematician often does not have a preconceived notion as to what the resultshould be while trying to find out what a result should be and simply tries to use manydifferent approaches until she finds one that works. For example, in this case the productof the limit definitions of the two functions might be examined in an attempt to see if theresult might be shown to equal the limit shown above. As a result of the previousexample we already know this is not a possibility. Another possibility is that themathematician might play with possible rules for the previous example and then, ifsomething was found that seemed to work for that example, try to prove it in general. However, someone experienced in mathematics would look at the above limit and noticesomething that someone less experienced would not. Namely, the mathematician wouldthink to herself, if the g(x) at the end were g(x + ∆x) instead, then the g(x + ∆x) could be
factored out and leave (f (x + ∆x) - f (x)) inside and ′ =+ −
→f x Lim
f x x f xxx
( )( ) ( )
∆
∆∆0
is the definition of the derivative. Now, you cannot change things to make them what youwant them to be. But one of the tricks of the trade is to wonder whether or not you mightget somewhere if you subtracted the desired expression, f (x) g(x + ∆x), in the limit aboveand simultaneously added it so that, in effect, you had not changed the limit as follows:
Limf x x g x x f x g x x f x g x x f x g x
xx∆
∆ ∆ ∆ ∆∆→
+ + − + + + −0
( ) ( ) ( ) ( ) ( ) ( ) ( ) ( )
At this point the mathematician would realize that she had hit pay dirt but it is most likelythat you do not see it. The part of this that the mathematician would notice is that f (x)can be factored out of the second two terms, leaving g(x + ∆x) - g(x) as a factor, andthis, divided by ∆x, involves the definition of the derivative of g(x). In essence, themathematician is now viewing the desired limit as
Limf x x f x g x x g x x g x f x
xx∆
∆ ∆ ∆∆→
+ − + + + −0
[ ( ) ( )] ( ) [ ( ) ( )] ( )
Being very familiar with algebra, the mathematician now rearranges this in accordancewith the idea that prompted this whole line of thought, namely, the desire to see the limitdefinition of f (x) emerge in some way. That is,
Limf x x f x
xg x x
g x x g xx
f xx∆
∆∆
∆∆∆→
+ −
⋅ + +
+ −
0
( ) ( )( )
( ) ( )( )
Chapter Five of Brief Calculus with Integrated Precalculus - Spring 2007.wpd Page 5 - 30
Now and .Limf x x f x
xf x
x∆
∆∆→
+ −= ′
0
( ) ( )( ) Lim
g x x g xx
g xx∆
∆∆→
+ −= ′
0
( ) ( )( )
Also, . The last limit might not seem obvious to you since itLim g x x g xx∆
∆→
+ =0
( ) ( )is true that g(x + ∆x) does not equal g(x). However, as ∆x 6 0, x + ∆x 6 x. Hence, thelast limit is valid if g(x) is continuous (as is the case for a polynomial). It should be notedthat if a function has a derivative (is differentiable) at a point, then it is continuous there. The desired theorem now follows. That is,
Theorem: If f (x) and g(x) are differentiable functions, thenddx
f x g x f x g x g x f x( ( ) ( )) ( ) ( ) ( ) ( )= ′ + ′
Example 5.27: Use the theorem to find for f (x) = x2 + 3 andddx
f x g x( ( ) ( ))⋅
g(x) = 5x - 7. Then verify that this agrees with Example 5.26 part (a).Solution:
Since f N(x) = 2x and gN(x) = 5,
= 2x(5x - 7) + 5(x2 + 3)ddx
f x g x f x g x g x f x( ( ) ( )) ( ) ( ) ( ) ( )= ′ + ′
= 10x2 - 14x + 5x2 + 15 = 15x2 - 14x + 15This is the same answer that was obtained in Example 5.26 part (a).
Stated in a somewhat easier to remember format, the theorem becomes:
Product Rule:ddx
uv udvdx
vdudx
( ) = ⋅
+ ⋅
The derivative of a product is the first factor times the derivative of the second factorplus the second factor times the derivative of the first factor.
Chapter Five of Brief Calculus with Integrated Precalculus - Spring 2007.wpd Page 5 - 31
Example 5.28: Find the derivative of f (x) = (3x + 1)(x2 - 5x + 4)(a) by writing f (x) as a polynomial and then taking the derivative, and(b) by using the product rule to find the derivative and then simplifying the result.
Solution: (a) f (x) = (3x + 1)(x2 - 5x + 4) = 3x3 - 15x2 + 12x + x2 - 5x + 4 = 3x3 - 14x2 + 7x + 4
Y f N(x) = 9x2 - 28x + 7. (b) “The derivative of a product is the first times the derivative of the second plus the second
time the derivative of the first.”The first factor is 3x + 1 and the second factor is x2 - 5x + 4. So, by the product rule,ddx
x x x xddx
x x x xddx
x(( )( )) ( ) ( ) ( ) ( )3 1 5 4 3 1 5 1 5 1 3 12 2 2+ − + = + − +
+ − + +
= (3x + 1)(2x - 5) + (x2 - 5x + 4)(3) = 6x2 -13x - 5 + 3x2 -15x + 12= 9x2 - 28x + 7, which agrees with part (a).
Example 5.29: Find the derivative of (a) f (x) = 3(5x - 7)4 and (b) f (x) = 3x(5x - 7)4.Solution:
The two examples may look very similar to you apart from one feature, but that featurechanges the method by which the problem is done. Notice that part (b) has an extra x init. Let’s see why this has a major impact on the solution.
(a) As written, the general power rule applies in this part. But you should make sure that yourealize that the reason why this is true is due to the fact that 3 is a constant that does notcontain the variable x. Hence,f N(x) = 12(5x - 7)3(5) = 60(5x - 7)3.It should be noted that the product rule could be used here, but it would be a wasted oftime and involve more work to use it as follows:
= 12(5x - 7)3(5) + (5x - 7)4(0) = 60(5x - 7)3.3 5 7 5 7 34 4ddx
x xddx
( ) ( ) ( )− + −
In a very real sense, the reason that the product rule does not have to be used is due to thefact that the derivative of a constant such as 3 is 0. On the other hand, the derivative of3x is not zero, it is 3. And that is why part (b) requires the product rule.
(b) In this part we have a product of two functions, both of which contain x. So the productrule must be used.
f N(x) = = 12x(5x - 7)3(5) + (5x - 7)4(3)3 5 7 5 7 34 4xddx
x xddx
x( ) ( ) ( )− + −
= 60x(5x - 7)3 + 3(5x - 7)4
The answer so far is correct, but some algebraic simplification should be carried out. Notonly is 3 common to the two terms that appear, but (5x - 7)3 is also common to both. Hence, f N(x) = 3 (5x - 7)3[20x + (5x - 7)] = 3(25x - 7)(5x - 7)3.
Chapter Five of Brief Calculus with Integrated Precalculus - Spring 2007.wpd Page 5 - 32
Example 5.30: Find the derivative of (a) f (x) = 3x4(2x3 + 5)6
(b) y = x2(3x2 - 4x + 1)5
Solution:
(a) ′ = + + +f x xddx
x xddx
x( ) ( ) ( ) ( )3 2 5 2 5 34 3 6 3 6 4
= 18x4(2x3 + 5)5(6x2) + (2x3 + 5)6(12x3) = 108x6(2x3 + 5)5 + 12x3 (2x3 + 5)6
= 12x3(2x3 + 5)5[9x3 + (2x3 + 5)]= 12x3(11x3 + 5)(2x3 + 5)5
(b)dydx
xddx
x x x xddx
x= − + + − +2 2 5 2 5 23 4 1 3 4 1( ) ( ) ( )
= 5x2(3x2 - 4x + 1)4(6x - 4) + (3x2 - 4x + 1)5(2x) = 10x2(3x - 2)(3x2 - 4x + 1)4 + 2x(3x2 - 4x + 1)5
The last answer is acceptable for the purposes of this textbook. However, you might wishto observe that 2x(3x2 - 4x + 1)4 is common to both terms so that the derivative can bewritten as 2x(3x2 - 4x + 1)4[5x(3x - 2) + (3x2 - 4x + 1)] = 2x(18x2 - 14x + 1)(3x2 - 4x + 1)4
Example 5.31: Given f (x) = 5(2x + 3)4(7x - 1)6, find the equation of the line tangent to thecurve at (0, 405).
Solution:First we need to find the slope of the tangent at (0, 405), which is f N(0).
′ = + − + − +f x xddx
x xddx
x( ) ( ) ( ) ( ) ( ( ) )5 2 3 7 1 7 1 5 2 34 6 6 4
= 5(2x + 3)4[6(7x - 1)5(7)] + (7x - 1)6[20(2x + 3)3(2)]= 210(2x + 3)4(7x - 1)5 + 40(7x - 1)6(2x + 3)3
There is no need to simplify the derivative any further since we only need to know itsvalue at x = 0. In fact, we could have even stopped at the line before the last one andsubstituted 0 for x. Thus, the slope of the tangent line ism = f N(0) = 210(3)4(-1)5 + 40(-1)6(3)3 = -210(81) + 40(27) = -15,930So the equation of the tangent line can be obtained fromy - 405 = -15,930(x - 0) Y y = -15,930x + 405
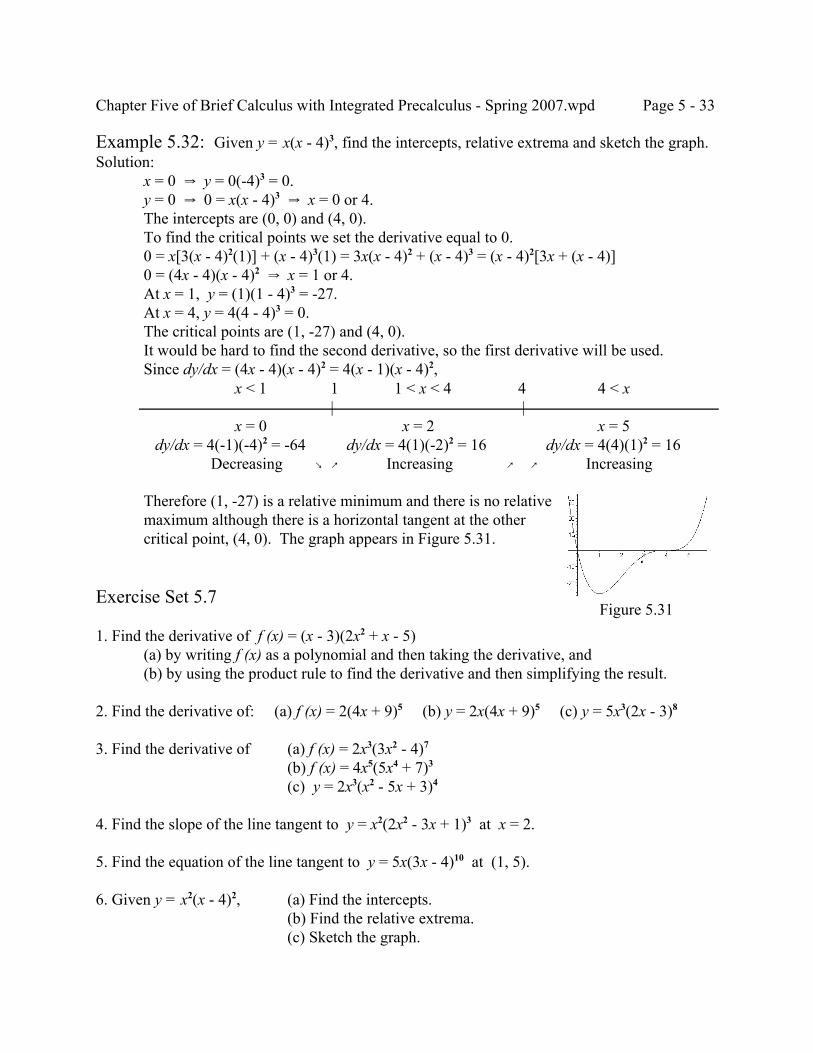
Chapter Five of Brief Calculus with Integrated Precalculus - Spring 2007.wpd Page 5 - 33
Figure 5.31
Example 5.32: Given y = x(x - 4)3, find the intercepts, relative extrema and sketch the graph.Solution:
x = 0 Y y = 0(-4)3 = 0.y = 0 Y 0 = x(x - 4)3 Y x = 0 or 4.The intercepts are (0, 0) and (4, 0).To find the critical points we set the derivative equal to 0.0 = x[3(x - 4)2(1)] + (x - 4)3(1) = 3x(x - 4)2 + (x - 4)3 = (x - 4)2[3x + (x - 4)]0 = (4x - 4)(x - 4)2 Y x = 1 or 4.At x = 1, y = (1)(1 - 4)3 = -27.At x = 4, y = 4(4 - 4)3 = 0.The critical points are (1, -27) and (4, 0).It would be hard to find the second derivative, so the first derivative will be used.Since dy/dx = (4x - 4)(x - 4)2 = 4(x - 1)(x - 4)2,
Therefore (1, -27) is a relative minimum and there is no relativemaximum although there is a horizontal tangent at the othercritical point, (4, 0). The graph appears in Figure 5.31.
Exercise Set 5.7
1. Find the derivative of f (x) = (x - 3)(2x2 + x - 5)(a) by writing f (x) as a polynomial and then taking the derivative, and(b) by using the product rule to find the derivative and then simplifying the result.
2. Find the derivative of: (a) f (x) = 2(4x + 9)5 (b) y = 2x(4x + 9)5 (c) y = 5x3(2x - 3)8
3. Find the derivative of (a) f (x) = 2x3(3x2 - 4)7
(b) f (x) = 4x5(5x4 + 7)3
(c) y = 2x3(x2 - 5x + 3)4
4. Find the slope of the line tangent to y = x2(2x2 - 3x + 1)3 at x = 2.
5. Find the equation of the line tangent to y = 5x(3x - 4)10 at (1, 5).
6. Given y = x2(x - 4)2, (a) Find the intercepts.(b) Find the relative extrema.(c) Sketch the graph.
x < 1 1 1 < x < 4 4 4 < x| |
x = 0 x = 2 x = 5 dy/dx = 4(-1)(-4)2 = -64 dy/dx = 4(1)(-2)2 = 16 dy/dx = 4(4)(1)2 = 16
Decreasing ` _ Increasing _ _ Increasing
Chapter Six of Brief Calculus with Integrated Precalculus - Spring 2007.wpd Page 6 - 1
CHAPTER SIXRATIONAL FUNCTIONS
6.1 ONE SIDED LIMITS AND CONTINUITY
A fraction is the quotient of two integers and another name for a fraction is a rational number. Ina similar manner the quotient of two polynomials is called a rational function. Thus, forexample,
is a rational function. As long as values of x that make the denominatorf xx x
x( ) =
+ −−
2
2
24
equal zero are avoided, the rational function is defined. In the example provided, the only valuesof x that make the denominator equal zero are -2 and 2. For any other values the function is
defined. For example, for x = 3 we get and for x = 1 we getf ( )33 3 2
3 4105
22
2=+ −−
= =
(remember, as long as the denominator is not 0, a 0 in thef ( )11 1 2
1 403
02
2=+ −−
=−
=
numerator produces a result of 0). On the other hand, if a value is chosen for x that makes thedenominator equal zero, then the function is not defined. In the example provided, for x = -2,
= undefined (remember, if the denominator is 0 the result isf ( )( ) ( )
( )− =
− + − −− −
=22 2 2
2 400
2
2
undefined even if the numerator is also 0). Also, for x = 2, =f ( )22 2 2
2 440
2
2=+ −−
=
undefined. The values of x for which a function is defined is called the domain of the function. Thus, for the example provided the domain consists of all real numbers not equal to -2 or 2.
Domain of y = f(x): The values of x for which the function is defined.
Rational Function: A quotient of two polynomials.
Fact 6.1: The domain of a rational function f (x) consists of all real values of x except thosevalues which make the denominator equal 0.
Chapter Six of Brief Calculus with Integrated Precalculus - Spring 2007.wpd Page 6 - 2
Figure 6.1
Figure 6.2
Example 6.1: Given the rational function , find the domain andf xx x
x( ) =
− −−
2 22
evaluate if they exist. Also, findLim f x Lim f x and Lim f xx x x→ → →+ −2 2 2
( ), ( ) ( )the values of x for which the function is continuous.
Solution: The domain consists of all real values of x for which the denominator is not 0. So thedomain is found from x - 2 … 0 Y x … 2 is the domain. (An alternate means ofrepresenting this domain is (-4, 2) c (2, 4). This means all values of x less than but notincluding 2 together with all values of x greater than but not including 2.)Observe that f (2) = 0/0 is undefined (does not exist).
Numerical Solution for the limits: The following table shows the values of f (x) both for valuesof x less than 2 and getting closer to 2 as well as for values of x greater than 2 and gettingcloser to 2.x 1 1.9 1.99 1.999 2 2.001 2.01 2.1 3
f (x) 2 2.9 2.99 2.999 undefined 3.001 3.01 3.1 4Notice that, as x gets closer to 2 on the left (1, 1.9, 1.99, 1.999 6 2 -),
y = f (x) gets closer to 3 (2, 2.9, 2.99, 2.999 6 3).Likewise, as x gets closer to 2 on the right (3, 2.1, 2.01, 2.001 6 2+),
y = f (x) gets closer to 3 (4, 3.1, 3.01, 3.001 6 3).Therefore,
Lim f x Lim f x Lim f xx x x→ → →+ −
= = =2 2 2
3( ) ( ) ( )
Graphical Solution for the limits:If f (x) is graphed using ZoomStd, Figure 6.1 appears. Thegraph appears to be a straight line. However, if thefollowing is done in the graph window:Press F5 (Math).Press ENTER (for selection 1: Value).Press 2 (set the x-coordinate value to x = 2).Press ENTER.Figure 6.2 now appears. The absence of a value for yc: means that there is no y-coordinate that corresponds to x=2. That is, f (x) is undefined for x = 2. So, while the graphlooks as if it does not have a break, in actuality the point (2,3) that seems to lie on the straight line is not part of thegraph of f(x).
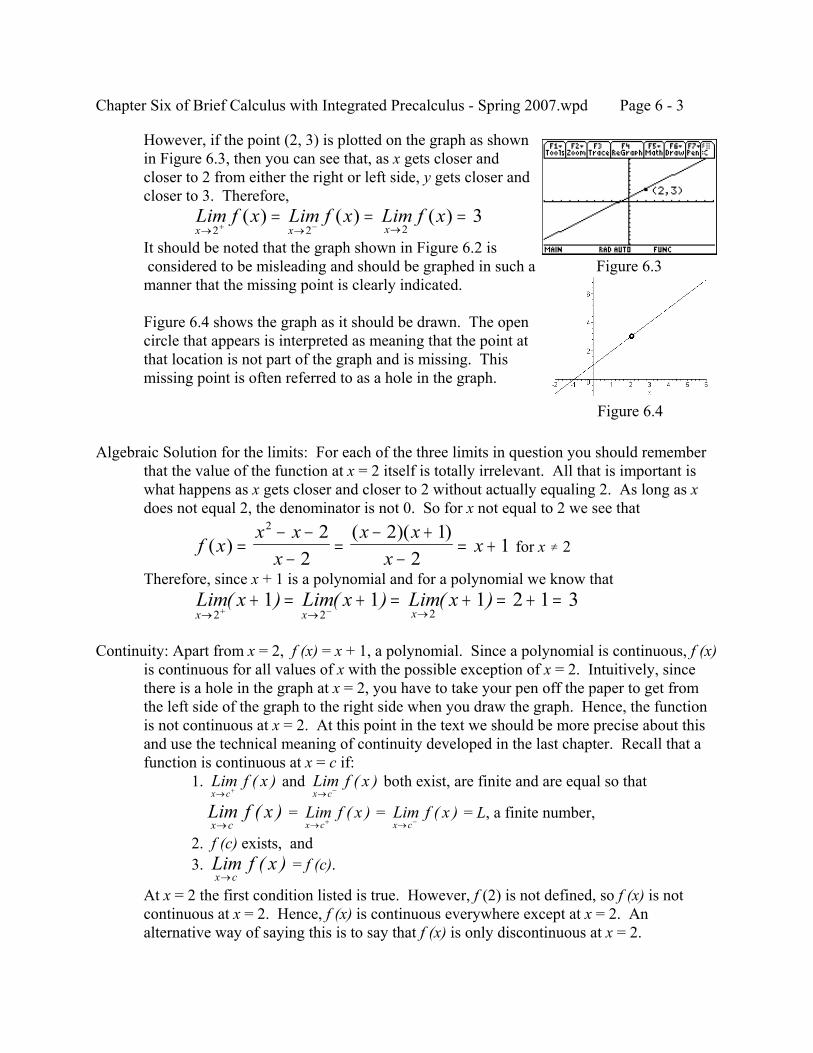
Chapter Six of Brief Calculus with Integrated Precalculus - Spring 2007.wpd Page 6 - 3
Figure 6.3
Figure 6.4
However, if the point (2, 3) is plotted on the graph as shownin Figure 6.3, then you can see that, as x gets closer andcloser to 2 from either the right or left side, y gets closer andcloser to 3. Therefore,
Lim f x Lim f x Lim f xx x x→ → →+ −
= = =2 2 2
3( ) ( ) ( )It should be noted that the graph shown in Figure 6.2 is considered to be misleading and should be graphed in such amanner that the missing point is clearly indicated.
Figure 6.4 shows the graph as it should be drawn. The opencircle that appears is interpreted as meaning that the point atthat location is not part of the graph and is missing. Thismissing point is often referred to as a hole in the graph.
Algebraic Solution for the limits: For each of the three limits in question you should rememberthat the value of the function at x = 2 itself is totally irrelevant. All that is important iswhat happens as x gets closer and closer to 2 without actually equaling 2. As long as xdoes not equal 2, the denominator is not 0. So for x not equal to 2 we see that
for x … 2f xx x
xx x
xx( )
( )( )=
− −−
=− +
−= +
2 22
2 12
1
Therefore, since x + 1 is a polynomial and for a polynomial we know thatLim x Lim x Lim xx x x→ → →+ −
+ = + = + = + =2 2 2
1 1 1 2 1 3( ) ( ) ( )
Continuity: Apart from x = 2, f (x) = x + 1, a polynomial. Since a polynomial is continuous, f (x)is continuous for all values of x with the possible exception of x = 2. Intuitively, sincethere is a hole in the graph at x = 2, you have to take your pen off the paper to get fromthe left side of the graph to the right side when you draw the graph. Hence, the functionis not continuous at x = 2. At this point in the text we should be more precise about thisand use the technical meaning of continuity developed in the last chapter. Recall that afunction is continuous at x = c if:
1. and both exist, are finite and are equal so thatLim f xx c→ +
( ) Lim f xx c→ −
( )
= = = L, a finite number,Lim f xx c→
( ) Lim f xx c→ +
( ) Lim f xx c→ −
( )
2. f (c) exists, and3. = f (c).Lim f x
x c→( )
At x = 2 the first condition listed is true. However, f (2) is not defined, so f (x) is notcontinuous at x = 2. Hence, f (x) is continuous everywhere except at x = 2. Analternative way of saying this is to say that f (x) is only discontinuous at x = 2.
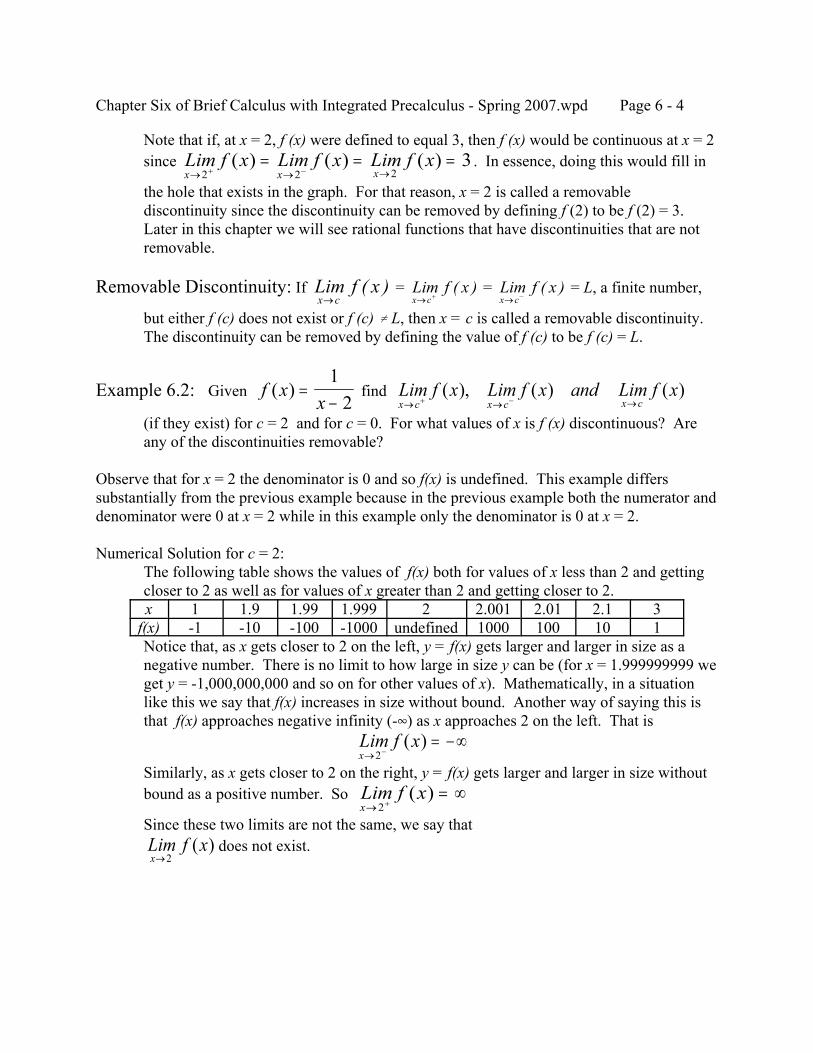
Chapter Six of Brief Calculus with Integrated Precalculus - Spring 2007.wpd Page 6 - 4
Note that if, at x = 2, f (x) were defined to equal 3, then f (x) would be continuous at x = 2since . In essence, doing this would fill inLim f x Lim f x Lim f x
x x x→ → →+ −= = =
2 2 23( ) ( ) ( )
the hole that exists in the graph. For that reason, x = 2 is called a removablediscontinuity since the discontinuity can be removed by defining f (2) to be f (2) = 3. Later in this chapter we will see rational functions that have discontinuities that are notremovable.
Removable Discontinuity: If = = = L, a finite number,Lim f xx c→
( ) Lim f xx c→ +
( ) Lim f xx c→ −
( )
but either f (c) does not exist or f (c) … L, then x = c is called a removable discontinuity. The discontinuity can be removed by defining the value of f (c) to be f (c) = L.
Example 6.2: Given find f xx
( ) =−1
2Lim f x Lim f x and Lim f xx c x c x c→ → →+ −
( ), ( ) ( )
(if they exist) for c = 2 and for c = 0. For what values of x is f (x) discontinuous? Areany of the discontinuities removable?
Observe that for x = 2 the denominator is 0 and so f(x) is undefined. This example differssubstantially from the previous example because in the previous example both the numerator anddenominator were 0 at x = 2 while in this example only the denominator is 0 at x = 2.
Numerical Solution for c = 2:The following table shows the values of f(x) both for values of x less than 2 and gettingcloser to 2 as well as for values of x greater than 2 and getting closer to 2.x 1 1.9 1.99 1.999 2 2.001 2.01 2.1 3
f(x) -1 -10 -100 -1000 undefined 1000 100 10 1Notice that, as x gets closer to 2 on the left, y = f(x) gets larger and larger in size as anegative number. There is no limit to how large in size y can be (for x = 1.999999999 weget y = -1,000,000,000 and so on for other values of x). Mathematically, in a situationlike this we say that f(x) increases in size without bound. Another way of saying this isthat f(x) approaches negative infinity (-4) as x approaches 2 on the left. That is
Lim f xx→ −
= −∞2
( )Similarly, as x gets closer to 2 on the right, y = f(x) gets larger and larger in size withoutbound as a positive number. So Lim f x
x→ += ∞
2( )
Since these two limits are not the same, we say thatdoes not exist.Lim f x
x→2( )
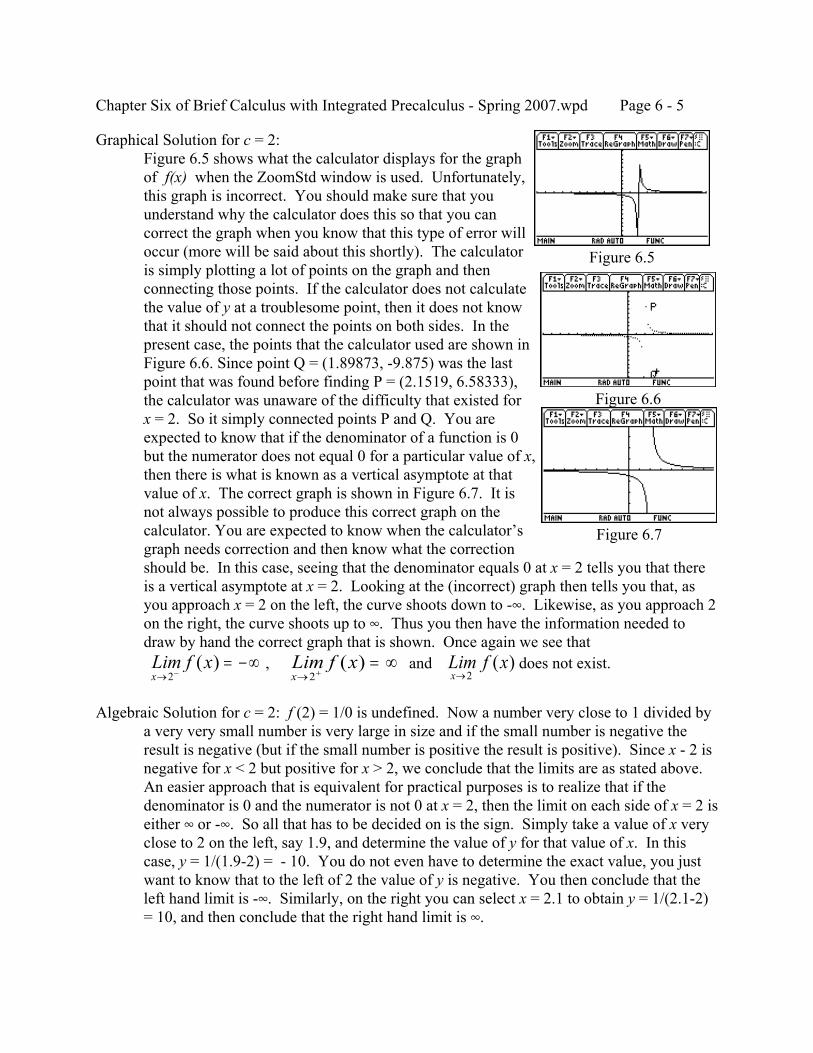
Chapter Six of Brief Calculus with Integrated Precalculus - Spring 2007.wpd Page 6 - 5
Figure 6.5
Figure 6.6
Figure 6.7
Graphical Solution for c = 2:Figure 6.5 shows what the calculator displays for the graphof f(x) when the ZoomStd window is used. Unfortunately,this graph is incorrect. You should make sure that youunderstand why the calculator does this so that you cancorrect the graph when you know that this type of error willoccur (more will be said about this shortly). The calculatoris simply plotting a lot of points on the graph and thenconnecting those points. If the calculator does not calculatethe value of y at a troublesome point, then it does not knowthat it should not connect the points on both sides. In thepresent case, the points that the calculator used are shown inFigure 6.6. Since point Q = (1.89873, -9.875) was the lastpoint that was found before finding P = (2.1519, 6.58333),the calculator was unaware of the difficulty that existed forx = 2. So it simply connected points P and Q. You areexpected to know that if the denominator of a function is 0but the numerator does not equal 0 for a particular value of x,then there is what is known as a vertical asymptote at thatvalue of x. The correct graph is shown in Figure 6.7. It isnot always possible to produce this correct graph on thecalculator. You are expected to know when the calculator’sgraph needs correction and then know what the correctionshould be. In this case, seeing that the denominator equals 0 at x = 2 tells you that thereis a vertical asymptote at x = 2. Looking at the (incorrect) graph then tells you that, asyou approach x = 2 on the left, the curve shoots down to -4. Likewise, as you approach 2on the right, the curve shoots up to 4. Thus you then have the information needed todraw by hand the correct graph that is shown. Once again we see that , and does not exist.Lim f x
x→ −= −∞
2( ) Lim f x
x→ += ∞
2( ) Lim f x
x→2( )
Algebraic Solution for c = 2: f (2) = 1/0 is undefined. Now a number very close to 1 divided bya very very small number is very large in size and if the small number is negative theresult is negative (but if the small number is positive the result is positive). Since x - 2 isnegative for x < 2 but positive for x > 2, we conclude that the limits are as stated above. An easier approach that is equivalent for practical purposes is to realize that if thedenominator is 0 and the numerator is not 0 at x = 2, then the limit on each side of x = 2 iseither 4 or -4. So all that has to be decided on is the sign. Simply take a value of x veryclose to 2 on the left, say 1.9, and determine the value of y for that value of x. In thiscase, y = 1/(1.9-2) = - 10. You do not even have to determine the exact value, you justwant to know that to the left of 2 the value of y is negative. You then conclude that theleft hand limit is -4. Similarly, on the right you can select x = 2.1 to obtain y = 1/(2.1-2)= 10, and then conclude that the right hand limit is 4.
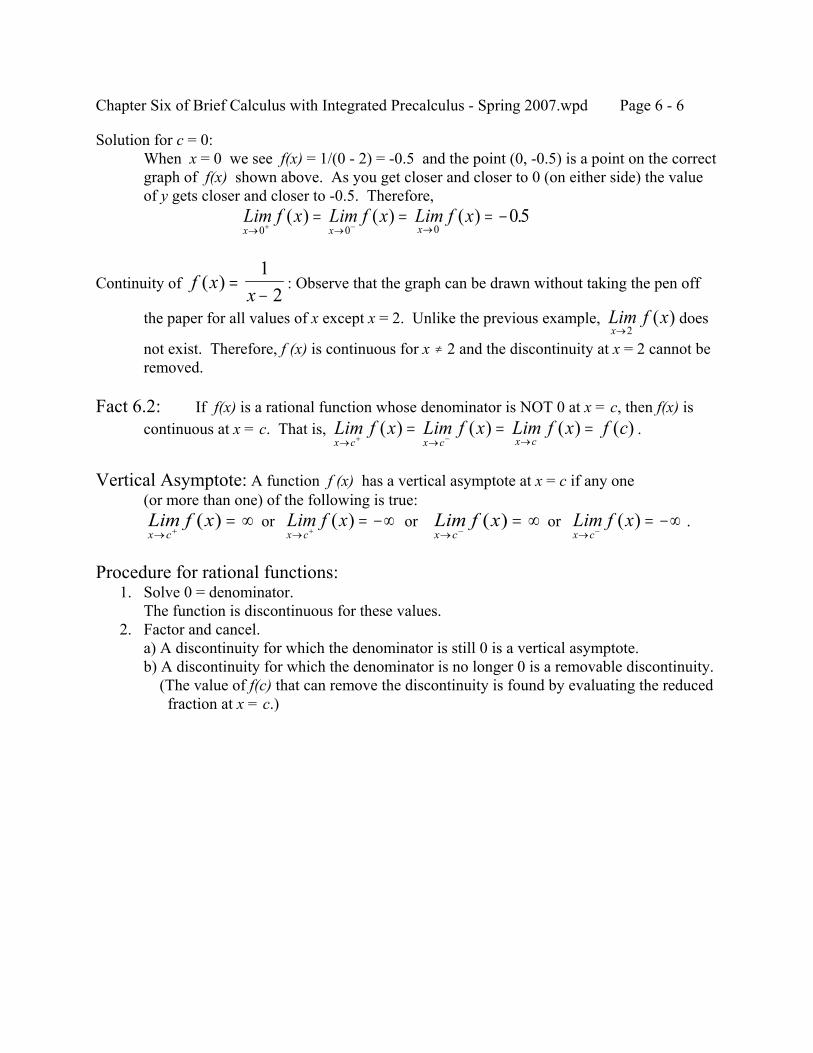
Chapter Six of Brief Calculus with Integrated Precalculus - Spring 2007.wpd Page 6 - 6
Solution for c = 0:When x = 0 we see f(x) = 1/(0 - 2) = -0.5 and the point (0, -0.5) is a point on the correctgraph of f(x) shown above. As you get closer and closer to 0 (on either side) the valueof y gets closer and closer to -0.5. Therefore,
Lim f x Lim f x Lim f xx x x→ → →+ −
= = = −0 0 0
05( ) ( ) ( ) .
Continuity of : Observe that the graph can be drawn without taking the pen offf xx
( ) =−1
2the paper for all values of x except x = 2. Unlike the previous example, doesLim f x
x→2( )
not exist. Therefore, f (x) is continuous for x … 2 and the discontinuity at x = 2 cannot beremoved.
Fact 6.2: If f(x) is a rational function whose denominator is NOT 0 at x = c, then f(x) iscontinuous at x = c. That is, .Lim f x Lim f x Lim f x f c
x c x c x c→ → →+ −= = =( ) ( ) ( ) ( )
Vertical Asymptote: A function f (x) has a vertical asymptote at x = c if any one(or more than one) of the following is true:
or or or .Lim f xx c→ +
= ∞( ) Lim f xx c→ +
= −∞( ) Lim f xx c→ −
= ∞( ) Lim f xx c→ −
= −∞( )
Procedure for rational functions: 1. Solve 0 = denominator.
The function is discontinuous for these values. 2. Factor and cancel.
a) A discontinuity for which the denominator is still 0 is a vertical asymptote.b) A discontinuity for which the denominator is no longer 0 is a removable discontinuity. (The value of f(c) that can remove the discontinuity is found by evaluating the reduced fraction at x = c.)
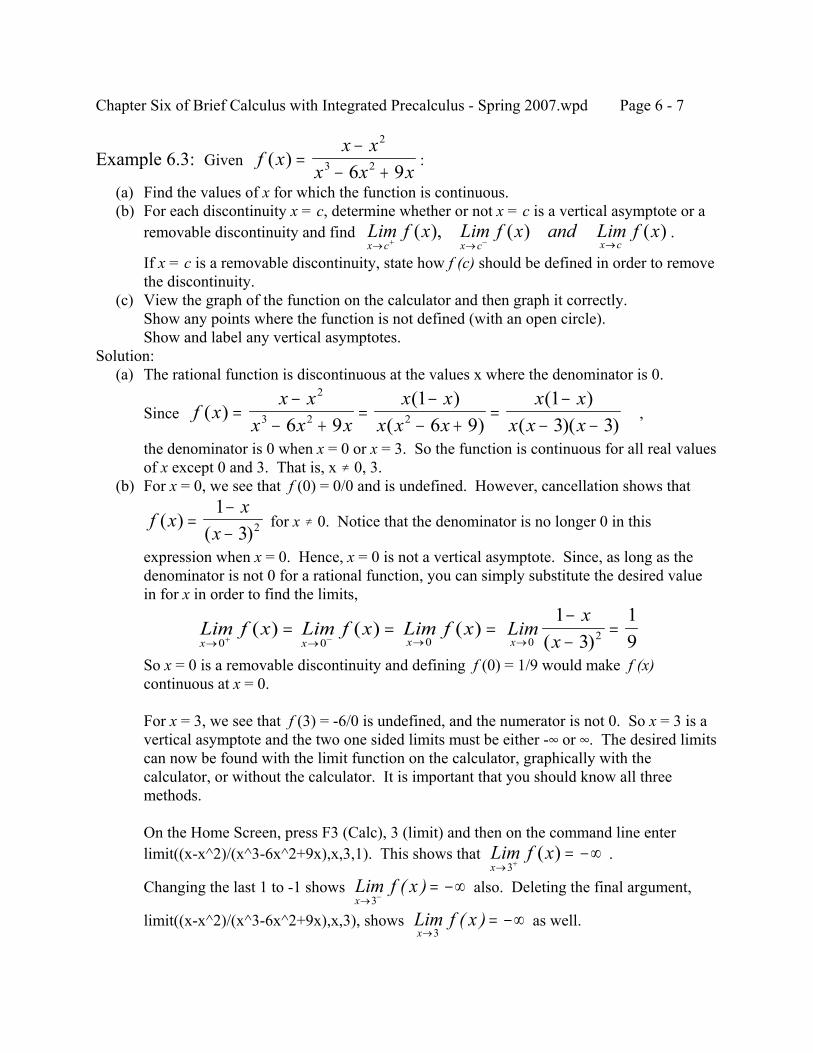
Chapter Six of Brief Calculus with Integrated Precalculus - Spring 2007.wpd Page 6 - 7
Example 6.3: Given :f xx x
x x x( ) =
−− +
2
3 26 9 (a) Find the values of x for which the function is continuous. (b) For each discontinuity x = c, determine whether or not x = c is a vertical asymptote or a
removable discontinuity and find .Lim f x Lim f x and Lim f xx c x c x c→ → →+ −
( ), ( ) ( )If x = c is a removable discontinuity, state how f (c) should be defined in order to removethe discontinuity.
(c) View the graph of the function on the calculator and then graph it correctly.Show any points where the function is not defined (with an open circle).Show and label any vertical asymptotes.
Solution: (a) The rational function is discontinuous at the values x where the denominator is 0.
Since ,f xx x
x x xx x
x x xx x
x x x( )
( )( )
( )( )( )
=−
− +=
−− +
=−
− −
2
3 2 26 91
6 913 3
the denominator is 0 when x = 0 or x = 3. So the function is continuous for all real valuesof x except 0 and 3. That is, x … 0, 3.
(b) For x = 0, we see that f (0) = 0/0 and is undefined. However, cancellation shows that
for x … 0. Notice that the denominator is no longer 0 in thisf xx
x( )
( )=
−−
13 2
expression when x = 0. Hence, x = 0 is not a vertical asymptote. Since, as long as thedenominator is not 0 for a rational function, you can simply substitute the desired valuein for x in order to find the limits,
Lim f x Lim f x Lim f xx x x→ → →+ −
= = =0 0 0
( ) ( ) ( ) Limx
xx→
−−
=0 2
13
19( )
So x = 0 is a removable discontinuity and defining f (0) = 1/9 would make f (x)continuous at x = 0.
For x = 3, we see that f (3) = -6/0 is undefined, and the numerator is not 0. So x = 3 is avertical asymptote and the two one sided limits must be either -4 or 4. The desired limitscan now be found with the limit function on the calculator, graphically with thecalculator, or without the calculator. It is important that you should know all threemethods.
On the Home Screen, press F3 (Calc), 3 (limit) and then on the command line enterlimit((x-x^2)/(x^3-6x^2+9x),x,3,1). This shows that .Lim f x
x→ += −∞
3( )
Changing the last 1 to -1 shows also. Deleting the final argument,Lim f xx→ −
= −∞3
( )
limit((x-x^2)/(x^3-6x^2+9x),x,3), shows as well.Lim f xx→
= −∞3
( )
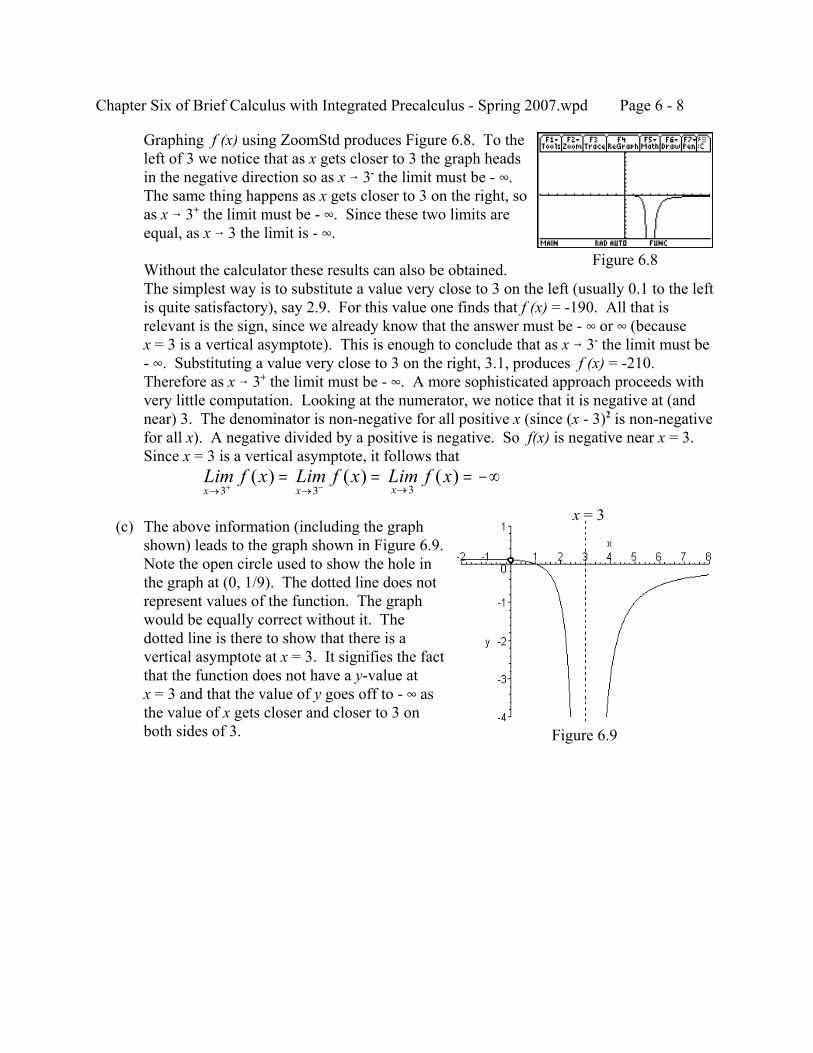
Chapter Six of Brief Calculus with Integrated Precalculus - Spring 2007.wpd Page 6 - 8
Figure 6.9
Figure 6.8
Graphing f (x) using ZoomStd produces Figure 6.8. To theleft of 3 we notice that as x gets closer to 3 the graph headsin the negative direction so as x 6 3- the limit must be - 4. The same thing happens as x gets closer to 3 on the right, soas x 6 3+ the limit must be - 4. Since these two limits areequal, as x 6 3 the limit is - 4.
Without the calculator these results can also be obtained. The simplest way is to substitute a value very close to 3 on the left (usually 0.1 to the leftis quite satisfactory), say 2.9. For this value one finds that f (x) = -190. All that isrelevant is the sign, since we already know that the answer must be - 4 or 4 (becausex = 3 is a vertical asymptote). This is enough to conclude that as x 6 3- the limit must be- 4. Substituting a value very close to 3 on the right, 3.1, produces f (x) = -210. Therefore as x 6 3+ the limit must be - 4. A more sophisticated approach proceeds withvery little computation. Looking at the numerator, we notice that it is negative at (andnear) 3. The denominator is non-negative for all positive x (since (x - 3)2 is non-negativefor all x). A negative divided by a positive is negative. So f(x) is negative near x = 3. Since x = 3 is a vertical asymptote, it follows that
Lim f x Lim f x Lim f xx x x→ → →+ −
= = = −∞3 3 3
( ) ( ) ( )
(c) The above information (including the graphshown) leads to the graph shown in Figure 6.9. Note the open circle used to show the hole inthe graph at (0, 1/9). The dotted line does notrepresent values of the function. The graphwould be equally correct without it. Thedotted line is there to show that there is avertical asymptote at x = 3. It signifies the factthat the function does not have a y-value atx = 3 and that the value of y goes off to - 4 asthe value of x gets closer and closer to 3 onboth sides of 3.
x = 3
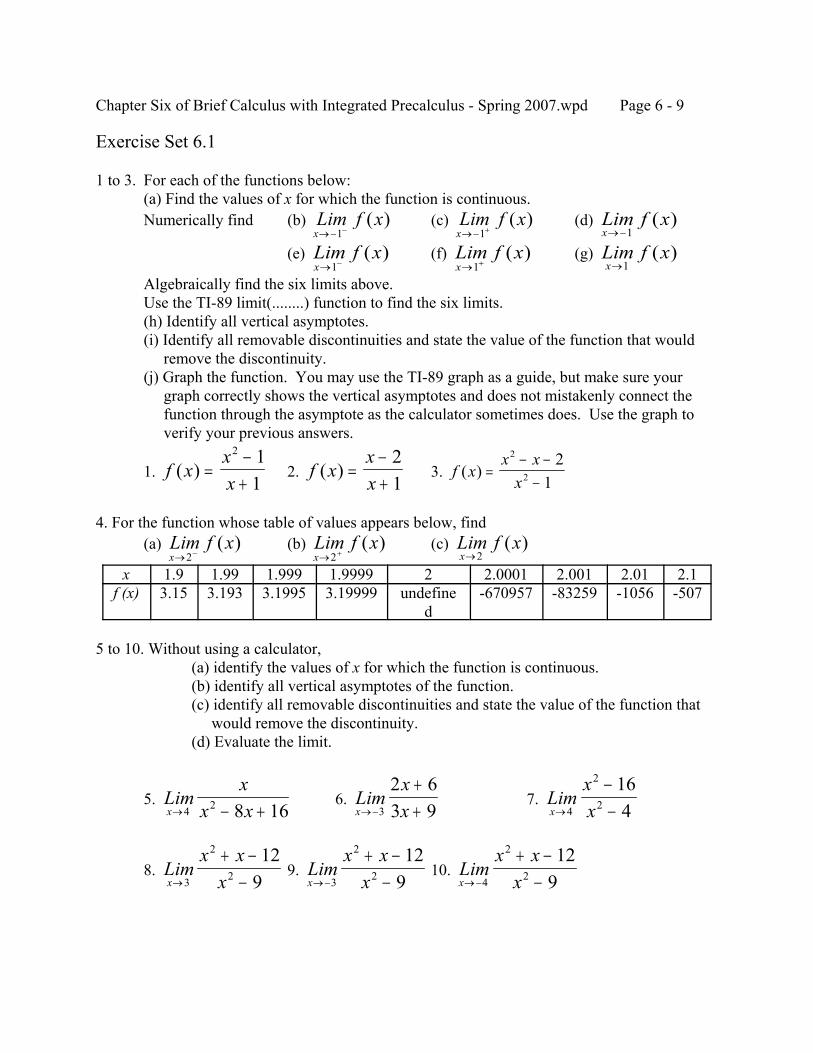
Chapter Six of Brief Calculus with Integrated Precalculus - Spring 2007.wpd Page 6 - 9
Exercise Set 6.1
1 to 3. For each of the functions below:(a) Find the values of x for which the function is continuous.Numerically find (b) (c) (d) Lim f x
x→− −1( ) Lim f x
x→− +1( ) Lim f x
x→−1( )
(e) (f) (g) Lim f xx→ −1
( ) Lim f xx→ +1
( ) Lim f xx→1
( )Algebraically find the six limits above.Use the TI-89 limit(........) function to find the six limits.(h) Identify all vertical asymptotes.(i) Identify all removable discontinuities and state the value of the function that would remove the discontinuity.(j) Graph the function. You may use the TI-89 graph as a guide, but make sure your graph correctly shows the vertical asymptotes and does not mistakenly connect the function through the asymptote as the calculator sometimes does. Use the graph to verify your previous answers.
1. 2. 3. f xxx
( ) =−+
2 11
f xxx
( ) =−+
21
f xx x
x( ) =
− −−
2
2
21
4. For the function whose table of values appears below, find(a) (b) (c) Lim f x
x→ −2( ) Lim f x
x→ +2( ) Lim f x
x→2( )
x 1.9 1.99 1.999 1.9999 2 2.0001 2.001 2.01 2.1f (x) 3.15 3.193 3.1995 3.19999 undefine
d-670957 -83259 -1056 -507
5 to 10. Without using a calculator,(a) identify the values of x for which the function is continuous.(b) identify all vertical asymptotes of the function.(c) identify all removable discontinuities and state the value of the function that would remove the discontinuity.(d) Evaluate the limit.
5. 6. 7. Limx
x xx→ − +4 2 8 16Lim
xxx→−
++3
2 63 9
Limxxx→
−−4
2
2
164
8. 9. 10. Limx x
xx→
+ −−3
2
2
129
Limx x
xx→−
+ −−3
2
2
129
Limx x
xx→−
+ −−4
2
2
129
Chapter Six of Brief Calculus with Integrated Precalculus - Spring 2007.wpd Page 6 - 10
11. Given f xx
x x x( ) =
−− +2 48 123 2
Without using a calculator:(a) Identify the values of x for which the function is continuous.(b) Identify all vertical asymptotesThen find the limits below for the following values of c: 0, 1, 2, 6.(c) (d) (e) Lim f x
x c→ −( ) Lim f x
x c→ +( ) Lim f x
x c→( )
(f) identify all removable discontinuities and state the value of the function that would remove the discontinuity.
(g) Use the TI-89 to help you correctly graph the function and use the graph to visually verify your previous answers.
6.2 BEHAVIOR AT INFINITY
In Chapter 5 we saw that as x increases in size without bound the term in a polynomial with thegreatest exponent dominates the polynomial, so that, for example,
.Lim x x Lim xx x→∞ →∞
− + = − = −∞( )8 3 10 32 2
Before applying this basic idea to rational functions, there is one fact (exemplified by the nextexample) that you have to make sure you understand.
Example 6.4: Verify numerically and graphically that = 0.Limxx→ ∞ −76
4Numerical verification:
A sequence of numbers that gets larger and larger is 10, 100, 1000, 10 000, 100 000,...
The values of for these numbers are indicated in the following tablef xx
( ) =−76
4x 10 100 1000 10,000 100,000 1,000,000
f(x) 12.6667 0.791 667 0.076 305 0.007 603 0.000 760 0.000 076Since 12.6667, 0.791 667, 0.076 305, 0.007 603, 0.000 760, 0.000 076, ... is getting
closer and closer to 0, = 0.Limxx→ ∞ −76
4Graphical verification:
We already know from the previous section that has a vertical asymptotef xx
( ) =−76
4at x = 4 (since the denominator is 0 at x = 4 but the numerator is not 0). That does notconcern us here since we are interested in large values of x. So we will look at the graphfor values of x starting after x = 4.
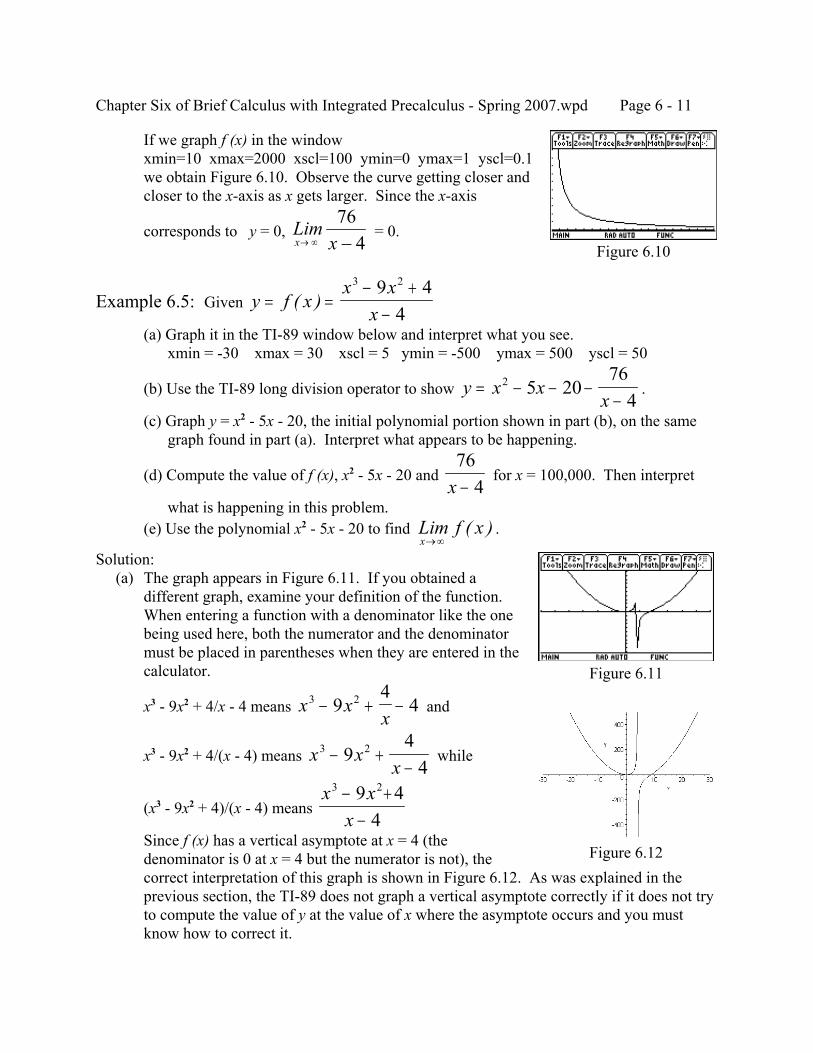
Chapter Six of Brief Calculus with Integrated Precalculus - Spring 2007.wpd Page 6 - 11
Figure 6.12
Figure 6.11
Figure 6.10
If we graph f (x) in the windowxmin=10 xmax=2000 xscl=100 ymin=0 ymax=1 yscl=0.1we obtain Figure 6.10. Observe the curve getting closer andcloser to the x-axis as x gets larger. Since the x-axis
corresponds to y = 0, = 0.Limxx→ ∞ −76
4
Example 6.5: Given y f xx x
x= =
− +−
( )3 29 4
4(a) Graph it in the TI-89 window below and interpret what you see. xmin = -30 xmax = 30 xscl = 5 ymin = -500 ymax = 500 yscl = 50
(b) Use the TI-89 long division operator to show .y x xx
= − − −−
2 5 2076
4(c) Graph y = x2 - 5x - 20, the initial polynomial portion shown in part (b), on the same graph found in part (a). Interpret what appears to be happening.
(d) Compute the value of f (x), x2 - 5x - 20 and for x = 100,000. Then interpret76
4x − what is happening in this problem.(e) Use the polynomial x2 - 5x - 20 to find .Lim f x
x→∞( )
Solution: (a) The graph appears in Figure 6.11. If you obtained a
different graph, examine your definition of the function. When entering a function with a denominator like the onebeing used here, both the numerator and the denominatormust be placed in parentheses when they are entered in thecalculator.
x3 - 9x2 + 4/x - 4 means andx xx
3 294
4− + −
x3 - 9x2 + 4/(x - 4) means whilex xx
3 294
4− +
−
(x3 - 9x2 + 4)/(x - 4) means x x
x
3 29 44
− +−
Since f (x) has a vertical asymptote at x = 4 (thedenominator is 0 at x = 4 but the numerator is not), thecorrect interpretation of this graph is shown in Figure 6.12. As was explained in theprevious section, the TI-89 does not graph a vertical asymptote correctly if it does not tryto compute the value of y at the value of x where the asymptote occurs and you mustknow how to correct it.
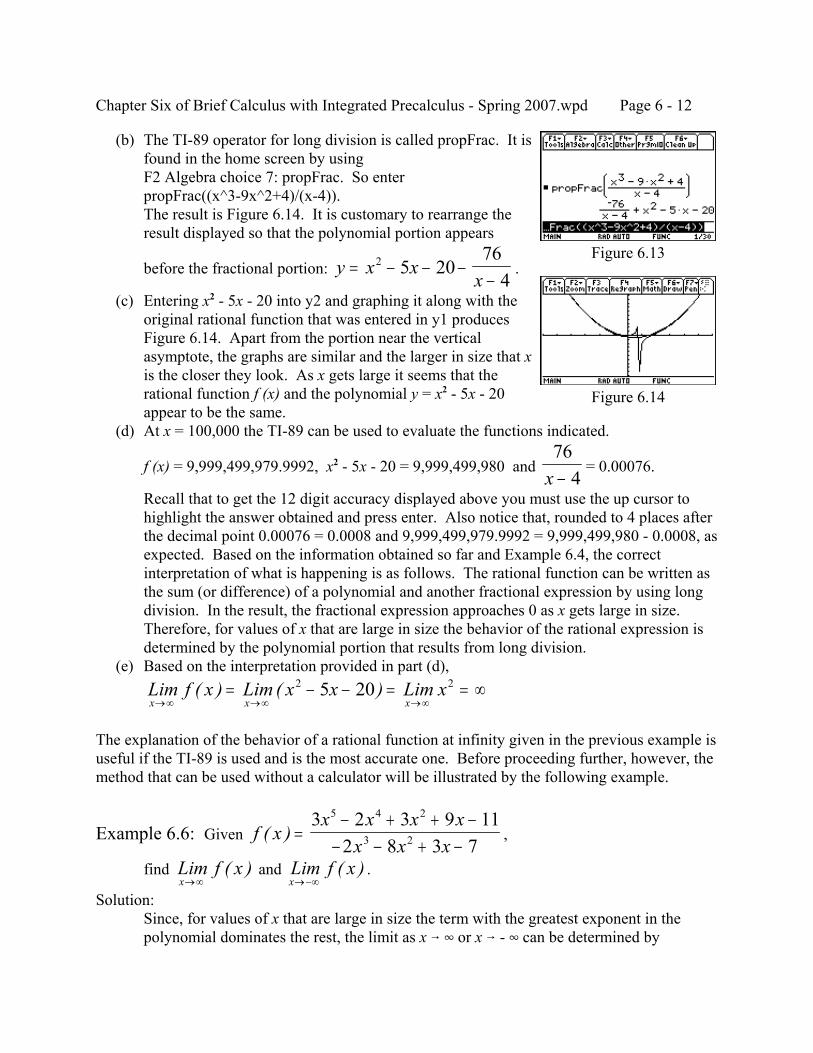
Chapter Six of Brief Calculus with Integrated Precalculus - Spring 2007.wpd Page 6 - 12
Figure 6.14
Figure 6.13
(b) The TI-89 operator for long division is called propFrac. It isfound in the home screen by usingF2 Algebra choice 7: propFrac. So enterpropFrac((x^3-9x^2+4)/(x-4)).The result is Figure 6.14. It is customary to rearrange theresult displayed so that the polynomial portion appears
before the fractional portion: .y x xx
= − − −−
2 5 2076
4 (c) Entering x2 - 5x - 20 into y2 and graphing it along with the
original rational function that was entered in y1 producesFigure 6.14. Apart from the portion near the verticalasymptote, the graphs are similar and the larger in size that xis the closer they look. As x gets large it seems that therational function f (x) and the polynomial y = x2 - 5x - 20appear to be the same.
(d) At x = 100,000 the TI-89 can be used to evaluate the functions indicated.
f (x) = 9,999,499,979.9992, x2 - 5x - 20 = 9,999,499,980 and = 0.00076.76
4x −Recall that to get the 12 digit accuracy displayed above you must use the up cursor tohighlight the answer obtained and press enter. Also notice that, rounded to 4 places afterthe decimal point 0.00076 = 0.0008 and 9,999,499,979.9992 = 9,999,499,980 - 0.0008, asexpected. Based on the information obtained so far and Example 6.4, the correctinterpretation of what is happening is as follows. The rational function can be written asthe sum (or difference) of a polynomial and another fractional expression by using longdivision. In the result, the fractional expression approaches 0 as x gets large in size. Therefore, for values of x that are large in size the behavior of the rational expression isdetermined by the polynomial portion that results from long division.
(e) Based on the interpretation provided in part (d),Lim f x Lim x x Lim xx x x→∞ →∞ →∞
= − − = = ∞( ) ( )2 25 20
The explanation of the behavior of a rational function at infinity given in the previous example isuseful if the TI-89 is used and is the most accurate one. Before proceeding further, however, themethod that can be used without a calculator will be illustrated by the following example.
Example 6.6: Given ,f xx x x x
x x x( ) =
− + + −− − + −
3 2 3 9 112 8 3 7
5 4 2
3 2
find and .Lim f xx→∞
( ) Lim f xx→−∞
( )Solution:
Since, for values of x that are large in size the term with the greatest exponent in thepolynomial dominates the rest, the limit as x 6 4 or x 6 - 4 can be determined by
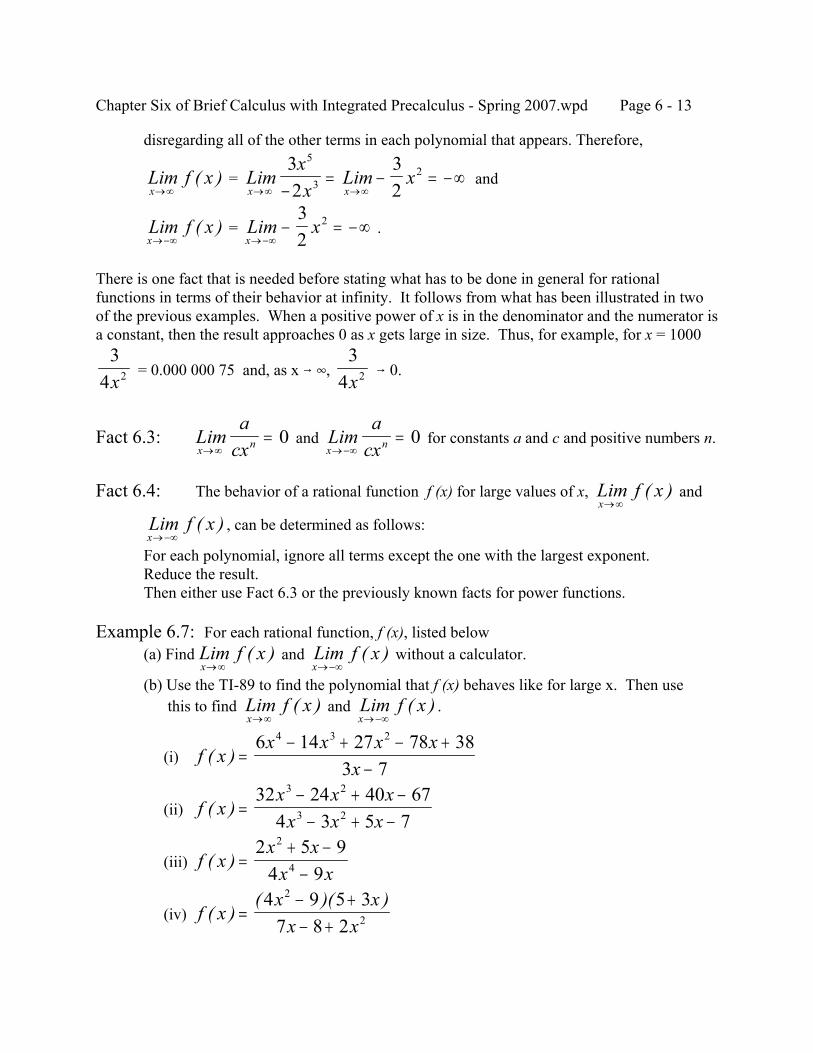
Chapter Six of Brief Calculus with Integrated Precalculus - Spring 2007.wpd Page 6 - 13
disregarding all of the other terms in each polynomial that appears. Therefore,
= andLim f xx→∞
( ) Limxx
Lim xx x→∞ →∞−
= − = −∞32
32
5
32
= .Lim f xx→−∞
( ) Lim xx→−∞
− = −∞32
2
There is one fact that is needed before stating what has to be done in general for rationalfunctions in terms of their behavior at infinity. It follows from what has been illustrated in twoof the previous examples. When a positive power of x is in the denominator and the numerator isa constant, then the result approaches 0 as x gets large in size. Thus, for example, for x = 1000
= 0.000 000 75 and, as x 6 4, 6 0.3
4 2x3
4 2x
Fact 6.3: and for constants a and c and positive numbers n.Lima
cxx n→∞= 0 Lim
acxx n→−∞
= 0
Fact 6.4: The behavior of a rational function f (x) for large values of x, andLim f xx→∞
( )
, can be determined as follows:Lim f xx→−∞
( )For each polynomial, ignore all terms except the one with the largest exponent.Reduce the result.Then either use Fact 6.3 or the previously known facts for power functions.
Example 6.7: For each rational function, f (x), listed below(a) Find and without a calculator.Lim f x
x→∞( ) Lim f x
x→−∞( )
(b) Use the TI-89 to find the polynomial that f (x) behaves like for large x. Then use this to find and .Lim f x
x→∞( ) Lim f x
x→−∞( )
(i) f xx x x x
x( ) =
− + − +−
6 14 27 78 383 7
4 3 2
(ii) f xx x x
x x x( ) =
− + −− + −
32 24 40 674 3 5 7
3 2
3 2
(iii) f xx x
x x( ) =
+ −−
2 5 94 9
2
4
(iv) f xx x
x x( )
( )( )=
− +− +
4 9 5 37 8 2
2
2
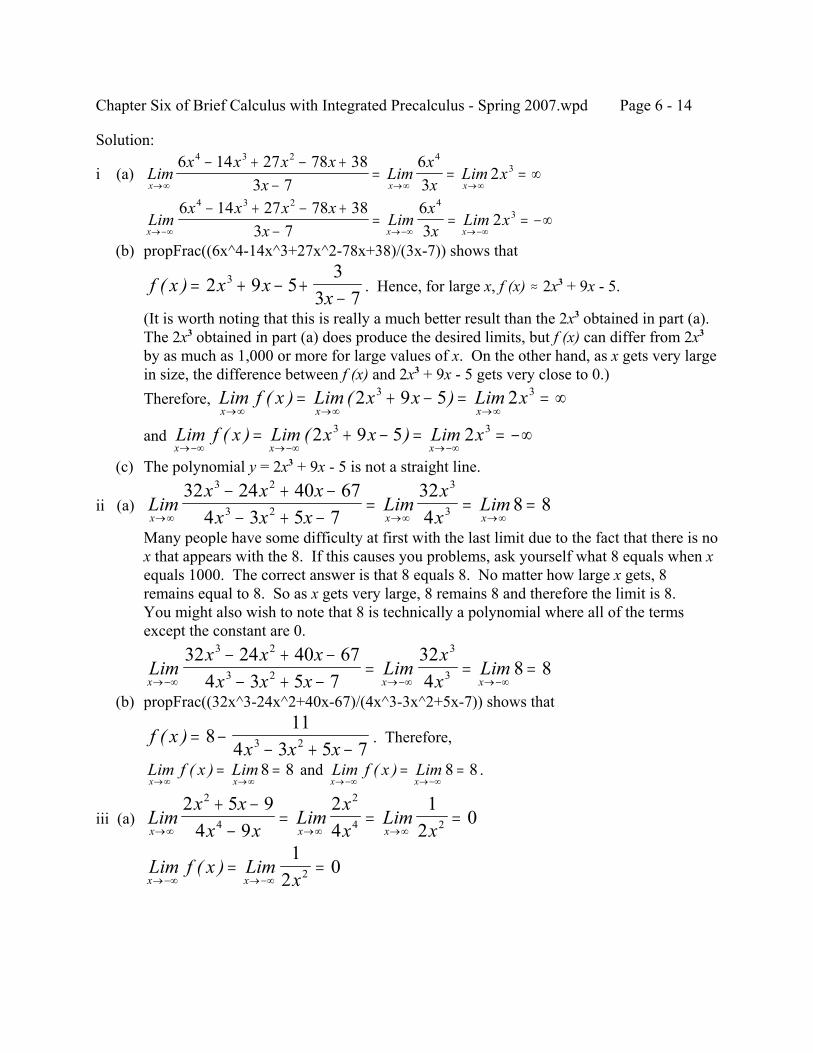
Chapter Six of Brief Calculus with Integrated Precalculus - Spring 2007.wpd Page 6 - 14
Solution:
i (a) Limx x x x
xLim
xx
Lim xx x x→∞ →∞ →∞
− + − +−
= = = ∞6 14 27 78 38
3 763
24 3 2 4
3
Limx x x x
xLim
xx
Lim xx x x→−∞ →−∞ →−∞
− + − +−
= = = −∞6 14 27 78 38
3 763
24 3 2 4
3
(b) propFrac((6x^4-14x^3+27x^2-78x+38)/(3x-7)) shows that
. Hence, for large x, f (x) . 2x3 + 9x - 5.f x x xx
( ) = + − +−
2 9 53
3 73
(It is worth noting that this is really a much better result than the 2x3 obtained in part (a).The 2x3 obtained in part (a) does produce the desired limits, but f (x) can differ from 2x3
by as much as 1,000 or more for large values of x. On the other hand, as x gets very largein size, the difference between f (x) and 2x3 + 9x - 5 gets very close to 0.)Therefore, Lim f x Lim x x Lim x
x x x→∞ →∞ →∞= + − = = ∞( ) ( )2 9 5 23 3
and Lim f x Lim x x Lim xx x x→−∞ →−∞ →−∞
= + − = = −∞( ) ( )2 9 5 23 3
(c) The polynomial y = 2x3 + 9x - 5 is not a straight line.
ii (a) Limx x x
x x xLim
xx
Limx x x→∞ →∞ →∞
− + −− + −
= = =32 24 40 67
4 3 5 7324
8 83 2
3 2
3
3
Many people have some difficulty at first with the last limit due to the fact that there is nox that appears with the 8. If this causes you problems, ask yourself what 8 equals when xequals 1000. The correct answer is that 8 equals 8. No matter how large x gets, 8remains equal to 8. So as x gets very large, 8 remains 8 and therefore the limit is 8.You might also wish to note that 8 is technically a polynomial where all of the termsexcept the constant are 0.
Limx x x
x x xLim
xx
Limx x x→−∞ →−∞ →−∞
− + −− + −
= = =32 24 40 67
4 3 5 7324
8 83 2
3 2
3
3
(b) propFrac((32x^3-24x^2+40x-67)/(4x^3-3x^2+5x-7)) shows that
. Therefore,f xx x x
( ) = −− + −
811
4 3 5 73 2
and .Lim f x Limx x→∞ →∞
= =( ) 8 8 Lim f x Limx x→−∞ →−∞
= =( ) 8 8
iii (a) Limx x
x xLim
xx
Limxx x x→∞ →∞ →∞
+ −−
= = =2 5 9
4 924
12
02
4
2
4 2
Lim f x Limxx x→−∞ →−∞
= =( )1
202
Chapter Six of Brief Calculus with Integrated Precalculus - Spring 2007.wpd Page 6 - 15
(b) propFrac((2x^2+5x-9)/(4x^4-9x)) produces , which is the same as the2 5 9
4 9
2
3
x xx x
+ −−( )
original function with the denominator in factored form. The reason this happened is dueto the fact that the original rational function had a denominator whose greatest exponentwas greater than all of the exponents in the numerator. As a result, it was already in finalform and long division does not change it. In essence, the propFrac operator is telling
you that f (x) = 0 + . Hence, and2 5 9
4 9
2
3
x xx x
+ −−( )
Lim f x Limx x→∞ →∞
= =( ) 0 0
.Lim f x Limx x→−∞ →−∞
= =( ) 0 0iv (a) In doing this problem it is important to realize that the numerator does not consist of a
single polynomial as it should in order for the rational function to be dealt with in thestandard manner. There are two possible choices. We could first multiply out thenumerator to obtain
.Lim f x Limx x x
x xLim
xx
Lim xx x x x→∞ →∞ →∞ →∞
=+ − −
+ −= = = ∞( )
12 20 27 452 7 8
122
63 2
2
3
2
However, it is easier to simply realize that the basic principle still holds: In eachpolynomial eliminate all terms except the one with the greatest exponent when x 6 4.
Limx x
x xLim
x xx
Limxx
Lim xx x x x→∞ →∞ →∞ →∞
− +− +
= = = = ∞( )( ) ( )( )4 9 5 3
7 8 24 3
2122
62
2
2
2
3
2
Limx x
x xLim
x xx
Limxx
Lim xx x x x→−∞ →−∞ →−∞ →−∞
− +− +
= = = = −∞( )( ) ( )( )4 9 5 3
7 8 24 3
2122
62
2
2
2
3
2
(b) propFrac(((4x^2-9)*(5+3x))/(7x-8+2x^2)) shows that
. Hence, f (x) .6x - 11 when x is large in size so thatf x xx
x x( )
( )= − +
−+ −
6 117 14 192 7 82
andLim f x Lim x Lim xx x x→∞ →∞ →∞
= − = = ∞( ) ( )6 11 6
.Lim f x Lim x Lim xx x x→−∞ →−∞ →−∞
= − = = −∞( ) ( )6 11 6
Example 6.8: For each rational function, f (x), listed below(a) Find and without a calculator.Lim f x
x→∞( ) Lim f x
x→−∞( )
(b) Use the TI-89 to find the polynomial, y = P(x), that f (x) behaves like for large x. Graph P(x) and f (x) in an appropriate window and verify the fact that as x gets larger in size the graph of f (x) gets closer to the graph of P(x).
(i) (ii) f xxx
( ) =−
−2 7
3
2
f xx
x( ) =
−6
2 10
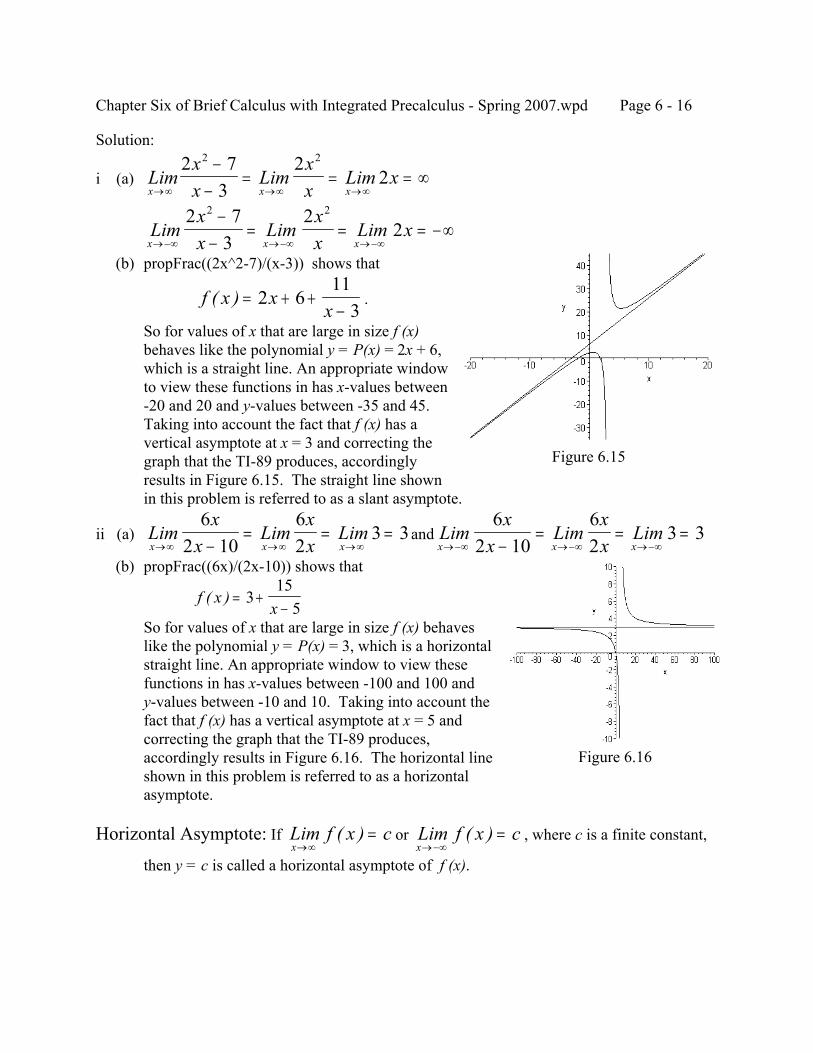
Chapter Six of Brief Calculus with Integrated Precalculus - Spring 2007.wpd Page 6 - 16
Figure 6.15
Figure 6.16
Solution:
i (a) Limxx
Limxx
Lim xx x x→∞ →∞ →∞
−−
= = = ∞2 7
32
22 2
Limxx
Limxx
Lim xx x x→−∞ →−∞ →−∞
−−
= = = −∞2 7
32
22 2
(b) propFrac((2x^2-7)/(x-3)) shows that
.f x xx
( ) = + +−
2 611
3So for values of x that are large in size f (x)behaves like the polynomial y = P(x) = 2x + 6,which is a straight line. An appropriate windowto view these functions in has x-values between-20 and 20 and y-values between -35 and 45. Taking into account the fact that f (x) has avertical asymptote at x = 3 and correcting thegraph that the TI-89 produces, accordinglyresults in Figure 6.15. The straight line shownin this problem is referred to as a slant asymptote.
ii (a) andLimx
xLim
xx
Limx x x→∞ →∞ →∞−
= = =6
2 1062
3 3 Limx
xLim
xx
Limx x x→−∞ →−∞ →−∞−
= = =6
2 1062
3 3
(b) propFrac((6x)/(2x-10)) shows that
f xx
( ) = +−
315
5So for values of x that are large in size f (x) behaveslike the polynomial y = P(x) = 3, which is a horizontalstraight line. An appropriate window to view thesefunctions in has x-values between -100 and 100 andy-values between -10 and 10. Taking into account thefact that f (x) has a vertical asymptote at x = 5 andcorrecting the graph that the TI-89 produces,accordingly results in Figure 6.16. The horizontal lineshown in this problem is referred to as a horizontalasymptote.
Horizontal Asymptote: If or , where c is a finite constant,Lim f x cx→∞
=( ) Lim f x cx→−∞
=( )then y = c is called a horizontal asymptote of f (x).
Chapter Six of Brief Calculus with Integrated Precalculus - Spring 2007.wpd Page 6 - 17
Example 6.9: Find and for the following functions.Lim f xx→∞
( ) Lim f xx→−∞
( ) Then find the horizontal asymptotes (if any).
(a) (b) (c) f xx
x x( ) =
−+ −
5 35 7
2
2 f xx xx x
( ) =− ++ −
4 8 93 5 11
5 2
3 f xxx
( ) =+−
7 62 8
2
3
Solution:
(a) and = 5.Limx
x xLim
xx
Limx x x→∞ →∞ →∞
−+ −
= =5 3
5 75
5 52
2
2
2 Lim f xx→−∞
( )
y = 5 is a horizontal asymptote.
(b) andLimx xx x
Limxx
Lim xx x x→∞ →∞ →∞
− ++ −
= = = ∞4 8 93 5 11
43
43
5 2
3
5
32
= . There are no horizontal asymptotes.Lim f xx→−∞
( ) Lim xx→−∞
= ∞43
2
(c) and = 0.Limxx
Limxx
Limxx x x→∞ →∞ →∞
+−
= = =7 62 8
72
72
02
3
2
3 Lim f xx→−∞
( )
y = 0 is a horizontal asymptote.
Exercise Set 6.2
For problems 1 to 9:(a) Find and by hand.Lim f x
x→∞( ) Lim f x
x→−∞( )
(b) Use the calculator to find the polynomial P(x) that f (x) behaves like for large x and observe that this polynomial produces the same limits as in part (a).
1. 2. f xx x x
x( ) =
+ − −+
14 27 212 3
3 2
f xx xx x
( ) =+ −+ −
6 18 733 11
2
2
3. 4. f xx x x x x
x x( ) =
− + − + −− +
15 47 47 50 55 273 7 2
5 4 3 2
2 f xx x x
x( ) =
+ + ++
5 8 7 311
3 2
4
5. f xx x x x x x
x x( ) =
+ − + + − +− +
6 5 93 37 260 600 1015 45 105
6 5 4 3 2
3
6. 7. f xx x x
x( ) =
+ − −+
21 14 273 2
3 2
f xx x
x x( )
( )( )=
+ −− +
2 7 3 95 8 12
8. 9. f x xx
( ) = − + ++
3 72
3 5f x
xx
( ) = −+−
76 73 1
Chapter Six of Brief Calculus with Integrated Precalculus - Spring 2007.wpd Page 6 - 18
For problems 10 to 12 find the horizontal asymptotes (if any). If there are none, then state whatf (x) behaves like as x 6 4 and x 6 - 4.
10. 11. 12. f xx xx x
( ) =+ −− +
7 3 112 9 5
2
3 f xxx
( ) =+−
6 92 5
2
f xx xx x
( ) =− +
− +15 8 12 3 7
3 2
3
6.3 THE QUOTIENT RULE
In order to find relative extrema we need to be able to find the derivative of a function and it isimportant that you realize that none of the rules that we have so far tells us how to find thederivative when the variable appears in the denominator. There is no problem when a constantappears in the denominator since
ddx
x x ddx
x x xx5 2 7
353
23
73
103
23
10 23
22− +
= − +
= − =
−
and, as you notice, just taking the derivative of the numerator and writing it over thedenominator will always work if there is no variable such as x in the denominator. But once thevariable appears in the denominator our current rules fail. For example,
according to the power rule and this is not the same as 7x6/3x2 =ddx
xx
ddx
x x7
34 34
= =
7x4/3. We need a new rule that tells us how to find the derivative of an expression that has thevariable in the denominator.
Quotient Rule: ddx
uv
vu uvv
=
′ − ′2
Derivative of a Quotient =Denominator times Derivative of Numerator - Numerator times Derivative of Denominator
Denominator Squared
It is very important that you get the order of the terms correct since you will get the sign of theanswer wrong if they are interchanged. It must begin “denominator times derivative of thenumerator.” In the next example expressions for u and v will be explicitly identified so that thequotient rule can be used as initially stated above. After that, all problems will be done using theEnglish indicated since that is the best way to do the problems.
Example 6.10: Use the quotient rule to verify = 4x3, as was shown above by firstddx
xx
7
3
reducing the fraction to x4 and then using the power rule.
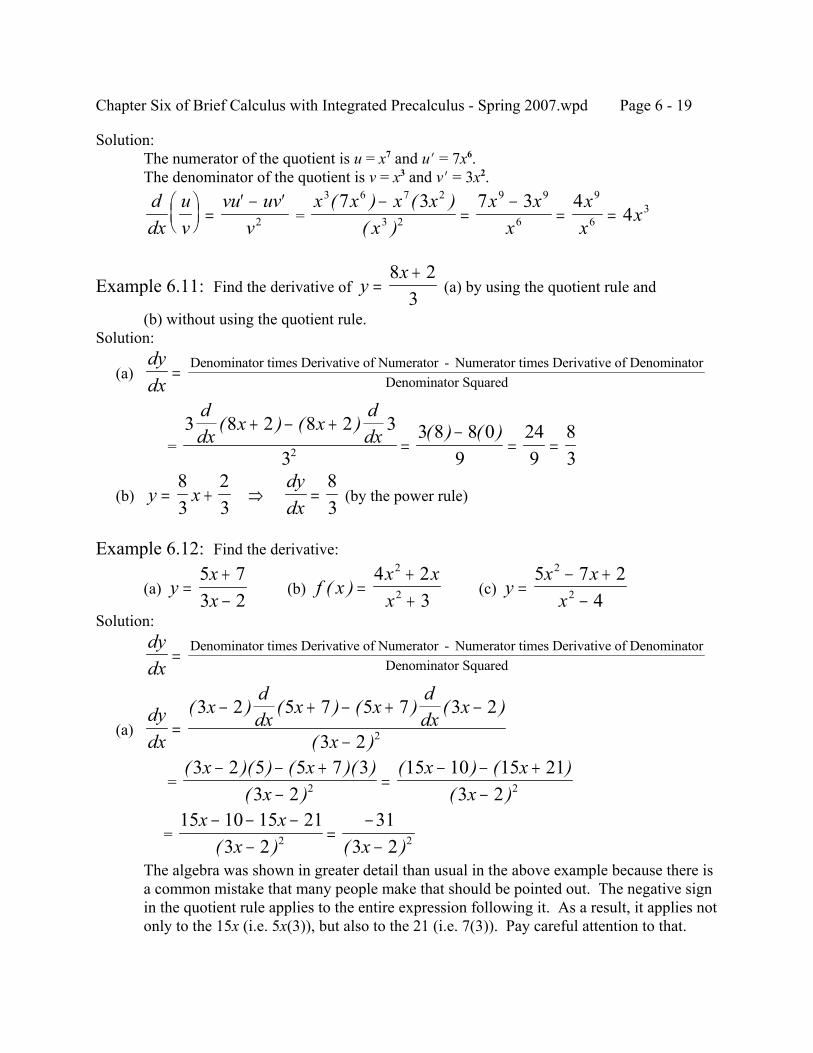
Chapter Six of Brief Calculus with Integrated Precalculus - Spring 2007.wpd Page 6 - 19
Solution:The numerator of the quotient is u = x7 and uN = 7x6.The denominator of the quotient is v = x3 and vN = 3x2.
= ddx
uv
vu uvv
=
′ − ′2
x x x xx
x xx
xx
x3 6 7 2
3 2
9 9
6
9
637 3 7 3 4
4( ) ( )
( )−
=−
= =
Example 6.11: Find the derivative of (a) by using the quotient rule andyx
=+8 23
(b) without using the quotient rule.Solution:
(a)dydx
= Denominator times Derivative of Numerator - Numerator times Derivative of DenominatorDenominator Squared
= 3 8 2 8 2 3
33 8 8 0
9249
832
ddx
x xddx
( ) ( ) ( ) ( )+ − +=
−= =
(b) (by the power rule)y xdydx
= + ⇒ =83
23
83
Example 6.12: Find the derivative:
(a) (b) (c) yxx
=+−
5 73 2
f xx xx
( ) =++
4 23
2
2 yx x
x=
− +−
5 7 24
2
2
Solution:dydx
= Denominator times Derivative of Numerator - Numerator times Derivative of DenominatorDenominator Squared
(a)dydx
xddx
x xddx
x
x=
− + − + −
−
( ) ( ) ( ) ( )
( )
3 2 5 7 5 7 3 2
3 2 2
= ( )( ) ( )( )
( )( ) ( )
( )3 2 5 5 7 3
3 215 10 15 21
3 22 2
x xx
x xx
− − +−
=− − +
−
= 15 10 15 21
3 231
3 22 2
x xx x
− − −−
=−−( ) ( )
The algebra was shown in greater detail than usual in the above example because there isa common mistake that many people make that should be pointed out. The negative signin the quotient rule applies to the entire expression following it. As a result, it applies notonly to the 15x (i.e. 5x(3)), but also to the 21 (i.e. 7(3)). Pay careful attention to that.
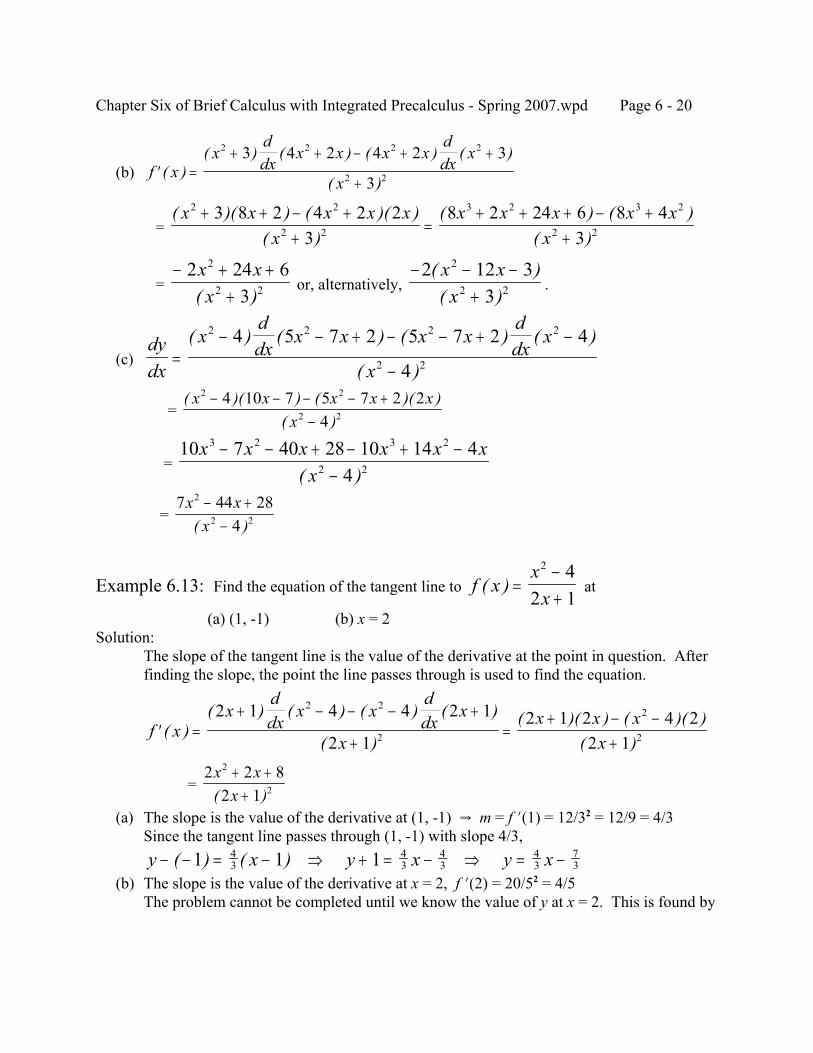
Chapter Six of Brief Calculus with Integrated Precalculus - Spring 2007.wpd Page 6 - 20
(b) ′ =+ + − + +
+f x
xddx
x x x xddx
x
x( )
( ) ( ) ( ) ( )
( )
2 2 2 2
2 2
3 4 2 4 2 3
3
= ( )( ) ( )( )
( )( ) ( )
( )x x x x x
xx x x x x
x
2 2
2 2
3 2 3 2
2 2
3 8 2 4 2 23
8 2 24 6 8 43
+ + − ++
=+ + + − +
+
= or, alternatively, .− + +
+2 24 6
3
2
2 2
x xx( )
− − −+
2 12 33
2
2 2
( )( )x xx
(c)dydx
xddx
x x x xddx
x
x=
− − + − − + −
−
( ) ( ) ( ) ( )
( )
2 2 2 2
2 2
4 5 7 2 5 7 2 4
4
= ( )( ) ( )( )
( )x x x x x
x
2 2
2 2
4 10 7 5 7 2 24
− − − − +−
= 10 7 40 28 10 14 4
4
3 2 3 2
2 2
x x x x x xx
− − + − + −−( )
= 7 44 28
4
2
2 2
x xx− +
−( )
Example 6.13: Find the equation of the tangent line to atf xx
x( ) =
−+
2 42 1
(a) (1, -1) (b) x = 2Solution:
The slope of the tangent line is the value of the derivative at the point in question. Afterfinding the slope, the point the line passes through is used to find the equation.
′ =+ − − − +
+=
+ − −+
f xx
ddx
x xddx
x
xx x x
x( )
( ) ( ) ( ) ( )
( )( )( ) ( )( )
( )
2 1 4 4 2 1
2 12 1 2 4 2
2 1
2 2
2
2
2
= 2 2 8
2 1
2
2
x xx+ ++( )
(a) The slope is the value of the derivative at (1, -1) Y m = f N(1) = 12/32 = 12/9 = 4/3Since the tangent line passes through (1, -1) with slope 4/3,y x y x y x− − = − ⇒ + = − ⇒ = −( ) ( )1 1 14
343
43
43
73
(b) The slope is the value of the derivative at x = 2, f N(2) = 20/52 = 4/5The problem cannot be completed until we know the value of y at x = 2. This is found by
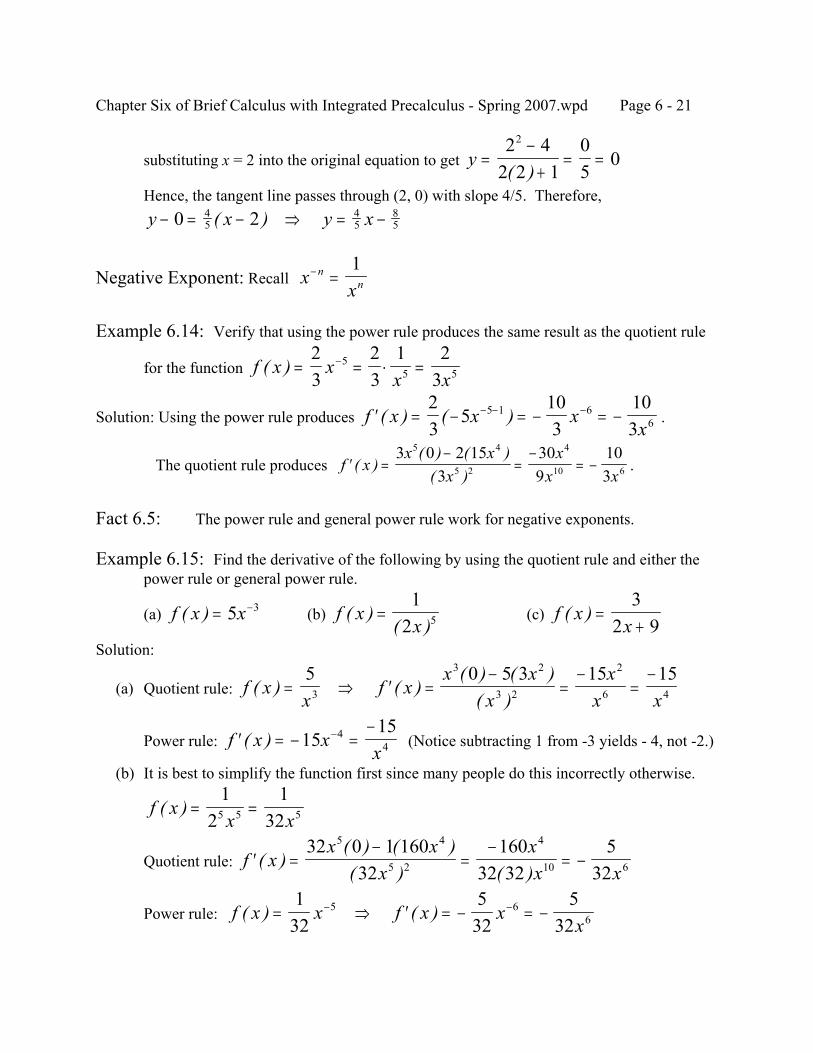
Chapter Six of Brief Calculus with Integrated Precalculus - Spring 2007.wpd Page 6 - 21
substituting x = 2 into the original equation to get y =−+
= =2 4
2 2 105
02
( )Hence, the tangent line passes through (2, 0) with slope 4/5. Therefore,y x y x− = − ⇒ = −0 24
545
85( )
Negative Exponent: Recall xx
nn
− =1
Example 6.14: Verify that using the power rule produces the same result as the quotient rule
for the function f x xx x
( ) = = ⋅ =−23
23
1 23
55 5
Solution: Using the power rule produces .′ = − = − = −− − −f x x xx
( ) ( )23
5103
103
5 1 66
The quotient rule produces .′ =−
=−
= −f xx x
xx
x x( )
( ) ( )( )
3 0 2 153
309
103
5 4
5 2
4
10 6
Fact 6.5: The power rule and general power rule work for negative exponents.
Example 6.15: Find the derivative of the following by using the quotient rule and either thepower rule or general power rule.
(a) (b) (c) f x x( ) = −5 3 f xx
( )( )
=1
2 5 f xx
( ) =+3
2 9Solution:
(a) Quotient rule: f xx
f xx x
xx
x x( ) ( )
( ) ( )( )
= ⇒ ′ =−
=−
=−5 0 5 3 15 15
3
3 2
3 2
2
6 4
Power rule: (Notice subtracting 1 from -3 yields - 4, not -2.)′ = − =−−f x xx
( ) 151544
(b) It is best to simplify the function first since many people do this incorrectly otherwise.
f xx x
( ) = =1
21
325 5 5
Quotient rule: ′ =−
=−
= −f xx x
xxx x
( )( ) ( )( ) ( )
32 0 1 16032
16032 32
532
5 4
5 2
4
10 6
Power rule: f x x f x xx
( ) ( )= ⇒ ′ = − = −− −132
532
532
5 66
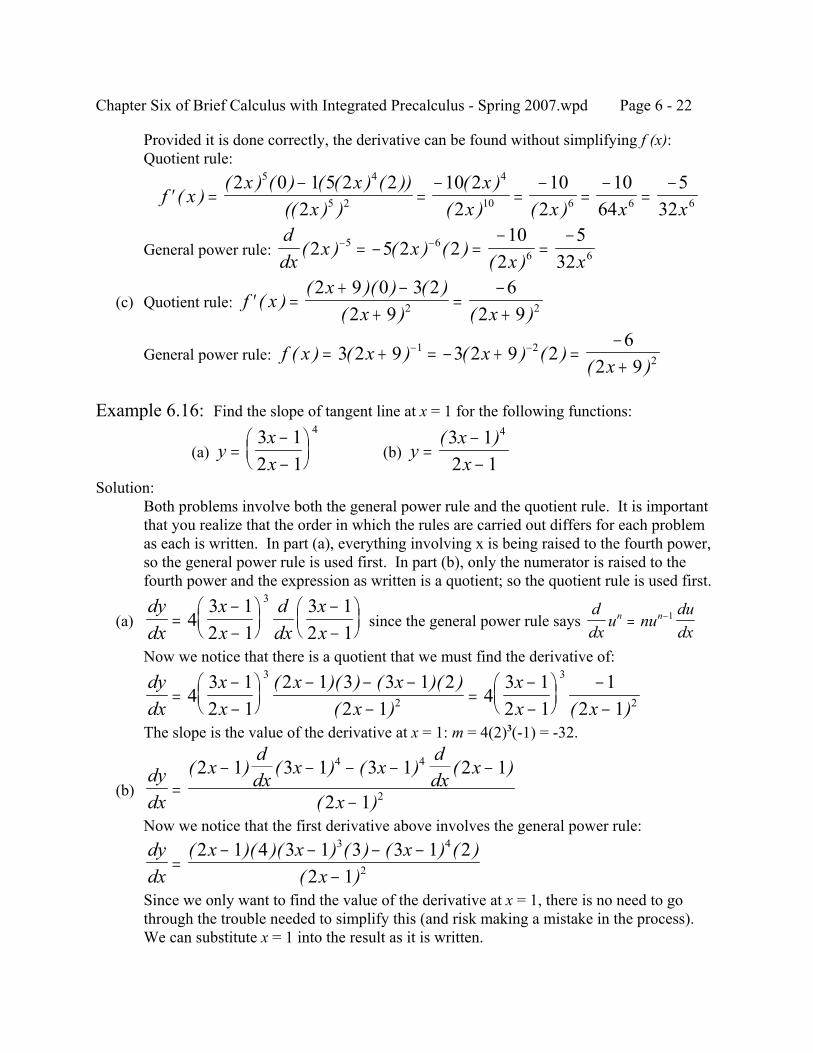
Chapter Six of Brief Calculus with Integrated Precalculus - Spring 2007.wpd Page 6 - 22
Provided it is done correctly, the derivative can be found without simplifying f (x):Quotient rule:
′ =−
=−
=−
=−
=−
f xx x
xx
x x x x( )
( ) ( ) ( ( ) ( ))(( ) )
( )( ) ( )
2 0 1 5 2 22
10 22
102
1064
532
5 4
5 2
4
10 6 6 6
General power rule: ddx
x xx x
( ) ( ) ( )( )
2 5 2 210
25
325 6
6 6− −= − =
−=
−
(c) Quotient rule: ′ =+ −
+=
−+
f xx
x x( )
( )( ) ( )( ) ( )
2 9 0 3 22 9
62 92 2
General power rule: f x x xx
( ) ( ) ( ) ( )( )
= + = − + =−+
− −3 2 9 3 2 9 26
2 91 2
2
Example 6.16: Find the slope of tangent line at x = 1 for the following functions:
(a) (b) yxx
=−−
3 12 1
4
yxx
=−−
( )3 12 1
4
Solution:Both problems involve both the general power rule and the quotient rule. It is importantthat you realize that the order in which the rules are carried out differs for each problemas each is written. In part (a), everything involving x is being raised to the fourth power,so the general power rule is used first. In part (b), only the numerator is raised to thefourth power and the expression as written is a quotient; so the quotient rule is used first.
(a) since the general power rule says dydx
xx
ddx
xx
=−−
−−
4
3 12 1
3 12 1
3ddx
u nududx
n n= −1
Now we notice that there is a quotient that we must find the derivative of:
dydx
xx
x xx
xx x
=−−
− − −−
=−−
−−
43 12 1
2 1 3 3 1 22 1
43 12 1
12 1
3
2
3
2
( )( ) ( )( )( ) ( )
The slope is the value of the derivative at x = 1: m = 4(2)3(-1) = -32.
(b)dydx
xddx
x xddx
x
x=
− − − − −
−
( ) ( ) ( ) ( )
( )
2 1 3 1 3 1 2 1
2 1
4 4
2
Now we notice that the first derivative above involves the general power rule:dydx
x x xx
=− − − −
−( )( )( ) ( ) ( ) ( )
( )2 1 4 3 1 3 3 1 2
2 1
3 4
2
Since we only want to find the value of the derivative at x = 1, there is no need to gothrough the trouble needed to simplify this (and risk making a mistake in the process). We can substitute x = 1 into the result as it is written.
Chapter Six of Brief Calculus with Integrated Precalculus - Spring 2007.wpd Page 6 - 23
m =−
=−
=( )( )( ) ( ) ( ) ( )1 4 2 3 2 2
196 32
164
3 4
2
Exercise Set 6.3:
For problems 1 to 8 find the derivative.
1. 2. 3. f xxx
( ) =+−
3 28 9
yxx
=−+
4 72 6
f xx
x( ) =
+5
7 3
4. 5. 6. yx
x=
−+
4 16 52 y
x xx
=++
3 27 1
2
f xx x
x( ) =
+ −+
2 5 71
3
2
7. 8. f xx
( ) =+8
32 yx x
=+ −5 6 12
2
9. Find the equation of the line tangent to at the point (2, 3).yx
x=
+−
2 52 1
10. Find the equation of the line tangent to at the point where x = 0.f xxx
( ) =+−
3 45 2
11. Find the derivative by using the quotient rule and also by using the power rule or the general power rule:
(a) (b) (c) yx
=511 f x x( ) = −2 3 f x
x( ) =
52 2
(d) (e) (f) y x= − −2 5 7 4( ) yx
=+4
5 2( )y
x=
+1
3 11
(g) f xx
( )( )
=3
2 3
For problems 12 to 14 find the slope of the tangent line at x = 2.
12. 13. 14. yx
x=
−4
3 4 3( )f x
xx
( ) =−−
3 42 3
3
y xx
x= +
−
( )5 2
31
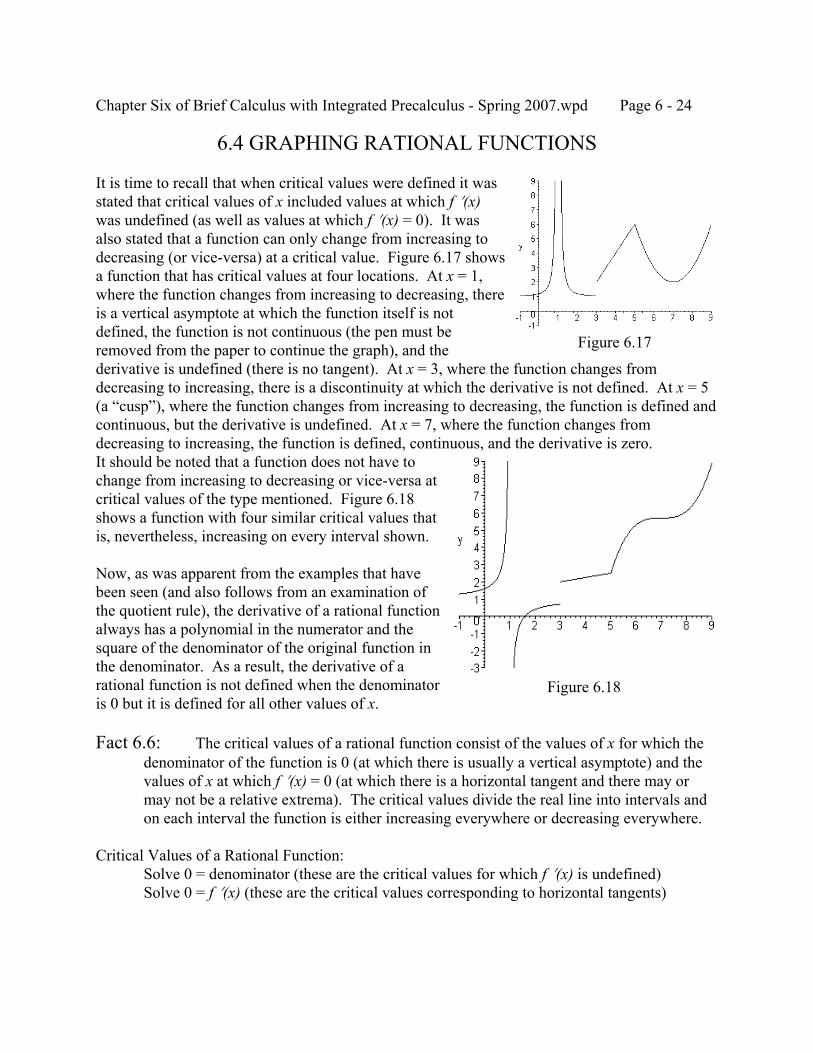
Chapter Six of Brief Calculus with Integrated Precalculus - Spring 2007.wpd Page 6 - 24
Figure 6.18
Figure 6.17
6.4 GRAPHING RATIONAL FUNCTIONS
It is time to recall that when critical values were defined it wasstated that critical values of x included values at which f N(x)was undefined (as well as values at which f N(x) = 0). It wasalso stated that a function can only change from increasing todecreasing (or vice-versa) at a critical value. Figure 6.17 showsa function that has critical values at four locations. At x = 1,where the function changes from increasing to decreasing, thereis a vertical asymptote at which the function itself is notdefined, the function is not continuous (the pen must beremoved from the paper to continue the graph), and thederivative is undefined (there is no tangent). At x = 3, where the function changes fromdecreasing to increasing, there is a discontinuity at which the derivative is not defined. At x = 5(a “cusp”), where the function changes from increasing to decreasing, the function is defined andcontinuous, but the derivative is undefined. At x = 7, where the function changes fromdecreasing to increasing, the function is defined, continuous, and the derivative is zero.It should be noted that a function does not have tochange from increasing to decreasing or vice-versa atcritical values of the type mentioned. Figure 6.18shows a function with four similar critical values thatis, nevertheless, increasing on every interval shown.
Now, as was apparent from the examples that havebeen seen (and also follows from an examination ofthe quotient rule), the derivative of a rational functionalways has a polynomial in the numerator and thesquare of the denominator of the original function inthe denominator. As a result, the derivative of arational function is not defined when the denominatoris 0 but it is defined for all other values of x.
Fact 6.6: The critical values of a rational function consist of the values of x for which thedenominator of the function is 0 (at which there is usually a vertical asymptote) and thevalues of x at which f N(x) = 0 (at which there is a horizontal tangent and there may ormay not be a relative extrema). The critical values divide the real line into intervals andon each interval the function is either increasing everywhere or decreasing everywhere.
Critical Values of a Rational Function:Solve 0 = denominator (these are the critical values for which f N(x) is undefined)Solve 0 = f N(x) (these are the critical values corresponding to horizontal tangents)
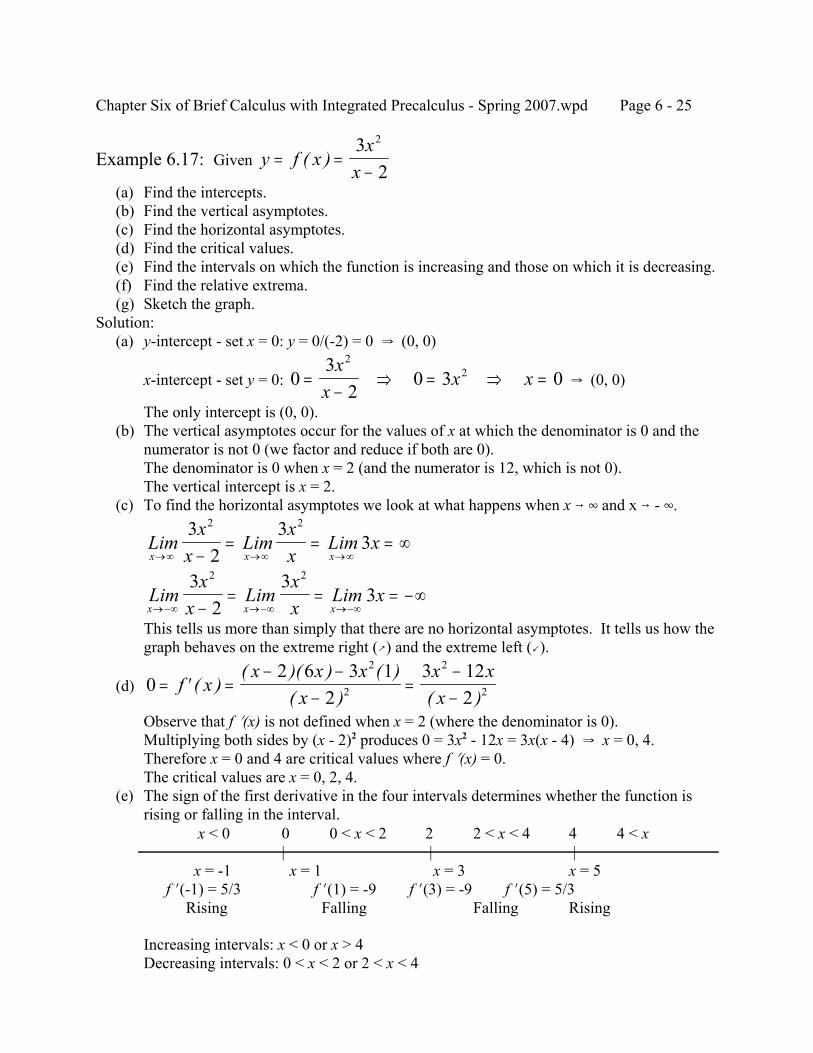
Chapter Six of Brief Calculus with Integrated Precalculus - Spring 2007.wpd Page 6 - 25
Example 6.17: Given y f xx
x= =
−( )
32
2
(a) Find the intercepts. (b) Find the vertical asymptotes. (c) Find the horizontal asymptotes. (d) Find the critical values. (e) Find the intervals on which the function is increasing and those on which it is decreasing. (f) Find the relative extrema. (g) Sketch the graph.Solution: (a) y-intercept - set x = 0: y = 0/(-2) = 0 Y (0, 0)
x-intercept - set y = 0: Y (0, 0)03
20 3 0
22=
−⇒ = ⇒ =
xx
x x
The only intercept is (0, 0). (b) The vertical asymptotes occur for the values of x at which the denominator is 0 and the
numerator is not 0 (we factor and reduce if both are 0).The denominator is 0 when x = 2 (and the numerator is 12, which is not 0).The vertical intercept is x = 2.
(c) To find the horizontal asymptotes we look at what happens when x 6 4 and x 6 - 4.
Limx
xLim
xx
Lim xx x x→∞ →∞ →∞−
= = = ∞3
23
32 2
Limx
xLim
xx
Lim xx x x→−∞ →−∞ →−∞−
= = = −∞3
23
32 2
This tells us more than simply that there are no horizontal asymptotes. It tells us how thegraph behaves on the extreme right (_) and the extreme left (b).
(d) 02 6 3 1
23 12
2
2
2
2
2= ′ =− −
−=
−−
f xx x x
xx xx
( )( )( ) ( )
( ) ( )Observe that f N(x) is not defined when x = 2 (where the denominator is 0).Multiplying both sides by (x - 2)2 produces 0 = 3x2 - 12x = 3x(x - 4) Y x = 0, 4.Therefore x = 0 and 4 are critical values where f N(x) = 0.The critical values are x = 0, 2, 4.
(e) The sign of the first derivative in the four intervals determines whether the function isrising or falling in the interval.
Increasing intervals: x < 0 or x > 4Decreasing intervals: 0 < x < 2 or 2 < x < 4
x < 0 0 0 < x < 2 2 2 < x < 4 4 4 < x| | |
x = -1 x = 1 x = 3 x = 5 f N(-1) = 5/3 f N(1) = -9 f N(3) = -9 f N(5) = 5/3
Rising Falling Falling Rising
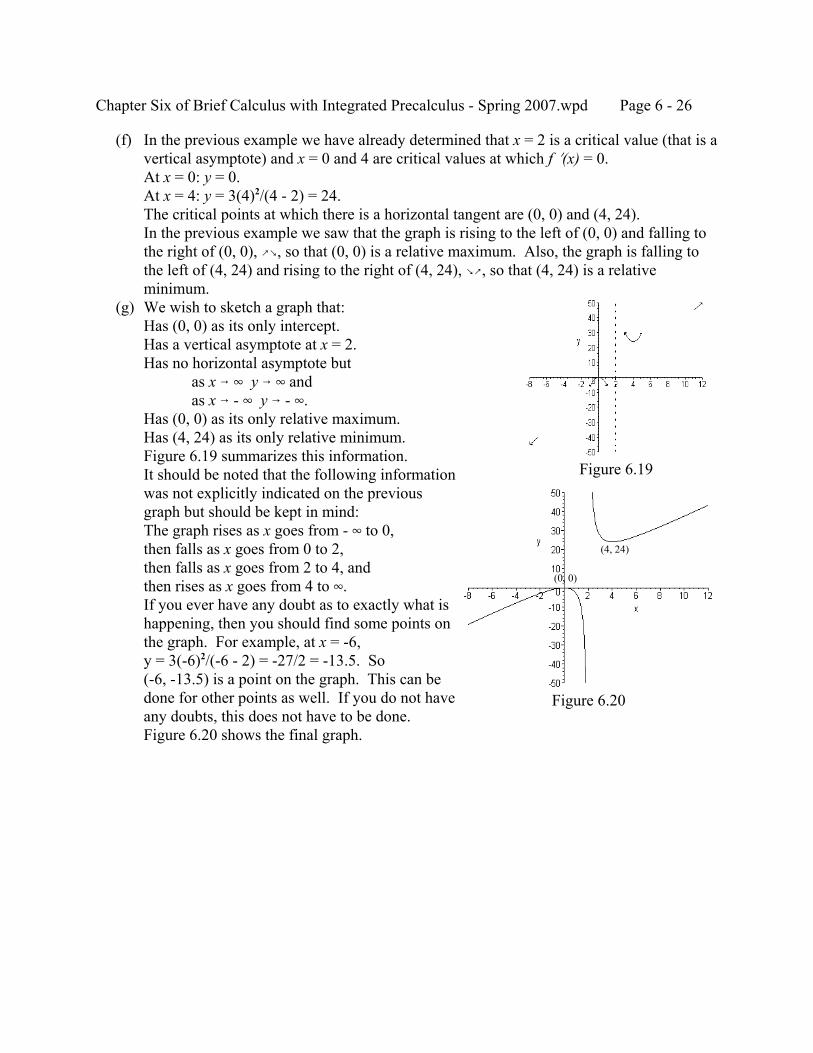
Chapter Six of Brief Calculus with Integrated Precalculus - Spring 2007.wpd Page 6 - 26
Figure 6.20
Figure 6.19
(f) In the previous example we have already determined that x = 2 is a critical value (that is avertical asymptote) and x = 0 and 4 are critical values at which f N(x) = 0.At x = 0: y = 0.At x = 4: y = 3(4)2/(4 - 2) = 24.The critical points at which there is a horizontal tangent are (0, 0) and (4, 24).In the previous example we saw that the graph is rising to the left of (0, 0) and falling tothe right of (0, 0), _`, so that (0, 0) is a relative maximum. Also, the graph is falling tothe left of (4, 24) and rising to the right of (4, 24), `_, so that (4, 24) is a relativeminimum.
(g) We wish to sketch a graph that:Has (0, 0) as its only intercept.Has a vertical asymptote at x = 2.Has no horizontal asymptote but
as x 6 4 y 6 4 andas x 6 - 4 y 6 - 4.
Has (0, 0) as its only relative maximum.Has (4, 24) as its only relative minimum.Figure 6.19 summarizes this information.It should be noted that the following informationwas not explicitly indicated on the previousgraph but should be kept in mind:The graph rises as x goes from - 4 to 0,then falls as x goes from 0 to 2,then falls as x goes from 2 to 4, andthen rises as x goes from 4 to 4.If you ever have any doubt as to exactly what ishappening, then you should find some points onthe graph. For example, at x = -6,y = 3(-6)2/(-6 - 2) = -27/2 = -13.5. So(-6, -13.5) is a point on the graph. This can bedone for other points as well. If you do not haveany doubts, this does not have to be done.Figure 6.20 shows the final graph.
(4, 24)
(0, 0)
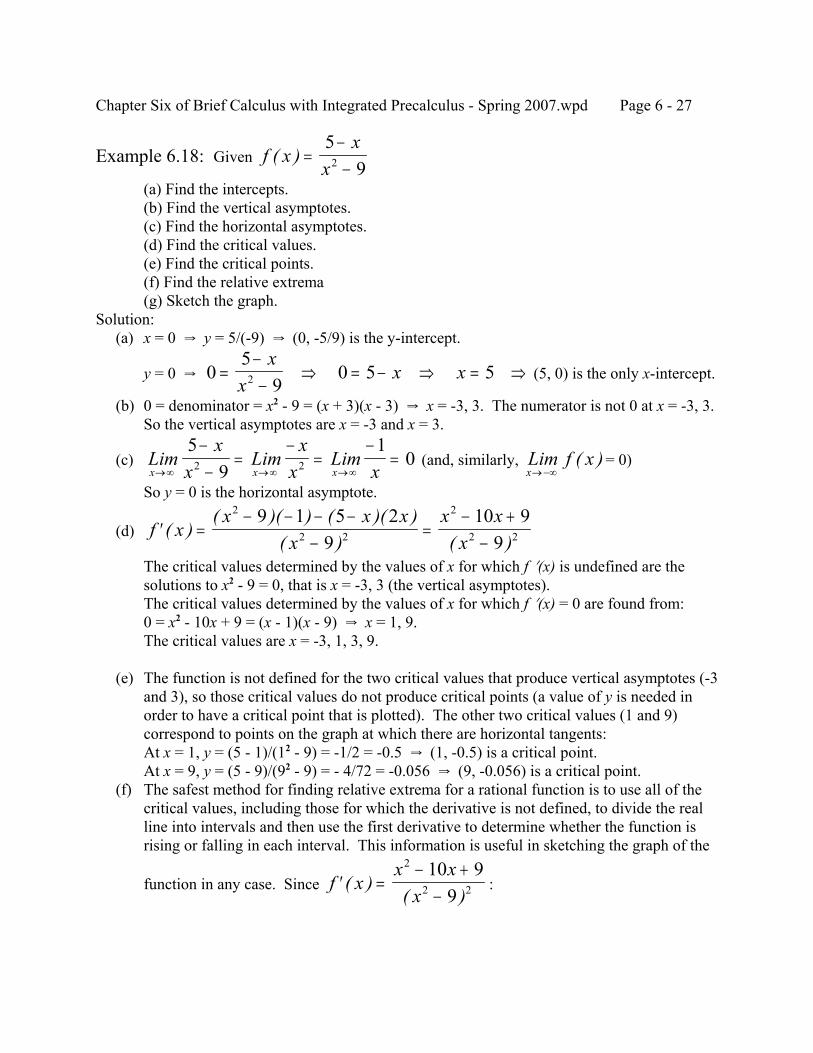
Chapter Six of Brief Calculus with Integrated Precalculus - Spring 2007.wpd Page 6 - 27
Example 6.18: Given f xx
x( ) =
−−
592
(a) Find the intercepts.(b) Find the vertical asymptotes.(c) Find the horizontal asymptotes.(d) Find the critical values.(e) Find the critical points.(f) Find the relative extrema(g) Sketch the graph.
Solution: (a) x = 0 Y y = 5/(-9) Y (0, -5/9) is the y-intercept.
y = 0 Y (5, 0) is the only x-intercept.05
90 5 52=
−−
⇒ = − ⇒ = ⇒x
xx x
(b) 0 = denominator = x2 - 9 = (x + 3)(x - 3) Y x = -3, 3. The numerator is not 0 at x = -3, 3.So the vertical asymptotes are x = -3 and x = 3.
(c) (and, similarly, = 0)Limx
xLim
xx
Limxx x x→∞ →∞ →∞
−−
=−
=−
=5
91
02 2 Lim f xx→−∞
( )
So y = 0 is the horizontal asymptote.
(d) ′ =− − − −
−=
− +−
f xx x x
xx x
x( )
( )( ) ( )( )( ) ( )
2
2 2
2
2 2
9 1 5 29
10 99
The critical values determined by the values of x for which f N(x) is undefined are thesolutions to x2 - 9 = 0, that is x = -3, 3 (the vertical asymptotes).The critical values determined by the values of x for which f N(x) = 0 are found from:0 = x2 - 10x + 9 = (x - 1)(x - 9) Y x = 1, 9.The critical values are x = -3, 1, 3, 9.
(e) The function is not defined for the two critical values that produce vertical asymptotes (-3and 3), so those critical values do not produce critical points (a value of y is needed inorder to have a critical point that is plotted). The other two critical values (1 and 9)correspond to points on the graph at which there are horizontal tangents:At x = 1, y = (5 - 1)/(12 - 9) = -1/2 = -0.5 Y (1, -0.5) is a critical point.At x = 9, y = (5 - 9)/(92 - 9) = - 4/72 = -0.056 Y (9, -0.056) is a critical point.
(f) The safest method for finding relative extrema for a rational function is to use all of thecritical values, including those for which the derivative is not defined, to divide the realline into intervals and then use the first derivative to determine whether the function isrising or falling in each interval. This information is useful in sketching the graph of the
function in any case. Since :′ =− +
−f x
x xx
( )( )
2
2 2
10 99
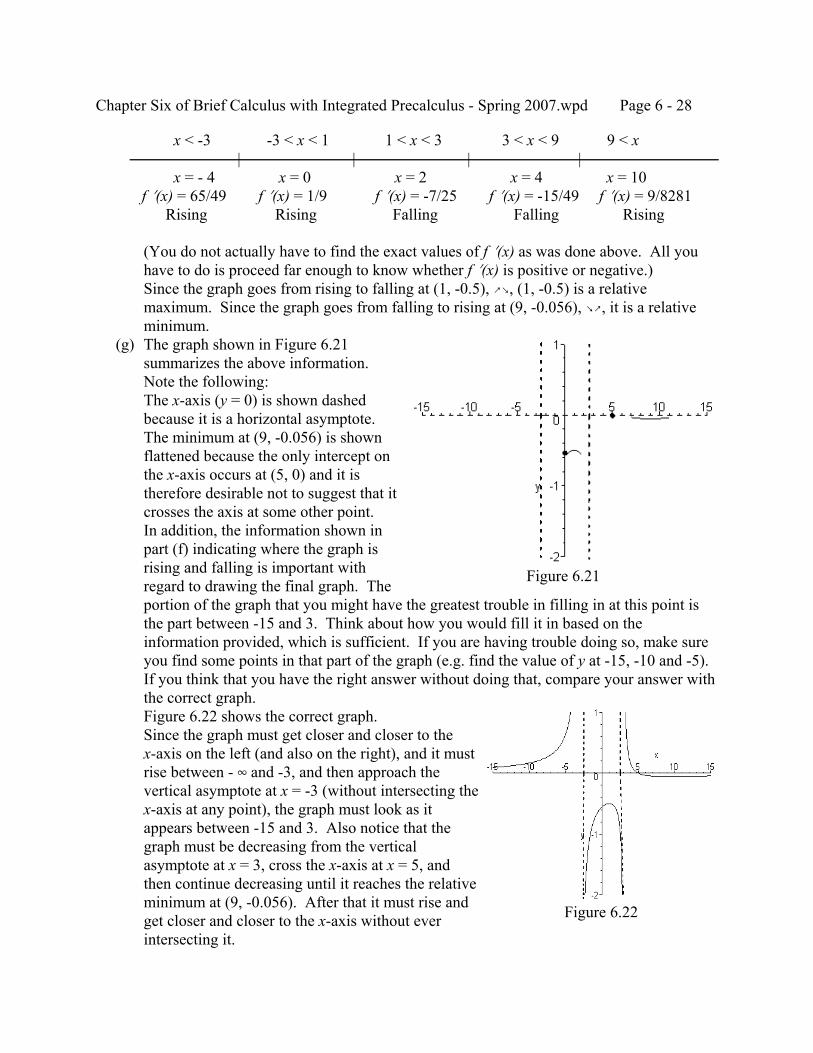
Chapter Six of Brief Calculus with Integrated Precalculus - Spring 2007.wpd Page 6 - 28
Figure 6.22
Figure 6.21
(You do not actually have to find the exact values of f N(x) as was done above. All youhave to do is proceed far enough to know whether f N(x) is positive or negative.)Since the graph goes from rising to falling at (1, -0.5), _`, (1, -0.5) is a relativemaximum. Since the graph goes from falling to rising at (9, -0.056), `_, it is a relativeminimum.
(g) The graph shown in Figure 6.21summarizes the above information.Note the following:The x-axis (y = 0) is shown dashedbecause it is a horizontal asymptote.The minimum at (9, -0.056) is shownflattened because the only intercept onthe x-axis occurs at (5, 0) and it istherefore desirable not to suggest that itcrosses the axis at some other point.In addition, the information shown inpart (f) indicating where the graph isrising and falling is important withregard to drawing the final graph. Theportion of the graph that you might have the greatest trouble in filling in at this point isthe part between -15 and 3. Think about how you would fill it in based on theinformation provided, which is sufficient. If you are having trouble doing so, make sureyou find some points in that part of the graph (e.g. find the value of y at -15, -10 and -5). If you think that you have the right answer without doing that, compare your answer withthe correct graph.Figure 6.22 shows the correct graph.Since the graph must get closer and closer to thex-axis on the left (and also on the right), and it mustrise between - 4 and -3, and then approach thevertical asymptote at x = -3 (without intersecting thex-axis at any point), the graph must look as itappears between -15 and 3. Also notice that thegraph must be decreasing from the verticalasymptote at x = 3, cross the x-axis at x = 5, andthen continue decreasing until it reaches the relativeminimum at (9, -0.056). After that it must rise andget closer and closer to the x-axis without everintersecting it.
x < -3 -3 < x < 1 1 < x < 3 3 < x < 9 9 < x | | | | x = - 4 x = 0 x = 2 x = 4 x = 10 f N(x) = 65/49 f N(x) = 1/9 f N(x) = -7/25 f N(x) = -15/49 f N(x) = 9/8281 Rising Rising Falling Falling Rising
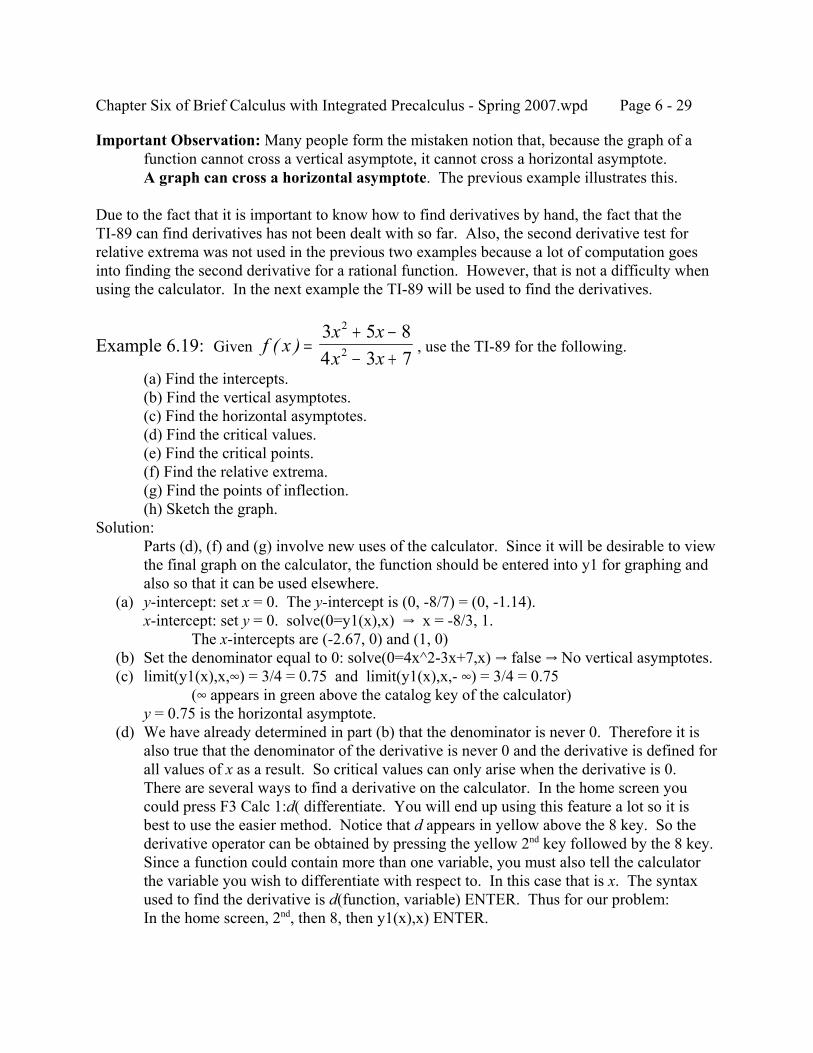
Chapter Six of Brief Calculus with Integrated Precalculus - Spring 2007.wpd Page 6 - 29
Important Observation: Many people form the mistaken notion that, because the graph of afunction cannot cross a vertical asymptote, it cannot cross a horizontal asymptote.A graph can cross a horizontal asymptote. The previous example illustrates this.
Due to the fact that it is important to know how to find derivatives by hand, the fact that theTI-89 can find derivatives has not been dealt with so far. Also, the second derivative test forrelative extrema was not used in the previous two examples because a lot of computation goesinto finding the second derivative for a rational function. However, that is not a difficulty whenusing the calculator. In the next example the TI-89 will be used to find the derivatives.
Example 6.19: Given , use the TI-89 for the following.f xx xx x
( ) =+ −− +
3 5 84 3 7
2
2
(a) Find the intercepts.(b) Find the vertical asymptotes.(c) Find the horizontal asymptotes.(d) Find the critical values.(e) Find the critical points.(f) Find the relative extrema.(g) Find the points of inflection.(h) Sketch the graph.
Solution:Parts (d), (f) and (g) involve new uses of the calculator. Since it will be desirable to viewthe final graph on the calculator, the function should be entered into y1 for graphing andalso so that it can be used elsewhere.
(a) y-intercept: set x = 0. The y-intercept is (0, -8/7) = (0, -1.14).x-intercept: set y = 0. solve(0=y1(x),x) Y x = -8/3, 1.
The x-intercepts are (-2.67, 0) and (1, 0) (b) Set the denominator equal to 0: solve(0=4x^2-3x+7,x) Y false Y No vertical asymptotes. (c) limit(y1(x),x,4) = 3/4 = 0.75 and limit(y1(x),x,- 4) = 3/4 = 0.75
(4 appears in green above the catalog key of the calculator)y = 0.75 is the horizontal asymptote.
(d) We have already determined in part (b) that the denominator is never 0. Therefore it isalso true that the denominator of the derivative is never 0 and the derivative is defined forall values of x as a result. So critical values can only arise when the derivative is 0.There are several ways to find a derivative on the calculator. In the home screen youcould press F3 Calc 1:d( differentiate. You will end up using this feature a lot so it isbest to use the easier method. Notice that d appears in yellow above the 8 key. So thederivative operator can be obtained by pressing the yellow 2nd key followed by the 8 key. Since a function could contain more than one variable, you must also tell the calculatorthe variable you wish to differentiate with respect to. In this case that is x. The syntaxused to find the derivative is d(function, variable) ENTER. Thus for our problem:In the home screen, 2nd, then 8, then y1(x),x) ENTER.
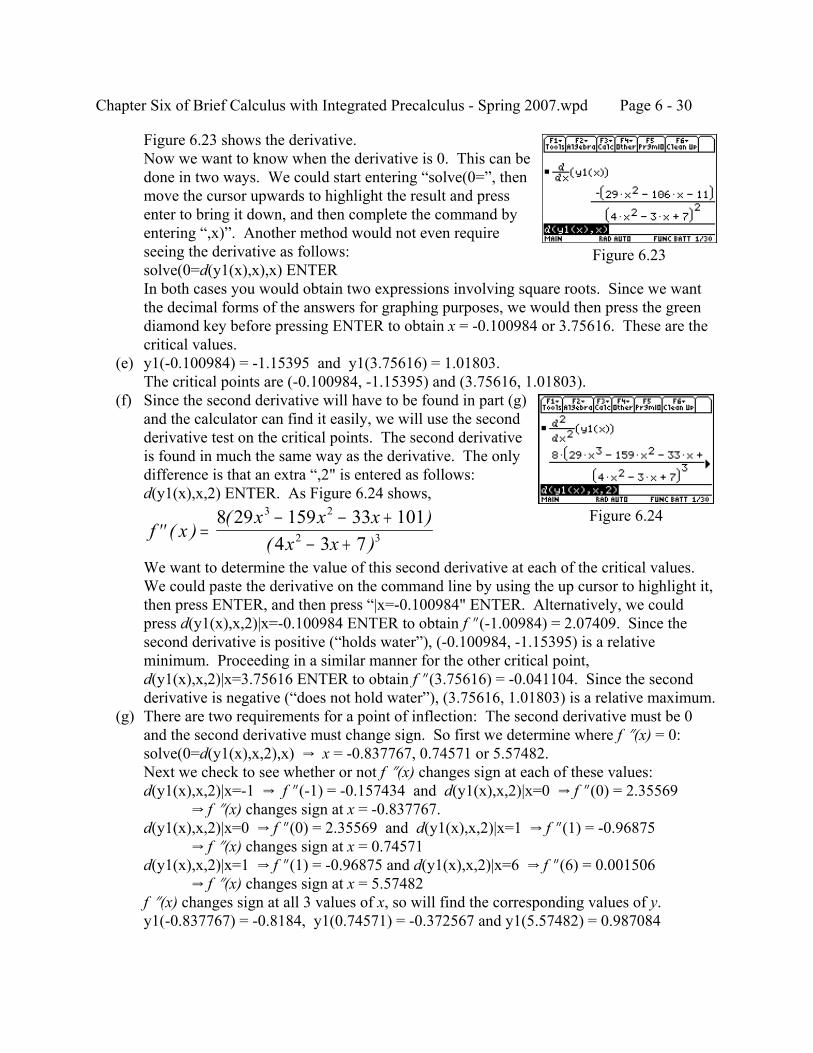
Chapter Six of Brief Calculus with Integrated Precalculus - Spring 2007.wpd Page 6 - 30
Figure 6.24
Figure 6.23
Figure 6.23 shows the derivative.Now we want to know when the derivative is 0. This can bedone in two ways. We could start entering “solve(0=”, thenmove the cursor upwards to highlight the result and pressenter to bring it down, and then complete the command byentering “,x)”. Another method would not even requireseeing the derivative as follows:solve(0=d(y1(x),x),x) ENTERIn both cases you would obtain two expressions involving square roots. Since we wantthe decimal forms of the answers for graphing purposes, we would then press the greendiamond key before pressing ENTER to obtain x = -0.100984 or 3.75616. These are thecritical values.
(e) y1(-0.100984) = -1.15395 and y1(3.75616) = 1.01803.The critical points are (-0.100984, -1.15395) and (3.75616, 1.01803).
(f) Since the second derivative will have to be found in part (g)and the calculator can find it easily, we will use the secondderivative test on the critical points. The second derivativeis found in much the same way as the derivative. The onlydifference is that an extra “,2" is entered as follows:d(y1(x),x,2) ENTER. As Figure 6.24 shows,
′′ =− − +
− +f x
x x xx x
( )( )
( )8 29 159 33 101
4 3 7
3 2
2 3
We want to determine the value of this second derivative at each of the critical values. We could paste the derivative on the command line by using the up cursor to highlight it,then press ENTER, and then press “|x=-0.100984" ENTER. Alternatively, we couldpress d(y1(x),x,2)|x=-0.100984 ENTER to obtain f O(-1.00984) = 2.07409. Since thesecond derivative is positive (“holds water”), (-0.100984, -1.15395) is a relativeminimum. Proceeding in a similar manner for the other critical point,d(y1(x),x,2)|x=3.75616 ENTER to obtain f O(3.75616) = -0.041104. Since the secondderivative is negative (“does not hold water”), (3.75616, 1.01803) is a relative maximum.
(g) There are two requirements for a point of inflection: The second derivative must be 0and the second derivative must change sign. So first we determine where f O(x) = 0:solve(0=d(y1(x),x,2),x) Y x = -0.837767, 0.74571 or 5.57482.Next we check to see whether or not f O(x) changes sign at each of these values:d(y1(x),x,2)|x=-1 Y f O(-1) = -0.157434 and d(y1(x),x,2)|x=0 Y f O(0) = 2.35569
Y f O(x) changes sign at x = -0.837767.d(y1(x),x,2)|x=0 Y f O(0) = 2.35569 and d(y1(x),x,2)|x=1 Y f O(1) = -0.96875
Y f O(x) changes sign at x = 0.74571d(y1(x),x,2)|x=1 Y f O(1) = -0.96875 and d(y1(x),x,2)|x=6 Y f O(6) = 0.001506
Y f O(x) changes sign at x = 5.57482f O(x) changes sign at all 3 values of x, so will find the corresponding values of y.y1(-0.837767) = -0.8184, y1(0.74571) = -0.372567 and y1(5.57482) = 0.987084
Chapter Six of Brief Calculus with Integrated Precalculus - Spring 2007.wpd Page 6 - 31
Figure 6.25
Figure 6.26
The points of inflection are (-0.837767, -0.8184),(0.74571, -0.372567) and (5.57482, 0.987084).
(h) All of the points found above have x values between -3 and6, and y values between -2 and 2. Since there is a horizontalasymptote of y = 0.75 and no vertical asymptotes it wouldseem acceptable as an initial graph to use the window:xmin = -10 xmax = 10 xscl = 1 ymin = -2 ymax = 2 yscl = 1Figure 6.25 is the result.
Figure 6.26 shows the final graph witha dashed line indicating the horizontalasymptote.
Exercise Set 6.4
For problems 1 to 6 do parts (a) to (g) by hand.(a) Find the intercepts.(b) Find the vertical asymptotes (if none, say so).(c) Find the horizontal asymptotes (if none, say so).(d) Find the critical values.(e) Find the critical points.(f) Find the intervals for which the function is increasing and those for which it is decreasing.(g) Find the relative extrema.(h) Sketch the graph.(i) Verify your result by viewing the graph on the TI-89.
1. 2. 3. f xxx
( ) =+ 3
2 f xxx
( ) =−−
2
2
254
f xx x
x x( ) =
−+ +
4 82 1
2
2
4. 5. 6. f xx
( ) =−
1683 f x
xx
( ) =+
3
2f x
xx
( ) =+
51
2
2
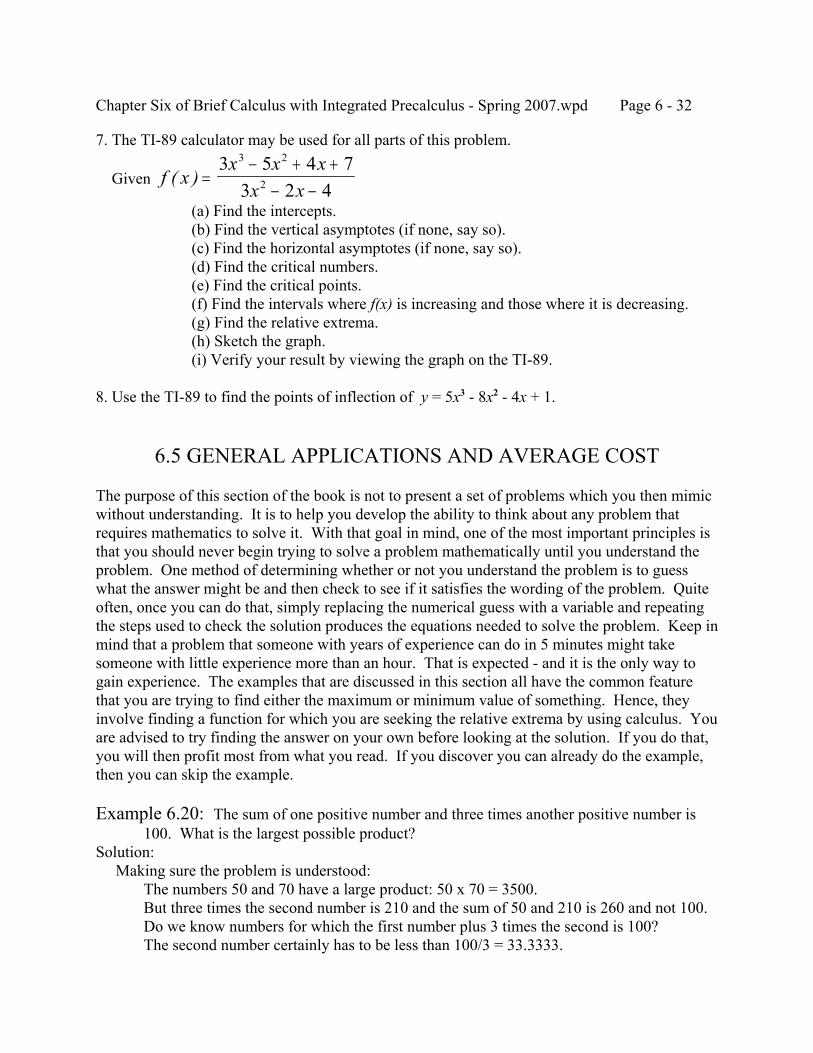
Chapter Six of Brief Calculus with Integrated Precalculus - Spring 2007.wpd Page 6 - 32
7. The TI-89 calculator may be used for all parts of this problem.
Given f xx x x
x x( ) =
− + +− −
3 5 4 73 2 4
3 2
2
(a) Find the intercepts.(b) Find the vertical asymptotes (if none, say so).(c) Find the horizontal asymptotes (if none, say so).(d) Find the critical numbers.(e) Find the critical points.(f) Find the intervals where f(x) is increasing and those where it is decreasing.(g) Find the relative extrema.(h) Sketch the graph.(i) Verify your result by viewing the graph on the TI-89.
8. Use the TI-89 to find the points of inflection of y = 5x3 - 8x2 - 4x + 1.
6.5 GENERAL APPLICATIONS AND AVERAGE COST
The purpose of this section of the book is not to present a set of problems which you then mimicwithout understanding. It is to help you develop the ability to think about any problem thatrequires mathematics to solve it. With that goal in mind, one of the most important principles isthat you should never begin trying to solve a problem mathematically until you understand theproblem. One method of determining whether or not you understand the problem is to guesswhat the answer might be and then check to see if it satisfies the wording of the problem. Quiteoften, once you can do that, simply replacing the numerical guess with a variable and repeatingthe steps used to check the solution produces the equations needed to solve the problem. Keep inmind that a problem that someone with years of experience can do in 5 minutes might takesomeone with little experience more than an hour. That is expected - and it is the only way togain experience. The examples that are discussed in this section all have the common featurethat you are trying to find either the maximum or minimum value of something. Hence, theyinvolve finding a function for which you are seeking the relative extrema by using calculus. Youare advised to try finding the answer on your own before looking at the solution. If you do that,you will then profit most from what you read. If you discover you can already do the example,then you can skip the example.
Example 6.20: The sum of one positive number and three times another positive number is100. What is the largest possible product?
Solution: Making sure the problem is understood:
The numbers 50 and 70 have a large product: 50 x 70 = 3500.But three times the second number is 210 and the sum of 50 and 210 is 260 and not 100.Do we know numbers for which the first number plus 3 times the second is 100?The second number certainly has to be less than 100/3 = 33.3333.
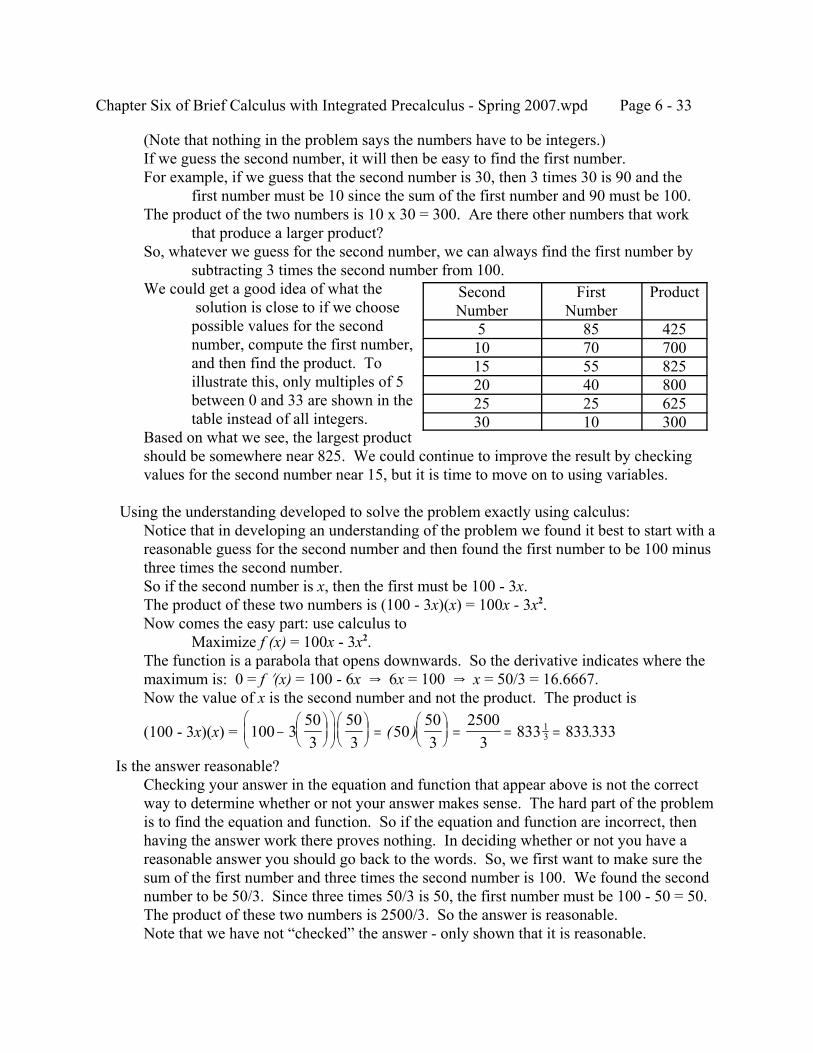
Chapter Six of Brief Calculus with Integrated Precalculus - Spring 2007.wpd Page 6 - 33
(Note that nothing in the problem says the numbers have to be integers.)If we guess the second number, it will then be easy to find the first number.For example, if we guess that the second number is 30, then 3 times 30 is 90 and the
first number must be 10 since the sum of the first number and 90 must be 100.The product of the two numbers is 10 x 30 = 300. Are there other numbers that work
that produce a larger product?So, whatever we guess for the second number, we can always find the first number by
subtracting 3 times the second number from 100.We could get a good idea of what the
solution is close to if we choosepossible values for the secondnumber, compute the first number,and then find the product. Toillustrate this, only multiples of 5between 0 and 33 are shown in thetable instead of all integers.
Based on what we see, the largest productshould be somewhere near 825. We could continue to improve the result by checkingvalues for the second number near 15, but it is time to move on to using variables.
Using the understanding developed to solve the problem exactly using calculus:Notice that in developing an understanding of the problem we found it best to start with areasonable guess for the second number and then found the first number to be 100 minusthree times the second number.So if the second number is x, then the first must be 100 - 3x.The product of these two numbers is (100 - 3x)(x) = 100x - 3x2.Now comes the easy part: use calculus to
Maximize f (x) = 100x - 3x2.The function is a parabola that opens downwards. So the derivative indicates where themaximum is: 0 = f N(x) = 100 - 6x Y 6x = 100 Y x = 50/3 = 16.6667.Now the value of x is the second number and not the product. The product is
(100 - 3x)(x) = 100 3503
503
50503
25003
833 83333313−
=
= = =( ) .
Is the answer reasonable?Checking your answer in the equation and function that appear above is not the correctway to determine whether or not your answer makes sense. The hard part of the problemis to find the equation and function. So if the equation and function are incorrect, thenhaving the answer work there proves nothing. In deciding whether or not you have areasonable answer you should go back to the words. So, we first want to make sure thesum of the first number and three times the second number is 100. We found the secondnumber to be 50/3. Since three times 50/3 is 50, the first number must be 100 - 50 = 50. The product of these two numbers is 2500/3. So the answer is reasonable.Note that we have not “checked” the answer - only shown that it is reasonable.
SecondNumber
FirstNumber
Product
5 85 42510 70 70015 55 82520 40 80025 25 62530 10 300
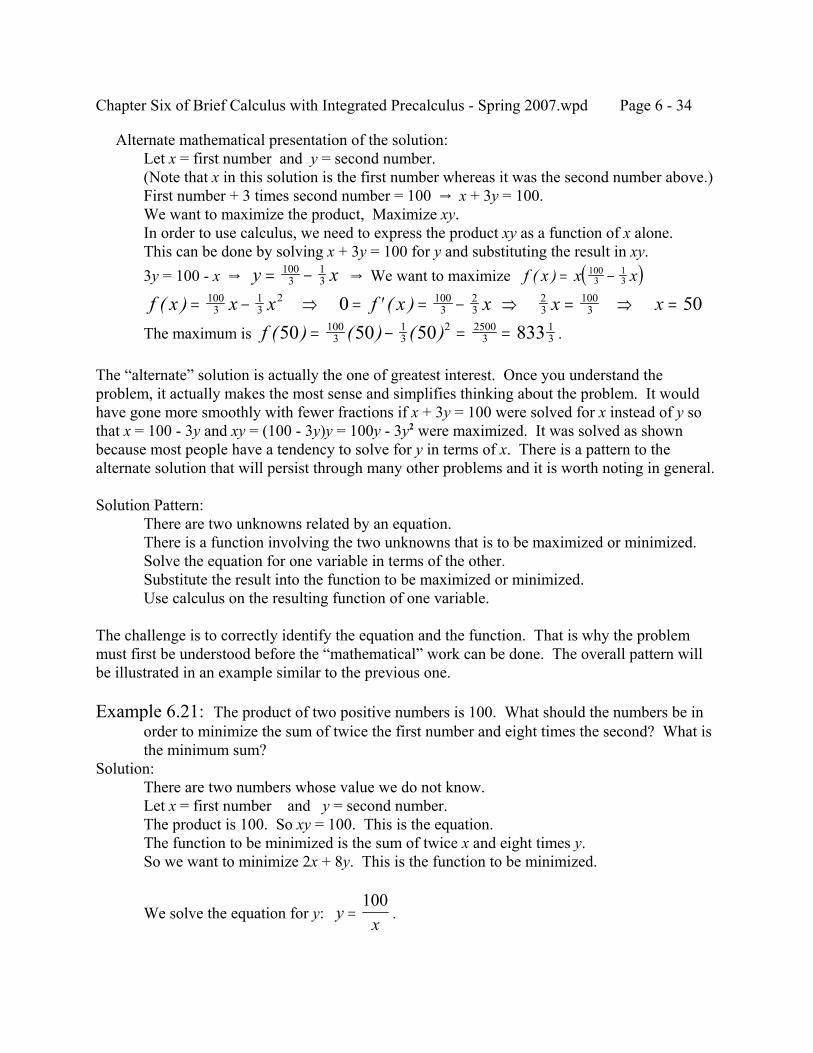
Chapter Six of Brief Calculus with Integrated Precalculus - Spring 2007.wpd Page 6 - 34
Alternate mathematical presentation of the solution:Let x = first number and y = second number.(Note that x in this solution is the first number whereas it was the second number above.)First number + 3 times second number = 100 Y x + 3y = 100.We want to maximize the product, Maximize xy.In order to use calculus, we need to express the product xy as a function of x alone.This can be done by solving x + 3y = 100 for y and substituting the result in xy.3y = 100 - x Y Y We want to maximize y x= −100
313 ( )f x x x( ) = −100
313
f x x x f x x( ) ( )= − ⇒ = ′ = −1003
13
2 1003
230 ⇒ = ⇒ =2
3100
3 50x xThe maximum is .f ( ) ( ) ( )50 50 50 833100
313
2 25003
13= − = =
The “alternate” solution is actually the one of greatest interest. Once you understand theproblem, it actually makes the most sense and simplifies thinking about the problem. It wouldhave gone more smoothly with fewer fractions if x + 3y = 100 were solved for x instead of y sothat x = 100 - 3y and xy = (100 - 3y)y = 100y - 3y2 were maximized. It was solved as shownbecause most people have a tendency to solve for y in terms of x. There is a pattern to thealternate solution that will persist through many other problems and it is worth noting in general.
Solution Pattern:There are two unknowns related by an equation.There is a function involving the two unknowns that is to be maximized or minimized.Solve the equation for one variable in terms of the other.Substitute the result into the function to be maximized or minimized.Use calculus on the resulting function of one variable.
The challenge is to correctly identify the equation and the function. That is why the problemmust first be understood before the “mathematical” work can be done. The overall pattern willbe illustrated in an example similar to the previous one.
Example 6.21: The product of two positive numbers is 100. What should the numbers be inorder to minimize the sum of twice the first number and eight times the second? What isthe minimum sum?
Solution:There are two numbers whose value we do not know.Let x = first number and y = second number.The product is 100. So xy = 100. This is the equation.The function to be minimized is the sum of twice x and eight times y.So we want to minimize 2x + 8y. This is the function to be minimized.
We solve the equation for y: .yx
=100
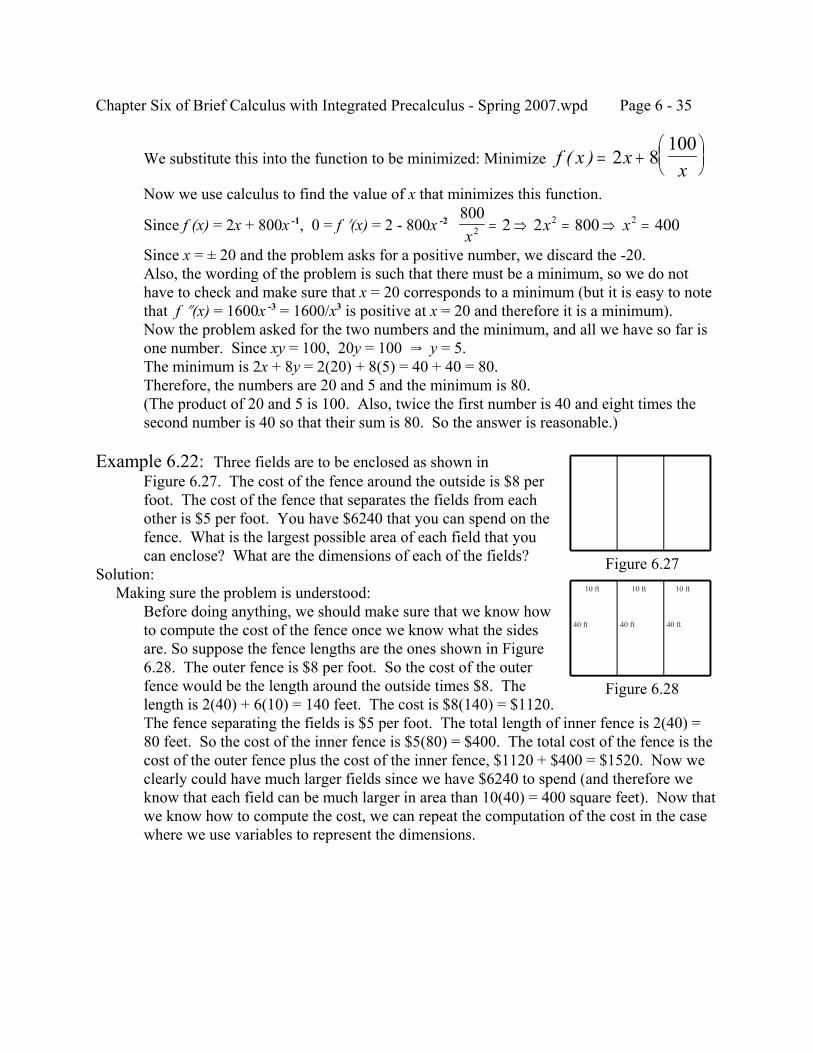
Chapter Six of Brief Calculus with Integrated Precalculus - Spring 2007.wpd Page 6 - 35
Figure 6.27
Figure 6.28
We substitute this into the function to be minimized: Minimize f x xx
( ) = +
2 8
100
Now we use calculus to find the value of x that minimizes this function.
Since f (x) = 2x + 800x -1, 0 = f N(x) = 2 - 800x -2 800
2 2 800 40022 2
xx x= ⇒ = ⇒ =
Since x = ± 20 and the problem asks for a positive number, we discard the -20.Also, the wording of the problem is such that there must be a minimum, so we do nothave to check and make sure that x = 20 corresponds to a minimum (but it is easy to notethat f O(x) = 1600x -3 = 1600/x3 is positive at x = 20 and therefore it is a minimum).Now the problem asked for the two numbers and the minimum, and all we have so far isone number. Since xy = 100, 20y = 100 Y y = 5.The minimum is 2x + 8y = 2(20) + 8(5) = 40 + 40 = 80.Therefore, the numbers are 20 and 5 and the minimum is 80.(The product of 20 and 5 is 100. Also, twice the first number is 40 and eight times thesecond number is 40 so that their sum is 80. So the answer is reasonable.)
Example 6.22: Three fields are to be enclosed as shown inFigure 6.27. The cost of the fence around the outside is $8 perfoot. The cost of the fence that separates the fields from eachother is $5 per foot. You have $6240 that you can spend on thefence. What is the largest possible area of each field that youcan enclose? What are the dimensions of each of the fields?
Solution: Making sure the problem is understood:
Before doing anything, we should make sure that we know howto compute the cost of the fence once we know what the sidesare. So suppose the fence lengths are the ones shown in Figure6.28. The outer fence is $8 per foot. So the cost of the outerfence would be the length around the outside times $8. Thelength is 2(40) + 6(10) = 140 feet. The cost is $8(140) = $1120. The fence separating the fields is $5 per foot. The total length of inner fence is 2(40) =80 feet. So the cost of the inner fence is $5(80) = $400. The total cost of the fence is thecost of the outer fence plus the cost of the inner fence, $1120 + $400 = $1520. Now weclearly could have much larger fields since we have $6240 to spend (and therefore weknow that each field can be much larger in area than 10(40) = 400 square feet). Now thatwe know how to compute the cost, we can repeat the computation of the cost in the casewhere we use variables to represent the dimensions.
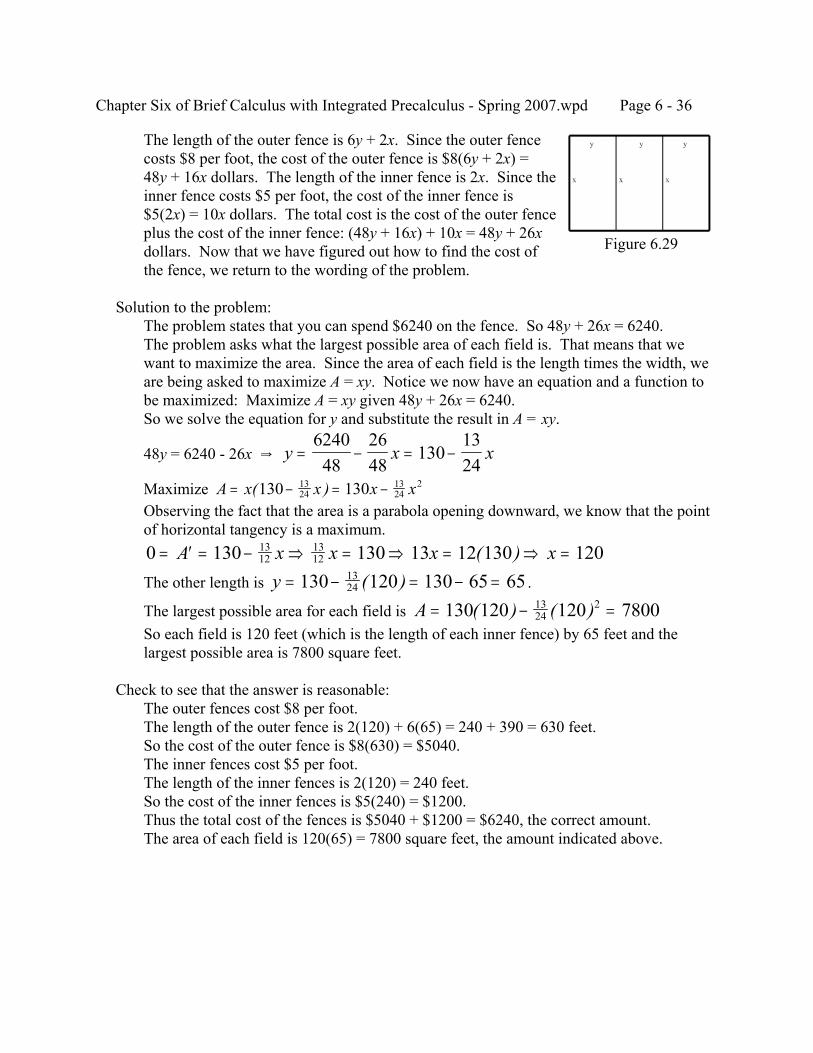
Chapter Six of Brief Calculus with Integrated Precalculus - Spring 2007.wpd Page 6 - 36
Figure 6.29
The length of the outer fence is 6y + 2x. Since the outer fencecosts $8 per foot, the cost of the outer fence is $8(6y + 2x) =48y + 16x dollars. The length of the inner fence is 2x. Since theinner fence costs $5 per foot, the cost of the inner fence is$5(2x) = 10x dollars. The total cost is the cost of the outer fenceplus the cost of the inner fence: (48y + 16x) + 10x = 48y + 26xdollars. Now that we have figured out how to find the cost ofthe fence, we return to the wording of the problem.
Solution to the problem:The problem states that you can spend $6240 on the fence. So 48y + 26x = 6240.The problem asks what the largest possible area of each field is. That means that wewant to maximize the area. Since the area of each field is the length times the width, weare being asked to maximize A = xy. Notice we now have an equation and a function tobe maximized: Maximize A = xy given 48y + 26x = 6240.So we solve the equation for y and substitute the result in A = xy.
48y = 6240 - 26x Y y x x= − = −624048
2648
1301324
Maximize A x x x x= − = −( )130 1301324
1324
2
Observing the fact that the area is a parabola opening downward, we know that the pointof horizontal tangency is a maximum.0 130 130 13 12 130 12013
121312= ′ = − ⇒ = ⇒ = ⇒ =A x x x x( )
The other length is .y = − = − =130 120 130 65 651324 ( )
The largest possible area for each field is A = − =130 120 120 78001324
2( ) ( )So each field is 120 feet (which is the length of each inner fence) by 65 feet and thelargest possible area is 7800 square feet.
Check to see that the answer is reasonable:The outer fences cost $8 per foot.The length of the outer fence is 2(120) + 6(65) = 240 + 390 = 630 feet.So the cost of the outer fence is $8(630) = $5040.The inner fences cost $5 per foot.The length of the inner fences is 2(120) = 240 feet.So the cost of the inner fences is $5(240) = $1200.Thus the total cost of the fences is $5040 + $1200 = $6240, the correct amount.The area of each field is 120(65) = 7800 square feet, the amount indicated above.
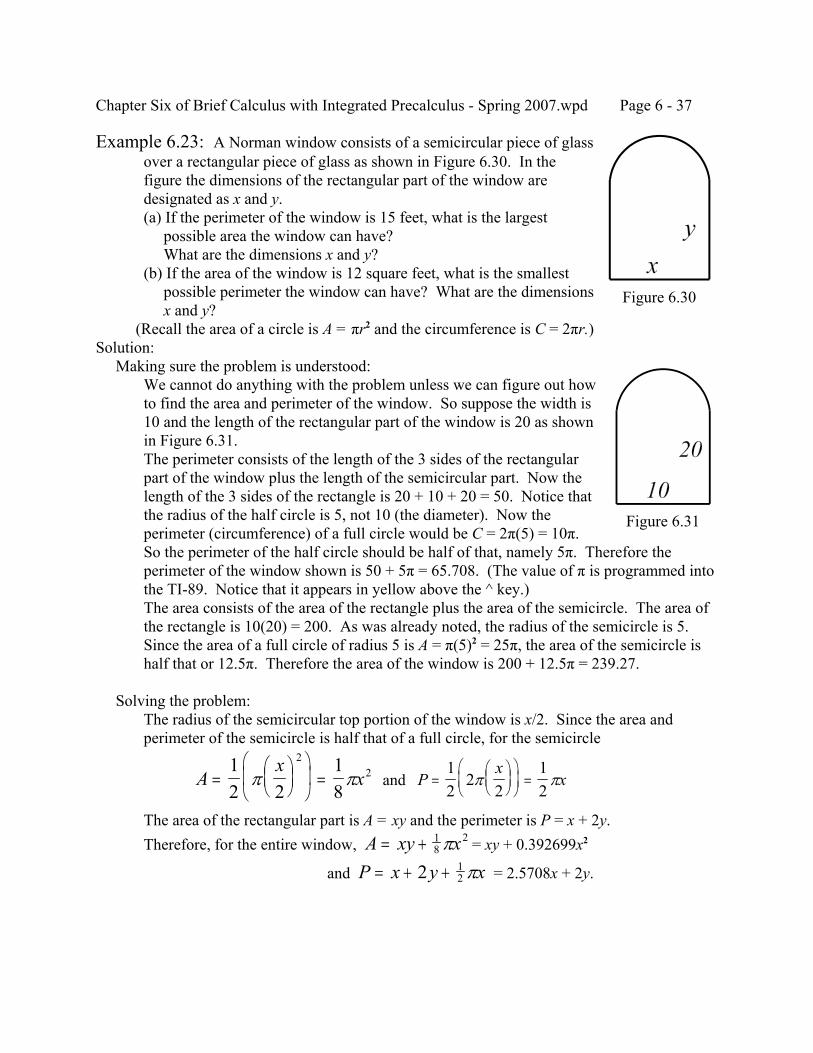
Chapter Six of Brief Calculus with Integrated Precalculus - Spring 2007.wpd Page 6 - 37
Figure 6.30
Figure 6.31
Example 6.23: A Norman window consists of a semicircular piece of glassover a rectangular piece of glass as shown in Figure 6.30. In thefigure the dimensions of the rectangular part of the window aredesignated as x and y.(a) If the perimeter of the window is 15 feet, what is the largest possible area the window can have? What are the dimensions x and y?(b) If the area of the window is 12 square feet, what is the smallest possible perimeter the window can have? What are the dimensions x and y?
(Recall the area of a circle is A = πr2 and the circumference is C = 2πr.)Solution: Making sure the problem is understood:
We cannot do anything with the problem unless we can figure out howto find the area and perimeter of the window. So suppose the width is10 and the length of the rectangular part of the window is 20 as shownin Figure 6.31.The perimeter consists of the length of the 3 sides of the rectangularpart of the window plus the length of the semicircular part. Now thelength of the 3 sides of the rectangle is 20 + 10 + 20 = 50. Notice thatthe radius of the half circle is 5, not 10 (the diameter). Now theperimeter (circumference) of a full circle would be C = 2π(5) = 10π. So the perimeter of the half circle should be half of that, namely 5π. Therefore theperimeter of the window shown is 50 + 5π = 65.708. (The value of π is programmed intothe TI-89. Notice that it appears in yellow above the ^ key.)The area consists of the area of the rectangle plus the area of the semicircle. The area ofthe rectangle is 10(20) = 200. As was already noted, the radius of the semicircle is 5. Since the area of a full circle of radius 5 is A = π(5)2 = 25π, the area of the semicircle ishalf that or 12.5π. Therefore the area of the window is 200 + 12.5π = 239.27.
Solving the problem:The radius of the semicircular top portion of the window is x/2. Since the area andperimeter of the semicircle is half that of a full circle, for the semicircle
and Ax
x=
=
12 2
18
22π π P
xx=
=
12
22
12
π π
The area of the rectangular part is A = xy and the perimeter is P = x + 2y.Therefore, for the entire window, = xy + 0.392699x2A xy x= + 1
82π
and = 2.5708x + 2y.P x y x= + +2 12 π
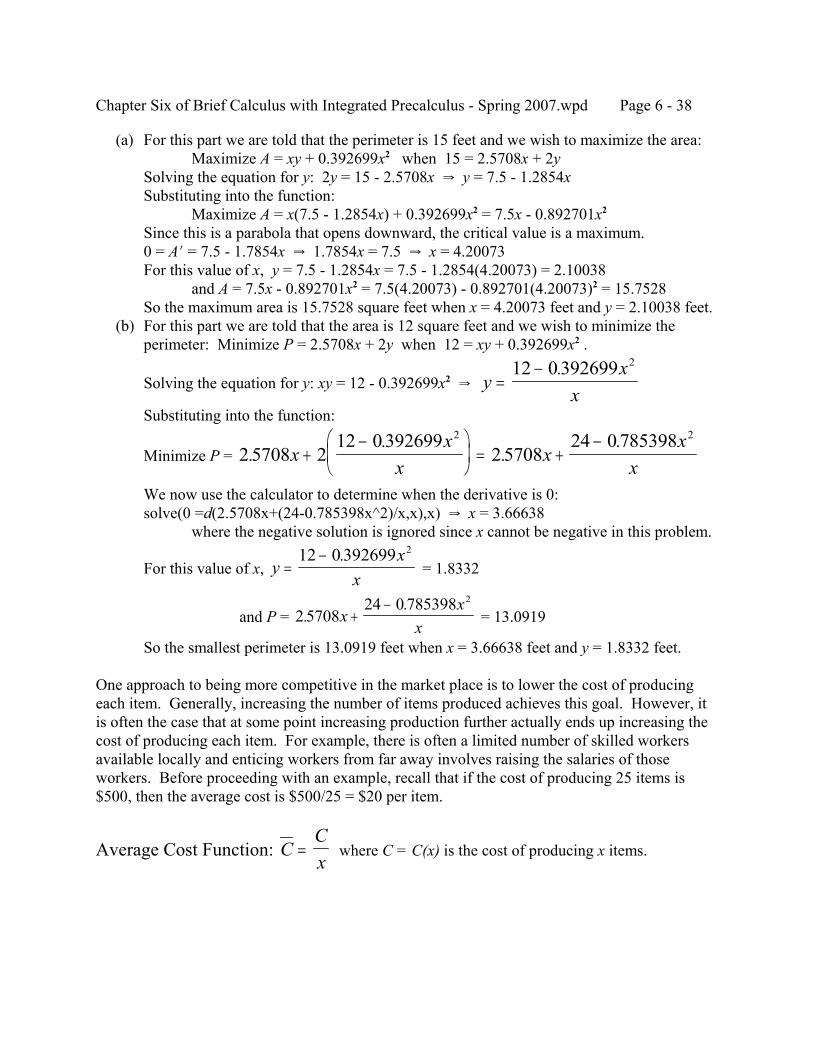
Chapter Six of Brief Calculus with Integrated Precalculus - Spring 2007.wpd Page 6 - 38
(a) For this part we are told that the perimeter is 15 feet and we wish to maximize the area:Maximize A = xy + 0.392699x2 when 15 = 2.5708x + 2y
Solving the equation for y: 2y = 15 - 2.5708x Y y = 7.5 - 1.2854xSubstituting into the function:
Maximize A = x(7.5 - 1.2854x) + 0.392699x2 = 7.5x - 0.892701x2
Since this is a parabola that opens downward, the critical value is a maximum.0 = AN = 7.5 - 1.7854x Y 1.7854x = 7.5 Y x = 4.20073For this value of x, y = 7.5 - 1.2854x = 7.5 - 1.2854(4.20073) = 2.10038
and A = 7.5x - 0.892701x2 = 7.5(4.20073) - 0.892701(4.20073)2 = 15.7528So the maximum area is 15.7528 square feet when x = 4.20073 feet and y = 2.10038 feet.
(b) For this part we are told that the area is 12 square feet and we wish to minimize theperimeter: Minimize P = 2.5708x + 2y when 12 = xy + 0.392699x2 .
Solving the equation for y: xy = 12 - 0.392699x2 Y yx
x=
−12 0 392699 2.
Substituting into the function:
Minimize P = 2 5708 212 0 392699
2 570824 0 7853982 2
..
..
xx
xx
xx
+−
= +
−
We now use the calculator to determine when the derivative is 0:solve(0 =d(2.5708x+(24-0.785398x^2)/x,x),x) Y x = 3.66638
where the negative solution is ignored since x cannot be negative in this problem.
For this value of x, = 1.8332yx
x=
−12 0 392699 2.
and P = = 13.09192 570824 0 785398 2
..
xx
x+
−
So the smallest perimeter is 13.0919 feet when x = 3.66638 feet and y = 1.8332 feet.
One approach to being more competitive in the market place is to lower the cost of producingeach item. Generally, increasing the number of items produced achieves this goal. However, itis often the case that at some point increasing production further actually ends up increasing thecost of producing each item. For example, there is often a limited number of skilled workersavailable locally and enticing workers from far away involves raising the salaries of thoseworkers. Before proceeding with an example, recall that if the cost of producing 25 items is$500, then the average cost is $500/25 = $20 per item.
Average Cost Function: where C = C(x) is the cost of producing x items.CCx
=
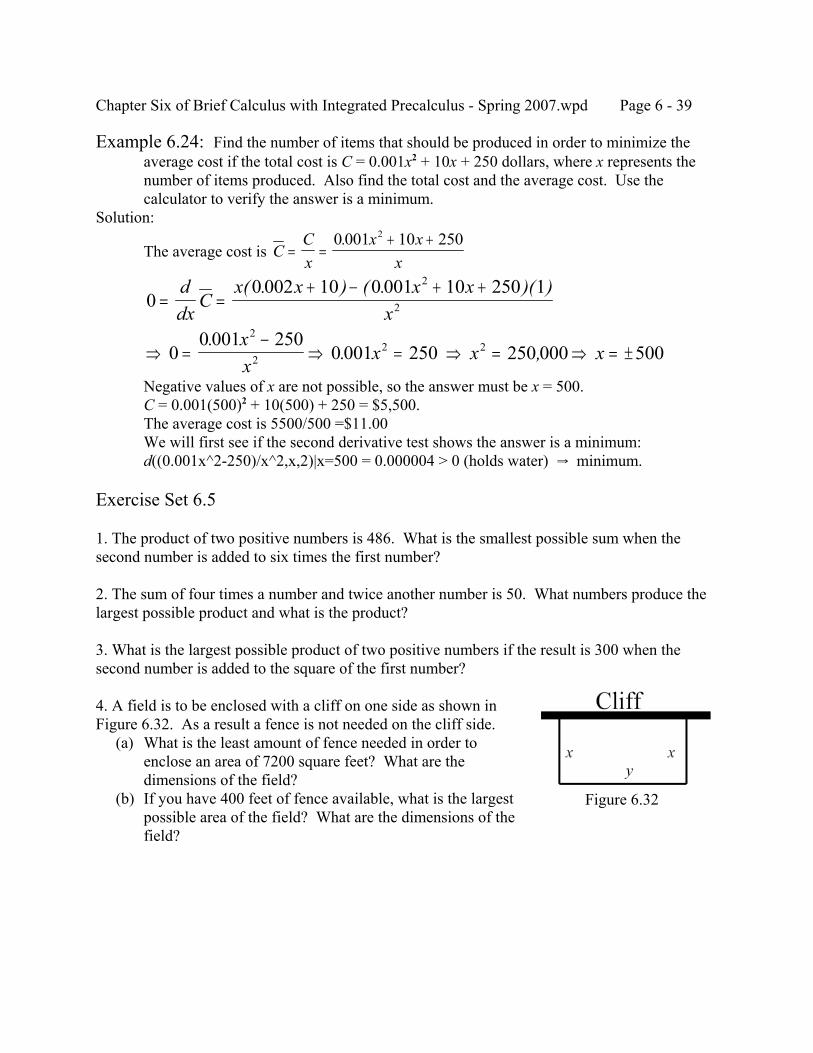
Chapter Six of Brief Calculus with Integrated Precalculus - Spring 2007.wpd Page 6 - 39
Figure 6.32
Example 6.24: Find the number of items that should be produced in order to minimize theaverage cost if the total cost is C = 0.001x2 + 10x + 250 dollars, where x represents thenumber of items produced. Also find the total cost and the average cost. Use thecalculator to verify the answer is a minimum.
Solution:
The average cost is CCx
x xx
= =+ +0 001 10 2502.
00 002 10 0 001 10 250 12
2= =+ − + +d
dxC
x x x xx
( . ) ( . )( )
⇒ =−
⇒ =00 001 250
0 001 2502
22.
.xx
x ⇒ = ⇒ = ±x x2 250 000 500,
Negative values of x are not possible, so the answer must be x = 500.C = 0.001(500)2 + 10(500) + 250 = $5,500.The average cost is 5500/500 =$11.00We will first see if the second derivative test shows the answer is a minimum:d((0.001x^2-250)/x^2,x,2)|x=500 = 0.000004 > 0 (holds water) Y minimum.
Exercise Set 6.5
1. The product of two positive numbers is 486. What is the smallest possible sum when thesecond number is added to six times the first number?
2. The sum of four times a number and twice another number is 50. What numbers produce thelargest possible product and what is the product?
3. What is the largest possible product of two positive numbers if the result is 300 when thesecond number is added to the square of the first number?
4. A field is to be enclosed with a cliff on one side as shown inFigure 6.32. As a result a fence is not needed on the cliff side. (a) What is the least amount of fence needed in order to
enclose an area of 7200 square feet? What are thedimensions of the field?
(b) If you have 400 feet of fence available, what is the largestpossible area of the field? What are the dimensions of thefield?
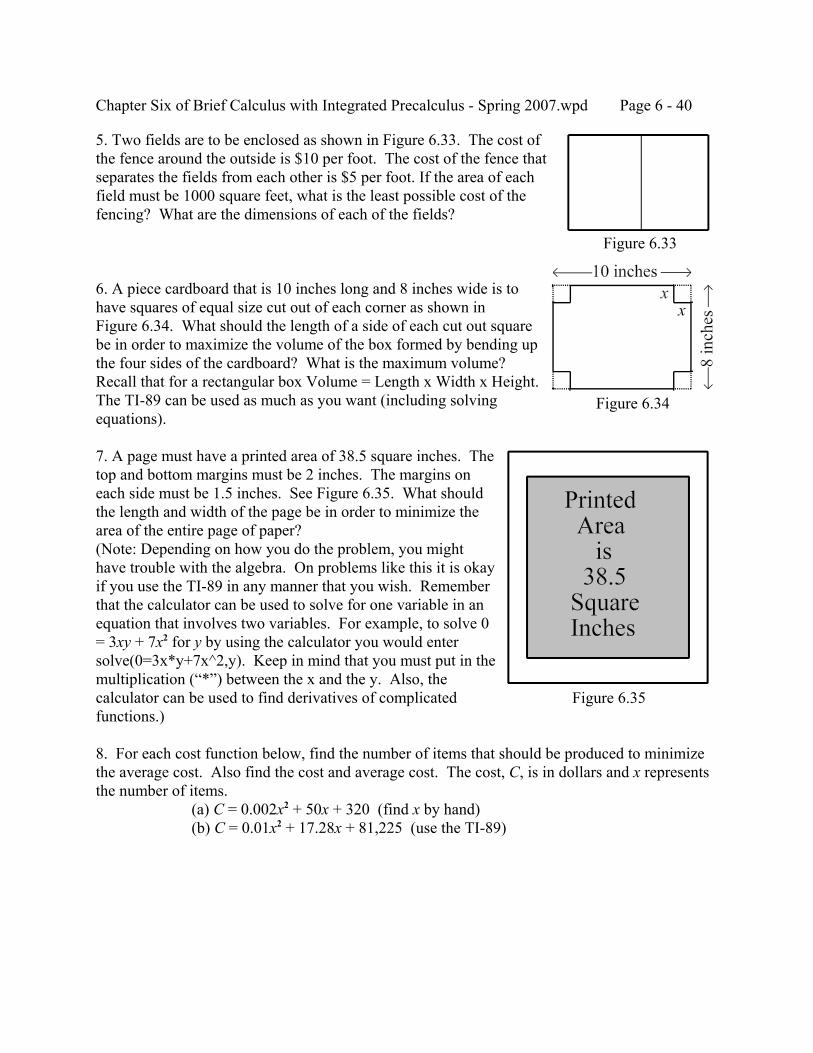
Chapter Six of Brief Calculus with Integrated Precalculus - Spring 2007.wpd Page 6 - 40
Figure 6.33
Figure 6.34
Figure 6.35
5. Two fields are to be enclosed as shown in Figure 6.33. The cost ofthe fence around the outside is $10 per foot. The cost of the fence thatseparates the fields from each other is $5 per foot. If the area of eachfield must be 1000 square feet, what is the least possible cost of thefencing? What are the dimensions of each of the fields?
6. A piece cardboard that is 10 inches long and 8 inches wide is tohave squares of equal size cut out of each corner as shown inFigure 6.34. What should the length of a side of each cut out squarebe in order to maximize the volume of the box formed by bending upthe four sides of the cardboard? What is the maximum volume?Recall that for a rectangular box Volume = Length x Width x Height.The TI-89 can be used as much as you want (including solvingequations).
7. A page must have a printed area of 38.5 square inches. Thetop and bottom margins must be 2 inches. The margins oneach side must be 1.5 inches. See Figure 6.35. What shouldthe length and width of the page be in order to minimize thearea of the entire page of paper?(Note: Depending on how you do the problem, you mighthave trouble with the algebra. On problems like this it is okayif you use the TI-89 in any manner that you wish. Rememberthat the calculator can be used to solve for one variable in anequation that involves two variables. For example, to solve 0= 3xy + 7x2 for y by using the calculator you would entersolve(0=3x*y+7x^2,y). Keep in mind that you must put in themultiplication (“*”) between the x and the y. Also, thecalculator can be used to find derivatives of complicatedfunctions.)
8. For each cost function below, find the number of items that should be produced to minimizethe average cost. Also find the cost and average cost. The cost, C, is in dollars and x representsthe number of items.
(a) C = 0.002x2 + 50x + 320 (find x by hand)(b) C = 0.01x2 + 17.28x + 81,225 (use the TI-89)
Chapter Seven of Brief Calculus with Integrated Precalculus - Fall 2008.wpd Page 7 - 1
CHAPTER SEVENRADICALS AND PIECEWISE DEFINED FUNCTIONS
7.1 FUNCTIONS INVOLVING RADICALS
Recall that because 32 = 9, because 23 = 8, because 34 = 81,9 9 32= = 8 23 = 81 34 =etc. In the expression (the nth root of x) the value of n is called the root index and thexn
expression is referred to as a radical. Since by definition (and is exemplified( )x xn n=
above), the laws of exponents suggests . Remember that if( )( )x x x xn n n n n n
1 1 1
= ⇒ =
the root index n is even then is only defined for nonnegative numbers (e.g. isxn −4undefined) but that if the root index is odd, then is defined for all real numbers (e.g.xn
since (-2)3 = -8). In general, you should remember the following.− = −8 23
Fact 7.1: (x $ 0 for even n, all real numbers for odd n.)( )x x xmn n m mn= =
The denominator of the fraction is the root index; the numerator is the power.
In particular, for x $ 0.x x=12
Fact 7.2: The power rule and general power rule work for fractional exponents.
Example 7.1: Evaluate the following(a) 271/3 (b) 272/3 (c) 274/3 (d) 27-1/3 (e) 27-2/3(f) (-27)1/3 (g) (-27)-1/3 (h) 163/4 (i) (-16)1/4 (j) 16-1/4(k) 161/2 (l) 16-1/2 (m) 163/2 (n) 1005/2 (o) (-32)-3/5
Solution:
(a) (b) 27 27 3 3 2713 3 3= = = since ( )27 27 3 92
3 3 2 2= = =
(c) (d) ( )27 27 3 8143 3 4 4= = = 27
127
127
13
13
13 3
− = = =
(e) (f) ( )
271
271
27
13
19
23
23 3 2 2
− = = = = ( )− = − = −27 27 313 3
(g) (h) ( )( )
− =−
=−
=−
= −−271
27127
13
13
13
13 3 ( )16 16 2 83
4 4 3 3= = =
Chapter Seven of Brief Calculus with Integrated Precalculus - Fall 2008.wpd Page 7 - 2
(i) is undefined (j) ( )− = −16 1614 4 16
116
116
12
14
14 4
− = = =
(k) (l) 16 16 412 = = 16
116
116
14
12
12
− = = =
(m) (n) ( )16 16 4 6432
3 3= = = ( )100 100 10 100 00052
5 5= = = ,
(o) ( )
( )( ) ( )
− =−
=−
=−
= −−321
321
32
12
18
35
35 5 3 3
Example 7.2: Find the derivative of the following functions.
(a) (b) (c) f x x( ) = 3 yx
=6
f x x( ) = 23
(d) (e) (f) f x x( ) = +2 3 5 y x= −4 2 1 35 ( ) y x= −4 2 135
Solution:In order to find the derivative of the functions, they must all be converted to theirexponential form so that the power rule or general power rule can be used.
(a) f x x f x xx x
( ) ( ) ( )/ /= ⇒ ′ = = =−3 33
23
21 2 1
21 2
12
(b) The quotient rule can be used after converting the radical to its exponential form.However, since the numerator does not contain x, the following can be done instead.
yx
xdydx
x xx x
= = ⇒ = − = − =−
=−− − − −6
6 6 33 3
12
12
32
32
1 2 12
13
/ ( )
(c) f x x f x xx x
( ) ( )= ⇒ ′ = = =−23
13
13
23 3
23
23
(d) f x x( ) ( )= +2 3 5 12 ( )⇒ ′ = + =
+=
+−f x x
x x( ) ( ) ( )
( )2 3 5 3
33 5
33 5
12
12
12
(e) y x= −4 2 1 35( ) ( )⇒ = − =
−=
−−dy
dxx
x x4 2 1 2
245 2 1
245 2 1
35 5
25
25
( ) ( )( )
(f) ( )y xdydx
x xx
x= − ⇒ = − =
−−4 2 1 4 2 1 6
245 2 1
3 15
3 22
3 45
15
45( ) ( ) ( )
( )
Chapter Seven of Brief Calculus with Integrated Precalculus - Fall 2008.wpd Page 7 - 3
Example 7.3: If , find f O(1). What is the concavity of the functionf x x( ) = −8 6 2at x = 1?
Solution:
f x x f x x x( ) ( ) ( ) ( ) ( ) ( )= − ⇒ ′ = − − = − −− −8 6 2 4 6 2 2 8 6 212
12
12
⇒ ′′ = − − = − −− −f x x x( ) ( ) ( ) ( )4 6 2 2 8 6 232
32
⇒ ′′ = − − = − =−
=−
=−
= −− −f ( ) ( ( )) ( )( )
1 8 6 2 1 8 48
484
82
132
32
32 3 3
At x = 1 the function is concave down since the second derivative is negative.
Example 7.4: Find the equation of the line tangent to at (2, 6).y x x= −3 32
Solution:
The function is a product of 3x and . So the product rule must be used.x2 3−
y x xdydx
xddx
x xddx
x= − ⇒ = − + −3 3 3 3 3 32 2 212
12
12( ) ( ) ( )
( )⇒ = − + −−dydx
x x x x3 3 2 3 312
2 212
12( ) ( ) ( ) =
−+ −
33
3 32
22x
xx
So the slope at x = 2 is m =−
+ − = + =3 22 3
3 2 3121
3 1 152
22( )
( )
We want to find the equation of the straight line passing through (2, 6) with slope 15.y - 6 = 15(x - 2) = 15x - 30 Y y = 15x -24.
Example 7.5: The demand function for a product is given by , wherep x= −90 000 2,x represents the number of items produced and sold weekly and p is the price in dollars.(a) For what values of x is the demand function defined (i.e. what is its domain)?(b) Verify that the price decreases as the demand increases, as should be true of a demand function. (Remember that the number of items cannot be negative.)(c) If the weekly cost of producing x items is given by C = -0.01x2 + 25x + 20,000, find the marginal profit function (by hand).(d) Use the calculator to compute the marginal profit when 150 items are produced and when 250 items are produced. What do you conclude from this?(e) Use the calculator to determine what the maximum profit is and what production level produces it.
Solution: (a) You cannot take the square root of a negative number. So 90,000 - x2 $ 0 and hence
90,000 $ x2 Y -300 # x # 300 is the mathematical domain. Of course, since a negativenumber of items cannot be produced, the demand function is defined for 0 # x # 300.
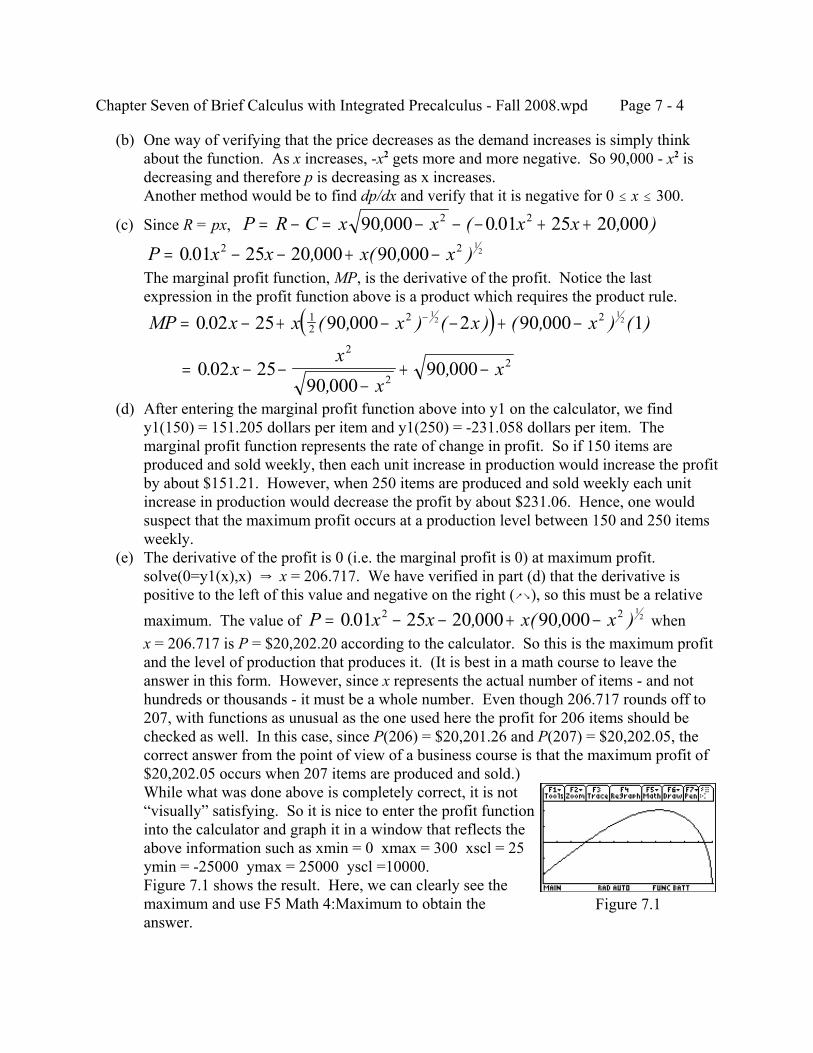
Chapter Seven of Brief Calculus with Integrated Precalculus - Fall 2008.wpd Page 7 - 4
Figure 7.1
(b) One way of verifying that the price decreases as the demand increases is simply thinkabout the function. As x increases, -x2 gets more and more negative. So 90,000 - x2 isdecreasing and therefore p is decreasing as x increases.Another method would be to find dp/dx and verify that it is negative for 0 # x # 300.
(c) Since R = px, P R C x x x x= − = − − − + +90 000 0 01 25 20 0002 2, ( . , )P x x x x= − − + −0 01 25 20 000 90 0002 2 1
2. , ( , )The marginal profit function, MP, is the derivative of the profit. Notice the lastexpression in the profit function above is a product which requires the product rule.
( )MP x x x x x= − + − − + −−0 02 25 90 000 2 90 000 112
2 212
12. ( , ) ( ) ( , ) ( )
= − −−
+ −0 02 2590 000
90 0002
22.
,,x
xx
x
(d) After entering the marginal profit function above into y1 on the calculator, we findy1(150) = 151.205 dollars per item and y1(250) = -231.058 dollars per item. Themarginal profit function represents the rate of change in profit. So if 150 items areproduced and sold weekly, then each unit increase in production would increase the profitby about $151.21. However, when 250 items are produced and sold weekly each unitincrease in production would decrease the profit by about $231.06. Hence, one wouldsuspect that the maximum profit occurs at a production level between 150 and 250 itemsweekly.
(e) The derivative of the profit is 0 (i.e. the marginal profit is 0) at maximum profit.solve(0=y1(x),x) Y x = 206.717. We have verified in part (d) that the derivative ispositive to the left of this value and negative on the right (_`), so this must be a relativemaximum. The value of whenP x x x x= − − + −0 01 25 20 000 90 0002 2 1
2. , ( , )x = 206.717 is P = $20,202.20 according to the calculator. So this is the maximum profitand the level of production that produces it. (It is best in a math course to leave theanswer in this form. However, since x represents the actual number of items - and nothundreds or thousands - it must be a whole number. Even though 206.717 rounds off to207, with functions as unusual as the one used here the profit for 206 items should bechecked as well. In this case, since P(206) = $20,201.26 and P(207) = $20,202.05, thecorrect answer from the point of view of a business course is that the maximum profit of$20,202.05 occurs when 207 items are produced and sold.)While what was done above is completely correct, it is not“visually” satisfying. So it is nice to enter the profit functioninto the calculator and graph it in a window that reflects theabove information such as xmin = 0 xmax = 300 xscl = 25ymin = -25000 ymax = 25000 yscl =10000.Figure 7.1 shows the result. Here, we can clearly see themaximum and use F5 Math 4:Maximum to obtain theanswer.
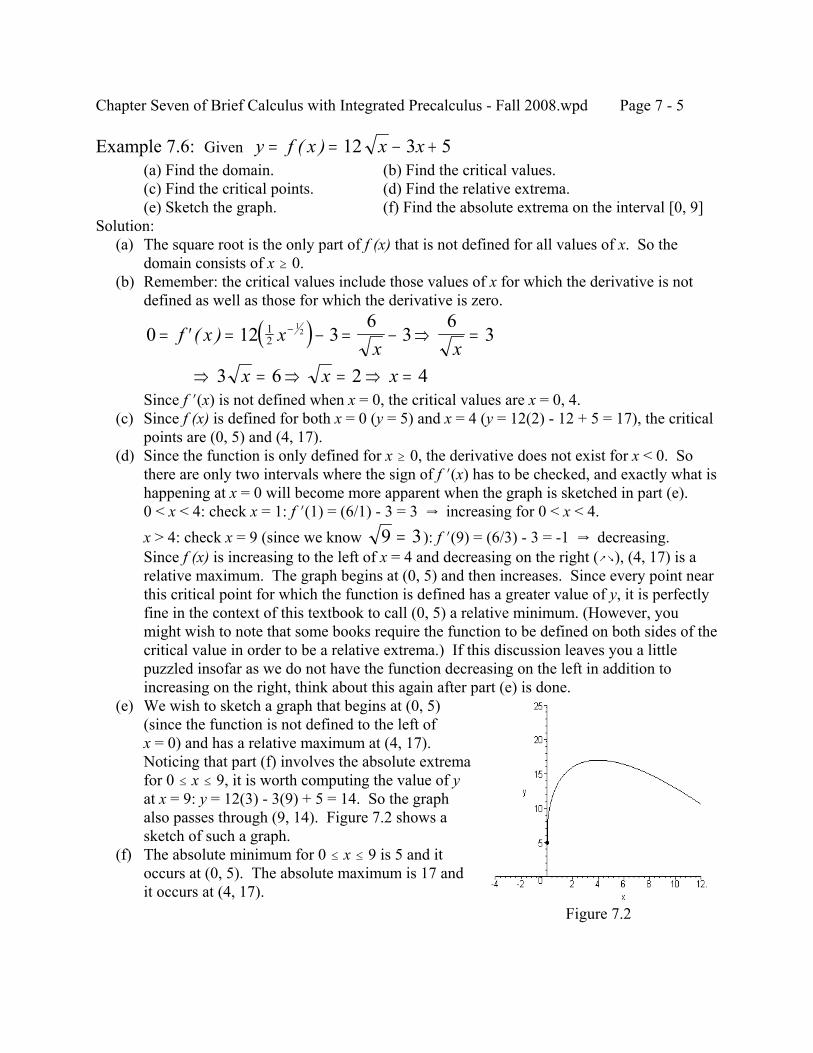
Chapter Seven of Brief Calculus with Integrated Precalculus - Fall 2008.wpd Page 7 - 5
Figure 7.2
Example 7.6: Given y f x x x= = − +( ) 12 3 5(a) Find the domain. (b) Find the critical values.(c) Find the critical points. (d) Find the relative extrema.(e) Sketch the graph. (f) Find the absolute extrema on the interval [0, 9]
Solution: (a) The square root is the only part of f (x) that is not defined for all values of x. So the
domain consists of x $ 0. (b) Remember: the critical values include those values of x for which the derivative is not
defined as well as those for which the derivative is zero.
( )0 12 36
36
312
12= ′ = − = − ⇒ =−f x x
x x( )
⇒ = ⇒ = ⇒ =3 6 2 4x x xSince f N(x) is not defined when x = 0, the critical values are x = 0, 4.
(c) Since f (x) is defined for both x = 0 (y = 5) and x = 4 (y = 12(2) - 12 + 5 = 17), the criticalpoints are (0, 5) and (4, 17).
(d) Since the function is only defined for x $ 0, the derivative does not exist for x < 0. Sothere are only two intervals where the sign of f N(x) has to be checked, and exactly what ishappening at x = 0 will become more apparent when the graph is sketched in part (e).0 < x < 4: check x = 1: f N(1) = (6/1) - 3 = 3 Y increasing for 0 < x < 4.x > 4: check x = 9 (since we know ): f N(9) = (6/3) - 3 = -1 Y decreasing.9 3=Since f (x) is increasing to the left of x = 4 and decreasing on the right (_`), (4, 17) is arelative maximum. The graph begins at (0, 5) and then increases. Since every point nearthis critical point for which the function is defined has a greater value of y, it is perfectlyfine in the context of this textbook to call (0, 5) a relative minimum. (However, youmight wish to note that some books require the function to be defined on both sides of thecritical value in order to be a relative extrema.) If this discussion leaves you a littlepuzzled insofar as we do not have the function decreasing on the left in addition toincreasing on the right, think about this again after part (e) is done.
(e) We wish to sketch a graph that begins at (0, 5)(since the function is not defined to the left ofx = 0) and has a relative maximum at (4, 17). Noticing that part (f) involves the absolute extremafor 0 # x # 9, it is worth computing the value of yat x = 9: y = 12(3) - 3(9) + 5 = 14. So the graphalso passes through (9, 14). Figure 7.2 shows asketch of such a graph.
(f) The absolute minimum for 0 # x # 9 is 5 and itoccurs at (0, 5). The absolute maximum is 17 andit occurs at (4, 17).
Chapter Seven of Brief Calculus with Integrated Precalculus - Fall 2008.wpd Page 7 - 6
Exercise Set 7.1
1. Evaluate the following:(a) 641/2 (b) 641/3 (c) 641/6 (d) 645/6 (e) 64-1/2(f) 64-2/3 (g) (-64)1/2 (h) (-64)1/3 (i) (-64)-1/3 (j) (-64)-5/6(k) 91/2 (l) (-9)1/2 (m) 93/2(n) 9-1/2 (o) 323/5(p) (-32)1/5 (q) 32-6/5 (r) 36-1/2 (s) 253/2 (t) 81-3/4
2. Find the derivative of the following functions.
(a) (b) (c) f x x( ) = 53 y x= 10 35 f x x( ) = 6
(d) (e) (f) f xx
( ) =8
y x= +4 5 73 y x= −3 4 1 54 ( )
(g) (h) (i) y x= −3 4 154 f x x( ) ( )= +7 4 5 3 y x= +7 4 53
(j) f xx
( ) =−
83 4
3. For each function below: (a) Find the equation of the tangent line at x = 2.(b) Find f O(2) and the concavity at x = 2.
(i) (ii) y x= 3 8 f x x( ) = −5 1
4. Find the slope of the line tangent to the graph of each function below at x = 3.
(a) (b) y x x= +2 5 10 f xxx
( ) =+−
2 33 8
5. If x items are produced and sold daily, the daily profit is dollars.P x x x= − −15 200What is the profit and marginal profit when (a) 81 items are sold daily? (b) 144?(c) What is the maximum profit and the number of items that produces it?What is the maximum profit if no more than (d) 81 items can be made daily? (e) 144?
(You may use the calculator for arithmetic only - but it can be done by hand.)
6. Suppose the demand function is and the cost function isp x= −10 000,C = 20x + 50,000, where x represents the number if items produced and sold monthly and theprice and cost are in dollars. (You may use the TI-89 for all parts of this problem.)
(a) What is the domain of the demand function?(b) Find dp/dx and use it to verify the price decreases for increasing demand.(c) Find the revenue, cost, profit, marginal revenue, marginal cost and marginal profit when 5000 items are produced and sold monthly.(d) Find the maximum profit and the production level at which it occurs.
Chapter Seven of Brief Calculus with Integrated Precalculus - Fall 2008.wpd Page 7 - 7
7. Given y f x x x= = − −( ) 2 8 3(a) Find the domain. (b) Find the critical values.(c) Find the critical points. (d) Find the relative extrema.(e) Sketch the graph. (f) Find the absolute extrema on the interval [0, 28]
7.2 PIECEWISE DEFINED FUNCTIONS
Definition: The absolute value of x, |x|, is the value of x expressed as a nonnegative number.
If x is already a nonnegative number, then |x| is the same as x, that is, *7* is the same as 7. However, if x is a negative number, then multiplying it by -1 changes its sign and makes it apositive number. So, if x is a negative number, then |x| = -x, that is *-7* = -(-7) = 7.Therefore, another way of writing the absolute value function is the
Piecewise definition of absolute value: xx for x
x for x=− <
≥
00
This symbolism means that if x is less than 0 (negative), then |x| = -x. However, if x is greaterthan or equal to 0 (nonnegative), then |x| = x. Defined in this way the absolute value function isseen to be a piecewise defined function. It is defined to be one function (-x) for one “piece” ofthe x-axis (x < 0), but it is defined to be a different function (x) for a different “piece” of the axis(x $ 0).
Example 7.7: Given , find the following limits:f xxx
( )| |
=−−
22
.Lim f x Lim f x Lim f x Lim f x Lim f x and Lim f xx x x x x x→ → → → → →+ − + −0 0 0 2 2 2
( ), ( ), ( ), ( ), ( ) ( )
Then graph the function.
Numerical Solution: The following table shows the values of f(x) close to 0 on both sides:
x -0.1 -0.01 -0.001 0 0.001 0.01 0.1f(x) -1 -1 -1 -1 -1 -1 -1
Therefore Lim f x Lim f x Lim f xx x x→ → →+ −
= = = −0 0 0
1( ) ( ) ( )
The next table shows the values of f(x) close to 2 on both sides:x 1.9 1.99 1.999 2 2.001 2.01 2.1
f (x) -1 -1 -1 undefined 1 1 1
Therefore , and does not exist.Lim f xx→ −
= −2
1( ) Lim f xx→ +
=2
1( ) Lim f xx→2
( )
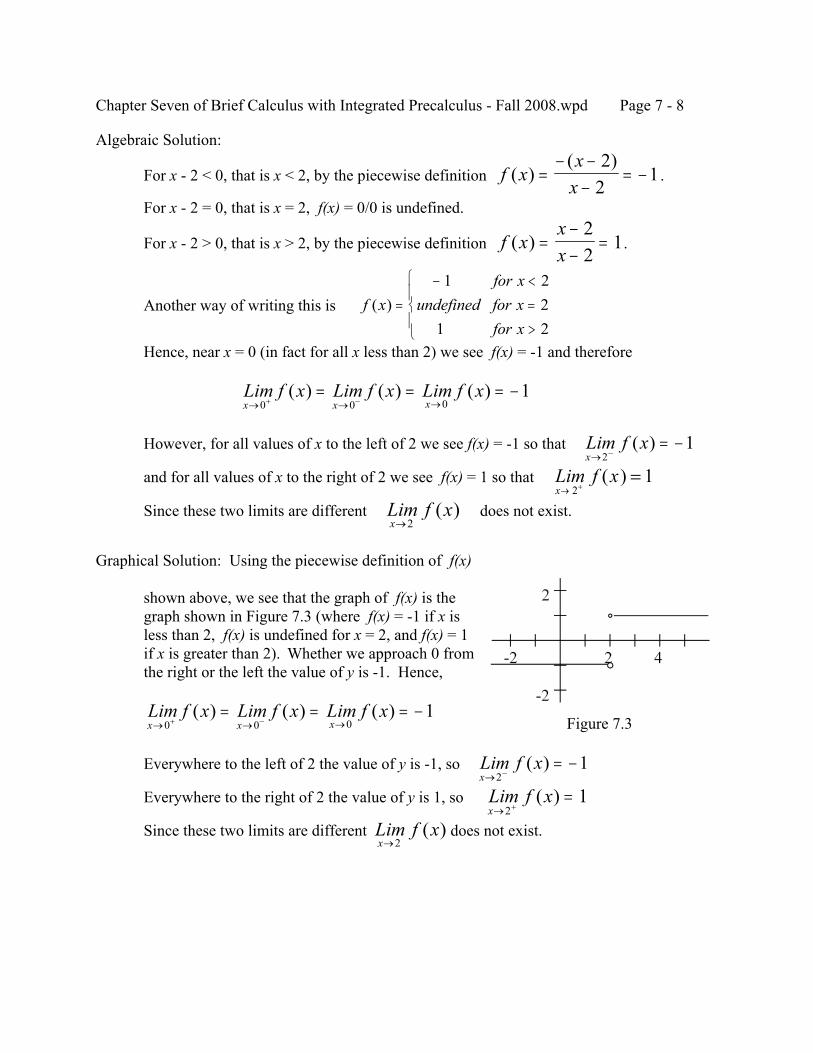
Chapter Seven of Brief Calculus with Integrated Precalculus - Fall 2008.wpd Page 7 - 8
Figure 7.3
Algebraic Solution:
For x - 2 < 0, that is x < 2, by the piecewise definition .f xx
x( )
( )=
− −−
= −2
21
For x - 2 = 0, that is x = 2, f(x) = 0/0 is undefined.
For x - 2 > 0, that is x > 2, by the piecewise definition .f xxx
( ) =−−
=22
1
Another way of writing this is f xfor x
undefined for xfor x
( ) =− <
=>
1 22
1 2Hence, near x = 0 (in fact for all x less than 2) we see f(x) = -1 and therefore
Lim f x Lim f x Lim f xx x x→ → →+ −
= = = −0 0 0
1( ) ( ) ( )
However, for all values of x to the left of 2 we see f(x) = -1 so that Lim f xx→ −
= −2
1( )
and for all values of x to the right of 2 we see f(x) = 1 so that Lim f xx→ +
=2
1( )
Since these two limits are different does not exist.Lim f xx→2
( )
Graphical Solution: Using the piecewise definition of f(x)
shown above, we see that the graph of f(x) is thegraph shown in Figure 7.3 (where f(x) = -1 if x isless than 2, f(x) is undefined for x = 2, and f(x) = 1if x is greater than 2). Whether we approach 0 fromthe right or the left the value of y is -1. Hence,
Lim f x Lim f x Lim f xx x x→ → →+ −
= = = −0 0 0
1( ) ( ) ( )
Everywhere to the left of 2 the value of y is -1, so Lim f xx→ −
= −2
1( )
Everywhere to the right of 2 the value of y is 1, so Lim f xx→ +
=2
1( )
Since these two limits are different does not exist.Lim f xx→2
( )
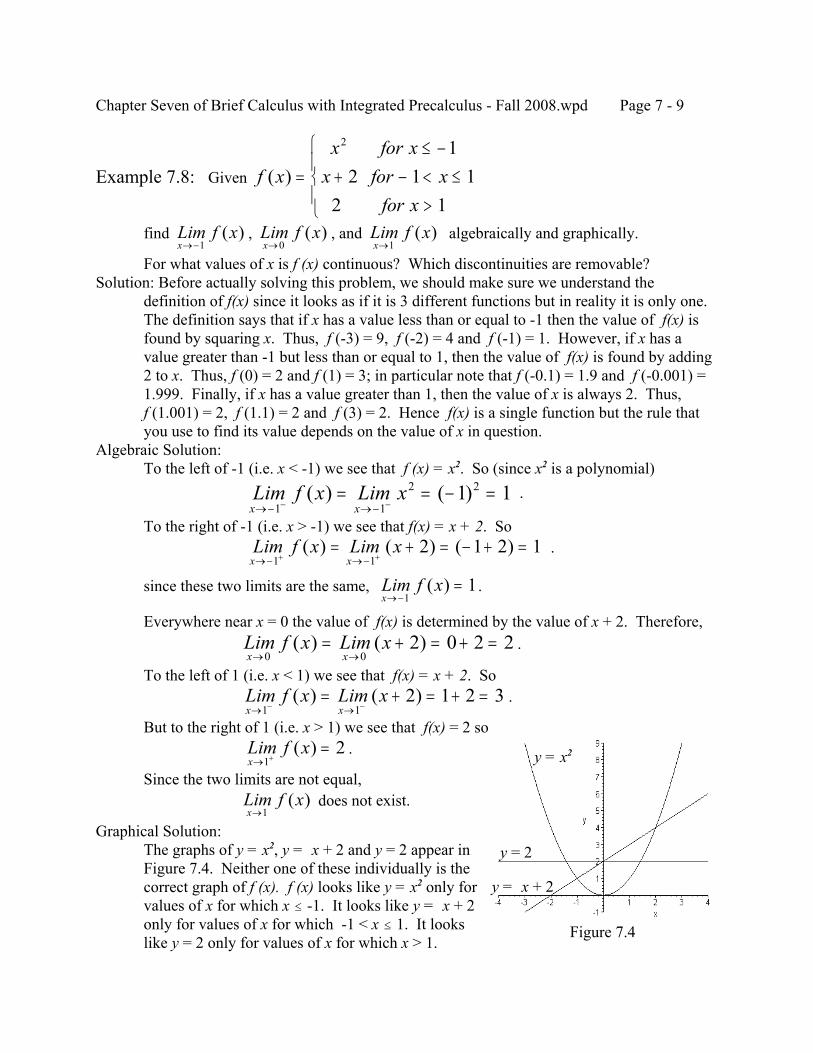
Chapter Seven of Brief Calculus with Integrated Precalculus - Fall 2008.wpd Page 7 - 9
Figure 7.4
Example 7.8: Given f xx for x
x for xfor x
( ) =≤ −
+ − < ≤>
2 12 1 1
2 1find , , and algebraically and graphically.Lim f x
x→−1( ) Lim f x
x→0( ) Lim f x
x→1( )
For what values of x is f (x) continuous? Which discontinuities are removable?Solution: Before actually solving this problem, we should make sure we understand the
definition of f(x) since it looks as if it is 3 different functions but in reality it is only one. The definition says that if x has a value less than or equal to -1 then the value of f(x) isfound by squaring x. Thus, f (-3) = 9, f (-2) = 4 and f (-1) = 1. However, if x has avalue greater than -1 but less than or equal to 1, then the value of f(x) is found by adding2 to x. Thus, f (0) = 2 and f (1) = 3; in particular note that f (-0.1) = 1.9 and f (-0.001) =1.999. Finally, if x has a value greater than 1, then the value of x is always 2. Thus,f (1.001) = 2, f (1.1) = 2 and f (3) = 2. Hence f(x) is a single function but the rule thatyou use to find its value depends on the value of x in question.
Algebraic Solution:To the left of -1 (i.e. x < -1) we see that f (x) = x2. So (since x2 is a polynomial)
. Lim f x Lim xx x→− →−− −
= = − =1 1
2 21 1( ) ( )To the right of -1 (i.e. x > -1) we see that f(x) = x + 2. So
. Lim f x Lim xx x→− →−+ +
= + = − + =1 1
2 1 2 1( ) ( ) ( )
since these two limits are the same, . Lim f xx→−
=1
1( )
Everywhere near x = 0 the value of f(x) is determined by the value of x + 2. Therefore,.Lim f x Lim x
x x→ →= + = + =
0 02 0 2 2( ) ( )
To the left of 1 (i.e. x < 1) we see that f(x) = x + 2. So.Lim f x Lim x
x x→ →− −= + = + =
1 12 1 2 3( ) ( )
But to the right of 1 (i.e. x > 1) we see that f(x) = 2 so .Lim f x
x→ +=
12( )
Since the two limits are not equal, does not exist.Lim f x
x→1( )
Graphical Solution:The graphs of y = x2, y = x + 2 and y = 2 appear inFigure 7.4. Neither one of these individually is thecorrect graph of f (x). f (x) looks like y = x2 only forvalues of x for which x # -1. It looks like y = x + 2only for values of x for which -1 < x # 1. It lookslike y = 2 only for values of x for which x > 1.
y = x2
y = x + 2
y = 2
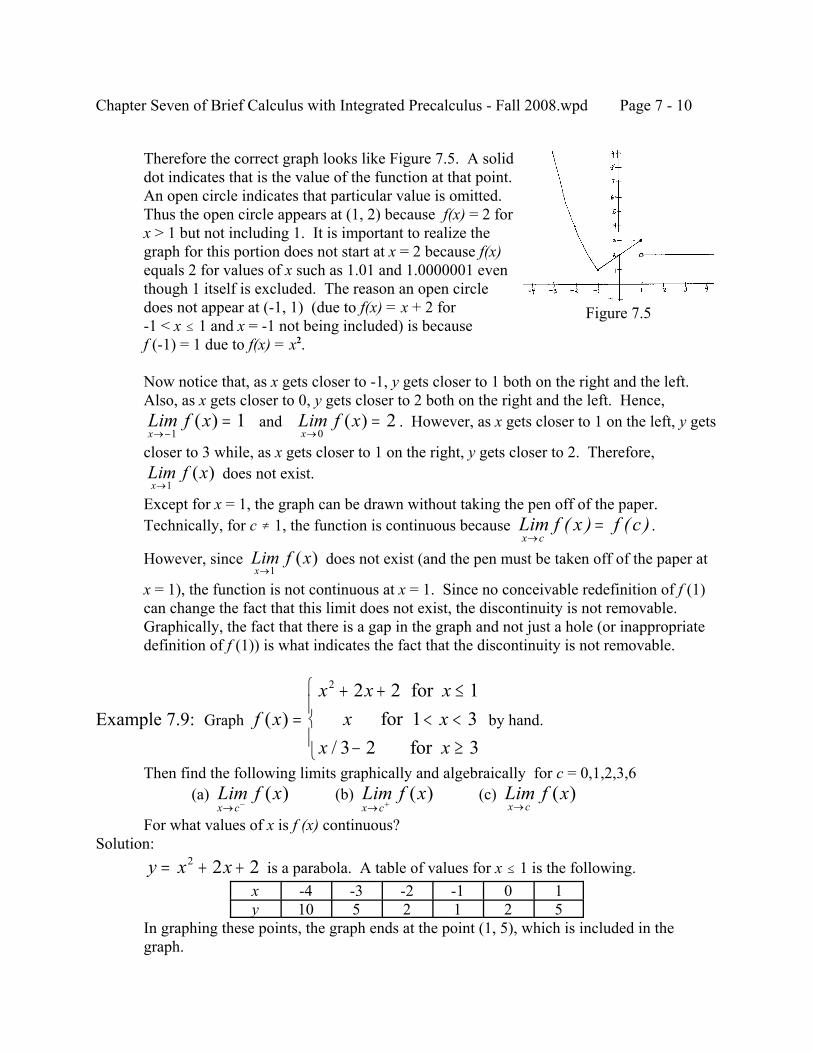
Chapter Seven of Brief Calculus with Integrated Precalculus - Fall 2008.wpd Page 7 - 10
Figure 7.5
Therefore the correct graph looks like Figure 7.5. A soliddot indicates that is the value of the function at that point. An open circle indicates that particular value is omitted. Thus the open circle appears at (1, 2) because f(x) = 2 forx > 1 but not including 1. It is important to realize thegraph for this portion does not start at x = 2 because f(x)equals 2 for values of x such as 1.01 and 1.0000001 eventhough 1 itself is excluded. The reason an open circledoes not appear at (-1, 1) (due to f(x) = x + 2 for-1 < x # 1 and x = -1 not being included) is becausef (-1) = 1 due to f(x) = x2.
Now notice that, as x gets closer to -1, y gets closer to 1 both on the right and the left.Also, as x gets closer to 0, y gets closer to 2 both on the right and the left. Hence,
and . However, as x gets closer to 1 on the left, y getsLim f xx→−
=1
1( ) Lim f xx→
=0
2( )
closer to 3 while, as x gets closer to 1 on the right, y gets closer to 2. Therefore, does not exist.Lim f x
x→1( )
Except for x = 1, the graph can be drawn without taking the pen off of the paper. Technically, for c … 1, the function is continuous because . Lim f x f c
x c→=( ) ( )
However, since does not exist (and the pen must be taken off of the paper atLim f xx→1
( )
x = 1), the function is not continuous at x = 1. Since no conceivable redefinition of f (1)can change the fact that this limit does not exist, the discontinuity is not removable. Graphically, the fact that there is a gap in the graph and not just a hole (or inappropriatedefinition of f (1)) is what indicates the fact that the discontinuity is not removable.
Example 7.9: Graph by hand.f xx x x
x xx x
( )/
=+ + ≤
< <− ≥
2 2 2 11 3
3 2 3
for for
for Then find the following limits graphically and algebraically for c = 0,1,2,3,6
(a) (b) (c) Lim f xx c→ −
( ) Lim f xx c→ +
( ) Lim f xx c→
( )For what values of x is f (x) continuous?
Solution: is a parabola. A table of values for x # 1 is the following.y x x= + +2 2 2
x -4 -3 -2 -1 0 1y 10 5 2 1 2 5
In graphing these points, the graph ends at the point (1, 5), which is included in thegraph.
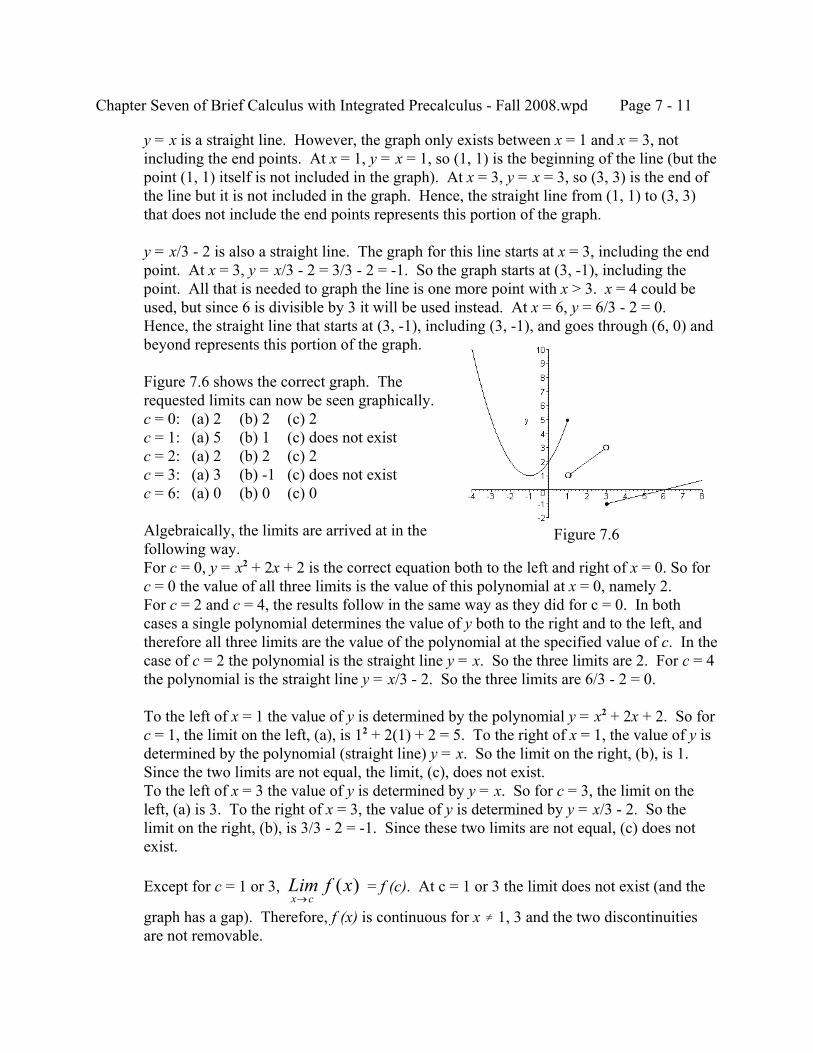
Chapter Seven of Brief Calculus with Integrated Precalculus - Fall 2008.wpd Page 7 - 11
Figure 7.6
y = x is a straight line. However, the graph only exists between x = 1 and x = 3, notincluding the end points. At x = 1, y = x = 1, so (1, 1) is the beginning of the line (but thepoint (1, 1) itself is not included in the graph). At x = 3, y = x = 3, so (3, 3) is the end ofthe line but it is not included in the graph. Hence, the straight line from (1, 1) to (3, 3)that does not include the end points represents this portion of the graph.
y = x/3 - 2 is also a straight line. The graph for this line starts at x = 3, including the endpoint. At x = 3, y = x/3 - 2 = 3/3 - 2 = -1. So the graph starts at (3, -1), including thepoint. All that is needed to graph the line is one more point with x > 3. x = 4 could beused, but since 6 is divisible by 3 it will be used instead. At x = 6, y = 6/3 - 2 = 0. Hence, the straight line that starts at (3, -1), including (3, -1), and goes through (6, 0) andbeyond represents this portion of the graph.
Figure 7.6 shows the correct graph. Therequested limits can now be seen graphically.c = 0: (a) 2 (b) 2 (c) 2c = 1: (a) 5 (b) 1 (c) does not existc = 2: (a) 2 (b) 2 (c) 2c = 3: (a) 3 (b) -1 (c) does not existc = 6: (a) 0 (b) 0 (c) 0
Algebraically, the limits are arrived at in thefollowing way.For c = 0, y = x2 + 2x + 2 is the correct equation both to the left and right of x = 0. So forc = 0 the value of all three limits is the value of this polynomial at x = 0, namely 2.For c = 2 and c = 4, the results follow in the same way as they did for c = 0. In bothcases a single polynomial determines the value of y both to the right and to the left, andtherefore all three limits are the value of the polynomial at the specified value of c. In thecase of c = 2 the polynomial is the straight line y = x. So the three limits are 2. For c = 4the polynomial is the straight line y = x/3 - 2. So the three limits are 6/3 - 2 = 0.
To the left of x = 1 the value of y is determined by the polynomial y = x2 + 2x + 2. So forc = 1, the limit on the left, (a), is 12 + 2(1) + 2 = 5. To the right of x = 1, the value of y isdetermined by the polynomial (straight line) y = x. So the limit on the right, (b), is 1. Since the two limits are not equal, the limit, (c), does not exist.To the left of x = 3 the value of y is determined by y = x. So for c = 3, the limit on theleft, (a) is 3. To the right of x = 3, the value of y is determined by y = x/3 - 2. So thelimit on the right, (b), is 3/3 - 2 = -1. Since these two limits are not equal, (c) does notexist.
Except for c = 1 or 3, = f (c). At c = 1 or 3 the limit does not exist (and theLim f xx c→
( )graph has a gap). Therefore, f (x) is continuous for x … 1, 3 and the two discontinuitiesare not removable.
Chapter Seven of Brief Calculus with Integrated Precalculus - Fall 2008.wpd Page 7 - 12
Exercise Set 7.2
1 to 3. The TI-89 has the absolute value function available for use. It is abs(....) and can beentered in two ways. You can enter it directly on the command (entry) line (press the alpha andthen = keys for “a”, etc.) or press the catalog key followed by the = key (for “a” if necessary toselect abs) and then ENTER. Graph each of the following functions on the TI-89 and find
(a) (b) (c) Lim f xx→ −0
( ) Lim f xx→ +0
( ) Lim f xx→0
( )For what values of x is the function continuous? Are the discontinuities removable?
1. 2. 3. f x x( ) = 5 f xxx
( ) =5
f xx
x( ) =
52
4. Find the three limits for exercise 2 above numerically without using the graph. You may useyour calculator to do the arithmetic.
5. Find the three limits for exercise 3 above numerically without using the graph. You may useyour calculator to do the arithmetic.
6. Given Without using the TI-89f xx x
x( ) =+ ≤
>
1 11
for 4 for
Find (a) f (0) (b) f (1) (c) f (2)
Find (d) (e) (f) Lim f xx→ −0
( ) Lim f xx→ +0
( ) Lim f xx→0
( )
(g) (h) (i) Lim f xx→ −1
( ) Lim f xx→ +1
( ) Lim f xx→1
( )
(j) (k) (l) Lim f xx→ −2
( ) Lim f xx→ +2
( ) Lim f xx→2
( )
(m) Graph the function by hand and verify visually the limits that you found.(n) For what values of x is the function continuous? Are the discontinuities removable?
7. Repeat exercise 6 using the function f xx x
xx x
( ) =<≤ <≥
2 03 0 2
2
for for for
Chapter Seven of Brief Calculus with Integrated Precalculus - Fall 2008.wpd Page 7 - 13
7.3 IMPLICIT DIFFERENTIATION
Before proceeding further, remember when the chain rule was discussed that there are timeswhen we must pay attention to what we are differentiating with respect to. For example,
because the variable in 5y3 is y and we are differentiating with respect to y, butddy
y y5 153 2=
because the variable in 5y3 is y and, since we are differentiating with respectddx
y ydydx
5 153 2=
to x and not y, the general power rule (chain rule) is used.
Example 7.10: Consider the equation 21x + 7y = 14. (a) Find dy/dx by first solving for y and then taking the derivative. This is called explicit
differentiation. (b) Take the derivative with respect to x of both sides of the equation and then solve for
dy/dx. This is called implicit differentiation.Solution: (a) 21x + 7y = 14 Y 7y = 14 - 21x Y y = 2 - 3x Y dy/dx = -3.
(b) .ddx
x yddx
dydx
dydx
dydx
( )21 7 14 21 7 0 7 21 3+ = ⇒ + = ⇒ = − ⇒ = −
Example 7.11: Given xy = 8, find dy/dx and the equation of the tangent line at (2, 4) byusing (a) explicit differentiation and (b) implicit differentiation.
Solution:
(a) For explicit differentiation we first solve the equation for y: . Then we find theyx
=8
derivative with respect to x: . So the slope of thedydx
ddx
x xx
= = − =−− −8 8
81 22
tangent at (2, 4) is m = -8/22 = -8/4 = -2. Therefore, for the tangent line,y - 4 = -2(x - 2) = -2x + 4 Y y = -2x + 8.
(b) For implicit differentiation we simply take the derivative of both sides of the equation asis. However, something must be noticed that is often overlooked by people seeing thisfor the first time. The expression xy is a product of x times y. For that reason, theproduct rule must be used when finding the derivative with respect to x since y isunderstood to be a function of x. Therefore,ddx
xyddx
xddx
y yddx
x xdydx
y xdydx
ydydx
yx
= ⇒ + = ⇒ + = ⇒ = − ⇒ =−
8 0 1 0( )
So the slope of the tangent at (2, 4) is m = - 4/2 = -2 and the equation is found in the sameway as it was found in part (a).
Chapter Seven of Brief Calculus with Integrated Precalculus - Fall 2008.wpd Page 7 - 14
Remark: Superficially the derivative found in part (b) of the last example looks different fromthe derivative found in part (a). However, notice that both produce the same slope at
x = 2 and, since , . So the derivatives are the same.yx
=8 dy
dxy
x x x x=
−=
−⋅ =
−1 8 82
Example 7.12: Use implicit differentiation to find dy/dx for the following equations.(a) x2 - y3 = 7 (b) 3xy - 5x2 = 4x (c) 2x2 + 5xy - y3 = 9
Solution: (a) Since the derivative of y3 is with respect to x, the general power rule is needed.
ddx
x yddx
x ydydx
ydydx
xdydx
xy
( )2 3 2 227 2 3 0 3 2
23
− = ⇒ − = ⇒ = ⇒ =
(b) Since 3xy is a product, the product rule is needed.
3 3 10 4 3 3 10 4xddx
y yddx
x x xdydx
y x+ − = ⇒ + − =
Since we are solving for dy/dx, we next get all terms not involving dy/dx on the right sideand all terms containing dy/dx on the left side.
3 4 10 34 10 3
3x
dydx
x ydydx
x yx
= + − ⇒ =+ −
(c) The 5xy term requires the product rule and the y3 term requires the general power rule.
4 5 5 3 02x xdydx
y ydydx
+ + − =( ) ⇒ − = − −5 3 4 52xdydx
ydydx
x y
It is now time to remember that, when solving 5x - 3x = 7 by writing this as 2x = 7, whatwe are really saying is that 5x - 3x = (5 - 3)x = 2x and that we really only want to see xappear once. In order to make x appear only once, we factor it out of the expression. With this reminder, we remember that, since we are solving for dy/dx (and not x or y), weproceed by factoring the dy/dx out of the expression on the left side.
( )5 3 4 54 5
5 32
2x ydydx
x ydydx
x yx y
− = − − ⇒ =− −
−The above expression for dy/dx is a perfectly acceptable answer. However, sometimesthe correct answer must be picked out of a list of answers (such as on a multiple choiceexam). So it is worth remembering in any case that you can change the sign of all termsin the numerator and denominator of a fraction without changing its value. Thus, forexample, . Hence, since -5x + 3y2 is the same as 3y2 - 5x, an−
− −−= =2
323
57
57 and
alternative answer is .dydx
x yy x
=+−
4 53 52
Chapter Seven of Brief Calculus with Integrated Precalculus - Fall 2008.wpd Page 7 - 15
Example 7.13: Find the slope of the tangent line to 3x2y3 + 2y = y2 - 5x + 19 at (-1, 2).Solution:
We cannot find the derivative for the above equation explicitly even if we wanted to. Even using the TI-89 and asking it to solve the above equation for y only producesanother form of the equation. So we must use implicit differentiation. In any case, wewant to find the slope by hand.
3 3 6 2 2 52 2 3x ydydx
y xdydx
ydydx
+ + = −( )
At this point we could go through the complicated process of solving for dy/dx and riskmaking a mistake. But, since we only want to know the value of dy/dx (slope of thetangent) at (-1, 2), it is easier to just substitute into the equation x = -1 and y = 2.
3 1 3 2 2 6 1 2 2 2 52 2 3( ) ( )( ) ( ) ( )( ) ( )− + − + = −dydx
dydx
dydx
So is the slope.36 48 2 4 5 34 434334
dydx
dydx
dydx
dydx
dydx
− + = − ⇒ = ⇒ =
Exercise Set 7.3
1 to 3. For each of the following equations find dy/dx by using:(a) Explicit differentiation. (b) Implicit differentiation.
1. 4x + 2y = 14 2. 4x3 - 3y = 2 3. 3xy + 2 = x3
4 to 8. For each of the following equations find dy/dx by implicit differentiation.4. 3x2 - 4y2 = 7 5. 2x3 + y3 = 2x 6. x2 + 4xy = 77. x3 - 2xy + 5y2 = 8 8. x + 3x2y - 7y = 2x
9. Find the equation of the line tangent to x2y3 = 108 at (2, 3).
10. Find the slope of the line tangent to x3 + 5x2y2 - 8y = 2x + 32 at (2, -1).
Chapter Seven of Brief Calculus with Integrated Precalculus - Fall 2008.wpd Page 7 - 16
7.4 RELATED RATES
Example 7.14: If x represents the number of items that are produced and sold each month,
the demand function is , where p is the price in dollars, and the costp x= −100function is C = 40x +100,000, where C is the cost in dollars.(a) If the number of items produced and sold each month is increasing at the rate of 10 items per month, at what rate per month is the profit changing when 400 items are being produced monthly?(b) If the profit is increasing at the rate of $225 per month and the number of items produced monthly is increasing at the rate of 10 items per month, how many items are being produced monthly?(c) If the profit is increasing at the rate of $900 per month and the current production level is 100 items, at what rate is the production level increasing per month?
Solution:This is an example where the instinct to find the profit function and then take thederivative with respect to x is incorrect. Doing so replaces thinking with mechanicalcomputation. Look closely. There is something new here. The variable x represents thenumber of items and the problem does not ask “at what rate per (additional) item is theprofit changing?” However, the problem does inquire concerning a rate of change andtherefore a derivative. Notice the phrase “rate per month.” Month is a unit of time andthis means the question involves the rate of change with respect to time. None of thevariables mentioned in the original problem represent time. So we have to make up anew variable, t, that represents the time in months.
(a) The fact that the number of items produced, x, is increasing at the rate of 10 items permonth (i.e with respect to time, t), is telling us that dx/dt = 10. We are also told that thecurrent production level is x = 400 items. When the problem asks at what rate per monththe profit is changing, it is telling us to find the rate of change in profit with respect totime, dP/dt. So we need to find the profit function first.Since ,R px x x x xx x x= = − = − = −( )100 100 1001
23
2
.P R C x x x= − = − − +( ) ( , )100 40 100 00032 = − −60 100 0003
2x x ,We are looking for dP/dt, we now take the derivative with respect to t,
, and then substitute the given information:dPdt
dxdt
xdxdt
= −6032
12
dollars per month.dPdt
= − = − =60 10 400 10 600 20 10 30032
32( ) ( )( ) ( )( )
(b) In this part of the problem we are told that dP/dt = 225 and dx/dt = 10. We are asked tofind x. Once again, we substitute the given information in dP/dt above.
items.225 60 10 10 15 37532= − ⇒ =( ) ( )( )x x ⇒ = ⇒ =x x25 625
Chapter Seven of Brief Calculus with Integrated Precalculus - Fall 2008.wpd Page 7 - 17
(c) We are now told that dP/dt = 900 and x = 100 and asked to find dx/dt, sodPdt
dxdt
xdxdt
= −6032
12 ⇒ = −900 60
32
100dxdt
dxdt
( )
items per month.⇒ = − = ⇒ =900 60 15 45 20dxdt
dxdt
dxdt
dxdt
Mastering the mechanical operations of mathematics is easy to do. Somewhat harder iscontinually practicing them so that they are not forgotten. But this is simply a matter of memoryat which some people have to work harder. One of the most important parts is easily overlooked. If you do not know when to use a particular technique, you can easily do the wrong thing andend up with a result that is totally erroneous. The procedure for handling a problem like theprevious one is relatively straightforward for a lot of problems. But first you must be able torecognize the problem type.
Identifying a Related Rate Problem: A problem that involves a rate of change per unit oftime is a related rate problem (unless it involves velocity or acceleration).
Solving a Related Rate Problem:1. Find an equation that connects the variables.2. Take d/dt of both sides.3. Substitute and solve. (Some extra work is involved in harder problems.)
Before solving some additional related rate problems, the second step mentioned above will beillustrated in the next two examples.
Example 7.15: If x2 + y2 = 2x, find the value of y when x = 7, dx/dt = 5 and dy/dt = -3.Solution:
Notice that the derivatives are with respect to t. That is the clue that we should take thederivative with respect to t on both sides of the equation given.
-6y = -60 Y y = 10.2 2 2 2 7 5 2 3 2 5xdxdt
ydydt
dxdt
y+ = ⇒ + − = ⇒( )( ) ( ) ( )
Example 7.16: Let x3y2 = - 4.(a) Find dx/dt when x = -1, y = 2 and dy/dt = 12.(b) Find dy/dt when x = 2, y = -3 and dx/dt = 20.
Solution: Since the derivative is with respect to t,
x ydydt
y xdxdt
x ydydt
x ydxdt
3 2 2 3 2 22 3 0 2 3 0
+
= ⇒ + =
(a) 2(-1)3(2)(12) + 3(-1)2(2)2(dx/dt) = 0 Y - 48 + 12(dx/dt) = 0 Y dx/dt = 4. (b) 2(2)3(-3)(dy/dt) + 3(2)2(-3)2(20) = 0 Y - 48(dy/dt) + 2160 = 0 Y dy/dt = 45.
Chapter Seven of Brief Calculus with Integrated Precalculus - Fall 2008.wpd Page 7 - 18
Example 7.17: The sides of a square are expanding at the rate of 2 inches per minute.(a) Find how much the area changed during the minute when the sides went from 2 to 4 inches long.(b) Find the area change during the minute when the sides went from 4 to 6 inches long.(c) Is the area changing at a constant rate?(d) What is the (instantaneous) rate of change in area when the square has sides that are 4 inches long.
Solution: (a) Since the area of a square is found from A = s2, the area of a square whose side is 2 inches
long is A = 22 = 4 inch2. The area of a square with s = 4 inches is A = 42 = 16 inch2. Sothe area changed by 16 - 4 = 12 square inches in the minute.
(b) The change in area during the minute is 62 - 42 = 36 - 16 = 20 square inches. (c) No. If it were, the answers to parts (a) and (b) would be the same. (d) Notice that the first piece of information provided by the problem is a rate of change per
minute. So the rate of change is with respect to time, t, and therefore we are dealing witha related rate problem where we take d/dt of both sides of the equation A = s2. We thensubstitute the information provided: ds/dt = 2 inches per minute and s = 4 inches.
square inches per minute.dAdt
sdsdt
= = =2 2 4 2 16( )( )
Example 7.18: If the volume of a cube is increasing at the rate of 450 cubic inches perminute,
find the rate at which its sides are increasing when the length of a side is 10 inches.Solution:
Once again, the rate per minute indicates a derivative with respect to time, t. A cube is abox for which the length, width and height are all the same. Since the volume of a box isgiven by Volume = length x width x height, the volume of a cube is V = sss = s3, where sis the length of the side. In the problem we are told that dV/dt = 450 and s = 10. Thus,
=1.5 inches per minute.dVdt
sdsdt
dsdt
dsdt
= ⇒ = ⇒ = =3 450 3 10450300
32
2 2( )
Example 7.19: A kite is 90 feet high. There is already 150 string let out and the string isbeing
released at the rate of 4 feet per second. The wind is causing the kite to travelhorizontally parallel to the ground (that is, the kite is staying exactly 90 feet high whilethe string is being released). What is the horizontal speed of the kite?
Solution:While it is immediately evident that this is a related rate problem (indicated by the “persecond”), the first difficulty encountered is the fact that there is no obvious equation totake the derivative with respect to time on both sides. When this happens, the onlysensible thing to do is to draw a picture and see whether or not anything occurs to you.Figure 7.7 on the next page is an example of such a picture.
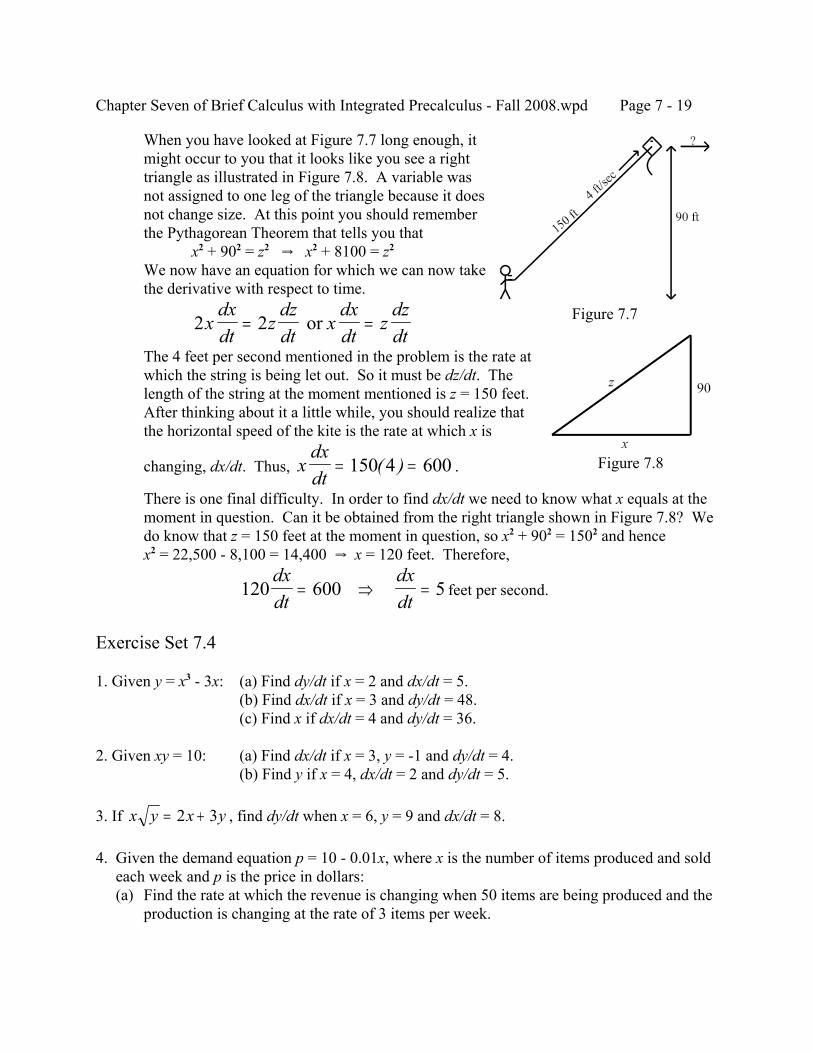
Chapter Seven of Brief Calculus with Integrated Precalculus - Fall 2008.wpd Page 7 - 19
Figure 7.7
Figure 7.8
When you have looked at Figure 7.7 long enough, itmight occur to you that it looks like you see a righttriangle as illustrated in Figure 7.8. A variable wasnot assigned to one leg of the triangle because it doesnot change size. At this point you should rememberthe Pythagorean Theorem that tells you that
x2 + 902 = z2 Y x2 + 8100 = z2We now have an equation for which we can now takethe derivative with respect to time.
2 2xdxdt
zdzdt
xdxdt
zdzdt
= = or
The 4 feet per second mentioned in the problem is the rate atwhich the string is being let out. So it must be dz/dt. Thelength of the string at the moment mentioned is z = 150 feet. After thinking about it a little while, you should realize thatthe horizontal speed of the kite is the rate at which x is
changing, dx/dt. Thus, .xdxdt
= =150 4 600( )
There is one final difficulty. In order to find dx/dt we need to know what x equals at themoment in question. Can it be obtained from the right triangle shown in Figure 7.8? Wedo know that z = 150 feet at the moment in question, so x2 + 902 = 1502 and hencex2 = 22,500 - 8,100 = 14,400 Y x = 120 feet. Therefore,
feet per second.120 600 5dxdt
dxdt
= ⇒ =
Exercise Set 7.4
1. Given y = x3 - 3x: (a) Find dy/dt if x = 2 and dx/dt = 5.(b) Find dx/dt if x = 3 and dy/dt = 48.(c) Find x if dx/dt = 4 and dy/dt = 36.
2. Given xy = 10: (a) Find dx/dt if x = 3, y = -1 and dy/dt = 4.(b) Find y if x = 4, dx/dt = 2 and dy/dt = 5.
3. If , find dy/dt when x = 6, y = 9 and dx/dt = 8.x y x y= +2 3
4. Given the demand equation p = 10 - 0.01x, where x is the number of items produced and sold each week and p is the price in dollars: (a) Find the rate at which the revenue is changing when 50 items are being produced and the
production is changing at the rate of 3 items per week.
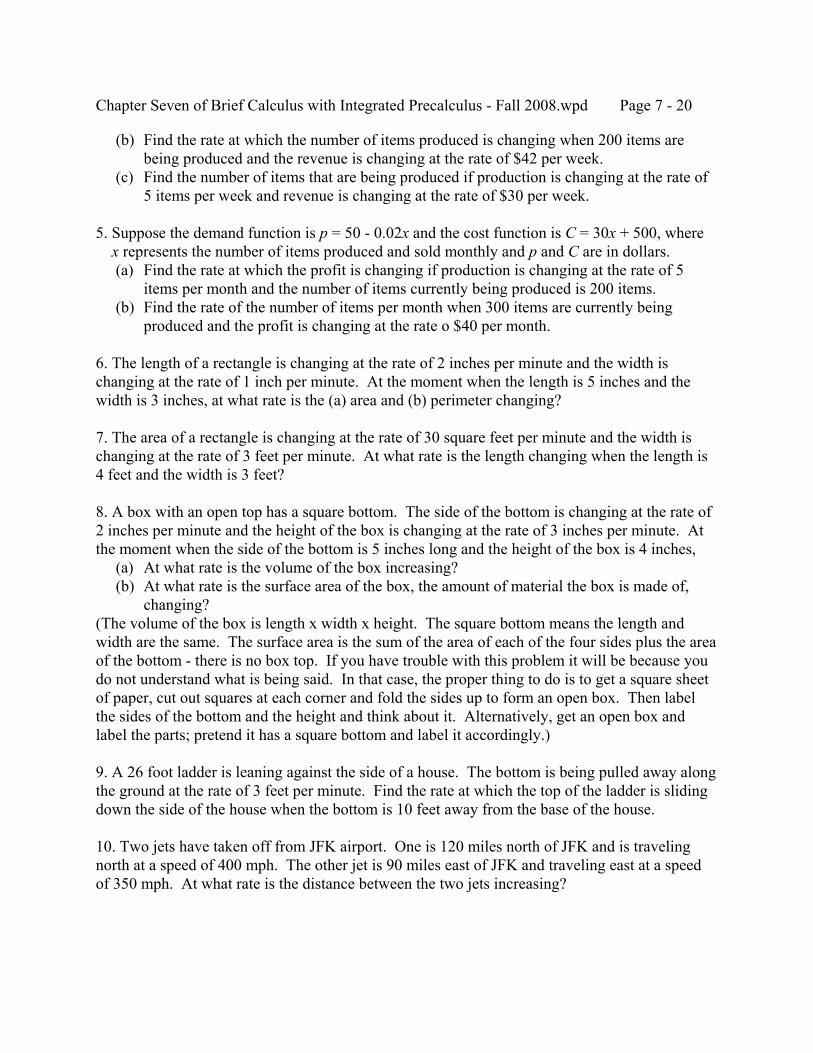
Chapter Seven of Brief Calculus with Integrated Precalculus - Fall 2008.wpd Page 7 - 20
(b) Find the rate at which the number of items produced is changing when 200 items arebeing produced and the revenue is changing at the rate of $42 per week.
(c) Find the number of items that are being produced if production is changing at the rate of5 items per week and revenue is changing at the rate of $30 per week.
5. Suppose the demand function is p = 50 - 0.02x and the cost function is C = 30x + 500, where x represents the number of items produced and sold monthly and p and C are in dollars. (a) Find the rate at which the profit is changing if production is changing at the rate of 5
items per month and the number of items currently being produced is 200 items. (b) Find the rate of the number of items per month when 300 items are currently being
produced and the profit is changing at the rate o $40 per month.
6. The length of a rectangle is changing at the rate of 2 inches per minute and the width ischanging at the rate of 1 inch per minute. At the moment when the length is 5 inches and thewidth is 3 inches, at what rate is the (a) area and (b) perimeter changing?
7. The area of a rectangle is changing at the rate of 30 square feet per minute and the width ischanging at the rate of 3 feet per minute. At what rate is the length changing when the length is4 feet and the width is 3 feet?
8. A box with an open top has a square bottom. The side of the bottom is changing at the rate of2 inches per minute and the height of the box is changing at the rate of 3 inches per minute. Atthe moment when the side of the bottom is 5 inches long and the height of the box is 4 inches, (a) At what rate is the volume of the box increasing? (b) At what rate is the surface area of the box, the amount of material the box is made of,
changing?(The volume of the box is length x width x height. The square bottom means the length andwidth are the same. The surface area is the sum of the area of each of the four sides plus the areaof the bottom - there is no box top. If you have trouble with this problem it will be because youdo not understand what is being said. In that case, the proper thing to do is to get a square sheetof paper, cut out squares at each corner and fold the sides up to form an open box. Then labelthe sides of the bottom and the height and think about it. Alternatively, get an open box andlabel the parts; pretend it has a square bottom and label it accordingly.)
9. A 26 foot ladder is leaning against the side of a house. The bottom is being pulled away alongthe ground at the rate of 3 feet per minute. Find the rate at which the top of the ladder is slidingdown the side of the house when the bottom is 10 feet away from the base of the house.
10. Two jets have taken off from JFK airport. One is 120 miles north of JFK and is travelingnorth at a speed of 400 mph. The other jet is 90 miles east of JFK and traveling east at a speedof 350 mph. At what rate is the distance between the two jets increasing?
Chapter Seven of Brief Calculus with Integrated Precalculus - Fall 2008.wpd Page 7 - 21
7.5 ELASTICITY OF DEMAND
There are some commodities for which the demand does not change very much even if the pricechanges substantially. For example, the demand for gasoline does not change very much whenthe price changes a lot. For that reason the demand for such commodities is said to be inelastic. That is, an inelastic demand indicates the rate of change in demand with respect to price is smallin size. On the other hand, a change in price for some commodities can result in a drastic changein demand. For example, suppose either tomato variety A or tomato variety B can be used bymanufacturers to produce their products (such as tomato sauce). If a blight affects variety B sothat its price goes up, manufacturers will simply buy a lot more of variety A instead. Demandfor variety B is said to be elastic in such a case where the rate of change in demand with respectto price is large in size.
Notice that we are talking about the rate of change in demand, x, with respect to price, p, dx/dpand not dp/dx. Now there is one problem that has to be overcome before we can use the size ofthis rate of change to measure elasticity. Let x represent the gasoline used by the average car andp the price of the gasoline. Then there are many different numbers that can be used to representthe same rate of change in demand with respect to price. For example, suppose the average caruses x = 600 gallons of gas per year when the price is p = $2.00 but it uses x = 575 gallons peryear when the price is p = $3.00. That would lead us to a rate of change of dx/dp = -25 gallonsof gas per year per dollar. However, since there are 100 cents in each dollar we could representthis rate of change as dx/dp = -25/100 = -0.25 gallons per year per cent. Alternatively, sincethere are 365 days in a year, we could represent the rate of change as dx/dp = (-25/365)/$1.00 =-0.0685 gallons per day per dollar. Which of these numbers, -0.0685, -0.25 or -25 do we use todetermine the elasticity of demand? Is the demand inelastic because -0.0685 is small in size? Oris it elastic because -25 is large in size? In fact, a little thought reveals that other numbers couldhave been used (such as gallons per day per cent). The method used to take care of this problemis to choose a definition of elasticity that converts the answers found above to a quantity withoutunits. The starting values listed above were 600 gallons per year when the price was $2.00. The-25 gallons per year per dollar can be converted to a quantity without units by computing
−× = −
251
2600
0 0833 gallons per year dollar
dollars gallons per year
.
The same starting values are 600 gallons per year and 200 cents. So dx/dp = -0.25 gallons peryear per cent can be converted to the quantity without units by similarly computing
−× = −
0 251
200600
0 0833. . gallons per year cent
cents gallons per year
The starting values can also be viewed as (600/365) gallons per day when the price was $2.00 sothat dx/dp = -25/365 = -0.0685 gallons per day per dollar can be similarly converted to
−× = −
25365
12 0 0833 gallons per day
dollar dollars
gallons per day600365
.
This quantity without units is the one used to represent the elasticity of demand. In this case theelasticity of demand is small in size and we consider the demand to be inelastic. We now havethe definition of the elasticity of demand that we want.
Chapter Seven of Brief Calculus with Integrated Precalculus - Fall 2008.wpd Page 7 - 22
If the rate of change in demand with respect to price is dx/dp when the demand is x and the priceis p, then
Elasticity of Demand= = ⋅εDdxdp
px
We will now be precise as to what is meant by inelastic and elastic demands. Before doing that,however, notice that the elasticity of demand is always negative since demand decreases as theprice increases (dx/dp is negative) and the price and quantity (p and x) are always positive. Since we prefer to work with a positive number we now define the type of elasticity as follows.
Inelastic: < 1εD
Unitary: = 1εD
Elastic: > 1εD
Note: Many economics textbooks define the elasticity of demand to be the positive number. We will use the above definition since it agrees with the definition used on theεD
uniform final exam. It should also be mentioned that the definition used in economicscan be phrased in a manner that does not involve calculus: the elasticity of demand is thepercentage change in the demand divided by the percentage change in price.
Example 7.20: If the demand is given by x = 1000 - 2p, find the elasticity of demand whenthe price is a) $200, b) $250 and c) $400. Also indicate whether the demand is elastic,unitary or inelastic in each case.
Solution:dx/dp = -2.
a) We know the price is $200. In order to find the elasticity of demand we need to knowwhat demand, x, corresponds to this price. Using the function provided we findx = 1000 - 2p = 1000 - 2(200) = 600.
So ( )εDdxdp
px
= ⋅ = − = − = −2 0 667200600
23 .
Since = 0.667 < 1, the demand is inelastic.εD
b) When the price is $250 the demand is 1000 - 2(250) = 500.So ( )εD = − = −2 1250
500
Since = 1, the demand is unitary.εD
c) When the price is $400 the demand is 1000 - 2(400) = 200.So ( )εD = − = −2 4400
200
Since = 4 > 1, the demand is elastic.εD
Notice that the demand can be inelastic in some price ranges while it might be elastic in otherprice ranges.
Chapter Seven of Brief Calculus with Integrated Precalculus - Fall 2008.wpd Page 7 - 23
Example 7.21: If 3x + 9p = 1800 is the demand equation, find the elasticity of demand whenthe price is a) $50, b) $100 and c) $150. Also indicate whether the demand is elastic,unitary or inelastic.
Solution:In order to find dx/dp, it is easiest to first solve for x.x = -3p + 600 Y dx/dp = -3.
a) Once again we need to know the value of x when p = 50 in order to use the formula forthe elasticity of demand.x = -3p + 600 = -3(50) + 600 = 450
Therefore, ( )εDdxdp
px
= ⋅ = − = − = −3 0 33350450
13 .
Since = 0.333 < 1, the demand is inelastic.εD
b) When the price is $100 the demand is -3(100) + 600 = 300.So ( )εD = − = −3 1100
300
Since = 1, the demand is unitary.εD
c) When the price is $150 the demand is -3(150) + 600 = 150.So ( )εD = − = −3 3150
150
Since = 3 > 1, the demand is elastic.εD
Example 7.22: If is the demand function, find the elasticity of demand whenx p= −900 6the price is $400 and determine whether the demand is elastic, inelastic or unitary.
Solution:
( )dxdp
pp
= − =−−6 31
21
2
When p = 400, .x = − = − =900 6 400 900 6 20 780( )
Also, .dxdp
=−
=−3
4003
20
So εDdxdp
px
= ⋅ =−
⋅ = − = −3
20400780
113
0 0769.
Since = 0.0769 < 1, the demand is inelastic.εD
Chapter Seven of Brief Calculus with Integrated Precalculus - Fall 2008.wpd Page 7 - 24
Exercise Set 7.5
1. If the demand is given by x = 1200 - 6p, find the elasticity of demand when the price is a) $50, b) $100 and c) $150. Also indicate whether the demand is elastic, unitary or inelastic in each case.
2. If 4x + 10p = 800 is the demand equation, find the elasticity of demand when the price is a) $30, b) $40 and c) $50. Also indicate whether the demand is elastic, unitary or inelastic.
3. If is the demand function, find the elasticity of demand when the price isx p= −800 2 a) $900 and b) $2500. Also determine whether the demand is elastic, inelastic or unitary.
4. If is the demand function, find the elasticity of demand when the price isx p= −1000 4 $225 and determine whether the demand is elastic, inelastic or unitary.
5. If is the demand function, find the elasticity of demand when the price isxp2 8000= $50 and determine whether the demand is elastic, inelastic or unitary.
Chapter Eight of Brief Calculus with Integrated Precalculus - Spring 2007.wpd Page 8 - 1
CHAPTER EIGHTEXPONENTIAL FUNCTIONS
8.1 EXPONENTIAL GROWTH AND DECAY
Example 8.1: Bayfield has a population of 1000 people and the population is growing at therate of 10% per year. (a) What is the population 3 years from today? (b) In t years?
Solution: (a) 10% of 1000 is the result that you get if you multiply 1000 by 0.10. So in the first year
the population of Bayfield grows by 1000(0.10) = 100 people. As a result, after one yearthe population of Bayfield is 1000 + 100 = 1100 people. It is important for obtaining theanswer to part (b) to view this in another way. Namely, after one year the population is
1000 + 1000(0.10) = 1000(1 + 0.10) or 1000(1.10) = 1100.Now at the end of the second year we do not add another 100 people to the population. The reason is the fact that the year started with 1100 people in Bayfield, not 1000. So10% of 1100 people has to be added to 1100 to get the correct result. Since 10% of 1100is 1100(0.10) = 110, the population after two years is 1100 + 110 = 1210 people. Noticethat the same procedure indicated for the first year works for the second year:
1100 + 1100(0.10) = 1100(1 + 0.10) or 1100(1.10) = 1210.Notice that the 1100 equals 1000(1.10), so the population of Bayfield after two years is
1100(1.10) = (1000(1.10))(1.10) = 1000(1.10)2 = 1210In essence, to find the population at the end of a year you multiply the population at thebeginning of the year by 1.10. And this means that after 3 years you would multiply theinitial population of Bayfield by 1.10 three times, or 1.103. So the population of Bayfieldafter 3 years should be 1000(1.10)3 = 1000(1.331) = 1331. This of course corresponds totaking the population at the end of two years (1210) and adding 10% of it (121) to get thepopulation at the end of three years: 1210 + 121 =1331 people.
(b) As we saw in part (a), to determine the population of Bayfield after t years we have tomultiply 1000 by (1.10)(1.10)....(1.10) where 1.10 appears t times. So the populationafter t years is given by P = 1000(1.10)t.
Example 8.2: The population of Washburn is 1000 people and the population is decreasing(decaying) at the rate of 10% per year.(a) What is the population after 3 years? (b) After t years?
Solution: (a) This example is like the previous except in this case we have to subtract 10% of the
population at the end of each year. After one year we obtain1000 - 1000(0.10) = 1000(1 - 0.10) = 1000(0.90) = 900After two years we obtain900 - 900(0.10) = 900(1 - 0.10) = 900(0.90) = 810 or 1000(0.90)(0.90) = 1000(0.90)2
After three years we obtain810 - 810(0.10) = 810(1 - 0.10) = 810(0.90) = 729 or 1000(0.90)2(0.90) = 1000(0.90)3
Chapter Eight of Brief Calculus with Integrated Precalculus - Spring 2007.wpd Page 8 - 2
(b) What we notice above is that to find the population at the end of one year we multiply thepopulation at the beginning of the year by 1 - 0.10 = 0.90. After t years this amounts tomultiplying the starting population of 1000 by (0.90)(0.90)....(0.90) where the factor of0.90 appears t times. So the population after t years is P = 1000(0.90)t.
Exponential Growth or Decay: If a quantity P grows or decays at a constant percentage ratewhose decimal representation is r (negative for decay) and the initial quantity at t = 0 isP0, then P P a a rt= = +0 1 where
Example 8.3: The population of a town on January 1, 2000, is 50,000 people. Find thepopulation on January 1, 2004, for each case below.(a) The population is growing at the rate of 5% per year.(b) The population is decreasing at the rate of 4% per year.(c) The population is increasing at the rate of 8 people per year.(d) The population is decreasing at the rate of 10 people per year.
Solution:In all four cases the number of years is t = 4 and the initial population is P0 = 50,000.
(a) Since the population is growing at the rate of r = 5% = 0.05,P = P0(1 + r)t = 50,000(1 + 0.05)4 = 50,000(1.05)4 = 50,000(1.21550625) = 60,775.3125or 60,775 people.
(b) The population is decreasing at the rate of 4% per year, so r = -0.04. Hence,P = P0(1 + r)t = 50,000(1 - 0.04)4 = 50,000(0.96)4 = 50,000(0.84934656) = 42,467.328or 42,467 people.
(c) The population in this part is not increasing at a constant percentage rate. It is increasingat a constant number of people, 8. Constant rate of change in number, remember,represents linear growth where the constant rate is the slope. So in this case,P = mt + P0 = 8(4) + 50,000 = 50, 032.
(d) Once again, the constant rate is a constant number and not a constant percentage. SoP = mt + P0 = -10(4) + 50,000 = 49,960.
Computers can be programmed to solve problems once the problem is properly identified and thenecessary information is provided to the computer. Human minds are still needed to identify theproblem type. Our most important task when confronted by a problem is to be able to analyze itand decide what type of problem it is. If we forget a particular formula, we can always look itup. But we must be able to look at a problem and decide what type of problem it is. Lineargrowth is extremely important in many areas of life. The next most important constant growthrate is a percentage rate of growth as occurs, for example, when compound interest is involved.
Linear Growth: Constant rate of growth in number, y = mx + b.Exponential Growth: Constant rate of growth in percent, y = at.
Chapter Eight of Brief Calculus with Integrated Precalculus - Spring 2007.wpd Page 8 - 3
Example 8.4: Each of the following shows the population of a town t years after January, 1,2000. In each case identify whether the problem involves growth or decay, whether thegrowth or decay is linear or exponential, the population on January 1, 2000, and the rateof growth or decay.(a) P = 3000(1.25)t (b) P = 3000 + 25t (c) P = 2510 - 27t(d) P = 2510(0.91)t (e) P = 4200(1.008)t (f) P = 4200(0.825)t
Solution: (a) The variable in the exponent and the fact that 1.25 is greater than one indicates the
problem involves exponential growth. The initial population (on January 1,2000) is 3000people. Since 1 + r = 1.25, r = 0.25 = 25%. So the population is growing at the rate of25% per year.
(b) The variable is not in the exponent on the equation is that of a straight line with slope 25. Since the slope is positive, the problem involves linear growth at the rate of 25 people peryear. The initial population (when t = 0) is 3000 people.
(c) The function is a straight line with negative slope. So the problem involves linear decaywhere an initial population of 2510 people is decreasing at the rate of 27 people per year.
(d) The variable is in the exponent and the base is less than one. So the problem involvesexponential decay where the initial population is 2510. Since 1 + r = 0.91, it follows thatr = 0.91 -1.00 = -0.09 = -9%, where the negative sign indicates decay. So the populationis decreasing at the rate of 9% per year.
(e) The variable is in the exponent and the base, 1.008, is greater than one. So the probleminvolves exponential growth. The initial population is 4200 and the rate of growth isgiven by r = 0.008 = 0.8% per year (recall that you move the decimal point two placesand the percent is always bigger than its decimal form).
(f) The problem involves exponential decay where the initial population is 4200. The rate ofdecay is determined by 1 + r = 0.825, and hence r = 0.825 - 1.000 = -0.175 = -17.5%. Sothe population is decreasing at the rate of 17.5% per year.
Example 8.5: If there are 5000 people in a town today and the population has been growing atthe constant rate of 7.2%, how many people were in the town two and a half years ago?
Solution:The problem involves exponential growth where r = 7.2% = 0.072. It should be notedthat it is legitimate to use 2.5 for the number of years in the exponential growth formula. There are two possible methods of doing this problem.
Method I: In the exponential growth formula, P = P0(1 + r)t, let P0 represent the unknownstarting population of 2.5 years ago so that t = 0 corresponds to 2.5 years ago. In thatcase, the population today is P = 5000 and 5000 = P0(1+0.072)2.5 = 1.18984P0 and henceP0 = 4202.26, or 4202 people. (Alternatively, use solve(5000=x*1.072^2.5,x).)
Method II: In the exponential growth formula, let t = 0 represent today so that P0 = 5000.By this method 2.5 years ago is represented by t = -2.5 so that the formula becomesP = 5000(1.072)-2.5 = 5000(0.840452) = 4202.26, or 4202 people.
Chapter Eight of Brief Calculus with Integrated Precalculus - Spring 2007.wpd Page 8 - 4
Example 8.6: According to the year 2000 Statistical Abstract of the United States, thepopulation (in thousands of people) for the year 1970 was 205,052 and for the year 1980it was 227,726.(a) If the population was increasing at a constant percentage, what is the percentage?(b) If the population was increasing at a constant number of people, by how many people per year was it increasing?
Solution: (a) In the formula, P = P0(1 + r)t, P0 = 205,052, P = 227,726, t = 10 and r is what we are
asked to find. So 227,726 = 205,052(1 + r)10. Using the calculator,solve(227726=205052*(1+x)^10,x) Y r = 0.010543 or -2.01054. Since the problemclearly involves growth and not decay, we discard the negative solution. So thepopulation would be growing at the rate of 1.0543% per year.(If you are curious as to why the solution -2.01054 showed up, observe that, since 10 iseven, (1 - 2.010543)10 = (-1.010543)10 = 1.01054310.)
(b) The increase in population in 10 years is 227,726 - 205,052 = 22,674. So the populationwould be increasing at the rate of 22,674/10 = 2,267.4 or 2,267 people per year.
Example 8.7: During a period when the population was decreasing at the constant rate of 3%,the population decreased from 526,400 to 462,483. How much time elapsed?
Solution:Since the population is decreasing, in the formula, P = P0(1 + r)t, P should be the smallernumber and P0 should be the larger number. Also, 1 + r = 1 - 0.03 = 0.97. Hence,462,483 = 526,400(0.97)t. Using the calculator solve feature reveals t = 4.25. Since 0.25years is 1/4 of 12 months, or 3 months, the amount of time is 4 years and 3 months.
In order to do the next problem, we need to remember the following fact.
Percent Change: The percent change in going from the value a to the value b is the differencebetween the two values divided by the initial value a and converted to a percentage.
Percent Change =b a
a−
⋅100%
For example, to find the percent change between 20 and 25 we would compute
and convert it to 25% by multiplying by 100%.25 20
20520
14
0 25−
= = = .
Remark: In the first example of this section the population was growing at the rate of 10% peryear. The initial population was 1000 people and three years later the population was1331 people. Over the course of three years, the percentage change in the population was
. Make sure you notice that dividing 33.1% by 3 years does1331 10001000 100 331− ⋅ =% . %
NOT provide the correct yearly percentage rate of growth.
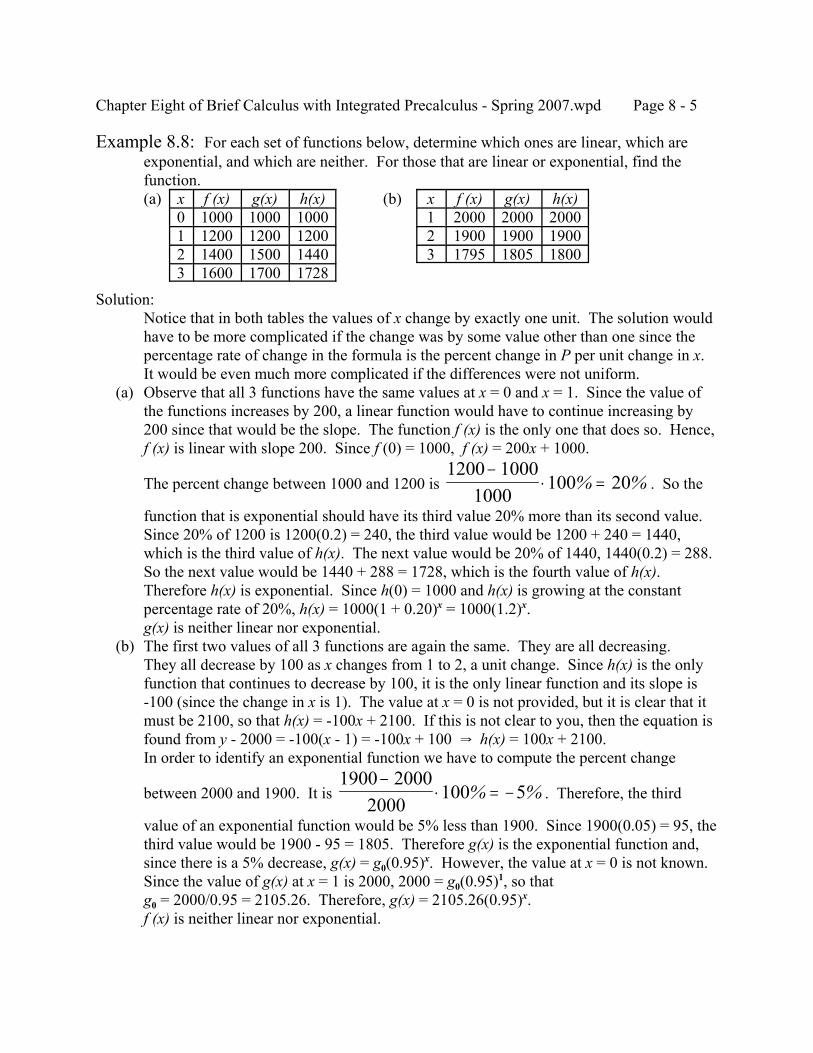
Chapter Eight of Brief Calculus with Integrated Precalculus - Spring 2007.wpd Page 8 - 5
Example 8.8: For each set of functions below, determine which ones are linear, which areexponential, and which are neither. For those that are linear or exponential, find thefunction.(a) (b) x f (x) g(x) h(x)
0 1000 1000 10001 1200 1200 12002 1400 1500 14403 1600 1700 1728
x f (x) g(x) h(x)1 2000 2000 20002 1900 1900 19003 1795 1805 1800
Solution:Notice that in both tables the values of x change by exactly one unit. The solution wouldhave to be more complicated if the change was by some value other than one since thepercentage rate of change in the formula is the percent change in P per unit change in x. It would be even much more complicated if the differences were not uniform.
(a) Observe that all 3 functions have the same values at x = 0 and x = 1. Since the value ofthe functions increases by 200, a linear function would have to continue increasing by200 since that would be the slope. The function f (x) is the only one that does so. Hence,f (x) is linear with slope 200. Since f (0) = 1000, f (x) = 200x + 1000.
The percent change between 1000 and 1200 is . So the1200 1000
1000100 20
−⋅ =% %
function that is exponential should have its third value 20% more than its second value. Since 20% of 1200 is 1200(0.2) = 240, the third value would be 1200 + 240 = 1440,which is the third value of h(x). The next value would be 20% of 1440, 1440(0.2) = 288. So the next value would be 1440 + 288 = 1728, which is the fourth value of h(x). Therefore h(x) is exponential. Since h(0) = 1000 and h(x) is growing at the constantpercentage rate of 20%, h(x) = 1000(1 + 0.20)x = 1000(1.2)x.g(x) is neither linear nor exponential.
(b) The first two values of all 3 functions are again the same. They are all decreasing.They all decrease by 100 as x changes from 1 to 2, a unit change. Since h(x) is the onlyfunction that continues to decrease by 100, it is the only linear function and its slope is-100 (since the change in x is 1). The value at x = 0 is not provided, but it is clear that itmust be 2100, so that h(x) = -100x + 2100. If this is not clear to you, then the equation isfound from y - 2000 = -100(x - 1) = -100x + 100 Y h(x) = 100x + 2100.In order to identify an exponential function we have to compute the percent change
between 2000 and 1900. It is . Therefore, the third1900 2000
2000100 5
−⋅ = −% %
value of an exponential function would be 5% less than 1900. Since 1900(0.05) = 95, thethird value would be 1900 - 95 = 1805. Therefore g(x) is the exponential function and,since there is a 5% decrease, g(x) = g0(0.95)x. However, the value at x = 0 is not known. Since the value of g(x) at x = 1 is 2000, 2000 = g0(0.95)1, so thatg0 = 2000/0.95 = 2105.26. Therefore, g(x) = 2105.26(0.95)x.f (x) is neither linear nor exponential.
Chapter Eight of Brief Calculus with Integrated Precalculus - Spring 2007.wpd Page 8 - 6
In the last example it was mentioned that an important feature of the data presented was the factthat the value of x changed by one unit. The remark provided after the definition of percent rateof change illustrates the importance of that fact. Parts (a) and (b) of the next example provideproblems where the exponential function can be found by hand. Part (c) of the next exampleshows how to find the function by using the calculator.
Example 8.9: Find the exponential function, y =abx, that passes through the two points listed.(a) (0, 5) and (3, 40) (b) (2, 32) and (4, 512) (c) (2, 5) and (7, 200)
Solution:All parts of this problem are done by substituting the two points into y =abx and thensolving for a and b.
(a) 5 = ab0 = a(1) = a and 40 = ab3 Y 40 = 5b3 Y b3 = 8 Y b = 2Since a = 5 and b = 2, the function is y =5(2)x.
(b) 32 = ab2 and 512 = ab4
There are various ways of solving these two equations, but the one that works mostsimply for problems like this is to divide the expression with the greater exponent by theexpression with the smallest exponent as follows:
(b is positive for growth from 32 to 512)abab
b b4
22512
3216 16 4= = ⇒ = ⇒ =
Now substitute the value b = 4 back into one of the two equations to find the value of a.32 = a(4)2 Y 16a = 32 Y a = 2. Therefore, y = 2(4)x.
(c) Substitution of the two points yields 5 = ab2 and 200 = ab7. Therefore,
abab
b b7
25200
540 2 09128= ⇒ = ⇒ = .
The calculator is used to find the value of b above either by using solve(b^5=40,b)or by realizing that the solution of b5 = 40 is b = 401/5, and using 40^(1/5).Substituting back into the first equation, 5 = a(2.09128)2 Y a = 1.14326.Therefore, y = 1.14326(2.09128)x.
Exercise Set 8.1
1. The population of a town consists of 3000 people. (a) Find the population two years later if it is growing at the rate of 7%. (b) Find the population 3 years and 6 months later if it is growing at the rate of 4%. (c) Find the population 4 years later if it is growing at the rate of 15 people per year. (d) Find the population 2 years later if it is decreasing at the rate of 2%. (e) Find the population 7 years later if it is decreasing at the rate of 50 people per year. (f) Find the population 5 years later if it is decreasing at the rate of 0.35%. (g) Find the population 3 years ago if it is increasing at the rate of 9.3% (h) Find the population 4 years and 3 months ago if it is decreasing at the rate of 4.2%.
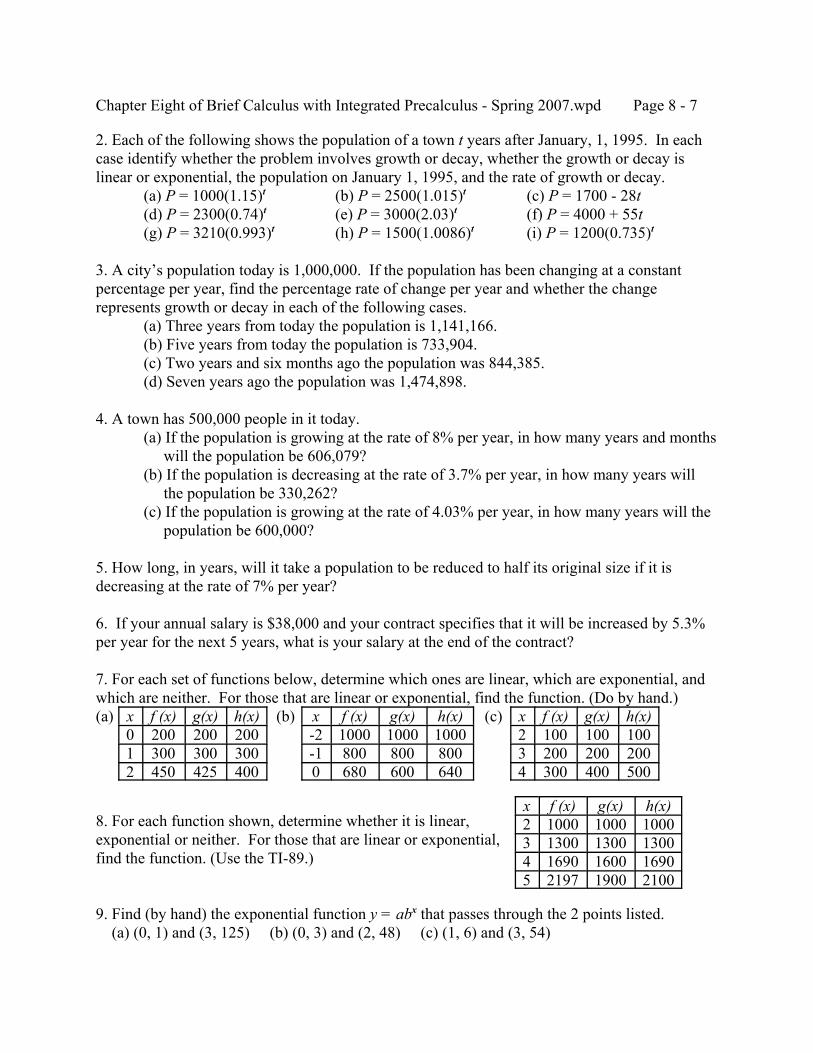
Chapter Eight of Brief Calculus with Integrated Precalculus - Spring 2007.wpd Page 8 - 7
2. Each of the following shows the population of a town t years after January, 1, 1995. In eachcase identify whether the problem involves growth or decay, whether the growth or decay islinear or exponential, the population on January 1, 1995, and the rate of growth or decay.
(a) P = 1000(1.15)t (b) P = 2500(1.015)t (c) P = 1700 - 28t(d) P = 2300(0.74)t (e) P = 3000(2.03)t (f) P = 4000 + 55t(g) P = 3210(0.993)t (h) P = 1500(1.0086)t (i) P = 1200(0.735)t
3. A city’s population today is 1,000,000. If the population has been changing at a constantpercentage per year, find the percentage rate of change per year and whether the changerepresents growth or decay in each of the following cases.
(a) Three years from today the population is 1,141,166.(b) Five years from today the population is 733,904.(c) Two years and six months ago the population was 844,385.(d) Seven years ago the population was 1,474,898.
4. A town has 500,000 people in it today.(a) If the population is growing at the rate of 8% per year, in how many years and months will the population be 606,079?(b) If the population is decreasing at the rate of 3.7% per year, in how many years will the population be 330,262?(c) If the population is growing at the rate of 4.03% per year, in how many years will the population be 600,000?
5. How long, in years, will it take a population to be reduced to half its original size if it isdecreasing at the rate of 7% per year?
6. If your annual salary is $38,000 and your contract specifies that it will be increased by 5.3%per year for the next 5 years, what is your salary at the end of the contract?
7. For each set of functions below, determine which ones are linear, which are exponential, andwhich are neither. For those that are linear or exponential, find the function. (Do by hand.)(a) (b) (c)x f (x) g(x) h(x)
0 200 200 2001 300 300 3002 450 425 400
x f (x) g(x) h(x)-2 1000 1000 1000-1 800 800 8000 680 600 640
x f (x) g(x) h(x)2 100 100 1003 200 200 2004 300 400 500
8. For each function shown, determine whether it is linear,exponential or neither. For those that are linear or exponential,find the function. (Use the TI-89.)
9. Find (by hand) the exponential function y = abx that passes through the 2 points listed. (a) (0, 1) and (3, 125) (b) (0, 3) and (2, 48) (c) (1, 6) and (3, 54)
x f (x) g(x) h(x)2 1000 1000 10003 1300 1300 13004 1690 1600 16905 2197 1900 2100
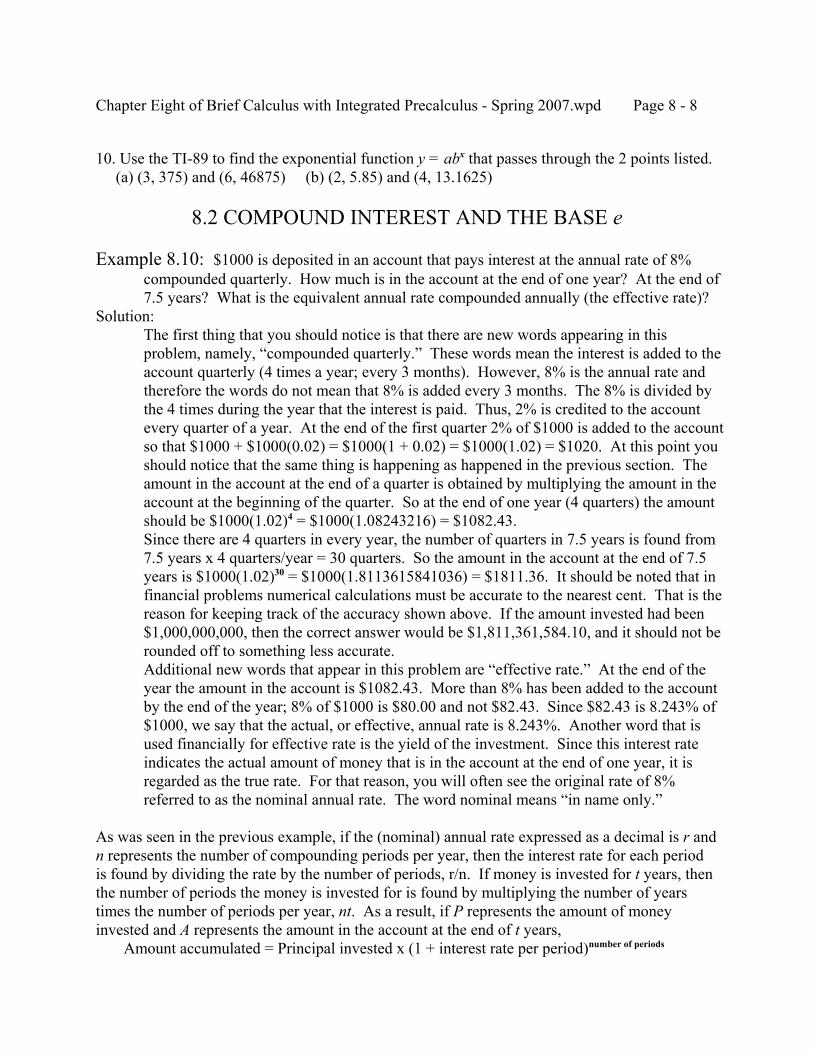
Chapter Eight of Brief Calculus with Integrated Precalculus - Spring 2007.wpd Page 8 - 8
10. Use the TI-89 to find the exponential function y = abx that passes through the 2 points listed. (a) (3, 375) and (6, 46875) (b) (2, 5.85) and (4, 13.1625)
8.2 COMPOUND INTEREST AND THE BASE e
Example 8.10: $1000 is deposited in an account that pays interest at the annual rate of 8%compounded quarterly. How much is in the account at the end of one year? At the end of7.5 years? What is the equivalent annual rate compounded annually (the effective rate)?
Solution:The first thing that you should notice is that there are new words appearing in thisproblem, namely, “compounded quarterly.” These words mean the interest is added to theaccount quarterly (4 times a year; every 3 months). However, 8% is the annual rate andtherefore the words do not mean that 8% is added every 3 months. The 8% is divided bythe 4 times during the year that the interest is paid. Thus, 2% is credited to the accountevery quarter of a year. At the end of the first quarter 2% of $1000 is added to the accountso that $1000 + $1000(0.02) = $1000(1 + 0.02) = $1000(1.02) = $1020. At this point youshould notice that the same thing is happening as happened in the previous section. Theamount in the account at the end of a quarter is obtained by multiplying the amount in theaccount at the beginning of the quarter. So at the end of one year (4 quarters) the amountshould be $1000(1.02)4 = $1000(1.08243216) = $1082.43.Since there are 4 quarters in every year, the number of quarters in 7.5 years is found from7.5 years x 4 quarters/year = 30 quarters. So the amount in the account at the end of 7.5years is $1000(1.02)30 = $1000(1.8113615841036) = $1811.36. It should be noted that infinancial problems numerical calculations must be accurate to the nearest cent. That is thereason for keeping track of the accuracy shown above. If the amount invested had been$1,000,000,000, then the correct answer would be $1,811,361,584.10, and it should not berounded off to something less accurate.Additional new words that appear in this problem are “effective rate.” At the end of theyear the amount in the account is $1082.43. More than 8% has been added to the accountby the end of the year; 8% of $1000 is $80.00 and not $82.43. Since $82.43 is 8.243% of$1000, we say that the actual, or effective, annual rate is 8.243%. Another word that isused financially for effective rate is the yield of the investment. Since this interest rateindicates the actual amount of money that is in the account at the end of one year, it isregarded as the true rate. For that reason, you will often see the original rate of 8%referred to as the nominal annual rate. The word nominal means “in name only.”
As was seen in the previous example, if the (nominal) annual rate expressed as a decimal is r andn represents the number of compounding periods per year, then the interest rate for each periodis found by dividing the rate by the number of periods, r/n. If money is invested for t years, thenthe number of periods the money is invested for is found by multiplying the number of yearstimes the number of periods per year, nt. As a result, if P represents the amount of moneyinvested and A represents the amount in the account at the end of t years, Amount accumulated = Principal invested x (1 + interest rate per period)number of periods
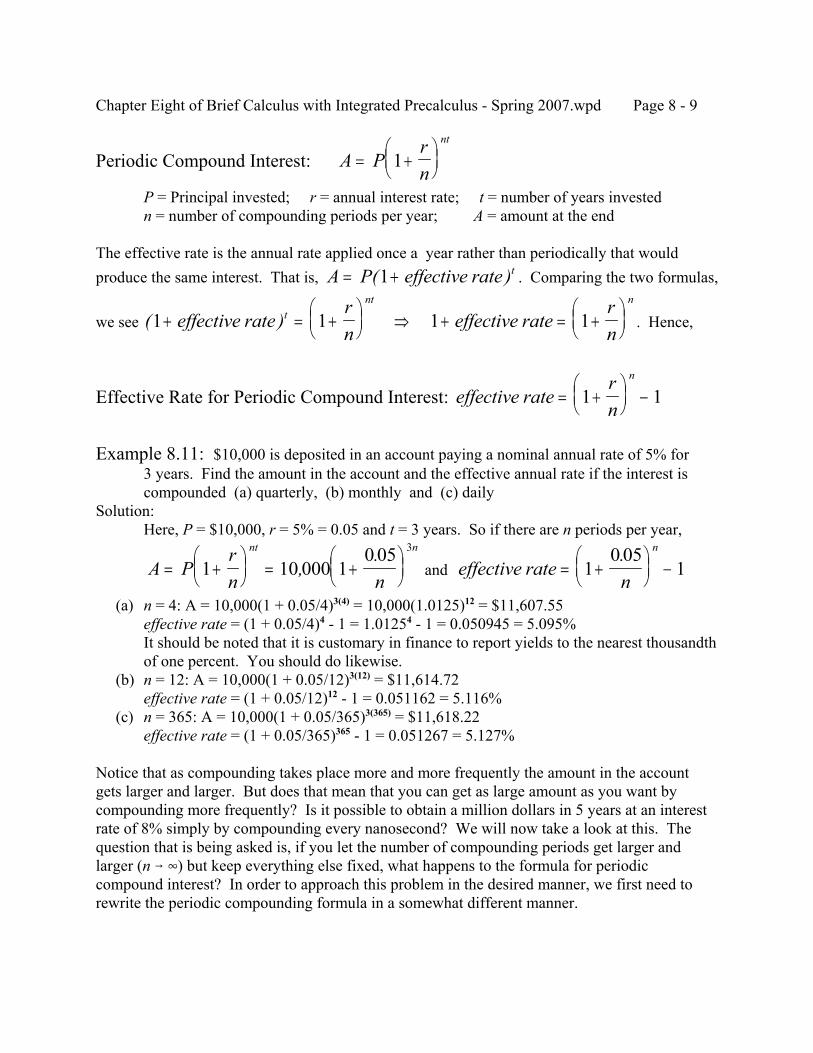
Chapter Eight of Brief Calculus with Integrated Precalculus - Spring 2007.wpd Page 8 - 9
Periodic Compound Interest: A Prn
nt
= +
1
P = Principal invested; r = annual interest rate; t = number of years investedn = number of compounding periods per year; A = amount at the end
The effective rate is the annual rate applied once a year rather than periodically that wouldproduce the same interest. That is, . Comparing the two formulas,A P( effective rate t= +1 )
we see . Hence,( )1 1 1 1+ = +
⇒ + = +
effective rate
rn
effective ratern
tnt n
Effective Rate for Periodic Compound Interest: effective ratern
n
= +
−1 1
Example 8.11: $10,000 is deposited in an account paying a nominal annual rate of 5% for3 years. Find the amount in the account and the effective annual rate if the interest iscompounded (a) quarterly, (b) monthly and (c) daily
Solution:Here, P = $10,000, r = 5% = 0.05 and t = 3 years. So if there are n periods per year,
and A Prn n
nt n
= +
= +
1 10 000 1
0 05 3
,.
effective raten
n
= +
−1
0 051
.
(a) n = 4: A = 10,000(1 + 0.05/4)3(4) = 10,000(1.0125)12 = $11,607.55effective rate = (1 + 0.05/4)4 - 1 = 1.01254 - 1 = 0.050945 = 5.095%It should be noted that it is customary in finance to report yields to the nearest thousandthof one percent. You should do likewise.
(b) n = 12: A = 10,000(1 + 0.05/12)3(12) = $11,614.72effective rate = (1 + 0.05/12)12 - 1 = 0.051162 = 5.116%
(c) n = 365: A = 10,000(1 + 0.05/365)3(365) = $11,618.22effective rate = (1 + 0.05/365)365 - 1 = 0.051267 = 5.127%
Notice that as compounding takes place more and more frequently the amount in the accountgets larger and larger. But does that mean that you can get as large amount as you want bycompounding more frequently? Is it possible to obtain a million dollars in 5 years at an interestrate of 8% simply by compounding every nanosecond? We will now take a look at this. Thequestion that is being asked is, if you let the number of compounding periods get larger andlarger (n 6 4) but keep everything else fixed, what happens to the formula for periodiccompound interest? In order to approach this problem in the desired manner, we first need torewrite the periodic compounding formula in a somewhat different manner.
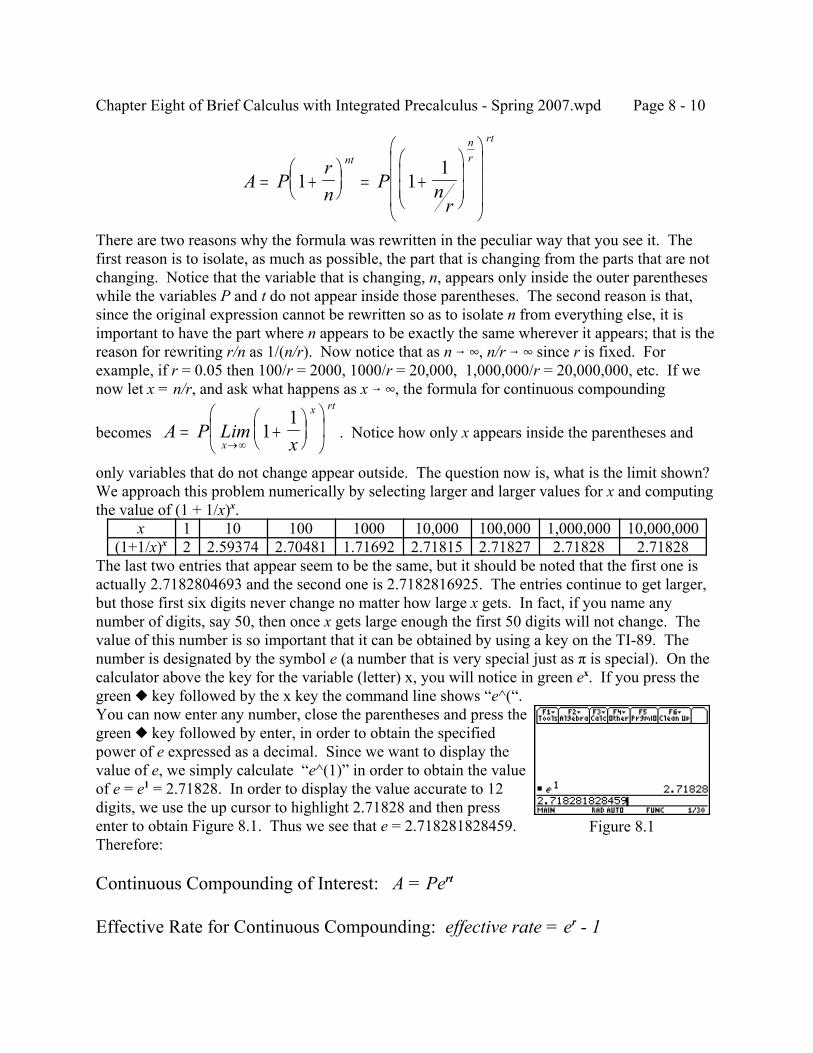
Chapter Eight of Brief Calculus with Integrated Precalculus - Spring 2007.wpd Page 8 - 10
Figure 8.1
A Prn
P nr
ntnr
rt
= +
= +
1 11
There are two reasons why the formula was rewritten in the peculiar way that you see it. Thefirst reason is to isolate, as much as possible, the part that is changing from the parts that are notchanging. Notice that the variable that is changing, n, appears only inside the outer parentheseswhile the variables P and t do not appear inside those parentheses. The second reason is that,since the original expression cannot be rewritten so as to isolate n from everything else, it isimportant to have the part where n appears to be exactly the same wherever it appears; that is thereason for rewriting r/n as 1/(n/r). Now notice that as n 6 4, n/r 6 4 since r is fixed. Forexample, if r = 0.05 then 100/r = 2000, 1000/r = 20,000, 1,000,000/r = 20,000,000, etc. If wenow let x = n/r, and ask what happens as x 6 4, the formula for continuous compounding
becomes . Notice how only x appears inside the parentheses andA P Limxx
x rt
= +
→∞1
1
only variables that do not change appear outside. The question now is, what is the limit shown? We approach this problem numerically by selecting larger and larger values for x and computingthe value of (1 + 1/x)x.
x 1 10 100 1000 10,000 100,000 1,000,000 10,000,000(1+1/x)x 2 2.59374 2.70481 1.71692 2.71815 2.71827 2.71828 2.71828
The last two entries that appear seem to be the same, but it should be noted that the first one isactually 2.7182804693 and the second one is 2.7182816925. The entries continue to get larger,but those first six digits never change no matter how large x gets. In fact, if you name anynumber of digits, say 50, then once x gets large enough the first 50 digits will not change. Thevalue of this number is so important that it can be obtained by using a key on the TI-89. Thenumber is designated by the symbol e (a number that is very special just as π is special). On thecalculator above the key for the variable (letter) x, you will notice in green ex. If you press thegreen — key followed by the x key the command line shows “e^(“. You can now enter any number, close the parentheses and press thegreen — key followed by enter, in order to obtain the specifiedpower of e expressed as a decimal. Since we want to display thevalue of e, we simply calculate “e^(1)” in order to obtain the valueof e = e1 = 2.71828. In order to display the value accurate to 12digits, we use the up cursor to highlight 2.71828 and then pressenter to obtain Figure 8.1. Thus we see that e = 2.718281828459. Therefore:
Continuous Compounding of Interest: A = Pert
Effective Rate for Continuous Compounding: effective rate = er - 1
Chapter Eight of Brief Calculus with Integrated Precalculus - Spring 2007.wpd Page 8 - 11
Example 8.12: In Example 8.11 we saw what $10,000 deposited in an account paying anominal annual rate of 5% for 3 years accumulated to for different compounding periods. The amount that it accumulates to when the interest is compounded continuously(sometimes referred to as infinitely often) should be greater than those amounts and theeffective rate should be greater. Compute the amount and effective rate.
Solution:A = Pert = 10,000e0.05(3) = 10,000e0.15 = 10,000(1.1618342427283) = $11,618.34.(Notice that we do not get an infinite amount by compounding continuously. In fact, weonly get $0.12 more than the $11,618.22 obtained by compounding daily.)effective rate = er - 1 = e0.05 - 1 = 0.051271 = 5.127%(Notice that, to the nearest thousandth of one percent, this is the same as compoundingdaily. You would have to express both to four decimal places to see a difference.)
Example 8.13: $3000 accumulates to $5000 in 8 years. What is the nominal annual rate andeffective rate if the interest is compounded (a) monthly and (b) continuously.
Solution:
(a) A Prn
nt
= +
1 ⇒ = +
= +
5000 3000 1
123000 1
12
12 8 96r r( )
solve(5000=3000*(1+x/12)^96,x) Y r = 0.064023 = 6.402%(The negative solution was discarded since the problem involves growth.)effective rate = (1 + r/n)n = (1 + 0.064023/12)12 - 1 = 0.065935 = 6.594%
(b) A = Pert Y 5000 = 3000e8r
solve(5000=3000*e^(8x),x) Y r = 0.063853 = 6.385%effective rate = er - 1 = e0.063853 - 1 = 0.065936 = 6.594%
Example 8.14: How long will it take for an investment to triple if the nominal annual interestrate is 6.4% and the interest is compounded (a) quarterly and (b) continuously?
Solution:There are two ways of doing this problem that are really the same. The first way is tosimply notice that the answer would be the same no matter how much you started with. So you could simply determine how long it would take for $1 to accumulate to $3. Theother way is the abstract way. In the abstract way you would determine how long itwould take x dollars to accumulate to 3x dollars. Notice that for part (a) the compound
interest formula for the abstract way says . Dividing both sides3 10 064
4
4
x xt
= +
.
by x then produces the same equation as the concrete approach produces, namely,
(a) and solve(3=(1+0.064/4)^(4t),t) Y t = 17.3028 years.3 1 10 064
4
4
= +
. t
(b) 3 = 1e0.064t and solve(3=e^(0.064t),t) Y t = 17.1658 years.
Chapter Eight of Brief Calculus with Integrated Precalculus - Spring 2007.wpd Page 8 - 12
Exercise Set 8.2
1. If $12,520 is invested at the nominal annual rate of 7.3%, find the amount in the account at theend of 5 years and 3 months and the effective annual rate if the money is compounded
(a) semiannually (b) quarterly (c) monthly (d) daily
2. Which of the following interest rates is the best interest rate and which is the worst?(a) 5.36% compounded semiannually (b) 5.32% compounded monthly(c) 5.30% compounded daily
3. How much does $12,500 accumulate to in 7.2 years at the nominal annual rate of 5.6% ifinterest is compounded: (a) annually (b) quarterly (c) monthly (d) daily (e) continuously?
4. Suppose $1000 is invested in an account paying interest at a rate of 5.5% per year. How muchis in the account after 8 years if the interest is compounded (a) Annually? (b) Continuously?
5. If money invested today accumulates to $3700 in 5 years at the nominal annual rate of 6.9%, how much is invested if the interest is compounded (a) quarterly, (b) continuously?
6. There is $1586.39 in an account with a nominal annual rate of 7.1%. If the money wasdeposited 3 years ago, how much was deposited if the interest is compounded (a) monthly(b) continuously?
7. If $5400 accumulates to $7486 in 5 years, what is the nominal annual rate if interest iscompounded (a) monthly, (b) continuously. (c) What is the effective rate?
8. If $8000 accumulates to $9576 in 2 years, what is the nominal annual rate if interest iscompounded (a) quarterly, (b) continuously. (c) What is the effective rate?
9. A department store issues its own credit card, with an interest rate of 2% per month. Explainwhy this is not the same as an annual rate of 24%. What is the effective annual rate?
10. Find the effective annual yield of a 6% annual rate, compounded continuously.
11. How long will it take $4300 to accumulate to $6000 at a nominal annual rate of 13% ifinterest is compounded (a) monthly (b) continuously?
12. How long will it take money to double at the nominal annual rate of 8% if interest iscompounded (a) daily (b) continuously?
13. Between December 1988 and December 1989, Brazil’s inflation rate was 1290% a year. (This means that between 1988 and 1989 prices increased by a factor of 1 + 12.90 = 13.90.)(a) What would an article which cost 1000 cruzados in 1988 cost in 1989?(b) What was Brazil’s monthly inflation rate during this period?
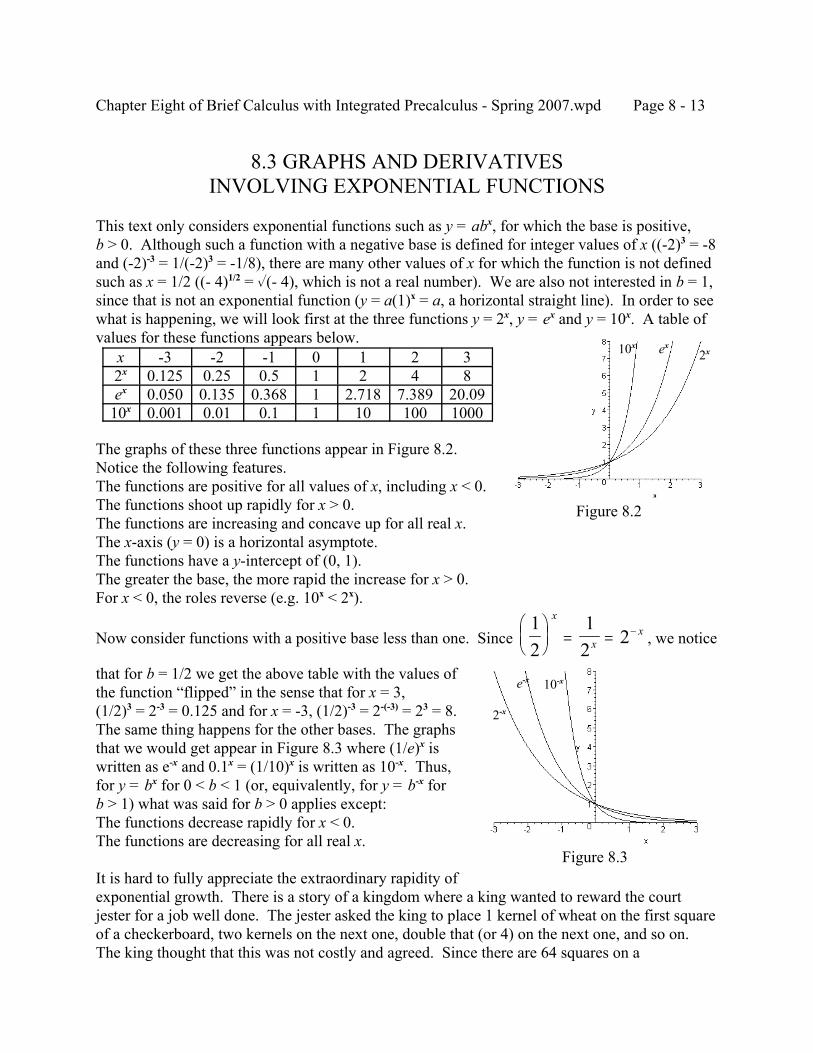
Chapter Eight of Brief Calculus with Integrated Precalculus - Spring 2007.wpd Page 8 - 13
Figure 8.2
Figure 8.3
8.3 GRAPHS AND DERIVATIVESINVOLVING EXPONENTIAL FUNCTIONS
This text only considers exponential functions such as y = abx, for which the base is positive,b > 0. Although such a function with a negative base is defined for integer values of x ((-2)3 = -8and (-2)-3 = 1/(-2)3 = -1/8), there are many other values of x for which the function is not definedsuch as x = 1/2 ((- 4)1/2 = %(- 4), which is not a real number). We are also not interested in b = 1,since that is not an exponential function (y = a(1)x = a, a horizontal straight line). In order to seewhat is happening, we will look first at the three functions y = 2x, y = ex and y = 10x. A table ofvalues for these functions appears below.
The graphs of these three functions appear in Figure 8.2.Notice the following features.The functions are positive for all values of x, including x < 0.The functions shoot up rapidly for x > 0.The functions are increasing and concave up for all real x.The x-axis (y = 0) is a horizontal asymptote.The functions have a y-intercept of (0, 1).The greater the base, the more rapid the increase for x > 0.For x < 0, the roles reverse (e.g. 10x < 2x).
Now consider functions with a positive base less than one. Since , we notice12
12
2
= = −
x
xx
that for b = 1/2 we get the above table with the values ofthe function “flipped” in the sense that for x = 3,(1/2)3 = 2-3 = 0.125 and for x = -3, (1/2)-3 = 2-(-3) = 23 = 8. The same thing happens for the other bases. The graphsthat we would get appear in Figure 8.3 where (1/e)x iswritten as e-x and 0.1x = (1/10)x is written as 10-x. Thus,for y = bx for 0 < b < 1 (or, equivalently, for y = b-x forb > 1) what was said for b > 0 applies except:The functions decrease rapidly for x < 0.The functions are decreasing for all real x.
It is hard to fully appreciate the extraordinary rapidity ofexponential growth. There is a story of a kingdom where a king wanted to reward the courtjester for a job well done. The jester asked the king to place 1 kernel of wheat on the first squareof a checkerboard, two kernels on the next one, double that (or 4) on the next one, and so on. The king thought that this was not costly and agreed. Since there are 64 squares on a
x -3 -2 -1 0 1 2 32x 0.125 0.25 0.5 1 2 4 8ex 0.050 0.135 0.368 1 2.718 7.389 20.09
10x 0.001 0.01 0.1 1 10 100 1000
10x ex 2x
2-x
e-x 10-x
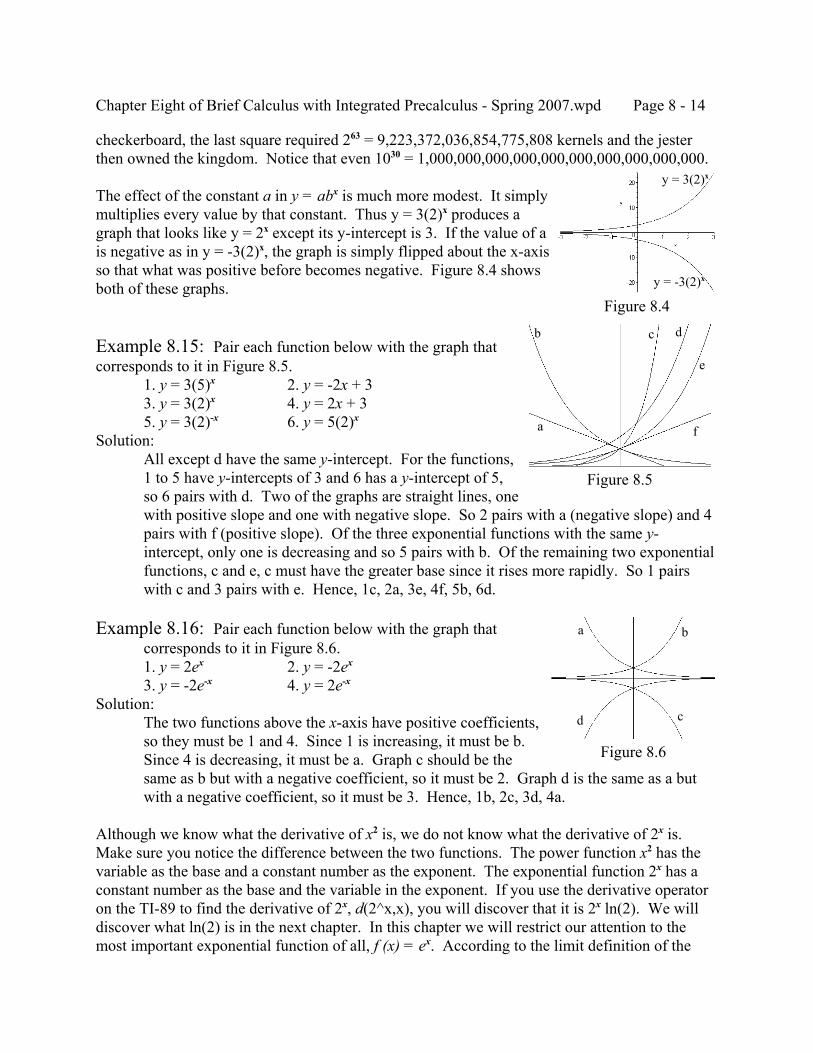
Chapter Eight of Brief Calculus with Integrated Precalculus - Spring 2007.wpd Page 8 - 14
Figure 8.4
Figure 8.5
Figure 8.6
checkerboard, the last square required 263 = 9,223,372,036,854,775,808 kernels and the jesterthen owned the kingdom. Notice that even 1030 = 1,000,000,000,000,000,000,000,000,000,000.
The effect of the constant a in y = abx is much more modest. It simplymultiplies every value by that constant. Thus y = 3(2)x produces agraph that looks like y = 2x except its y-intercept is 3. If the value of ais negative as in y = -3(2)x, the graph is simply flipped about the x-axisso that what was positive before becomes negative. Figure 8.4 showsboth of these graphs.
Example 8.15: Pair each function below with the graph thatcorresponds to it in Figure 8.5.
1. y = 3(5)x 2. y = -2x + 33. y = 3(2)x 4. y = 2x + 35. y = 3(2)-x 6. y = 5(2)x
Solution:All except d have the same y-intercept. For the functions,1 to 5 have y-intercepts of 3 and 6 has a y-intercept of 5,so 6 pairs with d. Two of the graphs are straight lines, onewith positive slope and one with negative slope. So 2 pairs with a (negative slope) and 4pairs with f (positive slope). Of the three exponential functions with the same y-intercept, only one is decreasing and so 5 pairs with b. Of the remaining two exponentialfunctions, c and e, c must have the greater base since it rises more rapidly. So 1 pairswith c and 3 pairs with e. Hence, 1c, 2a, 3e, 4f, 5b, 6d.
Example 8.16: Pair each function below with the graph thatcorresponds to it in Figure 8.6.1. y = 2ex 2. y = -2ex3. y = -2e-x 4. y = 2e-x
Solution:The two functions above the x-axis have positive coefficients,so they must be 1 and 4. Since 1 is increasing, it must be b. Since 4 is decreasing, it must be a. Graph c should be thesame as b but with a negative coefficient, so it must be 2. Graph d is the same as a butwith a negative coefficient, so it must be 3. Hence, 1b, 2c, 3d, 4a.
Although we know what the derivative of x2 is, we do not know what the derivative of 2x is. Make sure you notice the difference between the two functions. The power function x2 has thevariable as the base and a constant number as the exponent. The exponential function 2x has aconstant number as the base and the variable in the exponent. If you use the derivative operatoron the TI-89 to find the derivative of 2x, d(2^x,x), you will discover that it is 2x ln(2). We willdiscover what ln(2) is in the next chapter. In this chapter we will restrict our attention to themost important exponential function of all, f (x) = ex. According to the limit definition of the
y = 3(2)x
y = -3(2)x
b c d
e
a f
a b
d c
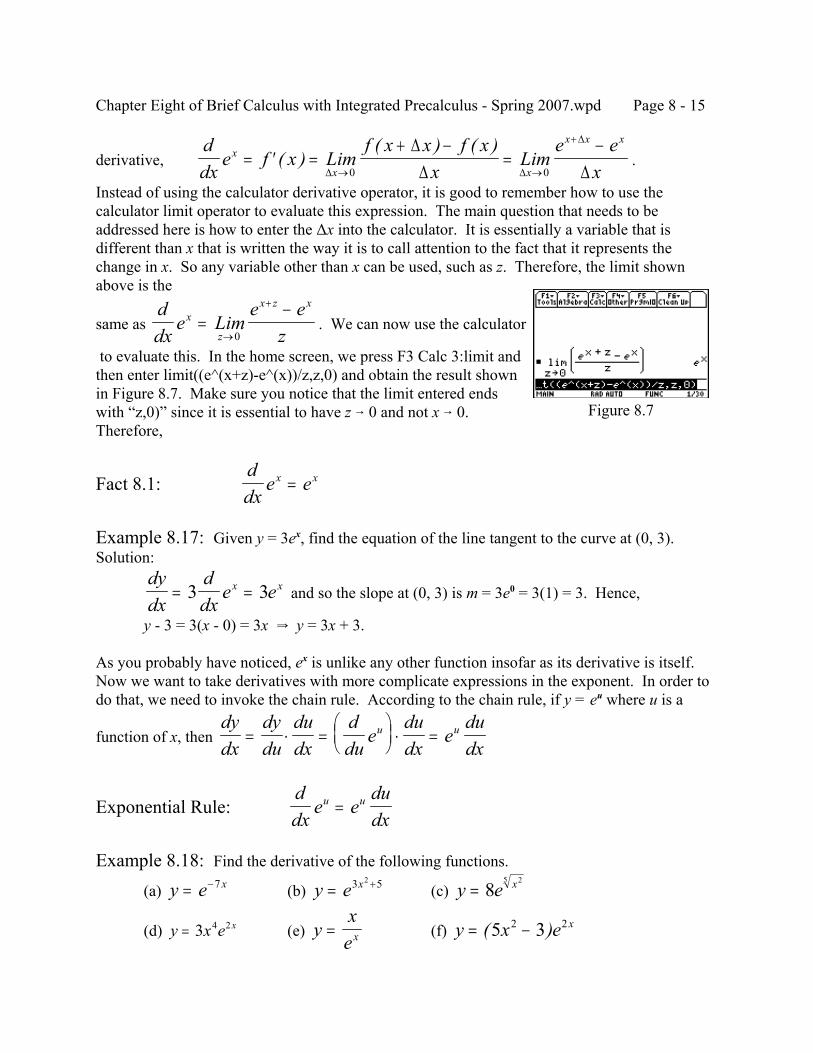
Chapter Eight of Brief Calculus with Integrated Precalculus - Spring 2007.wpd Page 8 - 15
Figure 8.7
derivative, .ddx
e f x Limf x x f x
xLim
e ex
x
x x
x x x
= ′ =+ −
=−
→ →
+
( )( ) ( )
∆ ∆
∆∆∆ ∆0 0
Instead of using the calculator derivative operator, it is good to remember how to use thecalculator limit operator to evaluate this expression. The main question that needs to beaddressed here is how to enter the ∆x into the calculator. It is essentially a variable that isdifferent than x that is written the way it is to call attention to the fact that it represents thechange in x. So any variable other than x can be used, such as z. Therefore, the limit shownabove is the
same as . We can now use the calculatorddx
e Lime e
zx
z
x z x
=−
→
+
0
to evaluate this. In the home screen, we press F3 Calc 3:limit andthen enter limit((e^(x+z)-e^(x))/z,z,0) and obtain the result shownin Figure 8.7. Make sure you notice that the limit entered endswith “z,0)” since it is essential to have z 6 0 and not x 6 0. Therefore,
Fact 8.1:ddx
e ex x=
Example 8.17: Given y = 3ex, find the equation of the line tangent to the curve at (0, 3).Solution:
and so the slope at (0, 3) is m = 3e0 = 3(1) = 3. Hence,dydx
ddx
e ex x= =3 3
y - 3 = 3(x - 0) = 3x Y y = 3x + 3.
As you probably have noticed, ex is unlike any other function insofar as its derivative is itself. Now we want to take derivatives with more complicate expressions in the exponent. In order todo that, we need to invoke the chain rule. According to the chain rule, if y = eu where u is a
function of x, then dydx
dydu
dudx
ddu
edudx
edudx
u u= ⋅ =
⋅ =
Exponential Rule:ddx
e edudx
u u=
Example 8.18: Find the derivative of the following functions.
(a) (b) (c) y e x= −7 y e x= +3 52
y e x= 825
(d) (e) (f) y x e x= 3 4 2 yxex= y x e x= −( )5 32 2
Chapter Eight of Brief Calculus with Integrated Precalculus - Spring 2007.wpd Page 8 - 16
Solution: (a) Since this is the first time the exponential rule is being illustrated, the function u will be
explicitly identified. In this problem we notice that -7x is the exponent. So u = -7x.
Hence, y = eu and . However,ddx
eddx
e edudx
eddx
x ex u u x x− − −= = = − = −7 7 77 7( )
we really want to think of the exponential rule as saying that, when you take thederivative of e raised to power that is an algebraic expression in x, the derivative is eraised to that exact same expression times the derivative of the expression. In this case,ddx
e eddx
x ex x x− − −= − = −7 7 77 7( )
(b)ddx
e eddx
x xex x x3 5 3 5 2 3 52 2 2
3 5 6+ + += + =( )
(c) ( )ddx
eddx
e eddx
x e xe
xx x x x
x
8 8 8 8165
25 25
25 2
52
5 35
25
25 35
= = = =−
(d) The product rule must be used in this problem since the expression in front of theexponential includes the variable x and is not just a constant.ddx
x e xddx
e eddx
x x eddx
x e x
x e x e x e x
x x x x x
x x x
3 3 3 3 2 12
6 12 6 2
4 2 4 2 2 4 4 2 2 3
4 2 3 2 3 2
= + = +
= + = +( ) (e) This problem can be done in two ways. One way is to use the quotient rule:
which is better if simplified asddx
xe
eddx
x xddx
e
ee xe
ex
x x
x
x x
x=−
=−
( )2 2
since .e x
ex
e
x
x x
( )1 12
−=
− ee e e
x
x x x x2 2
1 1= =−
The second way is to first write y = xe-x and then use the product rule.ddx
xe xddx
e eddx
x xeddx
x e
xe e
xe
x x x x x
x x x
− − − − −= + = − +
=−
+ =−
( )
1 1
Chapter Eight of Brief Calculus with Integrated Precalculus - Spring 2007.wpd Page 8 - 17
(f)ddx
x e xddx
e eddx
x
x eddx
x xe x e xe
x x x
x x x x
( ) ( ) ( )
( ) ( )
5 3 5 3 5 3
5 3 2 10 2 5 3 10
2 2 2 2 2 2
2 2 2 2 2 2
− = − + −
= − + = − +
(which does simplify to )e x x x x ex x2 2 2 22 5 3 10 10 10 6( ( ) ) ( )− + = + −
Example 8.19: Find the slope of the tangent line to y = (4 + e-3x)5 at x = 1.Solution:
The first rule that must be used is the general power rule.ddx
e eddx
e
e eddx
x e e
x x x
x x x x
( ) ( ) ( )
( ) ( ) ( )
4 5 4 4
5 4 3 15 4
3 5 3 4 3
3 4 3 3 4 3
+ = + +
= + − = − +
− − −
− − − −
(In general, when a problem starts with a negative expression in an exponent it is perfectly acceptable to leave an answer with negative expressions in the exponent.)So the slope at x = 1 is m = -15(4 + e-3)4e-3 is the answer if you do not have a calculator.That is, m = -200.88 if you can use the calculator. Of course, if you are allowed to usethe TI-89 the whole problem could have been done in one step:d((4+e^(-3x))^5,x)|x=1 provides the answer of -200.88.
Example 8.20: Use implicit differentiation to find dy/dx if ey +3x2 - y3 = 19.Solution:
edydx
x ydydx
edydx
ydydx
x
e ydydx
xdydx
xe y
y y
yy
+ − = ⇒ − = −
⇒ − = − ⇒ =−−
6 3 0 3 6
3 663
2 2
22( )
Example 8.21: If $3000 is invested at the nominal annual rate of 8.3% compoundedcontinuously, at what rate is the amount growing in 5 years?
Solution:If your instinct is to say the answer is 8.3% compounded continuously but then to askyourself whether there is something else involved, then it is a good instinct. As you thinkabout the problem somewhat more, you should eventually come to the thought that theproblem is not asking for a percentage rate of change. It is asking what the rate is interms of dollars per year at exactly 5 years from today. That is, the rate of change in theamount with respect to time, dA/dt. In order to answer the question we must rememberthat for continuous compounding A = Pert = 3000e0.083t. Therefore,
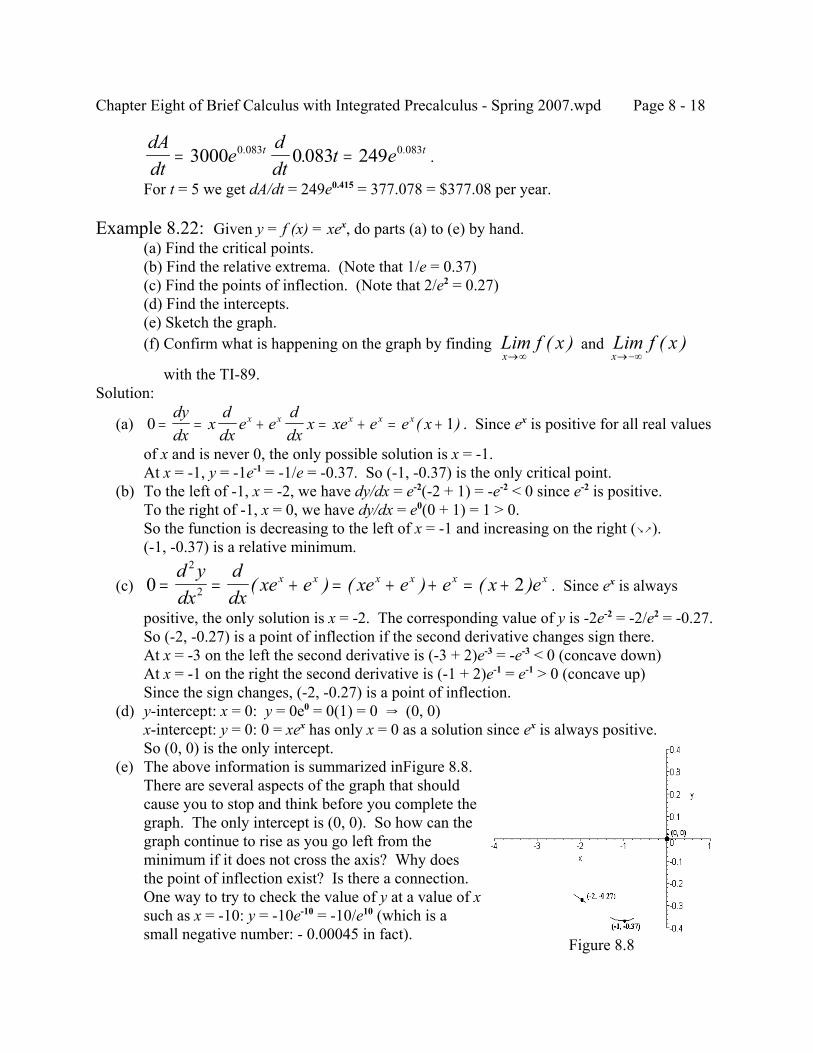
Chapter Eight of Brief Calculus with Integrated Precalculus - Spring 2007.wpd Page 8 - 18
Figure 8.8
.dAdt
eddt
t et t= =3000 0 083 2490 083 0 083. ..
For t = 5 we get dA/dt = 249e0.415 = 377.078 = $377.08 per year.
Example 8.22: Given y = f (x) = xex, do parts (a) to (e) by hand.(a) Find the critical points.(b) Find the relative extrema. (Note that 1/e = 0.37)(c) Find the points of inflection. (Note that 2/e2 = 0.27)(d) Find the intercepts.(e) Sketch the graph.(f) Confirm what is happening on the graph by finding and Lim f x
x→∞( ) Lim f x
x→−∞( )
with the TI-89.Solution:
(a) . Since ex is positive for all real values0 1= = + = + = +dydx
xddx
e eddx
x xe e e xx x x x x ( )
of x and is never 0, the only possible solution is x = -1.At x = -1, y = -1e-1 = -1/e = -0.37. So (-1, -0.37) is the only critical point.
(b) To the left of -1, x = -2, we have dy/dx = e-2(-2 + 1) = -e-2 < 0 since e-2 is positive.To the right of -1, x = 0, we have dy/dx = e0(0 + 1) = 1 > 0.So the function is decreasing to the left of x = -1 and increasing on the right (`_).(-1, -0.37) is a relative minimum.
(c) . Since ex is always0 22
2= = + = + + = +d ydx
ddx
xe e xe e e x ex x x x x x( ) ( ) ( )
positive, the only solution is x = -2. The corresponding value of y is -2e-2 = -2/e2 = -0.27.So (-2, -0.27) is a point of inflection if the second derivative changes sign there.At x = -3 on the left the second derivative is (-3 + 2)e-3 = -e-3 < 0 (concave down)At x = -1 on the right the second derivative is (-1 + 2)e-1 = e-1 > 0 (concave up)Since the sign changes, (-2, -0.27) is a point of inflection.
(d) y-intercept: x = 0: y = 0e0 = 0(1) = 0 Y (0, 0)x-intercept: y = 0: 0 = xex has only x = 0 as a solution since ex is always positive.So (0, 0) is the only intercept.
(e) The above information is summarized inFigure 8.8.There are several aspects of the graph that shouldcause you to stop and think before you complete thegraph. The only intercept is (0, 0). So how can thegraph continue to rise as you go left from theminimum if it does not cross the axis? Why doesthe point of inflection exist? Is there a connection. One way to try to check the value of y at a value of xsuch as x = -10: y = -10e-10 = -10/e10 (which is asmall negative number: - 0.00045 in fact).
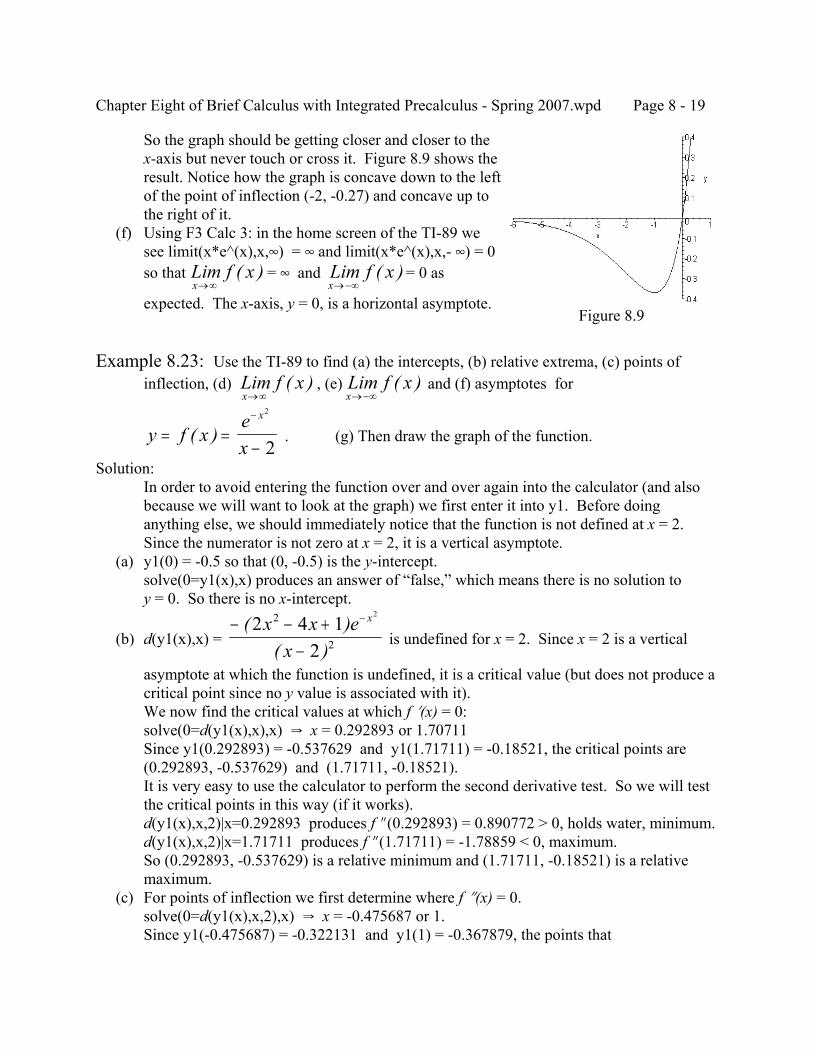
Chapter Eight of Brief Calculus with Integrated Precalculus - Spring 2007.wpd Page 8 - 19
Figure 8.9
So the graph should be getting closer and closer to thex-axis but never touch or cross it. Figure 8.9 shows theresult. Notice how the graph is concave down to the leftof the point of inflection (-2, -0.27) and concave up tothe right of it.
(f) Using F3 Calc 3: in the home screen of the TI-89 wesee limit(x*e^(x),x,4) = 4 and limit(x*e^(x),x,- 4) = 0so that = 4 and = 0 asLim f x
x→∞( ) Lim f x
x→−∞( )
expected. The x-axis, y = 0, is a horizontal asymptote.
Example 8.23: Use the TI-89 to find (a) the intercepts, (b) relative extrema, (c) points ofinflection, (d) , (e) and (f) asymptotes forLim f x
x→∞( ) Lim f x
x→−∞( )
. (g) Then draw the graph of the function.y f xex
x
= =−
−
( )2
2Solution:
In order to avoid entering the function over and over again into the calculator (and alsobecause we will want to look at the graph) we first enter it into y1. Before doinganything else, we should immediately notice that the function is not defined at x = 2. Since the numerator is not zero at x = 2, it is a vertical asymptote.
(a) y1(0) = -0.5 so that (0, -0.5) is the y-intercept.solve(0=y1(x),x) produces an answer of “false,” which means there is no solution toy = 0. So there is no x-intercept.
(b) d(y1(x),x) = is undefined for x = 2. Since x = 2 is a vertical− − +
−
−( )( )
2 4 12
2
2
2
x x ex
x
asymptote at which the function is undefined, it is a critical value (but does not produce acritical point since no y value is associated with it).We now find the critical values at which f N(x) = 0:solve(0=d(y1(x),x),x) Y x = 0.292893 or 1.70711Since y1(0.292893) = -0.537629 and y1(1.71711) = -0.18521, the critical points are(0.292893, -0.537629) and (1.71711, -0.18521).It is very easy to use the calculator to perform the second derivative test. So we will testthe critical points in this way (if it works).d(y1(x),x,2)|x=0.292893 produces f O(0.292893) = 0.890772 > 0, holds water, minimum.d(y1(x),x,2)|x=1.71711 produces f O(1.71711) = -1.78859 < 0, maximum.So (0.292893, -0.537629) is a relative minimum and (1.71711, -0.18521) is a relativemaximum.
(c) For points of inflection we first determine where f O(x) = 0.solve(0=d(y1(x),x,2),x) Y x = -0.475687 or 1.Since y1(-0.475687) = -0.322131 and y1(1) = -0.367879, the points that
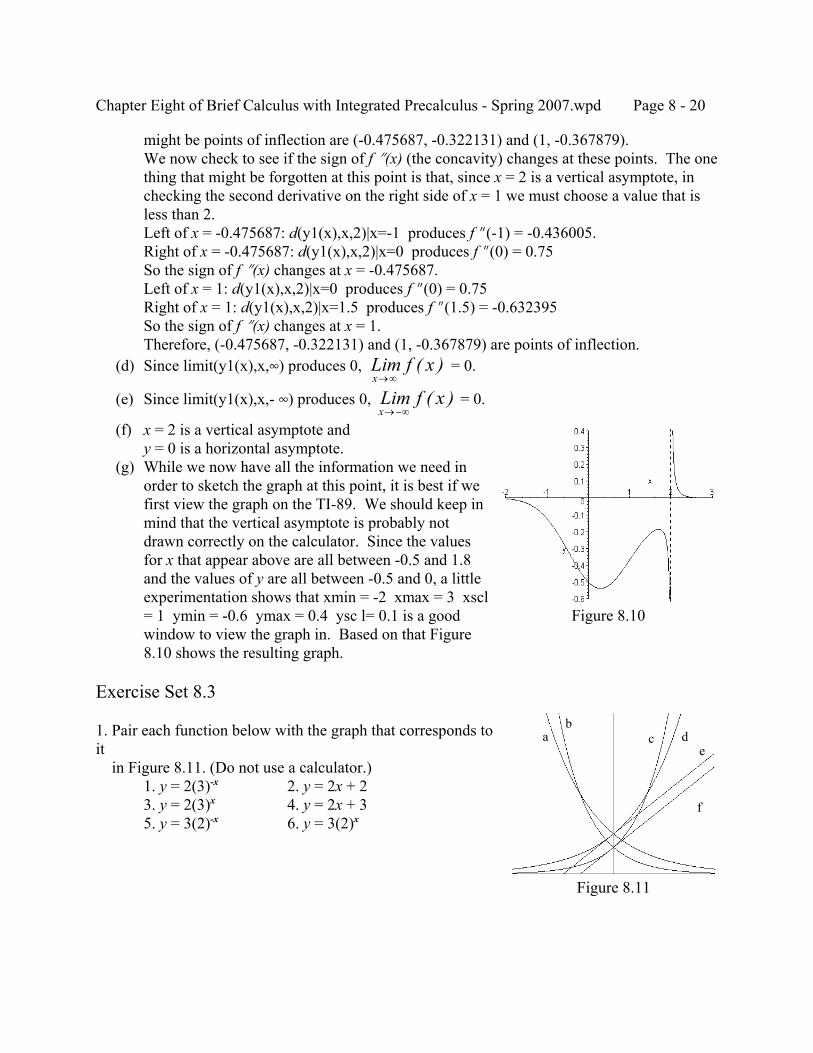
Chapter Eight of Brief Calculus with Integrated Precalculus - Spring 2007.wpd Page 8 - 20
Figure 8.10
Figure 8.11
might be points of inflection are (-0.475687, -0.322131) and (1, -0.367879).We now check to see if the sign of f O(x) (the concavity) changes at these points. The onething that might be forgotten at this point is that, since x = 2 is a vertical asymptote, inchecking the second derivative on the right side of x = 1 we must choose a value that isless than 2.Left of x = -0.475687: d(y1(x),x,2)|x=-1 produces f O(-1) = -0.436005.Right of x = -0.475687: d(y1(x),x,2)|x=0 produces f O(0) = 0.75So the sign of f O(x) changes at x = -0.475687.Left of x = 1: d(y1(x),x,2)|x=0 produces f O(0) = 0.75Right of x = 1: d(y1(x),x,2)|x=1.5 produces f O(1.5) = -0.632395So the sign of f O(x) changes at x = 1.Therefore, (-0.475687, -0.322131) and (1, -0.367879) are points of inflection.
(d) Since limit(y1(x),x,4) produces 0, = 0.Lim f xx→∞
( )
(e) Since limit(y1(x),x,- 4) produces 0, = 0.Lim f xx→−∞
( ) (f) x = 2 is a vertical asymptote and
y = 0 is a horizontal asymptote. (g) While we now have all the information we need in
order to sketch the graph at this point, it is best if wefirst view the graph on the TI-89. We should keep inmind that the vertical asymptote is probably notdrawn correctly on the calculator. Since the valuesfor x that appear above are all between -0.5 and 1.8and the values of y are all between -0.5 and 0, a littleexperimentation shows that xmin = -2 xmax = 3 xscl= 1 ymin = -0.6 ymax = 0.4 ysc l= 0.1 is a goodwindow to view the graph in. Based on that Figure8.10 shows the resulting graph.
Exercise Set 8.3
1. Pair each function below with the graph that corresponds toit in Figure 8.11. (Do not use a calculator.)
1. y = 2(3)-x 2. y = 2x + 23. y = 2(3)x 4. y = 2x + 35. y = 3(2)-x 6. y = 3(2)x
bda c
e
f
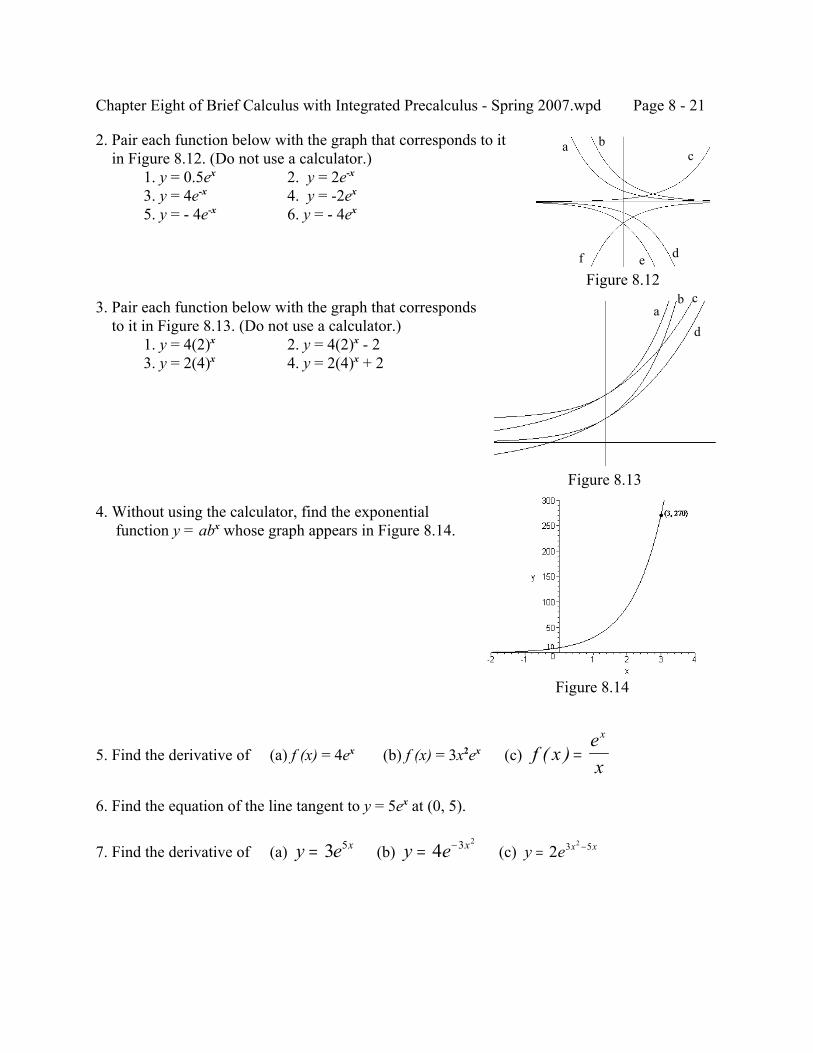
Chapter Eight of Brief Calculus with Integrated Precalculus - Spring 2007.wpd Page 8 - 21
Figure 8.12
Figure 8.13
Figure 8.14
2. Pair each function below with the graph that corresponds to it in Figure 8.12. (Do not use a calculator.)
1. y = 0.5ex 2. y = 2e-x3. y = 4e-x 4. y = -2ex5. y = - 4e-x 6. y = - 4ex
3. Pair each function below with the graph that corresponds to it in Figure 8.13. (Do not use a calculator.)
1. y = 4(2)x 2. y = 4(2)x - 23. y = 2(4)x 4. y = 2(4)x + 2
4. Without using the calculator, find the exponential function y = abx whose graph appears in Figure 8.14.
5. Find the derivative of (a) f (x) = 4ex (b) f (x) = 3x2ex (c) f xex
x
( ) =
6. Find the equation of the line tangent to y = 5ex at (0, 5).
7. Find the derivative of (a) (b) (c) y e x= 3 5 y e x= −4 3 2
y e x x= −2 3 52
ac
b
f e d
cba
d
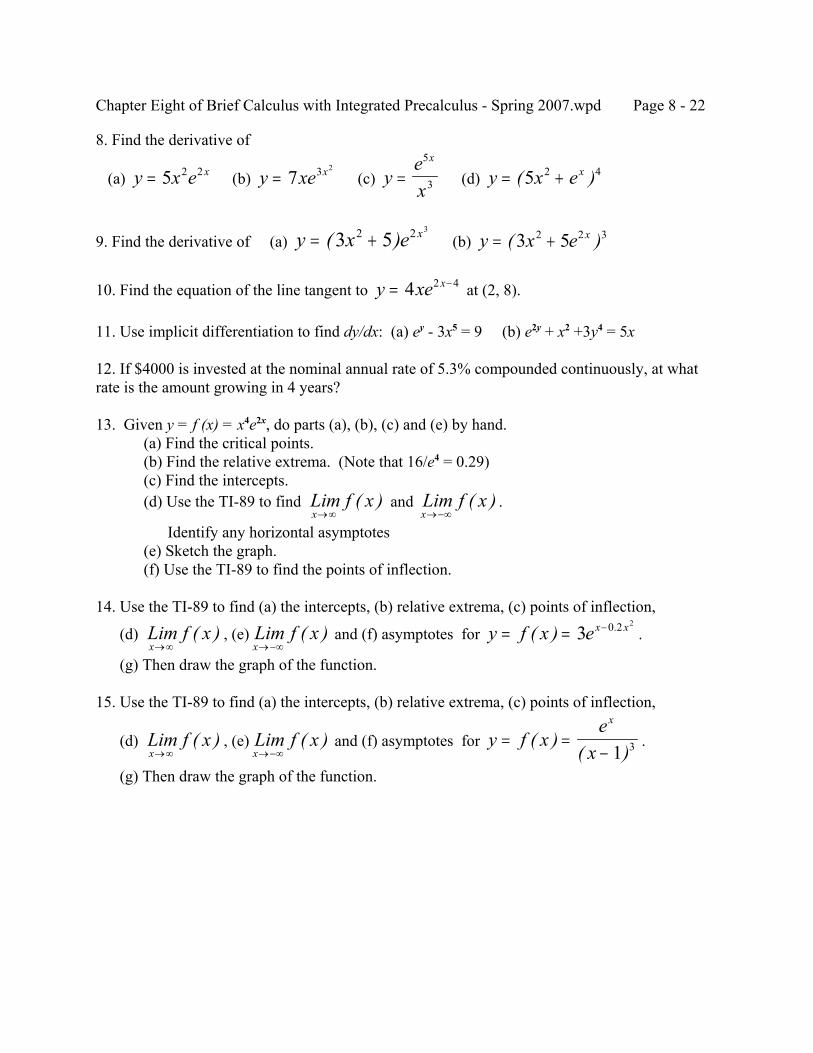
Chapter Eight of Brief Calculus with Integrated Precalculus - Spring 2007.wpd Page 8 - 22
8. Find the derivative of
(a) (b) (c) (d) y x e x= 5 2 2 y xe x= 7 3 2
yex
x
=5
3 y x ex= +( )5 2 4
9. Find the derivative of (a) (b) y x e x= +( )3 52 2 3
y x e x= +( )3 52 2 3
10. Find the equation of the line tangent to at (2, 8).y xe x= −4 2 4
11. Use implicit differentiation to find dy/dx: (a) ey - 3x5 = 9 (b) e2y + x2 +3y4 = 5x
12. If $4000 is invested at the nominal annual rate of 5.3% compounded continuously, at whatrate is the amount growing in 4 years?
13. Given y = f (x) = x4e2x, do parts (a), (b), (c) and (e) by hand.(a) Find the critical points.(b) Find the relative extrema. (Note that 16/e4 = 0.29)(c) Find the intercepts.(d) Use the TI-89 to find and .Lim f x
x→∞( ) Lim f x
x→−∞( )
Identify any horizontal asymptotes(e) Sketch the graph.(f) Use the TI-89 to find the points of inflection.
14. Use the TI-89 to find (a) the intercepts, (b) relative extrema, (c) points of inflection,
(d) , (e) and (f) asymptotes for .Lim f xx→∞
( ) Lim f xx→−∞
( ) y f x ex x= = −( ) .3 0 2 2
(g) Then draw the graph of the function.
15. Use the TI-89 to find (a) the intercepts, (b) relative extrema, (c) points of inflection,
(d) , (e) and (f) asymptotes for .Lim f xx→∞
( ) Lim f xx→−∞
( ) y f xe
x
x
= =−
( )( )1 3
(g) Then draw the graph of the function.
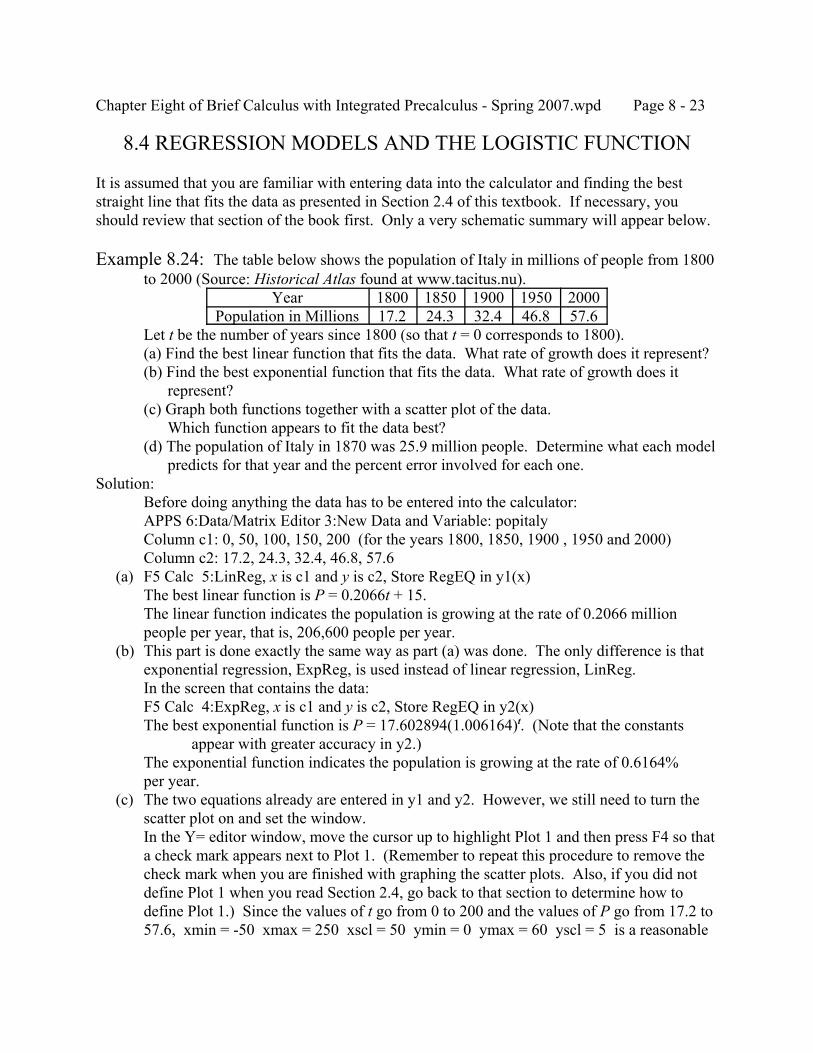
Chapter Eight of Brief Calculus with Integrated Precalculus - Spring 2007.wpd Page 8 - 23
8.4 REGRESSION MODELS AND THE LOGISTIC FUNCTION
It is assumed that you are familiar with entering data into the calculator and finding the beststraight line that fits the data as presented in Section 2.4 of this textbook. If necessary, youshould review that section of the book first. Only a very schematic summary will appear below.
Example 8.24: The table below shows the population of Italy in millions of people from 1800to 2000 (Source: Historical Atlas found at www.tacitus.nu).
Year 1800 1850 1900 1950 2000Population in Millions 17.2 24.3 32.4 46.8 57.6
Let t be the number of years since 1800 (so that t = 0 corresponds to 1800).(a) Find the best linear function that fits the data. What rate of growth does it represent?(b) Find the best exponential function that fits the data. What rate of growth does it represent?(c) Graph both functions together with a scatter plot of the data. Which function appears to fit the data best?(d) The population of Italy in 1870 was 25.9 million people. Determine what each model predicts for that year and the percent error involved for each one.
Solution:Before doing anything the data has to be entered into the calculator:APPS 6:Data/Matrix Editor 3:New Data and Variable: popitalyColumn c1: 0, 50, 100, 150, 200 (for the years 1800, 1850, 1900 , 1950 and 2000)Column c2: 17.2, 24.3, 32.4, 46.8, 57.6
(a) F5 Calc 5:LinReg, x is c1 and y is c2, Store RegEQ in y1(x)The best linear function is P = 0.2066t + 15.The linear function indicates the population is growing at the rate of 0.2066 millionpeople per year, that is, 206,600 people per year.
(b) This part is done exactly the same way as part (a) was done. The only difference is thatexponential regression, ExpReg, is used instead of linear regression, LinReg.In the screen that contains the data:F5 Calc 4:ExpReg, x is c1 and y is c2, Store RegEQ in y2(x)The best exponential function is P = 17.602894(1.006164)t. (Note that the constants
appear with greater accuracy in y2.)The exponential function indicates the population is growing at the rate of 0.6164%per year.
(c) The two equations already are entered in y1 and y2. However, we still need to turn thescatter plot on and set the window.In the Y= editor window, move the cursor up to highlight Plot 1 and then press F4 so thata check mark appears next to Plot 1. (Remember to repeat this procedure to remove thecheck mark when you are finished with graphing the scatter plots. Also, if you did notdefine Plot 1 when you read Section 2.4, go back to that section to determine how todefine Plot 1.) Since the values of t go from 0 to 200 and the values of P go from 17.2 to57.6, xmin = -50 xmax = 250 xscl = 50 ymin = 0 ymax = 60 yscl = 5 is a reasonable
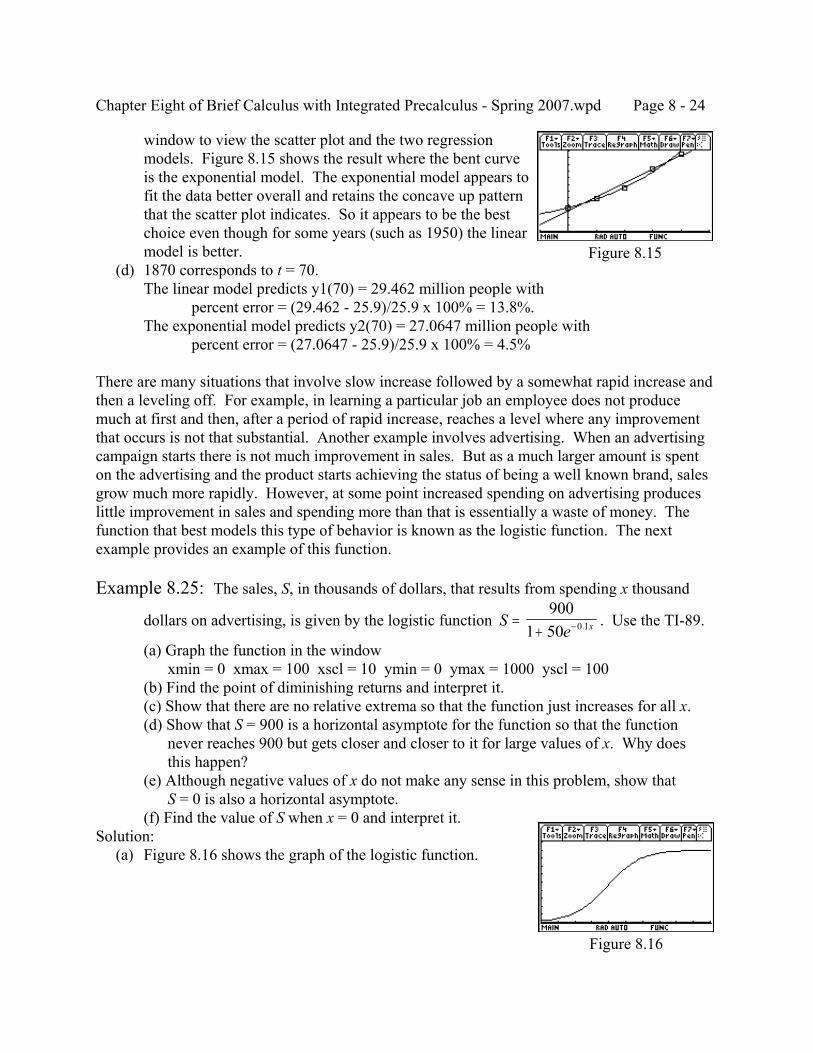
Chapter Eight of Brief Calculus with Integrated Precalculus - Spring 2007.wpd Page 8 - 24
Figure 8.15
Figure 8.16
window to view the scatter plot and the two regressionmodels. Figure 8.15 shows the result where the bent curveis the exponential model. The exponential model appears tofit the data better overall and retains the concave up patternthat the scatter plot indicates. So it appears to be the bestchoice even though for some years (such as 1950) the linearmodel is better.
(d) 1870 corresponds to t = 70.The linear model predicts y1(70) = 29.462 million people with
percent error = (29.462 - 25.9)/25.9 x 100% = 13.8%.The exponential model predicts y2(70) = 27.0647 million people with
percent error = (27.0647 - 25.9)/25.9 x 100% = 4.5%
There are many situations that involve slow increase followed by a somewhat rapid increase andthen a leveling off. For example, in learning a particular job an employee does not producemuch at first and then, after a period of rapid increase, reaches a level where any improvementthat occurs is not that substantial. Another example involves advertising. When an advertisingcampaign starts there is not much improvement in sales. But as a much larger amount is spenton the advertising and the product starts achieving the status of being a well known brand, salesgrow much more rapidly. However, at some point increased spending on advertising produceslittle improvement in sales and spending more than that is essentially a waste of money. Thefunction that best models this type of behavior is known as the logistic function. The nextexample provides an example of this function.
Example 8.25: The sales, S, in thousands of dollars, that results from spending x thousand
dollars on advertising, is given by the logistic function . Use the TI-89.Se x=
+ −
9001 50 0 1.
(a) Graph the function in the window xmin = 0 xmax = 100 xscl = 10 ymin = 0 ymax = 1000 yscl = 100(b) Find the point of diminishing returns and interpret it.(c) Show that there are no relative extrema so that the function just increases for all x.(d) Show that S = 900 is a horizontal asymptote for the function so that the function never reaches 900 but gets closer and closer to it for large values of x. Why does this happen?(e) Although negative values of x do not make any sense in this problem, show that S = 0 is also a horizontal asymptote.(f) Find the value of S when x = 0 and interpret it.
Solution: (a) Figure 8.16 shows the graph of the logistic function.
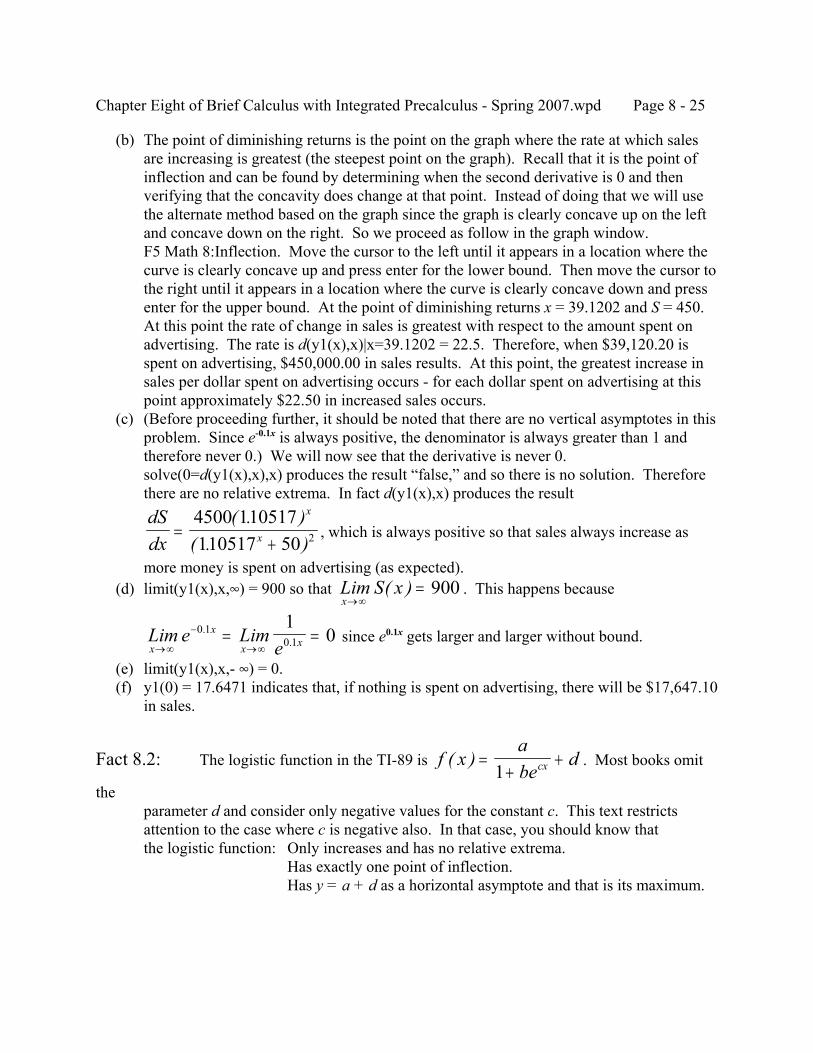
Chapter Eight of Brief Calculus with Integrated Precalculus - Spring 2007.wpd Page 8 - 25
(b) The point of diminishing returns is the point on the graph where the rate at which salesare increasing is greatest (the steepest point on the graph). Recall that it is the point ofinflection and can be found by determining when the second derivative is 0 and thenverifying that the concavity does change at that point. Instead of doing that we will usethe alternate method based on the graph since the graph is clearly concave up on the leftand concave down on the right. So we proceed as follow in the graph window.F5 Math 8:Inflection. Move the cursor to the left until it appears in a location where thecurve is clearly concave up and press enter for the lower bound. Then move the cursor tothe right until it appears in a location where the curve is clearly concave down and pressenter for the upper bound. At the point of diminishing returns x = 39.1202 and S = 450. At this point the rate of change in sales is greatest with respect to the amount spent onadvertising. The rate is d(y1(x),x)|x=39.1202 = 22.5. Therefore, when $39,120.20 isspent on advertising, $450,000.00 in sales results. At this point, the greatest increase insales per dollar spent on advertising occurs - for each dollar spent on advertising at thispoint approximately $22.50 in increased sales occurs.
(c) (Before proceeding further, it should be noted that there are no vertical asymptotes in thisproblem. Since e-0.1x is always positive, the denominator is always greater than 1 andtherefore never 0.) We will now see that the derivative is never 0.solve(0=d(y1(x),x),x) produces the result “false,” and so there is no solution. Thereforethere are no relative extrema. In fact d(y1(x),x) produces the result
, which is always positive so that sales always increase asdSdx
x
x=+
4500 110517110517 50 2
( . )( . )
more money is spent on advertising (as expected). (d) limit(y1(x),x,4) = 900 so that . This happens becauseLim S x
x→∞=( ) 900
since e0.1x gets larger and larger without bound.Lim e Limex
x
x x→∞
−
→∞= =0 1
0 1
10.
.
(e) limit(y1(x),x,- 4) = 0. (f) y1(0) = 17.6471 indicates that, if nothing is spent on advertising, there will be $17,647.10
in sales.
Fact 8.2: The logistic function in the TI-89 is . Most books omitf xabe
dcx( ) =+
+1
theparameter d and consider only negative values for the constant c. This text restrictsattention to the case where c is negative also. In that case, you should know thatthe logistic function: Only increases and has no relative extrema.
Has exactly one point of inflection.Has y = a + d as a horizontal asymptote and that is its maximum.
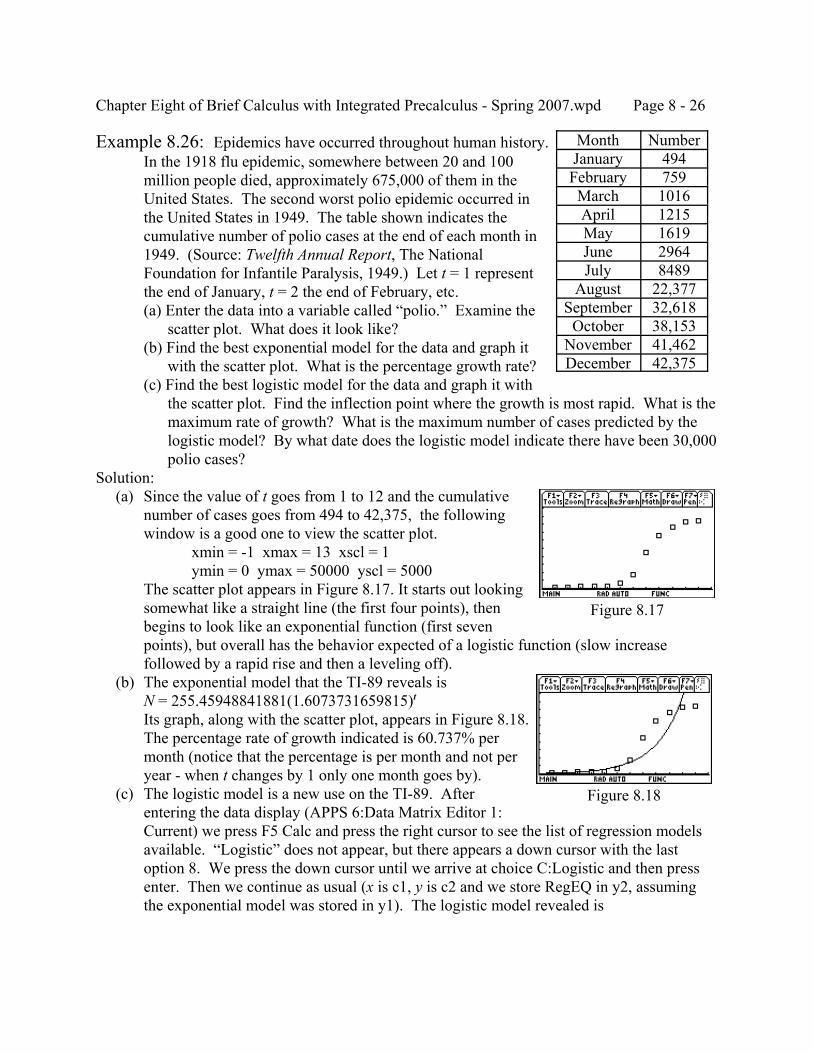
Chapter Eight of Brief Calculus with Integrated Precalculus - Spring 2007.wpd Page 8 - 26
Figure 8.17
Figure 8.18
Example 8.26: Epidemics have occurred throughout human history.In the 1918 flu epidemic, somewhere between 20 and 100million people died, approximately 675,000 of them in theUnited States. The second worst polio epidemic occurred inthe United States in 1949. The table shown indicates thecumulative number of polio cases at the end of each month in1949. (Source: Twelfth Annual Report, The NationalFoundation for Infantile Paralysis, 1949.) Let t = 1 representthe end of January, t = 2 the end of February, etc.(a) Enter the data into a variable called “polio.” Examine the scatter plot. What does it look like?(b) Find the best exponential model for the data and graph it with the scatter plot. What is the percentage growth rate?(c) Find the best logistic model for the data and graph it with the scatter plot. Find the inflection point where the growth is most rapid. What is the maximum rate of growth? What is the maximum number of cases predicted by the logistic model? By what date does the logistic model indicate there have been 30,000 polio cases?
Solution: (a) Since the value of t goes from 1 to 12 and the cumulative
number of cases goes from 494 to 42,375, the followingwindow is a good one to view the scatter plot.
xmin = -1 xmax = 13 xscl = 1ymin = 0 ymax = 50000 yscl = 5000
The scatter plot appears in Figure 8.17. It starts out lookingsomewhat like a straight line (the first four points), thenbegins to look like an exponential function (first sevenpoints), but overall has the behavior expected of a logistic function (slow increasefollowed by a rapid rise and then a leveling off).
(b) The exponential model that the TI-89 reveals isN = 255.45948841881(1.6073731659815)tIts graph, along with the scatter plot, appears in Figure 8.18.The percentage rate of growth indicated is 60.737% permonth (notice that the percentage is per month and not peryear - when t changes by 1 only one month goes by).
(c) The logistic model is a new use on the TI-89. Afterentering the data display (APPS 6:Data Matrix Editor 1:Current) we press F5 Calc and press the right cursor to see the list of regression modelsavailable. “Logistic” does not appear, but there appears a down cursor with the lastoption 8. We press the down cursor until we arrive at choice C:Logistic and then pressenter. Then we continue as usual (x is c1, y is c2 and we store RegEQ in y2, assumingthe exponential model was stored in y1). The logistic model revealed is
Month NumberJanuary 494February 759March 1016April 1215May 1619June 2964July 8489
August 22,377September 32,618
October 38,153November 41,462December 42,375
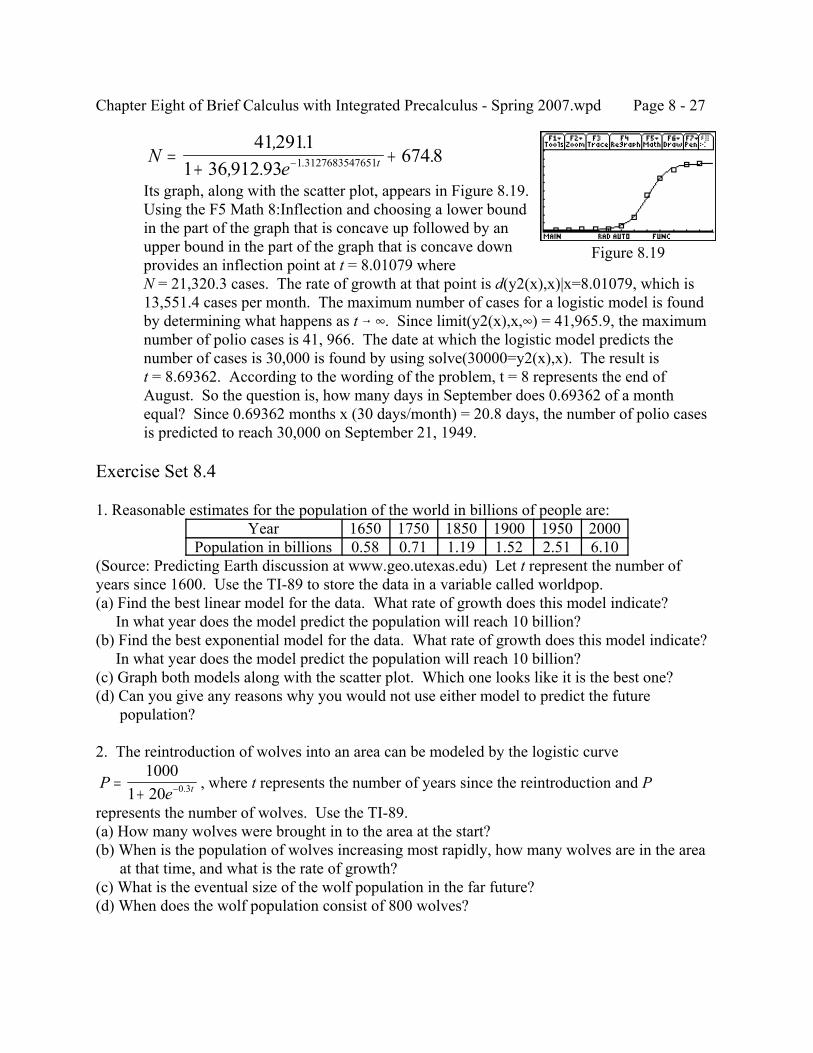
Chapter Eight of Brief Calculus with Integrated Precalculus - Spring 2007.wpd Page 8 - 27
Figure 8.19
Ne t=
++−
4129111 36 912 93
674 81 3127683547651
, ., .
..
Its graph, along with the scatter plot, appears in Figure 8.19.Using the F5 Math 8:Inflection and choosing a lower boundin the part of the graph that is concave up followed by anupper bound in the part of the graph that is concave downprovides an inflection point at t = 8.01079 whereN = 21,320.3 cases. The rate of growth at that point is d(y2(x),x)|x=8.01079, which is13,551.4 cases per month. The maximum number of cases for a logistic model is foundby determining what happens as t 6 4. Since limit(y2(x),x,4) = 41,965.9, the maximumnumber of polio cases is 41, 966. The date at which the logistic model predicts thenumber of cases is 30,000 is found by using solve(30000=y2(x),x). The result ist = 8.69362. According to the wording of the problem, t = 8 represents the end ofAugust. So the question is, how many days in September does 0.69362 of a monthequal? Since 0.69362 months x (30 days/month) = 20.8 days, the number of polio casesis predicted to reach 30,000 on September 21, 1949.
Exercise Set 8.4
1. Reasonable estimates for the population of the world in billions of people are:Year 1650 1750 1850 1900 1950 2000
Population in billions 0.58 0.71 1.19 1.52 2.51 6.10(Source: Predicting Earth discussion at www.geo.utexas.edu) Let t represent the number ofyears since 1600. Use the TI-89 to store the data in a variable called worldpop.(a) Find the best linear model for the data. What rate of growth does this model indicate? In what year does the model predict the population will reach 10 billion?(b) Find the best exponential model for the data. What rate of growth does this model indicate? In what year does the model predict the population will reach 10 billion?(c) Graph both models along with the scatter plot. Which one looks like it is the best one?(d) Can you give any reasons why you would not use either model to predict the future population?
2. The reintroduction of wolves into an area can be modeled by the logistic curve
, where t represents the number of years since the reintroduction and PPe t=
+ −
10001 20 0 3.
represents the number of wolves. Use the TI-89.(a) How many wolves were brought in to the area at the start?(b) When is the population of wolves increasing most rapidly, how many wolves are in the area at that time, and what is the rate of growth?(c) What is the eventual size of the wolf population in the far future?(d) When does the wolf population consist of 800 wolves?
Chapter Eight of Brief Calculus with Integrated Precalculus - Spring 2007.wpd Page 8 - 28
3. The first example of this section looked at the population of Italy overa relatively long period of time. In the past, many dire predictions weremade based on the fact that the population of the world was growingexponentially. Exercise 1 is an example of that reasoning. It isinstructive to examine the population of a developed country in therecent past to see whether or not it might be reasonable to change themodel for population growth. The following table provides informationconcerning the population of Italy since 1900. (Source: Historical Atlasfound at www.tacitus.nu) Enter the data into the variable popit2 on theTI-89. Use t = 0 for the year 1900.(a) What is the exponential model for the data? What rate of growthdoes it suggest?(b) What is the logistic model for the data? What does it predict to bethe eventual population of Italy?(c) Graph both models together with the scatter plot for the data. Which model appears to be thebetter model and why?
4. In the previous exercise we saw that in a developed country such as Italy there seemed to be aleveling off in the population characteristic of a logistic function. In fact, if we look at thepopulation it actually decreased slightly between 1990 and 2000. This has led some people tobelieve that as the rest of the world becomes more developed, the world population will alsodisplay the characteristics of a logistic model. Assuming this turned out to be correct:(a) What is the logistic model for the data presented in Exercise 1 that should already be in yourcalculator in the variable worldpop?(b) In what year does the model predict the world population will be 10 billion people?(c) What is the eventual population of the world in the long run?(Hint: APPS 6:Data Matrix Editor 2:Open Down cursor to variable, Right cursor then cursordown to worldpop and then enter retrieves the data.)
Year Populationin Millions
1900 32.41910 34.41920 36.41930 40.91940 44.51950 46.81960 50.21970 53.81980 56.41990 57.72000 57.6
Chapter Nine of Brief Calculus with Integrated Precalculus - Spring 2007.wpd Page 9 - 1
CHAPTER NINELOGARITHMIC FUNCTIONS
9.1 INVERSE FUNCTIONS
It is usually the case that every question has what might be called an inverse question. Forexample, one common question is: What is the monthly payment for a $400,000 mortgage on ahouse? The inverse question type is: If $2000 is the maximum possible monthly payment thatcan be made, what is the maximum mortgage possible on a house? The mathematical approachto this problem involves finding the inverse of a function. The inverse of the function f (x) isdesignated as f -1(x). This does NOT mean 1/f (x). There is a restriction on the types of functionsthat can have inverses as will be seen in the second example below. But first the basic idea of aninverse function will be illustrated by the next example.
Example 9.1: What is f -1(x) if f (x) = x3?Solution:
The definition of f -1(x) should take into account the following.Since f (2) = 23 = 8, f -1(8) should equal 2. Notice that f -1(8) = f -1(f (2)) = 2.Since f (3) = 33 = 27, f -1(27) should equal 3. Notice that f -1(27) = f -1(f (3)) = 3.Since f (4) = 43 = 64, f -1(64) should equal 4. Notice that f -1(64) = f -1(f (4)) = 4.Since f (-2) = (-2)3 = -8, f -1(-8) should equal -2. Notice that f -1(-8) = f -1(f (-2)) = -2.Since f (-3) = (-3)3 = -27, f -1(-27) should equal -3. Notice that f -1(-27) = f -1(f (-3)) = -3.
As can be seen, .f x x− =1 3( )The fact that f -1(f (x)) = x is simply stating in a formal way something that you already
know: .f f x f x x x− −= = =1 1 3 33( ( )) ( )Notice that it is also true that .f f f f( ( )) ( ) ( )− = = = =1 3 38 8 2 2 8That is, for any value of x, .f f x f x x x( ( )) ( ) ( )− = = =1 3 3 3
Calling f -1(x) by another name does not change anything. That is, if andg x x( ) = 3
f (x) = x3, then g(x) is the inverse of f (x) BECAUSE g(f (x)) = f (g(x)) = x. It is also truethat f (x) is the inverse of g(x) for the very same reason.
Example 9.2: Why does f (x) = x2 not have an inverse if all real values of x are allowed but itdoes have an inverse if only nonnegative values are allowed? What is the inverse if onlynonnegative values of x are allowed?
Solution:A function can have only one value for each value of x that is possible. For example, iff (x) is a function, then f (2) cannot equal 7 and also equal 11. The implications of thisfact for the current example stems from the fact that f (2) = 22 = 4 and f (-2) = (-2)2 = 4.So if f -1(4) can have only one value, should it be 2 or -2? If you selected 2, then
Chapter Nine of Brief Calculus with Integrated Precalculus - Spring 2007.wpd Page 9 - 2
f -1(f (-2)) = f -1(4) = 2 does not equal -2, which it should in order to be an inversefunction. If you selected -2, then f -1(f (2)) = f -1(4) = -2 does not equal 2, which it shouldin order to be an inverse function. However, if only nonnegative values of x are allowedfor the function f (x) = x2, then is the inverse since we know thatf x x− =1( )
only for nonnegative values of x. Likewise,f f x f x x x( ( )) ( ) ( )− = = =1 2
only for nonnegative values of x.f f x f x x x− −= = =1 1 2 2( ( )) ( )
As was seen in the previous example, an inverse function for f (x) does not exist if there are twovalues of x, x = a and x = b, a … b, for which f (a) = f (b) = c. The reason is that f -1(c) cannotequal both a and b at the same time.
One-to-One Function: A function for which f (a) … f (b) if a … b.
Inverse Function: If f (x) is a one-to-one function, then the inverse function, denoted byf -1(x), is the function such that f -1(f (x)) = f (f -1(x)) = x.
Example 9.3: Verify g(x) = is the inverse of f (x) = 2x - 3.x + 3
2Solution:
We need to show that g(f (x)) = f (g(x)) = x.
g(f (x)) = andg xx x
x( )( )
2 32 3 3
222
− =− +
= =
f (g(x)) = .fx x
x x+
=
+
− = + − =
32
23
23 3 3( )
Method for Finding f -1(x): Solve f (x) = y for x.Replace y by x and x by y.
Example 9.4: Find the inverse of f (x) = 5x + 7.Solution:
5x + 7 = y Y 5x = y - 7 Y Y xy
=− 75
f xx− =−1 75
( )
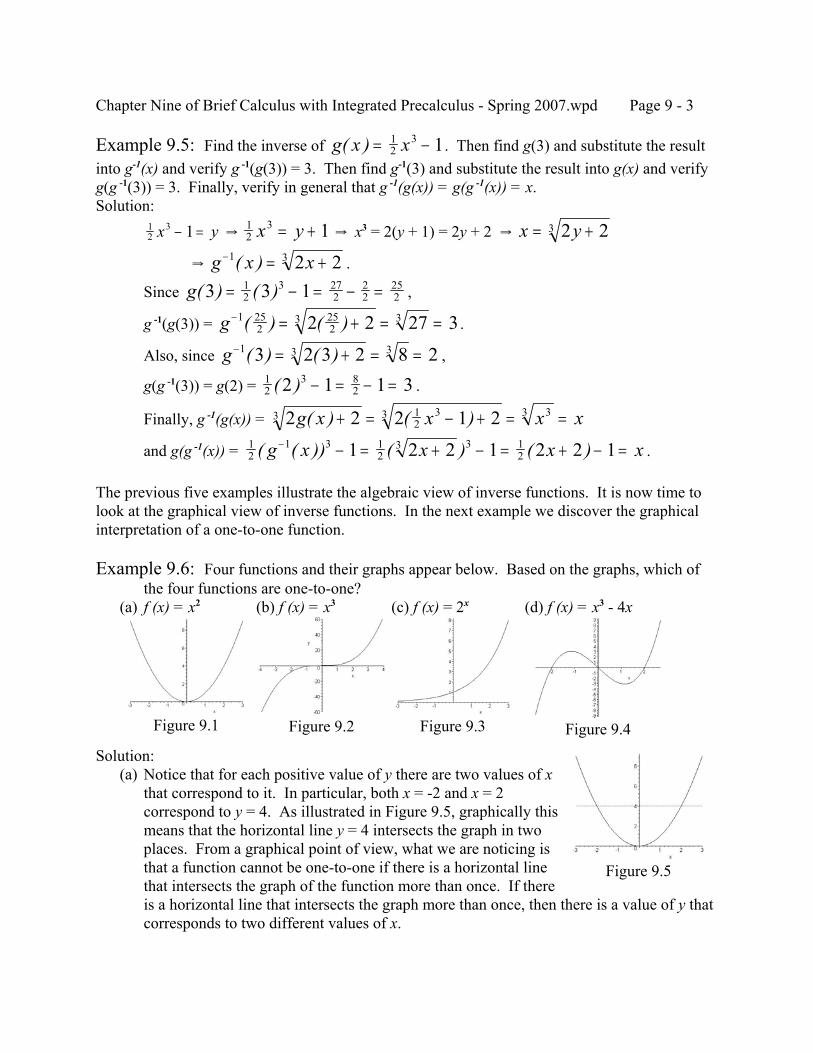
Chapter Nine of Brief Calculus with Integrated Precalculus - Spring 2007.wpd Page 9 - 3
Figure 9.1 Figure 9.2 Figure 9.3 Figure 9.4
Figure 9.5
Example 9.5: Find the inverse of . Then find g(3) and substitute the resultg x x( ) = −12
3 1into g-1(x) and verify g -1(g(3)) = 3. Then find g-1(3) and substitute the result into g(x) and verify g(g -1(3)) = 3. Finally, verify in general that g -1(g(x)) = g(g -1(x)) = x.Solution:
Y Y x3 = 2(y + 1) = 2y + 2 Y 12
3 1x y− = 12
3 1x y= + x y= +2 23
Y .g x x− = +1 3 2 2( )Since ,g( ) ( )3 3 11
23 27
222
252= − = − =
g -1(g(3)) = .g− = + = =1 252
252
3 32 2 27 3( ) ( )Also, since ,g− = + = =1 3 33 2 3 2 8 2( ) ( )g(g -1(3)) = g(2) = .1
23 8
22 1 1 3( ) − = − =
Finally, g -1(g(x)) = 2 2 2 1 23 12
33 33g x x x x( ) ( )+ = − + = =
and g(g -1(x)) = .12
1 3 12
3 3 121 2 2 1 2 2 1( ( )) ( ) ( )g x x x x− − = + − = + − =
The previous five examples illustrate the algebraic view of inverse functions. It is now time tolook at the graphical view of inverse functions. In the next example we discover the graphicalinterpretation of a one-to-one function.
Example 9.6: Four functions and their graphs appear below. Based on the graphs, which ofthe four functions are one-to-one?
(a) f (x) = x2 (b) f (x) = x3 (c) f (x) = 2x (d) f (x) = x3 - 4x
Solution: (a) Notice that for each positive value of y there are two values of x
that correspond to it. In particular, both x = -2 and x = 2correspond to y = 4. As illustrated in Figure 9.5, graphically thismeans that the horizontal line y = 4 intersects the graph in twoplaces. From a graphical point of view, what we are noticing isthat a function cannot be one-to-one if there is a horizontal linethat intersects the graph of the function more than once. If thereis a horizontal line that intersects the graph more than once, then there is a value of y thatcorresponds to two different values of x.
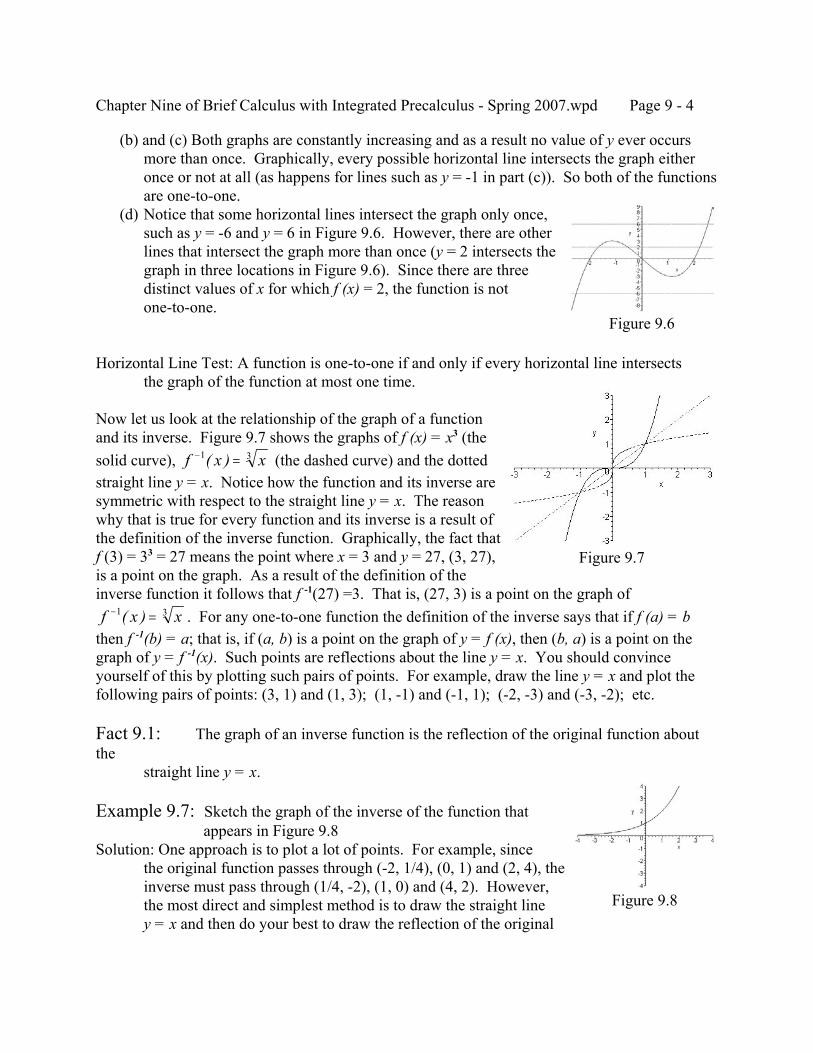
Chapter Nine of Brief Calculus with Integrated Precalculus - Spring 2007.wpd Page 9 - 4
Figure 9.6
Figure 9.7
Figure 9.8
(b) and (c) Both graphs are constantly increasing and as a result no value of y ever occursmore than once. Graphically, every possible horizontal line intersects the graph eitheronce or not at all (as happens for lines such as y = -1 in part (c)). So both of the functionsare one-to-one.
(d) Notice that some horizontal lines intersect the graph only once,such as y = -6 and y = 6 in Figure 9.6. However, there are otherlines that intersect the graph more than once (y = 2 intersects thegraph in three locations in Figure 9.6). Since there are threedistinct values of x for which f (x) = 2, the function is notone-to-one.
Horizontal Line Test: A function is one-to-one if and only if every horizontal line intersectsthe graph of the function at most one time.
Now let us look at the relationship of the graph of a functionand its inverse. Figure 9.7 shows the graphs of f (x) = x3 (thesolid curve), (the dashed curve) and the dottedf x x− =1 3( )straight line y = x. Notice how the function and its inverse aresymmetric with respect to the straight line y = x. The reasonwhy that is true for every function and its inverse is a result ofthe definition of the inverse function. Graphically, the fact thatf (3) = 33 = 27 means the point where x = 3 and y = 27, (3, 27),is a point on the graph. As a result of the definition of theinverse function it follows that f -1(27) =3. That is, (27, 3) is a point on the graph of
. For any one-to-one function the definition of the inverse says that if f (a) = bf x x− =1 3( )then f -1(b) = a; that is, if (a, b) is a point on the graph of y = f (x), then (b, a) is a point on thegraph of y = f -1(x). Such points are reflections about the line y = x. You should convinceyourself of this by plotting such pairs of points. For example, draw the line y = x and plot thefollowing pairs of points: (3, 1) and (1, 3); (1, -1) and (-1, 1); (-2, -3) and (-3, -2); etc.
Fact 9.1: The graph of an inverse function is the reflection of the original function aboutthe
straight line y = x.
Example 9.7: Sketch the graph of the inverse of the function that appears in Figure 9.8
Solution: One approach is to plot a lot of points. For example, sincethe original function passes through (-2, 1/4), (0, 1) and (2, 4), theinverse must pass through (1/4, -2), (1, 0) and (4, 2). However,the most direct and simplest method is to draw the straight liney = x and then do your best to draw the reflection of the original
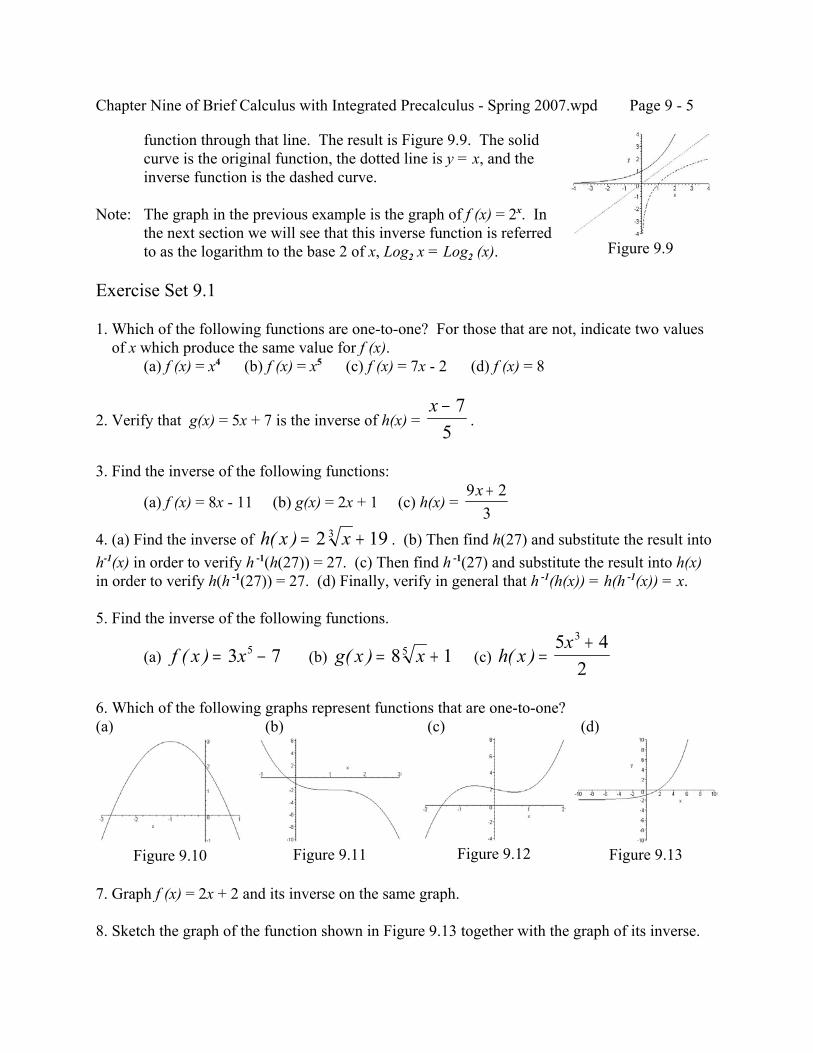
Chapter Nine of Brief Calculus with Integrated Precalculus - Spring 2007.wpd Page 9 - 5
Figure 9.9
Figure 9.11Figure 9.10 Figure 9.12 Figure 9.13
function through that line. The result is Figure 9.9. The solidcurve is the original function, the dotted line is y = x, and theinverse function is the dashed curve.
Note: The graph in the previous example is the graph of f (x) = 2x. Inthe next section we will see that this inverse function is referredto as the logarithm to the base 2 of x, Log2 x = Log2 (x).
Exercise Set 9.1
1. Which of the following functions are one-to-one? For those that are not, indicate two values of x which produce the same value for f (x).
(a) f (x) = x4 (b) f (x) = x5 (c) f (x) = 7x - 2 (d) f (x) = 8
2. Verify that g(x) = 5x + 7 is the inverse of h(x) = .x − 7
5
3. Find the inverse of the following functions:
(a) f (x) = 8x - 11 (b) g(x) = 2x + 1 (c) h(x) = 9 2
3x +
4. (a) Find the inverse of . (b) Then find h(27) and substitute the result intoh x x( ) = +2 193
h-1(x) in order to verify h -1(h(27)) = 27. (c) Then find h -1(27) and substitute the result into h(x)in order to verify h(h -1(27)) = 27. (d) Finally, verify in general that h -1(h(x)) = h(h -1(x)) = x.
5. Find the inverse of the following functions.
(a) (b) (c) f x x( ) = −3 75 g x x( ) = +8 15 h xx
( ) =+5 4
2
3
6. Which of the following graphs represent functions that are one-to-one?(a) (b) (c) (d)
7. Graph f (x) = 2x + 2 and its inverse on the same graph.
8. Sketch the graph of the function shown in Figure 9.13 together with the graph of its inverse.
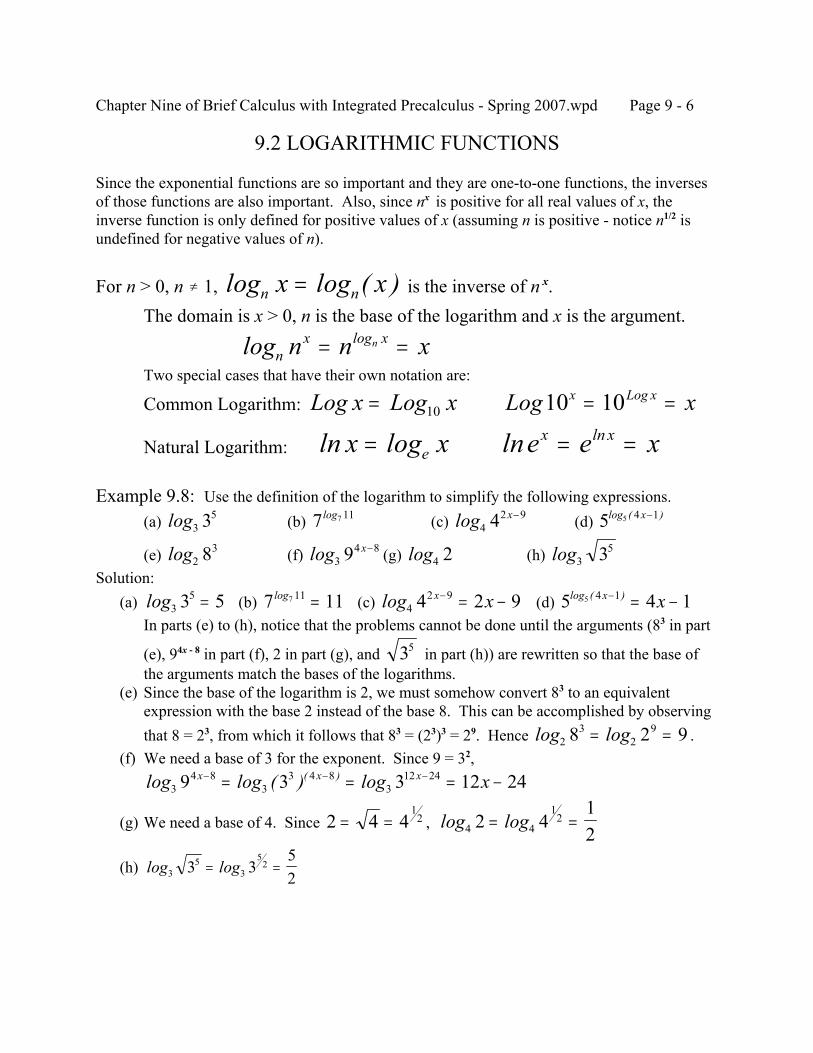
Chapter Nine of Brief Calculus with Integrated Precalculus - Spring 2007.wpd Page 9 - 6
9.2 LOGARITHMIC FUNCTIONS
Since the exponential functions are so important and they are one-to-one functions, the inversesof those functions are also important. Also, since nx is positive for all real values of x, theinverse function is only defined for positive values of x (assuming n is positive - notice n1/2 isundefined for negative values of n).
For n > 0, n … 1, is the inverse of n x.log log ( )n nx x=The domain is x > 0, n is the base of the logarithm and x is the argument.
log logn
x xn n xn= =Two special cases that have their own notation are:
Common Logarithm: Log x Log x Log xx Log x= = =10 10 10
Natural Logarithm: ln log ln lnx x e e xex x= = =
Example 9.8: Use the definition of the logarithm to simplify the following expressions.(a) (b) (c) (d) log3
53 7 7 11log log42 94 x− 5 5 4 1log ( )x−
(e) (f) (g) (h) log238 log3
4 89 x− log4 2 log353
Solution: (a) (b) (c) (d) log3
53 5= 7 117 11log = log42 94 2 9x x− = − 5 4 15 4 1log ( )x x− = −
In parts (e) to (h), notice that the problems cannot be done until the arguments (83 in part
(e), 94x - 8 in part (f), 2 in part (g), and in part (h)) are rewritten so that the base of35
the arguments match the bases of the logarithms. (e) Since the base of the logarithm is 2, we must somehow convert 83 to an equivalent
expression with the base 2 instead of the base 8. This can be accomplished by observingthat 8 = 23, from which it follows that 83 = (23)3 = 29. Hence .log log2
32
98 2 9= = (f) We need a base of 3 for the exponent. Since 9 = 32,
log log ( ) log( )3
4 83
3 4 83
12 249 3 3 12 24x x x x− − −= = = −
(g) We need a base of 4. Since , 2 4 41
2= = log log4 4
122 4
12
= =
(h) log log35
3
523 3
52
= =
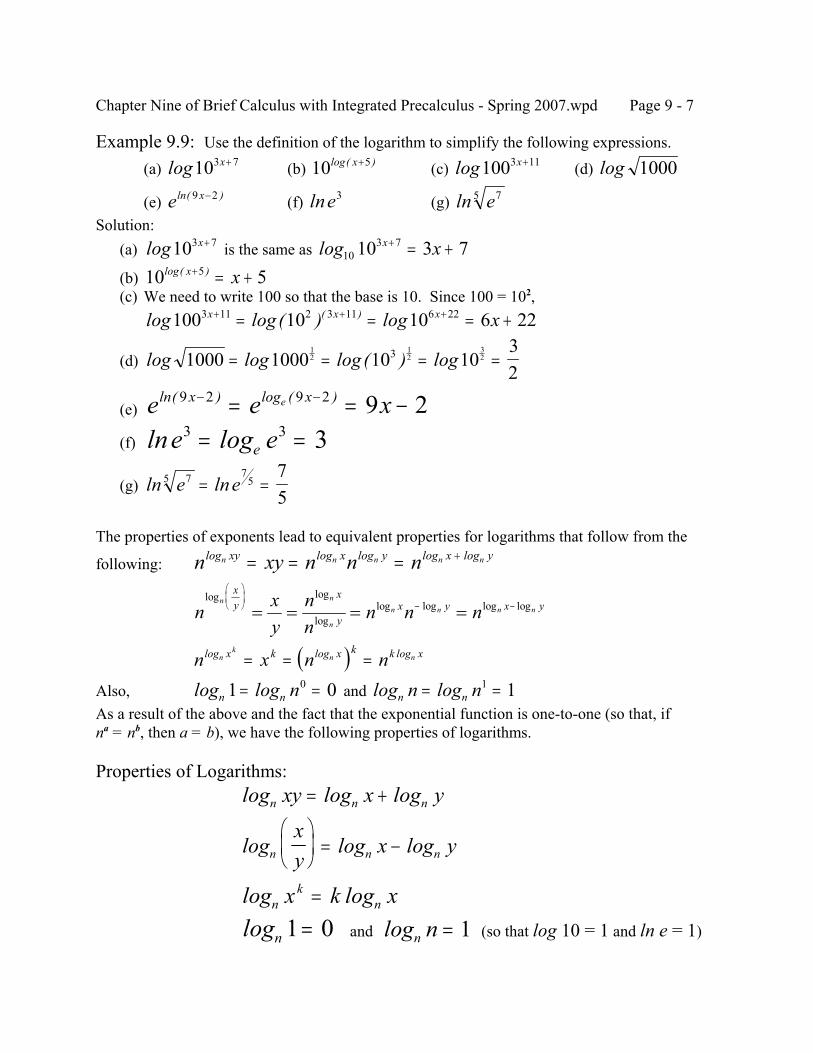
Chapter Nine of Brief Calculus with Integrated Precalculus - Spring 2007.wpd Page 9 - 7
Example 9.9: Use the definition of the logarithm to simplify the following expressions.
(a) (b) (c) (d) log103 7x+ 10 5log( )x+ log1003 11x+ log 1000
(e) (f) (g) e xln( )9 2− lne3 ln e75
Solution: (a) is the same as log103 7x+ log10
3 710 3 7x x+ = + (b) 10 55log( )x x+ = + (c) We need to write 100 so that the base is 10. Since 100 = 102,
log log( ) log( )100 10 10 6 223 11 2 3 11 6 22x x x x+ + += = = +
(d) log log log( ) log1000 1000 10 1032
12
12
323= = = =
(e) e e xx xeln( ) log ( )9 2 9 2 9 2− −= = − (f) ln loge ee
3 3 3= =
(g) ln lne e75 75
75
= =
The properties of exponents lead to equivalent properties for logarithms that follow from the
following: n xy n n nn n n n nxy x y x ylog log log log log= = = +
n xy
nn
n n nn n
n
n n n n
xy
x
yx y x y
log log
loglog log log log
− −= = = =
( )n x n nnk
n nx k x k k xlog log log= = =
Also, and log logn n n1 00= = log logn nn n= =1 1As a result of the above and the fact that the exponential function is one-to-one (so that, ifna = nb, then a = b), we have the following properties of logarithms.
Properties of Logarithms:log log logn n nxy x y= +
log log logn n n
xy
x y
= −
log lognk
nx k x= and (so that log 10 = 1 and ln e = 1)logn 1 0= logn n = 1
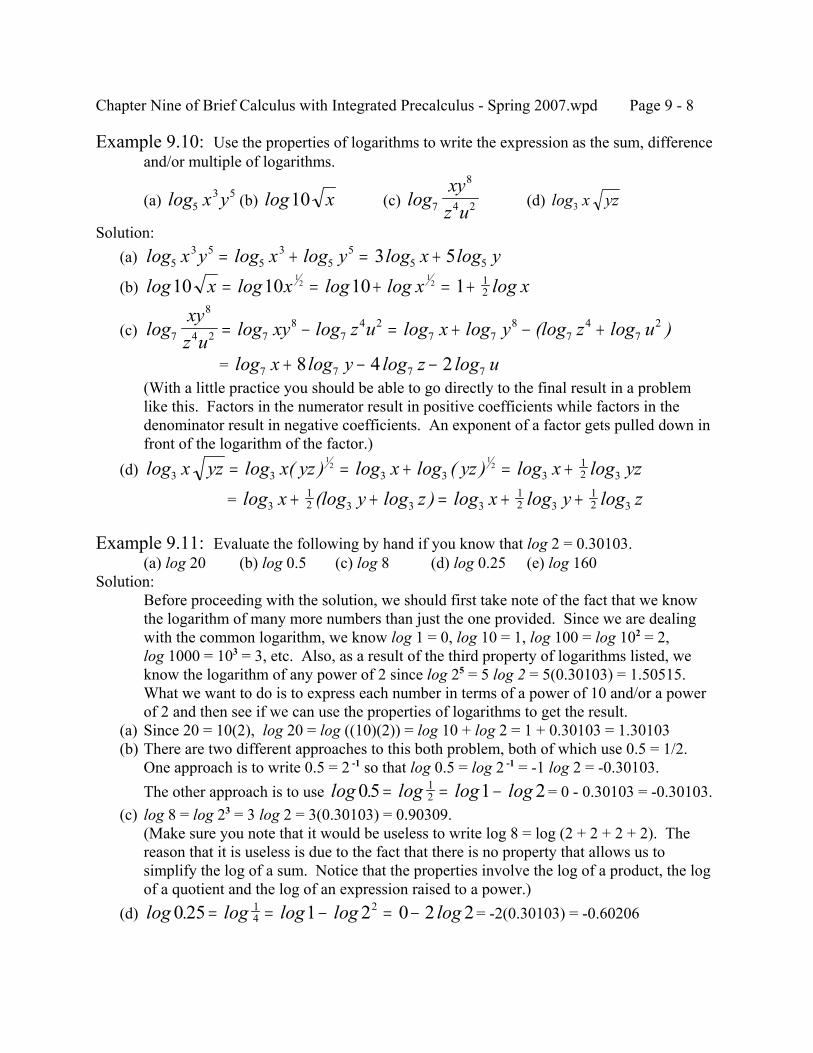
Chapter Nine of Brief Calculus with Integrated Precalculus - Spring 2007.wpd Page 9 - 8
Example 9.10: Use the properties of logarithms to write the expression as the sum, differenceand/or multiple of logarithms.
(a) (b) (c) (d) log53 5x y log10 x log7
8
4 2
xyz u
log3 x yz
Solution: (a) log log log log log5
3 55
35
55 53 5x y x y x y= + = +
(b) log log log log log10 10 10 112
12 1
2x x x x= = + = +
(c) log log log log log (log log )7
8
4 2 78
74 2
7 78
74
72xy
z uxy z u x y z u= − = + − +
= log log log log7 7 7 78 4 2x y z u+ − −(With a little practice you should be able to go directly to the final result in a problemlike this. Factors in the numerator result in positive coefficients while factors in thedenominator result in negative coefficients. An exponent of a factor gets pulled down infront of the logarithm of the factor.)
(d) log log ( ) log log ( ) log log3 3 3 3 312 3
12
12x yz x yz x yz x yz= = + = +
= log (log log ) log log log312 3 3 3
12 3
12 3x y z x y z+ + = + +
Example 9.11: Evaluate the following by hand if you know that log 2 = 0.30103.(a) log 20 (b) log 0.5 (c) log 8 (d) log 0.25 (e) log 160
Solution:Before proceeding with the solution, we should first take note of the fact that we knowthe logarithm of many more numbers than just the one provided. Since we are dealingwith the common logarithm, we know log 1 = 0, log 10 = 1, log 100 = log 102 = 2,log 1000 = 103 = 3, etc. Also, as a result of the third property of logarithms listed, weknow the logarithm of any power of 2 since log 25 = 5 log 2 = 5(0.30103) = 1.50515. What we want to do is to express each number in terms of a power of 10 and/or a powerof 2 and then see if we can use the properties of logarithms to get the result.
(a) Since 20 = 10(2), log 20 = log ((10)(2)) = log 10 + log 2 = 1 + 0.30103 = 1.30103 (b) There are two different approaches to this both problem, both of which use 0.5 = 1/2.
One approach is to write 0.5 = 2 -1 so that log 0.5 = log 2 -1 = -1 log 2 = -0.30103.The other approach is to use = 0 - 0.30103 = -0.30103.log . log log log05 1 21
2= = − (c) log 8 = log 23 = 3 log 2 = 3(0.30103) = 0.90309.
(Make sure you note that it would be useless to write log 8 = log (2 + 2 + 2 + 2). Thereason that it is useless is due to the fact that there is no property that allows us tosimplify the log of a sum. Notice that the properties involve the log of a product, the logof a quotient and the log of an expression raised to a power.)
(d) = -2(0.30103) = -0.60206log . log log log log0 25 1 2 0 2 214
2= = − = −
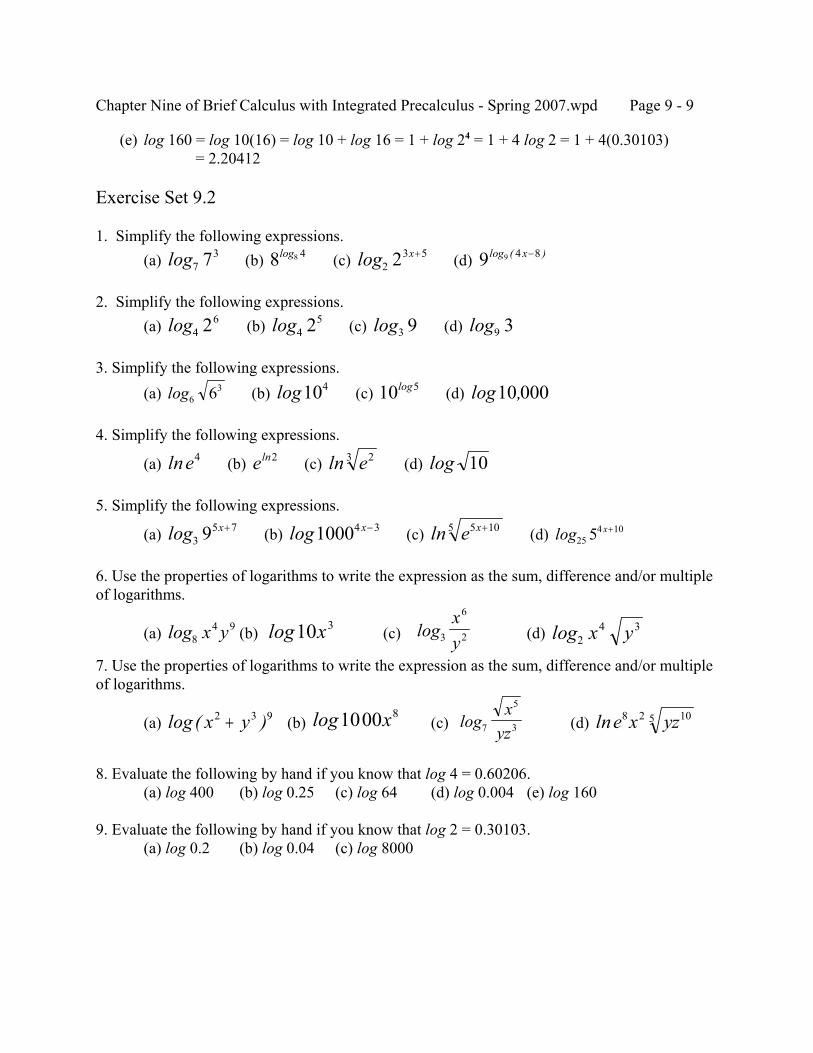
Chapter Nine of Brief Calculus with Integrated Precalculus - Spring 2007.wpd Page 9 - 9
(e) log 160 = log 10(16) = log 10 + log 16 = 1 + log 24 = 1 + 4 log 2 = 1 + 4(0.30103) = 2.20412
Exercise Set 9.2
1. Simplify the following expressions.(a) (b) (c) (d) log7
37 8 8 4log log23 52 x+ 9 9 4 8log ( )x−
2. Simplify the following expressions.(a) (b) (c) (d) log4
62 log452 log3 9 log9 3
3. Simplify the following expressions.(a) (b) (c) (d) log6
36 log104 10 5log log ,10 000
4. Simplify the following expressions.
(a) (b) (c) (d) lne4 eln2 ln e23 log 10
5. Simplify the following expressions.
(a) (b) (c) (d) log35 79 x+ log10004 3x− ln e x5 105 + log25
4 105 x+
6. Use the properties of logarithms to write the expression as the sum, difference and/or multipleof logarithms.
(a) (b) (c) (d) log84 9x y log10 3x log3
6
2
xy log2
4 3x y7. Use the properties of logarithms to write the expression as the sum, difference and/or multipleof logarithms.
(a) (b) (c) (d) log( )x y2 3 9+ log1000 8x log7
5
3
xyz lne x yz8 2 105
8. Evaluate the following by hand if you know that log 4 = 0.60206.(a) log 400 (b) log 0.25 (c) log 64 (d) log 0.004 (e) log 160
9. Evaluate the following by hand if you know that log 2 = 0.30103.(a) log 0.2 (b) log 0.04 (c) log 8000
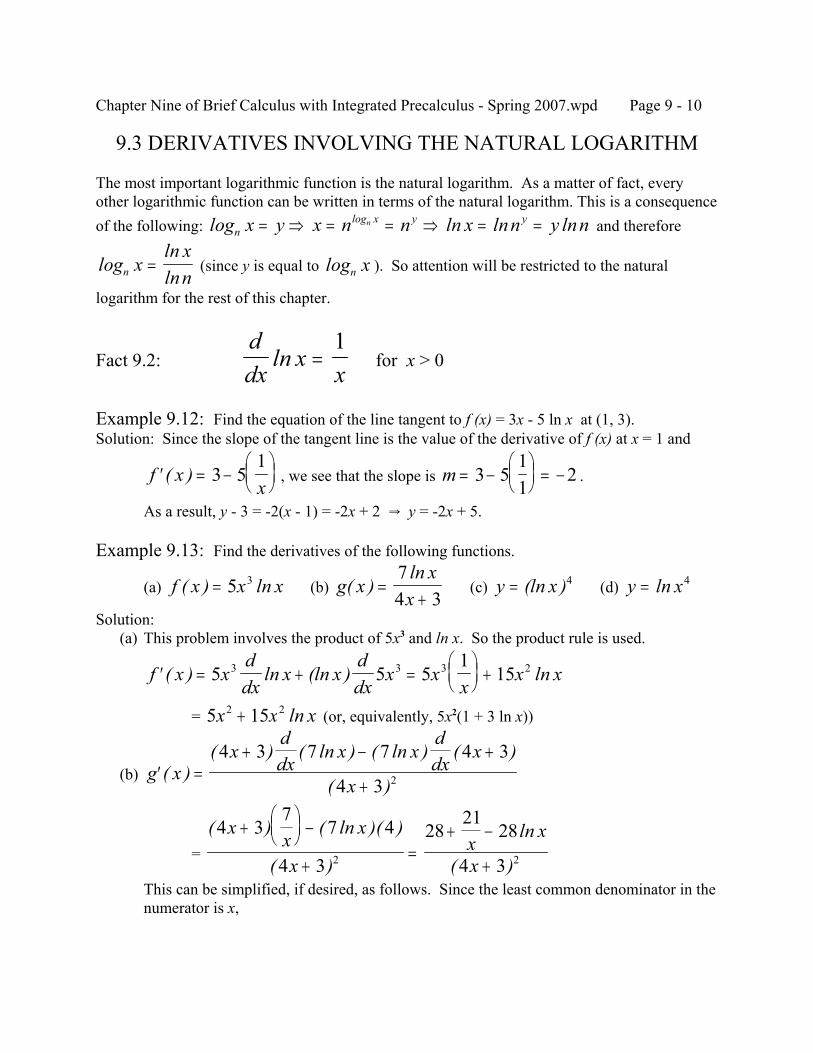
Chapter Nine of Brief Calculus with Integrated Precalculus - Spring 2007.wpd Page 9 - 10
9.3 DERIVATIVES INVOLVING THE NATURAL LOGARITHM
The most important logarithmic function is the natural logarithm. As a matter of fact, everyother logarithmic function can be written in terms of the natural logarithm. This is a consequenceof the following: and thereforelog ln ln lnlog
nx y yx y x n n x n y nn= ⇒ = = ⇒ = =
(since y is equal to ). So attention will be restricted to the naturalloglnlnn x
xn
= logn x
logarithm for the rest of this chapter.
Fact 9.2: for x > 0ddx
xx
ln =1
Example 9.12: Find the equation of the line tangent to f (x) = 3x - 5 ln x at (1, 3).Solution: Since the slope of the tangent line is the value of the derivative of f (x) at x = 1 and
, we see that the slope is .′ = −
f x
x( ) 3 5
1m = −
= −3 5
11
2
As a result, y - 3 = -2(x - 1) = -2x + 2 Y y = -2x + 5.
Example 9.13: Find the derivatives of the following functions.
(a) (b) (c) (d) f x x x( ) ln= 5 3 g xx
x( )
ln=
+74 3
y x= (ln )4 y x= ln 4
Solution: (a) This problem involves the product of 5x3 and ln x. So the product rule is used.
′ = + =
+f x x
ddx
x xddx
x xx
x x( ) ln (ln ) ln5 5 51
153 3 3 2
= (or, equivalently, 5x2(1 + 3 ln x))5 152 2x x x+ ln
(b) ′ =+ − +
+g x
xddx
x xddx
x
x( )
( ) ( ln ) ( ln ) ( )
( )
4 3 7 7 4 3
4 3 2
= ( ) ( ln )( )
( )
ln
( )
4 37
7 4
4 3
2821
28
4 32 2
xx
x
xx
x
x
+
−
+=
+ −
+This can be simplified, if desired, as follows. Since the least common denominator in thenumerator is x,
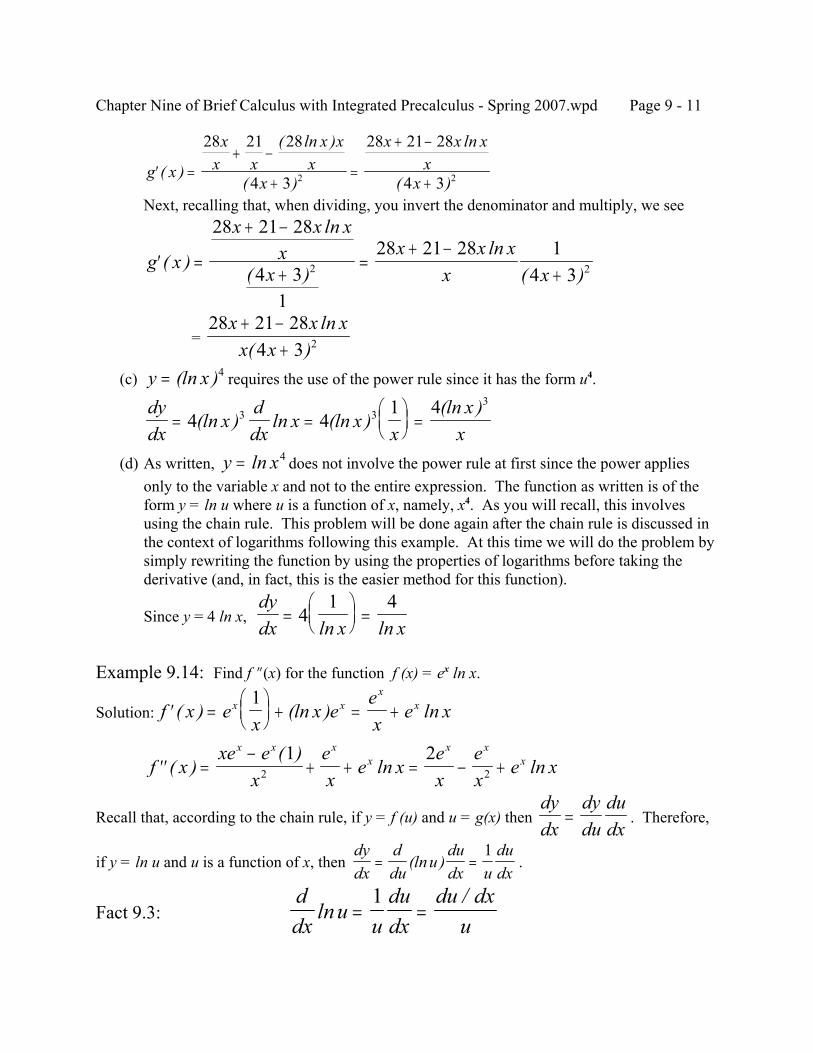
Chapter Nine of Brief Calculus with Integrated Precalculus - Spring 2007.wpd Page 9 - 11
′ =+ −
+=
+ −
+g x
xx x
x xx
x
x x xx
x( )
( ln )
( )
ln
( )
28 21 28
4 3
28 21 28
4 32 2
Next, recalling that, when dividing, you invert the denominator and multiply, we see
′ =
+ −
+=
+ −+
g x
x x xx
xx x x
x x( )
ln
( )ln
( )
28 21 28
4 31
28 21 28 14 32 2
= 28 21 28
4 3 2
x x xx x+ −
+ln
( ) (c) requires the use of the power rule since it has the form u4.y x= (ln )4
dydx
xddx
x xx
xx
= =
=4 4
1 43 33
(ln ) ln (ln )(ln )
(d) As written, does not involve the power rule at first since the power appliesy x= ln 4
only to the variable x and not to the entire expression. The function as written is of theform y = ln u where u is a function of x, namely, x4. As you will recall, this involvesusing the chain rule. This problem will be done again after the chain rule is discussed inthe context of logarithms following this example. At this time we will do the problem bysimply rewriting the function by using the properties of logarithms before taking thederivative (and, in fact, this is the easier method for this function).
Since y = 4 ln x, dydx x x
=
=4
1 4ln ln
Example 9.14: Find f O(x) for the function f (x) = ex ln x.
Solution: ′ =
+ = +f x e
xx e
ex
e xx xx
x( ) (ln ) ln1
′′ =−
+ + = − +f xxe e
xex
e xex
ex
e xx x x
xx x
x( )( )
ln ln1 2
2 2
Recall that, according to the chain rule, if y = f (u) and u = g(x) then . Therefore,dydx
dydu
dudx
=
if y = ln u and u is a function of x, then .dydx
ddu
ududx u
dudx
= =(ln )1
Fact 9.3:ddx
uu
dudx
du dxu
ln/
= =1
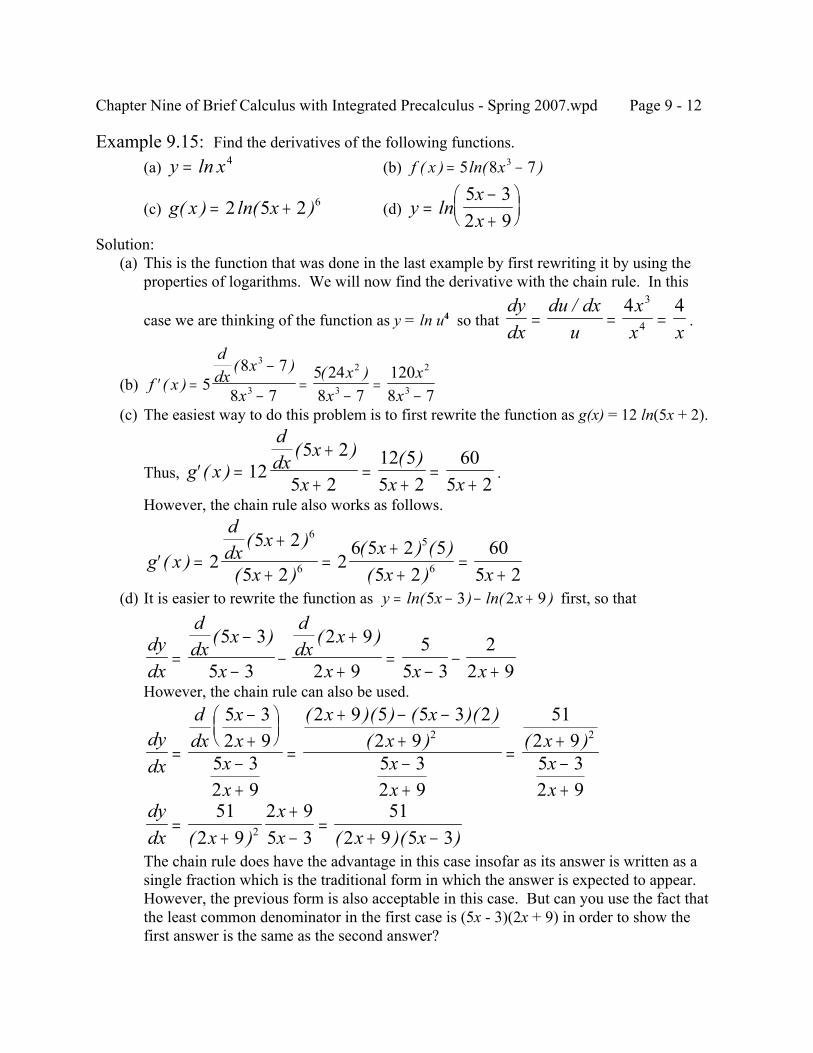
Chapter Nine of Brief Calculus with Integrated Precalculus - Spring 2007.wpd Page 9 - 12
Example 9.15: Find the derivatives of the following functions.(a) (b) y x= ln 4 f x x( ) ln( )= −5 8 73
(c) (d) g x x( ) ln( )= +2 5 2 6 yxx
=−+
ln
5 32 9
Solution: (a) This is the function that was done in the last example by first rewriting it by using the
properties of logarithms. We will now find the derivative with the chain rule. In this
case we are thinking of the function as y = ln u4 so that .dydx
du dxu
xx x
= = =/ 4 43
4
(b) ′ =−
−=
−=
−f x
ddx
x
xx
xx
x( )
( ) ( )5
8 7
8 75 248 7
1208 7
3
3
2
3
2
3
(c) The easiest way to do this problem is to first rewrite the function as g(x) = 12 ln(5x + 2).
Thus, .′ =+
+=
+=
+g x
ddx
x
x x x( )
( ) ( )12
5 2
5 212 55 2
605 2
However, the chain rule also works as follows.
′ =+
+=
++
=+
g x
ddx
x
xxx x
( )( )
( )( ) ( )( )
25 2
5 22
6 5 2 55 2
605 2
6
6
5
6
(d) It is easier to rewrite the function as first, so thaty x x= − − +ln( ) ln( )5 3 2 9
dydx
ddx
x
x
ddx
x
x x x=
−
−−
+
+=
−−
+
( ) ( )5 3
5 3
2 9
2 95
5 32
2 9However, the chain rule can also be used.
dydx
ddx
xx
xx
x xxxx
xxx
=
−+
−+
=
+ − −+−+
=+−+
5 32 9
5 32 9
2 9 5 5 3 22 95 32 9
512 95 32 9
2 2( )( ) ( )( )
( ) ( )
dydx x
xx x x
=+
+−
=+ −
512 9
2 95 3
512 9 5 32( ) ( )( )
The chain rule does have the advantage in this case insofar as its answer is written as asingle fraction which is the traditional form in which the answer is expected to appear. However, the previous form is also acceptable in this case. But can you use the fact thatthe least common denominator in the first case is (5x - 3)(2x + 9) in order to show thefirst answer is the same as the second answer?
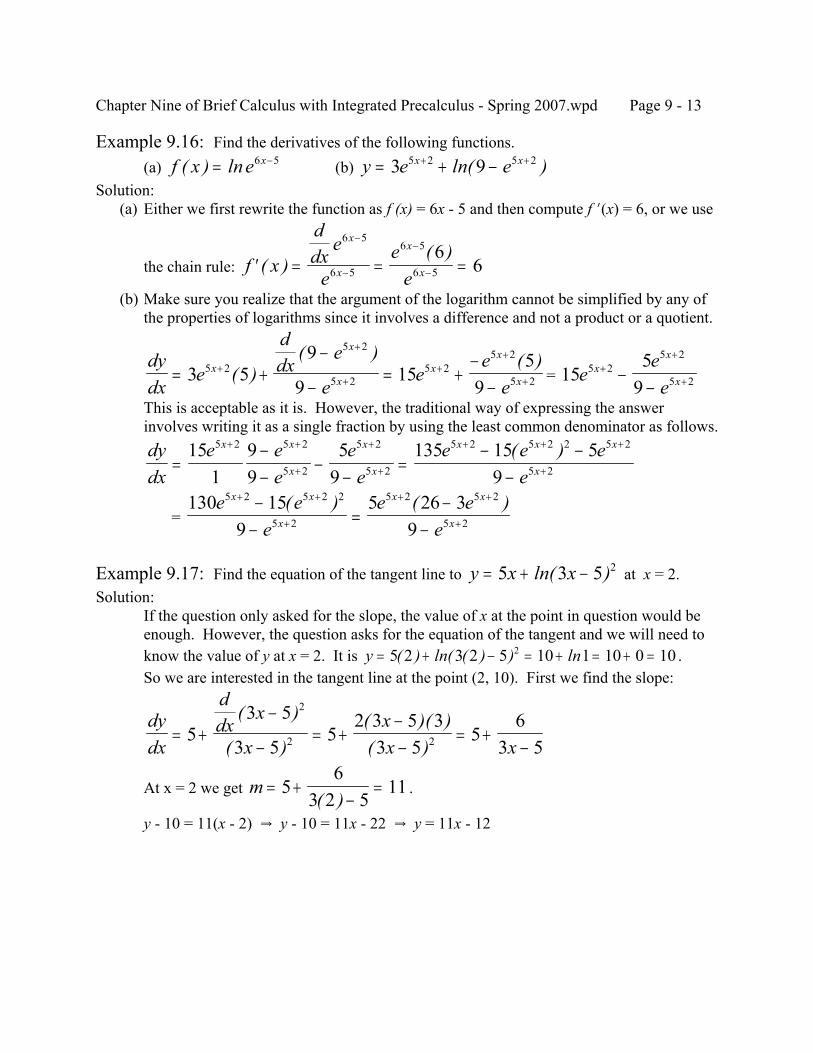
Chapter Nine of Brief Calculus with Integrated Precalculus - Spring 2007.wpd Page 9 - 13
Example 9.16: Find the derivatives of the following functions.(a) (b) f x e x( ) ln= −6 5 y e ex x= + −+ +3 95 2 5 2ln( )
Solution: (a) Either we first rewrite the function as f (x) = 6x - 5 and then compute f N(x) = 6, or we use
the chain rule: ′ = = =
−
−
−
−f x
ddx
e
ee
e
x
x
x
x( )( )
6 5
6 5
6 5
6 5
66
(b) Make sure you realize that the argument of the logarithm cannot be simplified by any ofthe properties of logarithms since it involves a difference and not a product or a quotient.
= dydx
e
ddx
e
ee
ee
x
x
xx
x
x= +−
−= +
−−
+
+
++
+
+3 59
915
59
5 2
5 2
5 25 2
5 2
5 2( )( ) ( )
155
95 2
5 2
5 2eee
xx
x+
+
+−−
This is acceptable as it is. However, the traditional way of expressing the answerinvolves writing it as a single fraction by using the least common denominator as follows.dydx
e ee
ee
e e ee
x x
x
x
x
x x x
x=−−
−−
=− −
−
+ +
+
+
+
+ + +
+
151
99
59
135 15 59
5 2 5 2
5 2
5 2
5 2
5 2 5 2 2 5 2
5 2
( )
= 130 15
95 26 3
9
5 2 5 2 2
5 2
5 2 5 2
5 2
e ee
e ee
x x
x
x x
x
+ +
+
+ +
+
−−
=−
−( ) ( )
Example 9.17: Find the equation of the tangent line to at x = 2.y x x= + −5 3 5 2ln( )Solution:
If the question only asked for the slope, the value of x at the point in question would beenough. However, the question asks for the equation of the tangent and we will need toknow the value of y at x = 2. It is .y = + − = + = + =5 2 3 2 5 10 1 10 0 102( ) ln( ( ) ) lnSo we are interested in the tangent line at the point (2, 10). First we find the slope:
dydx
ddx
x
xxx x
= +−
−= +
−−
= +−
53 5
3 55
2 3 5 33 5
56
3 5
2
2 2
( )
( )( )( )( )
At x = 2 we get .m = +−
=56
3 2 511
( )y - 10 = 11(x - 2) Y y - 10 = 11x - 22 Y y = 11x - 12
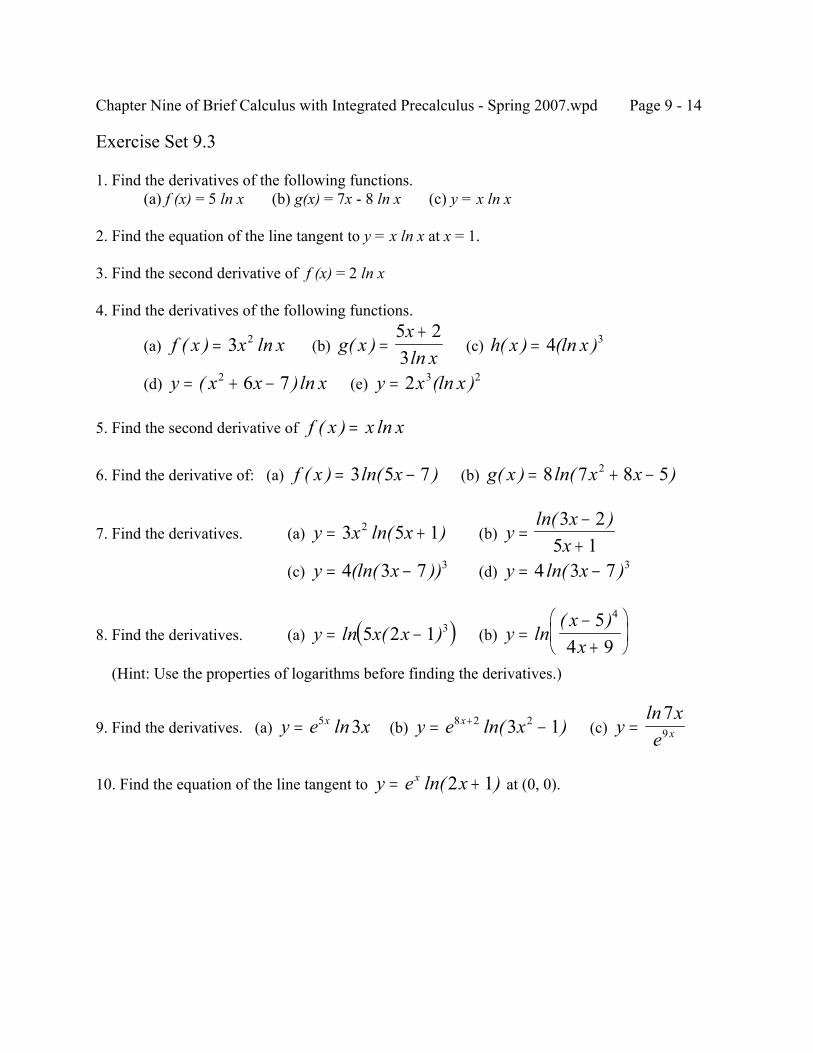
Chapter Nine of Brief Calculus with Integrated Precalculus - Spring 2007.wpd Page 9 - 14
Exercise Set 9.3
1. Find the derivatives of the following functions.(a) f (x) = 5 ln x (b) g(x) = 7x - 8 ln x (c) y = x ln x
2. Find the equation of the line tangent to y = x ln x at x = 1.
3. Find the second derivative of f (x) = 2 ln x
4. Find the derivatives of the following functions.
(a) (b) (c) f x x x( ) ln= 3 2 g xx
x( )
ln=
+5 23
h x x( ) (ln )= 4 3
(d) (e) y x x x= + −( )ln2 6 7 y x x= 2 3 2(ln )
5. Find the second derivative of f x x x( ) ln=
6. Find the derivative of: (a) (b) f x x( ) ln( )= −3 5 7 g x x x( ) ln( )= + −8 7 8 52
7. Find the derivatives. (a) (b) y x x= +3 5 12 ln( ) yx
x=
−+
ln( )3 25 1
(c) (d) y x= −4 3 7 3(ln( )) y x= −4 3 7 3ln( )
8. Find the derivatives. (a) (b) ( )y x x= −ln ( )5 2 1 3 yxx
=−+
ln
( )54 9
4
(Hint: Use the properties of logarithms before finding the derivatives.)
9. Find the derivatives. (a) (b) (c) y e xx= 5 3ln y e xx= −+8 2 23 1ln( ) yx
e x=ln7
9
10. Find the equation of the line tangent to at (0, 0).y e xx= +ln( )2 1
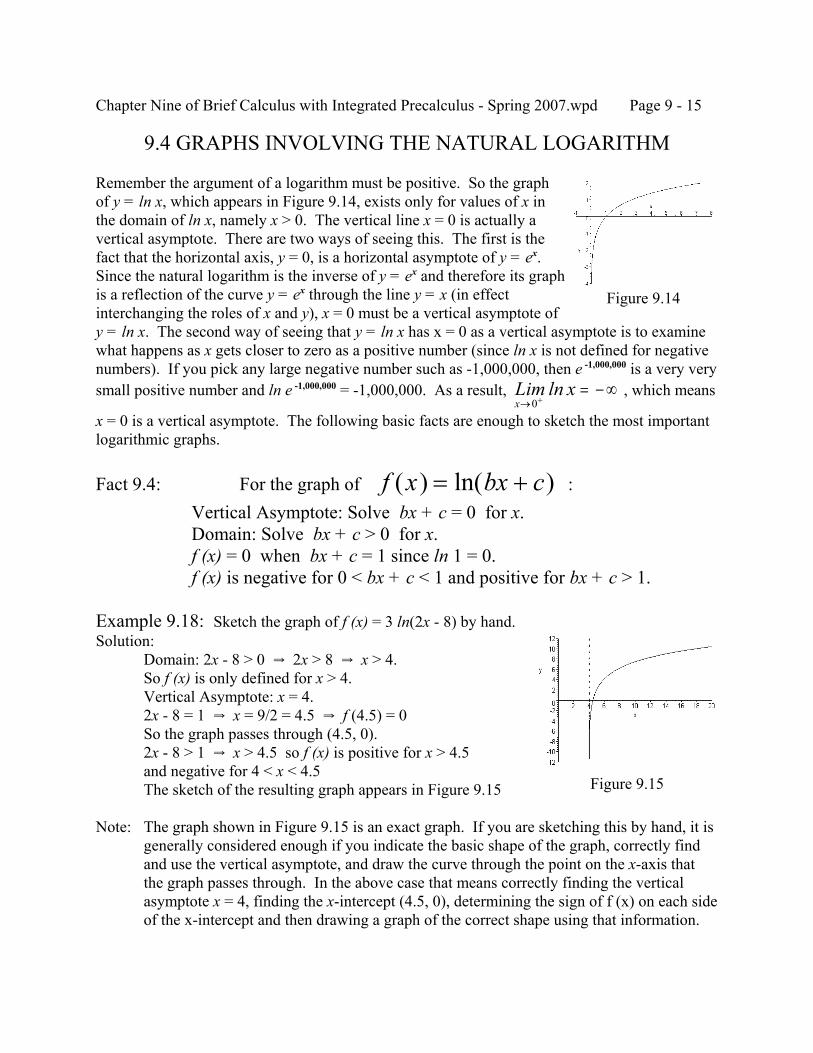
Chapter Nine of Brief Calculus with Integrated Precalculus - Spring 2007.wpd Page 9 - 15
Figure 9.14
Figure 9.15
9.4 GRAPHS INVOLVING THE NATURAL LOGARITHM
Remember the argument of a logarithm must be positive. So the graphof y = ln x, which appears in Figure 9.14, exists only for values of x inthe domain of ln x, namely x > 0. The vertical line x = 0 is actually avertical asymptote. There are two ways of seeing this. The first is thefact that the horizontal axis, y = 0, is a horizontal asymptote of y = ex. Since the natural logarithm is the inverse of y = ex and therefore its graphis a reflection of the curve y = ex through the line y = x (in effectinterchanging the roles of x and y), x = 0 must be a vertical asymptote ofy = ln x. The second way of seeing that y = ln x has x = 0 as a vertical asymptote is to examinewhat happens as x gets closer to zero as a positive number (since ln x is not defined for negativenumbers). If you pick any large negative number such as -1,000,000, then e -1,000,000 is a very verysmall positive number and ln e -1,000,000 = -1,000,000. As a result, , which meansLim x
x→ += −∞
0ln
x = 0 is a vertical asymptote. The following basic facts are enough to sketch the most importantlogarithmic graphs.
Fact 9.4: For the graph of :f x bx c( ) ln( )= +Vertical Asymptote: Solve bx + c = 0 for x.Domain: Solve bx + c > 0 for x.f (x) = 0 when bx + c = 1 since ln 1 = 0.f (x) is negative for 0 < bx + c < 1 and positive for bx + c > 1.
Example 9.18: Sketch the graph of f (x) = 3 ln(2x - 8) by hand.Solution:
Domain: 2x - 8 > 0 Y 2x > 8 Y x > 4.So f (x) is only defined for x > 4.Vertical Asymptote: x = 4.2x - 8 = 1 Y x = 9/2 = 4.5 Y f (4.5) = 0So the graph passes through (4.5, 0).2x - 8 > 1 Y x > 4.5 so f (x) is positive for x > 4.5and negative for 4 < x < 4.5The sketch of the resulting graph appears in Figure 9.15
Note: The graph shown in Figure 9.15 is an exact graph. If you are sketching this by hand, it isgenerally considered enough if you indicate the basic shape of the graph, correctly findand use the vertical asymptote, and draw the curve through the point on the x-axis thatthe graph passes through. In the above case that means correctly finding the verticalasymptote x = 4, finding the x-intercept (4.5, 0), determining the sign of f (x) on each sideof the x-intercept and then drawing a graph of the correct shape using that information.
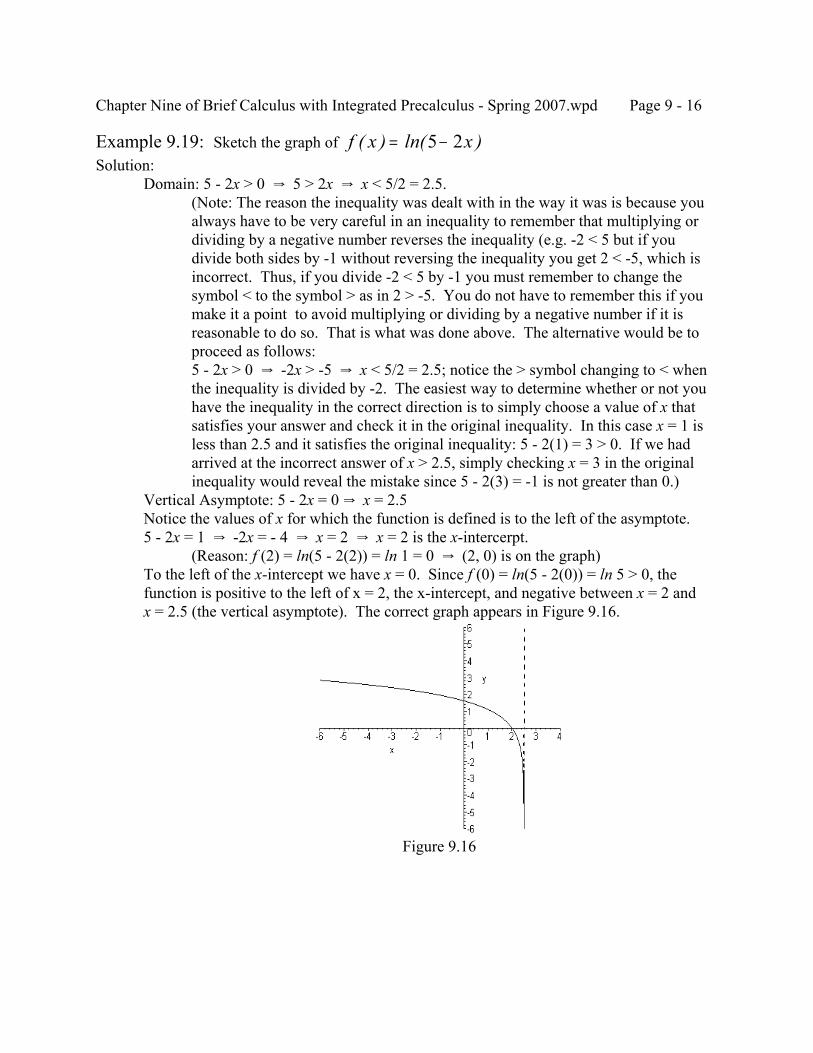
Chapter Nine of Brief Calculus with Integrated Precalculus - Spring 2007.wpd Page 9 - 16
Figure 9.16
Example 9.19: Sketch the graph of f x x( ) ln( )= −5 2Solution:
Domain: 5 - 2x > 0 Y 5 > 2x Y x < 5/2 = 2.5.(Note: The reason the inequality was dealt with in the way it was is because youalways have to be very careful in an inequality to remember that multiplying ordividing by a negative number reverses the inequality (e.g. -2 < 5 but if youdivide both sides by -1 without reversing the inequality you get 2 < -5, which isincorrect. Thus, if you divide -2 < 5 by -1 you must remember to change thesymbol < to the symbol > as in 2 > -5. You do not have to remember this if youmake it a point to avoid multiplying or dividing by a negative number if it isreasonable to do so. That is what was done above. The alternative would be toproceed as follows:5 - 2x > 0 Y -2x > -5 Y x < 5/2 = 2.5; notice the > symbol changing to < whenthe inequality is divided by -2. The easiest way to determine whether or not youhave the inequality in the correct direction is to simply choose a value of x thatsatisfies your answer and check it in the original inequality. In this case x = 1 isless than 2.5 and it satisfies the original inequality: 5 - 2(1) = 3 > 0. If we hadarrived at the incorrect answer of x > 2.5, simply checking x = 3 in the originalinequality would reveal the mistake since 5 - 2(3) = -1 is not greater than 0.)
Vertical Asymptote: 5 - 2x = 0 Y x = 2.5Notice the values of x for which the function is defined is to the left of the asymptote.5 - 2x = 1 Y -2x = - 4 Y x = 2 Y x = 2 is the x-intercerpt.
(Reason: f (2) = ln(5 - 2(2)) = ln 1 = 0 Y (2, 0) is on the graph)To the left of the x-intercept we have x = 0. Since f (0) = ln(5 - 2(0)) = ln 5 > 0, thefunction is positive to the left of x = 2, the x-intercept, and negative between x = 2 andx = 2.5 (the vertical asymptote). The correct graph appears in Figure 9.16.
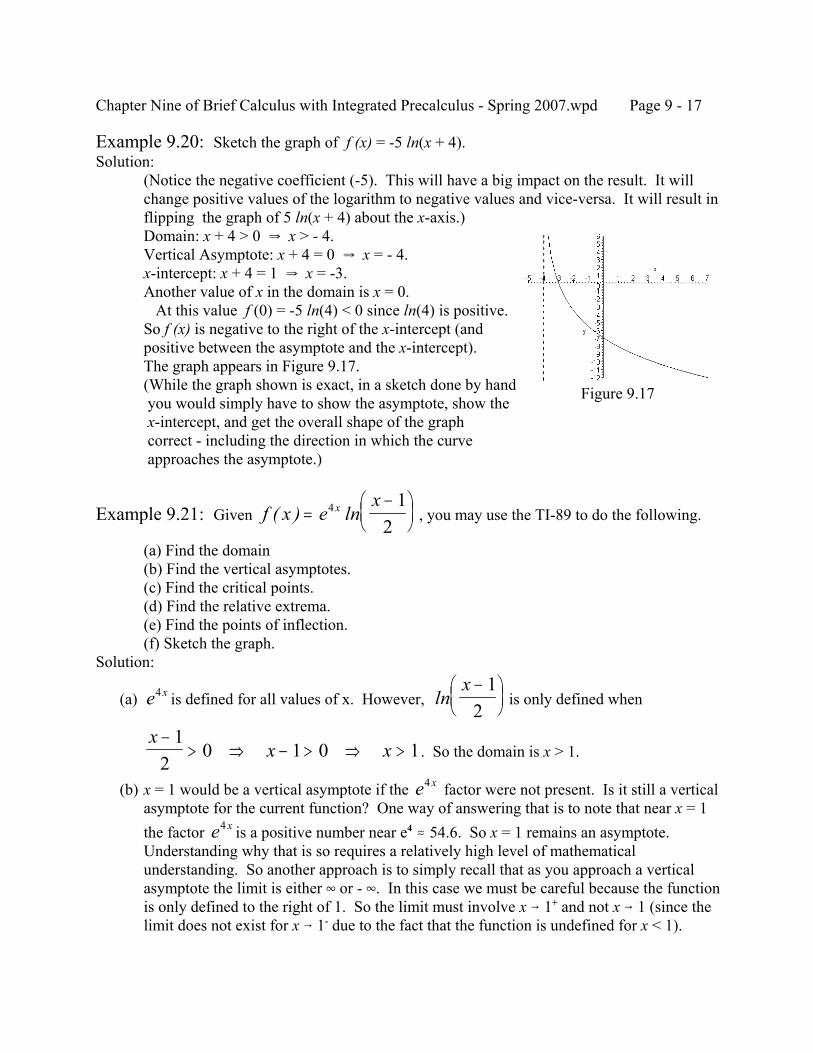
Chapter Nine of Brief Calculus with Integrated Precalculus - Spring 2007.wpd Page 9 - 17
Figure 9.17
Example 9.20: Sketch the graph of f (x) = -5 ln(x + 4).Solution:
(Notice the negative coefficient (-5). This will have a big impact on the result. It willchange positive values of the logarithm to negative values and vice-versa. It will result inflipping the graph of 5 ln(x + 4) about the x-axis.)Domain: x + 4 > 0 Y x > - 4.Vertical Asymptote: x + 4 = 0 Y x = - 4.x-intercept: x + 4 = 1 Y x = -3.Another value of x in the domain is x = 0. At this value f (0) = -5 ln(4) < 0 since ln(4) is positive.So f (x) is negative to the right of the x-intercept (andpositive between the asymptote and the x-intercept).The graph appears in Figure 9.17.(While the graph shown is exact, in a sketch done by hand you would simply have to show the asymptote, show the x-intercept, and get the overall shape of the graph correct - including the direction in which the curve approaches the asymptote.)
Example 9.21: Given , you may use the TI-89 to do the following.f x exx( ) ln=−
4 12
(a) Find the domain(b) Find the vertical asymptotes.(c) Find the critical points.(d) Find the relative extrema.(e) Find the points of inflection.(f) Sketch the graph.
Solution:
(a) is defined for all values of x. However, is only defined whene x4 lnx −
12
. So the domain is x > 1.x
x x−
> ⇒ − > ⇒ >1
20 1 0 1
(b) x = 1 would be a vertical asymptote if the factor were not present. Is it still a verticale x4
asymptote for the current function? One way of answering that is to note that near x = 1the factor is a positive number near e4 . 54.6. So x = 1 remains an asymptote. e x4
Understanding why that is so requires a relatively high level of mathematicalunderstanding. So another approach is to simply recall that as you approach a verticalasymptote the limit is either 4 or - 4. In this case we must be careful because the functionis only defined to the right of 1. So the limit must involve x 6 1+ and not x 6 1 (since thelimit does not exist for x 6 1- due to the fact that the function is undefined for x < 1).
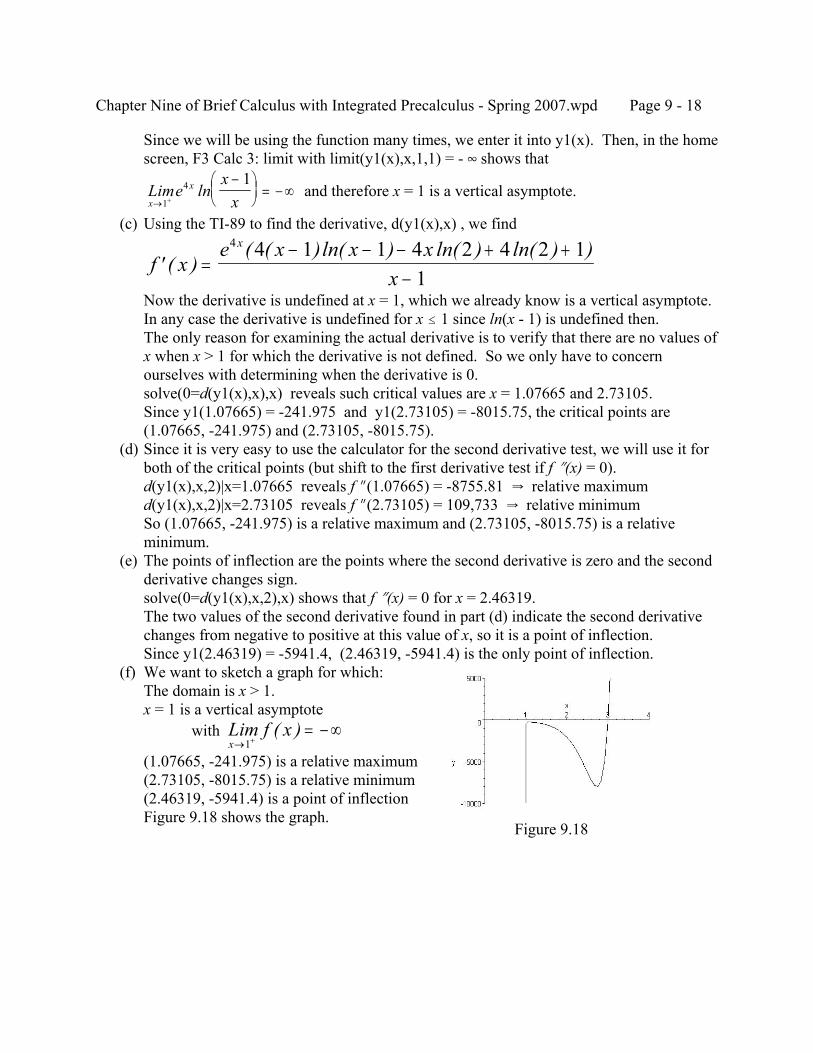
Chapter Nine of Brief Calculus with Integrated Precalculus - Spring 2007.wpd Page 9 - 18
Figure 9.18
Since we will be using the function many times, we enter it into y1(x). Then, in the homescreen, F3 Calc 3: limit with limit(y1(x),x,1,1) = - 4 shows that
and therefore x = 1 is a vertical asymptote.Limex
xx
x
→ +
−
= −∞
1
4 1ln
(c) Using the TI-89 to find the derivative, d(y1(x),x) , we find
f xe x x x
x
x
' ( )( ( )ln( ) ln( ) ln( ) )
=− − − + +
−
4 4 1 1 4 2 4 2 11
Now the derivative is undefined at x = 1, which we already know is a vertical asymptote.In any case the derivative is undefined for x # 1 since ln(x - 1) is undefined then.The only reason for examining the actual derivative is to verify that there are no values ofx when x > 1 for which the derivative is not defined. So we only have to concernourselves with determining when the derivative is 0.solve(0=d(y1(x),x),x) reveals such critical values are x = 1.07665 and 2.73105.Since y1(1.07665) = -241.975 and y1(2.73105) = -8015.75, the critical points are(1.07665, -241.975) and (2.73105, -8015.75).
(d) Since it is very easy to use the calculator for the second derivative test, we will use it forboth of the critical points (but shift to the first derivative test if f O(x) = 0).d(y1(x),x,2)|x=1.07665 reveals f O(1.07665) = -8755.81 Y relative maximumd(y1(x),x,2)|x=2.73105 reveals f O(2.73105) = 109,733 Y relative minimumSo (1.07665, -241.975) is a relative maximum and (2.73105, -8015.75) is a relativeminimum.
(e) The points of inflection are the points where the second derivative is zero and the secondderivative changes sign.solve(0=d(y1(x),x,2),x) shows that f O(x) = 0 for x = 2.46319.The two values of the second derivative found in part (d) indicate the second derivativechanges from negative to positive at this value of x, so it is a point of inflection.Since y1(2.46319) = -5941.4, (2.46319, -5941.4) is the only point of inflection.
(f) We want to sketch a graph for which:The domain is x > 1.x = 1 is a vertical asymptote
with Lim f xx→ +
= −∞1
( )(1.07665, -241.975) is a relative maximum(2.73105, -8015.75) is a relative minimum(2.46319, -5941.4) is a point of inflectionFigure 9.18 shows the graph.
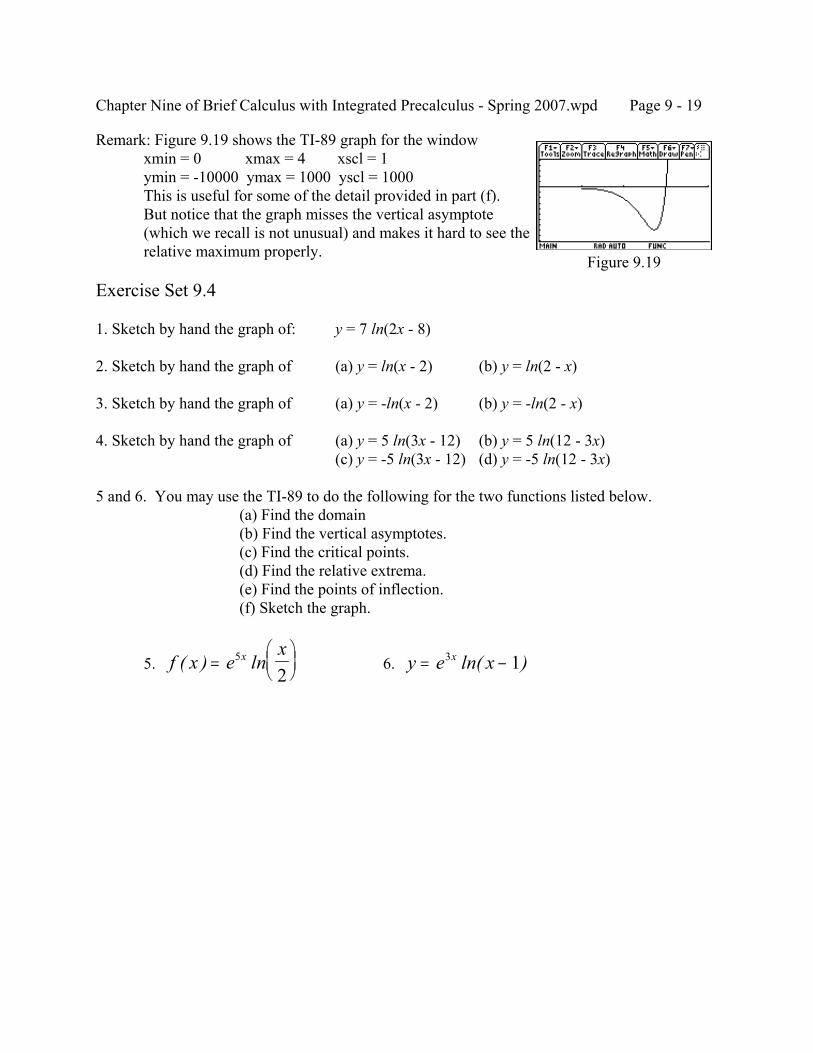
Chapter Nine of Brief Calculus with Integrated Precalculus - Spring 2007.wpd Page 9 - 19
Figure 9.19
Remark: Figure 9.19 shows the TI-89 graph for the windowxmin = 0 xmax = 4 xscl = 1ymin = -10000 ymax = 1000 yscl = 1000This is useful for some of the detail provided in part (f).But notice that the graph misses the vertical asymptote(which we recall is not unusual) and makes it hard to see therelative maximum properly.
Exercise Set 9.4
1. Sketch by hand the graph of: y = 7 ln(2x - 8)
2. Sketch by hand the graph of (a) y = ln(x - 2) (b) y = ln(2 - x)
3. Sketch by hand the graph of (a) y = -ln(x - 2) (b) y = -ln(2 - x)
4. Sketch by hand the graph of (a) y = 5 ln(3x - 12) (b) y = 5 ln(12 - 3x)(c) y = -5 ln(3x - 12) (d) y = -5 ln(12 - 3x)
5 and 6. You may use the TI-89 to do the following for the two functions listed below.(a) Find the domain(b) Find the vertical asymptotes.(c) Find the critical points.(d) Find the relative extrema.(e) Find the points of inflection.(f) Sketch the graph.
5. 6. f x exx( ) ln=
5
2y e xx= −3 1ln( )
Chapter Ten of Brief Calculus with Integrated Precalculus - Spring 2008.wpd Page 10 - 1
CHAPTER TENINTEGRATION
10.1 DIFFERENTIAL EQUATIONS AND THE INDEFINITE INTEGRAL
Suppose the cost is changing at the constant rate of $35 per unit and the fixed cost is $400. Wewere able to find the cost function before we knew any calculus because we recognized the factthat a linear function represented a constant rate of growth. The constant rate is the slope and thefixed cost is the cost when no items are produced and sold (the y-intercept). Therefore the costfunction is C(x) = 35x + 400. There is another way of stating the information presented that ismore useful for problems of a similar but more complicated nature where the rate of change isnot constant. Since the $35 in the problem is the rate of change and the rate of change isderivative, the problem above can be restated as follows. What is the cost function, C(x), if it isknown that CN(x) = 35 and C(0) = 400? CN(x) = 35 is called a differential equation because it isan equation that involves the derivative and we want to use that to determine what the originalfunction C(x) is. Now there are many functions that satisfy CN(x) = 35. For example, all of thefollowing satisfy the equation: C(x) = 35x + 10, C(x) = 35x +100, C(x) = 35x - 17, etc. If youthink about it, all of the equations for which C(x) = 35x + k, where k represents a constantnumber, is the general solution. The fact that the fixed cost is $400 provides what is known asan initial condition, namely, C(0) = 400. It is called an initial condition not so much because ittells us what is true when x = 0 but because it provides information that can be used to find thevalue of the constant k in C(x) = 35x + k. That is, 400 = C(0) = 35(0) + k Y k = 400 andtherefore C(x) = 35x + 400. Let us look at another differential equation problem.
Example 10.1: If the marginal weekly profit is changing at the rate of dPdx
x= +90 600
dollars per weekly unit of production and the profit is $7000 when 10 units are producedweekly, find the weekly profit function P and the profit that would result if 20 units wereproduced weekly.
Solution:We want to find the function that has 90x + 600 as its derivative. Since the derivative ofx2 is 2x, 45x2 has 90x as its derivative. We also know that the derivative of 600x is 600. So 45x2 + 600x produces the desired derivative. However, it cannot be the correct answersince the value of this function when x = 10 is 45(10)2 + 600(10) = 10,500 and the correctvalue should be $7000. Now we could choose any constant to tack on to the function
45x2 + 600x and still satisfy the differential equation . All of thedPdx
x= +90 600
following equations would work: 45x2 + 600x + 1000, 45x2 + 600x - 500, 45x2 + 600x +2, etc. We call the solution P(x) = 45x2 + 600x + C, where C is an arbitrary constant, thegeneral solution. We can use the initial condition provided, P(10) = 7000, to find theparticular solution for this problem as follows: 7000 = 45(10)2 + 600(10) + C and hence
Chapter Ten of Brief Calculus with Integrated Precalculus - Spring 2008.wpd Page 10 - 2
7000 = 4500 + 6000 + C Y C = -3500 Y P(x) = 45x2 + 600x - 3500.The weekly profit obtained by producing 20 units weekly is thereforeP(20) = 45(20)2 + 600(20) - 3500 = 45(400) + 12,000 - 3500 = $26,500
As you noticed in the last example, solving a differential equation together with an initialcondition involves finding the general solution to the differential equation that includes anarbitrary constant and then using the initial condition to determine the arbitrary constant.
Indefinite Integral: The general solution of is called the indefinitedFdx
F x f x= ′ =( ) ( )
integral and is represented as where C is an arbitrary constantf x dx F x C( ) ( )= +∫and F(x) is the solution to the differential equation FN(x) = f (x) that does not have aconstant term.
In this notation, the general solution to the previous example is represented by the following
indefinite integral: . The two features that make this( )90 600 45 6002x dx x x C+ = + +∫the result are the facts that the derivative of 45x2 + 600x equals 90x + 600 and there is anarbitrary constant added to the expression. Now many of the rules that tell us how to find thederivative of a function can be viewed in reverse. That is, they can tell us what functions
produce a specific derivative. For example, since , it follows thatddx
x x5 153 2=
. In general, since , it follows that15 52 3x dx x C= +∫ddx
kx k n xn n+ = +1 1( )
Fact 10.1: for n … -1.kx dxkxn
Cnn
=+
++
∫1
1
The reason n cannot equal -1 is due to the fact that you cannot divide by 0. We will see later
how to handle this special case but at the moment you might recall that .forddx
xx
xln = = −1 1
x > 0.The fact that the derivative of a sum of functions is the sum of the derivatives of the functions,has the following corresponding fact for integrals.
Fact 10.2: ( ( ) ( )) ( ) ( )af x bg x dx a f x dx b g x dx+ = + ∫∫∫
Chapter Ten of Brief Calculus with Integrated Precalculus - Spring 2008.wpd Page 10 - 3
Note, in particular, that (since ),kdx k dx kx C= = +∫∫ ddx
kx C k( )+ =
and (since )kx dxkx
C= +∫2
2ddx
kxC kx
2
2+
=
Example 10.2: Evaluate the following integrals and check the answer.
(a) (b) (c) (d) 12 3x dx∫ 5x dx∫ 7dx∫ ( )12 5 73x x dx+ +∫(e) ( )8 20 6 115 3x x x dx− + −∫
Solution:
(a) 12123 1
124
333 1 4
4x dxx
Cx
C x C=+
+ = + = ++
∫and this can be checked as follows:
ddx
x C x( )3 124 3+ =
(b) = (Check: )5x dx∫52
2xC+
ddx
xC x
52
52
+
=
(c) = 7x + C (Check: )7dx∫ddx
x C( )7 7+ =
(d) = ( )12 5 73x dx x dx+ +∫ 3 74 52
2x x x C+ + +
(e) = ( )8 20 6 115 3x x x dx− + −∫85 1
203 1
62
115 1 3 1 2x x x
x C+ +
+−
++ − +
= 43
6 4 25 3 11x x x x C− + − +
(Check: )ddx
x x x x C x x x( )43
6 4 2 5 35 3 11 8 20 6 11− + − + = − + −
Note: After doing parts (a), (b) and (c) above some people wonder why there is only oneconstant that appears in part (d) instead of three constants. There are two ways oflooking at this. One is to simply say that the sum of three constants is simply anotherconstant. The other way is to realize that it is the integral of the entire expression in part(d) that is to be evaluated and so there should only be one arbitrary constant and the basictest of whether or not the answer is right is that the derivative of the result equals the
expression that is integrated, namely, .ddx
x x x C x x( ) )3 7 12 5 74 52
2 3+ + + = + +
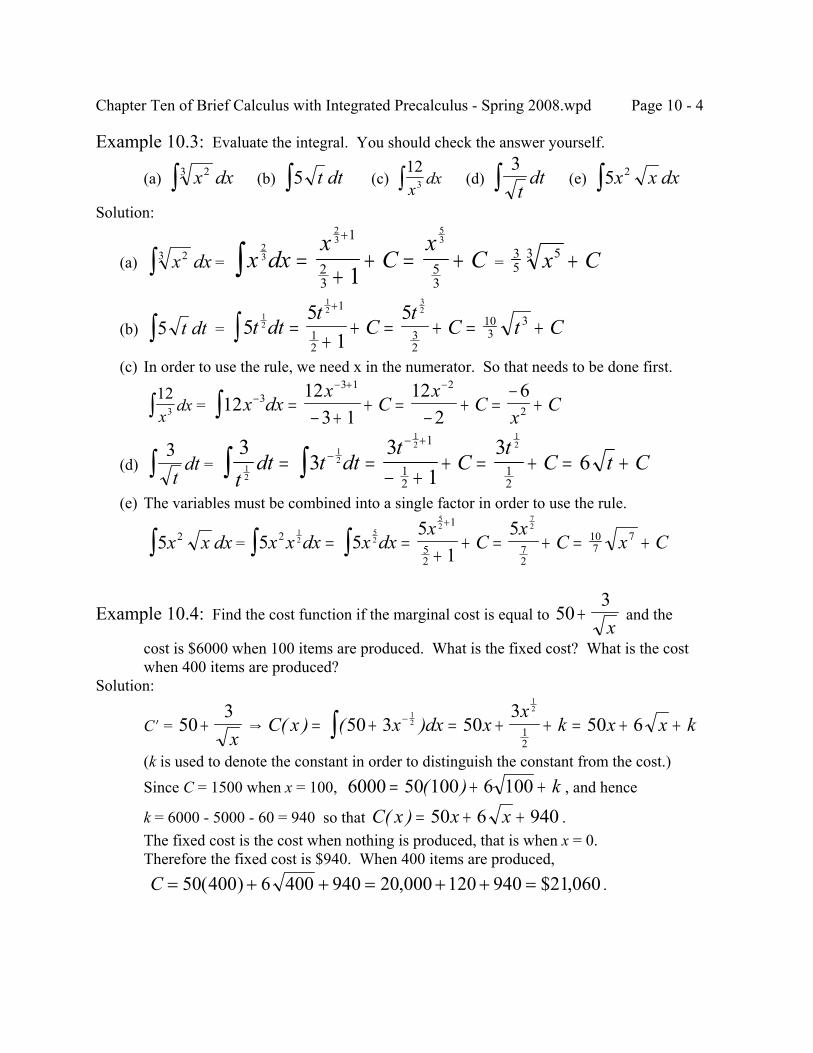
Chapter Ten of Brief Calculus with Integrated Precalculus - Spring 2008.wpd Page 10 - 4
Example 10.3: Evaluate the integral. You should check the answer yourself.
(a) (b) (c) (d) (e) x dx23∫ 5 t dt∫ 123x
dx∫3t
dt∫ 5 2x x dx∫Solution:
(a) = = x dx23∫ x dxx
Cx
C23
23
531
23
531
=+
+ = ++
∫ 35
53 x C+
(b) = 5 t dt∫ 55
151
2
12
321
12
32
103
3t dtt
Ct
C t C=+
+ = + = ++
∫ (c) In order to use the rule, we need x in the numerator. So that needs to be done first.
= 12
3xdx∫ 12
123 1
122
633 1 2
2x dxx
Cx
Cx
C−− + −
=− +
+ =−
+ =−
+∫
(d) = 3t
dt∫3
33
13
612
12
12
121
12
12t
dt t dtt
Ct
C t C= =− +
+ = + = +−− +
∫∫ (e) The variables must be combined into a single factor in order to use the rule.
=5 2x x dx∫ 5 55
152
1
52
72
107
712
52
52
72
x x dx x dxx
Cx
C x C= =+
+ = + = ++
∫∫
Example 10.4: Find the cost function if the marginal cost is equal to and the503
+x
cost is $6000 when 100 items are produced. What is the fixed cost? What is the costwhen 400 items are produced?
Solution:
CN = Y 503
+x
C x x dx xx
k x x k( ) ( )= + = + + = + +−∫ 50 3 503
50 612
12
12
(k is used to denote the constant in order to distinguish the constant from the cost.)Since C = 1500 when x = 100, , and hence6000 50 100 6 100= + +( ) kk = 6000 - 5000 - 60 = 940 so that .C x x x( ) = + +50 6 940The fixed cost is the cost when nothing is produced, that is when x = 0.Therefore the fixed cost is $940. When 400 items are produced, .C = + + = + + =50 400 6 400 940 20 000 120 940 060( ) , $21,
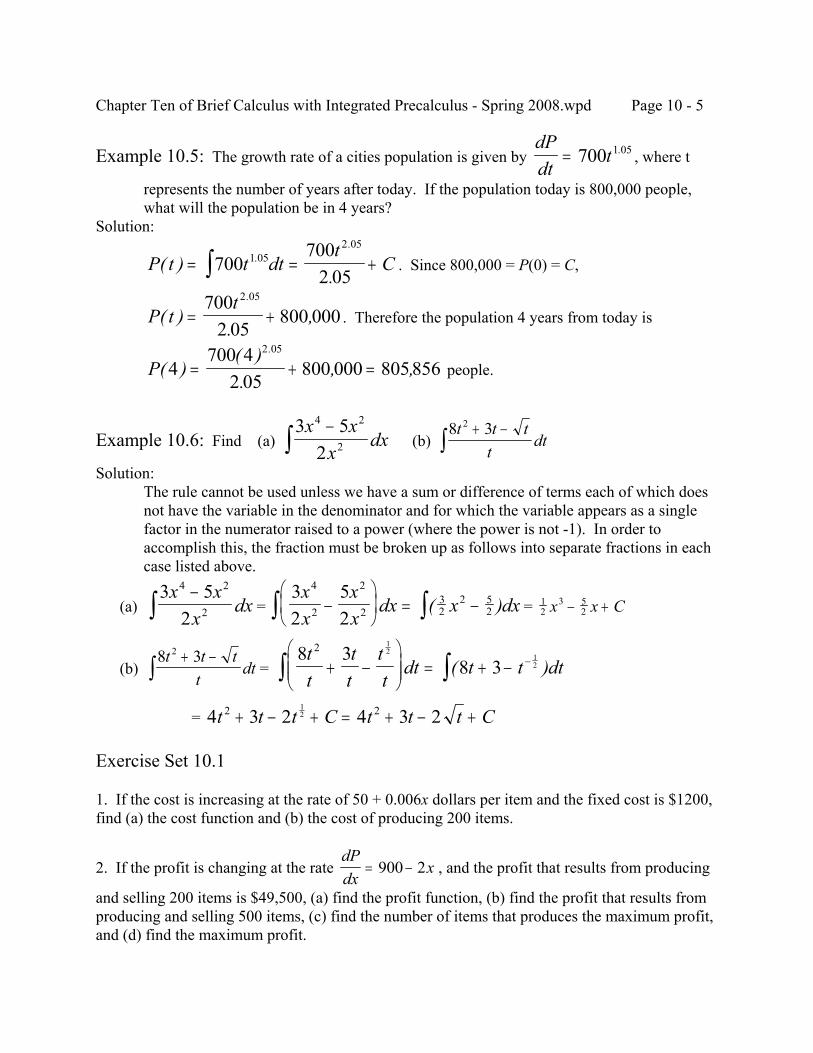
Chapter Ten of Brief Calculus with Integrated Precalculus - Spring 2008.wpd Page 10 - 5
Example 10.5: The growth rate of a cities population is given by , where tdPdt
t= 700 1 05.
represents the number of years after today. If the population today is 800,000 people,what will the population be in 4 years?
Solution:
. Since 800,000 = P(0) = C,P t t dtt
C( ).
..
= = +∫ 700700
2 051 05
2 05
. Therefore the population 4 years from today isP tt
( ).
,.
= +700
2 05800 000
2 05
people.P( )( ).
, ,.
4700 4
2 05800 000 805856
2 05
= + =
Example 10.6: Find (a) (b) 3 5
2
4 2
2
x xx
dx−
∫ 8 32t t tt
dt+ −
∫Solution:
The rule cannot be used unless we have a sum or difference of terms each of which doesnot have the variable in the denominator and for which the variable appears as a singlefactor in the numerator raised to a power (where the power is not -1). In order toaccomplish this, the fraction must be broken up as follows into separate fractions in eachcase listed above.
(a) = = 3 5
2
4 2
2
x xx
dx−
∫32
52
4
2
2
232
2 52
xx
xx
dx x dx−
= −∫∫ ( ) 1
23 5
2x x C− +
(b) = 8 32t t t
tdt
+ −∫
8 38 3
2 12
12
tt
tt
tt
dt t t dt+ −
= + − −∫∫ ( )
= 4 3 2 4 3 22 212t t t C t t t C+ − + = + − +
Exercise Set 10.1
1. If the cost is increasing at the rate of 50 + 0.006x dollars per item and the fixed cost is $1200,find (a) the cost function and (b) the cost of producing 200 items.
2. If the profit is changing at the rate , and the profit that results from producingdPdx
x= −900 2
and selling 200 items is $49,500, (a) find the profit function, (b) find the profit that results fromproducing and selling 500 items, (c) find the number of items that produces the maximum profit,and (d) find the maximum profit.
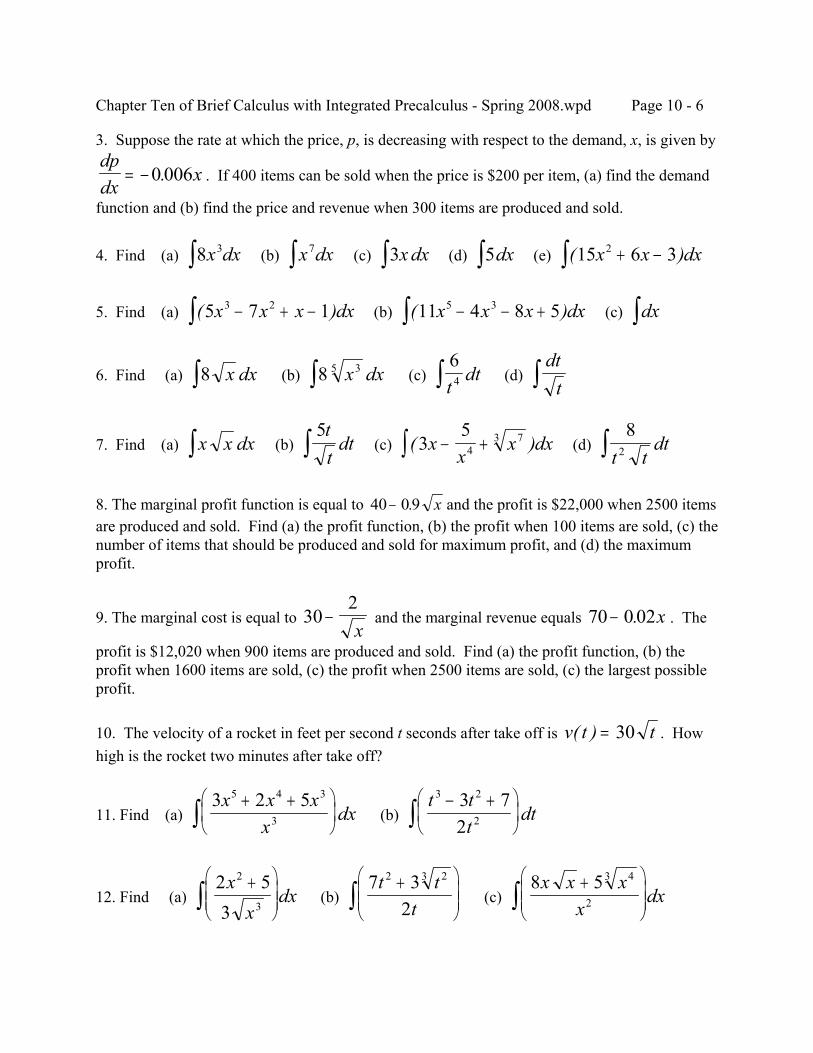
Chapter Ten of Brief Calculus with Integrated Precalculus - Spring 2008.wpd Page 10 - 6
3. Suppose the rate at which the price, p, is decreasing with respect to the demand, x, is given by
. If 400 items can be sold when the price is $200 per item, (a) find the demanddpdx
x= −0 006.
function and (b) find the price and revenue when 300 items are produced and sold.
4. Find (a) (b) (c) (d) (e) 8 3x dx∫ x dx7∫ 3x dx∫ 5dx∫ ( )15 6 32x x dx+ −∫
5. Find (a) (b) (c) ( )5 7 13 2x x x dx− + −∫ ( )11 4 8 55 3x x x dx− − +∫ dx∫
6. Find (a) (b) (c) (d) 8 x dx∫ 8 35 x dx∫64t
dt∫dt
t∫
7. Find (a) (b) (c) (d) x x dx∫5t
tdt∫ ( )3
54
73xx
x dx− +∫8
2t tdt∫
8. The marginal profit function is equal to and the profit is $22,000 when 2500 items40 0 9− . xare produced and sold. Find (a) the profit function, (b) the profit when 100 items are sold, (c) thenumber of items that should be produced and sold for maximum profit, and (d) the maximumprofit.
9. The marginal cost is equal to and the marginal revenue equals . The302
−x
70 0 02− . x
profit is $12,020 when 900 items are produced and sold. Find (a) the profit function, (b) theprofit when 1600 items are sold, (c) the profit when 2500 items are sold, (c) the largest possibleprofit.
10. The velocity of a rocket in feet per second t seconds after take off is . Howv t t( ) = 30high is the rocket two minutes after take off?
11. Find (a) (b) 3 2 55 4 3
3
x x xx
dx+ +
∫
t tt
dt3 2
2
3 72
− +
∫
12. Find (a) (b) (c) 2 53
2
3
xx
dx+
∫
7 32
2 23t tt
+
∫
8 5 43
2
x x xx
dx+
∫
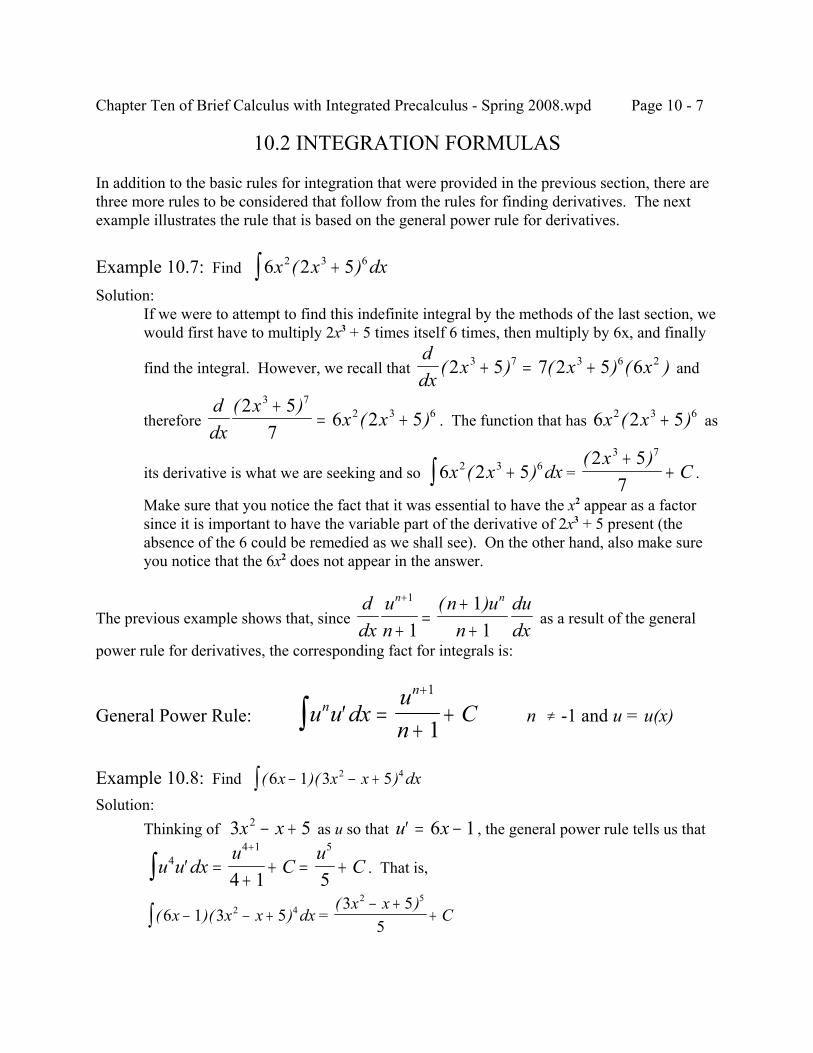
Chapter Ten of Brief Calculus with Integrated Precalculus - Spring 2008.wpd Page 10 - 7
10.2 INTEGRATION FORMULAS
In addition to the basic rules for integration that were provided in the previous section, there arethree more rules to be considered that follow from the rules for finding derivatives. The nextexample illustrates the rule that is based on the general power rule for derivatives.
Example 10.7: Find 6 2 52 3 6x x dx( )+∫Solution:
If we were to attempt to find this indefinite integral by the methods of the last section, wewould first have to multiply 2x3 + 5 times itself 6 times, then multiply by 6x, and finally
find the integral. However, we recall that andddx
x x x( ) ( ) ( )2 5 7 2 5 63 7 3 6 2+ = +
therefore . The function that has asddx
xx x
( )( )
2 57
6 2 53 7
2 3 6+= + 6 2 52 3 6x x( )+
its derivative is what we are seeking and so = .6 2 52 3 6x x dx( )+∫( )2 5
7
3 7xC
++
Make sure that you notice the fact that it was essential to have the x2 appear as a factorsince it is important to have the variable part of the derivative of 2x3 + 5 present (theabsence of the 6 could be remedied as we shall see). On the other hand, also make sureyou notice that the 6x2 does not appear in the answer.
The previous example shows that, since as a result of the generalddx
un
n un
dudx
n n+
+=
++
1
111
( )
power rule for derivatives, the corresponding fact for integrals is:
General Power Rule: n … -1 and u = u(x)u u dxun
Cnn
′ =+
++
∫1
1
Example 10.8: Find ( )( )6 1 3 52 4x x x dx− − +∫Solution:
Thinking of as u so that , the general power rule tells us that3 52x x− + ′ = −u x6 1
. That is,u u dxu
Cu
C44 1 5
4 1 5′ =
++ = +
+
∫= ( )( )6 1 3 52 4x x x dx− − +∫
( )3 55
2 5x xC
− ++
Chapter Ten of Brief Calculus with Integrated Precalculus - Spring 2008.wpd Page 10 - 8
Example 10.9: Find 6 5
3 5 12
tt t
dt+
+ −∫Solution:
Notice that = and that6 5
3 5 12
tt t
dt+
+ −∫ ( ) ( )3 5 1 6 52 12t t t dt+ − +−∫
so that the general power rule can be used if we think of uddt
t t t( )3 5 1 6 52 + − = +
as . Hence,3 5 12t t+ −
= 6 5
3 5 12
tt t
dt+
+ −∫( )3 5 1
12 3 5 1
2 1
12
2
12t t
C t t C+ −− +
+ = + − +− +
Example 10.10: Find x x dx( )5 22 4−∫Solution:
Thinking of 5x2 - 2 as u in the general power rule, the rule tells us that
since .( ) ( )( )
5 2 105 2
52 4
2 5
x x dxx
C− =−
+∫ ddx
x x( )5 2 102 − =
The problem is that the desired integral is missing the 10. This can be taken care of by
observing that, since , it follows thatddx
x x xx x
( ) ( ) ( )( )
5 250
5 5 2 1050
5 22 5 2 4
2 4−=
−= −
= . However, the easiest method of handling this asx x dx( )5 22 4−∫( )5 2
50
2 5xC
−+
a routine matter relies on the following observation. Since a constant factor does notchange what we do with derivatives, a constant factor does not change what we do with
integrals. That is, . Thus, once we realize that a factor of 10kf x dx k f x dx( ) ( )∫ ∫=is needed to find the desired integral, we can obtain it as follows:
= x x dx( )5 22 4−∫ ( ) ( ) ( )( )110
2 4 110
2 410 5 2 10 5 2x x dx x x dx− = −∫∫=
110
5 25
5 250
2 5 2 5( ) ( )xC
xC
−+ =
−+
The basic idea is that, since , the integral is not changed by this insertion and as110 10 1=
a result we end up with the necessary factor.
Chapter Ten of Brief Calculus with Integrated Precalculus - Spring 2008.wpd Page 10 - 9
Fact 10.3: A constant (and ONLY A CONSTANT) may be factored out of an
integral: kf x dx k f x dx( ) ( )= ∫∫
Example 10.11: Find (a) (b) x x dx2 3 115 4( )+∫ ( )( )t t t dt− −∫ 4 3 242 4
Solution:
(a) Since the general power rule would apply if there were a 15ddx
x x( )5 4 153 2+ =
present. The integral is unchanged if we insert in front of the x2 and then factor 115 15 1
15
out of the integral, thereby leaving the desired 15x2 inside the integral as follows.
= x x dx2 3 115 4( )+∫ ( ) ( ) ( ) ( )115
2 3 11 115
3 11 215 5 4 5 4 15x x dx x x dx+ = +∫∫=
115
5 412
5 4180
3 12 3 12( ) ( )xC
xC
++ =
++
(b) Since the general power rule would apply ifddt
t t t t( ) ( )3 24 6 24 6 42 − = − = −
there were a 6 present. Therefore,
= ( )( )t t t dt− −∫ 4 3 242 4 ( )( )( )16
2 46 4 3 24t t t dt− −∫ = 1
62 4
2 5 2 5
3 24 6 2416
3 245
3 2430
( ) ( )( ) ( )
t t t dtt t
Ct t
C− − =−
+ =−
+∫
Example 10.12: Find 3
5 72
xx
dx−∫
Solution:
The difficulty here is that the 3 is in the way since and 3 does notddx
x x( )5 7 102 − =
divide 10. The simplest way to handle this is to get the 3 out of the way first by factoringthe 3 (it is a constant) out of the integral first.
= 3
5 72
xx
dx−∫ 3
5 73 10 5 7
21
102 1
2x
xdx x x dx
−= − −∫∫ ( ) ( )
= = 310
22
12
5 7 103
105 71
2
12
( ) ( )( )
x x dxx
C− =−
+−∫3 5 7
5
2xC
−+
Chapter Ten of Brief Calculus with Integrated Precalculus - Spring 2008.wpd Page 10 - 10
Example 10.13: If and f (5) = 9, find f (x).′ = −f x x( ) ( )4 18 7
Solution:First we find the general solution to the differential equation.
f x x dx x dx x dx( ) ( ) ( )( ) ( )= − = − = −∫∫ ∫4 18 4 4 18 4 4 187 14
7 14
7
= 14
4 188
4 1832
8 8( ) ( )xC
xC
−+ =
−+
Next we use the initial condition f (5) = 9 to find the particular solution of interest here.
Y C = 1.9 54 5 18
32232
88 8
= =−
+ = + = +f C C C( )( ( ) )
Therefore, f xx
( )( )
=−
+4 18
321
8
(You should check the answer and verify and f (5) = 9.)′ = −f x x( ) ( )4 13 7
Now recall the fact that . Therefore,ddx
e e uu u= ′
Exponential Rule: e u dx e Cu u′ = +∫Example 10.14: Find (a) (b) 5 5 7e dxx+∫ ( )6 7 3 7 52
x e dxx x− − +∫Solution: (a) Thinking of 5x + 7 as u so that uN = 5, it follows from the exponential rule that
5 5 7 5 7e dx e u dx e C e Cx u u x+ += ′ = + = +∫∫ (b) In order to use the exponential rule we must have u = 3x2 - 7x + 5 in which case
uN = 6x - 7. Therefore,
= ( )6 7 3 7 52
x e dxx x− − +∫ e u dx e C e Cu u x x′ = + = +− +∫ 3 7 52
Chapter Ten of Brief Calculus with Integrated Precalculus - Spring 2008.wpd Page 10 - 11
Example 10.15: Find (a) (b) (c) e dxx7 4+∫ ( )3 5 6 20 92
t e dtt t− − +∫ 5 7 4e dtt−∫Solution: (a) In order to use the exponential rule the exponent of e must be the function u referred to in
the rule. In that case u = 7x + 4 and we need uN = 7 to appear in the integral in order toevaluate it. Since 7 is a constant, we can use the same technique that was used before:
= 5 5 7e dxx+∫ ( )17
7 4 17
7 4 17
7 47 7e dx e dx e Cx x x+ + += = +∫∫ (b) The derivative of 6t2 - 20t + 9 is 12t -20. Since 12t - 20 = 4(3t - 5),
= ( )3 5 6 20 92
t e dtt t− − +∫ ( )( ) ( )14
6 20 9 14
6 20 94 3 5 12 202 2
t e dt t e dtt t t t− = −− + − +∫∫=
14
6 20 92
e Ct t− + + (c) ( )5
77 4 5
77 4 5
77 47 7e dt e dt e Ct t t− − −= = +∫∫
Example 10.16: If a cars acceleration is given by feet per second2 and itsa t e t( ) = −6 2
velocity and distance at t = 3 seconds are 9 feet per second and 50 feet, find the velocity,v(t), and the distance, s(t), functions.
Solution:
Since , . Hence,a tddt
v t( ) ( )= v t a t dt e dtt( ) ( )= = −∫∫ 6 2
v t e dt e dt e Ct t t( ) ( )( ) ( )= − − = − − = − +− − −∫∫ 12
6 2 12
6 2 12
6 22 2
Since v = 9 when t = 3, 9 12
6 2 3 12
192= − + = − + ⇒ =−e C C C( )
Therefore, .v t e t( ) = − +−12
6 2 192
Since , . Hence,v tddt
s t( ) ( )= s t v t dt e dtt( ) ( ) ( )= = − +−∫∫ 12
6 2 192
s t e dt e t Ct t( ) ( ( ) )= − + = + +− −∫ 14
6 2 192
14
6 2 1922
Since s = 20 when t = 3, = Y .50 314
6 2 3 192
14
572= + + = + +−e C C( ) 115
4 + C C = 854
Therefore, .s t e tt( ) = + +−14
6 2 192
854
Before stating the final rule that we are interested in, it should be noted that the derivative rule
that we have for the natural logarithm, , only applies to positive values of x sinceddx
xx
ln =1
the logarithm is only defined for x > 0. The question that then arises is whether or not there is a
Chapter Ten of Brief Calculus with Integrated Precalculus - Spring 2008.wpd Page 10 - 12
function whose derivative is if x is negative. Now if x is negative, then -x is positive, and1x
hence . Recalling that the absolute value function is suchddx
x
ddx
x
x x xln( )
( )− =
−
−=
−−
=1 1
that |x| = x if x is positive but |x| = -x if x is negative, we see that for x … 0. ddx
xx
ln| |=1
Similarly, in general, .ddx
uuu
ln| |=′
Logarithmic Rule: for u … 0′
= +∫uu
dx u Cln| |
Example 10.17: Find (a) (b) 5
5 3xdx
−∫6 7
3 7 52
tt t
dt−
− +∫Solution:
If the expression in the denominator of both of these examples was raised to any power(such as 2 or 1/2 for a square root), then the general power rule would have been calledfor. However, in both cases there is no exponent. This means the logarithmic rule shouldbe used. Therefore, we need to see the derivative of the denominator in the numerator.
(a) Since the derivative of u = 5x - 3 is uN = 5, according to the logarithmic rule
= 5
5 3xdx
−∫ ln| |5 3x C− +
(b) Since the derivative of 3t2 - 7t + 5 is 6t - 7, according to the logarithmic rule
= 6 7
3 7 52
tt t
dt−
− +∫ ln| |3 7 52t t C− + +
Example 10.18: Find (a) (b) 1
7 4xdx
+∫4 1
8 4 92
xx x
dx−
− +∫Solution:
In both examples the expression in the denominator lacks an exponent. This suggeststhat the logarithmic rule should be used.
(a) Since the derivative of 7x + 4 is 7, we need to see a 7 in the numerator. Since 7 is aconstant, this can be arranged in the usual manner:
= 1
7 4xdx
+∫ ( )ln| |
17 1
717
77 4
77 4
7 4x
dxx
dx x C+
=+
= + +∫∫
Chapter Ten of Brief Calculus with Integrated Precalculus - Spring 2008.wpd Page 10 - 13
(b) Since and the numerator is 4x - 1, we would have theddx
x x x( )8 4 9 16 42 − + = −
desired numerator if the numerator were multiplied by 4, which is a constant. So
= 4 1
8 4 92
xx x
dx−
− +∫( )( )1
42
14 2
4 4 18 4 9
16 48 4 9
xx x
dxx
x xdx
−− +
=−
− +∫ ∫ = 1
428 4 9ln x x C− + +
Example 10.19: Find (a) (b) 2
10
5
5
++∫e
t edt
t
t3
7 4tdt
−∫Solution:
(a) = and therefore( )ddt
t e et t10 10 55 5+ = + ( )5 2 5+ e t
= = 2
10
5
5
++∫e
t edt
t
t( )( )1
55
515
5
5
5 210
10 510
++
=++∫∫
et e
dte
t edt
t
t
t
t15
510ln t e Ct+ +
(b) Since the derivative of 7t - 4 is 7 (and not 3),
= 3
7 4tdt
−∫37 3
737
77 4
77 4
7 4t
dtt
dt t C−
=−
= − +∫∫ ln
Exercise Set 10.2
1. Find (a) (b) (c) 5 5 4 6( )x dx+∫ 4 2 112 3t t dt( )+∫ ( )( )10 7 5 72 8x x x dx+ +∫
2. Find (a) (b) (c) 7
7 3 3( )xdx
−∫ ( )8 3 4 3 52t t t dt+ + +∫15 25 2
2
3
xx x
dx+
+∫
3. Find (a) (b) (c) x x dx3 4 25 1( )−∫2
10 3 2( )tdt
+∫ x x dx3 52 −∫
4. Find (a) (b) ( )( )t t t dt+ +∫ 2 4 162 5 4 2 28 6 12
2
3 2
t tt t t
dt+ −
+ −∫
5. Find (a) (b) (c) 7 4 52 3x x dx( )−∫5
9 2 3( )xdx
+∫ ( )10 2 5 32 3x x x dx− −∫
Chapter Ten of Brief Calculus with Integrated Precalculus - Spring 2008.wpd Page 10 - 14
6. If and f (1) = 23, find f (x).′ = −f x x( ) ( )12 3 5 3
7. If the velocity of an object at time t is given by , find the position at time t,v t t t( ) = +2 12
s(t), if the position is s = 5 when t = 2.
8. Find (a) (b) (c) 8 8 5e dxx+∫ 16 3 4 94
t e dtt −∫ ( )10 64 2 2 2 75 3
x x e dxx x+ + +∫
9. Find (a) (b) (c) e dxx11∫ 3 6 2
te dtt∫ ( )5 1 5 2 62
z e dzz z+ + −∫
10. Find (a) (b) (c) 4 5 3e dxx−∫ 7 3 2 14
t e dtt +∫ ( )30 52 12 6 53
x e dxx x− − +∫
11. The marginal profit function is given by , where the profitdPdx
x e x x= − − + −( )5000 10002 10 25
is in thousands of dollars and x represents thousands of items. If the profit is 300 thousanddollars when 5 thousand items are sold, find the profit function.
12. If the velocity of a car is given by mph, where t = 0 corresponds to 12v t e t( ) .= −80 0 1
noon, and the position of the car at 12 noon is 30 miles from home, what is the position of the carat 3:00 pm? What is the acceleration of the car at 3:00 pm?
13. Find (a) (b) (c) 8
8 11xdx
+∫10 3
5 3 72
xx x
dx−
− +∫8 1
4 22 2
tt t
dt−
− +∫ ( )
14. Find (a) (b) (c) 2
6 5xdx
+∫3 1
3 2 92
xx x
dx+
+ −∫e
edt
t
t
6
63+∫
15. Find (a) (b) (c) 8
9 8xdx
+∫20 5 5
8 3 6 11
2
3 2
x xx x x
dx− +
− + −∫3 38
8
8
++∫
et e
dtt
t
16. If and y = 5 when x = 2, find y as a function of x.dydx x
=−2
1
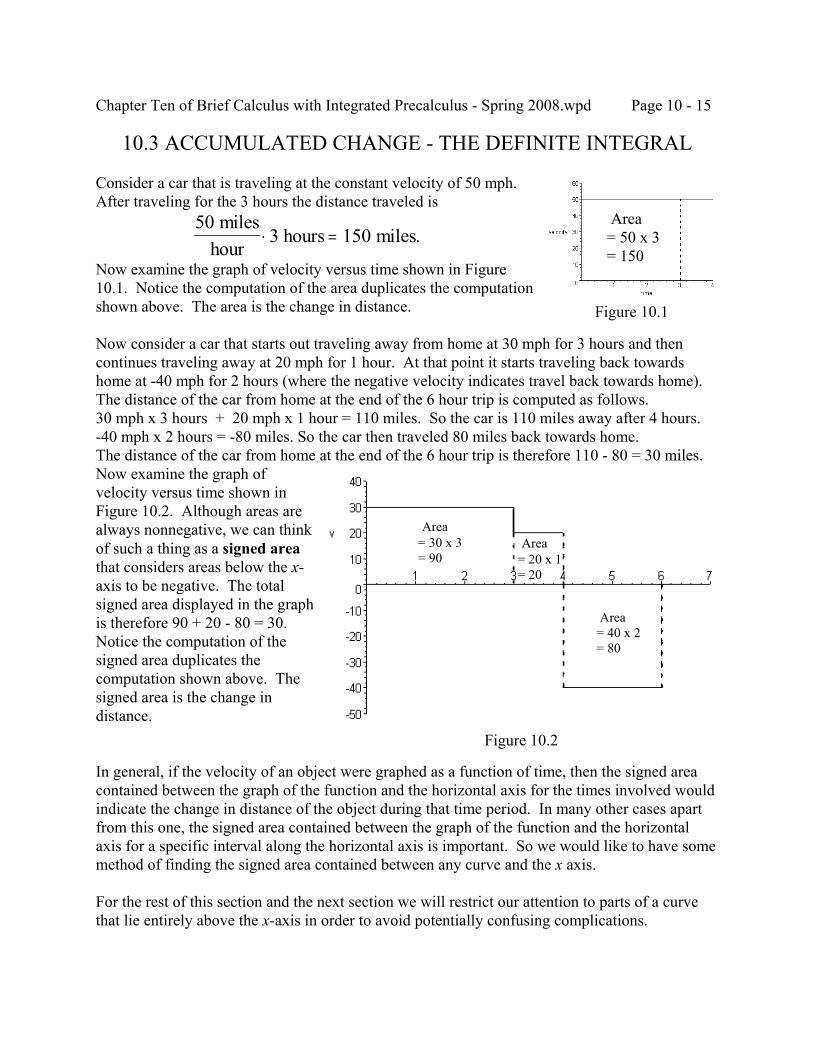
Chapter Ten of Brief Calculus with Integrated Precalculus - Spring 2008.wpd Page 10 - 15
Figure 10.1
Figure 10.2
10.3 ACCUMULATED CHANGE - THE DEFINITE INTEGRAL
Consider a car that is traveling at the constant velocity of 50 mph. After traveling for the 3 hours the distance traveled is
503 150
mileshour
hours miles.⋅ =
Now examine the graph of velocity versus time shown in Figure10.1. Notice the computation of the area duplicates the computationshown above. The area is the change in distance.
Now consider a car that starts out traveling away from home at 30 mph for 3 hours and thencontinues traveling away at 20 mph for 1 hour. At that point it starts traveling back towardshome at -40 mph for 2 hours (where the negative velocity indicates travel back towards home). The distance of the car from home at the end of the 6 hour trip is computed as follows.30 mph x 3 hours + 20 mph x 1 hour = 110 miles. So the car is 110 miles away after 4 hours.-40 mph x 2 hours = -80 miles. So the car then traveled 80 miles back towards home.The distance of the car from home at the end of the 6 hour trip is therefore 110 - 80 = 30 miles.Now examine the graph ofvelocity versus time shown inFigure 10.2. Although areas arealways nonnegative, we can thinkof such a thing as a signed areathat considers areas below the x-axis to be negative. The totalsigned area displayed in the graphis therefore 90 + 20 - 80 = 30. Notice the computation of thesigned area duplicates thecomputation shown above. Thesigned area is the change indistance.
In general, if the velocity of an object were graphed as a function of time, then the signed areacontained between the graph of the function and the horizontal axis for the times involved wouldindicate the change in distance of the object during that time period. In many other cases apartfrom this one, the signed area contained between the graph of the function and the horizontalaxis for a specific interval along the horizontal axis is important. So we would like to have somemethod of finding the signed area contained between any curve and the x axis.
For the rest of this section and the next section we will restrict our attention to parts of a curvethat lie entirely above the x-axis in order to avoid potentially confusing complications.
Area= 50 x 3= 150
Area= 20 x 1= 20
Area= 30 x 3= 90
Area= 40 x 2= 80
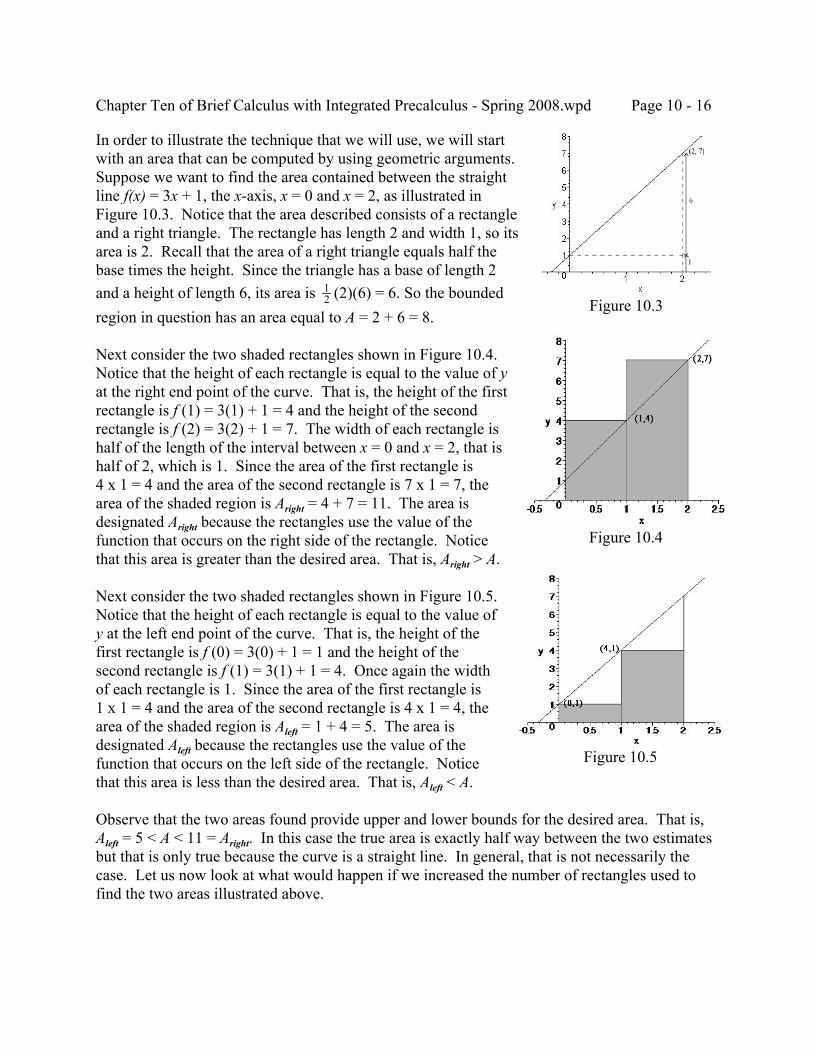
Chapter Ten of Brief Calculus with Integrated Precalculus - Spring 2008.wpd Page 10 - 16
Figure 10.3
In order to illustrate the technique that we will use, we will startwith an area that can be computed by using geometric arguments. Suppose we want to find the area contained between the straightline f(x) = 3x + 1, the x-axis, x = 0 and x = 2, as illustrated inFigure 10.3. Notice that the area described consists of a rectangleand a right triangle. The rectangle has length 2 and width 1, so itsarea is 2. Recall that the area of a right triangle equals half thebase times the height. Since the triangle has a base of length 2and a height of length 6, its area is (2)(6) = 6. So the bounded1
2
region in question has an area equal to A = 2 + 6 = 8.
Next consider the two shaded rectangles shown in Figure 10.4. Notice that the height of each rectangle is equal to the value of yat the right end point of the curve. That is, the height of the firstrectangle is f (1) = 3(1) + 1 = 4 and the height of the secondrectangle is f (2) = 3(2) + 1 = 7. The width of each rectangle ishalf of the length of the interval between x = 0 and x = 2, that ishalf of 2, which is 1. Since the area of the first rectangle is4 x 1 = 4 and the area of the second rectangle is 7 x 1 = 7, thearea of the shaded region is Aright = 4 + 7 = 11. The area isdesignated Aright because the rectangles use the value of thefunction that occurs on the right side of the rectangle. Noticethat this area is greater than the desired area. That is, Aright > A.
Next consider the two shaded rectangles shown in Figure 10.5. Notice that the height of each rectangle is equal to the value ofy at the left end point of the curve. That is, the height of thefirst rectangle is f (0) = 3(0) + 1 = 1 and the height of thesecond rectangle is f (1) = 3(1) + 1 = 4. Once again the widthof each rectangle is 1. Since the area of the first rectangle is1 x 1 = 4 and the area of the second rectangle is 4 x 1 = 4, thearea of the shaded region is Aleft = 1 + 4 = 5. The area isdesignated Aleft because the rectangles use the value of thefunction that occurs on the left side of the rectangle. Noticethat this area is less than the desired area. That is, Aleft < A.
Observe that the two areas found provide upper and lower bounds for the desired area. That is,Aleft = 5 < A < 11 = Aright. In this case the true area is exactly half way between the two estimatesbut that is only true because the curve is a straight line. In general, that is not necessarily thecase. Let us now look at what would happen if we increased the number of rectangles used tofind the two areas illustrated above.
Figure 10.4
Figure 10.5
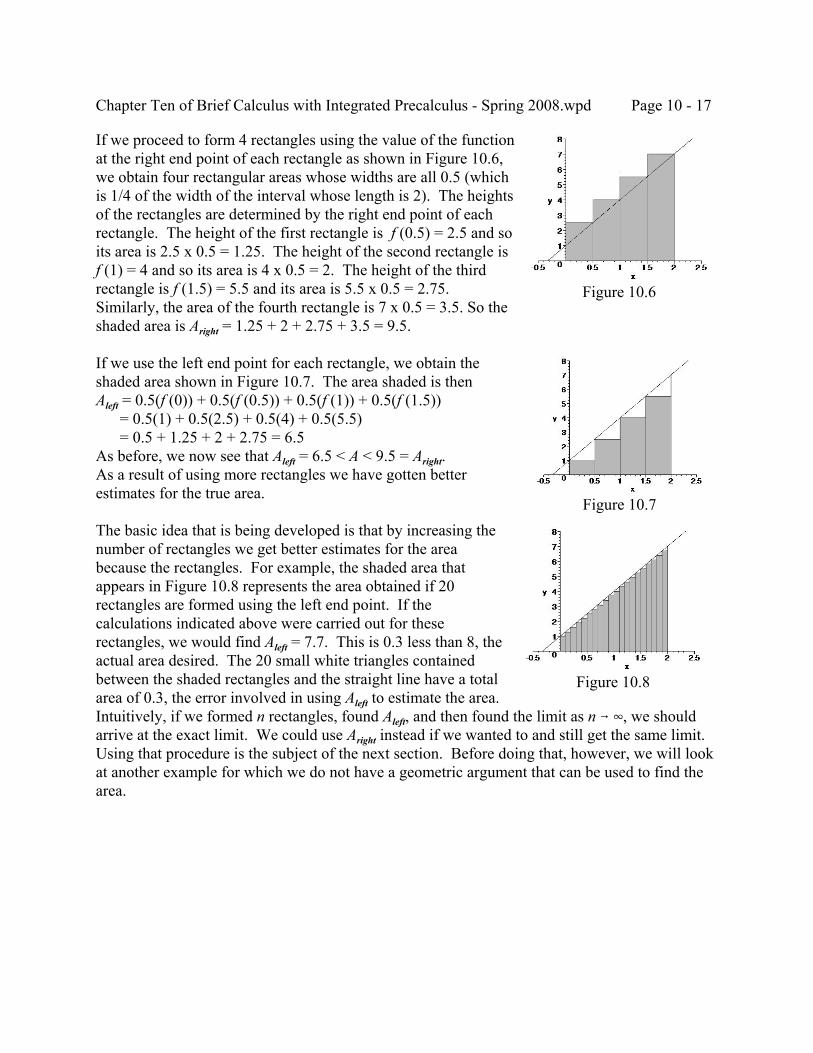
Chapter Ten of Brief Calculus with Integrated Precalculus - Spring 2008.wpd Page 10 - 17
If we proceed to form 4 rectangles using the value of the functionat the right end point of each rectangle as shown in Figure 10.6,we obtain four rectangular areas whose widths are all 0.5 (whichis 1/4 of the width of the interval whose length is 2). The heightsof the rectangles are determined by the right end point of eachrectangle. The height of the first rectangle is f (0.5) = 2.5 and soits area is 2.5 x 0.5 = 1.25. The height of the second rectangle is f (1) = 4 and so its area is 4 x 0.5 = 2. The height of the thirdrectangle is f (1.5) = 5.5 and its area is 5.5 x 0.5 = 2.75.Similarly, the area of the fourth rectangle is 7 x 0.5 = 3.5. So theshaded area is Aright = 1.25 + 2 + 2.75 + 3.5 = 9.5.
If we use the left end point for each rectangle, we obtain theshaded area shown in Figure 10.7. The area shaded is thenAleft = 0.5(f (0)) + 0.5(f (0.5)) + 0.5(f (1)) + 0.5(f (1.5)) = 0.5(1) + 0.5(2.5) + 0.5(4) + 0.5(5.5) = 0.5 + 1.25 + 2 + 2.75 = 6.5As before, we now see that Aleft = 6.5 < A < 9.5 = Aright.As a result of using more rectangles we have gotten betterestimates for the true area.
The basic idea that is being developed is that by increasing thenumber of rectangles we get better estimates for the areabecause the rectangles. For example, the shaded area thatappears in Figure 10.8 represents the area obtained if 20rectangles are formed using the left end point. If thecalculations indicated above were carried out for theserectangles, we would find Aleft = 7.7. This is 0.3 less than 8, theactual area desired. The 20 small white triangles containedbetween the shaded rectangles and the straight line have a totalarea of 0.3, the error involved in using Aleft to estimate the area. Intuitively, if we formed n rectangles, found Aleft, and then found the limit as n 6 4, we shouldarrive at the exact limit. We could use Aright instead if we wanted to and still get the same limit. Using that procedure is the subject of the next section. Before doing that, however, we will lookat another example for which we do not have a geometric argument that can be used to find thearea.
Figure 10.6
Figure 10.7
Figure 10.8
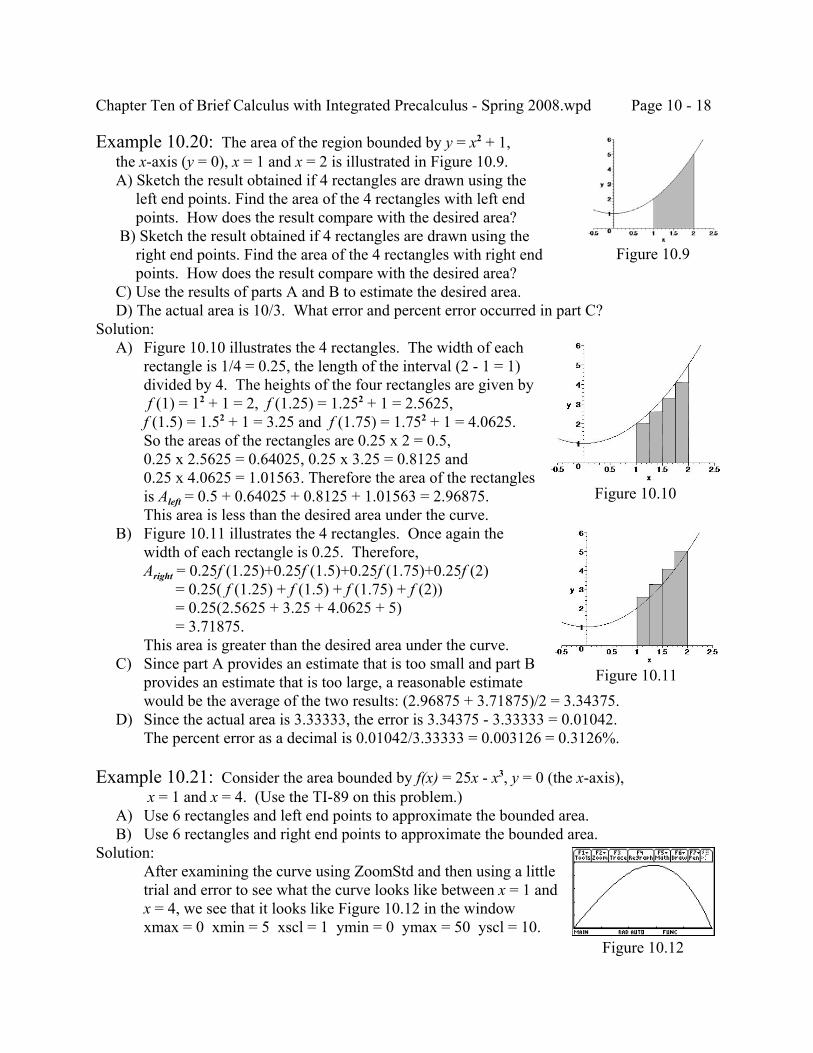
Chapter Ten of Brief Calculus with Integrated Precalculus - Spring 2008.wpd Page 10 - 18
Example 10.20: The area of the region bounded by y = x2 + 1, the x-axis (y = 0), x = 1 and x = 2 is illustrated in Figure 10.9. A) Sketch the result obtained if 4 rectangles are drawn using the left end points. Find the area of the 4 rectangles with left end points. How does the result compare with the desired area? B) Sketch the result obtained if 4 rectangles are drawn using the right end points. Find the area of the 4 rectangles with right end points. How does the result compare with the desired area? C) Use the results of parts A and B to estimate the desired area. D) The actual area is 10/3. What error and percent error occurred in part C?Solution: A) Figure 10.10 illustrates the 4 rectangles. The width of each
rectangle is 1/4 = 0.25, the length of the interval (2 - 1 = 1)divided by 4. The heights of the four rectangles are given by f (1) = 12 + 1 = 2, f (1.25) = 1.252 + 1 = 2.5625,f (1.5) = 1.52 + 1 = 3.25 and f (1.75) = 1.752 + 1 = 4.0625.So the areas of the rectangles are 0.25 x 2 = 0.5,0.25 x 2.5625 = 0.64025, 0.25 x 3.25 = 0.8125 and0.25 x 4.0625 = 1.01563. Therefore the area of the rectanglesis Aleft = 0.5 + 0.64025 + 0.8125 + 1.01563 = 2.96875.This area is less than the desired area under the curve.
B) Figure 10.11 illustrates the 4 rectangles. Once again thewidth of each rectangle is 0.25. Therefore,Aright = 0.25f (1.25)+0.25f (1.5)+0.25f (1.75)+0.25f (2) = 0.25( f (1.25) + f (1.5) + f (1.75) + f (2)) = 0.25(2.5625 + 3.25 + 4.0625 + 5) = 3.71875.This area is greater than the desired area under the curve.
C) Since part A provides an estimate that is too small and part Bprovides an estimate that is too large, a reasonable estimatewould be the average of the two results: (2.96875 + 3.71875)/2 = 3.34375.
D) Since the actual area is 3.33333, the error is 3.34375 - 3.33333 = 0.01042.The percent error as a decimal is 0.01042/3.33333 = 0.003126 = 0.3126%.
Example 10.21: Consider the area bounded by f(x) = 25x - x3, y = 0 (the x-axis), x = 1 and x = 4. (Use the TI-89 on this problem.)
A) Use 6 rectangles and left end points to approximate the bounded area. B) Use 6 rectangles and right end points to approximate the bounded area.Solution:
After examining the curve using ZoomStd and then using a littletrial and error to see what the curve looks like between x = 1 andx = 4, we see that it looks like Figure 10.12 in the windowxmax = 0 xmin = 5 xscl = 1 ymin = 0 ymax = 50 yscl = 10.
Figure 10.9
Figure 10.10
Figure 10.11
Figure 10.12
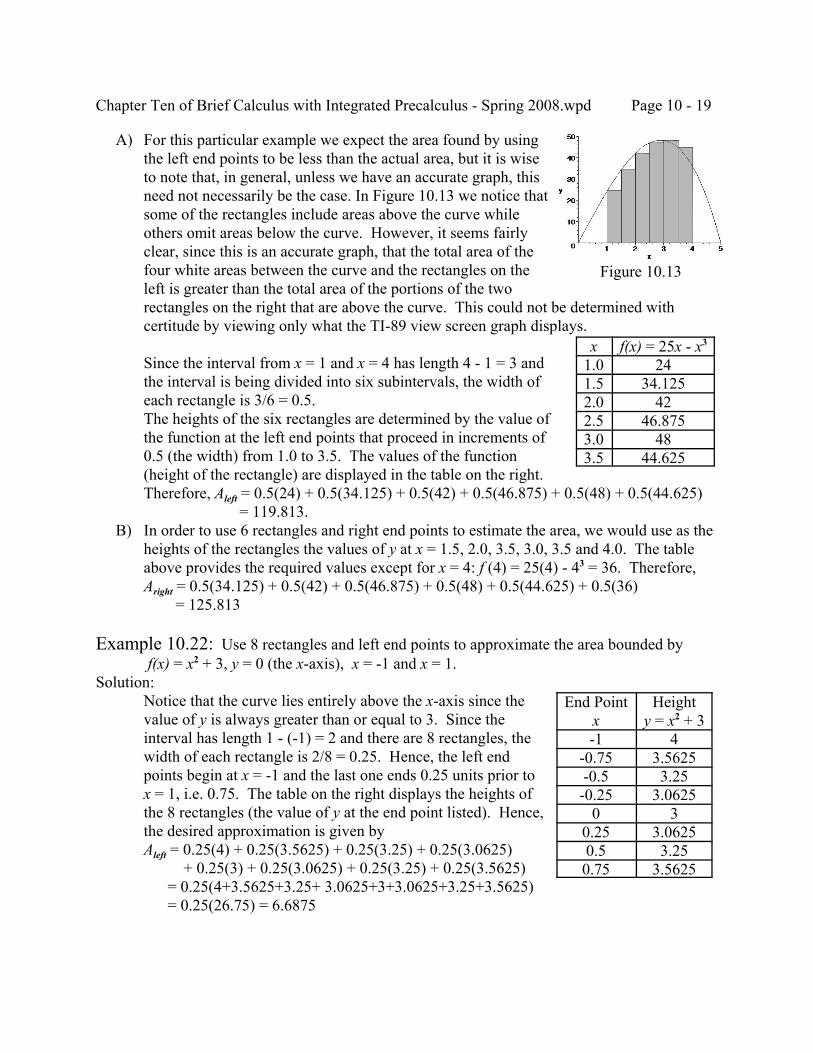
Chapter Ten of Brief Calculus with Integrated Precalculus - Spring 2008.wpd Page 10 - 19
A) For this particular example we expect the area found by usingthe left end points to be less than the actual area, but it is wiseto note that, in general, unless we have an accurate graph, thisneed not necessarily be the case. In Figure 10.13 we notice thatsome of the rectangles include areas above the curve whileothers omit areas below the curve. However, it seems fairlyclear, since this is an accurate graph, that the total area of thefour white areas between the curve and the rectangles on theleft is greater than the total area of the portions of the tworectangles on the right that are above the curve. This could not be determined withcertitude by viewing only what the TI-89 view screen graph displays.
Since the interval from x = 1 and x = 4 has length 4 - 1 = 3 andthe interval is being divided into six subintervals, the width ofeach rectangle is 3/6 = 0.5.The heights of the six rectangles are determined by the value ofthe function at the left end points that proceed in increments of0.5 (the width) from 1.0 to 3.5. The values of the function(height of the rectangle) are displayed in the table on the right.Therefore, Aleft = 0.5(24) + 0.5(34.125) + 0.5(42) + 0.5(46.875) + 0.5(48) + 0.5(44.625) = 119.813.
B) In order to use 6 rectangles and right end points to estimate the area, we would use as theheights of the rectangles the values of y at x = 1.5, 2.0, 3.5, 3.0, 3.5 and 4.0. The tableabove provides the required values except for x = 4: f (4) = 25(4) - 43 = 36. Therefore,Aright = 0.5(34.125) + 0.5(42) + 0.5(46.875) + 0.5(48) + 0.5(44.625) + 0.5(36) = 125.813
Example 10.22: Use 8 rectangles and left end points to approximate the area bounded by f(x) = x2 + 3, y = 0 (the x-axis), x = -1 and x = 1.
Solution:Notice that the curve lies entirely above the x-axis since thevalue of y is always greater than or equal to 3. Since theinterval has length 1 - (-1) = 2 and there are 8 rectangles, thewidth of each rectangle is 2/8 = 0.25. Hence, the left endpoints begin at x = -1 and the last one ends 0.25 units prior tox = 1, i.e. 0.75. The table on the right displays the heights ofthe 8 rectangles (the value of y at the end point listed). Hence,the desired approximation is given byAleft = 0.25(4) + 0.25(3.5625) + 0.25(3.25) + 0.25(3.0625) + 0.25(3) + 0.25(3.0625) + 0.25(3.25) + 0.25(3.5625) = 0.25(4+3.5625+3.25+ 3.0625+3+3.0625+3.25+3.5625) = 0.25(26.75) = 6.6875
Figure 10.13
x f(x) = 25x - x3
1.0 241.5 34.1252.0 422.5 46.8753.0 483.5 44.625
End Pointx
Heighty = x2 + 3
-1 4-0.75 3.5625-0.5 3.25-0.25 3.0625
0 30.25 3.06250.5 3.250.75 3.5625
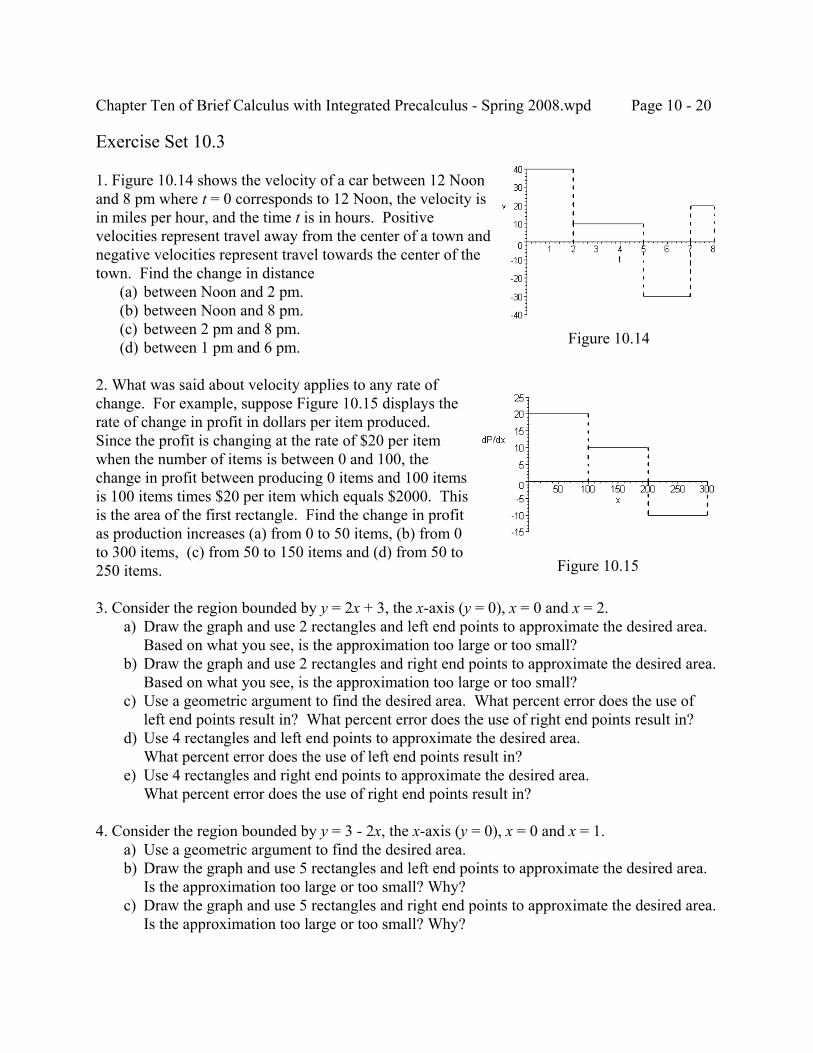
Chapter Ten of Brief Calculus with Integrated Precalculus - Spring 2008.wpd Page 10 - 20
Figure 10.14
Figure 10.15
Exercise Set 10.3
1. Figure 10.14 shows the velocity of a car between 12 Noonand 8 pm where t = 0 corresponds to 12 Noon, the velocity isin miles per hour, and the time t is in hours. Positivevelocities represent travel away from the center of a town andnegative velocities represent travel towards the center of thetown. Find the change in distance (a) between Noon and 2 pm. (b) between Noon and 8 pm. (c) between 2 pm and 8 pm. (d) between 1 pm and 6 pm.
2. What was said about velocity applies to any rate ofchange. For example, suppose Figure 10.15 displays therate of change in profit in dollars per item produced. Since the profit is changing at the rate of $20 per itemwhen the number of items is between 0 and 100, thechange in profit between producing 0 items and 100 itemsis 100 items times $20 per item which equals $2000. Thisis the area of the first rectangle. Find the change in profitas production increases (a) from 0 to 50 items, (b) from 0to 300 items, (c) from 50 to 150 items and (d) from 50 to250 items.
3. Consider the region bounded by y = 2x + 3, the x-axis (y = 0), x = 0 and x = 2. a) Draw the graph and use 2 rectangles and left end points to approximate the desired area.
Based on what you see, is the approximation too large or too small? b) Draw the graph and use 2 rectangles and right end points to approximate the desired area.
Based on what you see, is the approximation too large or too small? c) Use a geometric argument to find the desired area. What percent error does the use of
left end points result in? What percent error does the use of right end points result in? d) Use 4 rectangles and left end points to approximate the desired area.
What percent error does the use of left end points result in? e) Use 4 rectangles and right end points to approximate the desired area.
What percent error does the use of right end points result in?
4. Consider the region bounded by y = 3 - 2x, the x-axis (y = 0), x = 0 and x = 1. a) Use a geometric argument to find the desired area. b) Draw the graph and use 5 rectangles and left end points to approximate the desired area.
Is the approximation too large or too small? Why? c) Draw the graph and use 5 rectangles and right end points to approximate the desired area.
Is the approximation too large or too small? Why?
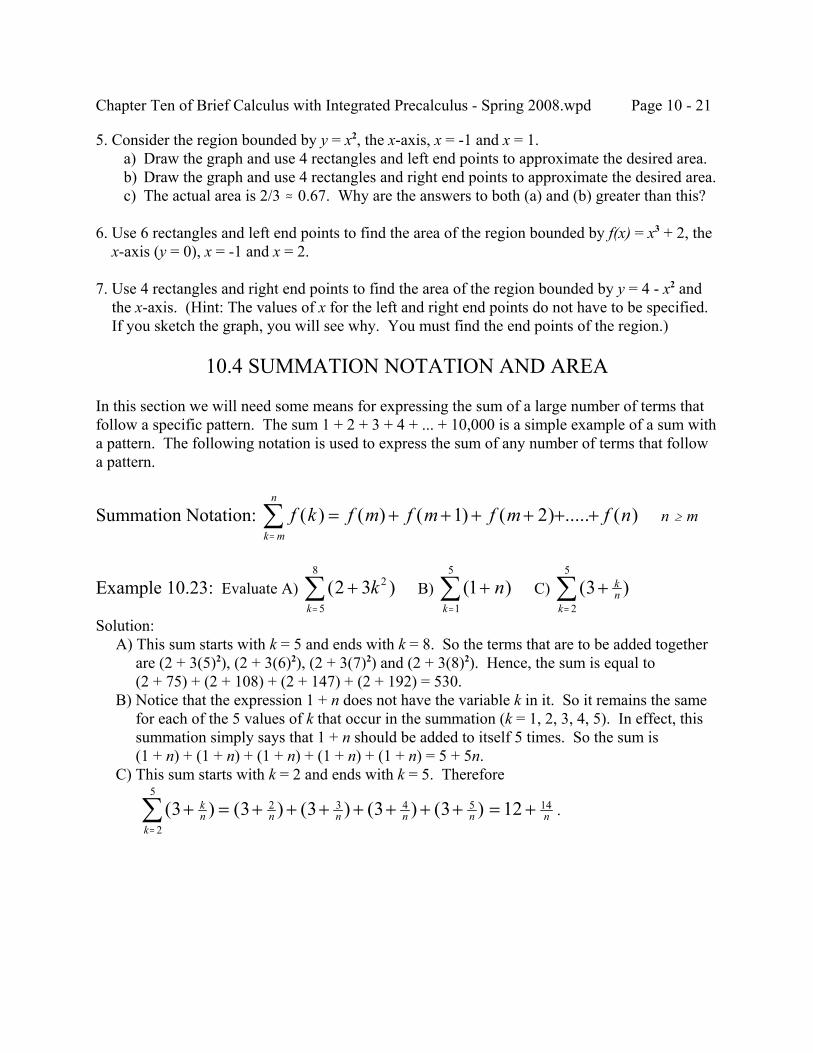
Chapter Ten of Brief Calculus with Integrated Precalculus - Spring 2008.wpd Page 10 - 21
5. Consider the region bounded by y = x2, the x-axis, x = -1 and x = 1. a) Draw the graph and use 4 rectangles and left end points to approximate the desired area. b) Draw the graph and use 4 rectangles and right end points to approximate the desired area. c) The actual area is 2/3 . 0.67. Why are the answers to both (a) and (b) greater than this?
6. Use 6 rectangles and left end points to find the area of the region bounded by f(x) = x3 + 2, the x-axis (y = 0), x = -1 and x = 2.
7. Use 4 rectangles and right end points to find the area of the region bounded by y = 4 - x2 and the x-axis. (Hint: The values of x for the left and right end points do not have to be specified. If you sketch the graph, you will see why. You must find the end points of the region.)
10.4 SUMMATION NOTATION AND AREA
In this section we will need some means for expressing the sum of a large number of terms thatfollow a specific pattern. The sum 1 + 2 + 3 + 4 + ... + 10,000 is a simple example of a sum witha pattern. The following notation is used to express the sum of any number of terms that followa pattern.
Summation Notation: n $ mf k f m f m f m f nk m
n
( ) ( ) ( ) ( ) ..... ( )= + + + + + +=∑ 1 2
Example 10.23: Evaluate A) B) C) ( )2 3 2
5
8
+=∑ kk
( )11
5
+=∑ nk
( )32
5
+=∑ k
nk
Solution: A) This sum starts with k = 5 and ends with k = 8. So the terms that are to be added together are (2 + 3(5)2), (2 + 3(6)2), (2 + 3(7)2) and (2 + 3(8)2). Hence, the sum is equal to (2 + 75) + (2 + 108) + (2 + 147) + (2 + 192) = 530. B) Notice that the expression 1 + n does not have the variable k in it. So it remains the same for each of the 5 values of k that occur in the summation (k = 1, 2, 3, 4, 5). In effect, this summation simply says that 1 + n should be added to itself 5 times. So the sum is (1 + n) + (1 + n) + (1 + n) + (1 + n) + (1 + n) = 5 + 5n. C) This sum starts with k = 2 and ends with k = 5. Therefore
.( ) ( ) ( ) ( ) ( )3 3 3 3 32
2
53 4 5+ = + + + + + + +
=∑ k
n nk
n n n = +12 14n
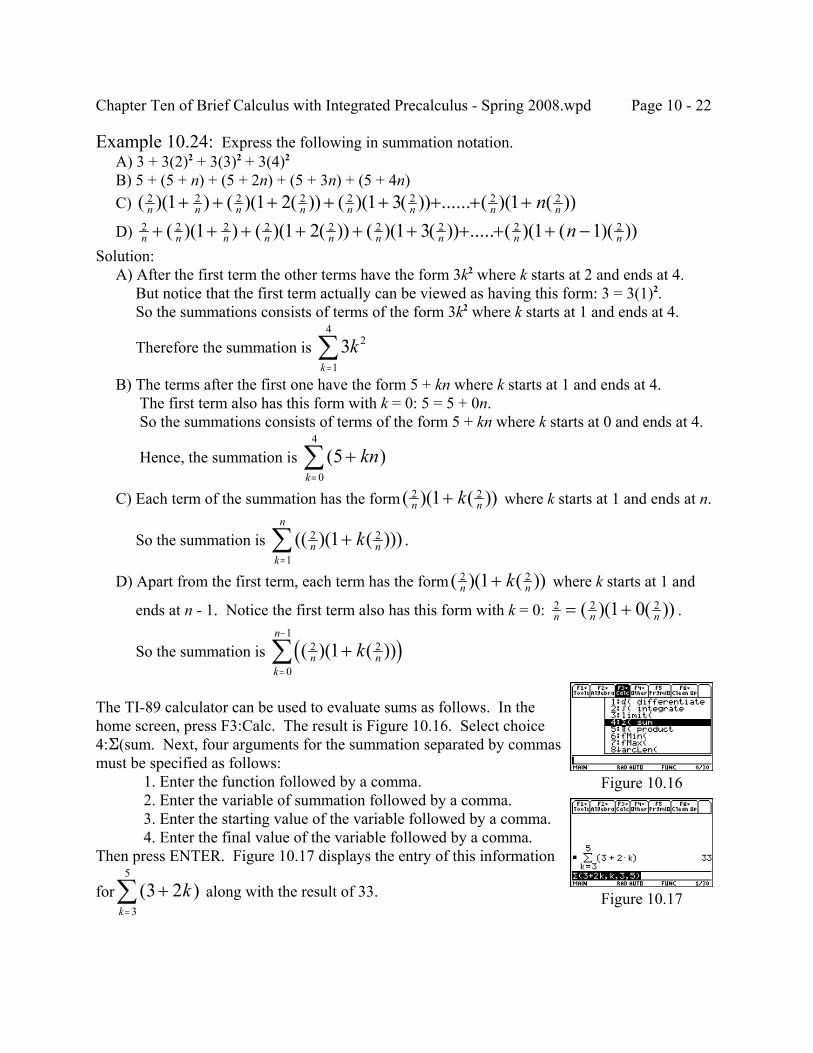
Chapter Ten of Brief Calculus with Integrated Precalculus - Spring 2008.wpd Page 10 - 22
Example 10.24: Express the following in summation notation. A) 3 + 3(2)2 + 3(3)2 + 3(4)2
B) 5 + (5 + n) + (5 + 2n) + (5 + 3n) + (5 + 4n) C) ( )( ) ( )( ( )) ( )( ( )) ...... ( )( ( ))2 2 2 2 2 2 2 21 1 2 1 3 1n n n n n n n nn+ + + + + + + + D) 2 2 2 2 2 2 2 2 21 1 2 1 3 1 1n n n n n n n n nn+ + + + + + + + + −( )( ) ( )( ( )) ( )( ( )) ( )( ( )( )).....Solution: A) After the first term the other terms have the form 3k2 where k starts at 2 and ends at 4. But notice that the first term actually can be viewed as having this form: 3 = 3(1)2. So the summations consists of terms of the form 3k2 where k starts at 1 and ends at 4.
Therefore the summation is 3 2
1
4
kk=∑
B) The terms after the first one have the form 5 + kn where k starts at 1 and ends at 4. The first term also has this form with k = 0: 5 = 5 + 0n. So the summations consists of terms of the form 5 + kn where k starts at 0 and ends at 4.
Hence, the summation is ( )50
4
+=∑ knk
C) Each term of the summation has the form where k starts at 1 and ends at n.( )( ( ))2 21n nk+
So the summation is .(( )( ( )))2 2
1
1n nk
n
k+=∑
D) Apart from the first term, each term has the form where k starts at 1 and( )( ( ))2 21n nk+ ends at n - 1. Notice the first term also has this form with k = 0: .2 2 21 0n n n= +( )( ( ))
So the summation is ( )( )( ( ))2 2
0
1
1n nk
n
k+=
−
∑
The TI-89 calculator can be used to evaluate sums as follows. In thehome screen, press F3:Calc. The result is Figure 10.16. Select choice4:G(sum. Next, four arguments for the summation separated by commasmust be specified as follows:
1. Enter the function followed by a comma.2. Enter the variable of summation followed by a comma.3. Enter the starting value of the variable followed by a comma.4. Enter the final value of the variable followed by a comma.
Then press ENTER. Figure 10.17 displays the entry of this information
for along with the result of 33.( )3 23
5
+=∑ kk
Figure 10.16
Figure 10.17
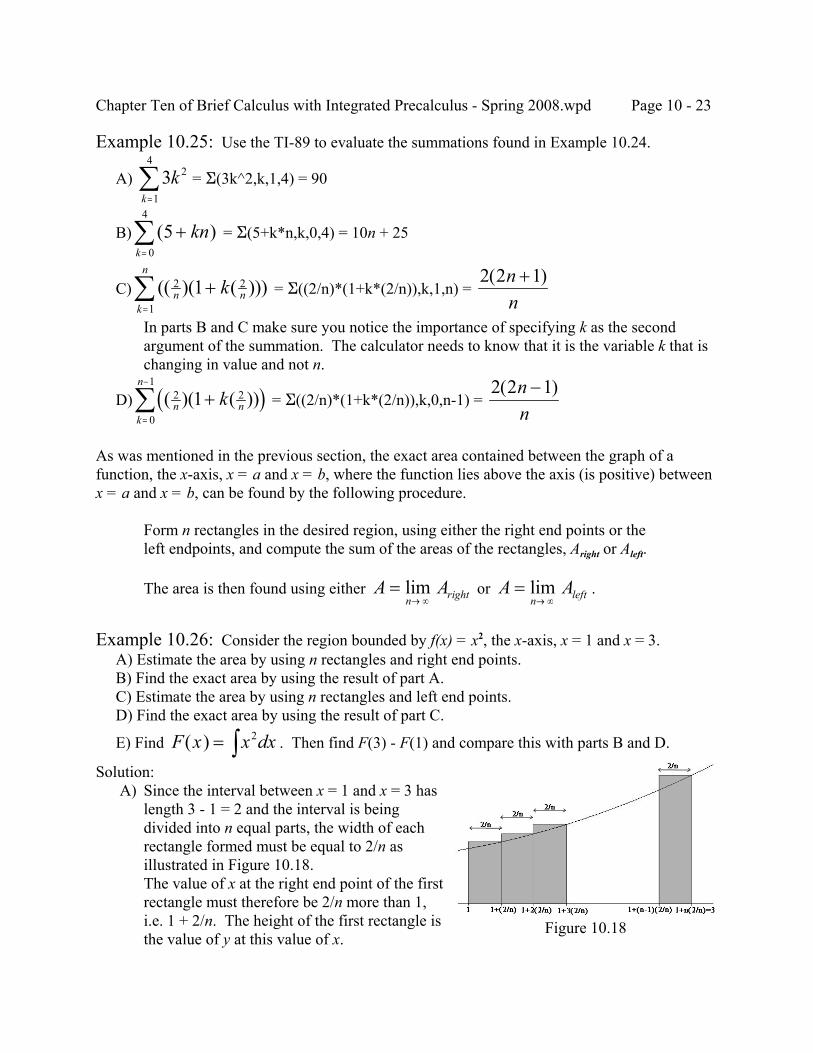
Chapter Ten of Brief Calculus with Integrated Precalculus - Spring 2008.wpd Page 10 - 23
Example 10.25: Use the TI-89 to evaluate the summations found in Example 10.24.
A) = G(3k^2,k,1,4) = 903 2
1
4
kk=∑
B) = G(5+k*n,k,0,4) = 10n + 25( )50
4
+=∑ knk
C) = G((2/n)*(1+k*(2/n)),k,1,n) = (( )( ( )))2 2
1
1n nk
n
k+=∑ 2 2 1( )n
n+
In parts B and C make sure you notice the importance of specifying k as the secondargument of the summation. The calculator needs to know that it is the variable k that ischanging in value and not n.
D) = G((2/n)*(1+k*(2/n)),k,0,n-1) = ( )( )( ( ))2 2
0
1
1n nk
n
k+=
−
∑ 2 2 1( )nn−
As was mentioned in the previous section, the exact area contained between the graph of afunction, the x-axis, x = a and x = b, where the function lies above the axis (is positive) betweenx = a and x = b, can be found by the following procedure.
Form n rectangles in the desired region, using either the right end points or theleft endpoints, and compute the sum of the areas of the rectangles, Aright or Aleft.
The area is then found using either or .A An right=→ ∞
lim A An left=→ ∞
lim
Example 10.26: Consider the region bounded by f(x) = x2, the x-axis, x = 1 and x = 3. A) Estimate the area by using n rectangles and right end points. B) Find the exact area by using the result of part A. C) Estimate the area by using n rectangles and left end points. D) Find the exact area by using the result of part C.
E) Find . Then find F(3) - F(1) and compare this with parts B and D.F x x dx( ) = ∫ 2
Solution: A) Since the interval between x = 1 and x = 3 has
length 3 - 1 = 2 and the interval is beingdivided into n equal parts, the width of eachrectangle formed must be equal to 2/n asillustrated in Figure 10.18.The value of x at the right end point of the firstrectangle must therefore be 2/n more than 1,i.e. 1 + 2/n. The height of the first rectangle isthe value of y at this value of x.
Figure 10.18
Chapter Ten of Brief Calculus with Integrated Precalculus - Spring 2008.wpd Page 10 - 24
Hence, for the first rectangle:Width = 2
n
Right end point = 1 + 2n
Height = (1 + )22n
Area = Height x Width = ( )(1 + )22n
2n
The value of x at the right end point of the second rectangle must be 2/n more than1 + 2/n, i.e. 1 + 2/n + 2/n = 1 + 2(2/n). Hence, for the second rectangle:
Width = 2n
Right end point = 1 + 2( )2n
Height = (1 + 2( ))22n
Area = Height x Width = ( )(1 + 2( ))22n
2n
The value of x at the right end point of the third rectangle must be 2/n more than1 + 2(2/n), i.e. 1 + 2(2/n) + 2/n = 1 + 3(2/n). Hence, for the third rectangle:
Width = 2n
Right end point = 1 + 3( )2n
Height = (1 + 3( ))22n
Area = Height x Width = ( )(1 + 3( ))22n
2n
Notice that the right end point of the kth rectangle is determined by the sum of 1 and ktimes , the width of the rectangle. In particular, the value of x at the right end point of2
n
the nth rectangle must be 1 + n(2/n) = 1 + 2 = 3. Hence, for the nth rectangle:Width = 2
n
Right end point = 1 + n( )2n
Height = (1 + n( ))22n
Area = Height x Width = ( )(1 + n( ))22n
2n
The desired estimate of the area in question is the sum of the areas of these rectangles:Aright(n) = ( )(1 + )2 + ( )(1 + 2( ))2 + ( )(1 + 3( ))2 + ... + ( )(1 + n( ))22
n2n
2n
2n
2n
2n
2n
2n
= ( )( ( ))2 2 2
1
1n nk
n
k+=∑
We can now use the TI-89 to evaluate this summation to obtain
Aright(n) = 2 13 12 2
3
2
2( )n n
n+ +
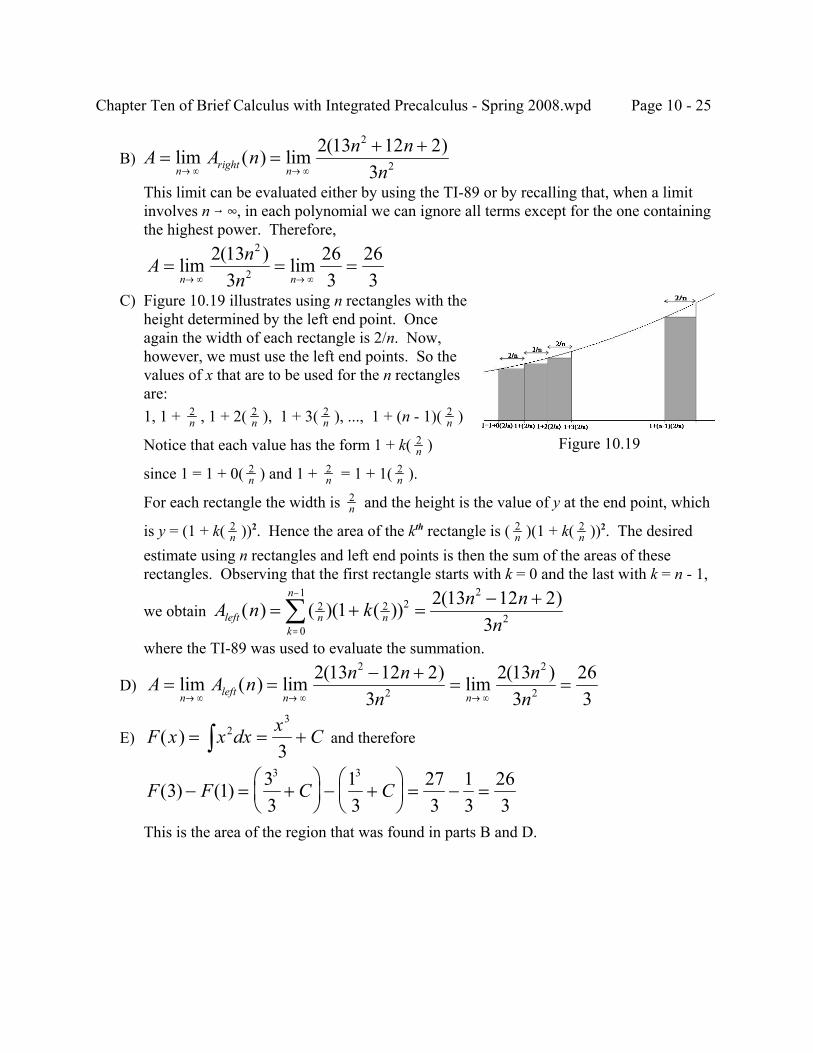
Chapter Ten of Brief Calculus with Integrated Precalculus - Spring 2008.wpd Page 10 - 25
B) A A n n nnn right n
= =+ +
→ ∞ → ∞lim ( ) lim ( )2 13 12 2
3
2
2
This limit can be evaluated either by using the TI-89 or by recalling that, when a limitinvolves n 6 4, in each polynomial we can ignore all terms except for the one containingthe highest power. Therefore,
A nnn n
= = =→ ∞ → ∞
lim ( ) lim2 133
263
263
2
2
C) Figure 10.19 illustrates using n rectangles with theheight determined by the left end point. Onceagain the width of each rectangle is 2/n. Now,however, we must use the left end points. So thevalues of x that are to be used for the n rectanglesare:1, 1 + , 1 + 2( ), 1 + 3( ), ..., 1 + (n - 1)( )2
n2n
2n
2n
Notice that each value has the form 1 + k( )2n
since 1 = 1 + 0( ) and 1 + = 1 + 1( ).2n
2n
2n
For each rectangle the width is and the height is the value of y at the end point, which2n
is y = (1 + k( ))2. Hence the area of the kth rectangle is ( )(1 + k( ))2. The desired2n
2n
2n
estimate using n rectangles and left end points is then the sum of the areas of theserectangles. Observing that the first rectangle starts with k = 0 and the last with k = n - 1,
we obtain A n k n nnleft n n
k
n
( ) ( )( ( )) ( )= + =
− +
=
−
∑ 2 2 22
20
1
1 2 13 12 23
where the TI-89 was used to evaluate the summation.
D) A A n n nn
nnn left n n
= =− +
= =→ ∞ → ∞ → ∞
lim ( ) lim ( ) lim ( )2 13 12 23
2 133
263
2
2
2
2
E) and thereforeF x x dx x C( ) = = +∫ 23
3
F F C C( ) ( )3 1 33
13
273
13
263
3 3
− = +
− +
= − =
This is the area of the region that was found in parts B and D.
Figure 10.19
Chapter Ten of Brief Calculus with Integrated Precalculus - Spring 2008.wpd Page 10 - 26
Example 10.27: Consider the region bounded by y = 3x2 - 2x + 1, the x-axis, x = 0 and x = 5. A) Estimate the area by using n rectangles and right end points. B) Find the exact area by using the result of part A. C) Estimate the area by using n rectangles and left end points. D) Find the exact area by using the result of part C.
E) Find .F x x x dx( ) ( )= − +∫ 3 2 12
Then find F(5) - F(0) and compare it with parts B and D.Solution:
Before beginning the problem it should be noted that the function involved is a parabolathat opens upward. Its minimum occurs at the solution of 0 = yN = 6x - 2, i.e. x = 1/3.The value of y at this value of x is 3( )2 - 2( ) + 1 = . Since the minimum lies above1
313
23
the x-axis, the entire parabola lies above the axis. A) Since the interval has length 5, the width of each rectangle is . Since the rectangles5
n
start at x = 0, the first right end point is , the second is 2( ), the third is 3( ), ... , and5n
5n
5n
the nth is n( ) = 5. In general, the right end point of the kth rectangle is k( ) and its5n
5n
height is the value of y = 3x2 - 2x + 1, that is, . So the area of( ) ( )3 2 15 2 5k kn n( ) ( )− +
the kth rectangle is width times the height, . Therefore,( ) ( ) ( )( )5 5 2 53 2 1n n nk k( ) ( )− +
since the first end point is 1( ) and the last one is n( ), the desired area is5n
5n
= ( ) ( ) ( )( )( )A n k kright n n nk
n
( ) ( ) ( )= − +=∑ 5 5 2 5
1
3 2 1 5 42 65 252
2
2( )n n
n+ +
where the TI-89 is used to evaluate the summation.
B) A A n n nn
nnn right n n
= =+ +
= =→ ∞ → ∞ → ∞
lim ( ) lim ( ) lim ( )5 42 65 252
5 422
1052
2
2
2
C) The left end points of the rectangles are 0 = 0( ), = 1( ), 2( ), ... , (n - 1)( ).5n
5n
5n
5n
5n
Hence = ( ) ( ) ( )( )( )A n k kleft n n nk
n
( ) ( ) ( )= − +=
−
∑ 5 5 2 5
0
1
3 2 1 5 42 65 252
2
2( )n n
n− +
D) A A n n nn
nnn left n n
= =− +
= =→ ∞ → ∞ → ∞
lim ( ) lim ( ) lim ( )5 42 65 252
5 422
1052
2
2
2
E) = and thereforeF x x x dx( ) ( )= − +∫ 3 2 12 x x x C3 2− + +
F F C C( ) ( ) ( ) ( )5 0 5 5 5 0 0 0 1053 2 3 2− = − + + − − + + =
Chapter Ten of Brief Calculus with Integrated Precalculus - Spring 2008.wpd Page 10 - 27
Exercise Set 10.4
1. Evaluate the following summations by hand.
A) B) C) D)31
4
kk=∑ ( )k k
k
2
1
5
2 1+ −=∑ ( )5 2
0
3
kk
+=∑ ( )k k
k
2
1
2
3 4+ −= −∑
2. Evaluate the following summations by hand.
A) B) C) ( )kn
k
+=∑ 3
1
5
( ( ) ( ) )2 3 52
2
4kn
kn
k
− +=∑ [( )( )]2 5 3
0
3
+=∑ k
n nk
3. Express the following in summation notation. A) 3 + 4 + 5 + 6 + 7 B) 1 + 4 + 9 + 16 + 25 + 36 + 49 + 64 C) -27 - 8 -1 + 1 + 8 + 27
4. Express the following in summation notation. A) (4 + n) + (4 + 2n) + (4 + 3n) + (4 + 4n) + (4 + 5n) + (4 + 6n) B) 4 + (4 + n) + (4 + 2n) + (4 + 3n) + (4 + 4n) + (4 + 5n) C) (4 + n) + (4 + 2n) + (4 + 3n) +...+ (4 + (n - 1)n) + (4 + n2) D) 4 + (4 + n) + (4 + 2n) + (4 + 3n) +...+ (4 + (n - 1)n)
5. Express the following in summation notation.
A) 1 2 3
2 2 2 2n n nnn
+ + + +...
B) ( )( ) ( )( ( )) ( )( ( )) ( )( ( ))3 3 3 3 3 3 3 35 5 2 5 3 5n n n n n n n nn+ + + + + + + +... C) ( )( ) ( )( ( )) ( )( ( )) ( )( ( )) ( )( ( )( ))3 3 3 3 3 3 3 3 35 5 5 2 5 3 5 1n n n n n n n n nn+ + + + + + + + + −...
6. Evaluate the following summations by using the TI-89.
A) B) ( )k kk
2
1
2
3 4+ −= −∑ ( ( ) ( ) )2 3 52
2
4kn
kn
k
− +=∑
C) D) ( )71
+=∑ k
nk
n
( ( ) )4 3 2
0
1
+=
−
∑ kn
k
n
E) F) [( )( ( ) )]5 5 2
1
2 3nk
nk
n
+=∑ [( )( ( ) ( ) )]3 3 4 3
0
1
2 1 5 1 7nkn
kn
k
n
+ + + −=
−
∑
Chapter Ten of Brief Calculus with Integrated Precalculus - Spring 2008.wpd Page 10 - 28
7. Consider the area of the region bounded by y = 4x, the x-axis, x = 0 and x = 1. A) Estimate the area using n rectangles and the right end points. B) Use the estimate found in part A to find the area of the region. C) Estimate the area using n rectangles and the left end points. D) Use the estimate found in part C to find the area of the region. E) Find the area using a geometric argument and compare it to parts B and D.
F) Find . Then find F(1) - F(0) and compare it with parts B, D and E.F x x dx( ) = ∫ 48. Consider the area of the region bounded by y = x3, the x-axis, x = 0 and x = 1. A) Estimate the area using n rectangles and the right end points. B) Use the estimate found in part A to find the area of the region. C) Estimate the area using n rectangles and the left end points. D) Use the estimate found in part C to find the area of the region.
E) Find . Evaluate it at x = 0 and x = 1 and then subtract the result obtained byx dx3∫ using x = 0 from the result obtained by using x = 1. Compare parts B, D and E.
9. Consider the area of the region bounded by y = 6x2 + 4x - 3, the x-axis, x = 2 and x = 5. A) Estimate the area using n rectangles and the right end points. B) Use the estimate found in part A to find the area of the region. C) Estimate the area using n rectangles and the left end points. D) Use the estimate found in part C to find the area of the region.
E) Find . Evaluate it at x = 2 and x = 5 and then subtract the result( )6 4 32x x dx+ −∫ obtained by using x = 2 from the result obtained by using x = 5. Compare parts B, D and E.
10. Consider the area of the region bounded by y = 16 - x2, the x-axis, x = -4 and x = 4. A) Estimate the area using n rectangles and the right end points. B) Use the estimate found in part A to find the area of the region. C) Estimate the area using n rectangles and the left end points. D) Use the estimate found in part C to find the area of the region.
E) Find . Evaluate it at x = -4 and x = 4 and then subtract the result obtained( )16 2−∫ x dx by using x = -4 from the result obtained by using x = 4. Compare parts B, D and E.
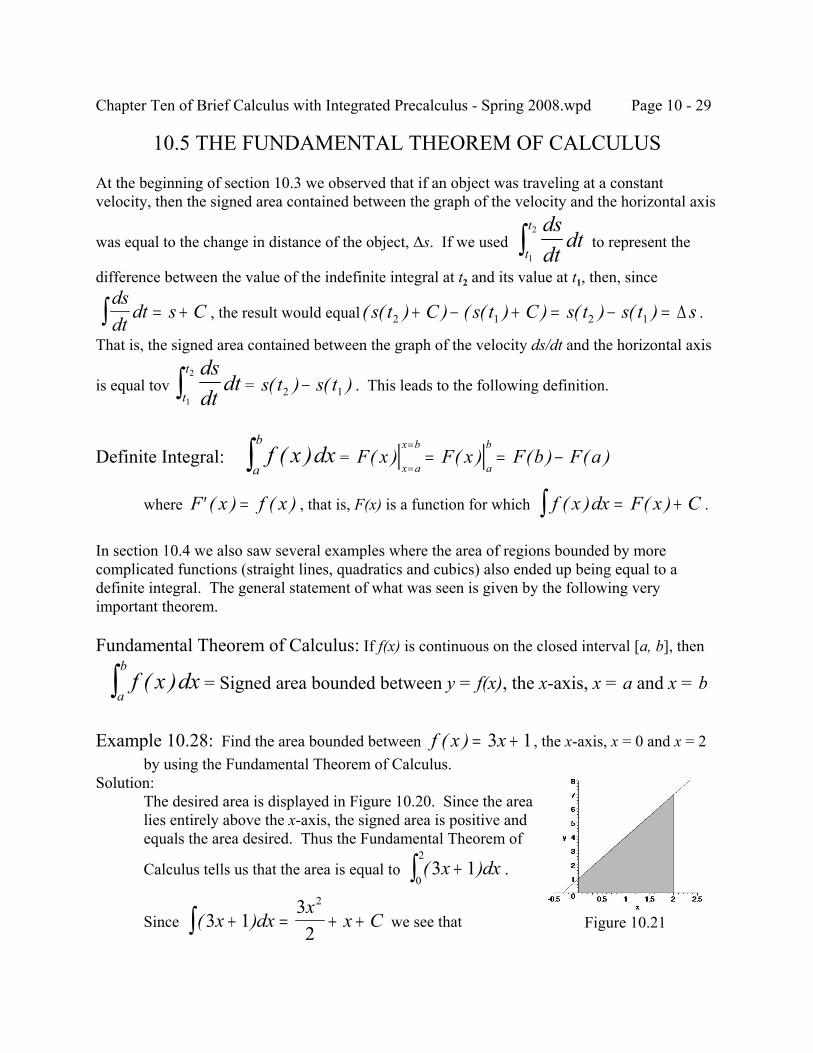
Chapter Ten of Brief Calculus with Integrated Precalculus - Spring 2008.wpd Page 10 - 29
10.5 THE FUNDAMENTAL THEOREM OF CALCULUS
At the beginning of section 10.3 we observed that if an object was traveling at a constantvelocity, then the signed area contained between the graph of the velocity and the horizontal axis
was equal to the change in distance of the object, ∆s. If we used to represent thedsdt
dtt
t
1
2
∫difference between the value of the indefinite integral at t2 and its value at t1, then, since
, the result would equal . dsdt
dt s C= +∫ ( ( ) ) ( ( ) ) ( ) ( )s t C s t C s t s t s2 1 2 1+ − + = − = ∆
That is, the signed area contained between the graph of the velocity ds/dt and the horizontal axis
is equal tov = . This leads to the following definition.dsdt
dtt
t
1
2
∫ s t s t( ) ( )2 1−
Definite Integral: = f x dxa
b( )∫ F x F x F b F a
x a
x b
a
b( ) ( ) ( ) ( )| |
=
== = −
where , that is, F(x) is a function for which .′ =F x f x( ) ( ) f x dx F x C( ) ( )= +∫In section 10.4 we also saw several examples where the area of regions bounded by morecomplicated functions (straight lines, quadratics and cubics) also ended up being equal to adefinite integral. The general statement of what was seen is given by the following veryimportant theorem.
Fundamental Theorem of Calculus: If f(x) is continuous on the closed interval [a, b], then
= Signed area bounded between y = f(x), the x-axis, x = a and x = bf x dxa
b( )∫
Example 10.28: Find the area bounded between , the x-axis, x = 0 and x = 2f x x( ) = +3 1by using the Fundamental Theorem of Calculus.
Solution: The desired area is displayed in Figure 10.20. Since the area
lies entirely above the x-axis, the signed area is positive andequals the area desired. Thus the Fundamental Theorem of
Calculus tells us that the area is equal to . ( )3 10
2x dx+∫
Since we see that( )3 132
2
x dxx
x C+ = + +∫ Figure 10.21
Chapter Ten of Brief Calculus with Integrated Precalculus - Spring 2008.wpd Page 10 - 30
Area = = = 8( )3 10
2x dx+∫
32
3 22
23 0
20
2
0
2 2 2xx+
= +
− +
( ) ( )
Example 10.29: Evaluate the following definite integrals.
(a) (b) (c) 3 2
1
3x dx∫ ( )7 6
1
4t t dt−∫ ( )2 3 3
0
3x dx−∫
(d) (e) (f) 2 3
0
2e dxxln
∫3
3 52
7
tdt
+∫ xx
dx3 121
0
+−∫Solution:
(a) Since = ,333
23
x dxx
C= +∫ x C3 +
= 3 2
1
3x dx∫ x3
1
3 3 33 1 26| = − =
(b) = ( )7 61
4t t dt−∫ ( )7 6
72
6 72
412
322
32
1
4 23
1
4
1
4t t dt
t t tt− = −
= −
∫
= [ ]7 42
4 47 1
24 1 56 32
72
4 242
32
3 12
( ) ( )−
− −
= − − −
=
(c) = ( )2 3 3
0
3x dx−∫ 1
23
0
3 4
0
32 2 3
12
2 34
( )( ) |x dx
x− =
−∫
= ( ( ) ) ( ( ) )2 3 3
82 0 3
8818
818
04 4−
−
−
= − =
(d) = 2 3
0
2e dxxln
∫ 23
33
0
23 2 3 0
0
23
23
23
23
e dxe e ex
x
= = −∫ln
ln ( )ln |
= 2
323
2 83
23
143
2 03
e eln ( )− = − =
(e) = 3
3 52
7
tdt
+∫ ln| | ln| | ln| | ln .|3 5 26 11 08602012
7 2611t + = − = =
(f) = x
xdx
3 121
0
+−∫16
22
12 1
0
1
06 3 1
16
3 112
12
x x dxx
( )( ) |+ =
+−
−−∫
= 3 1
33 0 1
33 1 1
313
23
13
2
1
02 2x +
=+
−− +
= − = −−| ( ) ( )
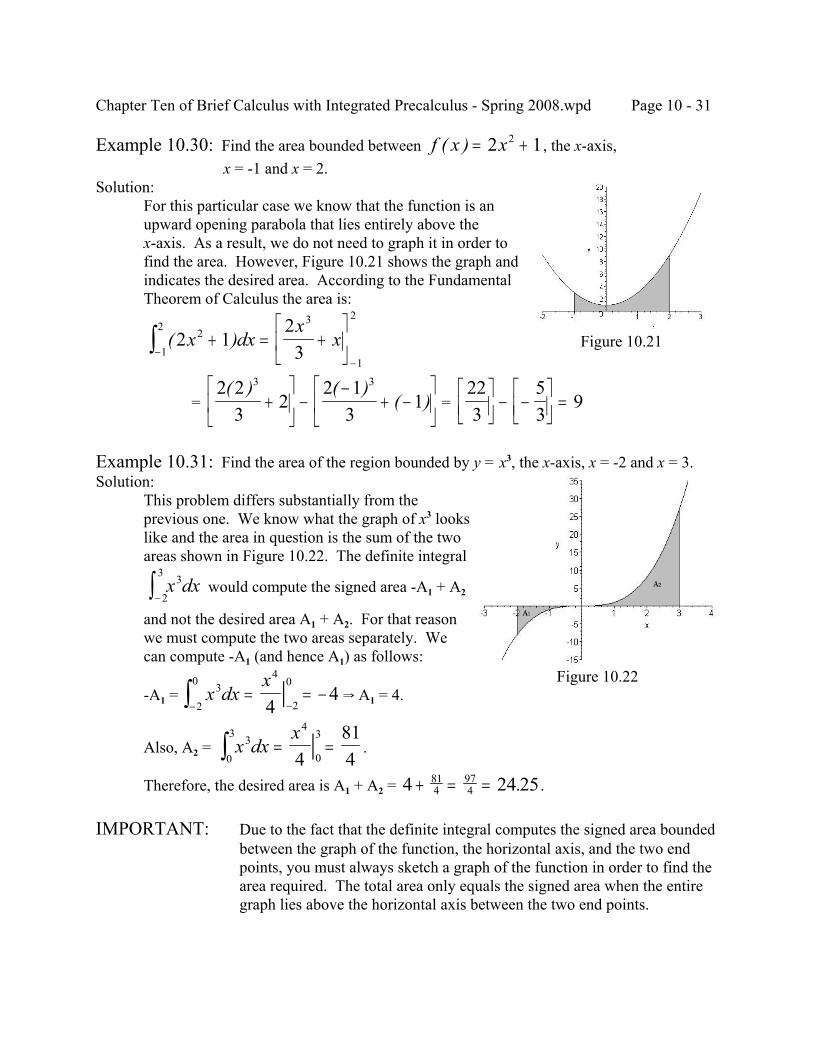
Chapter Ten of Brief Calculus with Integrated Precalculus - Spring 2008.wpd Page 10 - 31
Figure 10.21
Figure 10.22
Example 10.30: Find the area bounded between , the x-axis,f x x( ) = +2 12
x = -1 and x = 2.Solution:
For this particular case we know that the function is anupward opening parabola that lies entirely above thex-axis. As a result, we do not need to graph it in order tofind the area. However, Figure 10.21 shows the graph andindicates the desired area. According to the FundamentalTheorem of Calculus the area is:
( )2 123
23
1
2
1
2x dx
xx+ = +
−
−∫
= = 2 2
32
2 13
13 3( ) ( )
( )+
−
−+ −
223
53
9
− −
=
Example 10.31: Find the area of the region bounded by y = x3, the x-axis, x = -2 and x = 3.Solution:
This problem differs substantially from theprevious one. We know what the graph of x3 lookslike and the area in question is the sum of the twoareas shown in Figure 10.22. The definite integral
would compute the signed area -A1 + A2x dx3
2
3
−∫and not the desired area A1 + A2. For that reasonwe must compute the two areas separately. Wecan compute -A1 (and hence A1) as follows:
-A1 = Y A1 = 4.x dxx3
4
2
0
2
0
44= = −
−−∫ |
Also, A2 = .x dxx3
4
0
3
0
3
4814
= =∫ |Therefore, the desired area is A1 + A2 = .4 24 2581
4974+ = = .
IMPORTANT: Due to the fact that the definite integral computes the signed area boundedbetween the graph of the function, the horizontal axis, and the two endpoints, you must always sketch a graph of the function in order to find thearea required. The total area only equals the signed area when the entiregraph lies above the horizontal axis between the two end points.
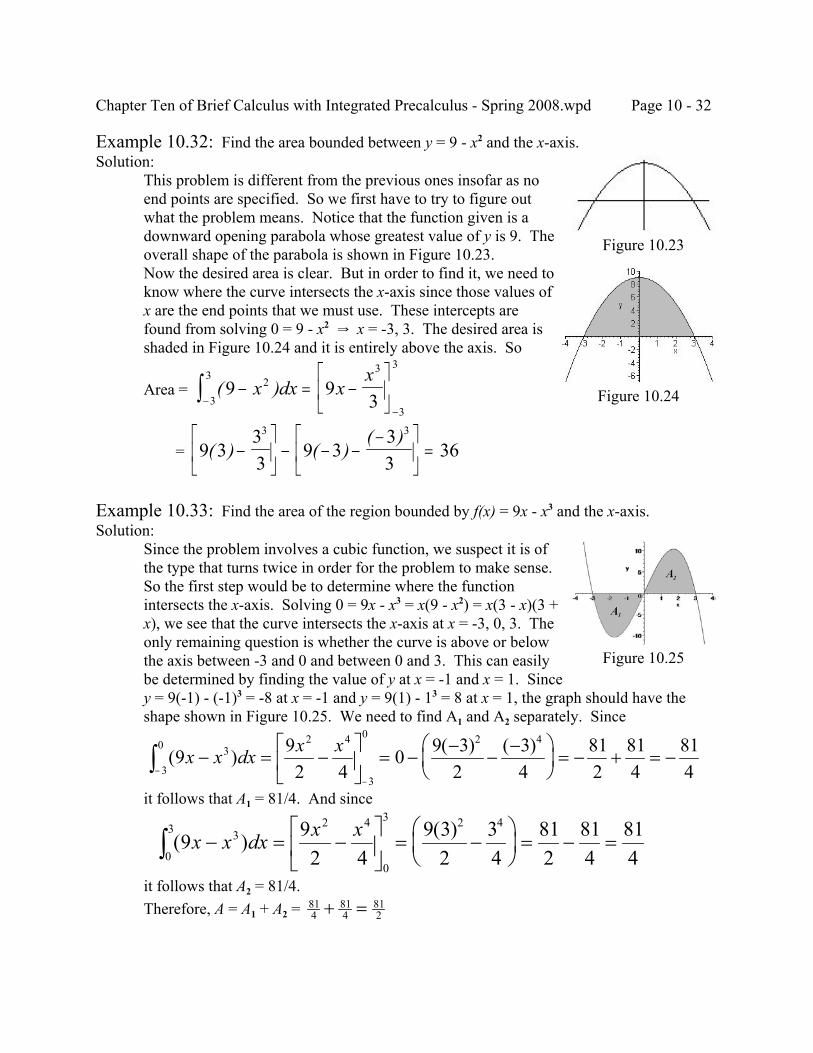
Chapter Ten of Brief Calculus with Integrated Precalculus - Spring 2008.wpd Page 10 - 32
Figure 10.23
Figure 10.24
Example 10.32: Find the area bounded between y = 9 - x2 and the x-axis.Solution:
This problem is different from the previous ones insofar as noend points are specified. So we first have to try to figure outwhat the problem means. Notice that the function given is adownward opening parabola whose greatest value of y is 9. Theoverall shape of the parabola is shown in Figure 10.23.Now the desired area is clear. But in order to find it, we need toknow where the curve intersects the x-axis since those values ofx are the end points that we must use. These intercepts arefound from solving 0 = 9 - x2 Y x = -3, 3. The desired area isshaded in Figure 10.24 and it is entirely above the axis. So
Area = ( )9 93
23
3
3
3
3− = −
−
−∫ x dx xx
= 9 333
9 333
363 3
( ) ( )( )
−
− − −
−
=
Example 10.33: Find the area of the region bounded by f(x) = 9x - x3 and the x-axis.Solution:
Since the problem involves a cubic function, we suspect it is ofthe type that turns twice in order for the problem to make sense. So the first step would be to determine where the functionintersects the x-axis. Solving 0 = 9x - x3 = x(9 - x2) = x(3 - x)(3 +x), we see that the curve intersects the x-axis at x = -3, 0, 3. Theonly remaining question is whether the curve is above or belowthe axis between -3 and 0 and between 0 and 3. This can easilybe determined by finding the value of y at x = -1 and x = 1. Sincey = 9(-1) - (-1)3 = -8 at x = -1 and y = 9(1) - 13 = 8 at x = 1, the graph should have theshape shown in Figure 10.25. We need to find A1 and A2 separately. Since
( ) ( ) ( )9 92 4
0 9 32
34
812
814
814
32 4
3
0 2 4
3
0x x dx x x− = −
= −
−−
−
= − + = −
−−∫
it follows that A1 = 81/4. And since
( ) ( )9 92 4
9 32
34
812
814
814
32 4
0
3 2 4
0
3x x dx x x− = −
= −
= − =∫
it follows that A2 = 81/4.Therefore, A = A1 + A2 = 81
4814
812+ =
Figure 10.25
Chapter Ten of Brief Calculus with Integrated Precalculus - Spring 2008.wpd Page 10 - 33
Exercise Set 10.5
1. Find the area bounded between y = 2x, the x-axis, x = 0 and x = 4(a) by sketching the function and using geometric arguments, and(b) by using the Fundamental Theorem of Calculus.
Find the area bounded between y = 2x, the x-axis, x = 1 and x = 3(c) by sketching the function and using geometric arguments, and(d) by using the Fundamental Theorem of Calculus.
2. (a) Sketch y = 2x and use geometric arguments to find the area bounded between y = 2x, the x-axis, x = -1 and x = 3.
(b) Evaluate .21
3x dx
−∫ (c) Explain why part (b) does not produce the same answer as part (a).
3. Evaluate (a) (b) ( )9 4 32
1
3x x dx− +∫ ( )3
11
9t
tdt+∫
4. Evaluate (a) (b) ( )4 4 3
0
1x dx−∫ ( )( )x x x dx+ + −∫ 1 2 32
1
3
5. Evaluate (a) (b) e dxx
0
5ln
∫ 3 7
0
1e dxx∫
6. Evaluate (a) (b) (c) 5
5 11
5
xdx
−∫3 1
3 2 2221
3 xx x
dx−
− −∫6
3 22
6
tdt
−∫
7. Find the area bounded between , y = 0 (the x-axis), x = -1 and x = 3.f x x( ) = 3 2
8. Find the area bounded between , y = 0 (the x-axis), x = 0 and x = 2.f x x( ) = +2 13
9. Find the area bounded between , y = 0 (the x-axis), x = -2 and x = 2.f x x( ) = 3
10. Find the area bounded between , y = 0 (the x-axis), x = -1 and x = 3.y x= −2 4
11. Find the area bounded between and the x-axis.y x= −2 4
12. Find the area bounded between and the x-axis.y x x= −3 4 (Hint: Where does this cubic cross the axis? What is its overall shape in that case?)
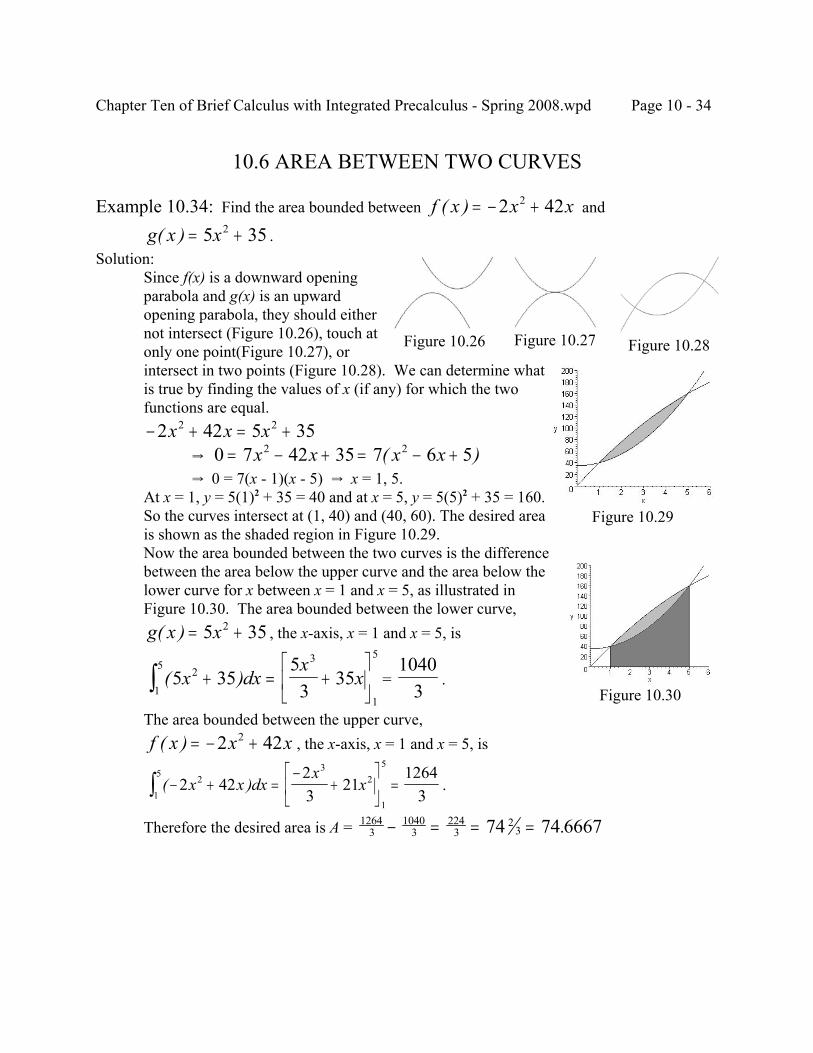
Chapter Ten of Brief Calculus with Integrated Precalculus - Spring 2008.wpd Page 10 - 34
Figure 10.26
Figure 10.30
Figure 10.27 Figure 10.28
Figure 10.29
10.6 AREA BETWEEN TWO CURVES
Example 10.34: Find the area bounded between andf x x x( ) = − +2 422
.g x x( ) = +5 352
Solution:Since f(x) is a downward openingparabola and g(x) is an upwardopening parabola, they should eithernot intersect (Figure 10.26), touch atonly one point(Figure 10.27), orintersect in two points (Figure 10.28). We can determine whatis true by finding the values of x (if any) for which the twofunctions are equal.− + = +2 42 5 352 2x x x
Y 0 7 42 35 7 6 52 2= − + = − +x x x x( )Y 0 = 7(x - 1)(x - 5) Y x = 1, 5.
At x = 1, y = 5(1)2 + 35 = 40 and at x = 5, y = 5(5)2 + 35 = 160.So the curves intersect at (1, 40) and (40, 60). The desired areais shown as the shaded region in Figure 10.29.Now the area bounded between the two curves is the differencebetween the area below the upper curve and the area below thelower curve for x between x = 1 and x = 5, as illustrated inFigure 10.30. The area bounded between the lower curve,
, the x-axis, x = 1 and x = 5, isg x x( ) = +5 352
= .( )5 3553
3523
1
5
1
5x dx
xx+ = +
∫
10403
The area bounded between the upper curve,, the x-axis, x = 1 and x = 5, isf x x x( ) = − +2 422
.( )− + =−
+
=∫ 2 42
23
211264
32
32
1
5
1
5x x dx
xx
Therefore the desired area is A = 12643
10403
2243
2374 74 6667− = = = .
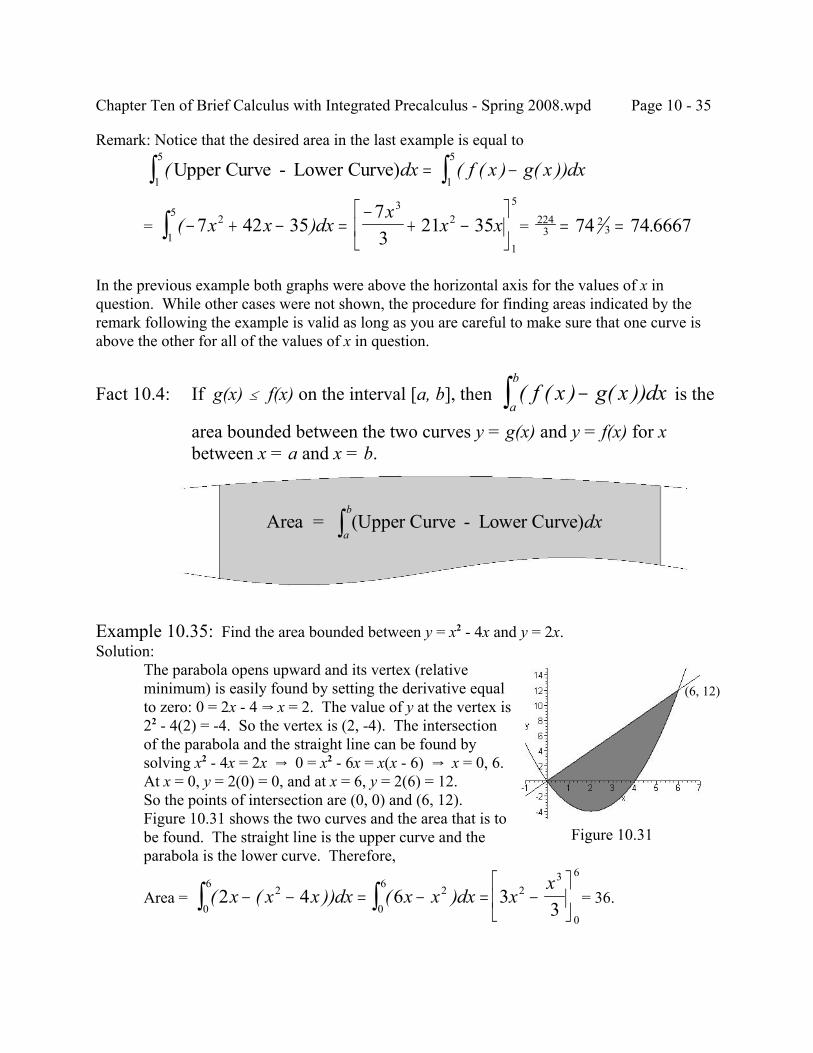
Chapter Ten of Brief Calculus with Integrated Precalculus - Spring 2008.wpd Page 10 - 35
Figure 10.31
Remark: Notice that the desired area in the last example is equal to
( ( ( ) ( ))Upper Curve - Lower Curve)dx f x g x dx= −∫∫ 1
5
1
5
= = ( )− + − =−
+ −
∫ 7 42 35
73
21 3523
2
1
5
1
5
x x dxx
x x 2243
2374 74 6667= = .
In the previous example both graphs were above the horizontal axis for the values of x inquestion. While other cases were not shown, the procedure for finding areas indicated by theremark following the example is valid as long as you are careful to make sure that one curve isabove the other for all of the values of x in question.
Fact 10.4: If g(x) # f(x) on the interval [a, b], then is the( ( ) ( ))f x g x dxa
b−∫
area bounded between the two curves y = g(x) and y = f(x) for xbetween x = a and x = b.
Area = (Upper Curve - Lower Curve)dxa
b
∫
Example 10.35: Find the area bounded between y = x2 - 4x and y = 2x.Solution:
The parabola opens upward and its vertex (relativeminimum) is easily found by setting the derivative equalto zero: 0 = 2x - 4 Y x = 2. The value of y at the vertex is22 - 4(2) = -4. So the vertex is (2, -4). The intersectionof the parabola and the straight line can be found bysolving x2 - 4x = 2x Y 0 = x2 - 6x = x(x - 6) Y x = 0, 6.At x = 0, y = 2(0) = 0, and at x = 6, y = 2(6) = 12.So the points of intersection are (0, 0) and (6, 12).Figure 10.31 shows the two curves and the area that is tobe found. The straight line is the upper curve and theparabola is the lower curve. Therefore,
Area = = 36.( ( )) ( )2 4 6 33
2
0
6 2
0
6 23
0
6
x x x dx x x dx xx
− − = − = −
∫ ∫
(6, 12)
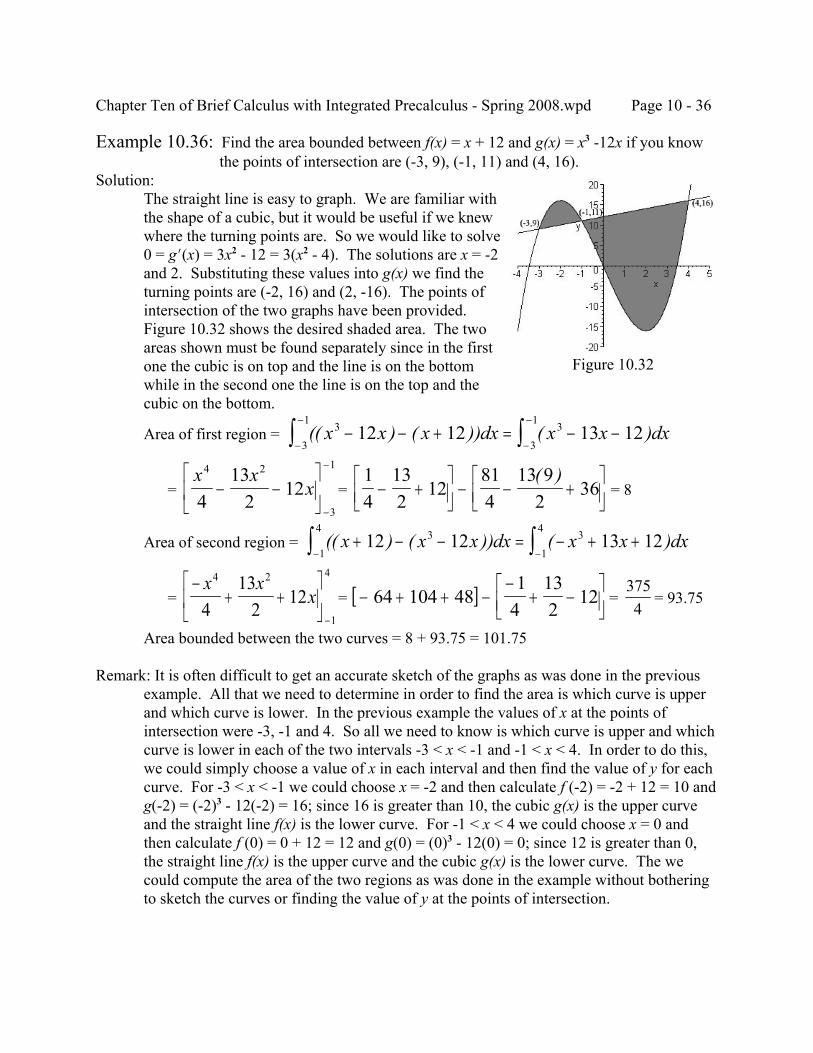
Chapter Ten of Brief Calculus with Integrated Precalculus - Spring 2008.wpd Page 10 - 36
Figure 10.32
Example 10.36: Find the area bounded between f(x) = x + 12 and g(x) = x3 -12x if you know the points of intersection are (-3, 9), (-1, 11) and (4, 16).
Solution:The straight line is easy to graph. We are familiar withthe shape of a cubic, but it would be useful if we knewwhere the turning points are. So we would like to solve0 = gN(x) = 3x2 - 12 = 3(x2 - 4). The solutions are x = -2and 2. Substituting these values into g(x) we find theturning points are (-2, 16) and (2, -16). The points ofintersection of the two graphs have been provided. Figure 10.32 shows the desired shaded area. The twoareas shown must be found separately since in the firstone the cubic is on top and the line is on the bottomwhile in the second one the line is on the top and thecubic on the bottom.
Area of first region = (( ) ( )) ( )x x x dx x x dx3
3
1 3
3
112 12 13 12− − + = − −
−
−
−
−
∫ ∫
= = = 8x x
x4 2
3
1
413
212− −
−
−14
132
12814
13 92
36− +
− − +
( )
Area of second region = (( ) ( )) ( )x x x dx x x dx+ − − = − + +− −∫ ∫12 12 13 123
1
4 3
1
4
= = = = 93.75−
+ +
−
x xx
4 2
1
4
413
212 [ ]− + + −
−+ −
64 104 481
4132
12 3754
Area bounded between the two curves = 8 + 93.75 = 101.75
Remark: It is often difficult to get an accurate sketch of the graphs as was done in the previousexample. All that we need to determine in order to find the area is which curve is upperand which curve is lower. In the previous example the values of x at the points ofintersection were -3, -1 and 4. So all we need to know is which curve is upper and whichcurve is lower in each of the two intervals -3 < x < -1 and -1 < x < 4. In order to do this,we could simply choose a value of x in each interval and then find the value of y for eachcurve. For -3 < x < -1 we could choose x = -2 and then calculate f (-2) = -2 + 12 = 10 andg(-2) = (-2)3 - 12(-2) = 16; since 16 is greater than 10, the cubic g(x) is the upper curveand the straight line f(x) is the lower curve. For -1 < x < 4 we could choose x = 0 andthen calculate f (0) = 0 + 12 = 12 and g(0) = (0)3 - 12(0) = 0; since 12 is greater than 0,the straight line f(x) is the upper curve and the cubic g(x) is the lower curve. The wecould compute the area of the two regions as was done in the example without botheringto sketch the curves or finding the value of y at the points of intersection.
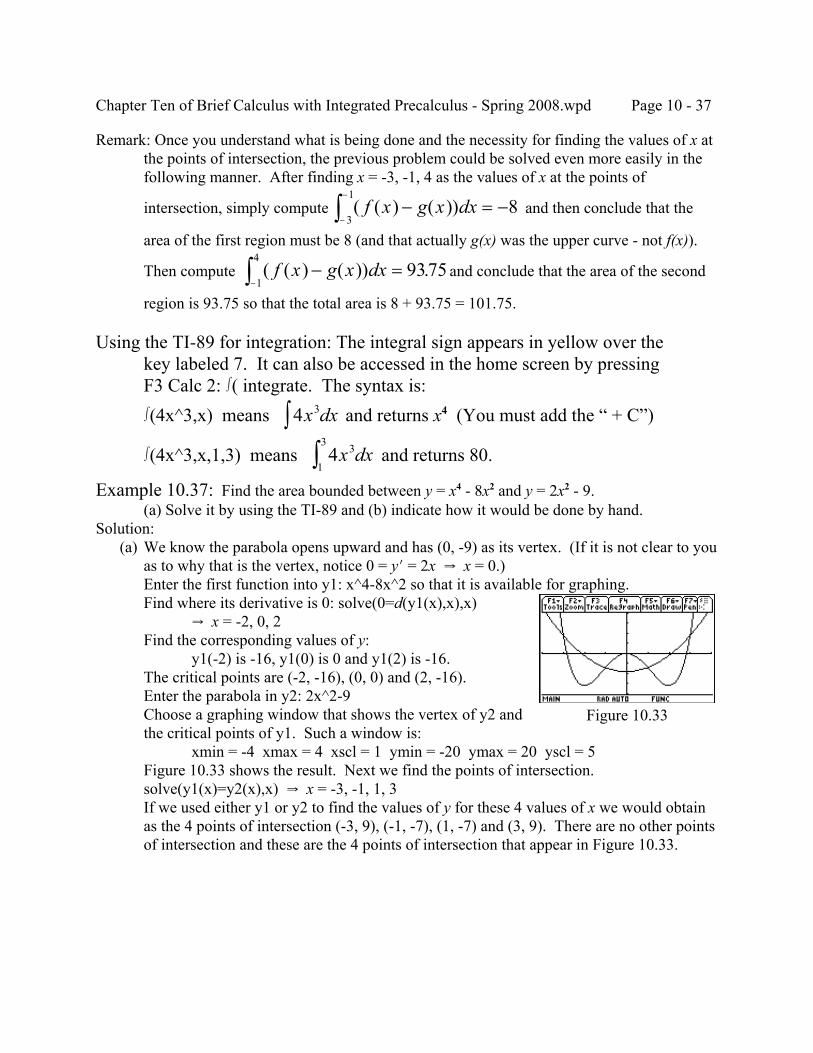
Chapter Ten of Brief Calculus with Integrated Precalculus - Spring 2008.wpd Page 10 - 37
Figure 10.33
Remark: Once you understand what is being done and the necessity for finding the values of x atthe points of intersection, the previous problem could be solved even more easily in thefollowing manner. After finding x = -3, -1, 4 as the values of x at the points of
intersection, simply compute and then conclude that the( ( ) ( ))f x g x dx− = −−
−
∫ 83
1
area of the first region must be 8 (and that actually g(x) was the upper curve - not f(x)).
Then compute and conclude that the area of the second( ( ) ( )) .f x g x dx− =−∫ 93751
4
region is 93.75 so that the total area is 8 + 93.75 = 101.75.
Using the TI-89 for integration: The integral sign appears in yellow over thekey labeled 7. It can also be accessed in the home screen by pressingF3 Calc 2: *( integrate. The syntax is:*(4x^3,x) means and returns x4 (You must add the “ + C”)4 3x dx∫*(4x^3,x,1,3) means and returns 80.4 3
1
3x dx∫
Example 10.37: Find the area bounded between y = x4 - 8x2 and y = 2x2 - 9.(a) Solve it by using the TI-89 and (b) indicate how it would be done by hand.
Solution: (a) We know the parabola opens upward and has (0, -9) as its vertex. (If it is not clear to you
as to why that is the vertex, notice 0 = yN = 2x Y x = 0.)Enter the first function into y1: x^4-8x^2 so that it is available for graphing.Find where its derivative is 0: solve(0=d(y1(x),x),x)
Y x = -2, 0, 2Find the corresponding values of y:
y1(-2) is -16, y1(0) is 0 and y1(2) is -16.The critical points are (-2, -16), (0, 0) and (2, -16).Enter the parabola in y2: 2x^2-9Choose a graphing window that shows the vertex of y2 andthe critical points of y1. Such a window is:
xmin = -4 xmax = 4 xscl = 1 ymin = -20 ymax = 20 yscl = 5Figure 10.33 shows the result. Next we find the points of intersection.solve(y1(x)=y2(x),x) Y x = -3, -1, 1, 3If we used either y1 or y2 to find the values of y for these 4 values of x we would obtainas the 4 points of intersection (-3, 9), (-1, -7), (1, -7) and (3, 9). There are no other pointsof intersection and these are the 4 points of intersection that appear in Figure 10.33.
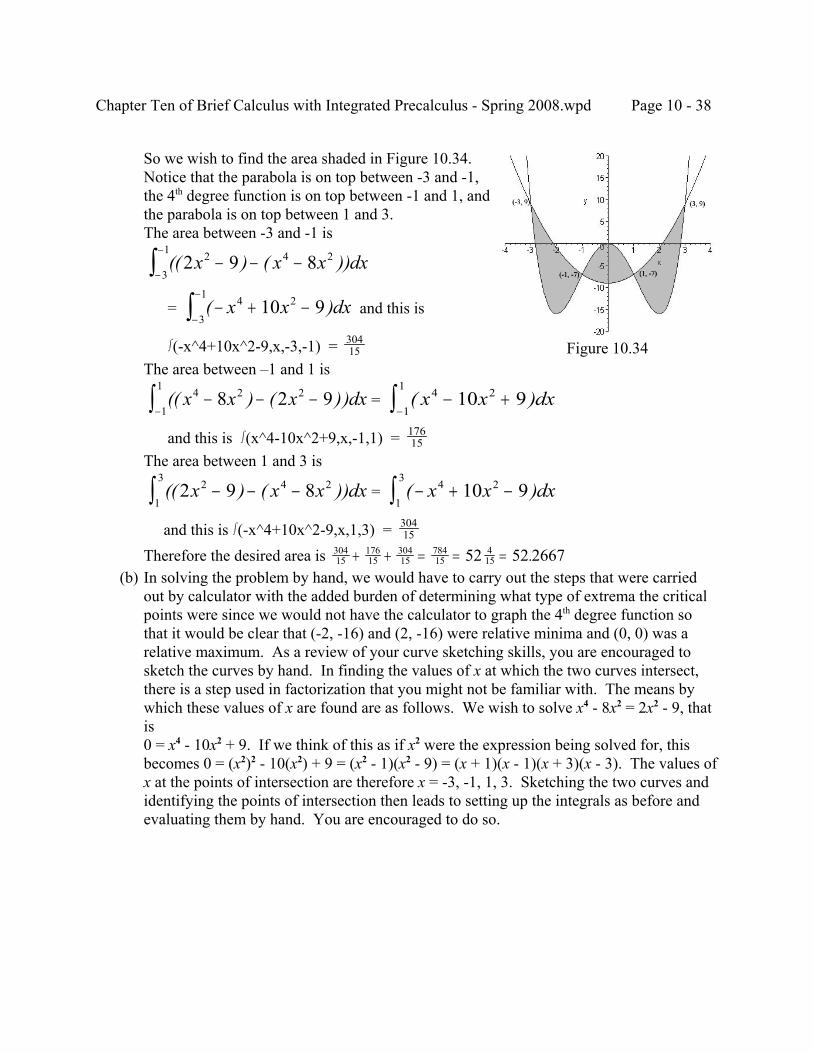
Chapter Ten of Brief Calculus with Integrated Precalculus - Spring 2008.wpd Page 10 - 38
Figure 10.34
So we wish to find the area shaded in Figure 10.34.Notice that the parabola is on top between -3 and -1,the 4th degree function is on top between -1 and 1, andthe parabola is on top between 1 and 3.The area between -3 and -1 is
(( ) ( ))2 9 82
3
1 4 2x x x dx− − −−
−
∫ = and this is( )− + −
−
−
∫ x x dx4 2
3
110 9
*(-x^4+10x^2-9,x,-3,-1) = 30415
The area between –1 and 1 is
= (( ) ( ))x x x dx4 2 2
1
18 2 9− − −
−∫ ( )x x dx4 2
1
110 9− +
−∫ and this is *(x^4-10x^2+9,x,-1,1) = 176
15
The area between 1 and 3 is
= (( ) ( ))2 9 82
1
3 4 2x x x dx− − −∫ ( )− + −∫ x x dx4 2
1
310 9
and this is *(-x^4+10x^2-9,x,1,3) = 30415
Therefore the desired area is 30415
17615
30415
78415
41552 52 2667+ + = = = .
(b) In solving the problem by hand, we would have to carry out the steps that were carriedout by calculator with the added burden of determining what type of extrema the criticalpoints were since we would not have the calculator to graph the 4th degree function sothat it would be clear that (-2, -16) and (2, -16) were relative minima and (0, 0) was arelative maximum. As a review of your curve sketching skills, you are encouraged tosketch the curves by hand. In finding the values of x at which the two curves intersect,there is a step used in factorization that you might not be familiar with. The means bywhich these values of x are found are as follows. We wish to solve x4 - 8x2 = 2x2 - 9, thatis0 = x4 - 10x2 + 9. If we think of this as if x2 were the expression being solved for, thisbecomes 0 = (x2)2 - 10(x2) + 9 = (x2 - 1)(x2 - 9) = (x + 1)(x - 1)(x + 3)(x - 3). The values ofx at the points of intersection are therefore x = -3, -1, 1, 3. Sketching the two curves andidentifying the points of intersection then leads to setting up the integrals as before andevaluating them by hand. You are encouraged to do so.
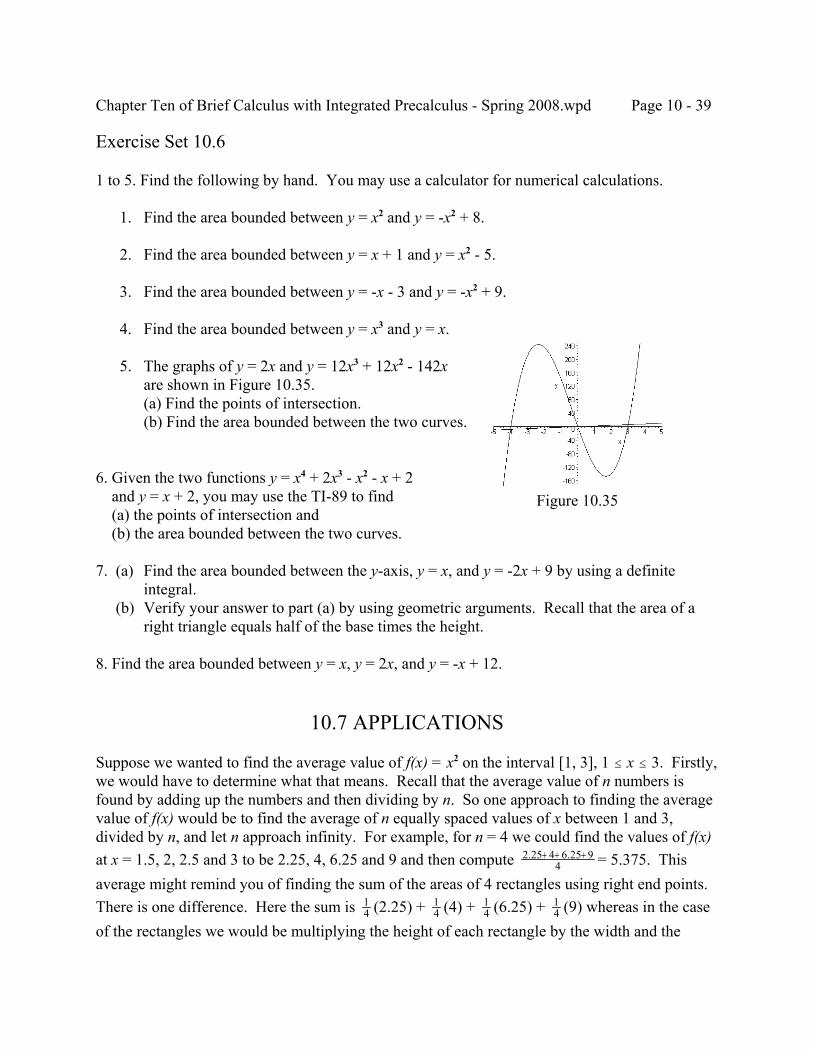
Chapter Ten of Brief Calculus with Integrated Precalculus - Spring 2008.wpd Page 10 - 39
Figure 10.35
Exercise Set 10.6
1 to 5. Find the following by hand. You may use a calculator for numerical calculations.
1. Find the area bounded between y = x2 and y = -x2 + 8.
2. Find the area bounded between y = x + 1 and y = x2 - 5.
3. Find the area bounded between y = -x - 3 and y = -x2 + 9.
4. Find the area bounded between y = x3 and y = x.
5. The graphs of y = 2x and y = 12x3 + 12x2 - 142xare shown in Figure 10.35.(a) Find the points of intersection.(b) Find the area bounded between the two curves.
6. Given the two functions y = x4 + 2x3 - x2 - x + 2 and y = x + 2, you may use the TI-89 to find (a) the points of intersection and (b) the area bounded between the two curves.
7. (a) Find the area bounded between the y-axis, y = x, and y = -2x + 9 by using a definiteintegral.
(b) Verify your answer to part (a) by using geometric arguments. Recall that the area of aright triangle equals half of the base times the height.
8. Find the area bounded between y = x, y = 2x, and y = -x + 12.
10.7 APPLICATIONS
Suppose we wanted to find the average value of f(x) = x2 on the interval [1, 3], 1 # x # 3. Firstly,we would have to determine what that means. Recall that the average value of n numbers isfound by adding up the numbers and then dividing by n. So one approach to finding the averagevalue of f(x) would be to find the average of n equally spaced values of x between 1 and 3,divided by n, and let n approach infinity. For example, for n = 4 we could find the values of f(x)at x = 1.5, 2, 2.5 and 3 to be 2.25, 4, 6.25 and 9 and then compute = 5.375. This2 25 4 6 25 9
4. .+ + +
average might remind you of finding the sum of the areas of 4 rectangles using right end points. There is one difference. Here the sum is (2.25) + (4) + (6.25) + (9) whereas in the case1
414
14
14
of the rectangles we would be multiplying the height of each rectangle by the width and the
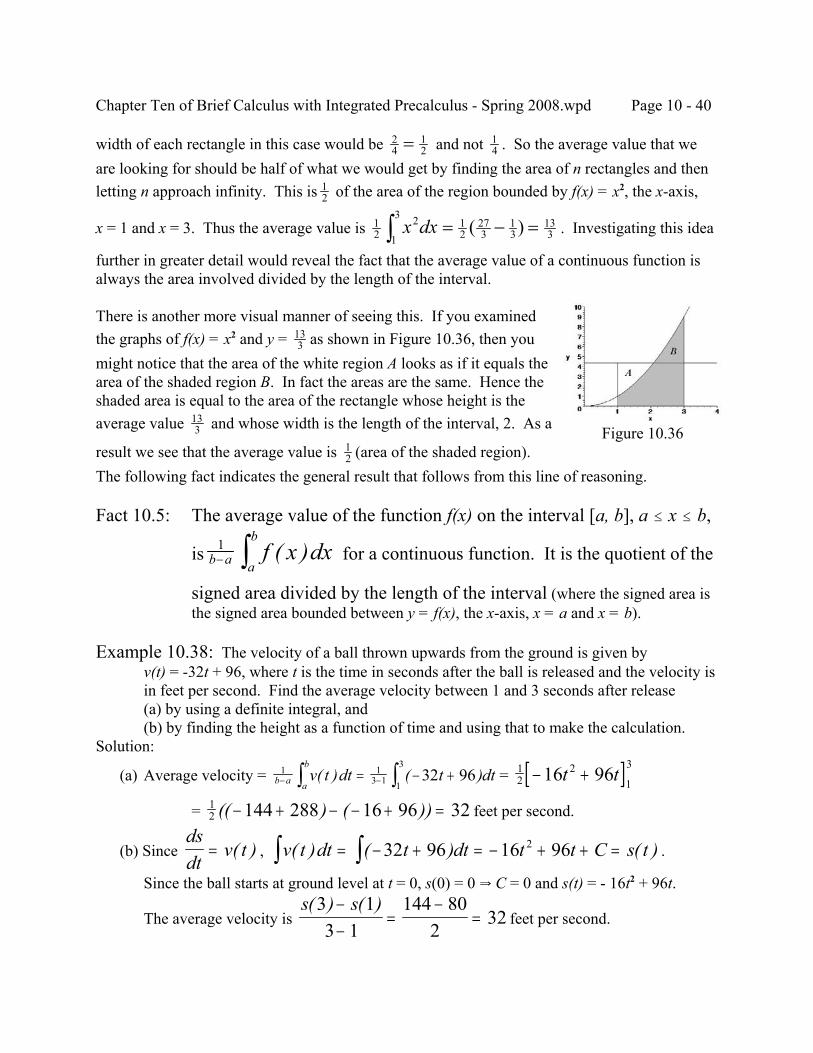
Chapter Ten of Brief Calculus with Integrated Precalculus - Spring 2008.wpd Page 10 - 40
width of each rectangle in this case would be and not . So the average value that we24
12= 1
4
are looking for should be half of what we would get by finding the area of n rectangles and thenletting n approach infinity. This is of the area of the region bounded by f(x) = x2, the x-axis,1
2
x = 1 and x = 3. Thus the average value is . Investigating this idea12
2 12
273
13
1331
3x dx = − =∫ ( )
further in greater detail would reveal the fact that the average value of a continuous function isalways the area involved divided by the length of the interval.
There is another more visual manner of seeing this. If you examinedthe graphs of f(x) = x2 and y = as shown in Figure 10.36, then you13
3
might notice that the area of the white region A looks as if it equals thearea of the shaded region B. In fact the areas are the same. Hence theshaded area is equal to the area of the rectangle whose height is theaverage value and whose width is the length of the interval, 2. As a13
3
result we see that the average value is (area of the shaded region). 12
The following fact indicates the general result that follows from this line of reasoning.
Fact 10.5: The average value of the function f(x) on the interval [a, b], a # x # b,
is for a continuous function. It is the quotient of the1b a a
bf x dx− ∫ ( )
signed area divided by the length of the interval (where the signed area isthe signed area bounded between y = f(x), the x-axis, x = a and x = b).
Example 10.38: The velocity of a ball thrown upwards from the ground is given byv(t) = -32t + 96, where t is the time in seconds after the ball is released and the velocity isin feet per second. Find the average velocity between 1 and 3 seconds after release(a) by using a definite integral, and(b) by finding the height as a function of time and using that to make the calculation.
Solution:
(a) Average velocity = = 1 13 1 1
332 96b a a
bv t dt t dt− −= − +∫∫ ( ) ( ) [ ]1
22
1
316 96− +t t
= feet per second.12 144 288 16 96 32(( ) ( ))− + − − + =
(b) Since , .dsdt
v t= ( ) v t dt t dt t t C s t( ) ( ) ( )= − + = − + + =∫∫ 32 96 16 962
Since the ball starts at ground level at t = 0, s(0) = 0 Y C = 0 and s(t) = - 16t2 + 96t.
The average velocity is feet per second.s s( ) ( )3 1
3 1144 80
232
−−
=−
=
Figure 10.36
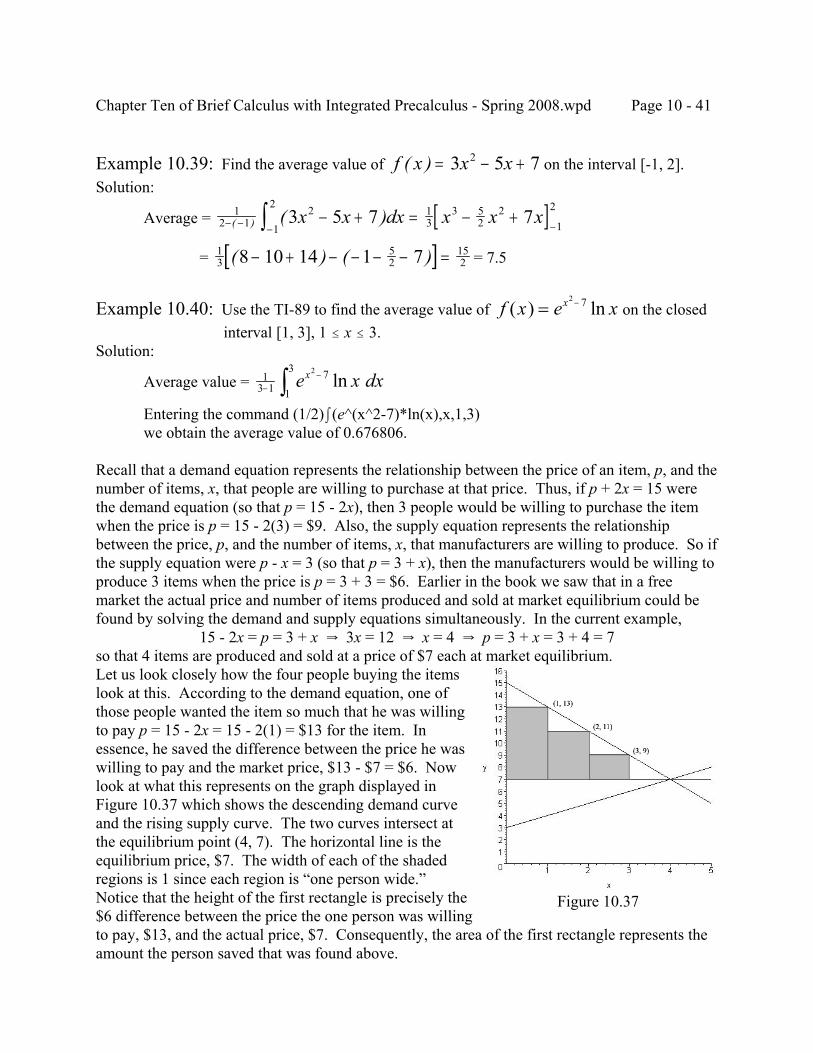
Chapter Ten of Brief Calculus with Integrated Precalculus - Spring 2008.wpd Page 10 - 41
Figure 10.37
Example 10.39: Find the average value of on the interval [-1, 2].f x x x( ) = − +3 5 72
Solution:
Average = [ ]12 1
2 13
3 52
21
2
1
23 5 7 7− − −−
− + = − +∫( ) ( )x x dx x x x
= = 7.5[ ]13
52
1528 10 14 1 7( ) ( )− + − − − − =
Example 10.40: Use the TI-89 to find the average value of on the closedf x e xx( ) ln= −2 7
interval [1, 3], 1 # x # 3.Solution:
Average value = 13 1
7
1
3 2
−−∫ e x dxx ln
Entering the command (1/2)I(e^(x^2-7)*ln(x),x,1,3)we obtain the average value of 0.676806.
Recall that a demand equation represents the relationship between the price of an item, p, and thenumber of items, x, that people are willing to purchase at that price. Thus, if p + 2x = 15 werethe demand equation (so that p = 15 - 2x), then 3 people would be willing to purchase the itemwhen the price is p = 15 - 2(3) = $9. Also, the supply equation represents the relationshipbetween the price, p, and the number of items, x, that manufacturers are willing to produce. So ifthe supply equation were p - x = 3 (so that p = 3 + x), then the manufacturers would be willing toproduce 3 items when the price is p = 3 + 3 = $6. Earlier in the book we saw that in a freemarket the actual price and number of items produced and sold at market equilibrium could befound by solving the demand and supply equations simultaneously. In the current example,
15 - 2x = p = 3 + x Y 3x = 12 Y x = 4 Y p = 3 + x = 3 + 4 = 7so that 4 items are produced and sold at a price of $7 each at market equilibrium.Let us look closely how the four people buying the itemslook at this. According to the demand equation, one ofthose people wanted the item so much that he was willingto pay p = 15 - 2x = 15 - 2(1) = $13 for the item. Inessence, he saved the difference between the price he waswilling to pay and the market price, $13 - $7 = $6. Nowlook at what this represents on the graph displayed inFigure 10.37 which shows the descending demand curveand the rising supply curve. The two curves intersect atthe equilibrium point (4, 7). The horizontal line is theequilibrium price, $7. The width of each of the shadedregions is 1 since each region is “one person wide.” Notice that the height of the first rectangle is precisely the$6 difference between the price the one person was willingto pay, $13, and the actual price, $7. Consequently, the area of the first rectangle represents theamount the person saved that was found above.
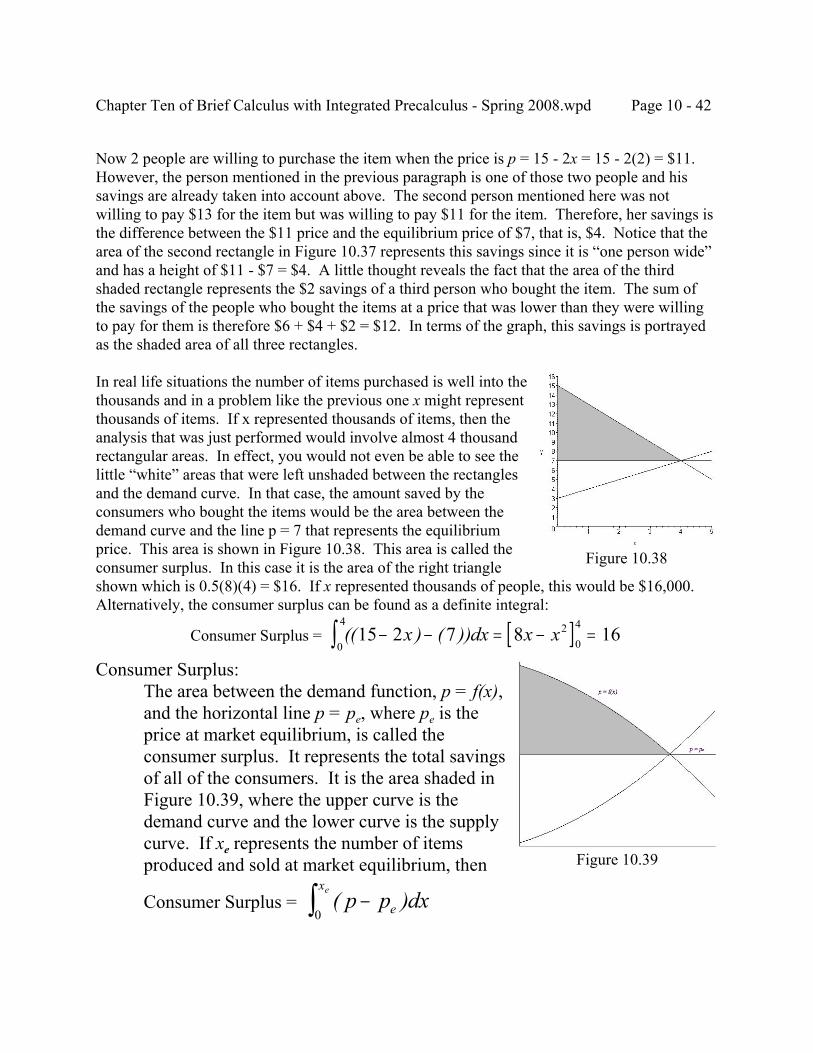
Chapter Ten of Brief Calculus with Integrated Precalculus - Spring 2008.wpd Page 10 - 42
Figure 10.38
Figure 10.39
Now 2 people are willing to purchase the item when the price is p = 15 - 2x = 15 - 2(2) = $11. However, the person mentioned in the previous paragraph is one of those two people and hissavings are already taken into account above. The second person mentioned here was notwilling to pay $13 for the item but was willing to pay $11 for the item. Therefore, her savings isthe difference between the $11 price and the equilibrium price of $7, that is, $4. Notice that thearea of the second rectangle in Figure 10.37 represents this savings since it is “one person wide”and has a height of $11 - $7 = $4. A little thought reveals the fact that the area of the thirdshaded rectangle represents the $2 savings of a third person who bought the item. The sum ofthe savings of the people who bought the items at a price that was lower than they were willingto pay for them is therefore $6 + $4 + $2 = $12. In terms of the graph, this savings is portrayedas the shaded area of all three rectangles.
In real life situations the number of items purchased is well into thethousands and in a problem like the previous one x might representthousands of items. If x represented thousands of items, then theanalysis that was just performed would involve almost 4 thousandrectangular areas. In effect, you would not even be able to see thelittle “white” areas that were left unshaded between the rectanglesand the demand curve. In that case, the amount saved by theconsumers who bought the items would be the area between thedemand curve and the line p = 7 that represents the equilibriumprice. This area is shown in Figure 10.38. This area is called theconsumer surplus. In this case it is the area of the right triangleshown which is 0.5(8)(4) = $16. If x represented thousands of people, this would be $16,000. Alternatively, the consumer surplus can be found as a definite integral:
Consumer Surplus = [ ](( ) ( ))15 2 7 8 1620
4
0
4− − = − =∫ x dx x x
Consumer Surplus:The area between the demand function, p = f(x),and the horizontal line p = pe, where pe is theprice at market equilibrium, is called theconsumer surplus. It represents the total savingsof all of the consumers. It is the area shaded inFigure 10.39, where the upper curve is thedemand curve and the lower curve is the supplycurve. If xe represents the number of itemsproduced and sold at market equilibrium, then
Consumer Surplus = ( )p p dxe
xe−∫0
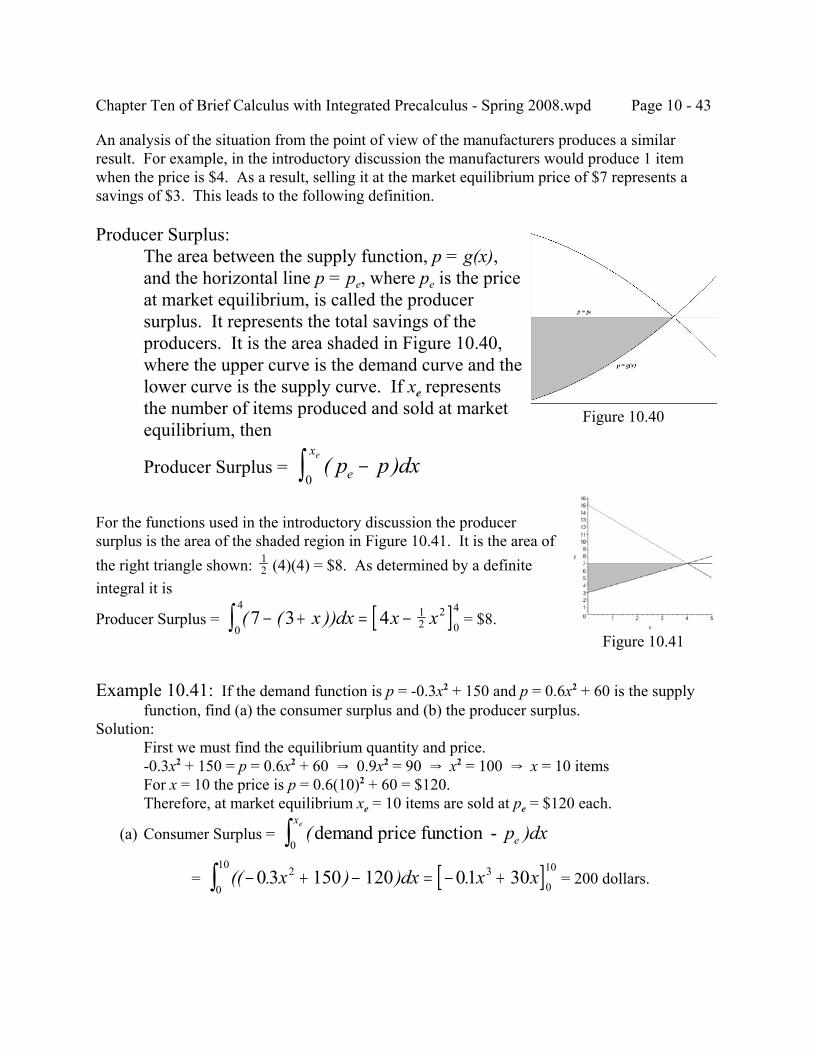
Chapter Ten of Brief Calculus with Integrated Precalculus - Spring 2008.wpd Page 10 - 43
Figure 10.40
Figure 10.41
An analysis of the situation from the point of view of the manufacturers produces a similarresult. For example, in the introductory discussion the manufacturers would produce 1 itemwhen the price is $4. As a result, selling it at the market equilibrium price of $7 represents asavings of $3. This leads to the following definition.
Producer Surplus:The area between the supply function, p = g(x),and the horizontal line p = pe, where pe is the priceat market equilibrium, is called the producersurplus. It represents the total savings of theproducers. It is the area shaded in Figure 10.40,where the upper curve is the demand curve and thelower curve is the supply curve. If xe representsthe number of items produced and sold at marketequilibrium, then
Producer Surplus = ( )p p dxe
xe−∫0
For the functions used in the introductory discussion the producersurplus is the area of the shaded region in Figure 10.41. It is the area ofthe right triangle shown: (4)(4) = $8. As determined by a definite1
2
integral it is
Producer Surplus = = $8.[ ]( ( ))7 3 4 12
20
4
0
4− + = −∫ x dx x x
Example 10.41: If the demand function is p = -0.3x2 + 150 and p = 0.6x2 + 60 is the supplyfunction, find (a) the consumer surplus and (b) the producer surplus.
Solution:First we must find the equilibrium quantity and price.-0.3x2 + 150 = p = 0.6x2 + 60 Y 0.9x2 = 90 Y x2 = 100 Y x = 10 itemsFor x = 10 the price is p = 0.6(10)2 + 60 = $120.Therefore, at market equilibrium xe = 10 items are sold at pe = $120 each.
(a) Consumer Surplus = ( )demand price function - p dxe
xe
0∫= = 200 dollars.[ ](( . ) ) .− + − = − +∫ 0 3 150 120 01 302 3
0
10
0
10x dx x x
Chapter Ten of Brief Calculus with Integrated Precalculus - Spring 2008.wpd Page 10 - 44
(b) Producer Surplus = ( )p dxe
xe−∫ supply price function
0
= = 400 dollars.[ ]( ( . )) .120 0 6 60 60 0 22 30
10
0
10− + = −∫ x dx x x
Example 10.42: The following equations are the demand and supply equations (but notnecessarily in that order): 3p - 6x = 240 and 2p + 6x = 560.(a) Determine which equation is the demand equation and which is the supply equation.(b) Find the consumer surplus.(c) Find the producer surplus.
Solution: (a) It is easier to determine which equation is the demand equation if we first rearrange each
in the form that will be needed to find the answers to parts (b) and (c). That is, we needto solve for p.3p - 6x = 240 Y 3p = 6x + 240 Y p = 2x + 80Since the price increases as the quantity increases, 3p - 6x = 240 is the supply equation.2p + 6x = 560 Y 2p = -6x + 560 Y p = -3x + 280Since the price decreases as the quantity increases, 2p + 6x = 560 is the demand equation.
(b) For both this part and the next one we need to know the equilibrium quantity and price.2x + 80 = p = -3x + 280 Y 5x = 200 Y x = 40At x = 40 the price is p = 2x + 80 = 2(40) + 80 = 160.Therefore, the equilibrium price and quantity are pe = $160 and xe = 40 items.The consumer surplus is the area between the demand curve p = -3x + 280 on the top andthe equilibrium price pe = 160 on the bottom for x between 0 and xe = 40, that is
Consumer surplus = = = $2400(( ) )− + −∫ 3 280 1600
40x dx [ ]− +3
22
0
40120x x
(c) The producer surplus is the area between the equilibrium price pe = 160 on the top andthe supply curve p = 2x + 80 on the bottom for x between 0 and xe = 40, that is
Producer surplus = = $1600[ ]( ( ))160 2 80 80 20
40
0
40− + = −∫ x dx x x
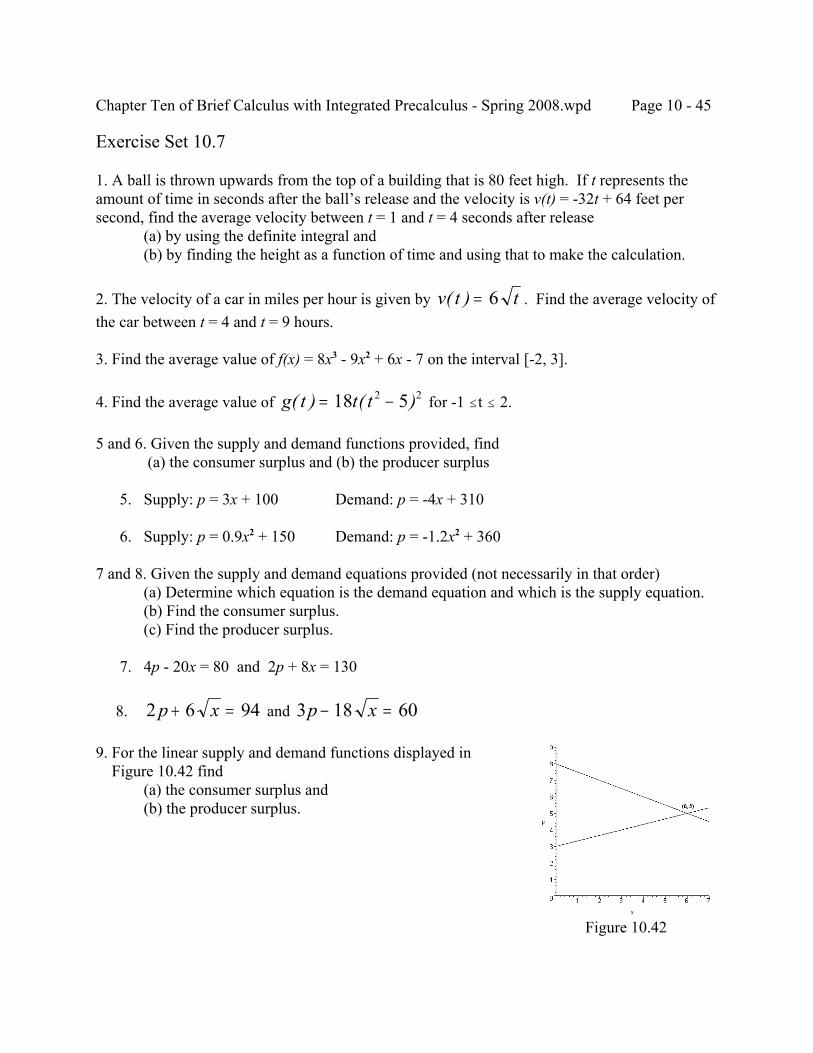
Chapter Ten of Brief Calculus with Integrated Precalculus - Spring 2008.wpd Page 10 - 45
Figure 10.42
Exercise Set 10.7
1. A ball is thrown upwards from the top of a building that is 80 feet high. If t represents theamount of time in seconds after the ball’s release and the velocity is v(t) = -32t + 64 feet persecond, find the average velocity between t = 1 and t = 4 seconds after release
(a) by using the definite integral and(b) by finding the height as a function of time and using that to make the calculation.
2. The velocity of a car in miles per hour is given by . Find the average velocity ofv t t( ) = 6the car between t = 4 and t = 9 hours.
3. Find the average value of f(x) = 8x3 - 9x2 + 6x - 7 on the interval [-2, 3].
4. Find the average value of for -1 #t # 2.g t t t( ) ( )= −18 52 2
5 and 6. Given the supply and demand functions provided, find (a) the consumer surplus and (b) the producer surplus
5. Supply: p = 3x + 100 Demand: p = -4x + 310
6. Supply: p = 0.9x2 + 150 Demand: p = -1.2x2 + 360
7 and 8. Given the supply and demand equations provided (not necessarily in that order)(a) Determine which equation is the demand equation and which is the supply equation.(b) Find the consumer surplus.(c) Find the producer surplus.
7. 4p - 20x = 80 and 2p + 8x = 130
8. and 2 6 94p x+ = 3 18 60p x− =
9. For the linear supply and demand functions displayed in Figure 10.42 find
(a) the consumer surplus and(b) the producer surplus.
Chapter Eleven of Brief Calculus with Integrated Precalculus - Spring 2007.wpd Page 11 - 1
CHAPTER ELEVENFUNCTIONS OF SEVERAL VARIABLES
11.1 TABLES AND CONTOUR GRAPHS
We have already encountered functions of several variables when we considered the topic ofcompound interest. The formulas and both represent functions ofA P r
nnt= +( )1 A Pert=
several variables. The first formula is a function of 4 variables and is symbolized by A(P, r, n, t). The second formula is a function of three variables, A(P, r, t). The order in which the variablesappear is important. In the case of the first formula A(1000, 0.05, 12, 4) means that there are 12periods per year (monthly compounding) and that 4 years have elapsed. A(1000, 0.05, 4, 12), onthe other hand, means that there are 4 periods per year (quarterly compounding) and that 12 yearshave elapsed. The significance of this will be clarified in the next example. It should be notedthat the four variables that appear in the first formula are referred to as the four arguments of thefunction.
Example 11.1: If f (x, y, z) = 3x + 4y + 5z find: (a) f (2, 7, 11) (b) f (7, 2, 11) (c) f (11, 7, 2) (d) f (2t, 7t, 11t) (e) f (5 + t, 9 - t, 7t) (f) f (y, x, z) (g) f (z, x, y) (h) f (y + z, x + z, x + y)Solution:
The first five parts of this example should not cause any problems. But you should lookclosely at the last three parts before beginning. Lest a misunderstanding should occur,part (f) will be examined first. It is important to realize that the definition of the functionprovided does not really involve x, y and z. The function should actually be viewed as
f (first argument, second argument, third argument) = 3(first argument) + 4(second argument) + 5(third argument)
The x, y and z are merely symbolic place holders representing these arguments. In part (f)the first argument is y, the second argument is x and the third argument is z.
(f) Therefore f (y, x, z) = 3(y) + 4(x) + 5(z) = 4x + 3y + 5z (a) f (2, 7, 11) = 3(2) + 4(7) + 5(11) = 89 (b) f (7, 2, 11) = 3(7) + 4(2) + 5(11) = 84 (c) f (11, 7, 2) = 3(11) + 4(7) + 5(2) = 71 (d) f (2t, 7t, 11t) = 3(2t) + 4(7t) + 5(11t) = 89t (e) f (5 + t, 9 - t, 7t) = 3(5 + t) + 4(9 - t) + 5(7t) = 15 + 3t + 36 - 4t + 35t = 51 + 34t (g) f (z, x, y) = 3(z) + 4(x) + 5(y) = 4x + 5y + 3z (h) f (y + z, x + z, x + y) = 3(y + z) + 4(x + z) + 5(x + y) = 9x + 8y + 7z
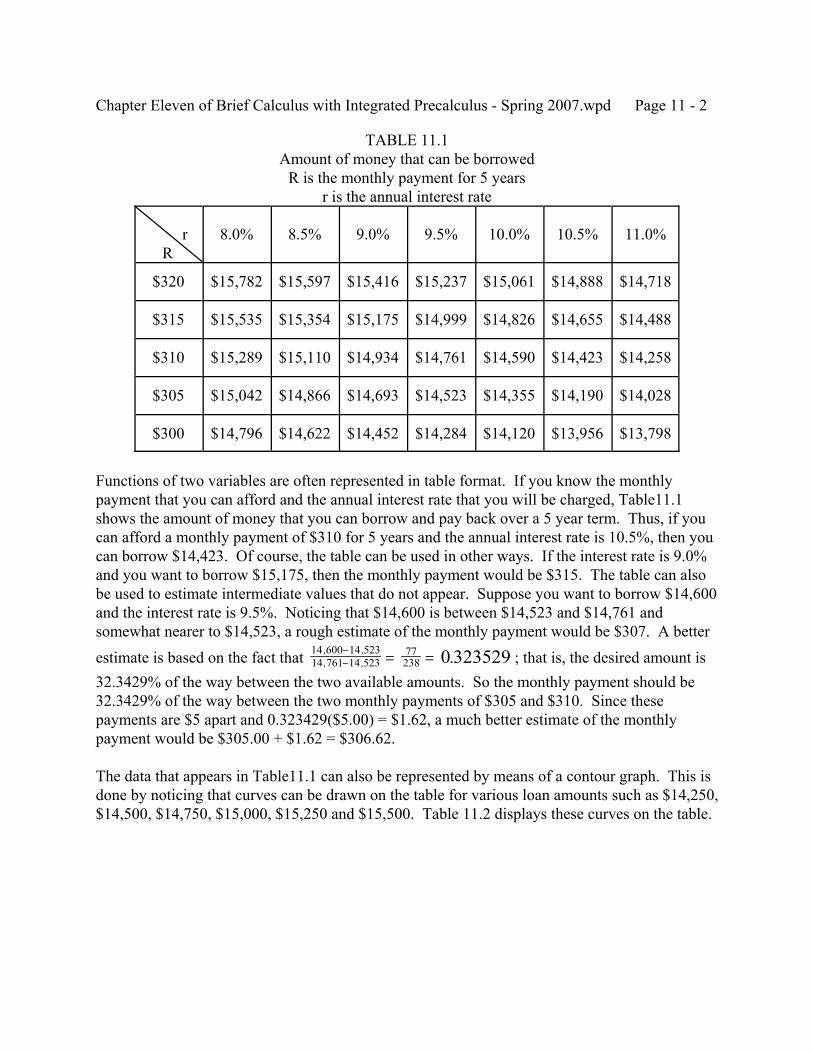
Chapter Eleven of Brief Calculus with Integrated Precalculus - Spring 2007.wpd Page 11 - 2
TABLE 11.1Amount of money that can be borrowed
R is the monthly payment for 5 yearsr is the annual interest rate
r R
8.0% 8.5% 9.0% 9.5% 10.0% 10.5% 11.0%
$320 $15,782 $15,597 $15,416 $15,237 $15,061 $14,888 $14,718
$315 $15,535 $15,354 $15,175 $14,999 $14,826 $14,655 $14,488
$310 $15,289 $15,110 $14,934 $14,761 $14,590 $14,423 $14,258
$305 $15,042 $14,866 $14,693 $14,523 $14,355 $14,190 $14,028
$300 $14,796 $14,622 $14,452 $14,284 $14,120 $13,956 $13,798
Functions of two variables are often represented in table format. If you know the monthlypayment that you can afford and the annual interest rate that you will be charged, Table11.1shows the amount of money that you can borrow and pay back over a 5 year term. Thus, if youcan afford a monthly payment of $310 for 5 years and the annual interest rate is 10.5%, then youcan borrow $14,423. Of course, the table can be used in other ways. If the interest rate is 9.0%and you want to borrow $15,175, then the monthly payment would be $315. The table can alsobe used to estimate intermediate values that do not appear. Suppose you want to borrow $14,600and the interest rate is 9.5%. Noticing that $14,600 is between $14,523 and $14,761 andsomewhat nearer to $14,523, a rough estimate of the monthly payment would be $307. A betterestimate is based on the fact that ; that is, the desired amount is14 600 14 523
14 761 14 52377238 0 323529, ,
, , .−− = =
32.3429% of the way between the two available amounts. So the monthly payment should be32.3429% of the way between the two monthly payments of $305 and $310. Since thesepayments are $5 apart and 0.323429($5.00) = $1.62, a much better estimate of the monthlypayment would be $305.00 + $1.62 = $306.62.
The data that appears in Table11.1 can also be represented by means of a contour graph. This isdone by noticing that curves can be drawn on the table for various loan amounts such as $14,250,$14,500, $14,750, $15,000, $15,250 and $15,500. Table 11.2 displays these curves on the table.
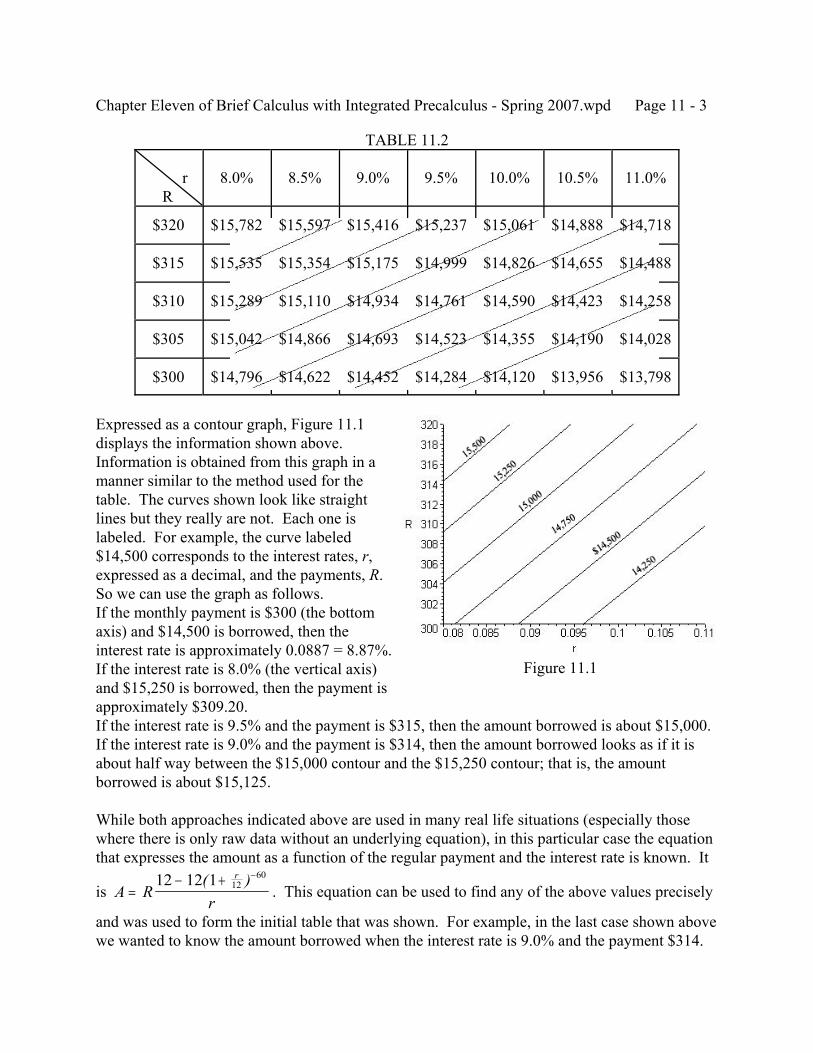
Chapter Eleven of Brief Calculus with Integrated Precalculus - Spring 2007.wpd Page 11 - 3
Figure 11.1
TABLE 11.2
r R
8.0% 8.5% 9.0% 9.5% 10.0% 10.5% 11.0%
$320 $15,782 $15,597 $15,416 $15,237 $15,061 $14,888 $14,718
$315 $15,535 $15,354 $15,175 $14,999 $14,826 $14,655 $14,488
$310 $15,289 $15,110 $14,934 $14,761 $14,590 $14,423 $14,258
$305 $15,042 $14,866 $14,693 $14,523 $14,355 $14,190 $14,028
$300 $14,796 $14,622 $14,452 $14,284 $14,120 $13,956 $13,798
Expressed as a contour graph, Figure 11.1displays the information shown above. Information is obtained from this graph in amanner similar to the method used for thetable. The curves shown look like straightlines but they really are not. Each one islabeled. For example, the curve labeled$14,500 corresponds to the interest rates, r,expressed as a decimal, and the payments, R. So we can use the graph as follows.If the monthly payment is $300 (the bottomaxis) and $14,500 is borrowed, then theinterest rate is approximately 0.0887 = 8.87%.If the interest rate is 8.0% (the vertical axis)and $15,250 is borrowed, then the payment isapproximately $309.20.If the interest rate is 9.5% and the payment is $315, then the amount borrowed is about $15,000.If the interest rate is 9.0% and the payment is $314, then the amount borrowed looks as if it isabout half way between the $15,000 contour and the $15,250 contour; that is, the amountborrowed is about $15,125.
While both approaches indicated above are used in many real life situations (especially thosewhere there is only raw data without an underlying equation), in this particular case the equationthat expresses the amount as a function of the regular payment and the interest rate is known. It
is . This equation can be used to find any of the above values preciselyA Rr
r
=− + −12 12 1 12
60( )
and was used to form the initial table that was shown. For example, in the last case shown abovewe wanted to know the amount borrowed when the interest rate is 9.0% and the payment $314.
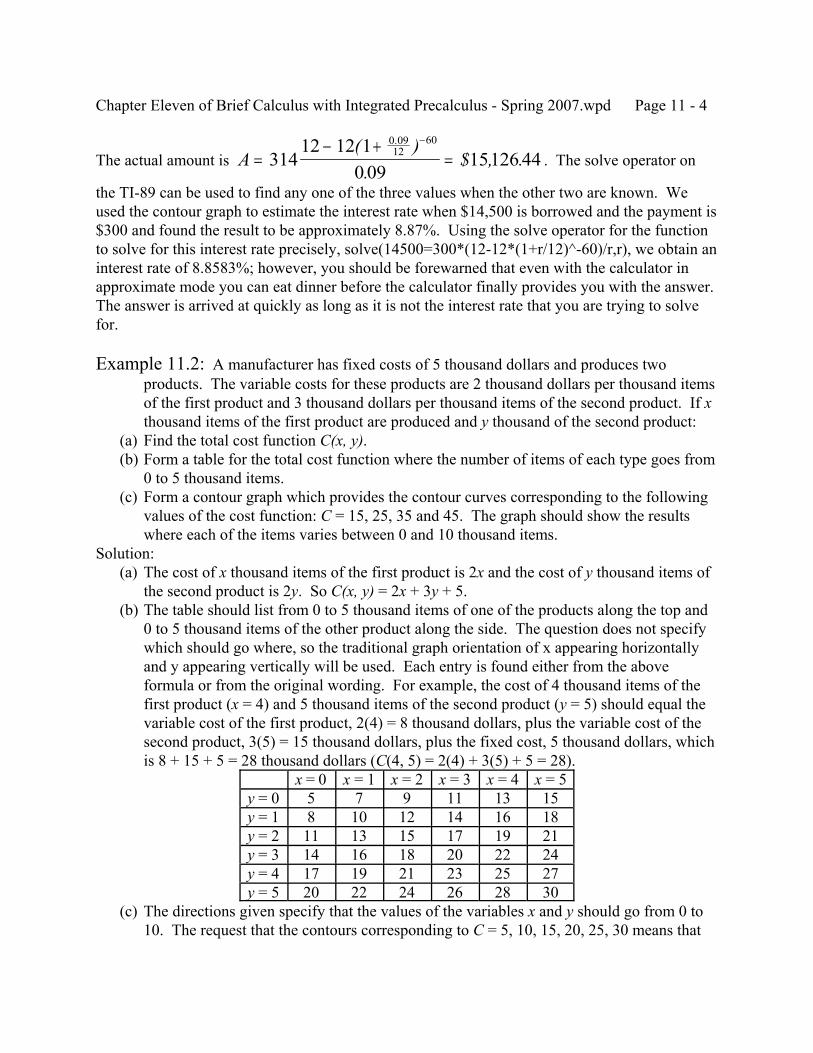
Chapter Eleven of Brief Calculus with Integrated Precalculus - Spring 2007.wpd Page 11 - 4
The actual amount is . The solve operator onA =− +
=−
31412 12 1
0 0915126 44
0 0912
60( ).
$ , ..
the TI-89 can be used to find any one of the three values when the other two are known. Weused the contour graph to estimate the interest rate when $14,500 is borrowed and the payment is$300 and found the result to be approximately 8.87%. Using the solve operator for the functionto solve for this interest rate precisely, solve(14500=300*(12-12*(1+r/12)^-60)/r,r), we obtain aninterest rate of 8.8583%; however, you should be forewarned that even with the calculator inapproximate mode you can eat dinner before the calculator finally provides you with the answer. The answer is arrived at quickly as long as it is not the interest rate that you are trying to solvefor.
Example 11.2: A manufacturer has fixed costs of 5 thousand dollars and produces twoproducts. The variable costs for these products are 2 thousand dollars per thousand itemsof the first product and 3 thousand dollars per thousand items of the second product. If xthousand items of the first product are produced and y thousand of the second product:
(a) Find the total cost function C(x, y). (b) Form a table for the total cost function where the number of items of each type goes from
0 to 5 thousand items. (c) Form a contour graph which provides the contour curves corresponding to the following
values of the cost function: C = 15, 25, 35 and 45. The graph should show the resultswhere each of the items varies between 0 and 10 thousand items.
Solution: (a) The cost of x thousand items of the first product is 2x and the cost of y thousand items of
the second product is 2y. So C(x, y) = 2x + 3y + 5. (b) The table should list from 0 to 5 thousand items of one of the products along the top and
0 to 5 thousand items of the other product along the side. The question does not specifywhich should go where, so the traditional graph orientation of x appearing horizontallyand y appearing vertically will be used. Each entry is found either from the aboveformula or from the original wording. For example, the cost of 4 thousand items of thefirst product (x = 4) and 5 thousand items of the second product (y = 5) should equal thevariable cost of the first product, 2(4) = 8 thousand dollars, plus the variable cost of thesecond product, 3(5) = 15 thousand dollars, plus the fixed cost, 5 thousand dollars, whichis 8 + 15 + 5 = 28 thousand dollars (C(4, 5) = 2(4) + 3(5) + 5 = 28).
x = 0 x = 1 x = 2 x = 3 x = 4 x = 5y = 0 5 7 9 11 13 15y = 1 8 10 12 14 16 18y = 2 11 13 15 17 19 21y = 3 14 16 18 20 22 24y = 4 17 19 21 23 25 27y = 5 20 22 24 26 28 30
(c) The directions given specify that the values of the variables x and y should go from 0 to10. The request that the contours corresponding to C = 5, 10, 15, 20, 25, 30 means that
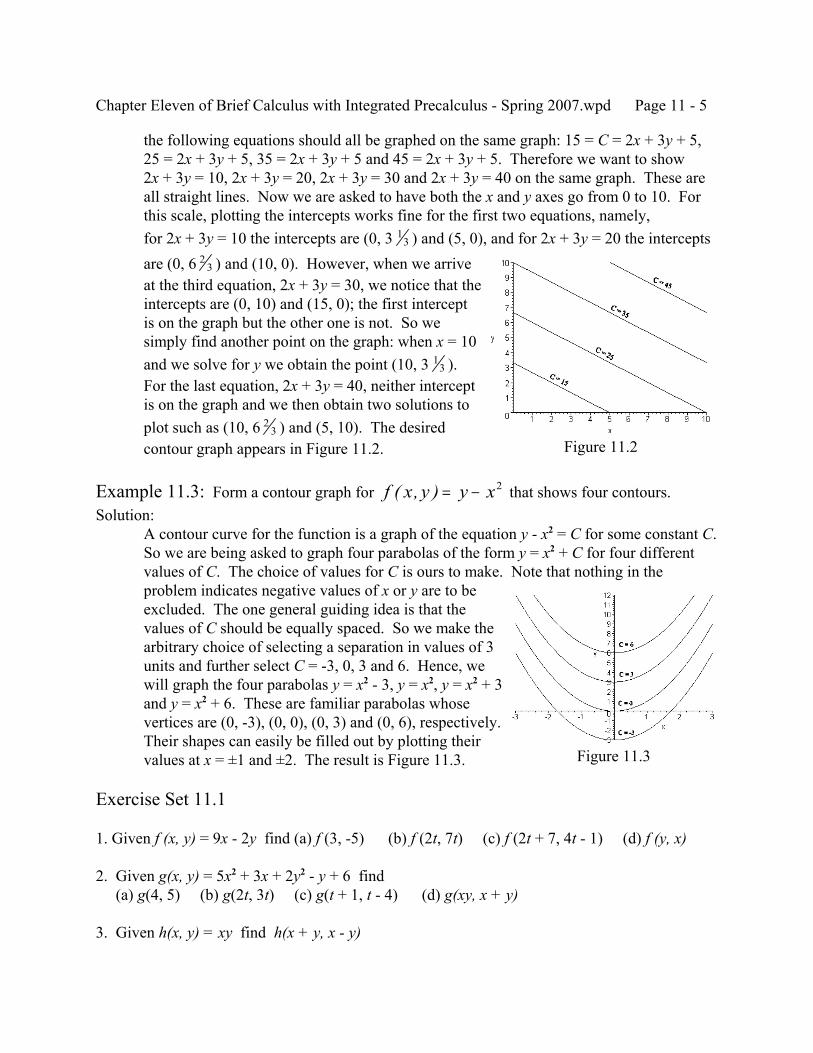
Chapter Eleven of Brief Calculus with Integrated Precalculus - Spring 2007.wpd Page 11 - 5
Figure 11.2
Figure 11.3
the following equations should all be graphed on the same graph: 15 = C = 2x + 3y + 5,25 = 2x + 3y + 5, 35 = 2x + 3y + 5 and 45 = 2x + 3y + 5. Therefore we want to show2x + 3y = 10, 2x + 3y = 20, 2x + 3y = 30 and 2x + 3y = 40 on the same graph. These areall straight lines. Now we are asked to have both the x and y axes go from 0 to 10. Forthis scale, plotting the intercepts works fine for the first two equations, namely,for 2x + 3y = 10 the intercepts are (0, 3 ) and (5, 0), and for 2x + 3y = 20 the intercepts1
3
are (0, 6 ) and (10, 0). However, when we arrive23
at the third equation, 2x + 3y = 30, we notice that theintercepts are (0, 10) and (15, 0); the first interceptis on the graph but the other one is not. So wesimply find another point on the graph: when x = 10and we solve for y we obtain the point (10, 3 ).1
3
For the last equation, 2x + 3y = 40, neither interceptis on the graph and we then obtain two solutions toplot such as (10, 6 ) and (5, 10). The desired2
3
contour graph appears in Figure 11.2.
Example 11.3: Form a contour graph for that shows four contours.f x y y x( , ) = − 2
Solution:A contour curve for the function is a graph of the equation y - x2 = C for some constant C. So we are being asked to graph four parabolas of the form y = x2 + C for four differentvalues of C. The choice of values for C is ours to make. Note that nothing in theproblem indicates negative values of x or y are to beexcluded. The one general guiding idea is that thevalues of C should be equally spaced. So we make thearbitrary choice of selecting a separation in values of 3units and further select C = -3, 0, 3 and 6. Hence, wewill graph the four parabolas y = x2 - 3, y = x2, y = x2 + 3and y = x2 + 6. These are familiar parabolas whosevertices are (0, -3), (0, 0), (0, 3) and (0, 6), respectively. Their shapes can easily be filled out by plotting theirvalues at x = ±1 and ±2. The result is Figure 11.3.
Exercise Set 11.1
1. Given f (x, y) = 9x - 2y find (a) f (3, -5) (b) f (2t, 7t) (c) f (2t + 7, 4t - 1) (d) f (y, x)
2. Given g(x, y) = 5x2 + 3x + 2y2 - y + 6 find (a) g(4, 5) (b) g(2t, 3t) (c) g(t + 1, t - 4) (d) g(xy, x + y)
3. Given h(x, y) = xy find h(x + y, x - y)
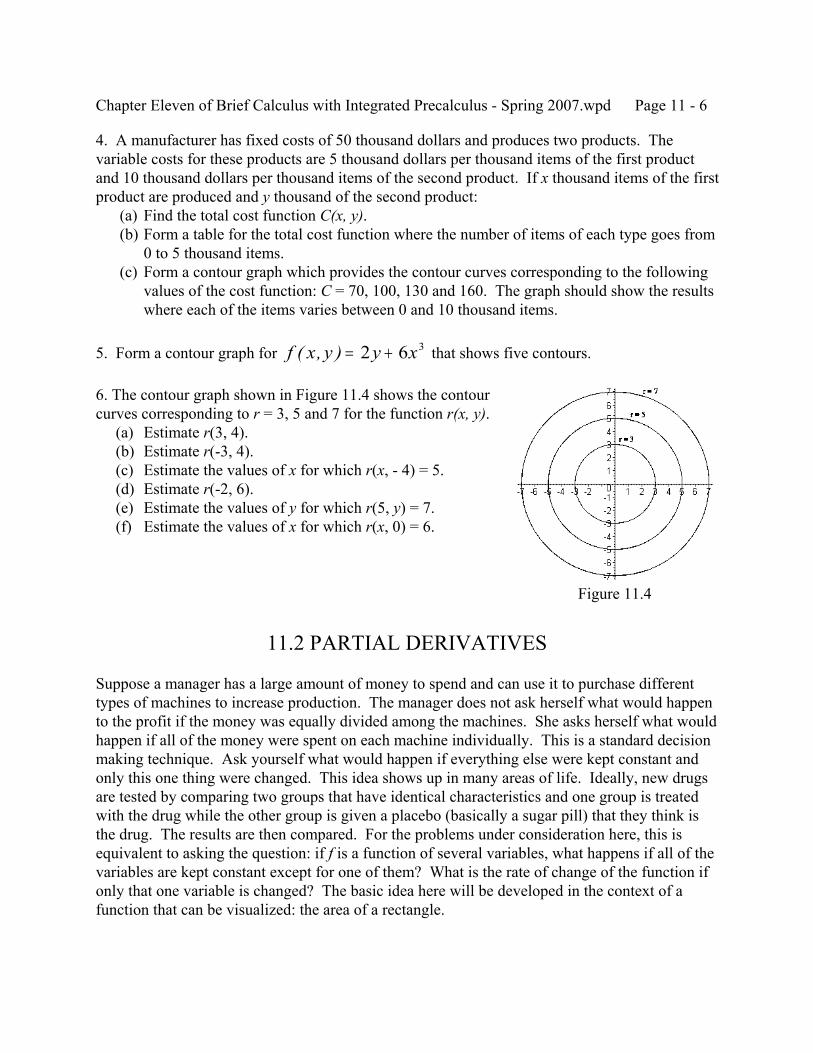
Chapter Eleven of Brief Calculus with Integrated Precalculus - Spring 2007.wpd Page 11 - 6
Figure 11.4
4. A manufacturer has fixed costs of 50 thousand dollars and produces two products. Thevariable costs for these products are 5 thousand dollars per thousand items of the first productand 10 thousand dollars per thousand items of the second product. If x thousand items of the firstproduct are produced and y thousand of the second product: (a) Find the total cost function C(x, y). (b) Form a table for the total cost function where the number of items of each type goes from
0 to 5 thousand items. (c) Form a contour graph which provides the contour curves corresponding to the following
values of the cost function: C = 70, 100, 130 and 160. The graph should show the resultswhere each of the items varies between 0 and 10 thousand items.
5. Form a contour graph for that shows five contours.f x y y x( , ) = +2 6 3
6. The contour graph shown in Figure 11.4 shows the contourcurves corresponding to r = 3, 5 and 7 for the function r(x, y). (a) Estimate r(3, 4). (b) Estimate r(-3, 4). (c) Estimate the values of x for which r(x, - 4) = 5. (d) Estimate r(-2, 6). (e) Estimate the values of y for which r(5, y) = 7. (f) Estimate the values of x for which r(x, 0) = 6.
11.2 PARTIAL DERIVATIVES
Suppose a manager has a large amount of money to spend and can use it to purchase differenttypes of machines to increase production. The manager does not ask herself what would happento the profit if the money was equally divided among the machines. She asks herself what wouldhappen if all of the money were spent on each machine individually. This is a standard decisionmaking technique. Ask yourself what would happen if everything else were kept constant andonly this one thing were changed. This idea shows up in many areas of life. Ideally, new drugsare tested by comparing two groups that have identical characteristics and one group is treatedwith the drug while the other group is given a placebo (basically a sugar pill) that they think isthe drug. The results are then compared. For the problems under consideration here, this isequivalent to asking the question: if f is a function of several variables, what happens if all of thevariables are kept constant except for one of them? What is the rate of change of the function ifonly that one variable is changed? The basic idea here will be developed in the context of afunction that can be visualized: the area of a rectangle.
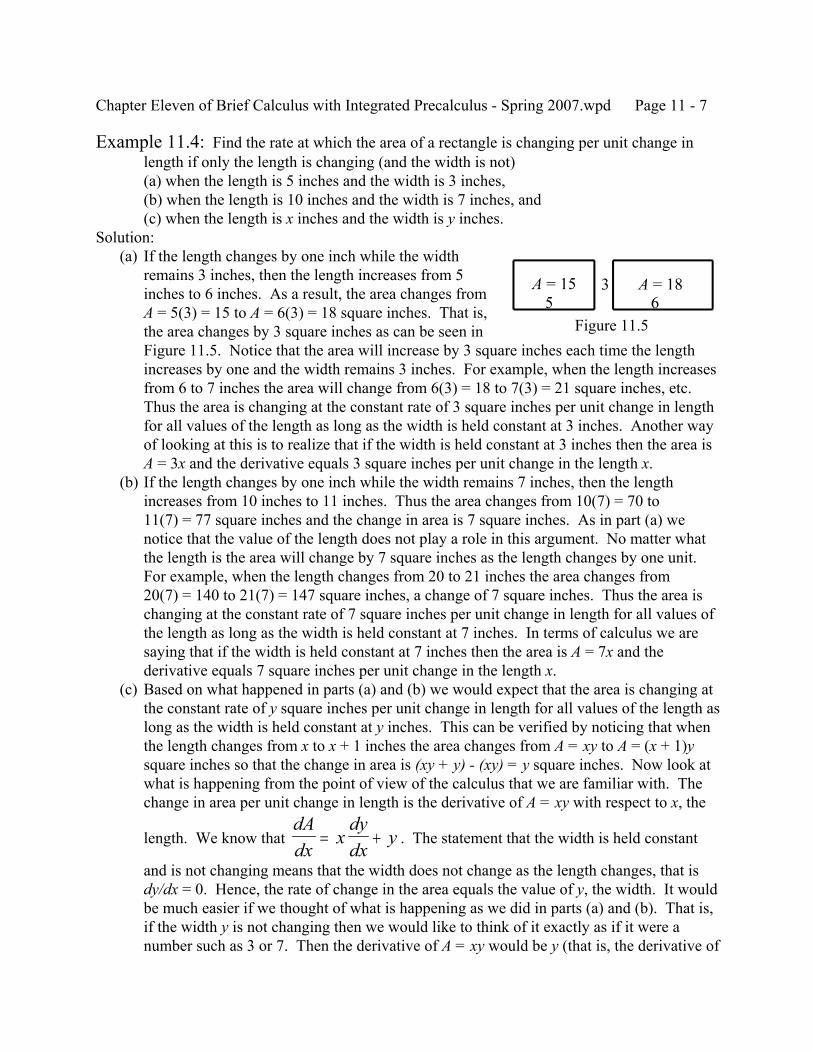
Chapter Eleven of Brief Calculus with Integrated Precalculus - Spring 2007.wpd Page 11 - 7
Figure 11.5
Example 11.4: Find the rate at which the area of a rectangle is changing per unit change inlength if only the length is changing (and the width is not)(a) when the length is 5 inches and the width is 3 inches,(b) when the length is 10 inches and the width is 7 inches, and(c) when the length is x inches and the width is y inches.
Solution: (a) If the length changes by one inch while the width
remains 3 inches, then the length increases from 5inches to 6 inches. As a result, the area changes fromA = 5(3) = 15 to A = 6(3) = 18 square inches. That is,the area changes by 3 square inches as can be seen inFigure 11.5. Notice that the area will increase by 3 square inches each time the lengthincreases by one and the width remains 3 inches. For example, when the length increasesfrom 6 to 7 inches the area will change from 6(3) = 18 to 7(3) = 21 square inches, etc. Thus the area is changing at the constant rate of 3 square inches per unit change in lengthfor all values of the length as long as the width is held constant at 3 inches. Another wayof looking at this is to realize that if the width is held constant at 3 inches then the area isA = 3x and the derivative equals 3 square inches per unit change in the length x.
(b) If the length changes by one inch while the width remains 7 inches, then the lengthincreases from 10 inches to 11 inches. Thus the area changes from 10(7) = 70 to11(7) = 77 square inches and the change in area is 7 square inches. As in part (a) wenotice that the value of the length does not play a role in this argument. No matter whatthe length is the area will change by 7 square inches as the length changes by one unit. For example, when the length changes from 20 to 21 inches the area changes from20(7) = 140 to 21(7) = 147 square inches, a change of 7 square inches. Thus the area ischanging at the constant rate of 7 square inches per unit change in length for all values ofthe length as long as the width is held constant at 7 inches. In terms of calculus we aresaying that if the width is held constant at 7 inches then the area is A = 7x and thederivative equals 7 square inches per unit change in the length x.
(c) Based on what happened in parts (a) and (b) we would expect that the area is changing atthe constant rate of y square inches per unit change in length for all values of the length aslong as the width is held constant at y inches. This can be verified by noticing that whenthe length changes from x to x + 1 inches the area changes from A = xy to A = (x + 1)ysquare inches so that the change in area is (xy + y) - (xy) = y square inches. Now look atwhat is happening from the point of view of the calculus that we are familiar with. Thechange in area per unit change in length is the derivative of A = xy with respect to x, the
length. We know that . The statement that the width is held constantdAdx
xdydx
y= +
and is not changing means that the width does not change as the length changes, that isdy/dx = 0. Hence, the rate of change in the area equals the value of y, the width. It wouldbe much easier if we thought of what is happening as we did in parts (a) and (b). That is,if the width y is not changing then we would like to think of it exactly as if it were anumber such as 3 or 7. Then the derivative of A = xy would be y (that is, the derivative of
Chapter Eleven of Brief Calculus with Integrated Precalculus - Spring 2007.wpd Page 11 - 8
3x is 3, the derivative of 7x is 7, the derivative of cx is c, and the derivative of yx is y). However, we do not want to confuse this idea of the derivative with respect to x (whereother variables are held constant) with the more general idea. So a special notation forthis type of derivative exists. It replaces the “d” in the derivative with the special symbol
“M.” For our current example this produces . It is interpreted as saying∂∂
∂∂
Ax x
xy y= =
that the partial derivative of A with respect to x is y. The word “partial” is used todesignate the fact that it is only the part of the derivative that you obtain if the othervariables are treated as constants (so that their derivatives with respect to x are 0).
Partial Derivative. Suppose z = f(x, y).
is the partial derivative of z = f(x, y) with respect to x.∂∂
zx
f f x yx x= = ( , )
It is derivative you get if you treat y as if it is a constant.
is the partial derivative of z = f(x, y) with respect to y.∂∂
zy
f f x yy y= = ( , )
It is derivative you get if you treat x as if it is a constant.
The idea generalizes to any number of variables. Thus, if w = g(x, y, z, u) then
is the partial derivative of w = g(x, y, z, u) with respect to z and it is∂∂wz
g g x y z uz z= = ( , , , )
the derivative you get if you treat x, y and u as if they are constants.
Example 11.5: If , find (a) fx and (b) fy.f x y x x y y( , ) = + +5 72 3 4 6
Solution: (a) For this part of the question we are being asked to think of y as if it were a constant and
then find the derivative with respect to x. For example, if y were the number 2 then wewould think of the function as f = 5x2 + x3(2)4 + 7(2)6 and the derivative would be10x + 3x2(2)4 + 0, that is, 10x + 3x2y4. Notice that in effect this is saying that if a termdoes not contain x then it gets treated as a constant and its derivative is 0; if a term doescontain x then you treat everything not containing x as if it is a constant multiplying thepart involving x.
(b) For this part of the question we are being asked to think of x as if it were a constant andthen find the derivative with respect to y. For example, if x were the number 2 then wewould think of the function as f = 5(2)2 + (2)3y4 + 7y6 and the derivative would be0 + (2)34y3 + 42y5, that is, 4x3y3 + 42y5. Notice that in effect this is saying that if a termdoes not contain y then it gets treated as a constant and its derivative is 0; if a term doescontain y then you treat everything not containing y as if it is a constant multiplying thepart involving y.
Chapter Eleven of Brief Calculus with Integrated Precalculus - Spring 2007.wpd Page 11 - 9
Example 11.6: If w = 3xyz2 + 5xy3z + 2x4yz + 7xy + xz + 9yz + 6x + 4y +11z,find (a) wx, (b) wy and (c) wz.
Solution: (a) Since we want to find the partial derivative with respect to x, we think of the function as
w = (3yz2)x + (5y3z)x + (2yz)x4 + (7y)x + (z)x + (9yz) + (6)x + (4y) + (11z)where we think of the expressions inside the parentheses as a constant since they do notinvolve x. As a result we see thatwx = (3yz2)(1) + (5y3z)(1) + (2yz)(4x3) + (7y)(1) + (z)(1) + 0 + (6)(1) + 0 + 0 = 3yz2 + 5y3z + 8x3yz + 7y + z + 6
(b) Since we want to find the partial derivative with respect to y, we think of the function asw = (3xz2)y + (5xz)y3 + (2x4z)y + (7x)y + (xz) + (9z)y + (6x) + (4)y + (11z)where we think of the expressions inside the parentheses as a constant since they do notinvolve y. As a result we see thatwy = (3xz2)(1) + (5xz)(3y2) + (2x4z)(1) + (7x)(1) + 0 + (9z)(1) + 0 + (4)(1) + 0 = 3xz2 + 15xy2z + 2x4z + 7x + 9z + 4
(c) Using w = (3xy)z2 + (5xy3)z + (2x4y)z + (7xy) + (x)z + (9y)z + (6x) + (4y) + (11)zwe obtain wz = (3xy)(2z) + (5xy3)(1) + (2x4y)(1) + 0 + (x)(1) + (9y)(1) + 0 + 0 + (11)(1)
= 6xyz + 5xy3 + 2x4y + x + 9y + 11
All of the usual rules for derivatives still hold.
Example 11.7: If find (a) fx and (b) fy.f x y xe xy( , ) = 3 2
Solution: (a) Since 3x and e2xy both contain x, the product rule has to be used.
f xx
e ex
x xex
xy exxy xy xy xy= + = +3 3 3 2 32 2 2 2∂
∂∂∂
∂∂
= 3 2 3 6 3 3 2 12 2 2 2 2xe y e xye e xy exy xy xy xy xy( ) ( )+ = + = + (b) Since 3x does not contain y, it simply acts like a numerical constant so that
f xy
e xey
xy xe x x eyxy xy xy xy= = = =3 3 2 3 2 62 2 2 2 2∂
∂∂∂
( )
Example 11.8: If z = (2x + 3y)5, find (a) zx and (b) zy.Solution:
(a) z x yx
x y x y x yx = + + = + = +5 2 3 2 3 5 2 3 2 10 2 34 4 4( ) ( ) ( ) ( ) ( )∂∂
(b) z x yy
x y x y x yy = + + = + = +5 2 3 2 3 5 2 3 3 15 2 34 4 4( ) ( ) ( ) ( ) ( )∂∂
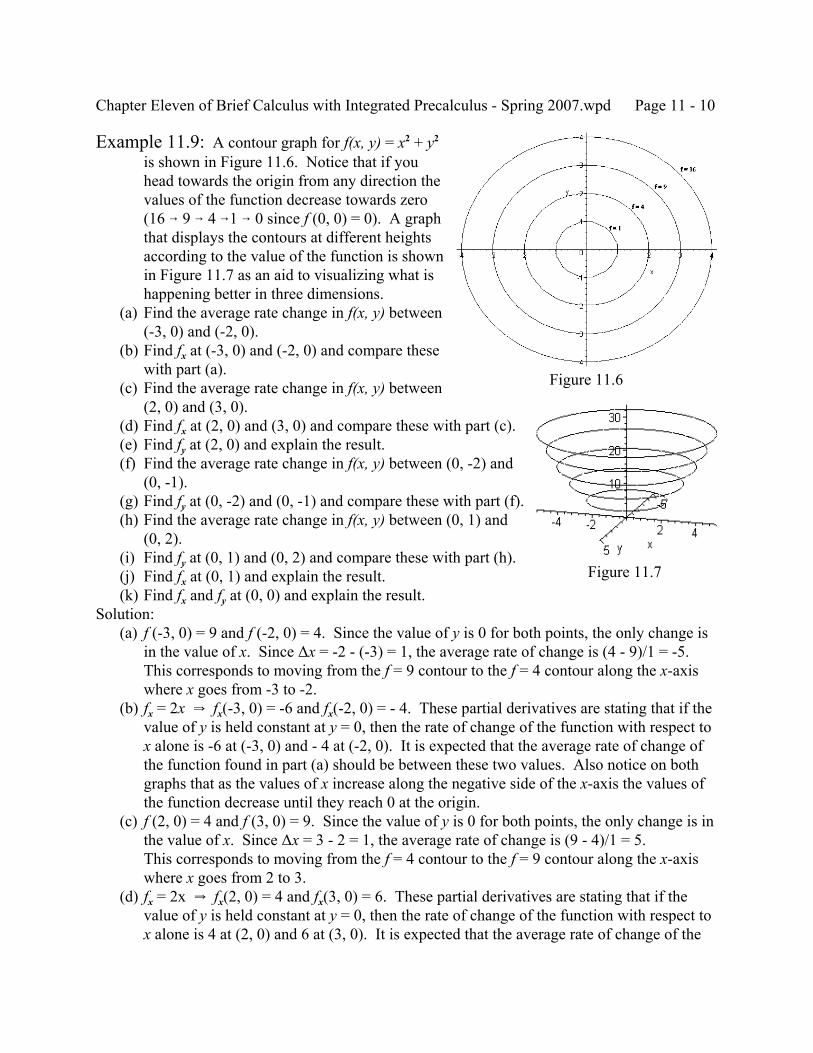
Chapter Eleven of Brief Calculus with Integrated Precalculus - Spring 2007.wpd Page 11 - 10
Figure 11.6
Figure 11.7
Example 11.9: A contour graph for f(x, y) = x2 + y2is shown in Figure 11.6. Notice that if youhead towards the origin from any direction thevalues of the function decrease towards zero(16 6 9 6 4 61 6 0 since f (0, 0) = 0). A graphthat displays the contours at different heightsaccording to the value of the function is shownin Figure 11.7 as an aid to visualizing what ishappening better in three dimensions.
(a) Find the average rate change in f(x, y) between(-3, 0) and (-2, 0).
(b) Find fx at (-3, 0) and (-2, 0) and compare thesewith part (a).
(c) Find the average rate change in f(x, y) between(2, 0) and (3, 0).
(d) Find fx at (2, 0) and (3, 0) and compare these with part (c). (e) Find fy at (2, 0) and explain the result. (f) Find the average rate change in f(x, y) between (0, -2) and
(0, -1). (g) Find fy at (0, -2) and (0, -1) and compare these with part (f). (h) Find the average rate change in f(x, y) between (0, 1) and
(0, 2). (i) Find fy at (0, 1) and (0, 2) and compare these with part (h). (j) Find fx at (0, 1) and explain the result. (k) Find fx and fy at (0, 0) and explain the result.Solution: (a) f (-3, 0) = 9 and f (-2, 0) = 4. Since the value of y is 0 for both points, the only change is
in the value of x. Since ∆x = -2 - (-3) = 1, the average rate of change is (4 - 9)/1 = -5.This corresponds to moving from the f = 9 contour to the f = 4 contour along the x-axiswhere x goes from -3 to -2.
(b) fx = 2x Y fx(-3, 0) = -6 and fx(-2, 0) = - 4. These partial derivatives are stating that if thevalue of y is held constant at y = 0, then the rate of change of the function with respect tox alone is -6 at (-3, 0) and - 4 at (-2, 0). It is expected that the average rate of change ofthe function found in part (a) should be between these two values. Also notice on bothgraphs that as the values of x increase along the negative side of the x-axis the values ofthe function decrease until they reach 0 at the origin.
(c) f (2, 0) = 4 and f (3, 0) = 9. Since the value of y is 0 for both points, the only change is inthe value of x. Since ∆x = 3 - 2 = 1, the average rate of change is (9 - 4)/1 = 5.This corresponds to moving from the f = 4 contour to the f = 9 contour along the x-axiswhere x goes from 2 to 3.
(d) fx = 2x Y fx(2, 0) = 4 and fx(3, 0) = 6. These partial derivatives are stating that if thevalue of y is held constant at y = 0, then the rate of change of the function with respect tox alone is 4 at (2, 0) and 6 at (3, 0). It is expected that the average rate of change of the
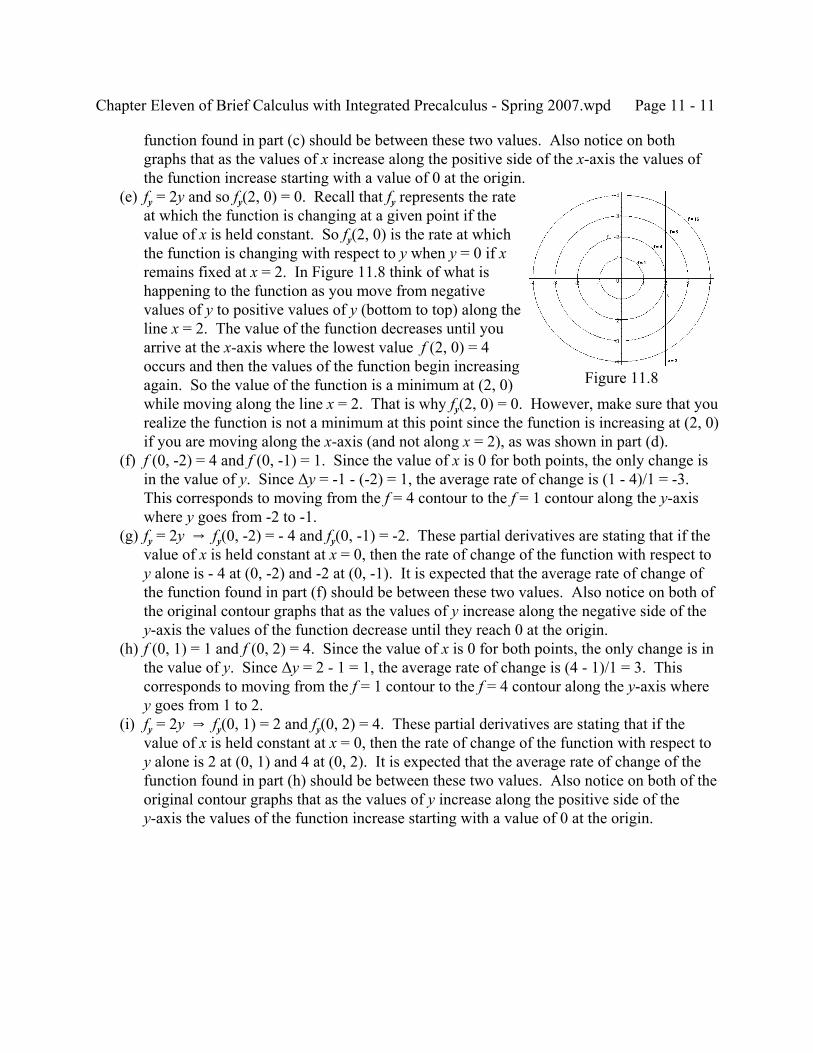
Chapter Eleven of Brief Calculus with Integrated Precalculus - Spring 2007.wpd Page 11 - 11
Figure 11.8
function found in part (c) should be between these two values. Also notice on bothgraphs that as the values of x increase along the positive side of the x-axis the values ofthe function increase starting with a value of 0 at the origin.
(e) fy = 2y and so fy(2, 0) = 0. Recall that fy represents the rateat which the function is changing at a given point if thevalue of x is held constant. So fy(2, 0) is the rate at whichthe function is changing with respect to y when y = 0 if xremains fixed at x = 2. In Figure 11.8 think of what ishappening to the function as you move from negativevalues of y to positive values of y (bottom to top) along theline x = 2. The value of the function decreases until youarrive at the x-axis where the lowest value f (2, 0) = 4occurs and then the values of the function begin increasingagain. So the value of the function is a minimum at (2, 0)while moving along the line x = 2. That is why fy(2, 0) = 0. However, make sure that yourealize the function is not a minimum at this point since the function is increasing at (2, 0)if you are moving along the x-axis (and not along x = 2), as was shown in part (d).
(f) f (0, -2) = 4 and f (0, -1) = 1. Since the value of x is 0 for both points, the only change isin the value of y. Since ∆y = -1 - (-2) = 1, the average rate of change is (1 - 4)/1 = -3. This corresponds to moving from the f = 4 contour to the f = 1 contour along the y-axiswhere y goes from -2 to -1.
(g) fy = 2y Y fy(0, -2) = - 4 and fy(0, -1) = -2. These partial derivatives are stating that if thevalue of x is held constant at x = 0, then the rate of change of the function with respect toy alone is - 4 at (0, -2) and -2 at (0, -1). It is expected that the average rate of change ofthe function found in part (f) should be between these two values. Also notice on both ofthe original contour graphs that as the values of y increase along the negative side of they-axis the values of the function decrease until they reach 0 at the origin.
(h) f (0, 1) = 1 and f (0, 2) = 4. Since the value of x is 0 for both points, the only change is inthe value of y. Since ∆y = 2 - 1 = 1, the average rate of change is (4 - 1)/1 = 3. Thiscorresponds to moving from the f = 1 contour to the f = 4 contour along the y-axis wherey goes from 1 to 2.
(i) fy = 2y Y fy(0, 1) = 2 and fy(0, 2) = 4. These partial derivatives are stating that if thevalue of x is held constant at x = 0, then the rate of change of the function with respect toy alone is 2 at (0, 1) and 4 at (0, 2). It is expected that the average rate of change of thefunction found in part (h) should be between these two values. Also notice on both of theoriginal contour graphs that as the values of y increase along the positive side of they-axis the values of the function increase starting with a value of 0 at the origin.
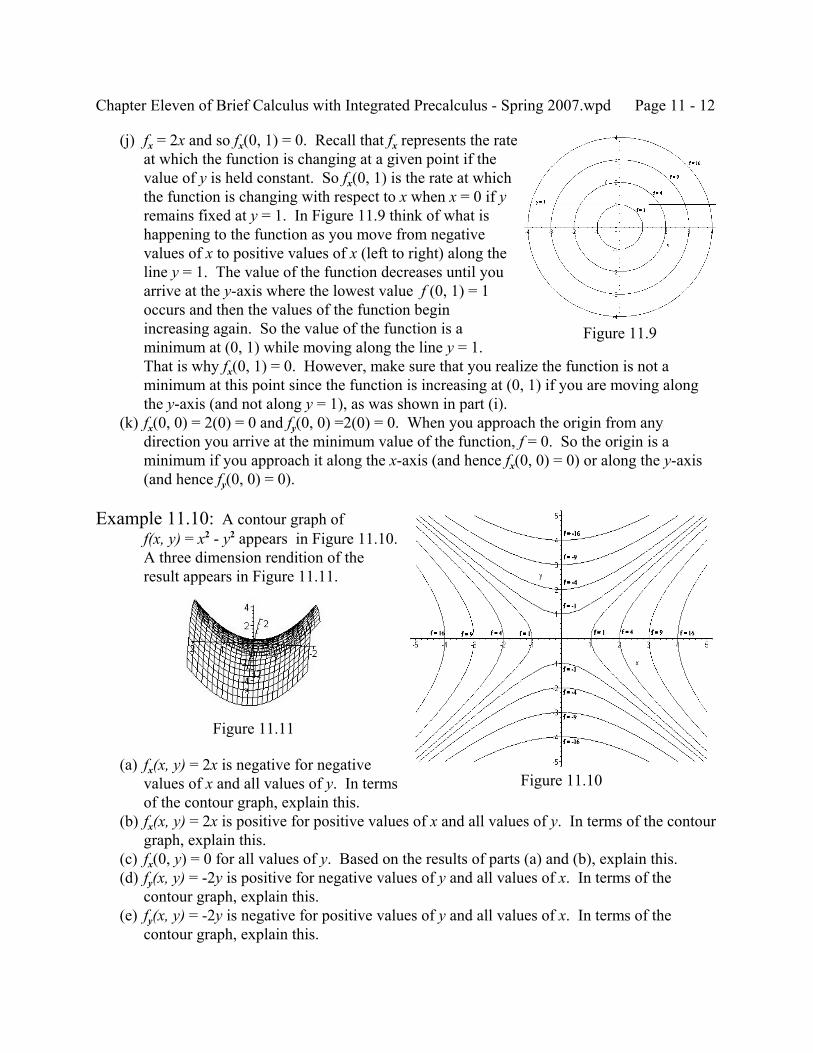
Chapter Eleven of Brief Calculus with Integrated Precalculus - Spring 2007.wpd Page 11 - 12
Figure 11.9
Figure 11.10
Figure 11.11
(j) fx = 2x and so fx(0, 1) = 0. Recall that fx represents the rateat which the function is changing at a given point if thevalue of y is held constant. So fx(0, 1) is the rate at whichthe function is changing with respect to x when x = 0 if yremains fixed at y = 1. In Figure 11.9 think of what ishappening to the function as you move from negativevalues of x to positive values of x (left to right) along theline y = 1. The value of the function decreases until youarrive at the y-axis where the lowest value f (0, 1) = 1occurs and then the values of the function beginincreasing again. So the value of the function is aminimum at (0, 1) while moving along the line y = 1. That is why fx(0, 1) = 0. However, make sure that you realize the function is not aminimum at this point since the function is increasing at (0, 1) if you are moving alongthe y-axis (and not along y = 1), as was shown in part (i).
(k) fx(0, 0) = 2(0) = 0 and fy(0, 0) =2(0) = 0. When you approach the origin from anydirection you arrive at the minimum value of the function, f = 0. So the origin is aminimum if you approach it along the x-axis (and hence fx(0, 0) = 0) or along the y-axis(and hence fy(0, 0) = 0).
Example 11.10: A contour graph of f(x, y) = x2 - y2 appears in Figure 11.10. A three dimension rendition of theresult appears in Figure 11.11.
(a) fx(x, y) = 2x is negative for negativevalues of x and all values of y. In termsof the contour graph, explain this.
(b) fx(x, y) = 2x is positive for positive values of x and all values of y. In terms of the contourgraph, explain this.
(c) fx(0, y) = 0 for all values of y. Based on the results of parts (a) and (b), explain this. (d) fy(x, y) = -2y is positive for negative values of y and all values of x. In terms of the
contour graph, explain this. (e) fy(x, y) = -2y is negative for positive values of y and all values of x. In terms of the
contour graph, explain this.
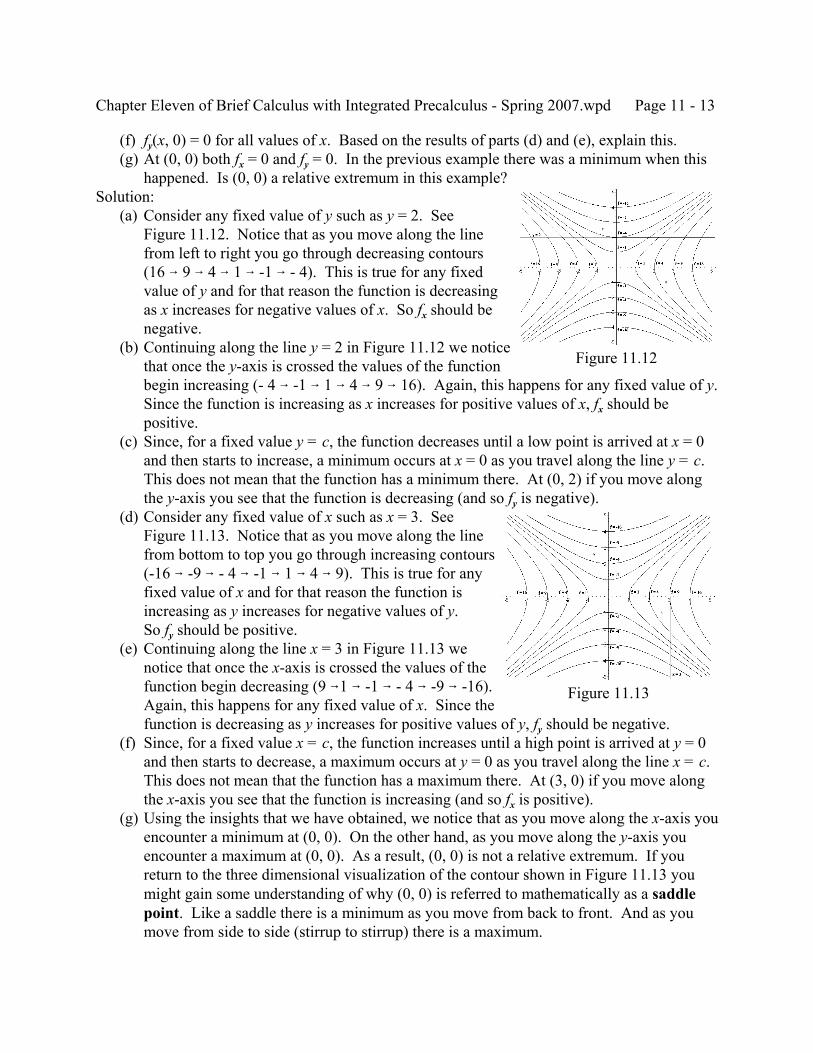
Chapter Eleven of Brief Calculus with Integrated Precalculus - Spring 2007.wpd Page 11 - 13
Figure 11.12
Figure 11.13
(f) fy(x, 0) = 0 for all values of x. Based on the results of parts (d) and (e), explain this. (g) At (0, 0) both fx = 0 and fy = 0. In the previous example there was a minimum when this
happened. Is (0, 0) a relative extremum in this example?Solution: (a) Consider any fixed value of y such as y = 2. See
Figure 11.12. Notice that as you move along the linefrom left to right you go through decreasing contours(16 6 9 6 4 6 1 6 -1 6 - 4). This is true for any fixedvalue of y and for that reason the function is decreasingas x increases for negative values of x. So fx should benegative.
(b) Continuing along the line y = 2 in Figure 11.12 we noticethat once the y-axis is crossed the values of the functionbegin increasing (- 4 6 -1 6 1 6 4 6 9 6 16). Again, this happens for any fixed value of y. Since the function is increasing as x increases for positive values of x, fx should bepositive.
(c) Since, for a fixed value y = c, the function decreases until a low point is arrived at x = 0and then starts to increase, a minimum occurs at x = 0 as you travel along the line y = c. This does not mean that the function has a minimum there. At (0, 2) if you move alongthe y-axis you see that the function is decreasing (and so fy is negative).
(d) Consider any fixed value of x such as x = 3. SeeFigure 11.13. Notice that as you move along the linefrom bottom to top you go through increasing contours(-16 6 -9 6 - 4 6 -1 6 1 6 4 6 9). This is true for anyfixed value of x and for that reason the function isincreasing as y increases for negative values of y.So fy should be positive.
(e) Continuing along the line x = 3 in Figure 11.13 wenotice that once the x-axis is crossed the values of thefunction begin decreasing (9 61 6 -1 6 - 4 6 -9 6 -16). Again, this happens for any fixed value of x. Since thefunction is decreasing as y increases for positive values of y, fy should be negative.
(f) Since, for a fixed value x = c, the function increases until a high point is arrived at y = 0and then starts to decrease, a maximum occurs at y = 0 as you travel along the line x = c. This does not mean that the function has a maximum there. At (3, 0) if you move alongthe x-axis you see that the function is increasing (and so fx is positive).
(g) Using the insights that we have obtained, we notice that as you move along the x-axis youencounter a minimum at (0, 0). On the other hand, as you move along the y-axis youencounter a maximum at (0, 0). As a result, (0, 0) is not a relative extremum. If youreturn to the three dimensional visualization of the contour shown in Figure 11.13 youmight gain some understanding of why (0, 0) is referred to mathematically as a saddlepoint. Like a saddle there is a minimum as you move from back to front. And as youmove from side to side (stirrup to stirrup) there is a maximum.
Chapter Eleven of Brief Calculus with Integrated Precalculus - Spring 2007.wpd Page 11 - 14
There are many products for which the demand for one product is related to the price of adifferent product. For example, the demand for one type of artificial sweetener would increase ifthe price of its competitor increased. In a situation such as this the products are regarded assubstitutes for each other. In general we know that the demand for a product decreases as itsprice increases. What we are now considering is what happens to the demand for a product whenthe price of some other related product increases. Let x1 and p1 denote the demand and price ofone product and x2 and p2 denote the demand and price of the related product. If the products aresubstitutes, then the demand for the first item should increase as the price of the second itemincreases (assuming the price of the first item remains unchanged); that is, Mx1/Mp2 > 0. Similarly,the demand for the second item should increase as the price of the first item increases (assumingthe price of the second item remains unchanged); that is, Mx2/Mp1 > 0.
Substitute Products: and ∂∂
xp
1
20>
∂∂xp
2
10>
where is the demand for the first product andx f p p1 1 2= ( , ) is the demand for the second product.x g p p2 1 2= ( , )
On the other hand, there are products for which the demand for both products go up and downtogether as the price of either one increases. For example, the demand for the hardware portionof computers and the demand for the software portion are related in this way because theconsumer is influenced by the total price of the computer. In this situation the products are saidto be complementary. If the products are complementary, then the demand for the first itemshould decrease as the price of the second item increases (assuming the price of the first itemremains unchanged); that is, Mx1/Mp2 < 0. This should happen because an increased price for thesecond item decreases demand for that item and this in turn decreases demand for the first item. Similarly, the demand for the second item should decrease as the price of the first item increases(assuming the price of the second item remains unchanged); that is, Mx2/Mp1 < 0.
Complementary Products: and ∂∂
xp
1
20<
∂∂xp
2
10<
For products that are neither complementary nor substitutes, the two partial derivatives citedhave opposite signs. If one partial derivative is positive then the other one is negative.
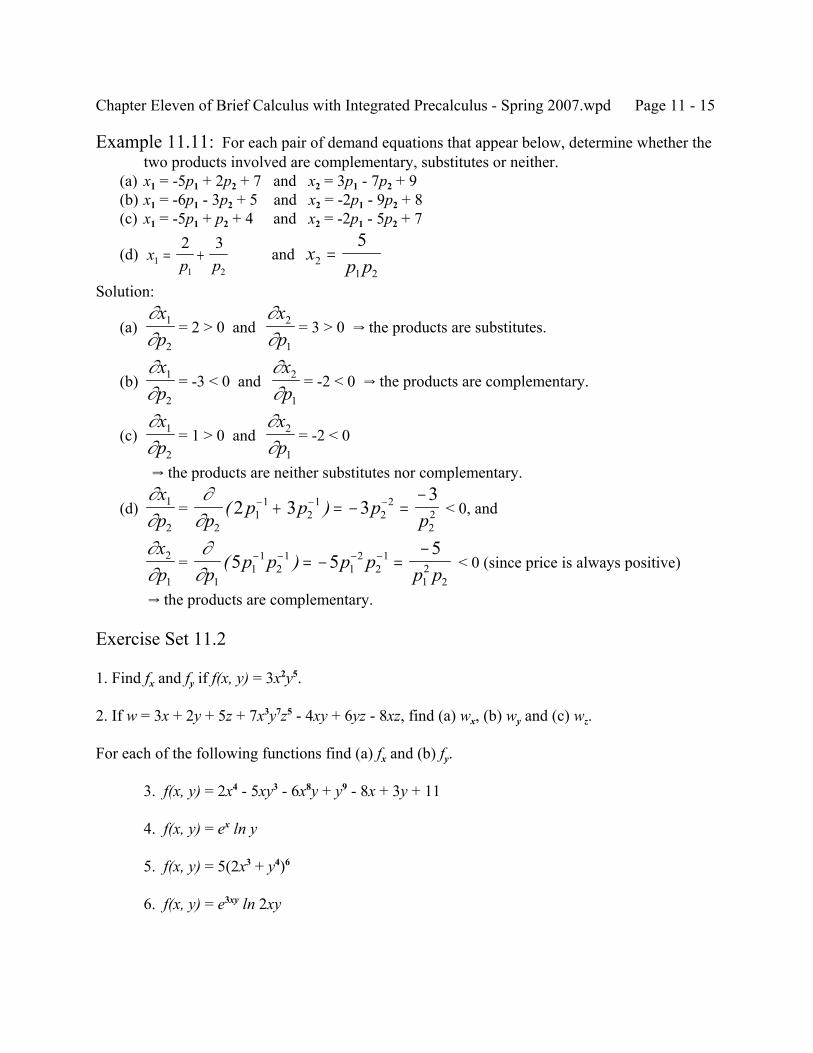
Chapter Eleven of Brief Calculus with Integrated Precalculus - Spring 2007.wpd Page 11 - 15
Example 11.11: For each pair of demand equations that appear below, determine whether thetwo products involved are complementary, substitutes or neither.
(a) x1 = -5p1 + 2p2 + 7 and x2 = 3p1 - 7p2 + 9 (b) x1 = -6p1 - 3p2 + 5 and x2 = -2p1 - 9p2 + 8 (c) x1 = -5p1 + p2 + 4 and x2 = -2p1 - 5p2 + 7
(d) and xp p1
1 2
2 3= + x
p p21 2
5=
Solution:
(a) = 2 > 0 and = 3 > 0 Y the products are substitutes.∂∂
xp
1
2
∂∂xp
2
1
(b) = -3 < 0 and = -2 < 0 Y the products are complementary.∂∂
xp
1
2
∂∂xp
2
1
(c) = 1 > 0 and = -2 < 0∂∂
xp
1
2
∂∂xp
2
1
Y the products are neither substitutes nor complementary.
(d) = < 0, and∂∂
xp
1
2
∂∂p
p p pp2
11
21
22
222 3 33
( )− − −+ = − =−
= < 0 (since price is always positive)∂∂xp
2
1
∂∂p
p p p pp p1
11
21
12
21
12
25 5
5( )− − − −= − =
−
Y the products are complementary.
Exercise Set 11.2
1. Find fx and fy if f(x, y) = 3x2y5.
2. If w = 3x + 2y + 5z + 7x3y7z5 - 4xy + 6yz - 8xz, find (a) wx, (b) wy and (c) wz.
For each of the following functions find (a) fx and (b) fy.
3. f(x, y) = 2x4 - 5xy3 - 6x8y + y9 - 8x + 3y + 11
4. f(x, y) = ex ln y
5. f(x, y) = 5(2x3 + y4)6
6. f(x, y) = e3xy ln 2xy
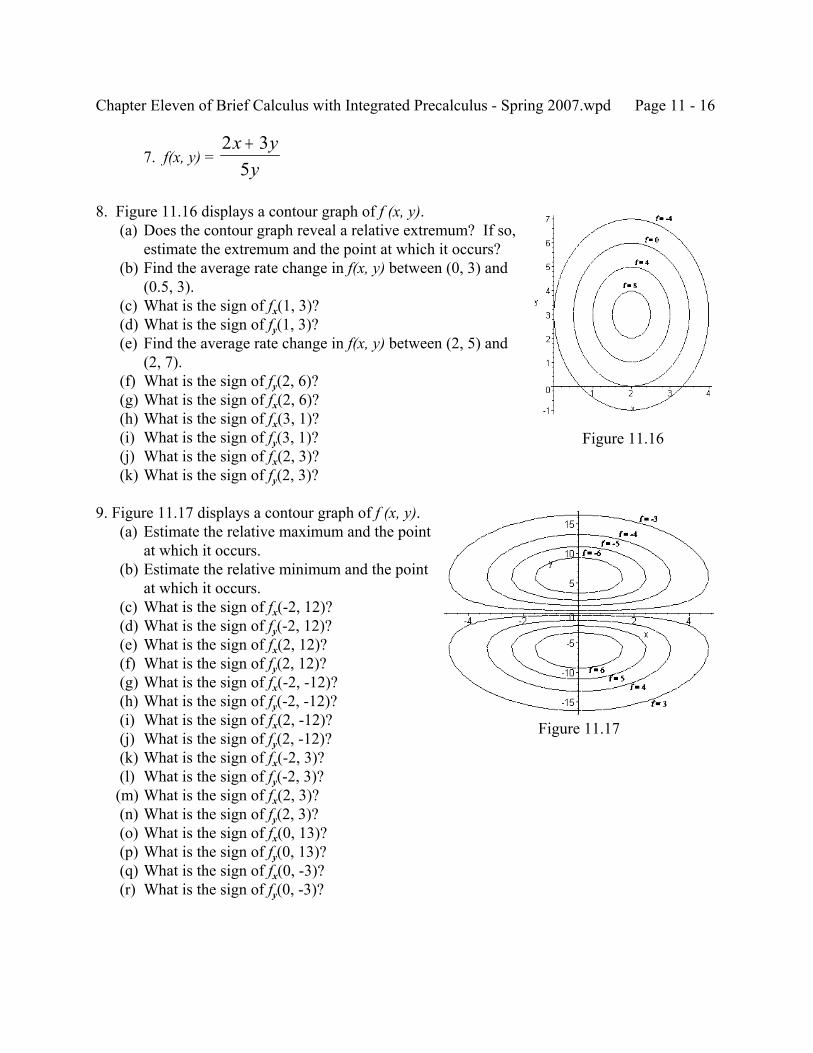
Chapter Eleven of Brief Calculus with Integrated Precalculus - Spring 2007.wpd Page 11 - 16
Figure 11.16
Figure 11.17
7. f(x, y) = 2 3
5x y
y+
8. Figure 11.16 displays a contour graph of f (x, y). (a) Does the contour graph reveal a relative extremum? If so,
estimate the extremum and the point at which it occurs? (b) Find the average rate change in f(x, y) between (0, 3) and
(0.5, 3). (c) What is the sign of fx(1, 3)? (d) What is the sign of fy(1, 3)? (e) Find the average rate change in f(x, y) between (2, 5) and
(2, 7). (f) What is the sign of fy(2, 6)? (g) What is the sign of fx(2, 6)? (h) What is the sign of fx(3, 1)? (i) What is the sign of fy(3, 1)? (j) What is the sign of fx(2, 3)? (k) What is the sign of fy(2, 3)?
9. Figure 11.17 displays a contour graph of f (x, y). (a) Estimate the relative maximum and the point
at which it occurs. (b) Estimate the relative minimum and the point
at which it occurs. (c) What is the sign of fx(-2, 12)? (d) What is the sign of fy(-2, 12)? (e) What is the sign of fx(2, 12)? (f) What is the sign of fy(2, 12)? (g) What is the sign of fx(-2, -12)? (h) What is the sign of fy(-2, -12)? (i) What is the sign of fx(2, -12)? (j) What is the sign of fy(2, -12)? (k) What is the sign of fx(-2, 3)? (l) What is the sign of fy(-2, 3)? (m) What is the sign of fx(2, 3)? (n) What is the sign of fy(2, 3)? (o) What is the sign of fx(0, 13)? (p) What is the sign of fy(0, 13)? (q) What is the sign of fx(0, -3)? (r) What is the sign of fy(0, -3)?
Chapter Eleven of Brief Calculus with Integrated Precalculus - Spring 2007.wpd Page 11 - 17
10. For each pair of demand equations that appear below, determine whether the two productsinvolved are complementary, substitutes or neither. (a) x1 = -5p1 + 4p2 + 6 and x2 = -2p1 - 3p2 + 8 (b) x1 = -5p1 + 4p2 + 6 and x2 = 2p1 - 3p2 + 8 (c) x1 = -5p1 - 4p2 + 6 and x2 = -2p1 - 3p2 + 8 (d) x1 = -8p1 - 3p2 + 4 and x2 = -p1 - 6p2 + 5 (e) x1 = -6p1 + p2 + 2 and x2 = 4p1 - 5p2 + 7
11. For each pair of demand equations that appear below, determine whether the two productsinvolved are complementary, substitutes or neither.
(a) and xp p1
1 2
6 2= − x
p p21 2
3 5= − +
(b) and xp p1
1 2
5 1= + x
p p21 2
4 6= − +
(c) and xp p1
1 2
8= x
p p22 1
7=
11.3 RELATIVE EXTREMA
In the previous section it was revealed in the examples that all of the partial derivatives must bezero at a point in order for a relative extrema to occur. However, we also saw an example wherethere was a point called a saddle point where the partial derivatives were zero but a relativeextrema did not occur at that point. This is similar to the situation we encountered with earlier inthe book for a function of one variable: relative extrema occurred at critical points but a criticalpoint might not be a relative extremum. The same basic terminology is used for functions ofseveral variables. However, determining whether or not a critical point is a relative extremum isconsiderably more difficult for functions of several variables. The next definition makes explicitwhat a critical point is for a function of two variables.
Critical Point: A critical point for z = f (x, y) is a point (a, b) for which the partial derivatives
are zero: and 0 = =fzxx
∂∂
0 = =fzyy
∂∂
Example 11.12: Find the critical points for .f x y x xy y x y( , ) = + + + − +6 2 4 6 12 2
Solution:We must solve 0 = fx = 12x + 2y + 4 and 0 = fy = 2x + 2y - 6.The best method is to use the standard method of substitution: Solve for a variable in oneequation and substitute the result into the other equation and then solve that. Unless it iseasier to solve for x, we usually solve for y in whatever equation makes that easiest. In
Chapter Eleven of Brief Calculus with Integrated Precalculus - Spring 2007.wpd Page 11 - 18
this case it is easy to solve for y in the first equation.2y = -12x - 4 Y y = -6x - 2. Now we substitute this into the second equation.0 = 2x + 2(-6x - 2) - 6 Y 0 = -10x - 10 Y 10x = -10 Y x = -1.We now substitute this value of x back into y = -6x - 2 to obtain y = -6(-1) - 2 = 4.Therefore (-1, 4) is the only critical point.(Note that, if there were a relative extremum at this point, the value of the extremumwould be z = f (-1, 4) = 6(-1)2 + 2(-1)(4) + 42 + 4(-1) - 6(4) + 1 = -13.)
The test used to determine whether or not a critical point produces a relative extremum or asaddle point is somewhat complicated and makes use of second partial derivatives. For afunction of one variable there is only one second derivative. For a function of two variables thereare four second partial derivatives, two of which may be regarded as the same for the purposes ofthis textbook.
Second Partial Derivatives:
f x yz
x xzxxx ( , ) = =
∂∂
∂∂
∂∂
2
2 f x yz
y yzyyy ( , ) = =
∂∂
∂∂
∂∂
2
2
f x yz
y x yzxxy ( , ) = =
∂∂ ∂
∂∂
∂∂
2
f x yz
x y xzyyx ( , ) = =
∂∂ ∂
∂∂
∂∂
2
Example 11.13: Find the four second partial derivatives and verify the fact that fxy = fyx forthe function f x y x x y y x y( , ) = − + − + −5 2 4 7 93 2 4 5
Solution:f x xyx = − −15 4 42 4
The second partial derivative fxx is found by finding the partial derivative with respect to xof the first partial derivative with respect to x that was just obtained.f x yxx = −30 4 4
Notice that for fxy we should take the partial derivative with respect to y of the partialderivative with respect to x that was found initially.f xyxy = −16 3
The other two second partial derivatives are found by first finding fy.f x y yy = − + +8 5 72 3 4
The second partial derivative fyy is found by finding the partial derivative with respect to yof the first partial derivative with respect to y that was just obtained.f x y yyy = − +24 202 2 3
Notice that for fyx we should take the partial derivative with respect to x of the partialderivative with respect to y.
Chapter Eleven of Brief Calculus with Integrated Precalculus - Spring 2007.wpd Page 11 - 19
f xyyx = −16 3
Notice that fxy = fyx.
Fact 11.1: fxy = fyx except for some extremely pathological functions. For all functions thatthis textbook deals with you may assume that fxy = fyx. That is, fxy may be foundby taking the two partial derivatives in any order (x first and then y or y first andthen x). However, note that finding both and verifying that they are equal acts as apartial check on your work.
Example 11.14: Find the second partial derivatives for f x y e yx( , ) ln= 3 5Solution:
fx = 3e3x ln 5y. Therefore,
and .fx
f e yxx xx= =
∂∂
9 53 ln fy
f ey
eyxy x
xx
= = =∂∂
35
533
3
and hence f ey
eyy
xx
= =335
5f
ye y e y
eyyy
x xx
= = − = −− −∂∂
( )3 1 3 23
2
(As a partial check on the work that was done, we can check to make sure that the partialderivative of fy with respect to x produces the same fxy as before. Doing this we see that
, which is the same result as previously obtained.)∂∂x
e y e yey
x xx
( )3 1 3 13
33− −= =
We can now state the test that is used to determine whether or not a critical point is a relativeextremum or a saddle point. You do not need to be concerned about what is required for afunction to have “suitable” second partial derivatives in the following statement. The word isthere primarily to acknowledge that there are some very weird functions that do not concern usfor which there are problems. All of the functions you will encounter in this text are “suitable.”
Second Partial Derivative Test: If (a, b) is a critical point for z = f (x, y) for which all of thesecond partial derivatives are suitable and
D f a f a f axx yy xy= −( ,b ) ( ,b ) ( ( ,b ))2
then for c = f (a, b):If D > 0 and fxx(a, b) > 0, then (a, b, c) is a relative minimum.If D > 0 and fxx(a, b) < 0, then (a, b, c) is a relative maximum.If D < 0 then (a, b, c) is a saddle point.If D = 0 then no conclusion can be made.
Taking everything said thus far into account, the following procedure is used to find the relativeextrema and saddle points for a function of two variables.
Chapter Eleven of Brief Calculus with Integrated Precalculus - Spring 2007.wpd Page 11 - 20
Procedure for finding extrema and saddle points:Find the critical points, (a, b), by solving fx = 0 and fy = 0.Find the second partial derivatives fxx, fxy and fyy.For each critical point find c = f (a, b) and
Evaluate D = (fxx, fxy and fyy)(fxy) - (fyy)2.If D > 0 then
fxx > 0 means (a, b, c) is a relative minimum (“+” = “holds water”).fxx < 0 means (a, b, c) is a relative maximum (“-“ = “does not hold water”).
If D < 0 then (a, b, c) is a saddle point.If D = 0 then no conclusion can be made.
Remark: The statement that (a, b, c) is a relative minimum means that z = f (x, y, z) has a relative minimum of z = c and it occurs at the point (a, b).
Example 11.15: For each function below find the relative extrema and saddle points.(a) z = f x y x y x y( , ) = + − + +5 2 20 12 502 2
(b) z = f x y x y x y( , ) = − + + −7 4 14 16 32 2
(c) z = f x y x y x y( , ) = + − −6 10 2 2
Solution: (a) First we find the critical points.
0 = fx = 10x - 20 Y 10x = 20 Y x = 20 = fy = 4y + 12 Y 4y = -12 Y y = -3So the only critical point is (2, -3).At (2, -3) z = 5(2)2 + 2(-3)2 - 20(2) + 12(-3) + 50 = 12.
fxx = 10, fxy = 0 and fyy = 4D = (fxx, fxy and fyy)(fxy) - (fyy)2 = (10)(4) - 02 = 40 > 0Since D > 0, we look at the sign of fxx. Since fxx = 10 is positive (“holds water”, c),(2, -3, 12) is a relative minimum. (The relative minimum is 12 and it occurs at (2, -3).)
(b) First we find the critical points.0 = fx = 14x + 14 Y 14x = -14 Y x = -10 = fy = -8y + 16 Y 8y = 16 Y y = 2So the only critical point is (-1, 2).At (-1, 2) z = 7(-1)2 - 4(2)2 + 14(-1) + 16(2) - 3 = 6.
fxx = 14, fxy = 0 and fyy = -8D = (fxx, fxy and fyy)(fxy) - (fyy)2 = (14)(-8) - 02 = -112 < 0Since D < 0, (-1, 2, 6) is a saddle point.
(c) 0 = fx = 6 - 2x Y x = 3 and 0 = fy = 10 - 2y Y y = 5 Y (3, 5) is the only critical point.At (3, 5) z = 6(3) + 10(5) - 32 - 52 = 34.fxx = -2, fxy = 0 and fyy = -2D = (fxx, fxy and fyy)(fxy) - (fyy)2 = (-2)(-2) - 02 = 4 > 0Since D > 0, we look at the sign of fxx. Since fxx = -2 (“does not hold water”, _),(3, 5, 34) is a relative maximum. (The relative maximum is 34 and it occurs at (3, 5).)
Chapter Eleven of Brief Calculus with Integrated Precalculus - Spring 2007.wpd Page 11 - 21
Example 11.16: A manufacturer makes two products whose prices are p1 and p2. The profitobtained by selling the products is given by . P p p p p= + − − −15 33 0 25 15 2051 2 1
222. .
Determine the maximum profit and what the two prices should be in order to obtain themaximum profit.
Solution:First we find the critical points.
Y p1 = 30 and Y p2 = 110 15 051
1= = −∂∂
Pp
p. 0 33 32
2= = −∂∂
Pp
p
For these prices the profit is P = 15(30) + 33(11) - 0.25(30)2 - 1.5(11)2 - 205 = $201.50.If we were sure that the maximum profit existed and occurred at a critical point, we couldstop right now since the solution obtained would have to be the solution. Nevertheless,we will continue to verify that the critical point is indeed a relative maximum.
, and Y D = (-0.5)(-3) - 02 = 1.5 > 0∂∂
2
12 05P
p= − .
∂∂ ∂
2
0P
x y=
∂∂
2
22 3P
p= −
Hence the maximum profit is $201.50 and it occurs when p1 = $30 and p2 = $11.
Example 11.17: Find the relative extrema and saddle points forf x y xy x y x y( , ) = − − + + −3 6 4 9 63 1072 2
Solution:Finding the critical points: Solve
0 = fx = 3y - 12x + 9 and 0 = fy = 3x - 8y + 63Solving the first equation for y we obtain y = 4x - 3.Substituting in the second equation: 0 = 3x - 8(4x - 3) + 63Solving for x: 0 = 3x - 32x + 24 + 63 Y 29x = 87 Y x = 3x = 3 Y y = 4x - 3 = 4(3) - 3 = 9 Y The critical point is (3, 9)
fxx = -12, fxy = 3 and fyy = -8 Y D = (-12)(-8) - (3)2 = 87 > 0Since fxx = -12 < 0, the critical point produces a relative maximum.f (3, 9) = 3(3)(9) - 6(3)2 - 4(9)2 + 9(3) + 63(9) - 107 = 190(3, 9, 190) is a relative maximum (the relative maximum is 190 and it occurs at (3, 9))
Example 11.18: Find the relative extrema and saddle points forf x y y x y x y( , ) = + + − − +3 2 22 3 16 9 50
Solution:0 = fx = 4x - 16 Y x = 40 = fy = 3y2 + 6y - 9 = 3(y2 + 2y - 3) = 3(y + 3)(y - 1) Y y = -3, 1There are two critical points: (4, -3) and (4, 1)fxx = 4, fxy = 0 and fyy = 6y + 6At (4, -3): fyy = 6(-3) + 6 = -12 Y D = (4)(-12) - 02 = - 48 < 0 (saddle point) f (4, -3) = (-3)3 + 2(4)2 + 3(-3)2 -16(4) - 9(-3) + 50 = 45 Y (4, -3, 45) is a saddle pointAt (4, 1): fyy = 6(1) + 6 = 12 Y D = (4)(12) - 02 = 48 > 0
Chapter Eleven of Brief Calculus with Integrated Precalculus - Spring 2007.wpd Page 11 - 22
Since D > 0 and fxx = 4 > 0 at (4, 1), a relative minimum occurs at (4, 1). f (4, 1) = (1)3 + 2(4)2 + 3(1)2 -16(4) - 9(1) + 50 = 13There is a relative minimum at (4, 1, 13) and a saddle point at (4, -3, 45).
Exercise Set 11.3
1. Find the critical points for the following functions.
(a) f x y x xy y x y( , ) = + + − + −2 2 2 4 12 52 2
(b) f x y x xy y x y( , ) = + + − − +3 2 6 82 2
2. Find fxx, fxy and fyy for the following functions.(a) f x y x x y y( , ) = + −5 3 72 3 4
(b) f x y x x y y x y( , ) = − + − + −6 2 8 3 113 2 3 5
3. Given z = x2 + e3xy, find , and .∂∂
2
2
zx
∂∂
2zxy
∂∂
2
2
zy
4. For each function below find the relative extrema and saddle points.(a) f x y x y x y( , ) = + + − +2 2 4 6 7(b) f x y x y x y( , ) = − − − +2 2 8 10 3(c) f x y x y x y( , ) = − − + + −2 2 6 2 5
5. For each function below find the relative extrema and saddle points.(a) f x y x y x y( , ) = − − + +2 3 8 24 112 2
(b) f x y x y x y( , ) = + − − −3 2 12 16 92 2
(c) f x y x y x y( , ) = − − + − +4 8 6 32 2
6. A manufacturer makes two products whose prices are p1 and p2. The profit obtained by sellingthe products is given by . Determine the maximum profitP p p p p= + − − −36 25 05 4251 2 1
222.
and what the two prices should be in order to obtain the maximum profit.
7. Find the relative extrema and saddle points for f x y x xy y x y( , ) = − + − − +6 2 3 4 22 562 2
8. Find the relative extrema and saddle points for .f x y x y x y( , ) = + − − +3 2 12 8 12
Chapter Eleven of Brief Calculus with Integrated Precalculus - Spring 2007.wpd Page 11 - 23
11.4 METHOD OF LAGRANGE MULTIPLIERS
Many problems arise where you want to maximize or minimize something but there arelimitations on what you can do. For example, a corporation might have a certain amount ofmoney to invest (the limitation) and wishes to maximize the profit obtained. The followingexample, which will be solved later in this section, provides a concrete example of the kind ofproblem that is being considered. We saw a method for solving this problem in an earlierchapter, but the purpose of this section is to introduce another method that is very powerful andcan be used for problems with very many variables.
Patio Problem: Suppose that you have a house with a backyard where you would like to makea patio with a low brick wall around it. You have 162 stone tiles for the floor of the patiothat are one square foot each (squares that are one foot by one foot). You would like touse all of them and form a patio that costs the least amount of money possible. The backdoor of the house provides the entrance to the patio and the back wall of the house formsone side of the patio and therefore the brick wall only needs to be built on the remainingthree sides of the patio. If it costs $10 per foot to build the brick wall, what should thedimensions of the patio be?
Notice that the patio problem involves a limitation (use exactly 162 stone tiles) and something tobe minimized (the cost of the brick wall). The method for solving such problems that we willuse is the method of Lagrange multipliers. In the phrasing of the method there is a phrase that isimportant mathematically but usually is not relevant to practical problems and can be ignored inthis textbook. The phrase is: “If f (x, y) has a maximum or a minimum.” We will assume for allof the problems in this section that the function does have a maximum or a minimum of the typerequested. In one of the problems it will be pointed out why there is such an extremum. Noticein the patio problem that for practical reasons there obviously must be a minimal cost. Thesymbol λ that appears is a letter of the Greek alphabet and is pronounced “lambda.”
Method of Lagrange Multipliers: If f (x, y) has a maximum or a minimum subject to the constraint g(x, y) = 0, then it occursat one of the sets of critical numbers of
F(x, y, λ) = f (x, y) - λg(x, y)
The variable λ is called a Lagrange multiplier. The method works for more than twovariables as well.
Chapter Eleven of Brief Calculus with Integrated Precalculus - Spring 2007.wpd Page 11 - 24
Example 11.19: Minimize f (x, y) = x2 + y2 subject to the constraint 6x + 2y = 4.Solution:
The function to be minimized is clearly f (x, y) = x2 + y2. In the statement of the methodof Lagrange multipliers the constraint function is listed as g(x, y) = 0. This means that theconstraint should be rewritten so that 0 appears on the right. So we will first rewrite theconstraint in this form: g(x, y) = 6x + 2y - 4 = 0. According to the method we should nowfind the critical points for
F(x, y, λ) = f (x, y) - λg(x, y) = x2 + y2 - λ(6x + 2y - 4) = x2 + y2 - 6xλ - 2yλ + 4λ
This means setting each of the three partial derivatives equal to 0 and solving theresulting three equations for x and y. (There are three partial derivatives because we arenow treating λ as an additional variable. However, the original problem does not includeλ and therefore we do not need to know what it equals and it is enough to find just x andy.) Notice in the following that 0 = Fλ is (and always will be) the constraint equation.
0 = Fx = 2x - 6λ 0 = Fy = 2y - 2λ 0 = Fλ = -6x - 2y + 4The standard approach to solving a system of equations in any number of variables is tofirst solve one of them for one variable and substitute the result in the other equations sothat you end up with one fewer equation and one fewer variable. Although any variablein any equation can be chosen, usually the easiest variable to solve for is chosen. In thiscase, however, there is a strong incentive to solve for λ since it is not needed in the finalanswer. We could solve for λ in the first equation, but that would result in a fraction. Since solving for λ in the second equation does not result in a fraction, we will do that.
0 = 2y - 2λ Y 2λ = 2y Y λ = ySubstituting this result in the other two equations wherever λ appears we obtain
0 = 2x - 6y and 0 = -6x - 2y + 4Solving for x in the first of these equations we obtain 2x = 6y Y x = 3y.Substituting this result into the other equation reveals the value of y as follows.
0 = -6(3y) - 2y + 4 = -20y + 4 Y 20y = 4 Y y = 0.2We can now obtain the value of x from any of the previous equations that involve only xand y. However the easiest one to use is
x = 3y = 3(0.2) = 0.6Since there is only one critical point, the method of Lagrange multipliers assures us that itis the answer (assuming as we do that an answer exists). It only remains to determine thevalue of the minimum for the original function.
f (0.6, 0.2) = x2 + y2 = (0.6)2 + (0.2)2 = 0.36 + 0.04 = 0.4Therefore the minimum is 0.4 and occurs at the point (0.6, 0.2).
Remark: In the previous example f (x, y) = x2 + y2 always has to be nonnegative due to the factthat each of the two squares has to be nonnegative. The point (0, 0) is not a solution sinceit does not satisfy the constraint equation. Hence, there should be some smallest value. Itis worth noting that we could have solved this problem by an old method. This involvessolving the constraint for one of the variables such as y
6x + 2y = 4 Y 2y = -6x + 4 Y y = -3x + 2
Chapter Eleven of Brief Calculus with Integrated Precalculus - Spring 2007.wpd Page 11 - 25
and substituting this into the function to be minimized as follows.Minimize x2 + (-3x + 2)2 = x2 + 9x2 -12x + 4 = 10x2 - 12x + 4
The resulting function is a parabola that opens upward and therefore the critical valuecorresponds to a minimum. The critical value can be easily found as follows.
0 = 20x - 12 Y 20x = 12 Y x = 3/5 = 0.6Also, y = -3x + 2 = -3(0.6) + 2 = -1.8 + 2 = 0.2and the value of the function is f (x, y) = x2 + y2 = (0.6)2 + (0.2)2 = 0.36 + 0.04 = 0.4.Hence, the relative minimum is 0.4 and it occurs at the point (0.6, 0.2).
Example 11.20: Maximize xy if 6x + 2y = 36.Solution:
As is often the case, this problem does not specifically identify the two functions involvednor the method by which it should be solved. In this section we are interested in seeingthe method of Lagrange multipliers used. The features of the problem that indicate themethod can be used are the fact that there is a function of several variables to bemaximized and there is an equation that imposes a constraint. The equation alwaysindicates the constraint and should first be written so that everything is on the left and setequal to zero. Thus the constraint is g(x, y) = 6x + 2y - 36 = 0. The function tomaximized is f (x, y) = xy. According to the method of Lagrange multipliers we mustfind the critical points for
F(x, y, λ) = f (x, y) - λg(x, y) = xy - λ(6x + 2y - 36) = xy - 6xλ - 2yλ + 36λ0 = Fx = y - 6λ 0 = Fy = x - 2λ 0 = Fλ = -6x - 2y + 36
(Solving the first equation for y instead of λ avoids fractions and is perfectly acceptable. It is suggested that you do precisely that and see that the resulting values of x and y arethe same as the ones obtained here by first solving for λ.) Solving the first equation for λ
we obtain 6λ = y Y . Substituting this in the second equation we obtainλ =y6
(there is no need to substitute it into the third equation since λ does not appear there).
0 26 3 3
3= −
= − ⇒ = ⇒ =x y x y y x y x
Next we substitute this into the third equation.0 = -6x -2(3x) + 36 = -12x + 36 Y 12x = 36 Y x = 3
We now use this to find the value of y: y = 3x = 3(3) = 9According to the method of Lagrange multipliers (3, 9) produces the desired maximumand it only remains to determine what that maximum is by substituting these values intothe function to be maximized: xy = 3(9) = 27.Therefore, the maximum is 27 and it occurs at the point (3, 9).
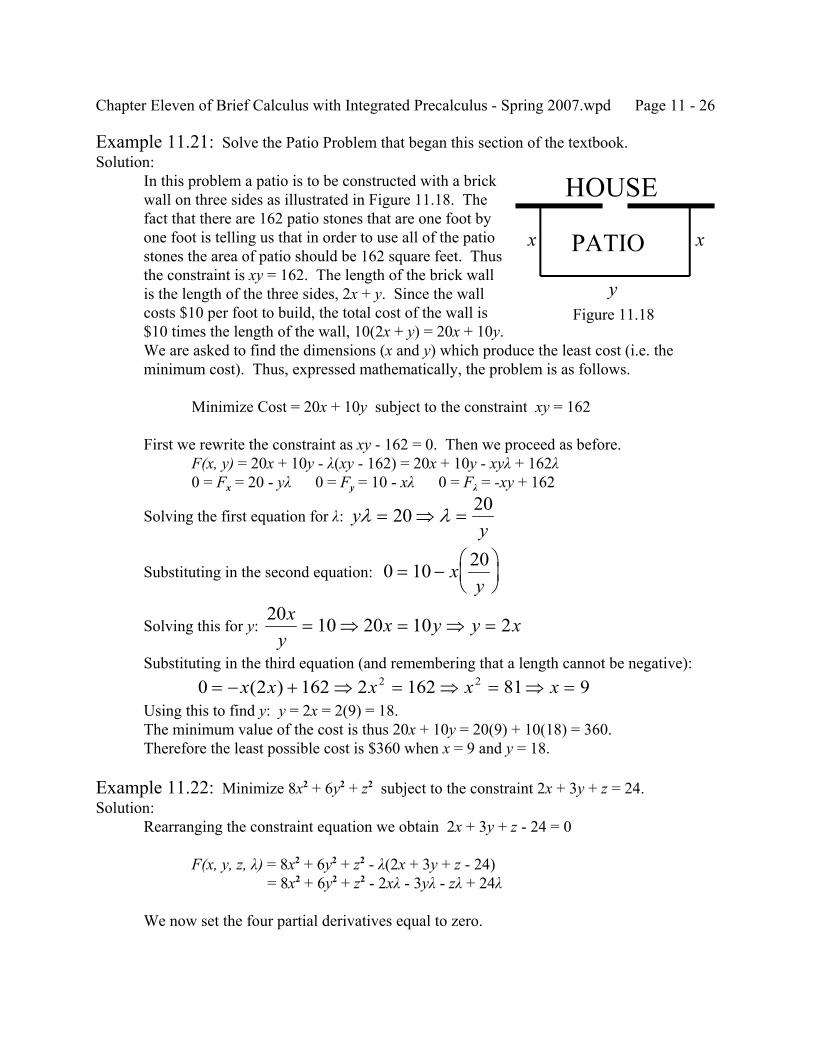
Chapter Eleven of Brief Calculus with Integrated Precalculus - Spring 2007.wpd Page 11 - 26
Example 11.21: Solve the Patio Problem that began this section of the textbook.Solution:
In this problem a patio is to be constructed with a brickwall on three sides as illustrated in Figure 11.18. Thefact that there are 162 patio stones that are one foot byone foot is telling us that in order to use all of the patiostones the area of patio should be 162 square feet. Thusthe constraint is xy = 162. The length of the brick wallis the length of the three sides, 2x + y. Since the wallcosts $10 per foot to build, the total cost of the wall is$10 times the length of the wall, 10(2x + y) = 20x + 10y. We are asked to find the dimensions (x and y) which produce the least cost (i.e. theminimum cost). Thus, expressed mathematically, the problem is as follows.
Minimize Cost = 20x + 10y subject to the constraint xy = 162
First we rewrite the constraint as xy - 162 = 0. Then we proceed as before.F(x, y) = 20x + 10y - λ(xy - 162) = 20x + 10y - xyλ + 162λ0 = Fx = 20 - yλ 0 = Fy = 10 - xλ 0 = Fλ = -xy + 162
Solving the first equation for λ: yy
λ λ= ⇒ =20 20
Substituting in the second equation: 0 10 20= −
x
y
Solving this for y: 20 10 20 10 2x
yx y y x= ⇒ = ⇒ =
Substituting in the third equation (and remembering that a length cannot be negative): 0 2 162 2 162 81 92 2= − + ⇒ = ⇒ = ⇒ =x x x x x( )
Using this to find y: y = 2x = 2(9) = 18.The minimum value of the cost is thus 20x + 10y = 20(9) + 10(18) = 360.Therefore the least possible cost is $360 when x = 9 and y = 18.
Example 11.22: Minimize 8x2 + 6y2 + z2 subject to the constraint 2x + 3y + z = 24.Solution:
Rearranging the constraint equation we obtain 2x + 3y + z - 24 = 0
F(x, y, z, λ) = 8x2 + 6y2 + z2 - λ(2x + 3y + z - 24) = 8x2 + 6y2 + z2 - 2xλ - 3yλ - zλ + 24λ
We now set the four partial derivatives equal to zero.
Figure 11.18
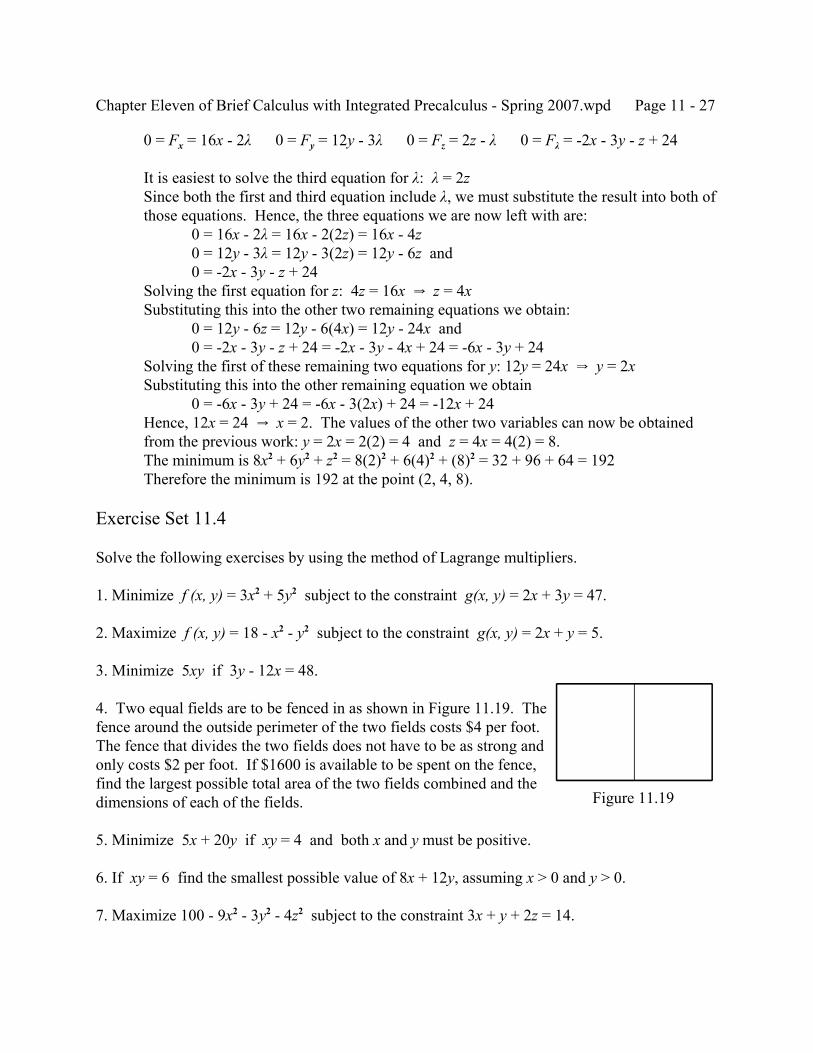
Chapter Eleven of Brief Calculus with Integrated Precalculus - Spring 2007.wpd Page 11 - 27
0 = Fx = 16x - 2λ 0 = Fy = 12y - 3λ 0 = Fz = 2z - λ 0 = Fλ = -2x - 3y - z + 24
It is easiest to solve the third equation for λ: λ = 2zSince both the first and third equation include λ, we must substitute the result into both ofthose equations. Hence, the three equations we are now left with are:
0 = 16x - 2λ = 16x - 2(2z) = 16x - 4z0 = 12y - 3λ = 12y - 3(2z) = 12y - 6z and0 = -2x - 3y - z + 24
Solving the first equation for z: 4z = 16x Y z = 4xSubstituting this into the other two remaining equations we obtain:
0 = 12y - 6z = 12y - 6(4x) = 12y - 24x and0 = -2x - 3y - z + 24 = -2x - 3y - 4x + 24 = -6x - 3y + 24
Solving the first of these remaining two equations for y: 12y = 24x Y y = 2xSubstituting this into the other remaining equation we obtain
0 = -6x - 3y + 24 = -6x - 3(2x) + 24 = -12x + 24Hence, 12x = 24 Y x = 2. The values of the other two variables can now be obtainedfrom the previous work: y = 2x = 2(2) = 4 and z = 4x = 4(2) = 8.The minimum is 8x2 + 6y2 + z2 = 8(2)2 + 6(4)2 + (8)2 = 32 + 96 + 64 = 192Therefore the minimum is 192 at the point (2, 4, 8).
Exercise Set 11.4
Solve the following exercises by using the method of Lagrange multipliers.
1. Minimize f (x, y) = 3x2 + 5y2 subject to the constraint g(x, y) = 2x + 3y = 47.
2. Maximize f (x, y) = 18 - x2 - y2 subject to the constraint g(x, y) = 2x + y = 5.
3. Minimize 5xy if 3y - 12x = 48.
4. Two equal fields are to be fenced in as shown in Figure 11.19. Thefence around the outside perimeter of the two fields costs $4 per foot. The fence that divides the two fields does not have to be as strong andonly costs $2 per foot. If $1600 is available to be spent on the fence,find the largest possible total area of the two fields combined and thedimensions of each of the fields.
5. Minimize 5x + 20y if xy = 4 and both x and y must be positive.
6. If xy = 6 find the smallest possible value of 8x + 12y, assuming x > 0 and y > 0.
7. Maximize 100 - 9x2 - 3y2 - 4z2 subject to the constraint 3x + y + 2z = 14.
Figure 11.19
Chapter Answers of Brief Calculus with Integrated Precalculus - Fall 2008.wpd A - 1
ANSWERSExercise Set 1.1 (Page 1 - 3)
1a) 3 b) 20x - 45 c) 20x - 9 d) 4x + 11 e) 4x + 2 f) 4x - 4 g) 8x - 37 h) 20 i) 4h2a) 27 b) 15x2 c) 75x2 d) 3x2 + 30x + 75 e) 3x2 + 75 f) 3x2 + 5 g) 12x2 - 84x + 147 h) 30x + 75 i) 6xh + 3h2
3a) 4 b) 10x2 - 25x + 5 c) 50x2 - 25x + 1 d) 2x2 + 15x + 26 e) 2x2 - 5x + 27 f) 2x2 - 5x + 6 g) 8x2 - 66x + 134 h) 20x + 25 i) 4xh + 2h2 - 5h
4) . For the purposes of this textbook, it is desirable that you should be able to3
2 23
2x h x+−
simplify this answer. In a later technology section, the means for doing this with the TI-89 willbe demonstrated. You might recall that this can be done by hand by first noting that thedenominator of the first fraction in factored form is 2(x + h). As a result, the least commondenominator (LCD) of the two fractions is 2x(x + h). Building both fractions and combining theresult over the LCD produces
3
23
23
23
23 3
23
2( ) ( )( )( )
( )( ) ( )x h x x h
xx x
x hx h
x x hx x h
hx x h+
− =+
⋅ − ⋅++
=− +
+=
−+
Exercise Set 1.2 (Page 1 - 8)
1a) 75 mph b) 71.43 mph2) 53.33 mph3a) f (2) = 28. The car is 28 miles from the center of the city at 8 am (2 hours after 6 am). b) f (-2) = 4. The car is 4 miles from the center of the city at 4 am (2 hours before 6 am). Notice the problem said nothing about the car starting to travel at 6 am. If it did say that, the best answer would be that it did not have meaning (although an argument could be made for saying f (-2) = 20, the location of the car at 6 am (t = 0), and that it meant the car was 20 miles from the city at 4 am; however, this is an unwarranted assumption). c) 2 mph d) 1 mph e) 0 mph. Previous calculations showed that at 8 am the car was 28 miles from city center, at 9 am it was 29 miles, at 10 am it was 28 miles. Although the car was at the same distance from the city at 8 am and 10 am, it was not standing still. Apparently, it was traveling away from the city at 8 am, turned around at some later point, and was headed back to the city at 10 am (at which point it was at the same location it was at when it was 8 am). Graphing the function (a parabola opening downwards) would confirm this.4) 17/5 = 3.4 mph; secant line is shown in the graph on the right. This assumes you read the following values from the graph: At 1 pm (t = 1) the distance was 5 miles. At 6 pm (t = 6) the distance was 22 miles. Your answer should be close to 3.4 mph in any case.
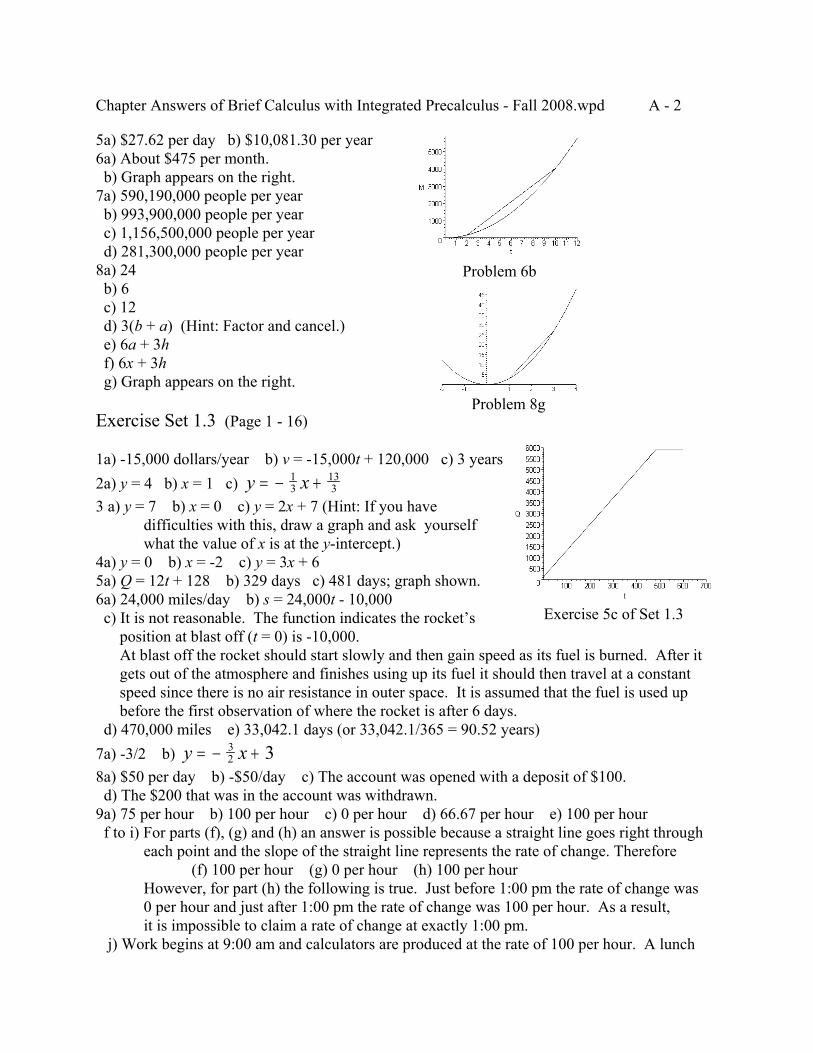
Chapter Answers of Brief Calculus with Integrated Precalculus - Fall 2008.wpd A - 2
Exercise 5c of Set 1.3
Problem 8g
Problem 6b
5a) $27.62 per day b) $10,081.30 per year6a) About $475 per month. b) Graph appears on the right.7a) 590,190,000 people per year b) 993,900,000 people per year c) 1,156,500,000 people per year d) 281,300,000 people per year8a) 24 b) 6 c) 12 d) 3(b + a) (Hint: Factor and cancel.) e) 6a + 3h f) 6x + 3h g) Graph appears on the right.
Exercise Set 1.3 (Page 1 - 16)
1a) -15,000 dollars/year b) v = -15,000t + 120,000 c) 3 years2a) y = 4 b) x = 1 c) y x= − +1
3133
3 a) y = 7 b) x = 0 c) y = 2x + 7 (Hint: If you havedifficulties with this, draw a graph and ask yourselfwhat the value of x is at the y-intercept.)
4a) y = 0 b) x = -2 c) y = 3x + 65a) Q = 12t + 128 b) 329 days c) 481 days; graph shown. 6a) 24,000 miles/day b) s = 24,000t - 10,000 c) It is not reasonable. The function indicates the rocket’s position at blast off (t = 0) is -10,000. At blast off the rocket should start slowly and then gain speed as its fuel is burned. After it gets out of the atmosphere and finishes using up its fuel it should then travel at a constant speed since there is no air resistance in outer space. It is assumed that the fuel is used up before the first observation of where the rocket is after 6 days. d) 470,000 miles e) 33,042.1 days (or 33,042.1/365 = 90.52 years)7a) -3/2 b) y x= − +3
2 38a) $50 per day b) -$50/day c) The account was opened with a deposit of $100. d) The $200 that was in the account was withdrawn.9a) 75 per hour b) 100 per hour c) 0 per hour d) 66.67 per hour e) 100 per hour f to i) For parts (f), (g) and (h) an answer is possible because a straight line goes right through
each point and the slope of the straight line represents the rate of change. Therefore(f) 100 per hour (g) 0 per hour (h) 100 per hour
However, for part (h) the following is true. Just before 1:00 pm the rate of change was0 per hour and just after 1:00 pm the rate of change was 100 per hour. As a result,it is impossible to claim a rate of change at exactly 1:00 pm.
j) Work begins at 9:00 am and calculators are produced at the rate of 100 per hour. A lunch
Chapter Answers of Brief Calculus with Integrated Precalculus - Fall 2008.wpd A - 3
break occurs at 12:00 and no calculators are produced until work resumes at 1:00 pm. From 1:00 to 5:00 pm calculators are produced at the rate of 100 per hour. At 5:00 pm work stops.10a) Yes: y = 3x + 5 b) No c) No d) Yes: y = 2x + 5 e) Yes: y = 3x - 6 f) No
Exercise Set 1.4 (Page 1 - 22)
1) 22,000 items at $77.00 each; demand: p = - q + 100; supply: p = 2q +312) 8400 items at $7.80 each; demand: ; supply: p q= − +1
2 12 p q= +13 5
3) 2000 items at $9.00 each; demand: 6p + 18q = 90; supply: 5p - 10q = 254) If q represents the number of shirts in hundreds, then the demand function is p q= − +1
2 23 and the supply function is p = q + 6. At equilibrium, 1133 shirts are sold per month at $17.33 each.5a) p = - 0.5x + 15 b) p = 0.3x + 3 c) 15,000 shirts at $7.50 (Hint for 4a: If the price increases by $1 from $8 to $9, how many shirts can be sold?)6a) I b) II c) $8.00 d) 12,000 e) $4.00 f) $11.00
Exercise Set 2.1 (Page 2 - 4)
1a) 39/35 b) 1.11429 c) 1.11428571428572a) 3097/3069 b) 1.00912 c) 1.00912349299453a) 235/28 b) 8.39286 c) 8.39285714285714) 2.64575 5) 3.31662 6) 13.8564 7) 2.645758) 6.41421 9) 40.3872 10) 1.44338Note: If you got an answer of 4.33013 for number 10, then go back and do not press the green
diamond key before pressing <enter>. Look at the pretty print answer for what youentered. How should you correct it?
11) 0.693692 (Look at the pretty print of what you entered if you got a different answer.)12) 3.141592653589813a) 85 b) 0.433601 c) 145/81 = 1.79012 d) 5/16 = 0.3125 e) = 0.37258323 16 2−14a) 117 b) 6.8418 c) 217/81 = 2.67901 d) 77/16 = 4.8125 e) = 4.3725827 16 2−
Exercise Set 2.2 (Page 2 - 7)
1. 2. 3. 12 45
20 2
xx− 7 23
3 122
xx
+−
10 29 164 4 1
3
3 2
x xx x x
− +− − +
4. x = 1 or -1/2 5. x = 3 or 5/2 or 0 or -1 6. x = -42/5
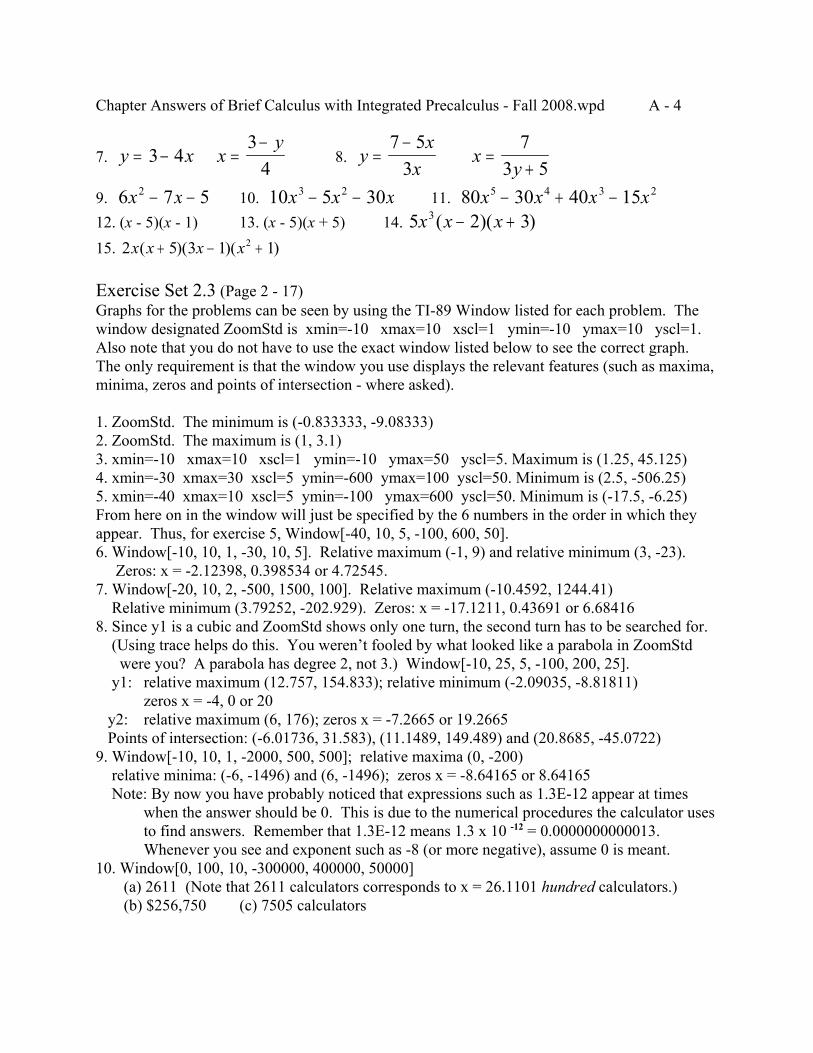
Chapter Answers of Brief Calculus with Integrated Precalculus - Fall 2008.wpd A - 4
7. 8. y x xy
= − =−
3 43
4 y
xx
xy
=−
=+
7 53
73 5
9. 10. 11. 6 7 52x x− − 10 5 303 2x x x− − 80 30 40 155 4 3 2x x x x− + −12. (x - 5)(x - 1) 13. (x - 5)(x + 5) 14. 5 2 33x x x( )( )− +15. 2 5 3 1 12x x x x( )( )( )+ − +
Exercise Set 2.3 (Page 2 - 17)Graphs for the problems can be seen by using the TI-89 Window listed for each problem. Thewindow designated ZoomStd is xmin=-10 xmax=10 xscl=1 ymin=-10 ymax=10 yscl=1.Also note that you do not have to use the exact window listed below to see the correct graph. The only requirement is that the window you use displays the relevant features (such as maxima,minima, zeros and points of intersection - where asked).
1. ZoomStd. The minimum is (-0.833333, -9.08333)2. ZoomStd. The maximum is (1, 3.1)3. xmin=-10 xmax=10 xscl=1 ymin=-10 ymax=50 yscl=5. Maximum is (1.25, 45.125)4. xmin=-30 xmax=30 xscl=5 ymin=-600 ymax=100 yscl=50. Minimum is (2.5, -506.25)5. xmin=-40 xmax=10 xscl=5 ymin=-100 ymax=600 yscl=50. Minimum is (-17.5, -6.25)From here on in the window will just be specified by the 6 numbers in the order in which theyappear. Thus, for exercise 5, Window[-40, 10, 5, -100, 600, 50].6. Window[-10, 10, 1, -30, 10, 5]. Relative maximum (-1, 9) and relative minimum (3, -23). Zeros: x = -2.12398, 0.398534 or 4.72545.7. Window[-20, 10, 2, -500, 1500, 100]. Relative maximum (-10.4592, 1244.41) Relative minimum (3.79252, -202.929). Zeros: x = -17.1211, 0.43691 or 6.684168. Since y1 is a cubic and ZoomStd shows only one turn, the second turn has to be searched for. (Using trace helps do this. You weren’t fooled by what looked like a parabola in ZoomStd were you? A parabola has degree 2, not 3.) Window[-10, 25, 5, -100, 200, 25]. y1: relative maximum (12.757, 154.833); relative minimum (-2.09035, -8.81811)
zeros x = -4, 0 or 20 y2: relative maximum (6, 176); zeros x = -7.2665 or 19.2665 Points of intersection: (-6.01736, 31.583), (11.1489, 149.489) and (20.8685, -45.0722)9. Window[-10, 10, 1, -2000, 500, 500]; relative maxima (0, -200) relative minima: (-6, -1496) and (6, -1496); zeros x = -8.64165 or 8.64165 Note: By now you have probably noticed that expressions such as 1.3E-12 appear at times
when the answer should be 0. This is due to the numerical procedures the calculator usesto find answers. Remember that 1.3E-12 means 1.3 x 10 -12 = 0.0000000000013.Whenever you see and exponent such as -8 (or more negative), assume 0 is meant.
10. Window[0, 100, 10, -300000, 400000, 50000] (a) 2611 (Note that 2611 calculators corresponds to x = 26.1101 hundred calculators.) (b) $256,750 (c) 7505 calculators
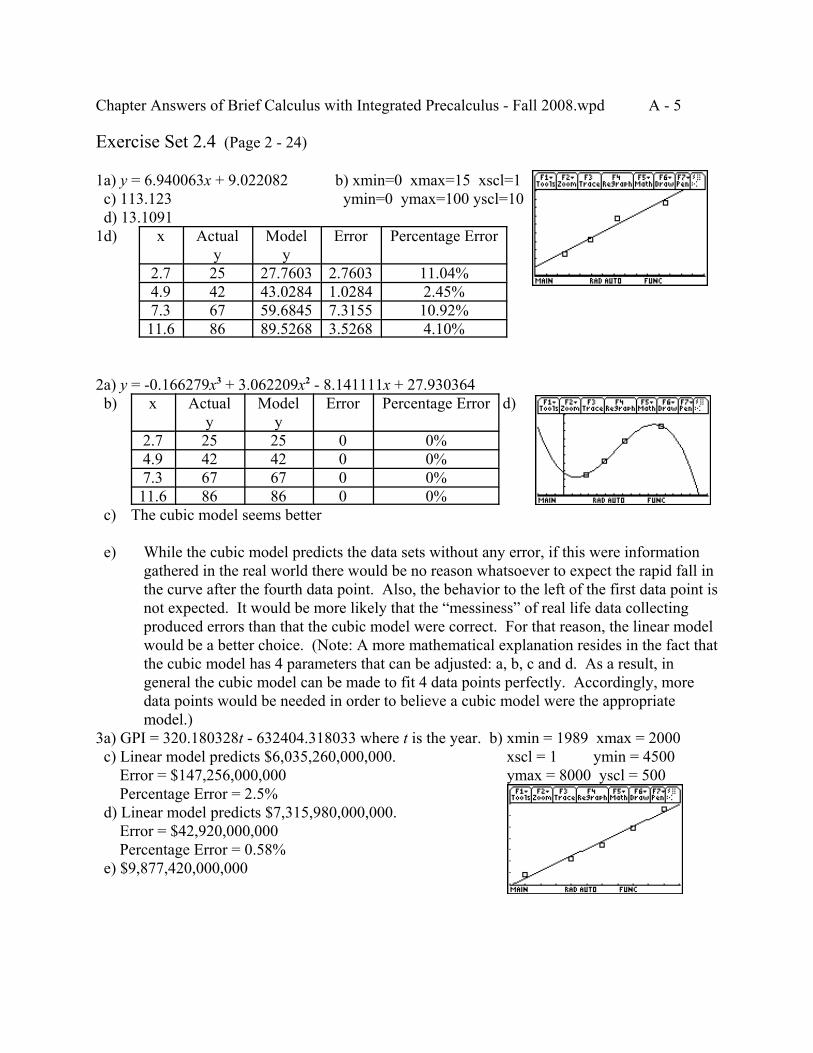
Chapter Answers of Brief Calculus with Integrated Precalculus - Fall 2008.wpd A - 5
Exercise Set 2.4 (Page 2 - 24)
1a) y = 6.940063x + 9.022082 b) xmin=0 xmax=15 xscl=1 c) 113.123 ymin=0 ymax=100 yscl=10 d) 13.10911d) x Actual
yModel
yError Percentage Error
2.7 25 27.7603 2.7603 11.04%4.9 42 43.0284 1.0284 2.45%7.3 67 59.6845 7.3155 10.92%11.6 86 89.5268 3.5268 4.10%
2a) y = -0.166279x3 + 3.062209x2 - 8.141111x + 27.930364 b)
c)
x Actualy
Modely
Error Percentage Error
2.7 25 25 0 0%4.9 42 42 0 0%7.3 67 67 0 0%11.6 86 86 0 0%
The cubic model seems better
d)
e) While the cubic model predicts the data sets without any error, if this were informationgathered in the real world there would be no reason whatsoever to expect the rapid fall inthe curve after the fourth data point. Also, the behavior to the left of the first data point isnot expected. It would be more likely that the “messiness” of real life data collectingproduced errors than that the cubic model were correct. For that reason, the linear modelwould be a better choice. (Note: A more mathematical explanation resides in the fact thatthe cubic model has 4 parameters that can be adjusted: a, b, c and d. As a result, ingeneral the cubic model can be made to fit 4 data points perfectly. Accordingly, moredata points would be needed in order to believe a cubic model were the appropriatemodel.)
3a) GPI = 320.180328t - 632404.318033 where t is the year. b) xmin = 1989 xmax = 2000 c) Linear model predicts $6,035,260,000,000. xscl = 1 ymin = 4500 Error = $147,256,000,000 ymax = 8000 yscl = 500 Percentage Error = 2.5% d) Linear model predicts $7,315,980,000,000. Error = $42,920,000,000 Percentage Error = 0.58% e) $9,877,420,000,000
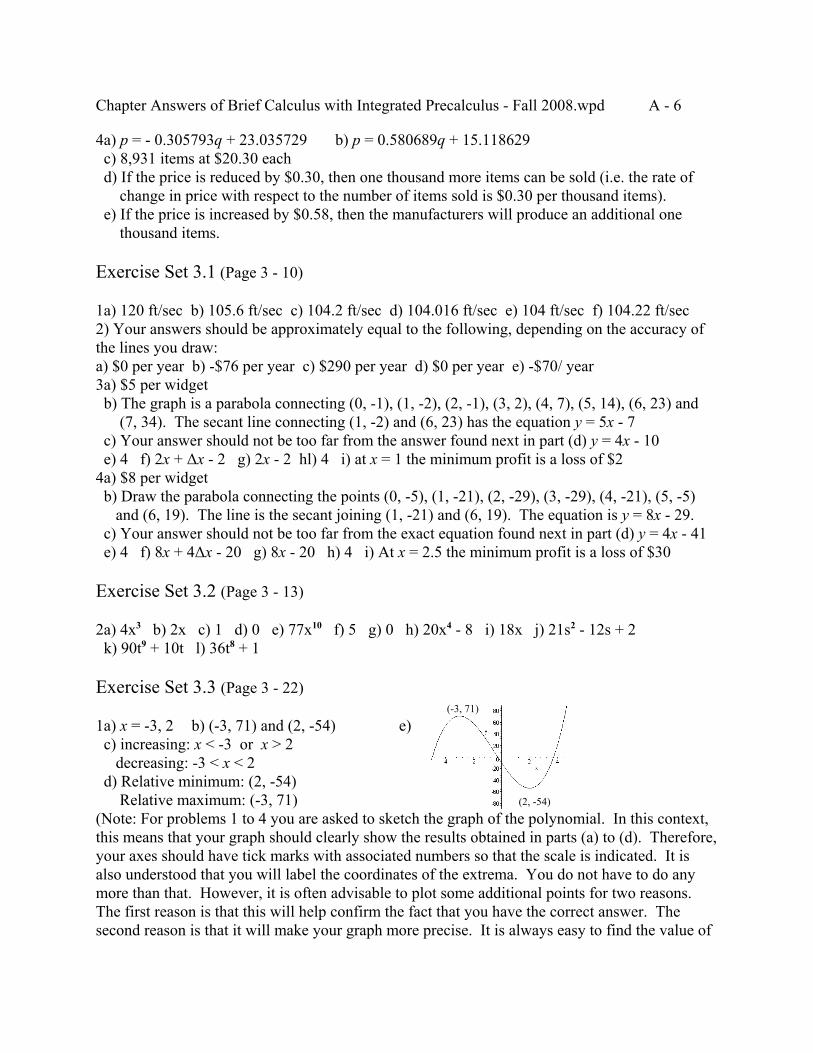
Chapter Answers of Brief Calculus with Integrated Precalculus - Fall 2008.wpd A - 6
4a) p = - 0.305793q + 23.035729 b) p = 0.580689q + 15.118629 c) 8,931 items at $20.30 each d) If the price is reduced by $0.30, then one thousand more items can be sold (i.e. the rate of change in price with respect to the number of items sold is $0.30 per thousand items). e) If the price is increased by $0.58, then the manufacturers will produce an additional one thousand items.
Exercise Set 3.1 (Page 3 - 10)
1a) 120 ft/sec b) 105.6 ft/sec c) 104.2 ft/sec d) 104.016 ft/sec e) 104 ft/sec f) 104.22 ft/sec2) Your answers should be approximately equal to the following, depending on the accuracy ofthe lines you draw:a) $0 per year b) -$76 per year c) $290 per year d) $0 per year e) -$70/ year3a) $5 per widget b) The graph is a parabola connecting (0, -1), (1, -2), (2, -1), (3, 2), (4, 7), (5, 14), (6, 23) and (7, 34). The secant line connecting (1, -2) and (6, 23) has the equation y = 5x - 7 c) Your answer should not be too far from the answer found next in part (d) y = 4x - 10 e) 4 f) 2x + ∆x - 2 g) 2x - 2 hl) 4 i) at x = 1 the minimum profit is a loss of $24a) $8 per widget b) Draw the parabola connecting the points (0, -5), (1, -21), (2, -29), (3, -29), (4, -21), (5, -5) and (6, 19). The line is the secant joining (1, -21) and (6, 19). The equation is y = 8x - 29. c) Your answer should not be too far from the exact equation found next in part (d) y = 4x - 41 e) 4 f) 8x + 4∆x - 20 g) 8x - 20 h) 4 i) At x = 2.5 the minimum profit is a loss of $30
Exercise Set 3.2 (Page 3 - 13)
2a) 4x3 b) 2x c) 1 d) 0 e) 77x10 f) 5 g) 0 h) 20x4 - 8 i) 18x j) 21s2 - 12s + 2 k) 90t9 + 10t l) 36t8 + 1
Exercise Set 3.3 (Page 3 - 22) (-3, 71)
1a) x = -3, 2 b) (-3, 71) and (2, -54) e) c) increasing: x < -3 or x > 2 decreasing: -3 < x < 2 d) Relative minimum: (2, -54) Relative maximum: (-3, 71) (2, -54)
(Note: For problems 1 to 4 you are asked to sketch the graph of the polynomial. In this context,this means that your graph should clearly show the results obtained in parts (a) to (d). Therefore,your axes should have tick marks with associated numbers so that the scale is indicated. It isalso understood that you will label the coordinates of the extrema. You do not have to do anymore than that. However, it is often advisable to plot some additional points for two reasons. The first reason is that this will help confirm the fact that you have the correct answer. Thesecond reason is that it will make your graph more precise. It is always easy to find the value of
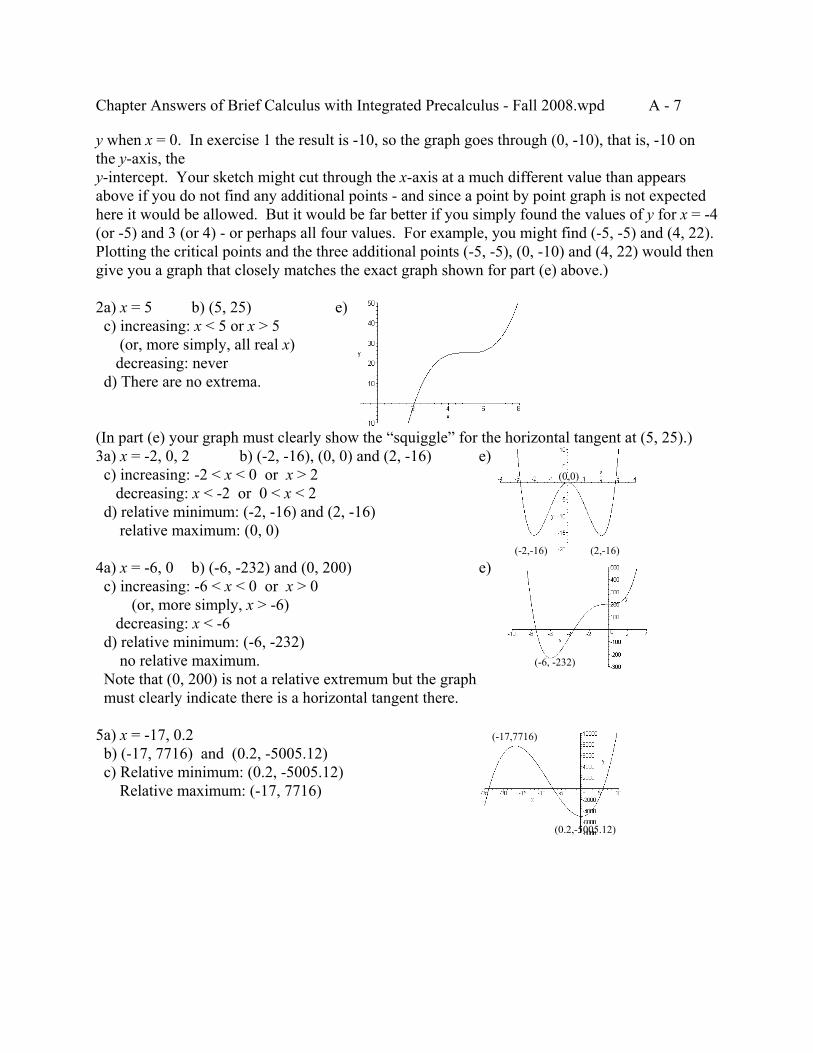
Chapter Answers of Brief Calculus with Integrated Precalculus - Fall 2008.wpd A - 7
y when x = 0. In exercise 1 the result is -10, so the graph goes through (0, -10), that is, -10 onthe y-axis, they-intercept. Your sketch might cut through the x-axis at a much different value than appearsabove if you do not find any additional points - and since a point by point graph is not expectedhere it would be allowed. But it would be far better if you simply found the values of y for x = -4(or -5) and 3 (or 4) - or perhaps all four values. For example, you might find (-5, -5) and (4, 22). Plotting the critical points and the three additional points (-5, -5), (0, -10) and (4, 22) would thengive you a graph that closely matches the exact graph shown for part (e) above.)
2a) x = 5 b) (5, 25) e) c) increasing: x < 5 or x > 5 (or, more simply, all real x) decreasing: never d) There are no extrema.
(In part (e) your graph must clearly show the “squiggle” for the horizontal tangent at (5, 25).)3a) x = -2, 0, 2 b) (-2, -16), (0, 0) and (2, -16) e) c) increasing: -2 < x < 0 or x > 2 (0,0)
decreasing: x < -2 or 0 < x < 2 d) relative minimum: (-2, -16) and (2, -16) relative maximum: (0, 0)
(-2,-16) (2,-16)
4a) x = -6, 0 b) (-6, -232) and (0, 200) e) c) increasing: -6 < x < 0 or x > 0 (or, more simply, x > -6) decreasing: x < -6 d) relative minimum: (-6, -232) no relative maximum. (-6, -232)
Note that (0, 200) is not a relative extremum but the graph must clearly indicate there is a horizontal tangent there.
5a) x = -17, 0.2 (-17,7716)
b) (-17, 7716) and (0.2, -5005.12) c) Relative minimum: (0.2, -5005.12) Relative maximum: (-17, 7716)
(0.2,-5005.12)
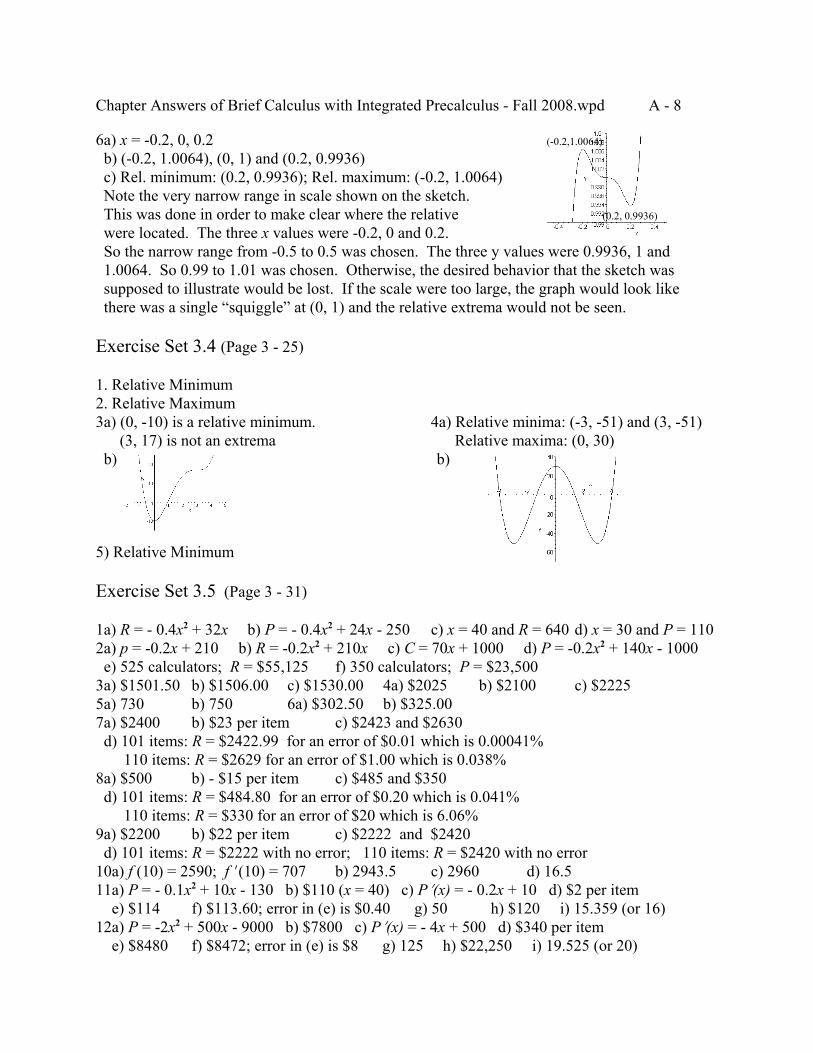
Chapter Answers of Brief Calculus with Integrated Precalculus - Fall 2008.wpd A - 8
6a) x = -0.2, 0, 0.2 (-0.2,1.0064)
b) (-0.2, 1.0064), (0, 1) and (0.2, 0.9936) c) Rel. minimum: (0.2, 0.9936); Rel. maximum: (-0.2, 1.0064) Note the very narrow range in scale shown on the sketch. This was done in order to make clear where the relative (0.2, 0.9936)
were located. The three x values were -0.2, 0 and 0.2. So the narrow range from -0.5 to 0.5 was chosen. The three y values were 0.9936, 1 and 1.0064. So 0.99 to 1.01 was chosen. Otherwise, the desired behavior that the sketch was supposed to illustrate would be lost. If the scale were too large, the graph would look like there was a single “squiggle” at (0, 1) and the relative extrema would not be seen.
Exercise Set 3.4 (Page 3 - 25)
1. Relative Minimum2. Relative Maximum3a) (0, -10) is a relative minimum. 4a) Relative minima: (-3, -51) and (3, -51) (3, 17) is not an extrema Relative maxima: (0, 30) b) b)
5) Relative Minimum
Exercise Set 3.5 (Page 3 - 31)
1a) R = - 0.4x2 + 32x b) P = - 0.4x2 + 24x - 250 c) x = 40 and R = 640 d) x = 30 and P = 1102a) p = -0.2x + 210 b) R = -0.2x2 + 210x c) C = 70x + 1000 d) P = -0.2x2 + 140x - 1000 e) 525 calculators; R = $55,125 f) 350 calculators; P = $23,5003a) $1501.50 b) $1506.00 c) $1530.00 4a) $2025 b) $2100 c) $22255a) 730 b) 750 6a) $302.50 b) $325.007a) $2400 b) $23 per item c) $2423 and $2630 d) 101 items: R = $2422.99 for an error of $0.01 which is 0.00041% 110 items: R = $2629 for an error of $1.00 which is 0.038%8a) $500 b) - $15 per item c) $485 and $350 d) 101 items: R = $484.80 for an error of $0.20 which is 0.041% 110 items: R = $330 for an error of $20 which is 6.06%9a) $2200 b) $22 per item c) $2222 and $2420 d) 101 items: R = $2222 with no error; 110 items: R = $2420 with no error10a) f (10) = 2590; f N(10) = 707 b) 2943.5 c) 2960 d) 16.511a) P = - 0.1x2 + 10x - 130 b) $110 (x = 40) c) PN(x) = - 0.2x + 10 d) $2 per item e) $114 f) $113.60; error in (e) is $0.40 g) 50 h) $120 i) 15.359 (or 16)12a) P = -2x2 + 500x - 9000 b) $7800 c) PN(x) = - 4x + 500 d) $340 per item e) $8480 f) $8472; error in (e) is $8 g) 125 h) $22,250 i) 19.525 (or 20)
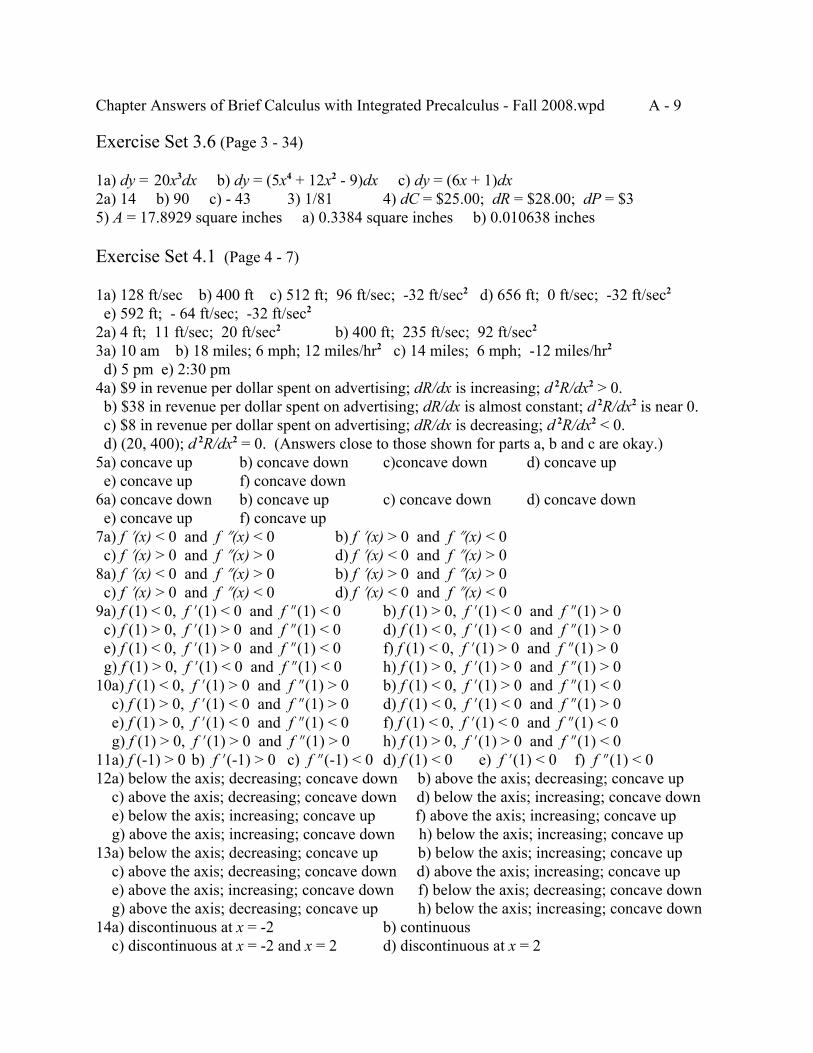
Chapter Answers of Brief Calculus with Integrated Precalculus - Fall 2008.wpd A - 9
Exercise Set 3.6 (Page 3 - 34)
1a) dy = 20x3dx b) dy = (5x4 + 12x2 - 9)dx c) dy = (6x + 1)dx2a) 14 b) 90 c) - 43 3) 1/81 4) dC = $25.00; dR = $28.00; dP = $35) A = 17.8929 square inches a) 0.3384 square inches b) 0.010638 inches
Exercise Set 4.1 (Page 4 - 7)
1a) 128 ft/sec b) 400 ft c) 512 ft; 96 ft/sec; -32 ft/sec2 d) 656 ft; 0 ft/sec; -32 ft/sec2
e) 592 ft; - 64 ft/sec; -32 ft/sec2
2a) 4 ft; 11 ft/sec; 20 ft/sec2 b) 400 ft; 235 ft/sec; 92 ft/sec2
3a) 10 am b) 18 miles; 6 mph; 12 miles/hr2 c) 14 miles; 6 mph; -12 miles/hr2
d) 5 pm e) 2:30 pm4a) $9 in revenue per dollar spent on advertising; dR/dx is increasing; d 2R/dx2 > 0. b) $38 in revenue per dollar spent on advertising; dR/dx is almost constant; d 2R/dx2 is near 0. c) $8 in revenue per dollar spent on advertising; dR/dx is decreasing; d 2R/dx2 < 0. d) (20, 400); d 2R/dx2 = 0. (Answers close to those shown for parts a, b and c are okay.)5a) concave up b) concave down c)concave down d) concave up e) concave up f) concave down6a) concave down b) concave up c) concave down d) concave down e) concave up f) concave up7a) f N(x) < 0 and f O(x) < 0 b) f N(x) > 0 and f O(x) < 0 c) f N(x) > 0 and f O(x) > 0 d) f N(x) < 0 and f O(x) > 08a) f N(x) < 0 and f O(x) > 0 b) f N(x) > 0 and f O(x) > 0 c) f N(x) > 0 and f O(x) < 0 d) f N(x) < 0 and f O(x) < 09a) f (1) < 0, f N(1) < 0 and f O(1) < 0 b) f (1) > 0, f N(1) < 0 and f O(1) > 0 c) f (1) > 0, f N(1) > 0 and f O(1) < 0 d) f (1) < 0, f N(1) < 0 and f O(1) > 0 e) f (1) < 0, f N(1) > 0 and f O(1) < 0 f) f (1) < 0, f N(1) > 0 and f O(1) > 0 g) f (1) > 0, f N(1) < 0 and f O(1) < 0 h) f (1) > 0, f N(1) > 0 and f O(1) > 010a) f (1) < 0, f N(1) > 0 and f O(1) > 0 b) f (1) < 0, f N(1) > 0 and f O(1) < 0 c) f (1) > 0, f N(1) < 0 and f O(1) > 0 d) f (1) < 0, f N(1) < 0 and f O(1) > 0 e) f (1) > 0, f N(1) < 0 and f O(1) < 0 f) f (1) < 0, f N(1) < 0 and f O(1) < 0 g) f (1) > 0, f N(1) > 0 and f O(1) > 0 h) f (1) > 0, f N(1) > 0 and f O(1) < 011a) f (-1) > 0 b) f N(-1) > 0 c) f O(-1) < 0 d) f (1) < 0 e) f N(1) < 0 f) f O(1) < 012a) below the axis; decreasing; concave down b) above the axis; decreasing; concave up c) above the axis; decreasing; concave down d) below the axis; increasing; concave down e) below the axis; increasing; concave up f) above the axis; increasing; concave up g) above the axis; increasing; concave down h) below the axis; increasing; concave up13a) below the axis; decreasing; concave up b) below the axis; increasing; concave up c) above the axis; decreasing; concave down d) above the axis; increasing; concave up e) above the axis; increasing; concave down f) below the axis; decreasing; concave down g) above the axis; decreasing; concave up h) below the axis; increasing; concave down14a) discontinuous at x = -2 b) continuous c) discontinuous at x = -2 and x = 2 d) discontinuous at x = 2
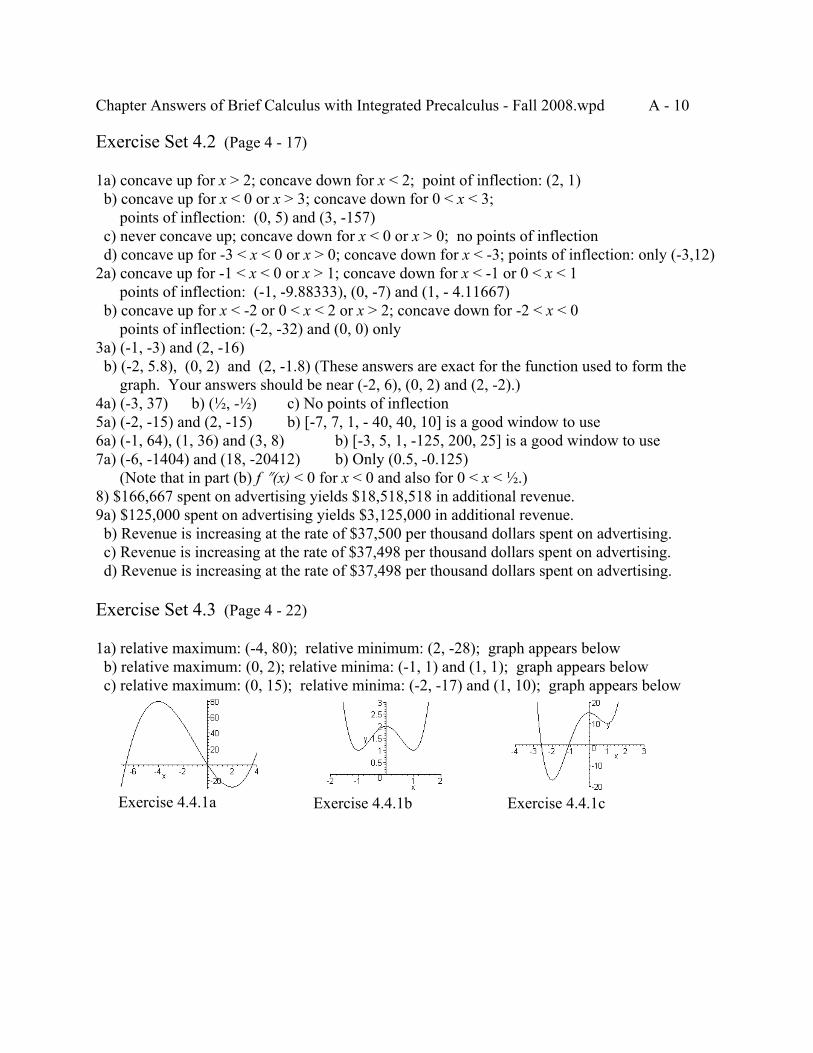
Chapter Answers of Brief Calculus with Integrated Precalculus - Fall 2008.wpd A - 10
Exercise 4.4.1a Exercise 4.4.1b Exercise 4.4.1c
Exercise Set 4.2 (Page 4 - 17)
1a) concave up for x > 2; concave down for x < 2; point of inflection: (2, 1) b) concave up for x < 0 or x > 3; concave down for 0 < x < 3; points of inflection: (0, 5) and (3, -157) c) never concave up; concave down for x < 0 or x > 0; no points of inflection d) concave up for -3 < x < 0 or x > 0; concave down for x < -3; points of inflection: only (-3,12)2a) concave up for -1 < x < 0 or x > 1; concave down for x < -1 or 0 < x < 1 points of inflection: (-1, -9.88333), (0, -7) and (1, - 4.11667) b) concave up for x < -2 or 0 < x < 2 or x > 2; concave down for -2 < x < 0 points of inflection: (-2, -32) and (0, 0) only 3a) (-1, -3) and (2, -16) b) (-2, 5.8), (0, 2) and (2, -1.8) (These answers are exact for the function used to form the graph. Your answers should be near (-2, 6), (0, 2) and (2, -2).)4a) (-3, 37) b) (½, -½) c) No points of inflection5a) (-2, -15) and (2, -15) b) [-7, 7, 1, - 40, 40, 10] is a good window to use6a) (-1, 64), (1, 36) and (3, 8) b) [-3, 5, 1, -125, 200, 25] is a good window to use7a) (-6, -1404) and (18, -20412) b) Only (0.5, -0.125) (Note that in part (b) f O(x) < 0 for x < 0 and also for 0 < x < ½.)8) $166,667 spent on advertising yields $18,518,518 in additional revenue.9a) $125,000 spent on advertising yields $3,125,000 in additional revenue. b) Revenue is increasing at the rate of $37,500 per thousand dollars spent on advertising. c) Revenue is increasing at the rate of $37,498 per thousand dollars spent on advertising. d) Revenue is increasing at the rate of $37,498 per thousand dollars spent on advertising.
Exercise Set 4.3 (Page 4 - 22)
1a) relative maximum: (-4, 80); relative minimum: (2, -28); graph appears below b) relative maximum: (0, 2); relative minima: (-1, 1) and (1, 1); graph appears below c) relative maximum: (0, 15); relative minima: (-2, -17) and (1, 10); graph appears below
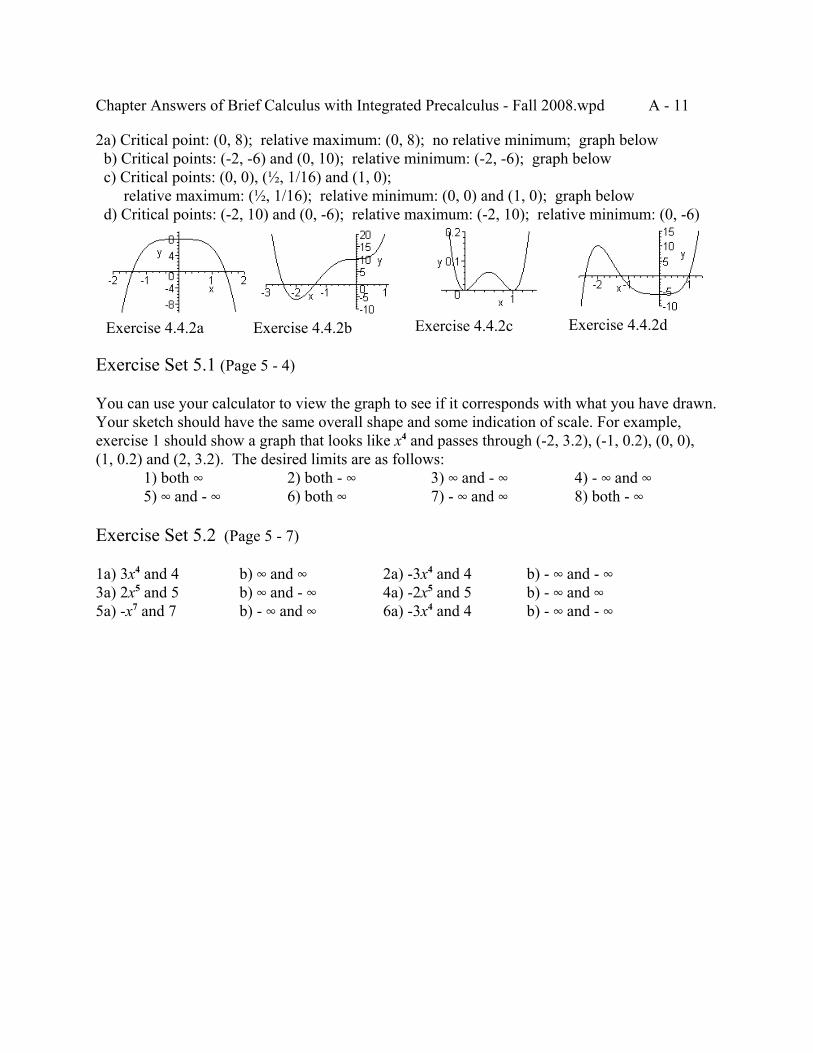
Chapter Answers of Brief Calculus with Integrated Precalculus - Fall 2008.wpd A - 11
Exercise 4.4.2dExercise 4.4.2cExercise 4.4.2bExercise 4.4.2a
2a) Critical point: (0, 8); relative maximum: (0, 8); no relative minimum; graph below b) Critical points: (-2, -6) and (0, 10); relative minimum: (-2, -6); graph below c) Critical points: (0, 0), (½, 1/16) and (1, 0); relative maximum: (½, 1/16); relative minimum: (0, 0) and (1, 0); graph below d) Critical points: (-2, 10) and (0, -6); relative maximum: (-2, 10); relative minimum: (0, -6)
Exercise Set 5.1 (Page 5 - 4)
You can use your calculator to view the graph to see if it corresponds with what you have drawn. Your sketch should have the same overall shape and some indication of scale. For example,exercise 1 should show a graph that looks like x4 and passes through (-2, 3.2), (-1, 0.2), (0, 0),(1, 0.2) and (2, 3.2). The desired limits are as follows:
1) both 4 2) both - 4 3) 4 and - 4 4) - 4 and 45) 4 and - 4 6) both 4 7) - 4 and 4 8) both - 4
Exercise Set 5.2 (Page 5 - 7)
1a) 3x4 and 4 b) 4 and 4 2a) -3x4 and 4 b) - 4 and - 43a) 2x5 and 5 b) 4 and - 4 4a) -2x5 and 5 b) - 4 and 45a) -x7 and 7 b) - 4 and 4 6a) -3x4 and 4 b) - 4 and - 4
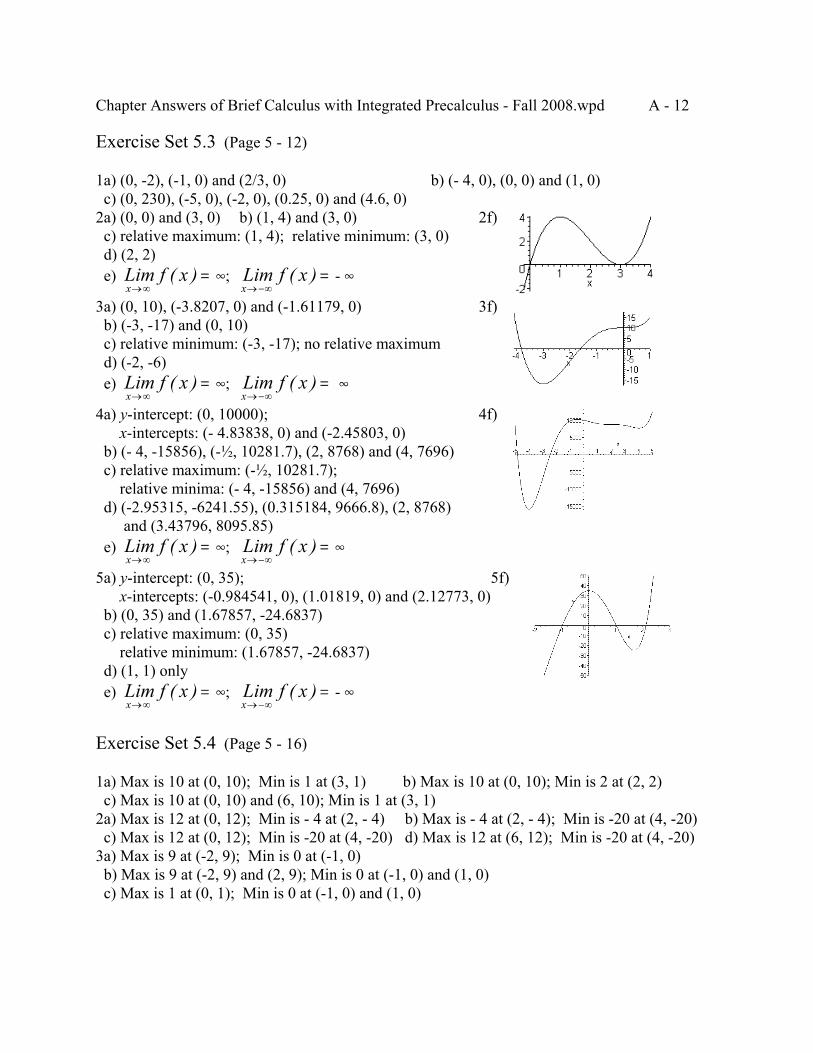
Chapter Answers of Brief Calculus with Integrated Precalculus - Fall 2008.wpd A - 12
Exercise Set 5.3 (Page 5 - 12)
1a) (0, -2), (-1, 0) and (2/3, 0) b) (- 4, 0), (0, 0) and (1, 0) c) (0, 230), (-5, 0), (-2, 0), (0.25, 0) and (4.6, 0)2a) (0, 0) and (3, 0) b) (1, 4) and (3, 0) 2f) c) relative maximum: (1, 4); relative minimum: (3, 0) d) (2, 2) e) 4; - 4Lim f x
x→∞=( ) Lim f x
x→−∞=( )
3a) (0, 10), (-3.8207, 0) and (-1.61179, 0) 3f) b) (-3, -17) and (0, 10) c) relative minimum: (-3, -17); no relative maximum d) (-2, -6) e) 4; 4Lim f x
x→∞=( ) Lim f x
x→−∞=( )
4a) y-intercept: (0, 10000); 4f) x-intercepts: (- 4.83838, 0) and (-2.45803, 0) b) (- 4, -15856), (-½, 10281.7), (2, 8768) and (4, 7696) c) relative maximum: (-½, 10281.7); relative minima: (- 4, -15856) and (4, 7696) d) (-2.95315, -6241.55), (0.315184, 9666.8), (2, 8768) and (3.43796, 8095.85) e) 4; 4Lim f x
x→∞=( ) Lim f x
x→−∞=( )
5a) y-intercept: (0, 35); 5f) x-intercepts: (-0.984541, 0), (1.01819, 0) and (2.12773, 0) b) (0, 35) and (1.67857, -24.6837) c) relative maximum: (0, 35) relative minimum: (1.67857, -24.6837) d) (1, 1) only e) 4; - 4Lim f x
x→∞=( ) Lim f x
x→−∞=( )
Exercise Set 5.4 (Page 5 - 16)
1a) Max is 10 at (0, 10); Min is 1 at (3, 1) b) Max is 10 at (0, 10); Min is 2 at (2, 2) c) Max is 10 at (0, 10) and (6, 10); Min is 1 at (3, 1)2a) Max is 12 at (0, 12); Min is - 4 at (2, - 4) b) Max is - 4 at (2, - 4); Min is -20 at (4, -20) c) Max is 12 at (0, 12); Min is -20 at (4, -20) d) Max is 12 at (6, 12); Min is -20 at (4, -20)3a) Max is 9 at (-2, 9); Min is 0 at (-1, 0) b) Max is 9 at (-2, 9) and (2, 9); Min is 0 at (-1, 0) and (1, 0) c) Max is 1 at (0, 1); Min is 0 at (-1, 0) and (1, 0)
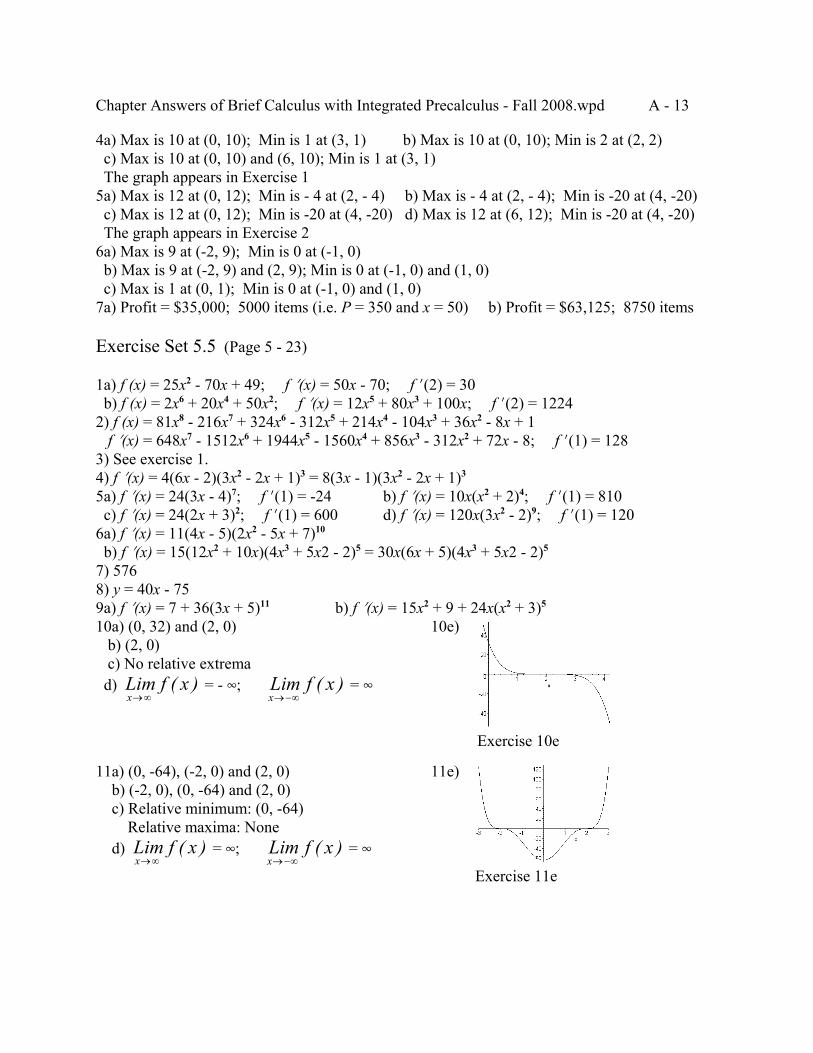
Chapter Answers of Brief Calculus with Integrated Precalculus - Fall 2008.wpd A - 13
Exercise 10e
Exercise 11e
4a) Max is 10 at (0, 10); Min is 1 at (3, 1) b) Max is 10 at (0, 10); Min is 2 at (2, 2) c) Max is 10 at (0, 10) and (6, 10); Min is 1 at (3, 1) The graph appears in Exercise 15a) Max is 12 at (0, 12); Min is - 4 at (2, - 4) b) Max is - 4 at (2, - 4); Min is -20 at (4, -20) c) Max is 12 at (0, 12); Min is -20 at (4, -20) d) Max is 12 at (6, 12); Min is -20 at (4, -20) The graph appears in Exercise 26a) Max is 9 at (-2, 9); Min is 0 at (-1, 0) b) Max is 9 at (-2, 9) and (2, 9); Min is 0 at (-1, 0) and (1, 0) c) Max is 1 at (0, 1); Min is 0 at (-1, 0) and (1, 0)7a) Profit = $35,000; 5000 items (i.e. P = 350 and x = 50) b) Profit = $63,125; 8750 items
Exercise Set 5.5 (Page 5 - 23)
1a) f (x) = 25x2 - 70x + 49; f N(x) = 50x - 70; f N(2) = 30 b) f (x) = 2x6 + 20x4 + 50x2; f N(x) = 12x5 + 80x3 + 100x; f N(2) = 12242) f (x) = 81x8 - 216x7 + 324x6 - 312x5 + 214x4 - 104x3 + 36x2 - 8x + 1 f N(x) = 648x7 - 1512x6 + 1944x5 - 1560x4 + 856x3 - 312x2 + 72x - 8; f N(1) = 1283) See exercise 1.4) f N(x) = 4(6x - 2)(3x2 - 2x + 1)3 = 8(3x - 1)(3x2 - 2x + 1)3
5a) f N(x) = 24(3x - 4)7; f N(1) = -24 b) f N(x) = 10x(x2 + 2)4; f N(1) = 810 c) f N(x) = 24(2x + 3)2; f N(1) = 600 d) f N(x) = 120x(3x2 - 2)9; f N(1) = 1206a) f N(x) = 11(4x - 5)(2x2 - 5x + 7)10
b) f N(x) = 15(12x2 + 10x)(4x3 + 5x2 - 2)5 = 30x(6x + 5)(4x3 + 5x2 - 2)5
7) 5768) y = 40x - 759a) f N(x) = 7 + 36(3x + 5)11 b) f N(x) = 15x2 + 9 + 24x(x2 + 3)5
10a) (0, 32) and (2, 0) 10e) b) (2, 0) c) No relative extrema d) = - 4; = 4Lim f x
x→∞( ) Lim f x
x→−∞( )
11a) (0, -64), (-2, 0) and (2, 0) 11e) b) (-2, 0), (0, -64) and (2, 0) c) Relative minimum: (0, -64) Relative maxima: None d) = 4; = 4Lim f x
x→∞( ) Lim f x
x→−∞( )
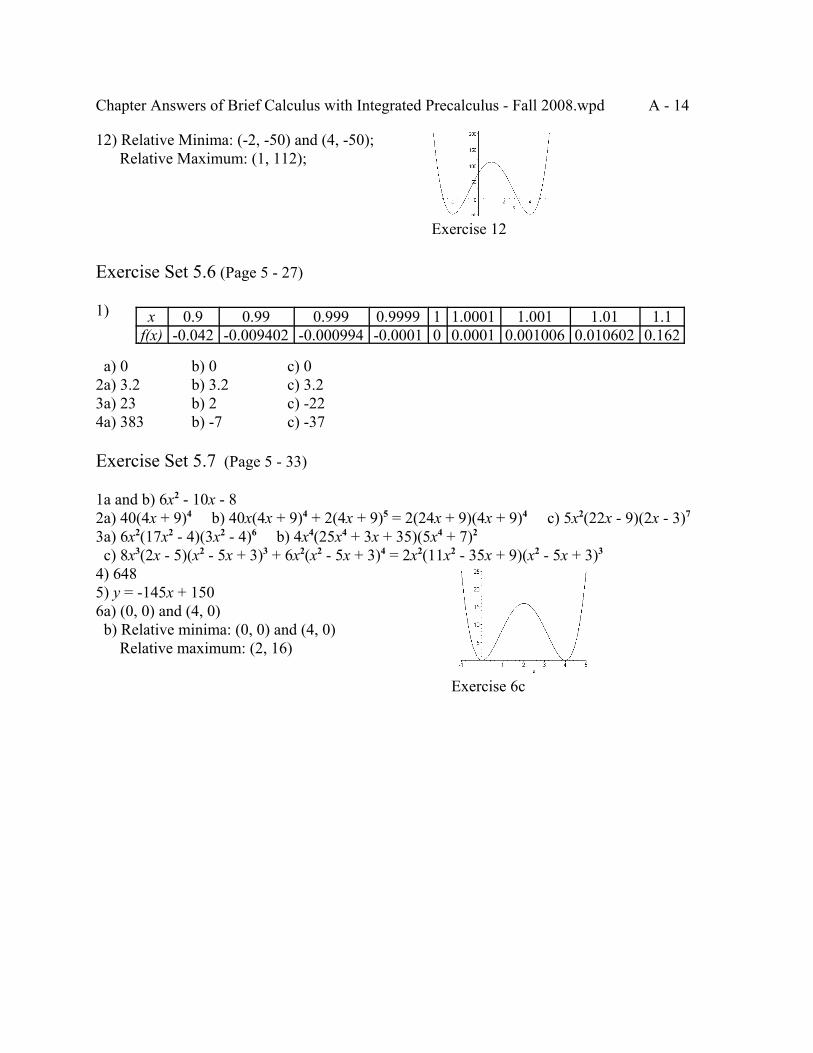
Chapter Answers of Brief Calculus with Integrated Precalculus - Fall 2008.wpd A - 14
Exercise 12
Exercise 6c
12) Relative Minima: (-2, -50) and (4, -50); Relative Maximum: (1, 112);
Exercise Set 5.6 (Page 5 - 27)
1)
a) 0 b) 0 c) 02a) 3.2 b) 3.2 c) 3.23a) 23 b) 2 c) -224a) 383 b) -7 c) -37
Exercise Set 5.7 (Page 5 - 33)
1a and b) 6x2 - 10x - 82a) 40(4x + 9)4 b) 40x(4x + 9)4 + 2(4x + 9)5 = 2(24x + 9)(4x + 9)4 c) 5x2(22x - 9)(2x - 3)7
3a) 6x2(17x2 - 4)(3x2 - 4)6 b) 4x4(25x4 + 3x + 35)(5x4 + 7)2
c) 8x3(2x - 5)(x2 - 5x + 3)3 + 6x2(x2 - 5x + 3)4 = 2x2(11x2 - 35x + 9)(x2 - 5x + 3)3
4) 6485) y = -145x + 1506a) (0, 0) and (4, 0) b) Relative minima: (0, 0) and (4, 0) Relative maximum: (2, 16)
x 0.9 0.99 0.999 0.9999 1 1.0001 1.001 1.01 1.1f(x) -0.042 -0.009402 -0.000994 -0.0001 0 0.0001 0.001006 0.010602 0.162
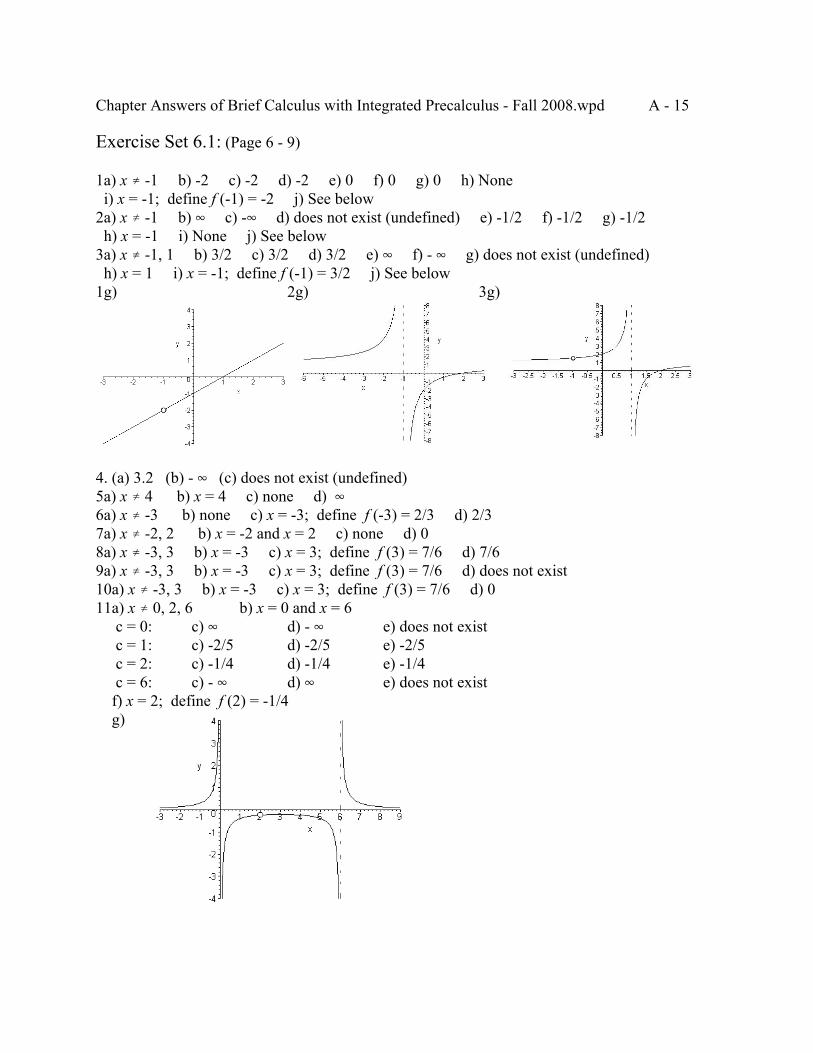
Chapter Answers of Brief Calculus with Integrated Precalculus - Fall 2008.wpd A - 15
Exercise Set 6.1: (Page 6 - 9)
1a) x … -1 b) -2 c) -2 d) -2 e) 0 f) 0 g) 0 h) None i) x = -1; define f (-1) = -2 j) See below2a) x … -1 b) 4 c) -4 d) does not exist (undefined) e) -1/2 f) -1/2 g) -1/2 h) x = -1 i) None j) See below3a) x … -1, 1 b) 3/2 c) 3/2 d) 3/2 e) 4 f) - 4 g) does not exist (undefined) h) x = 1 i) x = -1; define f (-1) = 3/2 j) See below1g) 2g) 3g)
4. (a) 3.2 (b) - 4 (c) does not exist (undefined)5a) x … 4 b) x = 4 c) none d) 46a) x … -3 b) none c) x = -3; define f (-3) = 2/3 d) 2/37a) x … -2, 2 b) x = -2 and x = 2 c) none d) 08a) x … -3, 3 b) x = -3 c) x = 3; define f (3) = 7/6 d) 7/69a) x … -3, 3 b) x = -3 c) x = 3; define f (3) = 7/6 d) does not exist10a) x … -3, 3 b) x = -3 c) x = 3; define f (3) = 7/6 d) 011a) x … 0, 2, 6 b) x = 0 and x = 6 c = 0: c) 4 d) - 4 e) does not exist c = 1: c) -2/5 d) -2/5 e) -2/5 c = 2: c) -1/4 d) -1/4 e) -1/4 c = 6: c) - 4 d) 4 e) does not exist f) x = 2; define f (2) = -1/4 g)
Chapter Answers of Brief Calculus with Integrated Precalculus - Fall 2008.wpd A - 16
Exercise Set 6.2: (Page 6 - 17)
1a) 4 and 4 b) P(x) = 7x2 + 3x - 52a) 6 and 6 b) P(x) = 63a) 4 and - 4 b) P(x) = 5x3 - 4x2 + 3x - 74a) 0 and 0 b) P(x) = 05a) 4 and - 4 b) P( x x x x) = + − +2
53 1
32 2
356a)- 4 and - 4 b) P(x) = -7x2 - 3x + 57a) and b) P(x) = 6
565
65
8a) - 4 and 4 b) P(x) = -3x + 79a) 5 and 5 b) P(x) = 510) y = 011) No horizontal asymptote; = 4 and = - 4Lim f x
x→∞( ) Lim f x
x→−∞( )
12) y = -5
Exercise Set 6.3: (Page 6 - 23)
1) 2) 3) −−43
8 9 2( )x38
2 6 2( )x +15
7 3 2( )x +
4) 5) 6) − + +
+24 12 20
6 5
2
2 2
x xx( )
21 6 27 1
2
2
x xx+ ++( )
2 14 51
4 2
2 2
x x xx
+ + ++( )
7) 8) 5x + 3 9) 10) −+16
32 2
xx( )
y x= − +23
133 y x= − −13
2 2
11a) b) c) d) e) f) −55
12x−
64x
−5
3x−−40
5 7 5( )x−+85 3( )x
−+
33 11 2( )x
11g) 12) - 4 13) -12 14) -6−9
8 4x
Exercise Set 6.4: (Page 6 - 31)
1a) (-3, 0) b) x = 0 c) y = 0 d) x = -6, 0 e) (-6, -1/12) f) Increasing: -6 < x < 0; Decreasing: x < -6 or x > 0 g) (-6, -1/12) is a relative minimum h) See below answer 4 i) -15, 15, 3, -0.5, 1, 0.1 is a good window to use2a) (0, 25/4), (5, 0) and (-5, 0) b) x = -2 and x = 2 c) y = 1 d) x = -2, 0, 2 e) (0, 6.25) f) Increasing: x > 0 ; Decreasing: x < 0 g) (0, 6.25) is a relative minimum h) See below answer 4 i) -10, 10, 1, -5, 10, 1 is a good window to use
Chapter Answers of Brief Calculus with Integrated Precalculus - Fall 2008.wpd A - 17
Answer 1h Answer 2h Answer 3h Answer 4h
Answer 5g Answer 6g Answer 7g
3a) (0, 0) and (2, 0) b) x = -1 c) y = 4 d) x = -1, ½ e) (½, -4/3) f) Increasing: x < -1 or x > ½; Decreasing: -1 < x < ½ g) (½, -4/3) is a relative minimum h) See below answer 4 i) -12, 12, 2, -2, 10, 1 is a good window to use4a) (0, -2) b) x = 2 c) y = 0 d) x = 0, 2 e) (0, -2) f) Increasing: never; Decreasing: all x g) No extrema h) See below i) -6, 6, 1, -4, 3, 1 is a good window to use
5a) (0, 0) b) x = -2 c) None d) x = -3, -2, 0 e) (-3, 27) and (0, 0) f) Increasing: x > -3; Decreasing: x < -3 g) (-3, 27) is a relative minimum h) See below i) -6, 6, 1, -10, 40, 5 is a good window6a) (0, 0) b) None c) y = 5 d) x = 0 e) (0, 0) f) Increasing: x > 0; Decreasing: x < 0 g) (0, 0) is a relative minimum h) See below i) -6, 6, 1, -2, 8, 1 is a good window7a) (0, -1.75) and (-0.745267, 0) b) x = -0.868517 and x = 1.53518 c) None (but y 6 4 as x 6 4 and y 6 - 4 as x 6 - 4) d) x = -1.48226, -0.868517, 1.53518, 2.85114) e) (-1.48226, -3.54305) and (2.85114, 3.22038) f) Increasing: x < -1.48226 or x > 2.85114; Decreasing: -1.48226 < x < 2.85114 g) (-1.48226, -3.54305) is a relative maximum and (2.85114, 3.22038) is a relative minimum h) See below i) -5, 5, 1, -10, 10, 1 is a good window
8) (0.533333, -2.65037)
Exercise Set 6.5: (Page 6 - 39)
1) The numbers are 9 and 54 and the smallest sum is 108.2) The numbers are 6.25 and 12.5 and the product is 78.125.3) The numbers are 10 and 200 and the product is 2000.4a) Least amount of fence is 240 feet; x = 60 feet and y = 120 feet. b) Greatest possible area is 20,000 square feet; x = 100 feet and y = 200 feet.5) The least possible cost is $2000. Each field is 40 feet (which is the length of the inner fence) by 25 feet.
Chapter Answers of Brief Calculus with Integrated Precalculus - Fall 2008.wpd A - 18
Exercise 7e
6) x = 1.47247 inches; Volume = 52.5138 cubic inches (x = 4.52753 is another value of x that you should have obtained. It is a positive number. Why is this value of x discarded as impossible? You should have an answer.)7) The length is 11.1647 inches and the width is 8.37355 inches.8a) 400 items; cost = $20,640; average cost = $51.60 b) 2850 items; cost = $211,698; average cost = $74.28
Exercise Set 7.1: (Page 7 - 6)
1a) 8 b) 4 c) 2 d) 32 e) 1/8 f) 1/16 g) undefined h) - 4 i) -1/4 j) undefined k) 3 l) undefined m) 27 n) 1/3 o) 8 p) -2 q) 1/64 r) 1/6 s) 125 t) 1/27
2a) b) c) d) e) f) x23 625 x
3x
−4
3x20
3 5 7 23 ( )x +15 4 14 x −
g) h) i) j) 154 1
4
5 34
xx( )−
42 4 5x +424 5
2
3
xx +
−
−
123 4 3( )x
3ia) y = 3x + 6 ib) f O(2) = -3/4; concave down iia) iib) f O(2) = -25/108; concave downy x= +5
643
4a) 13 b) -25/65a) P = $286; MP = $1.50 per item b) P = $232; MP = -$3.00 per item c) P = $300; x = 100 d) $286 e) $300
6a) 0 # x # 10,000 b) for 0 < x < 10,000dpdx x
=−
−<
12 10 000
0,
c) R = $353,553; C = $150,000; P = $203,553 MR = $35.3553 per item; MC = $20 per item; MP = $15.3553 per item d) P = $209,883; x = 5802.867a) x $ 3 b) x = 3, 7 c) (3, 6) and (7, -2) 7e) d) Relative maximum: (3, 6) Relative minimum: (7, -2) f) Absolute maximum: 16 at (28, 16) Absolute minimum: -2 at (7, -2)
Exercise Set 7.2: (Page 7 - 12)
1. (a) 0 (b) 0 (c) 0 Continuous for all real x.2. (a) -5 (b) 5 (c) does not exist Continuous for x … 0. The discontinuity is not removable.3. (a) 4 (b) 4 (c) 4 Continuous for x … 0. The discontinuity is not removable.4. (See exercise 2) 5. (See exercise 3)6. (a) 1 (b) 2 (c) 4 (d) 1 (e) 1 (f) 1 (g) 2 (h) 4 (i) does not exist (j) 4 (k) 4 (l) 4 (m) See below (n) Continuous for x … 1. The discontinuity is not removable.
Chapter Answers of Brief Calculus with Integrated Precalculus - Fall 2008.wpd A - 19
Exercise 6mExercise 7m
7. (a) 3 (b) 3 (c) 2 (a) 0 (b) 3 (c) does not exist (d) 3 (e) 3 (f) 3 (g) 3 (h) 2 (i) does not exist (m) See below (n) Continuous for x … 0, 2. The discontinuities are not removable.
Exercise Set 7.3 (Page 7 - 15)
1a&b) -5 2a&b) 4x2 3a) b) 6 6
92 2
3
3
2
3
2
xx
xx
+=
+ 3 33
2 2x yx
x yx
−=
−
4) 5) 6) 7) 8) 34
xy
2 63
2
2
− xy
− −22y xx
2 310 2
2y xy x−−
1 63 72
−−xy
x9) y = -x + 5 10) 5/8
Exercise Set 7.4 (Page 7 - 19)
1a) 45 b) 2 c) ± 2 2a) 12 b) -10 3) 44a) $27 per week b) 7 items per week c) 200 items5a) $60 per month b) 5 items per month6a) 11 square inches per minute b) 6 inches per minute 7) 6 feet per minute8a) 155 cubic inches per minute b) 112 square inches per minute9) 1.25 feet per minute 10) 530 mph
Exercise Set 7.5 (Page 7 - 24)
1a) -1/3 = -0.333; inelastic b) -1; unitary c) -3; elastic2a) -3/5 = -0.6; inelastic b) -1; unitary c) -5/3 = -1.667; elastic3a) -3/74 = -0.0405 inelastic b) -1/14 = -0.0714; inelastic4) -4.5; elastic5) -2; elastic
Chapter Answers of Brief Calculus with Integrated Precalculus - Fall 2008.wpd A - 20
Exercise Set 8.1 (Page 8 - 6)
1a) 3434.7 or 3435 people b) 3441.42 or 3441 people c) 3060 people d) 2881.2 or 2881 people e) 2650 people f) 2947.87 or 2948 people g) 2297.53 or 2298 people h) 3600.13 or 3600 people2a) Exponential growth at 15% per year; 1000 people b) Exponential growth at 1.5% per year; 2500 people c) Linear decay at 28 people per year; 1700 people2d) Exponential decay at 26% per year; 2300 people e) Exponential growth at 103% per year; 3000 people f) Linear growth at 55 people per year; 4000 people g) Exponential decay at 0.7% per year; 3210 people h) Exponential growth at 0.86% per year; 1500 people i) Exponential decay at 26.5% per year; 1200 people3a) 4.5% growth b) 6% decay c) 7% growth d) 5.4% decay4a) 2 years and 6 months b) 11 years c) 4.61467 years (If you are curious as to how to convert 4.61467 years to years, months and days, it is done as follows. The number of years is 4. The 0.61467 years is converted to months by multiplying it by 12 months/year to obtain 7.37604 months. The number of months is therefore 7. The 0.37604 months is converted to days by multiplying it by 30days/month to obtain 11.2812 days. So the result is 4 years, 7 months and 11 days, to the nearest day.)5) 9.55134 years (This corresponds to 9 years, 6 months and 18 days.)6) $49,195.517a) f (x): exponential growth at 50% per year; f (x) = 200(1.5)x; g(x) is neither h(x): linear growth of 100 people per year; h(x) = 100x + 200 b) f (x) is neither; g(x): linear decay of 200 people per year; g(x) = -200x + 600 h(x): exponential decay at 20% per year; h(x) = 640(0.8)x c) f (x): linear growth of 100 people per year; f (x) = 100x - 100; g(x): exponential growth at 100% per year; g(x) = 25(2)x; h(x) is neither8) f (x): exponential growth at 30% per year; f (x) = 591.716(1.3)x; g(x): linear growth of 300 people per year; g(x) = 300x + 400; h(x) is neither9a) y = 5x b) y = 3(4)x c) y = 2(3)x 10a) y = 3(5)x b) y = 2.6(1.5)x
Exercise Set 8.2 (Page 8 - 12)
1a) $18,242.40; 7.433% b) $18,304.05; 7.502% c) $18,346.09; 7.549% d) $18,366.70; 7.572%2) (b) is best and (a) is worst. The effective rates are a) 5.432% b) 5.452% c) 5.443%3a) $18,505.05 b) $18,655.34 c) $18,690.04 d) $18,707.00 e) $18,707.584a) $1534.69 b) $1552.71 5a) $2628.14 b) $2620.42 6a) $1282.86 b) $1282.057a) 6.5505% b) 6.5327% c) 6.7508% 8a) 9.0927% b) 8.9909% c) 9.4075%9) 26.824% 10) 6.184% 11a) 2.57651 years b) 2.56265 years12a) 8.66529 years b) 8.66434 years 13a) 13,900 cruzados b) 24.524%
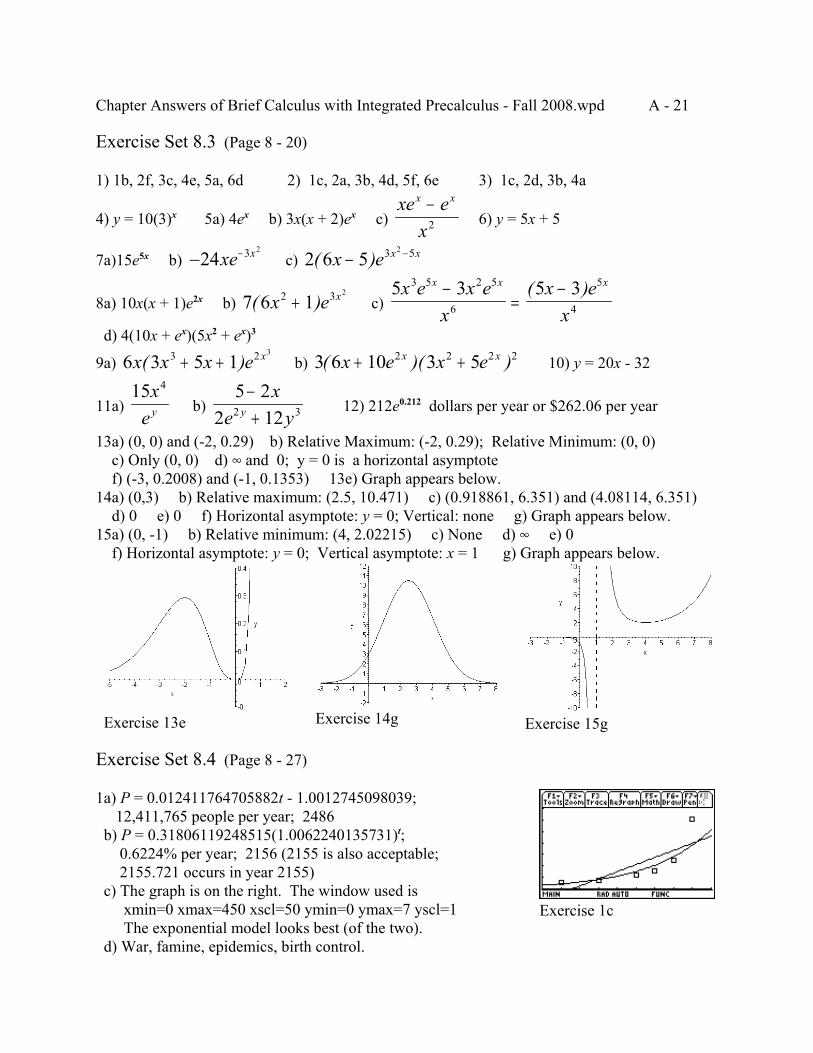
Chapter Answers of Brief Calculus with Integrated Precalculus - Fall 2008.wpd A - 21
Exercise 14g Exercise 15gExercise 13e
Exercise 1c
Exercise Set 8.3 (Page 8 - 20)
1) 1b, 2f, 3c, 4e, 5a, 6d 2) 1c, 2a, 3b, 4d, 5f, 6e 3) 1c, 2d, 3b, 4a
4) y = 10(3)x 5a) 4ex b) 3x(x + 2)ex c) 6) y = 5x + 5xe e
x
x x−2
7a)15e5x b) c) − −24 3 2
xe x 2 6 5 3 52
( )x e x x− −
8a) 10x(x + 1)e2x b) c) 7 6 12 3 2
( )x e x+5 3 5 33 5 2 5
6
5
4
x e x ex
x ex
x x x−=
−( )
d) 4(10x + ex)(5x2 + ex)3
9a) b) 10) y = 20x - 326 3 5 13 2 3
x x x e x( )+ + 3 6 10 3 52 2 2 2( )( )x e x ex x+ +
11a) b) 12) 212e0.212 dollars per year or $262.06 per year15 4x
ey5 2
2 122 3
−+
xe yy
13a) (0, 0) and (-2, 0.29) b) Relative Maximum: (-2, 0.29); Relative Minimum: (0, 0) c) Only (0, 0) d) 4 and 0; y = 0 is a horizontal asymptote f) (-3, 0.2008) and (-1, 0.1353) 13e) Graph appears below.14a) (0,3) b) Relative maximum: (2.5, 10.471) c) (0.918861, 6.351) and (4.08114, 6.351) d) 0 e) 0 f) Horizontal asymptote: y = 0; Vertical: none g) Graph appears below.15a) (0, -1) b) Relative minimum: (4, 2.02215) c) None d) 4 e) 0 f) Horizontal asymptote: y = 0; Vertical asymptote: x = 1 g) Graph appears below.
Exercise Set 8.4 (Page 8 - 27)
1a) P = 0.012411764705882t - 1.0012745098039; 12,411,765 people per year; 2486 b) P = 0.31806119248515(1.0062240135731)t; 0.6224% per year; 2156 (2155 is also acceptable; 2155.721 occurs in year 2155) c) The graph is on the right. The window used is xmin=0 xmax=450 xscl=50 ymin=0 ymax=7 yscl=1 The exponential model looks best (of the two). d) War, famine, epidemics, birth control.
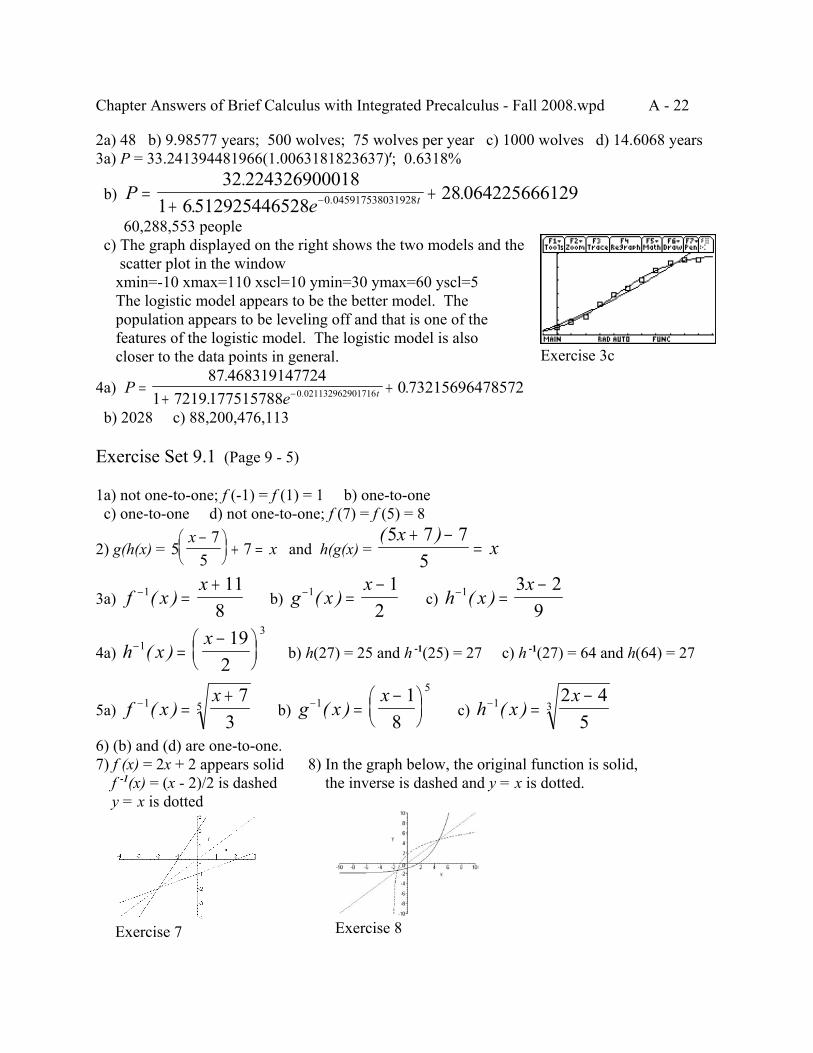
Chapter Answers of Brief Calculus with Integrated Precalculus - Fall 2008.wpd A - 22
Exercise 3c
Exercise 7 Exercise 8
2a) 48 b) 9.98577 years; 500 wolves; 75 wolves per year c) 1000 wolves d) 14.6068 years3a) P = 33.241394481966(1.0063181823637)t; 0.6318%
b) Pe t=
++−
32 2243269000181 6512925446528
28 0642256661290 045917538031928
..
..
60,288,553 people c) The graph displayed on the right shows the two models and the scatter plot in the window xmin=-10 xmax=110 xscl=10 ymin=30 ymax=60 yscl=5 The logistic model appears to be the better model. The population appears to be leveling off and that is one of the features of the logistic model. The logistic model is also closer to the data points in general.
4a) Pe t=
++−
87 4683191477241 7219177515788
0 732156964785720 021132962901716
..
..
b) 2028 c) 88,200,476,113
Exercise Set 9.1 (Page 9 - 5)
1a) not one-to-one; f (-1) = f (1) = 1 b) one-to-one c) one-to-one d) not one-to-one; f (7) = f (5) = 8
2) g(h(x) = and h(g(x) = 57
57
xx
−
+ =
( )5 7 75
xx
+ −=
3a) b) c) f xx− =+1 118
( ) g xx− =−1 12
( ) h xx− =−1 3 29
( )
4a) b) h(27) = 25 and h -1(25) = 27 c) h -1(27) = 64 and h(64) = 27h xx− =−
1319
2( )
5a) b) c) f xx− =+1 5
73
( ) g xx− =−
151
8( ) h x
x− =−1 3
2 45
( )
6) (b) and (d) are one-to-one.7) f (x) = 2x + 2 appears solid 8) In the graph below, the original function is solid, f -1(x) = (x - 2)/2 is dashed the inverse is dashed and y = x is dotted. y = x is dotted
Chapter Answers of Brief Calculus with Integrated Precalculus - Fall 2008.wpd A - 23
Exercise Set 9.2 (Page 9 - 9)
1a) 3 b) 4 c) 3x + 5 d) 4x - 8 2a) 3 b) 5/2 c) 2 d) 1/23a) 3/2 b)4 c) 5 d) 4 4a) 4 b) 2 c) 2/3 d) 1/25a) 10x + 14 b) 12x - 9 c) x + 2 d) 2x + 56a) b) c) d) 4 98 8log logx y+ 1 3+ log x 6 23 3log logx y− 4 2
32 2log logx y+
7a) ; this cannot be simplified further since it is a sum.9 2 3log( )x y+ b) 3 + 8 log x c) d) 5
2 7 7 73log log logx y z− − 8 2 215+ + +ln ln lnx y z
8a) 2.60206 b) -0.60206 c) 1.80618 d) -2.39794 e) 2.204129a) -0.69897 b) -1.39794 c) 3.90309
Exercise Set 9.3 (Page 9 - 14)8 2 25
2+ + +ln ln lnx y z
1a) b) c) 1 + ln x 2) y = x - 1 3) 5x
78 7 8
− =−
xxx
−22x
4a) b) = c) 3 6x x x+ ln15
15 6
3 2
ln
( ln )
xxx
x
−+
5 5 23 2
x x xx x
ln(ln )− − 12 2(ln )x
x
d) x x
xx x
x x x x x xx
2 2 26 72 6
6 7 2 6+ −+ + =
+ − + +( )ln
ln ln
e) or 4 62 2 2x x x xln (ln )+ 2 2 32x x x( ln )ln+
5) 6a) b) 1x
155 7x −
8 14 87 8 52
( )xx x
++ −
7a) b) 155 1
6 5 12x
xx x
++ +ln( )
15 3 5 3 2 3 23 2 5 1 2
x x xx x
+ − − −− +( )ln( )
( )( )
c) d) 36 3 7
3 7
2(ln( ))xx
−−
363 7x −
8a) or b) or 1 6
2 1x x+
−8 12 1x
x x−−( )
45
44 9x x−
−+
12 565 4 9
xx x
+− +( )( )
9a) b) c) ex
e xx
x5
55 3+ ln63 1
8 3 18 2
28 2 2xe
xe x
xx
++
−+ −ln( )
e xe xxe
x x
x
9 9
189 7− ln
10) y = 2x
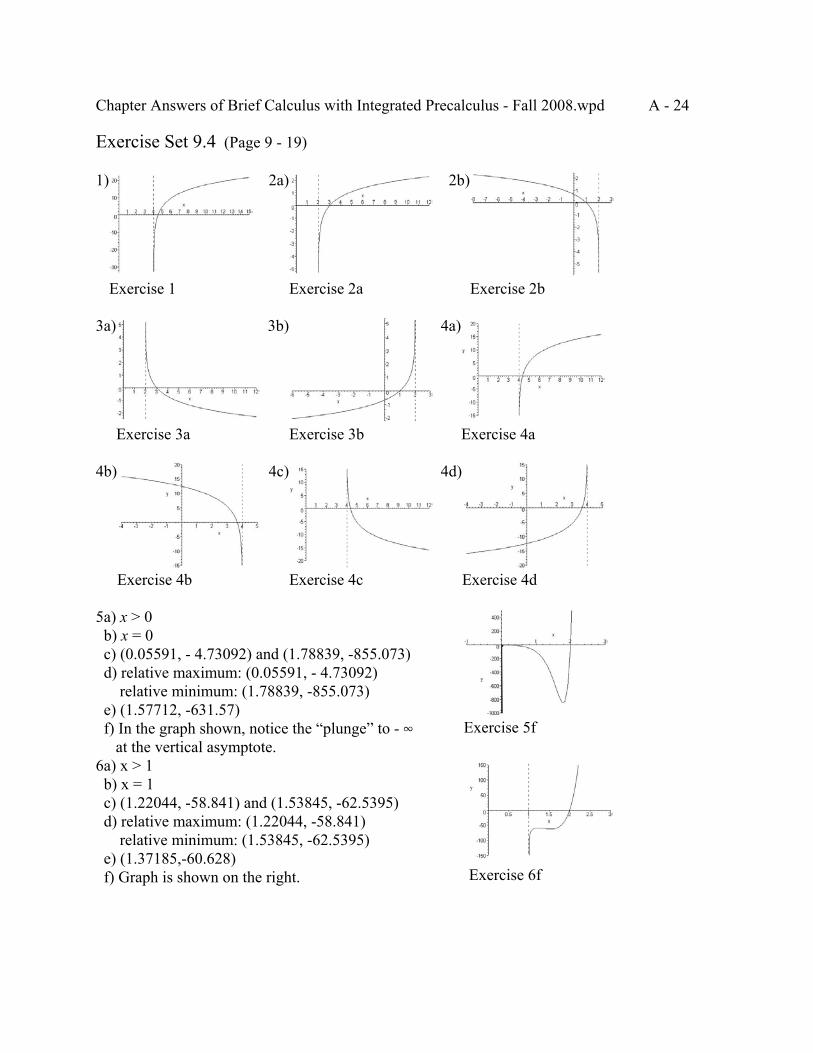
Chapter Answers of Brief Calculus with Integrated Precalculus - Fall 2008.wpd A - 24
Exercise 5f
Exercise 6f
Exercise Set 9.4 (Page 9 - 19)
1) 2a) 2b)
Exercise 1 Exercise 2a Exercise 2b
3a) 3b) 4a)
Exercise 3a Exercise 3b Exercise 4a
4b) 4c) 4d)
Exercise 4b Exercise 4c Exercise 4d
5a) x > 0 b) x = 0 c) (0.05591, - 4.73092) and (1.78839, -855.073) d) relative maximum: (0.05591, - 4.73092) relative minimum: (1.78839, -855.073) e) (1.57712, -631.57) f) In the graph shown, notice the “plunge” to - 4 at the vertical asymptote.6a) x > 1 b) x = 1 c) (1.22044, -58.841) and (1.53845, -62.5395) d) relative maximum: (1.22044, -58.841) relative minimum: (1.53845, -62.5395) e) (1.37185,-60.628) f) Graph is shown on the right.
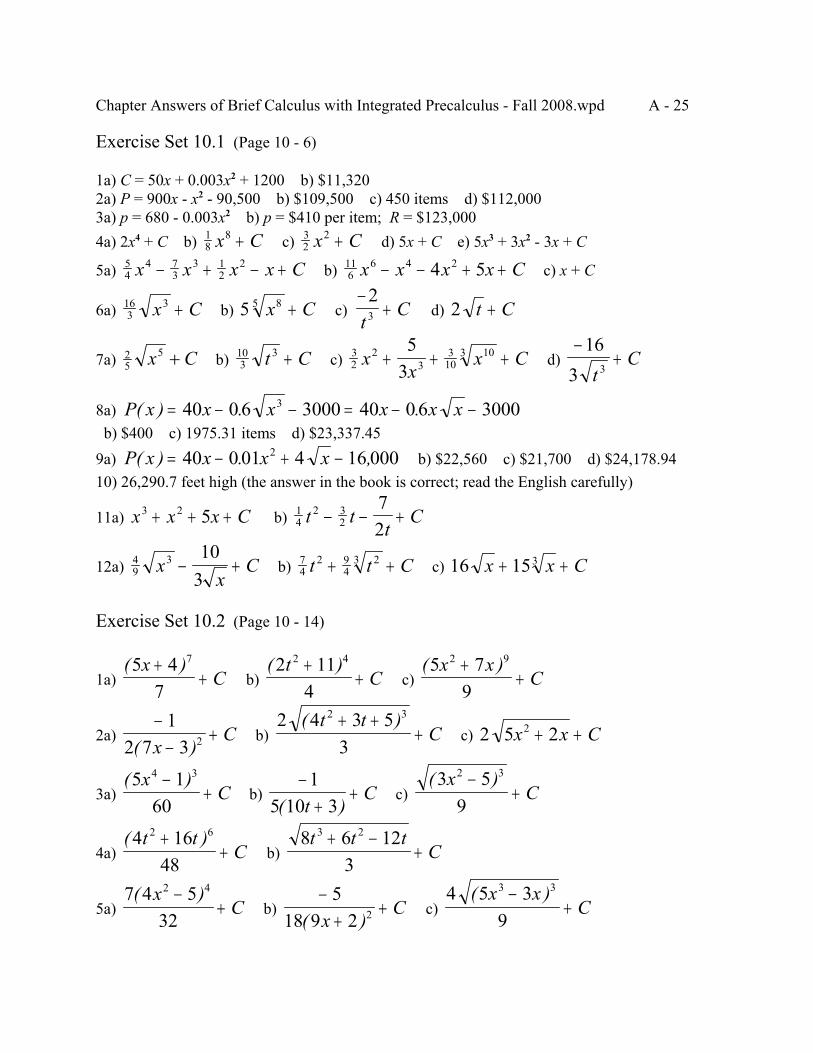
Chapter Answers of Brief Calculus with Integrated Precalculus - Fall 2008.wpd A - 25
Exercise Set 10.1 (Page 10 - 6)
1a) C = 50x + 0.003x2 + 1200 b) $11,3202a) P = 900x - x2 - 90,500 b) $109,500 c) 450 items d) $112,0003a) p = 680 - 0.003x2 b) p = $410 per item; R = $123,0004a) 2x4 + C b) c) d) 5x + C e) 5x3 + 3x2 - 3x + C1
88x C+ 3
22x C+
5a) b) c) x + C54
4 73
3 12
2x x x x C− + − + 116
6 4 24 5x x x x C− − + +
6a) b) c) d) 163
3x C+ 5 85 x C+−
+23t
C 2 t C+
7a) b) c) d) 25
5x C+ 103
3t C+ 32
23
310
10353
xx
x C+ + +−
+16
3 3tC
8a) P x x x x x x( ) . .= − − = − −40 0 6 3000 40 0 6 30003
b) $400 c) 1975.31 items d) $23,337.459a) b) $22,560 c) $21,700 d) $24,178.94P x x x x( ) . ,= − + −40 0 01 4 16 0002
10) 26,290.7 feet high (the answer in the book is correct; read the English carefully)
11a) b) x x x C3 2 5+ + + 14
2 32
72
t tt
C− − +
12a) b) c) 49
3 103
xx
C− + 74
2 94
23t t C+ + 16 153x x C+ +
Exercise Set 10.2 (Page 10 - 14)
1a) b) c) ( )5 4
7
7xC
++
( )2 114
2 4tC
++
( )5 79
2 9x xC
++
2a) b) c) −−
+1
2 7 3 2( )xC
2 4 3 53
2 3( )t tC
+ ++ 2 5 22x x C+ +
3a) b) c) ( )5 1
60
4 3xC
−+
−+
+1
5 10 3( )tC
( )3 59
2 3xC
−+
4a) b) ( )4 16
48
2 6t tC
++
8 6 123
3 2t t tC
+ −+
5a) b) c) 7 4 5
32
2 4( )xC
−+
−+
+5
18 9 2 2( )xC
4 5 39
3 3( )x xC
−+
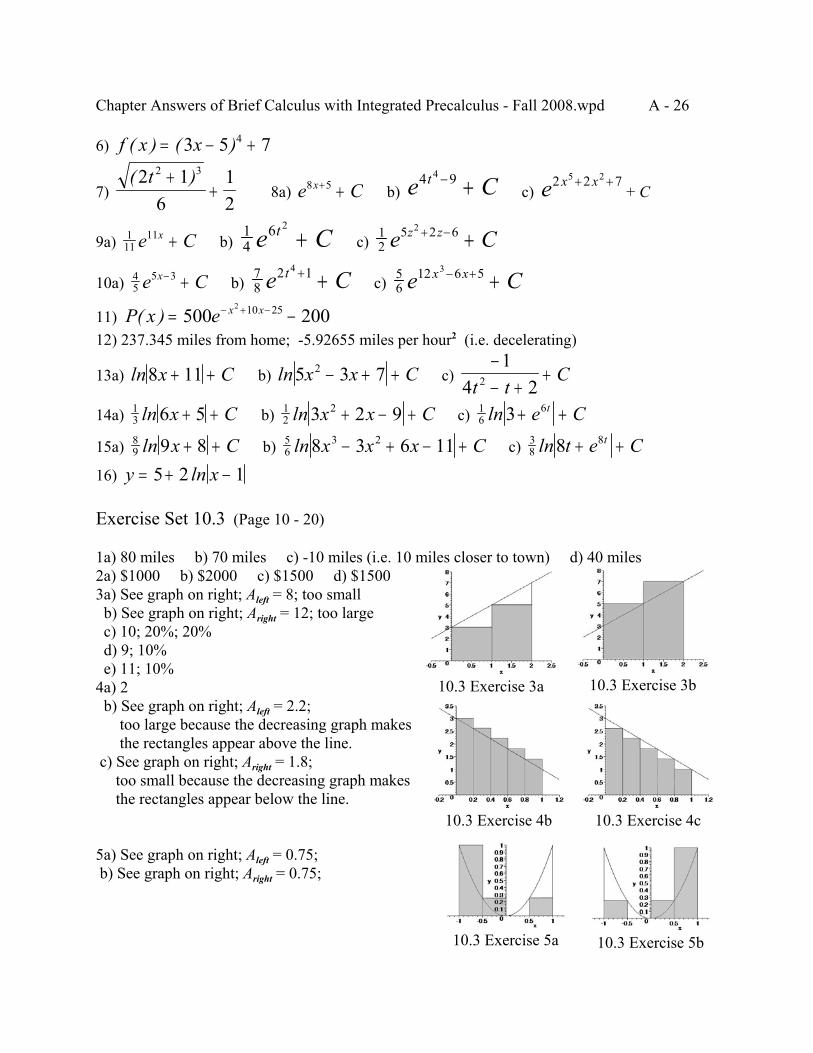
Chapter Answers of Brief Calculus with Integrated Precalculus - Fall 2008.wpd A - 26
6) f x x( ) ( )= − +3 5 74
7) 8a) b) c) + C( )2 1
612
2 3t ++ e Cx8 5+ + e Ct4 94 − + e x x2 2 75 2+ +
9a) b) c) 111
11e Cx + 14
6 2
e Ct + 12
5 2 62
e Cz z+ − +
10a) b) c) 45
5 3e Cx− + 78
2 14
e Ct + + 56
12 6 53
e Cx x− + +11) P x e x x( ) = −− + −500 200
2 10 25
12) 237.345 miles from home; -5.92655 miles per hour2 (i.e. decelerating)
13a) b) c) ln8 11x C+ + ln5 3 72x x C− + +−− +
+1
4 22t tC
14a) b) c) 13 6 5ln x C+ + 1
223 2 9ln x x C+ − + 1
663ln + +e Ct
15a) b) c) 89 9 8ln x C+ + 5
63 28 3 6 11ln x x x C− + − + 3
888ln t e Ct+ +
16) y x= + −5 2 1ln
Exercise Set 10.3 (Page 10 - 20)
1a) 80 miles b) 70 miles c) -10 miles (i.e. 10 miles closer to town) d) 40 miles2a) $1000 b) $2000 c) $1500 d) $15003a) See graph on right; Aleft = 8; too small b) See graph on right; Aright = 12; too large c) 10; 20%; 20% d) 9; 10% e) 11; 10%4a) 2 b) See graph on right; Aleft = 2.2; too large because the decreasing graph makes the rectangles appear above the line. c) See graph on right; Aright = 1.8; too small because the decreasing graph makes the rectangles appear below the line.
5a) See graph on right; Aleft = 0.75; b) See graph on right; Aright = 0.75;
10.3 Exercise 3b10.3 Exercise 3a
10.3 Exercise 4b 10.3 Exercise 4c
10.3 Exercise 5b10.3 Exercise 5a
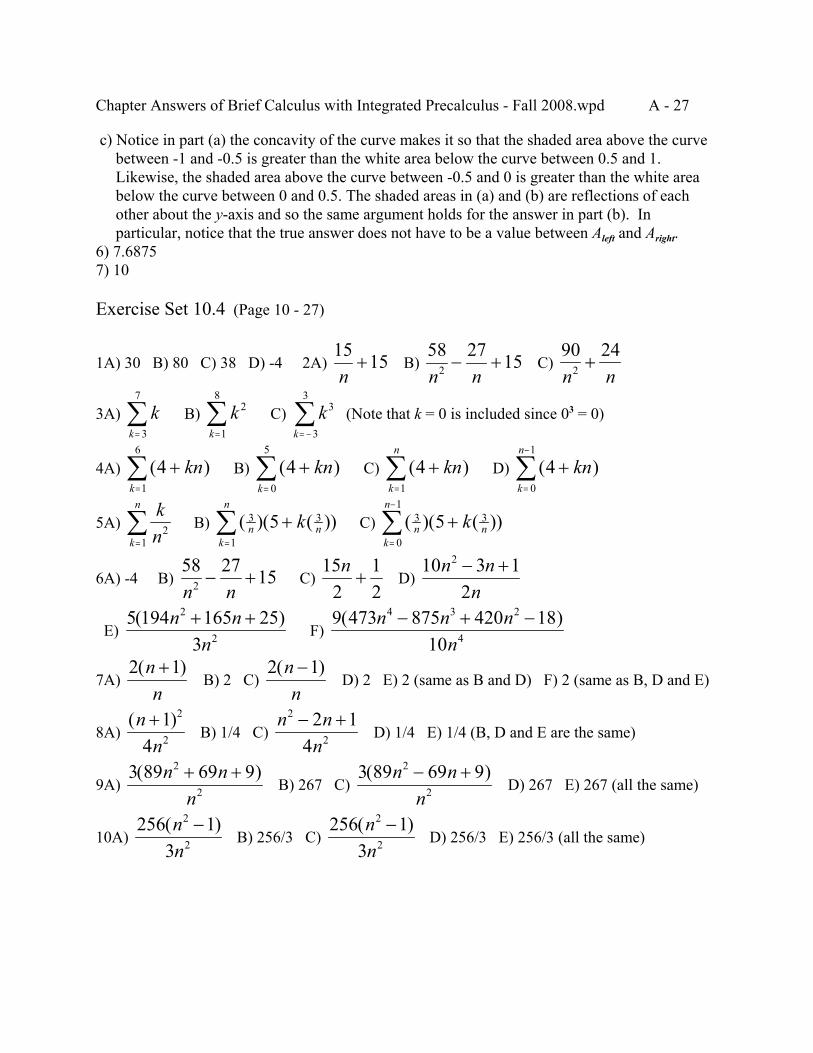
Chapter Answers of Brief Calculus with Integrated Precalculus - Fall 2008.wpd A - 27
c) Notice in part (a) the concavity of the curve makes it so that the shaded area above the curve between -1 and -0.5 is greater than the white area below the curve between 0.5 and 1. Likewise, the shaded area above the curve between -0.5 and 0 is greater than the white area below the curve between 0 and 0.5. The shaded areas in (a) and (b) are reflections of each other about the y-axis and so the same argument holds for the answer in part (b). In particular, notice that the true answer does not have to be a value between Aleft and Aright.6) 7.68757) 10
Exercise Set 10.4 (Page 10 - 27)
1A) 30 B) 80 C) 38 D) -4 2A) B) C) 15 15n+
58 27 152n n− +
90 242n n+
3A) B) C) (Note that k = 0 is included since 03 = 0)kk=∑
3
7
kk
2
1
8
=∑ k
k
3
3
3
= −∑
4A) B) C) D) ( )41
6
+=∑ knk
( )40
5
+=∑ knk
( )41
+=∑ knk
n
( )40
1
+=
−
∑ knk
n
5A) B) C) knk
n
21=∑ ( )( ( ))3 3
1
5n nk
n
k+=∑ ( )( ( ))3 3
0
1
5n nk
n
k+=
−
∑
6A) -4 B) C) D) 58 27 152n n
− +15
212
n+
10 3 12
2n nn− +
E) F) 5 194 165 25
3
2
2( )n n
n+ + 9 473 875 420 18
10
4 3 2
4( )n n n
n− + −
7A) B) 2 C) D) 2 E) 2 (same as B and D) F) 2 (same as B, D and E)2 1( )n
n+ 2 1( )n
n−
8A) B) 1/4 C) D) 1/4 E) 1/4 (B, D and E are the same)( )n
n+1
4
2
2n n
n
2
22 1
4− +
9A) B) 267 C) D) 267 E) 267 (all the same)3 89 69 92
2( )n n
n+ + 3 89 69 92
2( )n n
n− +
10A) B) 256/3 C) D) 256/3 E) 256/3 (all the same)256 1
3
2
2( )nn− 256 1
3
2
2( )nn−
Chapter Answers of Brief Calculus with Integrated Precalculus - Fall 2008.wpd A - 28
Exercise Set 10.5 (Page 10 - 33)
1a&b) 16 c&d) 82a) 10 b) 8 c) Part (b) produces the signed area and not the area. The area between x = -1 and x = 0 is below the axis and the area between x = 0 and x = 3 is above the axis. So part (b) equals signed area = - area below axis + area above axis = -1 + 9 = 8.3a) 68 b) 56 4a) -16 b) 36 5a) 4 b) 3
77 1 469 557( ) .e − =
6a) ln 6 = 1.79176 b) c) 8− = −12 21 152226ln .
7) 28 8) 10 9) 8 10) 34/3 11) 12) 8323
Exercise Set 10.6 (Page 10 - 39)
1) = 21.3333 2) = 20.8333 3) = 57.1667 4) = 0.5643
1321= 125
65620= 343
61657= 1
2
5a) (-4, -8), (0, 0) and (3, 6) b) 9376a) (-2, 0), (-1, 1), (0, 2) and (1, 3) b) = 1.6333349
3019301=
7a & b) = 13.5 8) 12272
1213=
Exercise Set 10.7 (Page 10 - 45)
1a) -16 ft/sec (negative due to the fact that at t = 4 the ball has been going back down) b) s = -16t2 + 64t + 80 Y ∆s/∆t = (80 - 128)/(4 - 1) = -16 ft/sec2) 76/5 = 15.2 mph 3) 1 4) 635a) $1800 b) $1350 6a) $800 b) $6007a) 4p - 20x = 80 is supply and 2p + 8x = 130 is demand b) $50 c) $62.508a) is demand and is supply b) $27 c) $542 6 94p x+ = 3 18 60p x− =9a) 9 b) 6
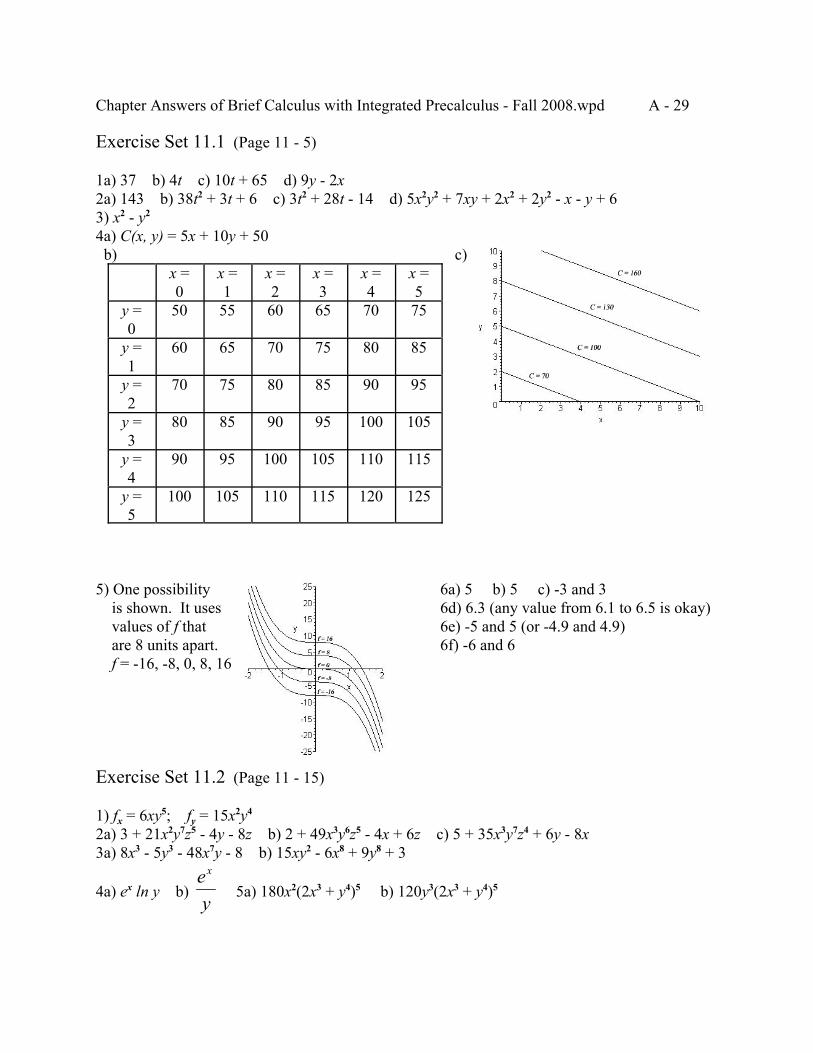
Chapter Answers of Brief Calculus with Integrated Precalculus - Fall 2008.wpd A - 29
Exercise Set 11.1 (Page 11 - 5)
1a) 37 b) 4t c) 10t + 65 d) 9y - 2x2a) 143 b) 38t2 + 3t + 6 c) 3t2 + 28t - 14 d) 5x2y2 + 7xy + 2x2 + 2y2 - x - y + 63) x2 - y2
4a) C(x, y) = 5x + 10y + 50 b)
x =0
x =1
x =2
x =3
x =4
x =5
y =0
50 55 60 65 70 75
y =1
60 65 70 75 80 85
y =2
70 75 80 85 90 95
y =3
80 85 90 95 100 105
y =4
90 95 100 105 110 115
y =5
100 105 110 115 120 125
c)
5) One possibility 6a) 5 b) 5 c) -3 and 3 is shown. It uses 6d) 6.3 (any value from 6.1 to 6.5 is okay) values of f that 6e) -5 and 5 (or -4.9 and 4.9) are 8 units apart. 6f) -6 and 6 f = -16, -8, 0, 8, 16
Exercise Set 11.2 (Page 11 - 15)
1) fx = 6xy5; fy = 15x2y4
2a) 3 + 21x2y7z5 - 4y - 8z b) 2 + 49x3y6z5 - 4x + 6z c) 5 + 35x3y7z4 + 6y - 8x3a) 8x3 - 5y3 - 48x7y - 8 b) 15xy2 - 6x8 + 9y8 + 3
4a) ex ln y b) 5a) 180x2(2x3 + y4)5 b) 120y3(2x3 + y4)5ey
x
Chapter Answers of Brief Calculus with Integrated Precalculus - Fall 2008.wpd A - 30
6a) b) 7a) b) e
xye xy
xyxy
333 2+ ln
ey
xe xyxy
xy3
33 2+ ln 25y
25 2
xy
8a) A relative maximum of f = 11 occurs at (2, 3). (Any value between 10 and 12 is okay.) b) 8 c) + d) 0 e) 4 f) - g) 0 h) - i) + j) 0 k) 09a) f = 7 at (0, -6) b) f = -7 at (0, 6) c) - d) + e) + f) + g) + h) + i) - j) + k) - l) - m) + n) - o) 0 p) + q) 0 r) -10a) Neither b) Substitutes c) Complementary d) Complementary e) Substitutes11a) Substitutes b) Neither c) Complementary
Exercise Set 11.3 (Page 11 - 22)
1a) (10/3, -14/3) b) (1, 0)2a) fxx = 10 + 18xy; fxy = 9x2; fyy = -84y2 b) fxx = 36x - 2y3; fxy = -6xy2; fyy = -6x2y + 40y3
3) = 2 + 9y2e3xy; = 9xye3xy + 3e3xy; = 9x2e3xy∂∂
2
2
zx
∂∂
2zxy
∂∂
2
2
zy
4a) Relative minimum: (-2, 3, -6) (The relative minimum is -6 and it occurs at (-2, 3).) b) Saddle point (4, -5, 12) c) Relative maximum: (3, 1, 5) (The relative maximum is 5 and it occurs at (3, 1).)5a) Saddle point (2, 4, 51) b) Relative minimum: (2, 4, -53) (The relative minimum is -53 and it occurs at (2, 4).) c) Relative maximum: (1, -3, 16) (The relative maximum is 16 and it occurs at (1, -3).)6) The maximum profit is $211.50 and it is obtained when p1 = $18.00 and p2 = $25.00.7) Relative minimum (1, 4, 10) (The relative minimum is 10 and it occurs at (1, 4).)8) Saddle point: (-2, 4, 12); Relative minimum: (2, 4, -20) ( Relative minimum is -20 at (2, 4))
Exercise Set 11.4 (Page 11 - 27)
1) The minimum is 705 and it occurs at (10, 9) 2) The maximum is 13 and it occurs at (2, 1)3) The minimum is -80 and it occurs at (-2, 8)4) The largest total area is 8000 square feet with each field 80 by 50 feet (middle fence 80 feet)5) Minimum is 40 occurring at (4, 1) 6) Minimum is 48 occurring at (3, 2)7) Maximum is 16 occurring at (2, 2, 3)