Embed Size (px)
Citation preview

41KMNE0048 OM92-O39 FOSTER 010
BRIEF ON WORK DONE
UNDER
OM92-039 OTT CLAIM SS605899
The work done for O.MIP File fOM92-039 was done exclusively on
Claim #5605899 in the South West portion of Part Lot 6, Concession
III of Foster Township, between latitudes 48O 12' and 48O 16* and
longitudes 450000C E15 and 450000 E20 . The work entailed the
following:
1. Stripping and trenching were done exclusivelyin the areas of Eg+09, ES +09, E7+09, E7+08 in
,/ the vacinity of an outcroppino. Three discontinuous viens of Breciated Rock was discovered along a plateau between Eg+06 - Es+06 and Eg+07 - E7+07, ^y a metal detector in the non-ferrous mode . .Several samples were taken from thisrarea and vrere analyzed for gold. The results were very encouraging.
Also, many samples were taken from an area Ejj+09- 10 where the metal detector in the non-ferrous mode found a strip of outcropping which contained many ribbons of pyrite disseminated throughout the rock itself.
These samples were analyzed for gold and the results were encouraging. Further, these samples were crushed and pulverized and fire assayed at Michigan Technological University. The results i-rare lower than the atomic absorption (A.A.) analysis but suggestions were made that bigger samples should be taken to get4better representative sample.
2. Some stripping and trenching was done in the area of W5+08 and We+09. Samples were taken from the outcropping ana some were taken from displaced boulders.

3. Mappincr of the areas was done in the vacinitv of Eg+08 - Eg+10; alonq lines So and EI; W2+00- W2*02 to EI+OO - EH-01 and W5*OS-W5*09 to W4+08-W4+09.
4. Soil samples were taken alonq lines So and EI.
5. Rocks wereftfrused, qrinded, and pulverized with /f Gardner Denver Crusher, Roller Grinder and Pulverizer.
6. Samples were digested in Aqua Reqia
7. Samples were analyzed in a Perkin-Elmer #604 Atomic Absorption Spectrometer. (See enclosed method)
8. Soil samples from lines Eg and Ej wereextensively tested for acidity, potassium, phosphorus, nitroaen. Iron II and Iron III. No soil sample crave any indication of Iron II and Iron III.
Under the present data submitted, larqer samples of rock
would have to be taken from the areas showinq the best qold
results. The response of the Metal Detector to the rock is
stronq enouqh to indicate that there is somethinq in the host
rock. Perhaps it may be another metal other than qold. Further
work is suqqested in the form of blastinq usinq a pluqqer in order
to qet larqer representative samples from the host rock.
SUBMITTED: FEBRUARY 12, 1993 Yours truly,
Kenneth Naples Prospector

DISCUSSION O*1 RESULTS
Analysis of soil samoles taken along the lines Eg and E -j
were encouraainq. Analysis of rock samoles taken from the
ontcropoina between lines E7 and Eg between E7 4- 06 - Eg + 10
were very encouraainq.
Since literature on deoosition of metals is oH deoendent,
an analysis of soil samoles for oH, could he an interesting
study. A profile of variation of pH in the soil along each
line could be used to correlate the soil tests results for
total metals.
Analysis of soil samoles alono line E?) from stations E fi + 0 0
to Eq 4- 14 correlated well with original analysis usino the same9
method with the exception of EQ 4 03, Eft + 09. This affords
another oooortunity to check other stations on other lines to
test the reliability of the reaaents usino the Geochemical Tests.
Rock samoles taken *rom station 1*75 + 9 R and between lines
E7 and Eg and soecifically between stations E7 4- 06 - 137 -l- 07
and Eg 4- 09 - Eg 4 10 were tested with the Geochemical Kit using
Dithizone. All samples showed medium concentrations of total
metals xvith the excention of E7 * 06, samole 2, stations W5 * OB
which showed exceptional -concentrations. This station E7 4- 06
is at the Northern edoe of the outcrooning.
Since our standard showed a purole colour with Iron III
oxide, all of the above rock samoles were tested for the Ferric
(Iron III) and **errous (Iron II) ions, by usina Potassium
Ferrocynide and Potassium ^erric Cvanate, respectively.

All rock samoles did not show a nositive test for either the
Iron III or the Iron II ion; thus, ruling out that the nurole colour
in our Heo-Test for total metals may have come from the nresence of
Iron.
The results tabulated in Table 2 sugoested that further
investigation and analysis for total metals and ooid should be
continued in these areas.
Rock samples taken from a rock outcropping between lines Eg
and Eg at stations Eg * 09 and Eg + 1 0 and Eg + 10 showed very high
values during the first set of runs. (See Table f3) However, when
the tests were reoeated with the atomic absorntion the results were
significantly lower. (Samnles 1,2,3)
These same samoles were submitted to Michigan Technological
University's Deoartment of Metallurgy and were fire assayed. (See
results on letter head) The results obtained in Samole 3 gave
results sianificantly lower than that produced by the A.A. in Trial
2. (See Table 3) The Sample H submitted as a solid rock was also
fire assayed and the results showed that there was very little Gold.
This samole was taken from the vacinity of Stations Eg +09 and Eg +
09 and Eg -i- 09 and Eg * 10. The samole showed small amounts of
pyrite in ribbon ^rom throughout the samole and gave a strong
response to the metal detector in the non ferrous mode. The sample
was tentatively identified as a stretched conglomerate.
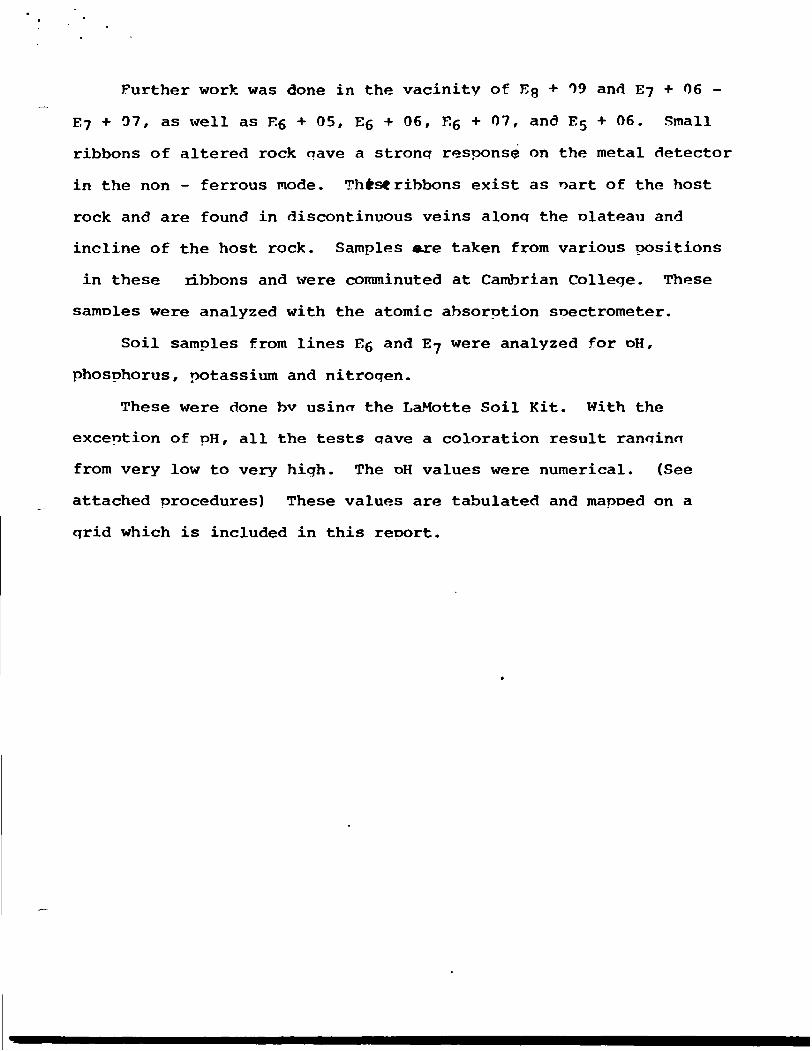
Further work was done in the vacinity of Eg * 09 and E -j + 0 6 -
E-j + 0 7, as well as Eg * 0 5, Eg * 06, Eg * 0 7, and E5 + 06. Small
ribbons of altered rock nave a stronq response on the metal detector
in the non - ferrous mode. Thts* ribbons exist as nart of the host
rock and are found in discontinuous veins along the olateau and
incline of the host rock. Samples are taken from various positions
in these ribbons and \vere comminuted at Cambrian College. These
samples were analyzed with the atomic absorption soectrometer.
Soil samples from lines Eg and E -j were analyzed for oH,
phosphorus, potassium and nitrogen.
These were done bv usinrr the LaMotte Soil Kit. With the
exception of pH, all the tests qave a coloration result ranqina
from very low to very high. The oH values were numerical. (See
attached procedures) These values are tabulated and mapped on a
grid which is included in this report.

SUMMARY: AND SUGGESTIONS FOP. ^URTHER WORK
The work that has been done "on Claim S605899 was more extensive
than any other year. The extent of the work was done in the vacinity
of Eg * 0 9 - Eg * 19 areas. It is interesting to note that the Metal
Detector has been an indispensable instrument in locatina such
anomalies, particularly when it is olaced in the non-ferrous mode.
f tore intense work incorporatincr the use of a pluacrer, blasting
and mucking. In order to get laroer samnles from the outcroooing
and host rock would be more beneficial, and would aive more
reoresentative results of the location.
Also, more work in pH, PO4~3, K"1", N2 testina could be done to
see if any relationship could be found between the concentrations
of these types of ions present in the soil and the denosit of metals
in the soil.
The bulk of future work will be taking more rock samples from
other areas such as W 5 * 0 8 etc. These samples will be comminuted
and analyzed by the A.A. method as well as the total metals method
using Dithizone.
The concentrations of total metals indicated the amounts of
lead, copper, zinc, tunasten and molvbdenum present while the more
sophisticated methods involving atomic absorotion and fire assays
will indicate gold levels on the property.

107
GOLD - ATOMIC ABSORPTION
Key Words
acid decomposition, filtration, ketone extraction, atomic absorption measurement
Contributors
*Dome Mines Ltd.British Newfoundland Exploration Ltd. Campbell Chibougamau Mines Ltd. Giant Yellowknlfe Mines Ltd.Kam Kotia Mines Ltd., Cobalt Refineries Division Pamour Porcupine Mines Ltd. Sigma Mines (Que.) Ltd. Wright-Hargreaves Mines Ltd., Wasamac Division
Outline
The sample is leached with aqua regia at room temp erature and, following filtration and washing of the insoluble residue, the gold is extracted from the filtrate with methyl isobutyl ketone (MIBK) and atomized directly in the organic medium. Although the sample is usually not completely soluble in aqua regia, the gold is effectively leached if the sample is adequately ground, although certain types of sample material may require a preliminary roasting step.
Apparatus
Atomic absorption spectrophotometer, Perkin-Elmer, Model 303, equipped with a digital concentration readout
Beakers, pyrex, tall form, 200 mlShaking apparatus, oscillating typeFlasks, Erlenmeyer, 125 mlFunnels, Buchner, 7 cmVacuum facility for filteringFilter paper, Whatman No. 3, 55 cmDispensing pipette (Schuco)Polyethylene stoppers, No. 5Mechanical shakerCylinder, acetylene
fbasic procedure supplied by J. Tweed, Chief Chemist

109
Dally working standards
#1 working standard
Measure by burette (very accurately) 10 ml of the stock standard Into a 200 ml volumetric flask. Add 5 ml of aqua reg!a, dilute to volume with distilled water and mix well (l ml - 0.03333 mg Au relative to Assay-Ton) .
#2 working standard
Measure by burette (very accurately) l ml of stock standard Into a 200 ml volumetric flask. Add 5 ml of aqua reg!a, dilute to volume with distilled water and mix well (l ml - 0.003333 mg Au relative to Assay-Ton) .
#3 working standard
Measure by burette very accurately 20 ml of #2 work- Ing standard Into a 200 ml volumetric flask. Add 5 ml of aqua reg!a, dilute to volume with distilled water and mix well (l ml - 0.0003333 mg Au relative to Assay-Ton) .
Instrumental - operating parameters
Wave length - 2428 mn Silt setting - 4 Current setting - 15 mill!ampsGain control - Set gain control switch (after warm-
up) until the energy meter needle is just in the black left of centre.
Fuel setting - 2.5 (reading taken from the middle (acetylene) of the white ball). Acetylene
pressure at the tank, 8 psig. Meter setting - 14 psi (on the dial)
(air)Instrument set- -5.5 ting (air)Flame - maintain as low as possible without
lift-off.

Ill
Modifications
General
Most of the contributors use similar procedures, with wide variations being found in the amount of acid used for acid digestion, and in the acidity present (3 to 4(^) for the ketone extraction. Erlenmeyer flasks are usually used for the extraction, which is normally carried out using 100 ml aqueous volume and 10 to 15 ml of MIBK. In some mines, analysed samples are run with the regular samples and used as standards but most mines use pure gold solutions as standards. Some contributors have found it advisable to scrub the organic fraction with dilute hydrochloric acid to remove contaminants but most of the contributing mines do not use this technique.
1. Campbell Chlbougamau, copper ore, takes a small portion of the sample filtrate for analysis of copper, as well as for iron, zinc, cobalt, etc., when required. They use a special Diluter (Fisher) for this purpose.
2. Kam Kotia Mines (Cobalt Refinery Division) uses a 30 minute leach with hot aqua regia, and uses 250 ml separatory funnels for the ketone extraction step.
3. Wasamac Mines heats the sample below boiling with 20 ml of aqua regia, then allows the sample to stand at room temperature for l hour. Solution samples are acidified with HC1, with solid KMnO4 added to aid in destroying cyanide complexes.
4. British Newfoundland Exploration Ltd., uses a leach with hot aqua regia and hydrofluoric acid, then bromine water. Hydrobromic acid is added before the ketone extraction.
5. Pamour Mines, gold ore, uses HC1 and KMnO4 to destroy cyanide complexes on mill solution samples. Analysed samples are run along with the regular samples for comparison calculation. High value mill concentrates and cyanide head samples are calcined at 940 0 to HOOT for 30 minutes before acid leaching. A fire assay procedure is still being used for pregnant solutions, as well as for slags and bullion.
6. Giant Tellowknlfe Mines adds a little HP with the aqua regia for solid samples. Sulphide mill concentrates are treated with nitric acid alone before aqua regia attack. Roasted samples and high-grade dusts are treated with HC1 and

113
References
1. J. Gillies and D. T. Semple, "Proceedings of the 5thAnnual Meeting of Canadian Gold Metallurgists", Dept. of Energy, Mines and Resources, Ottawa, 1968.
2. F. W. E. Strelow, E. C. Feast, P. M. Matthews, C. J. C. Bo t bma and C. R. VanZyl, Anal. Chem., 38, pp 115-7 (1966).
3. R. J. Guest, IR 70-57, Extraction Metallurgy Division,Mines Branch, Dept. of Energy, Mines and Resources, Ottawa, 1970.
4. R. J. Guest, IR 69-45, Extraction Metallurgy Division,Mines Branch, Dept. of Energy, Mines and Resources, Ottawa, 1969.
5. R. C. Hallett, Minerals Sci. Engng., 2 , No. 3, pp 28-37, 1970.
Note
(a) Since May 1971, Dome Mines Ltd. has used one filtering box (previously three rotating filtering tables) to accommodate a tray of 30 Erlenmeyer flasks. Each flask has a 1/2" hinged plexiglass cover through which project 30 Buchner polyethylene funnel steras that separate from the funnel for cleaning pur poses. Vacuum is supplied by a Bex Engineering Co. venturi system using mine air expelled to atmosphere. Pressure is reduced to 16" mercury from 5" in the previous system. Filtering time is greatly reduced.

When comparing a loM color with a color chan stand with l he light source coming from In-hind and hold the leM tube one-half inch .iwav from the color chart.
If the color ot a lest reaction falls be tween two standard colors on a color chan. I he mid-point between the two stan dard values is taken as the test result. For example, a pH test color reaction falling between ihc standard colors for pH 4-0 and pH S.O represents a test result of pH 4.V In the other tests, color reactions may either match, fall between, or fall beyond the three standard colors representing "Low". "Medium", and "High". Therefore seven different test results are possible: Vcr\ l.ow. l.ow. Medium Low. Medium. Medium High. High, and Ycrv High.
bH Test
Step l Step 2
Fill a test tube (0755) to line 4 with pH Indicator Solution (5701). Squeeze bot tle gently to control amount dispensed.
Step 3
Use 0.5 g measuring spoon (0698) to add three measures of soil sample to test tube.
Cap tube and shake gently for one minute.
Step 4
Allow tube to stand for 10 minutes to let soil settle.
StepS
Compare color re action with pH Color Chan and record result.

Potassium (Potash) Test
Step l Step 2 Step 3
Fill a test tube (0755) to line 7 with * Potassium Extract ing Solution (5707).
Use 0.5 g spoon to add /our measures of soil sample to test rube.
Cap tube and shake vigorously for one minute.
Step 4
Remove cap and allow soil to settle.
StepS
Use a clean pipet (0364) to transfer the clear liquid to another clean test tube. Be careful not to pull up any soil into pipet. Fill second tube to line 5 with liquid.
Step 6 Step? Step 8
V
ml'SA
Add one Potassium Indicator Tablet (5708) to soil extract in second tube.
Cap tube and shake to dissolve tablet. A purplish color will appear.
V
i*
Add Potassium Test Solution (5709) two drops at a time. keep count. Swirl test tube after each addition to mix contents. Stop add ing drops when color changes from Purplish to Blue.
Step 9
Use Potassium End Point Color Chart as a guide in reading this color change. Keep an accurate count of the number of drops added.
Read test result from table.
Step 10
Number Of Drops
Added0-8
101214161820 or more
Potassium (Potash)
LevelVery HighHighMedium HighMediumMedium LowLowVery Low

Phosphorus Test
Stop l Step 2 Step 3
Fill a test tube (0755) to line 6 with 'Phosphorus Ex tracting Solution (5704). ffi
Use 0.5 g spoon (0698) to add three measures of soil sample to test tube.
Cap tube and gently shake for one minute.
Step 4
Remove cap and allow tube to stand and soil tp settle until liquid above soil b clear.
Step 5
Use one pipet (0364) to transfer the clear liquid to another clean test tube. To a- void agitation of soil squeeze bulb of pipet before inserting tip into liquid. Release bulb slowly to draw clear liquid into pipet. do not pull up any soil. Fill second tube to line 3.
Step 6 Step?
WaAdd six drops of " Phosphorus Indica tor Reagent (5705) lo soil extract in second tube.
StepS
Cap tube and shake to mix contents.
Add one* Phosphorus TestTablet (5706) to testtube.
Step 9 Step 10
Cap tube and shake to dissolve tablet. A Blue color will develop.
O
Compare test color with Phosphorus Color Chart and record result

Nitrogen Test
Step Step Z
Fill test tube (0755) to line 7 with Nitrogen Extracting Solution (5702).
Use 0.5 g spoon to add two measures of soil sample to test tube.
Step Step 4
Cap tube and gently shake for one minute.
Remove cap and al low soil to settle.
Step 5
Use a clean pipet (0364) to transfer the clear liquid to another clean test tube. Be careful not to pull up any soil into pipet. Fill second tube to line 3 with liquid.
Step 6
Use 0.25 g measuring spoon (0695) to add lu-o measures of 'Nitrogen Indicator Powder (5703) to soil extract in second tube.
Step? Step 8
Cap tube and gently shake to mix.
Wait 5 minutes for Pink color to de velop above the powder. Compare test color with Nitrogen Color Chart and record result.

-*,
o
^J
44
t '

\ •N*
^ *•* 5 •V ^i o.
•v ^cx
K
NI5-
6,
K
**
P*
K
l

i \
.
^
IfefeSbt-
is
IS5Tl\K
!*V*\'SL X t *
l\
*- ivsr. IVN
l\ r*
vl\
x,
**.1^4
^
* fi
l)•V.

fe
i?
R Mtx w
t*
T~T
sItt" l K
IT H]5;
o S
CAI
iN l-l"
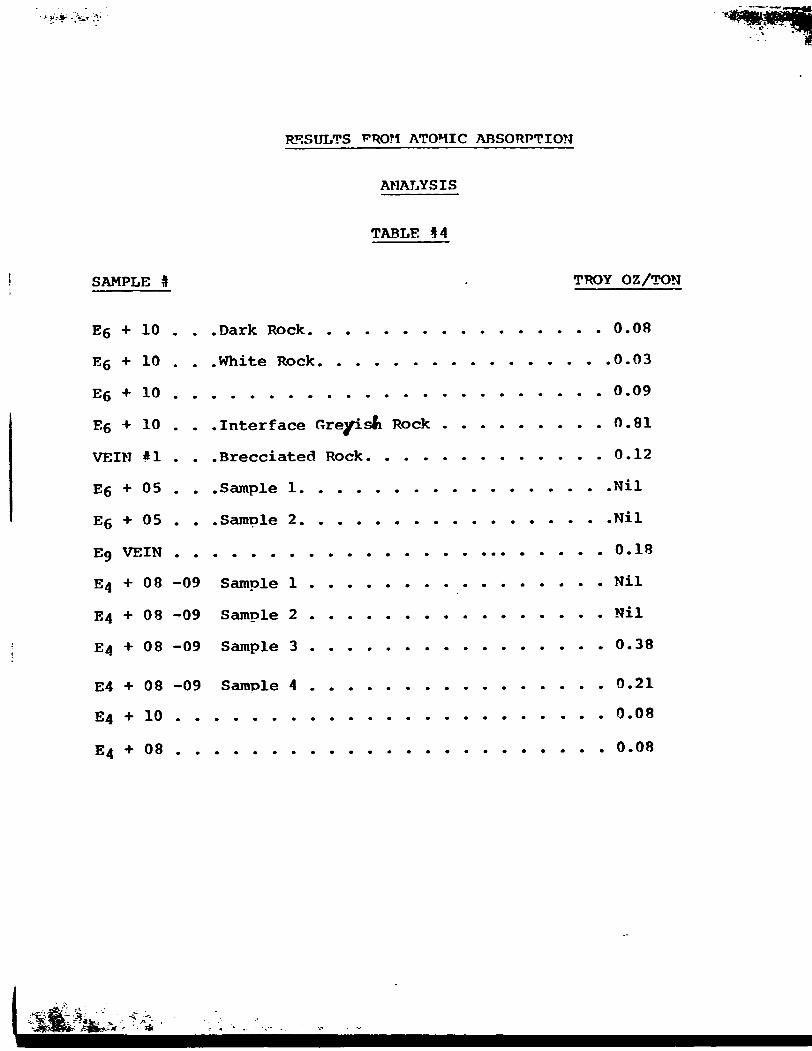
RESULTS PROM ATOMIC ABSORPTION
ANALYSIS
TABLE *4
SAMPLE TROY OZ/TON
Eg 4- 10 . . .Dark Rock. ...............0.08
Eg -t- 10 . . .White Rock. . . . . . . . . . . . . . . .0.03
Eg * 10 . . . . . . . . . . . . . . . . . . . . . . . 0.09
Eg * 10 . . .Interface Greyisli Rock . . . . . . . . . 0.81
VEIN *1 . . .Brecciated Rock. . . . . . . . . . . . . 0.12
Eg * 05 . . .Sample 1. . . . . . . . . . . . . . . . .Nil
Eg -l- 05 . . .Sample 2. . . . . . . . . . . . . . . . .Nil
Eg VEIN . . . . . . . . . . . . . . . . ,.. . . . . . 0.18
E4 * 08 -09 Sample l . . . . . . . . . . . . . . . . Nil
E4 * 08 -09 Sample 2 . . . . . . . . . . . . . . . . Nil
E4 * 08 -09 Sample 3 . . . . . . . . . . . . . . . . 0.38
E4 * 08 -09 Sample 4 . . . . . . . . . . . . . . . . 0.21
E4 -l- 10 . . . . . . . . . . . . . . . . . . . . . . . 0.08
E * 08 . . . . . . . . . . . . . . . . . . . . . . . 0.08
Michigan Technological University1400 Townsend Drive. Houghton. Michigan 49931-1295
College of EngineeringDepartment of Metallurgical
and Materials Engineering906/487-2630
FAX: 906/487-2934
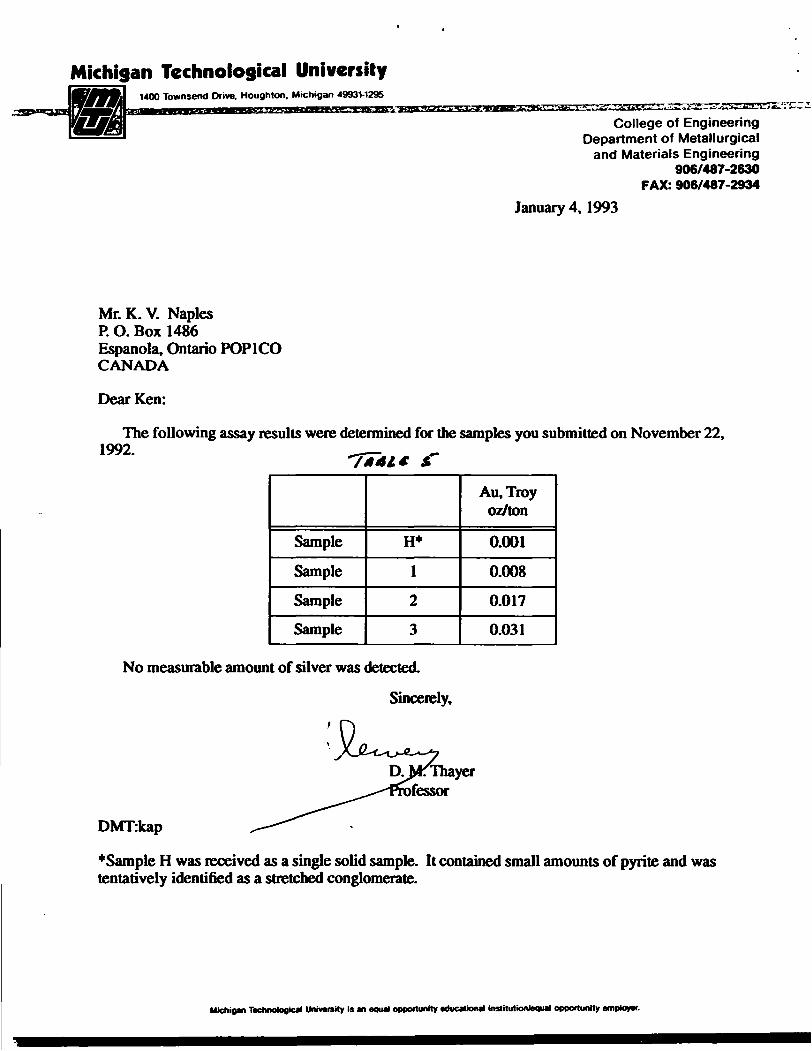
January 4,1993
Mr. K. V. NaplesP. O. Box 1486Espanola, Ontario POP ICOCANADA
Dear Ken:
The following assay results were determined for the samples you submitted on November 22,1992. ^—
•7T41* S
SampleSampleSampleSample
H*
123
Au, Troy oz/ton
0.001
0.0080.0170.031
No measurable amount of silver was detected.
Sincerely,
DMTrkap
•"Sample H was received as a single solid sample. It contained small amounts of pyrite and was tentatively identified as a stretched conglomerate.
Michigan Technological University is an equal opportunity educational bntitulionfequal opportunity employer.

TRIAL l
STATION
TABLE *tf
RESULTS IN TROY OZ/ton DATE: "'eh. 2^-2** 1992
TROY OZ/ton
W5 * O ft .
Eg + 09-Eo
Eg * 09-Eg
Eg + 04 .
E8 +06. .
E-j + 06 .
E 7 * 06 .
. . . . . . . . . . - - - - - . 0.47
10 . . . . . . . . - - - - - - - 0.45 Samnle SI
10 . . . . . . . - . . - - - - - 1.34 Samole *2,3
. . . . . . . . . . . . . . . . 0.18
. . . . . . . . . . . . . . . . .0.94
. . . . . . . . . . . . . . . . .0.93 Samnle *1
. . . . . . . . . . . . . . . . .0.82
TRIAL 2
STATION
*Eg * 09-Eg
**Efl * 09-Eg
* Eg * 04
Eg * 09-E9
E? * 09-Ev
E7 * 09-E ?
E-7 * 10
10
10
10
98
08
DATE: MARCH 11-13 1993 TROY O Z /ton
0.125 Sample 2,3
0.014 Samole l
0.02
0.015
0.02 Sample l
0.02 Samnle 2
0.05
*Reneated from Trial

si o! g
9*
Z il
to
o
o
Sf-s -
:t f
'- •i'l -
fi *
jo
*
S*
~
O
5
•o
. ,
l
J J
f S
i
?
o i
s s
s
--*
-4
a*
f
ST
2**
a an
**
l?
*
.?
..JT
•^
* rw
*
*o
; JS
r-
o
s*
s*
a
**
2J5
IS i*
s!-
HI i
s:? P
si:
Hii
j-
! .'
l .
S 5s
M
- *
f ;i
:f
||
l '
S -
f] ]
\ || |
(|
^
w HI
H ri ~ M
4 M
t•li
l
ME
RR
ITT
TWP
-70
-
x-r;,
'-i
V^^p
r^o
-o
U^"
-^ "
^
.j-
-
(D
f r\
~1
^ -X
,'
*' ^
" ^.
x
I .
-.-.^ j
- —
— -—
—L
—- —
s —os
—~
— -5
U —
' ^
B l
*
O
P R
L~ -
5
f ^tl
^.
i **
' ~^
*^^S
i^
v; W
-,
. jp
* w
j v
t -o
o a
V..
l 1C
^
•™"
" 7*
^ ^
- fs
o m
at
L
111
l~f
m
!Sm CO -p
3!a
^ o
^ ^
^
~I
Q*
CO
'
mQ
^ ^ r r
o
5 o IM O-C
)
. r
o
f
If i i i ii
m n
9>
> m
z z
oo
o 2
^
W
3*
o J-
>3
R
* l
l
iili
- 5
j *
zIs
fifii
v 5
3*
B*
3"?
59c
; :
i 9 w
w*
*
""
H *
i i
: i
2 z
o g
o ^
si
i *
t t
*^ ^
Z
r^
rs
O 5 w O
m
O m
i i i
' i
; ;
i i
i t
t i
t t
i i
^ i
i i
l l
l l
l l
"II
• S
o
' f
t 4
t l
41*1
1 (
4 t
4441
14
(1
11
l w
4
* *
l t
t[Z
(1
(1
14
a
4 4
* t
t (
iSC
*
4*1 l
J J
e 2
-5*
^P
V s

y o o 00
ft Y
/-
j,
fi! * o
3
*
of o/
r. 2o
t-s
ot, if o
r C f.c
ot
/X
li
f
i4*oo b/4+oo Wj C fr)p f'^cr t^oo ti**c
/f;S.a
o l
rf f t
ff
t/*o*
W OHM,,t '* ' ^
*'t S**Ht*
/f?JL
/o J
w
oo
\f.
O
'oo [*-t*00i,/ f
,* ot r ** t '
Slit S** fa S
\c
MW
41I04NE0048 OM92.038 FOSTER 210
ti /ft f
i/1 f' tt(0
03
nee rici
Hfo^3
(.oJ
OL. O L
/c (J
r? /)
* fi Hrk fi
l! 7 r —
ra.
D/ ri74* t
/cJ
'
flii.
ri, f' **
. f ul
///C H
/O fo
It n
:1 . T,"
f/ 'itfit l
.r J
7 A* t C
o O
c
o? ft* t c
10At t
l
to
/;
y// y//-
o/l'/
fi/*
X/'/
r/
x///C
x///
A/, i
ci X/'/
ci
v//
At
n *l*
•J 'L
n
t
\
tti *** t,,
Co X)
o*H
t. ^
LO
Obcf2,O
fn
rt?
\'* t.
O
4^d)
r*
lxN
^

f Y
V.
Pa /z.
A-
f li
Mf W
l 'l Steeper
3- Raf
ffi!l
03
T
*
Trr&,um r
ft.
m
BOU6H
XT o 'o
Q -
S** f if S
41I04NE004B OM82-038 FOSTER 220

V -
v -.
W s;
O)
O
t* ^
ii
** •S
D
O t* t 5
XD
O C.
p\
5p
57
f H
o- c
o o
* ;s
"^
o"
PP
-2 H- f
3*
Otn
gm S
•^ s
9
to a iv
i
o i
o x o r r i
O-
s o
i" o
o o*
O
l l
O o
i l i
\
l
o v
4
il
ti ?