Embed Size (px)
Citation preview
Appropriations Subcommittee
On Higher Education
Presentation
March 5, 2013
Office of Higher Education
www.ctohe.org
Office of Higher Education
Office of Higher Education
Appropriations Committee Questions
1. What are the high need areas served by the ARC program and its graduation rates?
There are currently seven ARC certification offerings including English, Family and Consumer Sciences, Mathematics, Music, Science (Biology, Chemistry, Earth Science, General Science and Physics), Technology Education, and World Languages. Those in bold are designated shortage areas. Over the last six years, 73% of graduates in shortage fields have been hired into local school districts. For additional detail, please see the ARC section in the Subcommittee Briefing Book. This program is designed to be self-supporting. It generates approximately $700,000 in revenue: $600,000 from tuition and $100,000 in state support. Approximately $700,000 is expended: $600,000 for program support and $100,000 in state support for the salary of the Director. Tuition of $3,975 would have to increase 34% to $5,325 to cover the loss of state support. This approach is not sustainable under the current fee structure.
2. How does German program state funding of $66,500 match with Germany’s support of $250,000? The Parliament of Baden-Württemberg supports Connecticut students with an annual scholarship fund of $250,000. This is distributed as $125,000 to replace the nine Yale doctoral students’ teaching fellowships and $125,000 to support the difference between the nine month U.S. academic year and the eleven month German year for the 48 undergraduates. The Connecticut portion of the program generates $112,500 in revenue annually and expends $110,000. The revenue comes from $66,500 in state support and $46,000 in student fees. It is expended as $63,000 in student grants for the 57 students studying in Germany; $28,000 for a part-time support staff member and $19,000 for other expenses, primarily travel to Germany for the program coordinator. Students are charged fees of $625 per full year for this program on top of annual tuition, which goes to the student’s home institution. These fees would have to increase at least 140% to $1,500 per year to cover the loss of state support. For additional information, please see the Germany Exchange section of the Subcommittee Briefing Book.
3. What is the reasoning behind the English Language Learners’ program cut? This is a new program that received a rescission in December. The rescission was carried forward to 2014 and the program was eliminated. We will be happy to discuss how we might proceed.
4. Describe the policy shift reasoning for the proposed student financial aid program. The current programs were designed to encourage access to higher education and are funded and awarded based on institutional needs and goals. Because they are based on institutional priorities, they pit institutions against each other for state funds and their use of state funds cannot be measured in any consistent manner to meet state-wide results requirements such as the RBA. The policy change moves the programs to a single set of goals for access, retention and completion that are student centered and directs limited state funds to the neediest students for their direct educational costs. This policy treats all students the same regardless of institution attended and does not pit institutions against one another for funds. With a single set of objectives, measurement criteria can be established and we can determine if the funding is making a difference. Student success in the 21st century must be our guiding principle in making state-funded financial aid the best and fairest it can be during the worst financial crisis to hit our state in years. Unifying the goals of the aid while retaining institutional decision making is a sound and reasoned approach to meeting the current needs of Connecticut’s students in a dramatically changed economy and allowing for the flexibility that will be required in the future.
5. How many students would receive aid under the proposed scholarship program, how does it affect part-time students, and what is the predicted distribution of funds? It is not possible to know exactly how many students would receive this grant, but the funding is distributed based on how many students were eligible for the grant in the year prior to the award year. Based on available 2012 information and a full-time only model, approximately 14,100 students made up the eligibility. If part-time students taking 6 credits or more per semester are added in, an additional 8,600 students would be eligible. This totals 22,700 eligible students compared to 25,332 students who received awards under a program with $11 million in additional funding. The predicted distribution of funds for full-time and part-time in 2014, based on a modeled estimate for the need-based only program (this number will change) is $4.0 million for the community colleges, $10.0 million for the state universities, $6.9 million for UConn and $14.3 million for the independent institutions. There is additional information in the Financial Aid section of the Subcommittee Briefing Book.
6. How will students apply for this grant and when will schools know how much funding they will have? This program and policy change is completely transparent to students. Students need not apply and the award will be made by each individual institution based on the number of eligible students and the amount of available funds. This is exactly the same process as existed under the CICSG/CAPCS programs except the eligible students will be determined by family contribution level and the awards will be pro-rated on that same level. 1
Office of Higher Education
7. How will incentive program encourage graduation rates and what are graduation rates for recipients?
The entire program encourages completion by first concentrating on the full-time students who have the best chance of graduating in the three or six year life of the award. Second, the merit portion rewards the students with the highest need who also have the best academic records with a higher award to encourage continued success in college. Third, the incentive award allows students without the early academic success to earn a higher award by accumulating enough credits to graduate in two or four years and maintaining a GPA above the minimum required to progress. These three components reward high expectations and commitment to encourage students to get out of school at the lowest cost and into the workforce as soon as possible. Placing limits on the number of years the awards can be received also encourages part-time students to take more credits so that they do not use up their state financial aid before they complete their educations.
8. What are other state practices and which states no longer provide reciprocal funding? Eighty percent of other states distribute their major need-based financial aid program centrally by means of fixed eligibility formulas and award ranges. The vast majority of the remaining states, which allow the distribution of awards for their major need-based financial aid program to be made by individual institutions, also use state-developed fixed eligibility formulas and award ranges. A handful of states either have no major need-based award program or allow decentralized awarding by institutional goals like Connecticut. Please see the Financial Aid section of the Subcommittee Briefing Book for further information.
9. What is the impact to the program of Yale returning? The estimated distribution of aid for Yale is $46,000.
2
Fact Sheet
Higher Education Overview
18 public degree-granting institutions organized under the University of Connecticut and the Board of Regents
28 independent colleges and universities
the U.S. Coast Guard Academy
202,935 students enrolled in fall 2012, for a tenth consecutive year of record enrollments
61 private occupational schools enrolling an additional 22,227 students
Over 59,000 minority students
29 percent minority students compared to 11 percent in fall 1989
42,503 degrees conferred, 39 percent growth over the last decade.
OHE Overview
The Office of Higher Education was established in July 2012 to provide consumer protection and to administer programs supporting Connecticut’s higher education system. Those programs include:
Academic program review and approval for independent institutions, as well as private occupational and hospital-based schools.
Three student financial aid programs for Connecticut undergraduates, in addition to programs for teachers and lawyers.
Programs for students through the Minority Advancement Program, the Alternate Route to Certification, the Commission on Community Service, the Connecticut-Germany Student Exchange and Teacher Quality Partnership Grants.
Primary source of official public information for Connecticut’s colleges and universities
Student Financial Assistance
There are six major state programs:
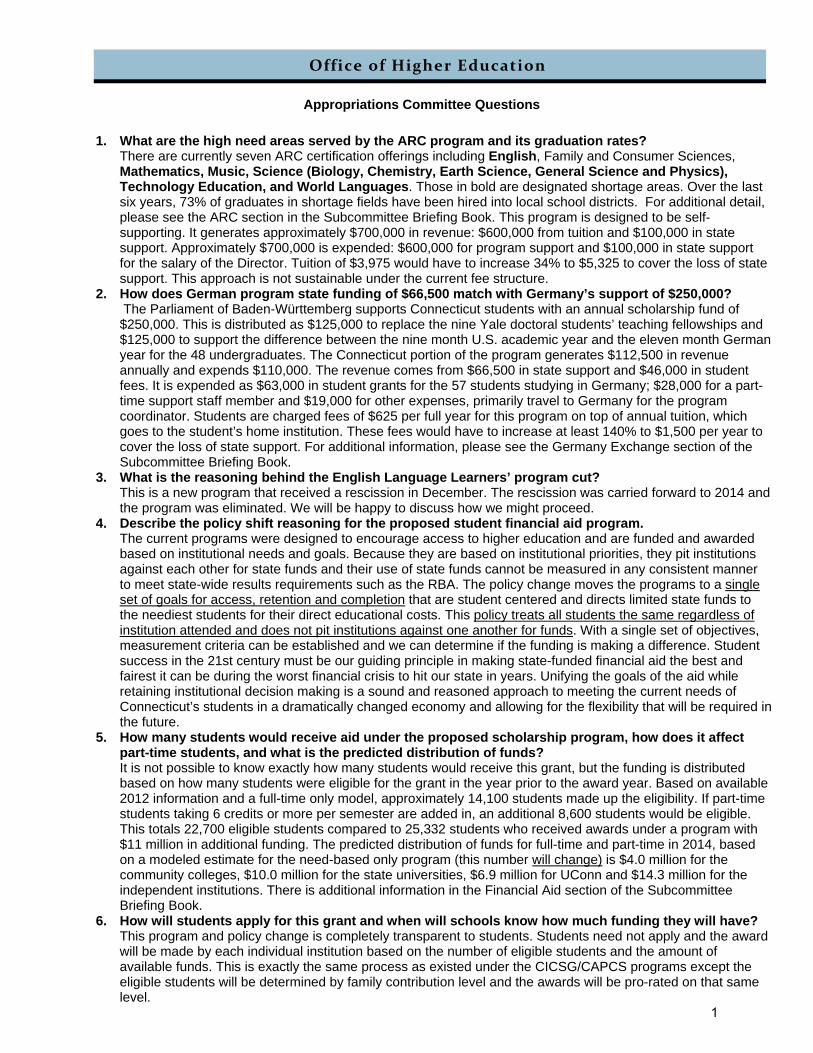
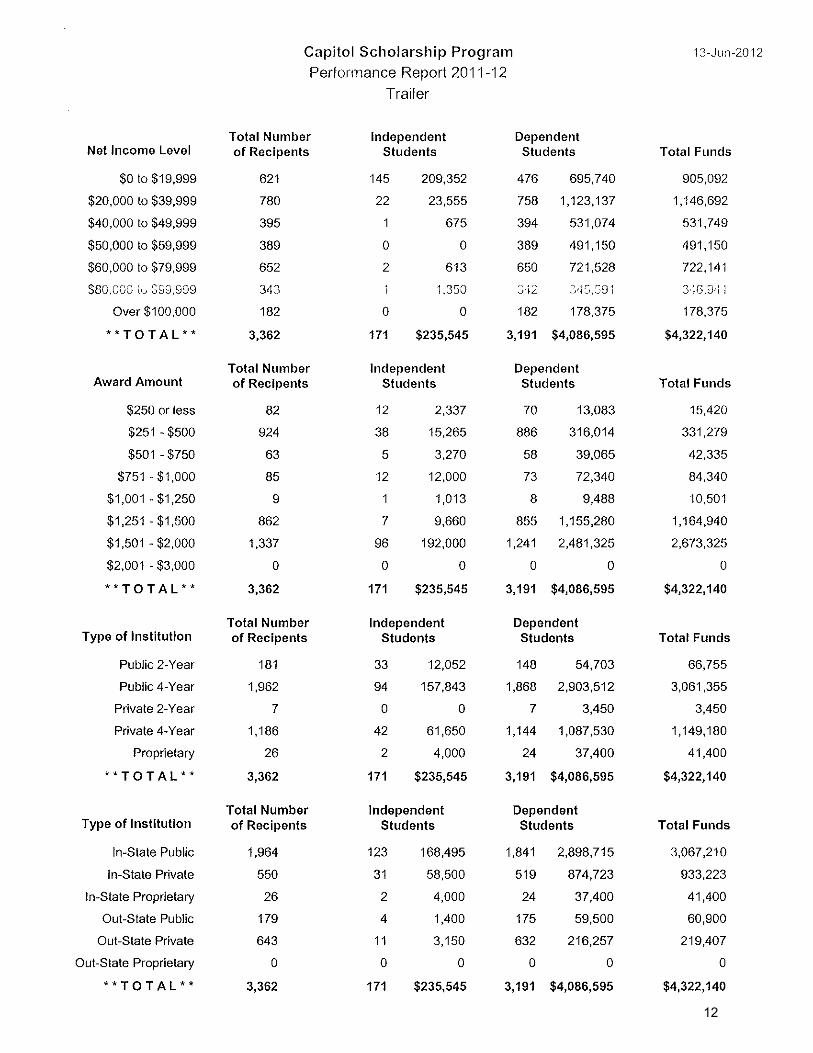
Capitol Scholarship Program provides awards to students based upon academic merit and financial need. The maximum award for students attending in-state institutions was $2,000. Awards to recipients at institutions in the six states with reciprocal agreements were a maximum of $350. 3,362 awards at an average of $1,286 were tendered in 2012.
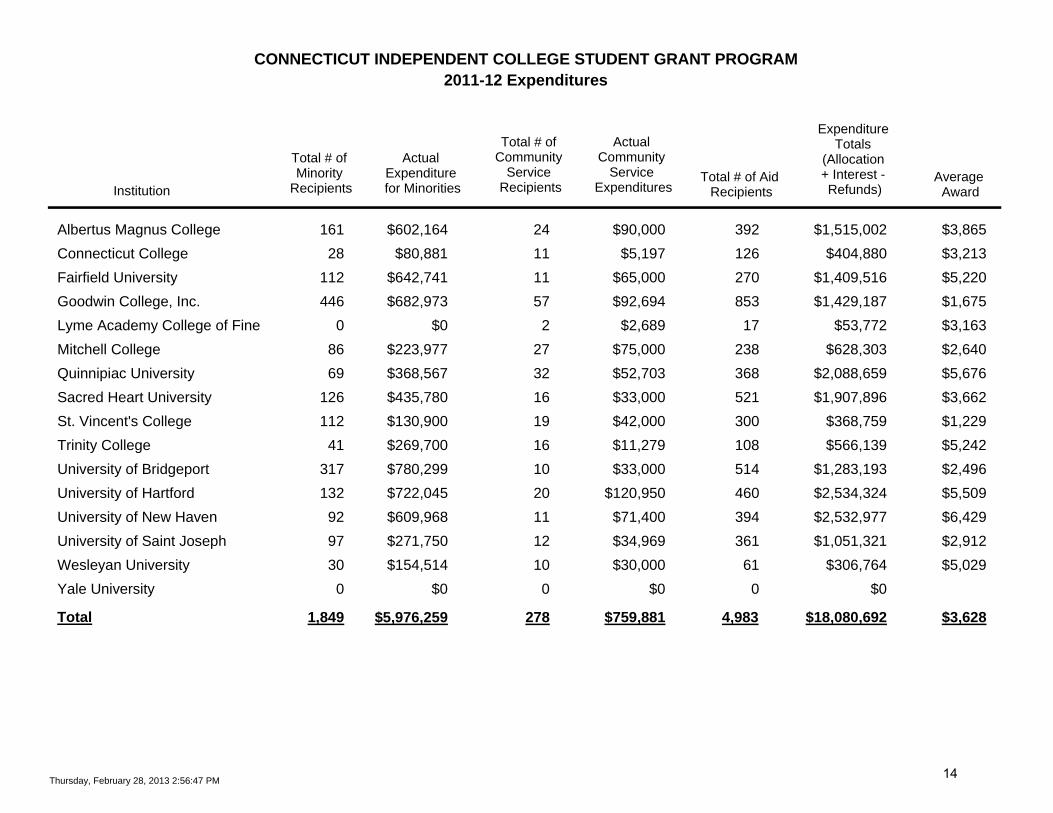
Connecticut Independent College Student Grant Program (CICSG) provides need-based grants to Connecticut residents attending private institutions in the state. The maximum annual grant per student is linked to actual state-supported expenditures per student at Connecticut's public four-year institutions under statutory formula. This program was funded at 59% of the statutory formula in 2012 with an average award of $3,628 to 4,983 recipients. Funding was reduced by 15.9 million for 2013, or 58% of statutory formula.
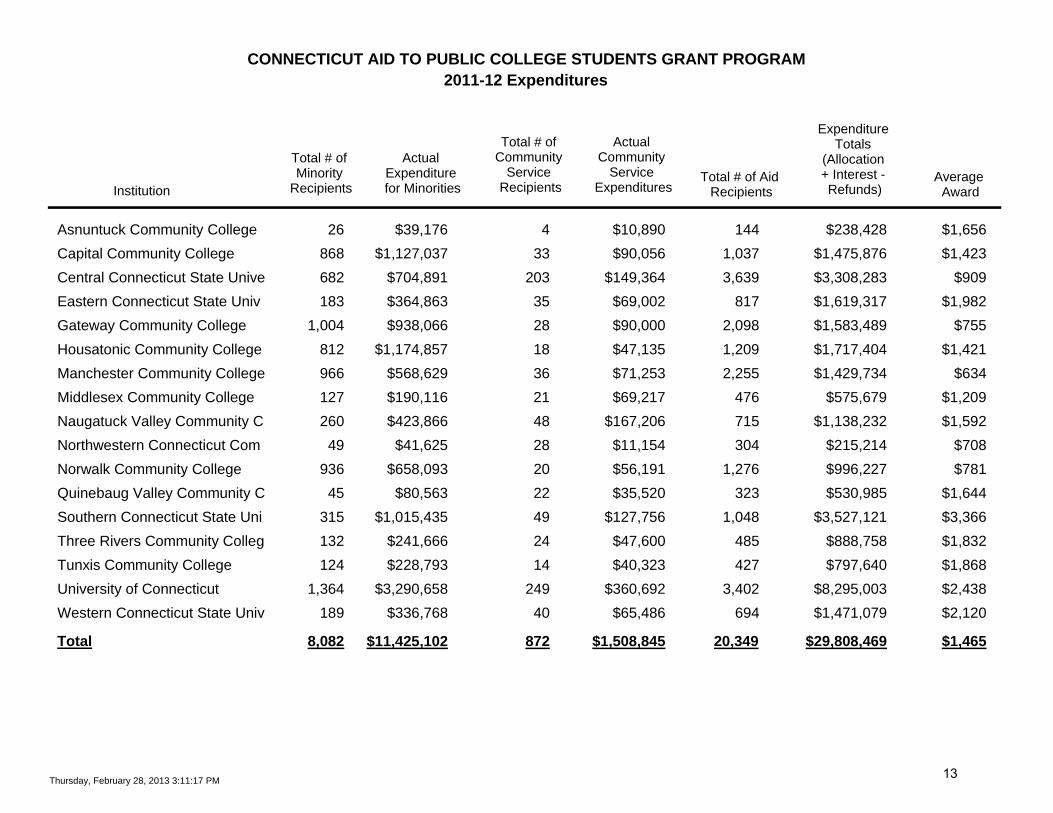
Connecticut Aid for Public College Students Program (CAPCS) provides need-based grants to Connecticut residents attending public institutions in Connecticut. The annual requested appropriation matches the 15 percent tuition set-asides for need-based aid at Connecticut public colleges. This program was 42% funded in 2012 with an average award of $1,465 to 20,349 recipients. Funding was reduced for 2013 to $24.2 million, or 31% of formula.
Connecticut Aid to Charter Oak provides grant assistance to Connecticut residents attending Charter Oak State College. In 2012, this program was 70% funded and served 200 students at an average award of $294. Funding for 2013 was reduced by five percent to $56,727.
Awards to Children of Deceased, Disabled, and Missing in Action Veterans are $400 per student and students must demonstrate financial need. No grants were awarded in 2012.
Minority Teacher Incentive Program (MTIP) provides annual $5,000 awards to minority students in teacher training programs and $2,500 stipends to graduates who teach in Connecticut schools for loan repayment assistance. The maximum award, grants and stipends combined, for each participant is $20,000. Funding for 2013 was reduced by five percent.
O f f i c e o f H i g h e r E d u c a t i o n
0%20%40%60%80%
100%
02 03 04 05 06 07 08 09 10 11 12
Percent of Total Award Dollars
Out-of-State Private Public
10
20
30
40
5098 99 00 01 02 03 04 05 06 07 08 09 10 11 12 13
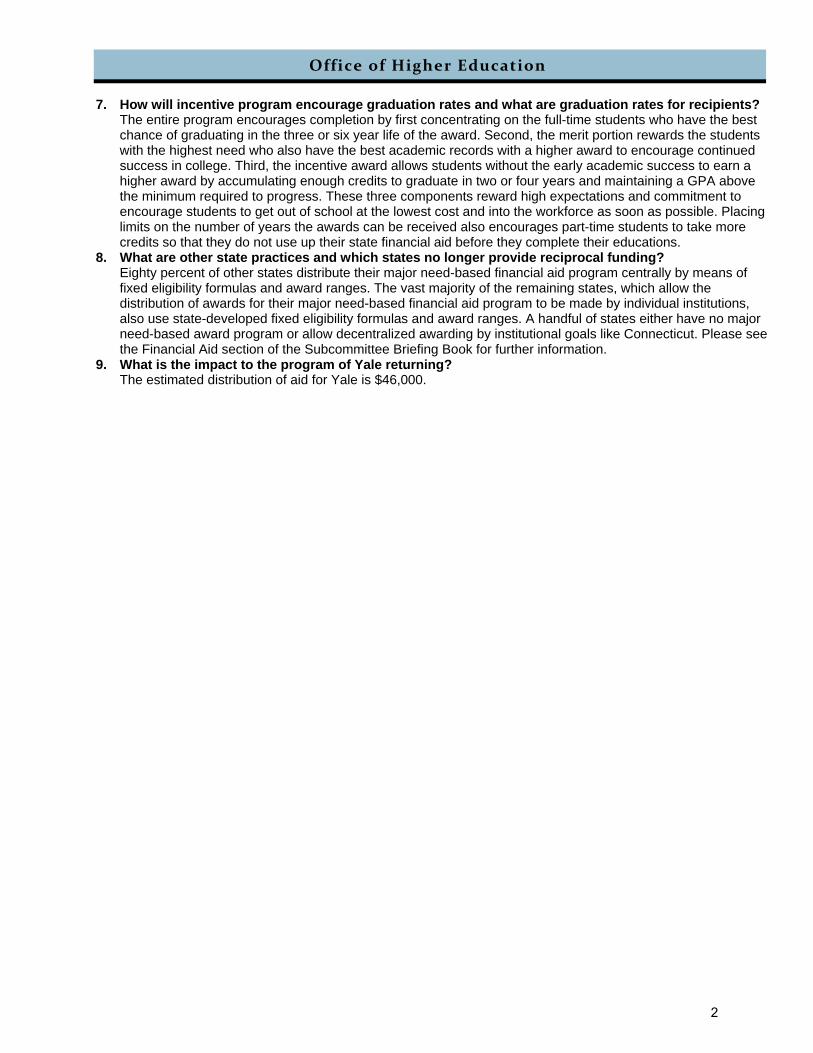
National RankingsAppropriations for State Tax Funds for Operating
Expenses of Higher Education per Capita
Ran
k
3
Program Coordination
In addition, management of the following specific programs provides support to various constituencies.
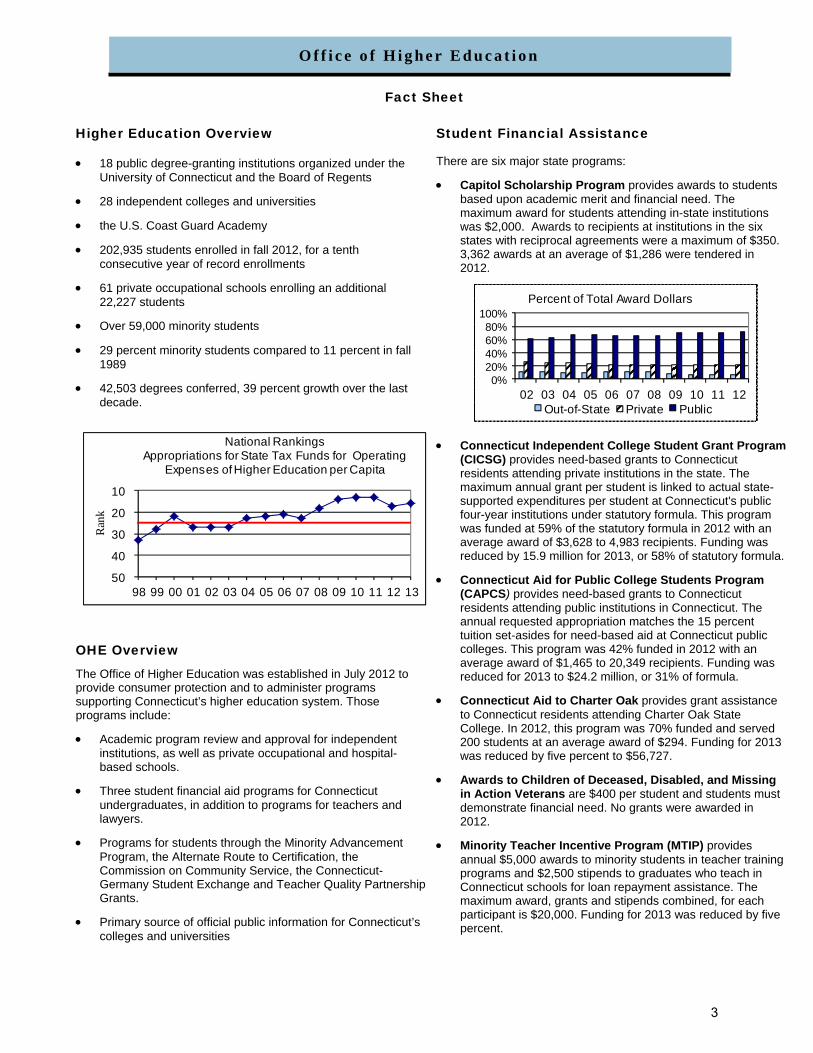
Alternate Route to Certification (ARC) is a time condensed teacher preparation program designed primarily for highly qualified mid-career adults. It is the 6th largest out of 19 SDE-approved teacher preparation programs. ARC also is the 4th largest preparer of minority teacher candidates in CT. One of the major priorities of ARC is to meet teacher shortage areas, which are reviewed on an annual basis to meet K-12 district hiring needs. ARC currently graduates approximately 120 teachers on an annual basis across seven content areas. Since 2007, the hiring rate for shortage area candidates who were employed in public school positions is 73%. The placement of teachers in urban settings since 2007 is 36%.
Educational and Employment Information Center (EEIC) is a statewide referral and information service for anyone who has questions about learning and career opportunities. The EEIC also provides admissions information for the agency’s Alternate Route to Certification and serves as the agency’s complaint center for students at independent colleges and private occupational schools who wish to pursue formal complaint resolution with the state.
Minority Advancement Program (MAP) is a student service program designed to provide college-readiness and to improve college success for individuals from disadvantaged backgrounds. ConnCAP implements pre-college programs for students from low-income and first (college) generation families that bolster the skills and motivation necessary to graduate from high school and succeed in postsecondary education. At the college level, the Community College Scholars and the University Success programs focus on strengthening minority retention and graduation at CT’s community colleges and public universities. These programs are designed to increase student retention and graduation. In the 2012 academic year, Naugatuck Valley Community College’s ConnCAP program, graduated 100% of its high school seniors, all of whom matriculated into a college or university.
Private Occupational School oversight provides a means to ensure the overall quality and financial viability of some 85 institutions and branches, enrolling 22,227 students and generating $166 million in net tuition revenues. An average three inquiries on opening a school are logged per week. In 2012, three new schools and two new branches were licensed and 23 schools reauthorized, 20 complaints were filed on existing schools and four schools closed. There was one change of ownership, four notices of violations, approximately 350 revisions to certificates of authorization and seven hospital-based schools approved.
The Connecticut State Approving Agency for the U.S. Department of Veteran Affairs, inspects, conducts compliance surveys and provides technical assistance to
educational institutions instructing veterans through the GI Bill.
National Service Initiative administers AmeriCorps programs in the state. In 2013 AmeriCorps will provide 719 participants the opportunity to reinforce, expand and start-up quality community service programs that help meet critical needs in education, public safety, health and the environment. In exchange for their service, AmeriCorps members earn an education award that can be used to pay for college or graduate school, or to pay back qualified student loans. This year, CT will receive more than $9,300,000 in federal funds dollars leveraged by a $331,707 state appropriation to support our communities’ efforts to address their most immediate challenges such as the education gap, public safety and healthcare.
The Baden-Wurttemberg, Germany Sister-State
Exchange Program originated from a legislative partnership concluded between CT and the German State of Baden-Wuerttemberg in 1989. Eleven CT universities, public as well as independent, participated in this reciprocal exchange which makes it possible for 57 CT students to earn credits at nine different German universities while 51 German students study at CT schools. This program is highly valued by more than 60 German companies that have branches and subsidiaries in CT as well as CT companies that have investments in German speaking countries.
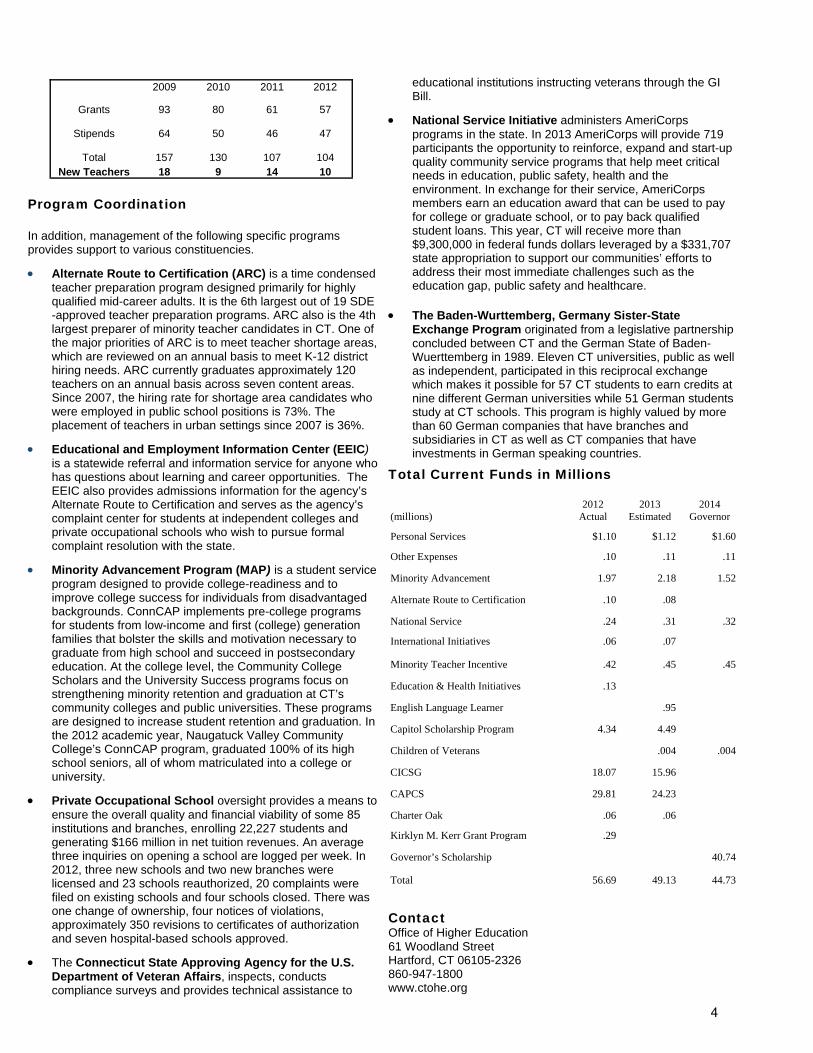
Total Current Funds in Millions
Contact Office of Higher Education 61 Woodland Street Hartford, CT 06105-2326 860-947-1800 www.ctohe.org
2009 2010 2011
Grants 93 80 61
Stipends 64 50 46
Total 157 130 107 New Teachers 18 9 14
2012
57
47
104 10
(millions)
2012 Actual
2013 Estimated
2014 Governor
Personal Services $1.10 $1.12 $1.60
Other Expenses .10 .11 .11
Minority Advancement 1.97 2.18 1.52
Alternate Route to Certification .10 .08
National Service .24 .31 .32
International Initiatives .06 .07
Minority Teacher Incentive .42 .45 .45
Education & Health Initiatives .13
English Language Learner .95
Capitol Scholarship Program 4.34 4.49
Children of Veterans .004 .004
CICSG 18.07 15.96
CAPCS 29.81 24.23
Charter Oak .06 .06
Kirklyn M. Kerr Grant Program .29
Governor’s Scholarship 40.74
Total 56.69 49.13 44.73
4
Office of Higher Education
Financial Overview
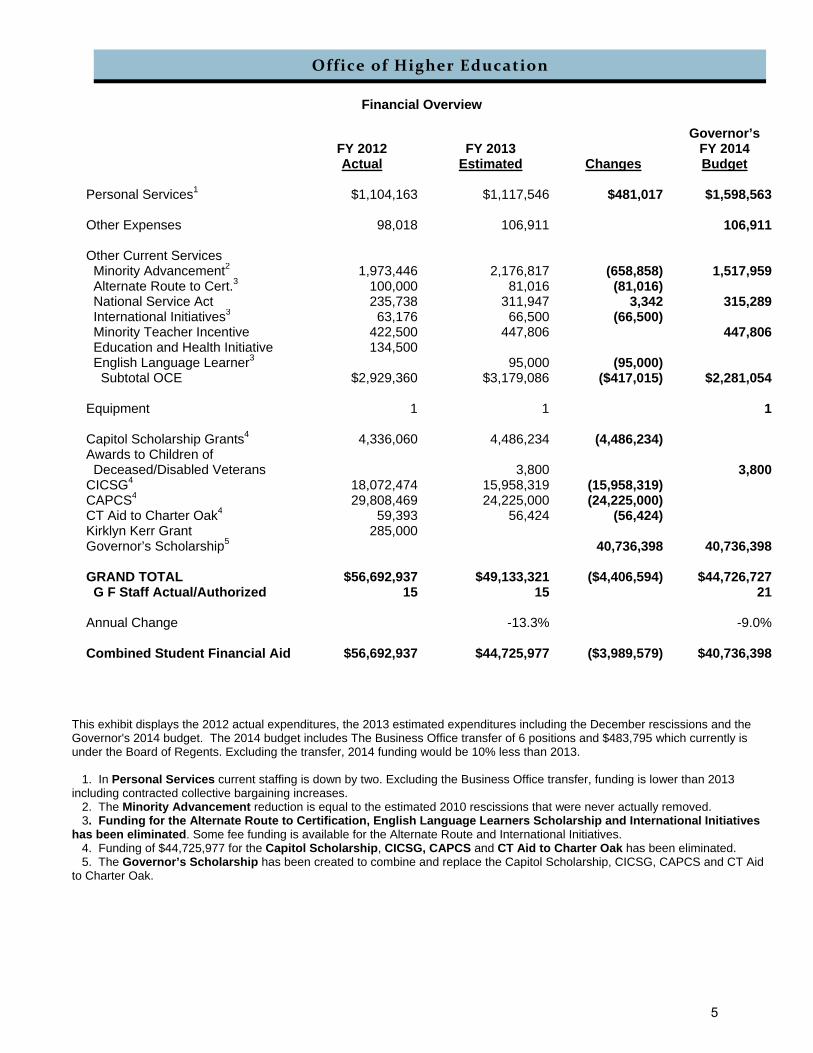
This exhibit displays the 2012 actual expenditures, the 2013 estimated expenditures including the December rescissions and the Governor's 2014 budget. The 2014 budget includes The Business Office transfer of 6 positions and $483,795 which currently is under the Board of Regents. Excluding the transfer, 2014 funding would be 10% less than 2013. 1. In Personal Services current staffing is down by two. Excluding the Business Office transfer, funding is lower than 2013 including contracted collective bargaining increases. 2. The Minority Advancement reduction is equal to the estimated 2010 rescissions that were never actually removed. 3. Funding for the Alternate Route to Certification, English Language Learners Scholarship and International Initiatives has been eliminated. Some fee funding is available for the Alternate Route and International Initiatives. 4. Funding of $44,725,977 for the Capitol Scholarship, CICSG, CAPCS and CT Aid to Charter Oak has been eliminated. 5. The Governor’s Scholarship has been created to combine and replace the Capitol Scholarship, CICSG, CAPCS and CT Aid to Charter Oak.
FY 2012 Actual
FY 2013 Estimated Changes
Governor’s FY 2014 Budget
Personal Services1 $1,104,163 $1,117,546 $481,017 $1,598,563 Other Expenses 98,018 106,911 106,911 Other Current Services Minority Advancement2 1,973,446 2,176,817 (658,858) 1,517,959 Alternate Route to Cert.3 100,000 81,016 (81,016) National Service Act 235,738 311,947 3,342 315,289 International Initiatives3 63,176 66,500 (66,500) Minority Teacher Incentive 422,500 447,806 447,806 Education and Health Initiative 134,500 English Language Learner3 95,000 (95,000) Subtotal OCE $2,929,360 $3,179,086 ($417,015) $2,281,054 Equipment 1 1 1 Capitol Scholarship Grants4 4,336,060 4,486,234 (4,486,234)Awards to Children of Deceased/Disabled Veterans 3,800 3,800CICSG4 18,072,474 15,958,319 (15,958,319)CAPCS4 29,808,469 24,225,000 (24,225,000) CT Aid to Charter Oak4 59,393 56,424 (56,424)Kirklyn Kerr Grant 285,000Governor’s Scholarship5 40,736,398 40,736,398 GRAND TOTAL $56,692,937 $49,133,321 ($4,406,594) $44,726,727 G F Staff Actual/Authorized 15 15 21 Annual Change -13.3% -9.0% Combined Student Financial Aid $56,692,937 $44,725,977 ($3,989,579) $40,736,398
5
Academic Affairs 1 General Fund
5 Other
Finance 5 General Fund
Student Services 5 General Fund*
6 Other
Internal Budgeting/ Research
Licensure & Accreditation -Independent Colleges -Out-of-State Colleges
Regulation of Private Occupational
Schools
Regulation of Hospital-based Schools
State Approving Agency for Veterans
Student Financial Aid
Administration
CT Aid for Public College Student Program
CT Independent College Student Grant Program
Minority Teacher Incentive Program/
Weisman Scholarship
AmeriCorps/Community Service
Connecticut - Germany Student Exchange
Education & Employment Information Center
Minority Advancement Program
Alternate Route to Certification
Teacher Quality Partnership Grants
Capitol Scholarship Program
O f f i c e o f H i g h e r E d u c a t i o n
3/5/2013
John R. Justice Grant Program
*Includes 2 vacant positions not currently funded.
**Transfers from BOR in 2014.
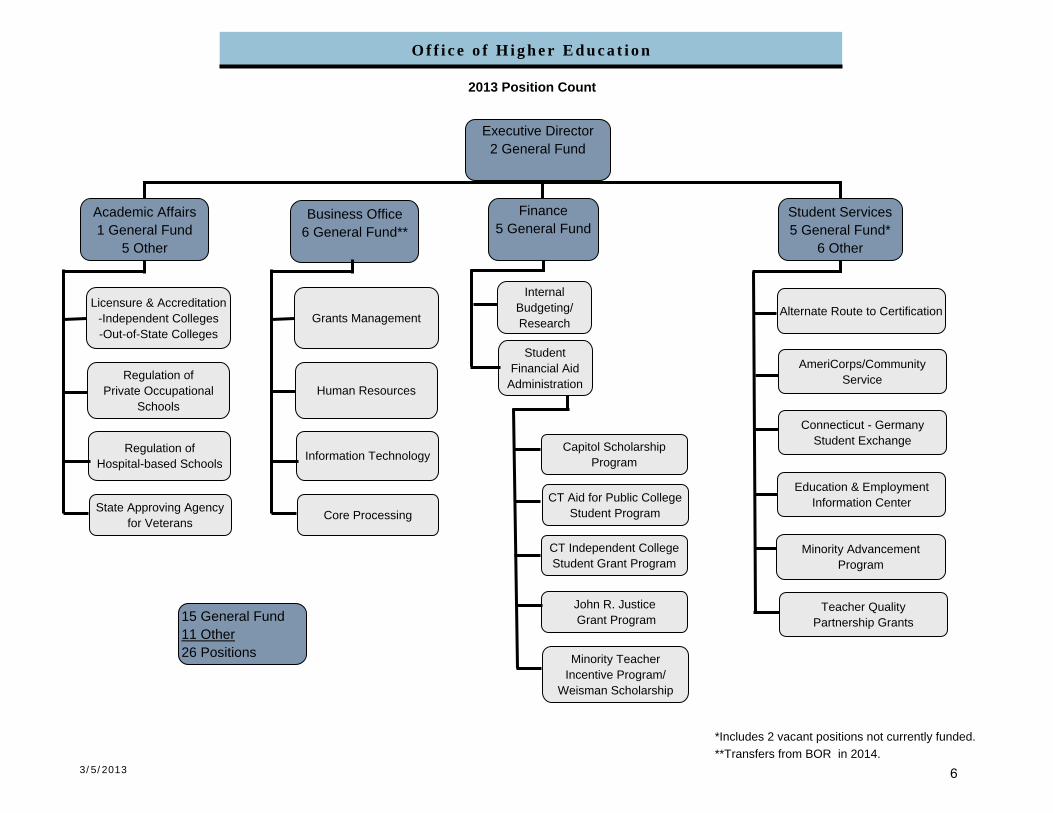
15 General Fund 11 Other 26 Positions
2013 Position Count
Executive Director 2 General Fund
Business Office 6 General Fund**
Grants Management
Human Resources
Information Technology
Core Processing
6
Office of Higher Education
The Governor’s Scholarship
Summary
This program combines all non-programmatic, state-funded student financial aid into one student-oriented program with two components administered by the Office of Higher Education.
The two program components are 1) a merit- and need-based grant and 2) a need-based only grant. The need-based grant will have three attributes: 1) a community college grant, 2) a four-year institution grant and 3) a Charter Oak grant. No student may receive both components of the grant.
The existing Capitol Scholarship, Connecticut Independent College Student Grant, Connecticut Aid to Public College Students Grant and Connecticut Aid to Charter Oak will be replaced by this program. All awards made under the previous programs through June 30 2013 will be honored and will be renewable for the life of the original award as long as need and academic standards are met.
Objectives Awards go to the neediest students first (access); 2) awards contribute to students staying in school
(retention); and 3) awards contribute to students attaining a degree in the shortest time possible (completion). This program will apply the same eligibility and award standards to all students regardless of the school they
choose to attend and targets those students with the most need. This approach provides consistency for students and measurability for the state. Awards will be renewable with satisfactory progress and continuing need. Awards will be available for 1.5 times the minimum time to graduation (3 years for a 2 year school; 6 years for a 4 year school).
These objectives will be applied state-wide based on appropriations and eligible students with a sliding scale of awards up to an annually established maximum family contribution.
The awards will go to full-time, degree-seeking undergraduates at Connecticut non-profit colleges and universities. Applicants must be Connecticut residents, and awards must be used for tuition and fees.
The merit/need component Applications are made electronically to the Office of Higher Education by high schools for eligible seniors. Awards are made on a sliding scale up to a maximum family contribution set annually by the Office and based
on funding levels and the number of eligible applicants. Merit/need awards will be higher than need only awards and will be awarded by the Office of Higher Education.
This component is effective for new students (freshmen) beginning in fall 2013. The need only component
Individual institutions will receive a funding allotment based on the number of eligible students enrolled in the previous year.
Individual institutions make awards based on the sliding scale set by the Office of Higher Education up to a maximum family contribution. The maximum award is determined by available funding and eligible students.
This component is effective for new students (freshmen) beginning in fall 2013. Incentive Pool
To help meet retention and completion criteria, there will be a pool of money set aside to provide an “incentive award” to students who return with sufficient credits to remain on a timeline to graduate in two or four years and who exceed the minimum satisfactory academic performance.
This component is effective for the new students (freshmen in fall 2013) who will be eligible in their second year of study.
Current program components to be dropped include appropriation formulas, minority or community service minimums, student employment awards, part-time students, graduate students, out-of-state schools and for-profit schools. Current options to be continued and applied to the whole program include a carry forward, an administrative allowance and compliance audits.
7
O f f i c e o f H i g h e r E d u c a t i o n
Financial Aid Trends from All Sources
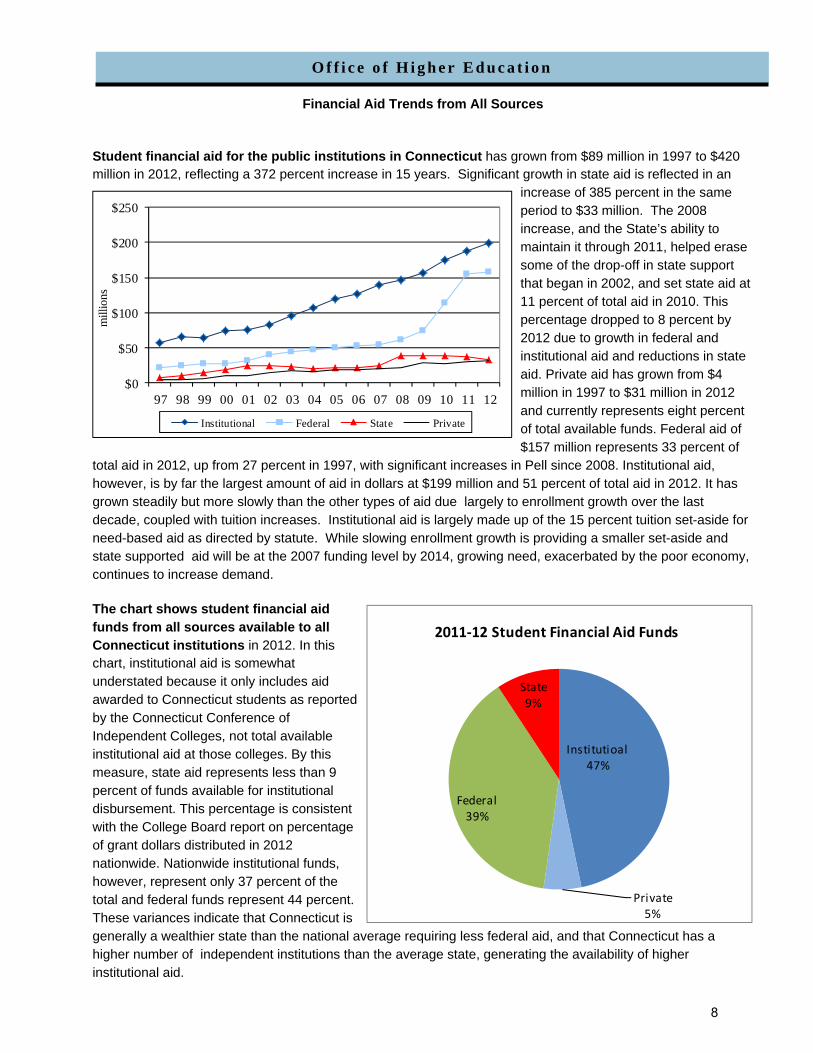
Student financial aid for the public institutions in Connecticut has grown from $89 million in 1997 to $420 million in 2012, reflecting a 372 percent increase in 15 years. Significant growth in state aid is reflected in an
increase of 385 percent in the same period to $33 million. The 2008 increase, and the State’s ability to maintain it through 2011, helped erase some of the drop-off in state support that began in 2002, and set state aid at 11 percent of total aid in 2010. This percentage dropped to 8 percent by 2012 due to growth in federal and institutional aid and reductions in state aid. Private aid has grown from $4 million in 1997 to $31 million in 2012 and currently represents eight percent of total available funds. Federal aid of $157 million represents 33 percent of
total aid in 2012, up from 27 percent in 1997, with significant increases in Pell since 2008. Institutional aid, however, is by far the largest amount of aid in dollars at $199 million and 51 percent of total aid in 2012. It has grown steadily but more slowly than the other types of aid due largely to enrollment growth over the last decade, coupled with tuition increases. Institutional aid is largely made up of the 15 percent tuition set-aside for need-based aid as directed by statute. While slowing enrollment growth is providing a smaller set-aside and state supported aid will be at the 2007 funding level by 2014, growing need, exacerbated by the poor economy, continues to increase demand.
The chart shows student financial aid funds from all sources available to all Connecticut institutions in 2012. In this chart, institutional aid is somewhat understated because it only includes aid awarded to Connecticut students as reported by the Connecticut Conference of Independent Colleges, not total available institutional aid at those colleges. By this measure, state aid represents less than 9 percent of funds available for institutional disbursement. This percentage is consistent with the College Board report on percentage of grant dollars distributed in 2012 nationwide. Nationwide institutional funds, however, represent only 37 percent of the total and federal funds represent 44 percent. These variances indicate that Connecticut is generally a wealthier state than the national average requiring less federal aid, and that Connecticut has a higher number of independent institutions than the average state, generating the availability of higher institutional aid.
$0
$50
$100
$150
$200
$250
97 98 99 00 01 02 03 04 05 06 07 08 09 10 11 12
mill
ions
Institutional Federal State Private
Institutioal47%
Private5%
Federal39%
State9%
2011‐12 Student Financial Aid Funds
8
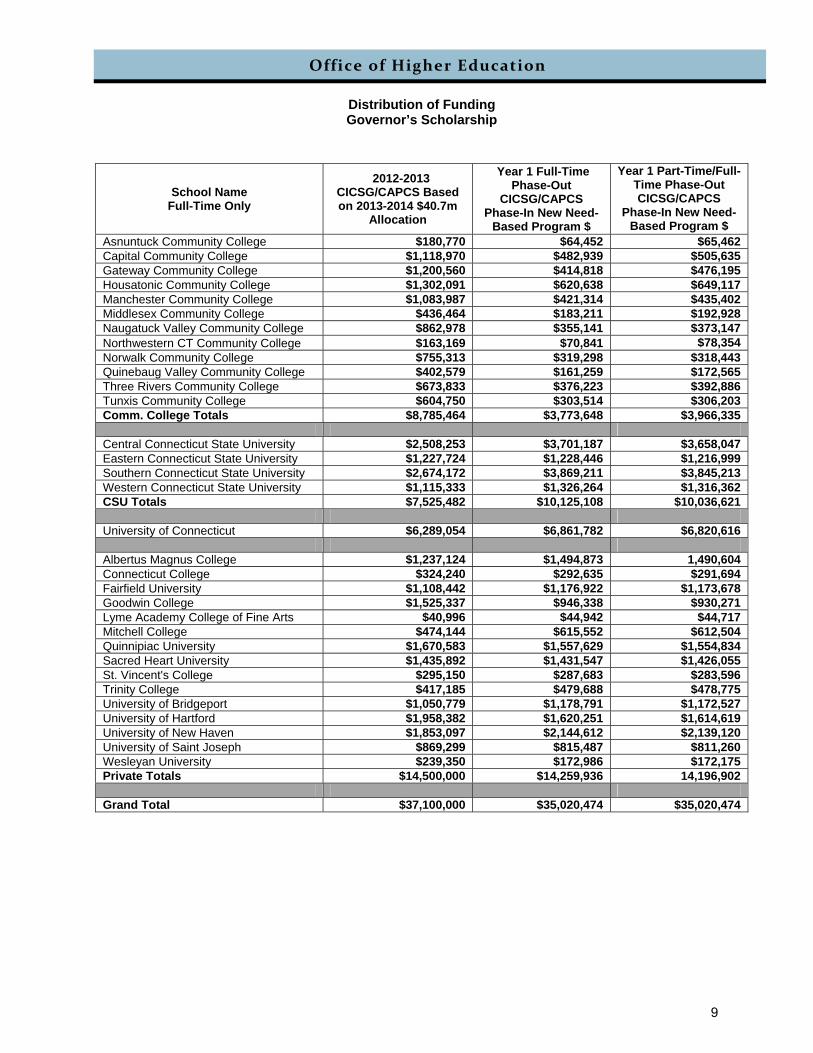
Office of Higher Education
Distribution of Funding Governor’s Scholarship
School Name Full-Time Only
2012-2013 CICSG/CAPCS Based on 2013-2014 $40.7m
Allocation
Year 1 Full-Time Phase-Out
CICSG/CAPCS Phase-In New Need-
Based Program $
Year 1 Part-Time/Full-Time Phase-Out CICSG/CAPCS
Phase-In New Need-Based Program $
Asnuntuck Community College $180,770 $64,452 $65,462Capital Community College $1,118,970 $482,939 $505,635Gateway Community College $1,200,560 $414,818 $476,195Housatonic Community College $1,302,091 $620,638 $649,117Manchester Community College $1,083,987 $421,314 $435,402Middlesex Community College $436,464 $183,211 $192,928Naugatuck Valley Community College $862,978 $355,141 $373,147Northwestern CT Community College $163,169 $70,841 $78,354Norwalk Community College $755,313 $319,298 $318,443Quinebaug Valley Community College $402,579 $161,259 $172,565Three Rivers Community College $673,833 $376,223 $392,886Tunxis Community College $604,750 $303,514 $306,203Comm. College Totals $8,785,464 $3,773,648 $3,966,335 Central Connecticut State University $2,508,253 $3,701,187 $3,658,047Eastern Connecticut State University $1,227,724 $1,228,446 $1,216,999Southern Connecticut State University $2,674,172 $3,869,211 $3,845,213Western Connecticut State University $1,115,333 $1,326,264 $1,316,362CSU Totals $7,525,482 $10,125,108 $10,036,621 University of Connecticut $6,289,054 $6,861,782 $6,820,616 Albertus Magnus College $1,237,124 $1,494,873 1,490,604Connecticut College $324,240 $292,635 $291,694Fairfield University $1,108,442 $1,176,922 $1,173,678Goodwin College $1,525,337 $946,338 $930,271Lyme Academy College of Fine Arts $40,996 $44,942 $44,717Mitchell College $474,144 $615,552 $612,504Quinnipiac University $1,670,583 $1,557,629 $1,554,834Sacred Heart University $1,435,892 $1,431,547 $1,426,055St. Vincent's College $295,150 $287,683 $283,596Trinity College $417,185 $479,688 $478,775University of Bridgeport $1,050,779 $1,178,791 $1,172,527University of Hartford $1,958,382 $1,620,251 $1,614,619University of New Haven $1,853,097 $2,144,612 $2,139,120University of Saint Joseph $869,299 $815,487 $811,260Wesleyan University $239,350 $172,986 $172,175Private Totals $14,500,000 $14,259,936 14,196,902 Grand Total $37,100,000 $35,020,474 $35,020,474
9
Office of Higher Education
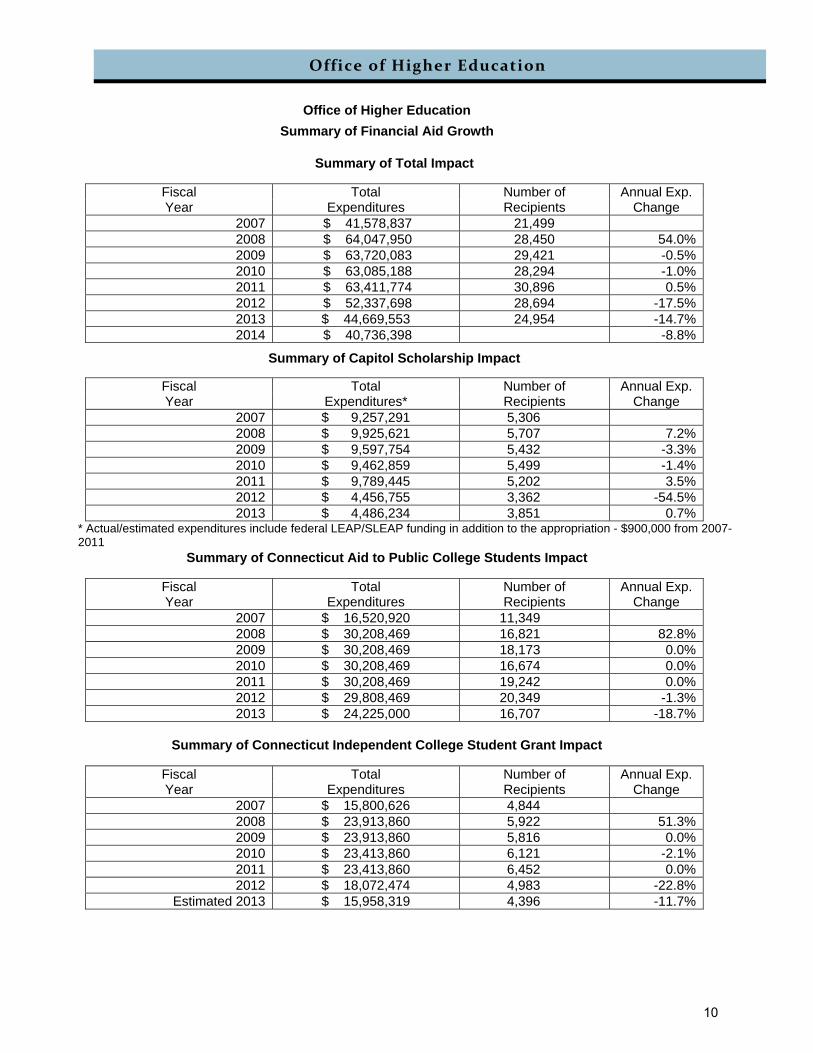
Office of Higher Education
Summary of Financial Aid Growth
Summary of Total Impact
Fiscal Total Number of Annual Exp. Year Expenditures Recipients Change
2007 $ 41,578,837 21,499 2008 $ 64,047,950 28,450 54.0%2009 $ 63,720,083 29,421 -0.5%2010 $ 63,085,188 28,294 -1.0%2011 $ 63,411,774 30,896 0.5%2012 $ 52,337,698 28,694 -17.5%
2013 $ 44,669,553 24,954 -14.7%2014 $ 40,736,398 -8.8%
Summary of Capitol Scholarship Impact
Fiscal Total Number of Annual Exp. Year Expenditures* Recipients Change
2007 $ 9,257,291 5,306 2008 $ 9,925,621 5,707 7.2%2009 $ 9,597,754 5,432 -3.3%2010 $ 9,462,859 5,499 -1.4%2011 $ 9,789,445 5,202 3.5%2012 $ 4,456,755 3,362 -54.5%2013 $ 4,486,234 3,851 0.7%
* Actual/estimated expenditures include federal LEAP/SLEAP funding in addition to the appropriation - $900,000 from 2007-2011
Summary of Connecticut Aid to Public College Students Impact
Fiscal Total Number of Annual Exp. Year Expenditures Recipients Change
2007 $ 16,520,920 11,349 2008 $ 30,208,469 16,821 82.8%2009 $ 30,208,469 18,173 0.0%2010 $ 30,208,469 16,674 0.0%2011 $ 30,208,469 19,242 0.0%2012 $ 29,808,469 20,349 -1.3%2013 $ 24,225,000 16,707 -18.7%
Summary of Connecticut Independent College Student Grant Impact
Fiscal Total Number of Annual Exp. Year Expenditures Recipients Change
2007 $ 15,800,626 4,844 2008 $ 23,913,860 5,922 51.3%2009 $ 23,913,860 5,816 0.0%2010 $ 23,413,860 6,121 -2.1%2011 $ 23,413,860 6,452 0.0%2012 $ 18,072,474 4,983 -22.8%
Estimated 2013 $ 15,958,319 4,396 -11.7%
10
Office of Higher Education
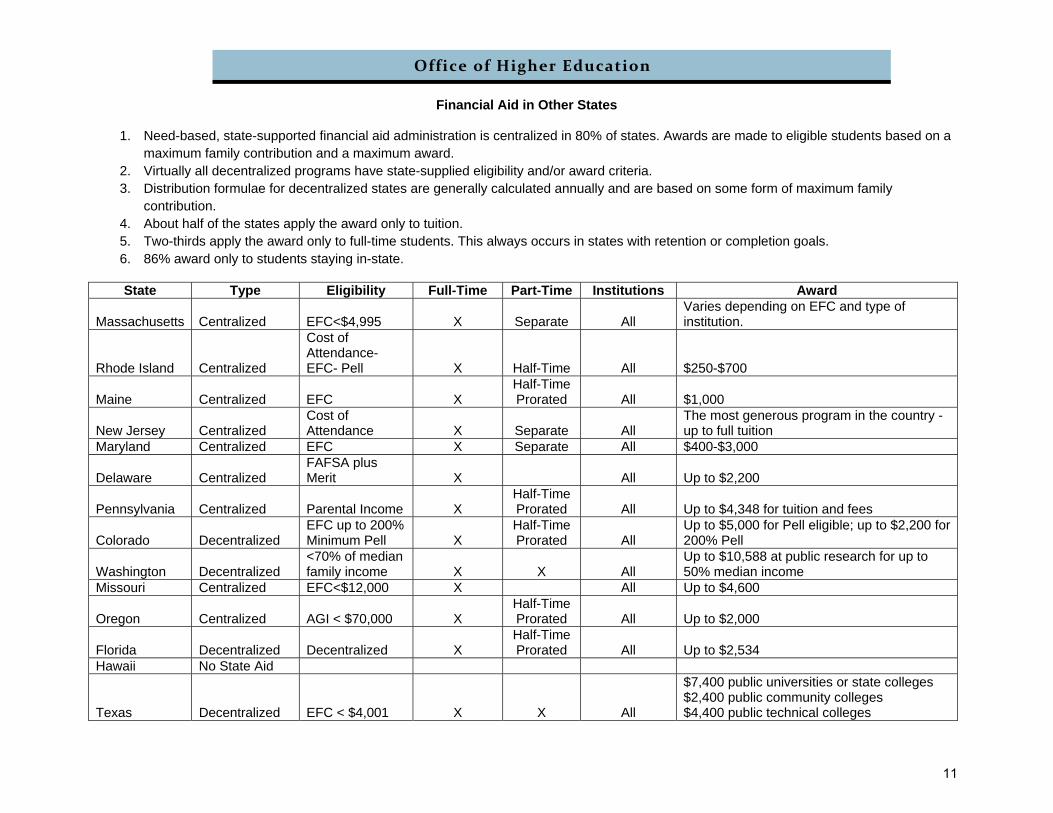
Financial Aid in Other States
1. Need-based, state-supported financial aid administration is centralized in 80% of states. Awards are made to eligible students based on a maximum family contribution and a maximum award.
2. Virtually all decentralized programs have state-supplied eligibility and/or award criteria. 3. Distribution formulae for decentralized states are generally calculated annually and are based on some form of maximum family
contribution. 4. About half of the states apply the award only to tuition. 5. Two-thirds apply the award only to full-time students. This always occurs in states with retention or completion goals. 6. 86% award only to students staying in-state.
State Type Eligibility Full-Time Part-Time Institutions Award
Massachusetts Centralized EFC<$4,995 X Separate All Varies depending on EFC and type of institution.
Rhode Island Centralized
Cost of Attendance-EFC- Pell X Half-Time All $250-$700
Maine Centralized EFC X Half-Time Prorated All $1,000
New Jersey Centralized Cost of Attendance X Separate All
The most generous program in the country - up to full tuition
Maryland Centralized EFC X Separate All $400-$3,000
Delaware Centralized FAFSA plus Merit X All Up to $2,200
Pennsylvania Centralized Parental Income X Half-Time Prorated All Up to $4,348 for tuition and fees
Colorado Decentralized EFC up to 200% Minimum Pell X
Half-Time Prorated All
Up to $5,000 for Pell eligible; up to $2,200 for 200% Pell
Washington Decentralized <70% of median family income X X All
Up to $10,588 at public research for up to 50% median income
Missouri Centralized EFC<$12,000 X All Up to $4,600
Oregon Centralized AGI < $70,000 X Half-Time Prorated All Up to $2,000
Florida Decentralized Decentralized X Half-Time Prorated All Up to $2,534
Hawaii No State Aid
Texas Decentralized EFC < $4,001 X X All
$7,400 public universities or state colleges $2,400 public community colleges $4,400 public technical colleges
11
12
Institution
2011-12 ExpendituresCONNECTICUT AID TO PUBLIC COLLEGE STUDENTS GRANT PROGRAM
Total # of Minority
Recipients
Actual Expenditure for Minorities
Total # of Community
Service Recipients
Actual Community
Service Expenditures
Total # of Aid Recipients
Expenditure Totals
(Allocation + Interest - Refunds)
Average Award
26Asnuntuck Community College $39,176 4 $10,890 144 $238,428 $1,656
868Capital Community College $1,127,037 33 $90,056 1,037 $1,475,876 $1,423
682Central Connecticut State Unive $704,891 203 $149,364 3,639 $3,308,283 $909
183Eastern Connecticut State Univ $364,863 35 $69,002 817 $1,619,317 $1,982
1,004Gateway Community College $938,066 28 $90,000 2,098 $1,583,489 $755
812Housatonic Community College $1,174,857 18 $47,135 1,209 $1,717,404 $1,421
966Manchester Community College $568,629 36 $71,253 2,255 $1,429,734 $634
127Middlesex Community College $190,116 21 $69,217 476 $575,679 $1,209
260Naugatuck Valley Community C $423,866 48 $167,206 715 $1,138,232 $1,592
49Northwestern Connecticut Com $41,625 28 $11,154 304 $215,214 $708
936Norwalk Community College $658,093 20 $56,191 1,276 $996,227 $781
45Quinebaug Valley Community C $80,563 22 $35,520 323 $530,985 $1,644
315Southern Connecticut State Uni $1,015,435 49 $127,756 1,048 $3,527,121 $3,366
132Three Rivers Community Colleg $241,666 24 $47,600 485 $888,758 $1,832
124Tunxis Community College $228,793 14 $40,323 427 $797,640 $1,868
1,364University of Connecticut $3,290,658 249 $360,692 3,402 $8,295,003 $2,438
189Western Connecticut State Univ $336,768 40 $65,486 694 $1,471,079 $2,120
$11,425,1028,082Total 872 20,349 $29,808,469$1,508,845 $1,465
Thursday, February 28, 2013 3:11:17 PM13
Institution
2011-12 ExpendituresCONNECTICUT INDEPENDENT COLLEGE STUDENT GRANT PROGRAM
Total # of Minority
Recipients
Actual Expenditure for Minorities
Total # of Community
Service Recipients
Actual Community
Service Expenditures
Total # of Aid Recipients
Expenditure Totals
(Allocation + Interest - Refunds)
Average Award
161Albertus Magnus College $602,164 24 $90,000 392 $1,515,002 $3,865
28Connecticut College $80,881 11 $5,197 126 $404,880 $3,213
112Fairfield University $642,741 11 $65,000 270 $1,409,516 $5,220
446Goodwin College, Inc. $682,973 57 $92,694 853 $1,429,187 $1,675
0Lyme Academy College of Fine $0 2 $2,689 17 $53,772 $3,163
86Mitchell College $223,977 27 $75,000 238 $628,303 $2,640
69Quinnipiac University $368,567 32 $52,703 368 $2,088,659 $5,676
126Sacred Heart University $435,780 16 $33,000 521 $1,907,896 $3,662
112St. Vincent's College $130,900 19 $42,000 300 $368,759 $1,229
41Trinity College $269,700 16 $11,279 108 $566,139 $5,242
317University of Bridgeport $780,299 10 $33,000 514 $1,283,193 $2,496
132University of Hartford $722,045 20 $120,950 460 $2,534,324 $5,509
92University of New Haven $609,968 11 $71,400 394 $2,532,977 $6,429
97University of Saint Joseph $271,750 12 $34,969 361 $1,051,321 $2,912
30Wesleyan University $154,514 10 $30,000 61 $306,764 $5,029
0Yale University $0 0 $0 0 $0
$5,976,2591,849Total 278 4,983 $18,080,692$759,881 $3,628
Thursday, February 28, 2013 2:56:47 PM14
2013 Program Report Card: Connecticut Independent College Student Grant (CICSG) (OHE)
Quality of Life Result: Connecticut residents and the state realize the career advancement and economic benefits of higher education.
Contribution to the Result: The program provides need-based grants to Connecticut residents attending Connecticut independent colleges to help defray the cost of higher education allowing students to remain in school to completion.
Actual SFY 12 Total Program Expenditures: $18,080,692 State Funding: $18,080,692 Federal Funding: $0 Other Funding: $ Estimated SFY 13 Total Program Expenditures: $15,958,319 State Funding: $15,958,319 Federal Funding: $0 Other Funding: $
Partners: Connecticut independent colleges and universities
1
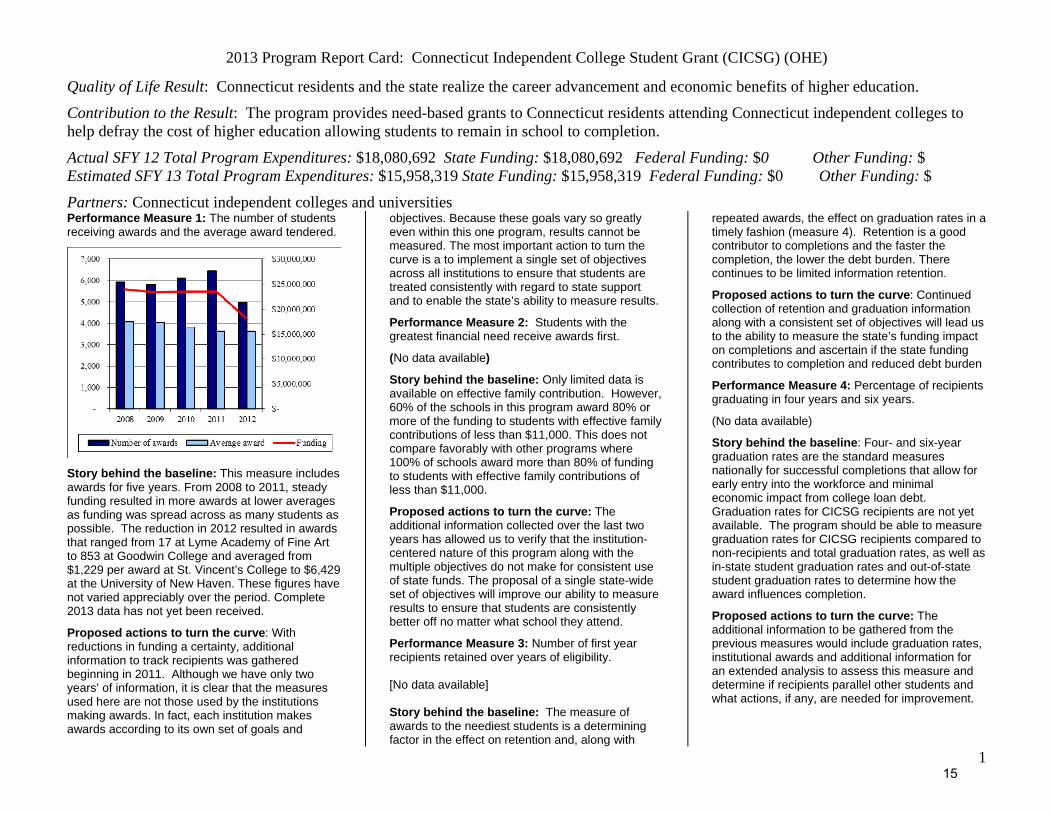
Performance Measure 1: The number of students receiving awards and the average award tendered.
Story behind the baseline: This measure includes awards for five years. From 2008 to 2011, steady funding resulted in more awards at lower averages as funding was spread across as many students as possible. The reduction in 2012 resulted in awards that ranged from 17 at Lyme Academy of Fine Art to 853 at Goodwin College and averaged from $1,229 per award at St. Vincent’s College to $6,429 at the University of New Haven. These figures have not varied appreciably over the period. Complete 2013 data has not yet been received.
Proposed actions to turn the curve: With reductions in funding a certainty, additional information to track recipients was gathered beginning in 2011. Although we have only two years’ of information, it is clear that the measures used here are not those used by the institutions making awards. In fact, each institution makes awards according to its own set of goals and
objectives. Because these goals vary so greatly even within this one program, results cannot be measured. The most important action to turn the curve is a to implement a single set of objectives across all institutions to ensure that students are treated consistently with regard to state support and to enable the state’s ability to measure results.
Performance Measure 2: Students with the greatest financial need receive awards first.
(No data available)
Story behind the baseline: Only limited data is available on effective family contribution. However, 60% of the schools in this program award 80% or more of the funding to students with effective family contributions of less than $11,000. This does not compare favorably with other programs where 100% of schools award more than 80% of funding to students with effective family contributions of less than $11,000.
Proposed actions to turn the curve: The additional information collected over the last two years has allowed us to verify that the institution-centered nature of this program along with the multiple objectives do not make for consistent use of state funds. The proposal of a single state-wide set of objectives will improve our ability to measure results to ensure that students are consistently better off no matter what school they attend.
Performance Measure 3: Number of first year recipients retained over years of eligibility. [No data available] Story behind the baseline: The measure of awards to the neediest students is a determining factor in the effect on retention and, along with
repeated awards, the effect on graduation rates in a timely fashion (measure 4). Retention is a good contributor to completions and the faster the completion, the lower the debt burden. There continues to be limited information retention.
Proposed actions to turn the curve: Continued collection of retention and graduation information along with a consistent set of objectives will lead us to the ability to measure the state’s funding impact on completions and ascertain if the state funding contributes to completion and reduced debt burden
Performance Measure 4: Percentage of recipients graduating in four years and six years.
(No data available)
Story behind the baseline: Four- and six-year graduation rates are the standard measures nationally for successful completions that allow for early entry into the workforce and minimal economic impact from college loan debt. Graduation rates for CICSG recipients are not yet available. The program should be able to measure graduation rates for CICSG recipients compared to non-recipients and total graduation rates, as well as in-state student graduation rates and out-of-state student graduation rates to determine how the award influences completion.
Proposed actions to turn the curve: The additional information to be gathered from the previous measures would include graduation rates, institutional awards and additional information for an extended analysis to assess this measure and determine if recipients parallel other students and what actions, if any, are needed for improvement.
15
O f f i c e o f H i g h e r E d u c a t i o n
Connecticut - Germany Student Exchange The Connecticut - Baden-Württemberg Germany Student Exchange (CT-BW Germany Exchange) provides opportunities for college and university students from all disciplines to receive credit for studies at institutions in the partner-state, and promotes the larger goals of economic development and cultural understanding. By helping to build a workforce with international and intercultural skills, the CT-BW Germany Exchange supports efforts to increase Connecticut’s exports as well as the number of foreign companies investing in Connecticut. Germany is among Connecticut’s top three trade partners. The CT-BW Germany Exchange began in 1991 as the result of a legislative partnership between the State of Connecticut and the German State of Baden-Württemberg. This year, 57 Connecticut students attended college in Germany while 51 German students came to Connecticut for study. Another 30 students from Connecticut studied in Germany in summer 2012. German and engineering continue to be the most popular majors of Connecticut students, while the German students concentrate on English, economics/business administration and engineering. Connecticut is fortunate to have a higher education partner eager to cooperate and collaborate in a vigorous student exchange, in basic and applied research, the transfer of technology, and in a large range of economic and cultural activities. The Parliament of Baden-Württemberg supports Connecticut students with an annual scholarship fund of $250,000. This is distributed as $125,000 to replace the nine Yale doctoral students’ teaching fellowships and $125,000 to support the difference between the nine month U.S. academic year and the eleven month German year for the 48 undergraduates. The Connecticut portion of the program generates $112,500 in revenue annually and expends $110,000. The revenue comes from $66,500 in state support and $46,000 in student fees. It is expended as $63,000 in student grants for the 57 students studying in Germany; $28,000 for a part-time support staff member and $19,000 for other expenses, primarily travel to Germany for the program coordinator. Students are charged fees of $625 per full year for this program on top of annual tuition, which goes to the student’s home institution. These fees would have to increase at least 140% to $1,500 per year to cover the loss of state support. Since its inception, the CT-BW Exchange has:
Facilitated the exchange of over 1,500 students with Baden-Württemberg for a semester or the academic year;
Made it possible for an additional 375 Connecticut students to study in summer programs in Germany;
Placed over 80 Connecticut engineering students in internships in German companies and research institutes;
Placed over 90 German students as unpaid summer interns in Connecticut civic organizations and companies for the summer; and,
Facilitated over 80 faculty contacts with research facilities and university campuses in Germany. On average, ten Connecticut engineering students perform internships in Germany as part of their studies each year with two trends emerging: Many interns are eager to gain experience in the car industry and choose to intern with Mercedes, Porsche, BMW and Audi. Another large group has interned with various Fraunhofer Institutes in Freiburg and Stuttgart. Fraunhofer is Europe’s largest application-oriented research organization. Fraunhofer will soon be opening a research center in the new Tech Park in Storrs. Both the CT-BW-Germany Exchange and the UConn engineering students have played a role in this accomplishment Baden-Württemberg is the home of some of Europe’s oldest and finest universities: Heidelberg, Freiburg, Tübingen, Mannheim, Karlsruhe, Stuttgart, Konstanz, Hohenheim, and Ulm. With a population of 11 million, Baden-Württemberg is the third largest of 16 German states and one of the most prosperous regions in Germany. It is the center of automotive, electronic and biomedical industries. More than 60 German companies are located in CT. Among the larger ones are Boehringer Ingelheim in Ridgefield, Henkel of America (also know at Henkel-Loctite) in Rocky Hill, Beiersdof, Inc. in Wilton, Trumpf, Inc. in Farmington and MTU Aeroengines in Rocky Hill.
16
Office of Higher Education
Alternate Route to Certification Program -- Fact Sheet
Overview of ARC The Alternate Route to Certification (ARC) Program, one of the oldest alternate route to certification programs in the nation, was created in 1986 via the Education Enhancement Act to encourage talented, mid-career adults with strong academic and professional skills to enter the teaching profession. The program has expanded to help meet critical teacher shortage areas in certain academic subjects identified by school districts and the Connecticut State Department of Education and to increase recruitment, training, and employment of minority teacher candidates. The “2011 National Council of Teacher Quality Policy Yearbook” ranked Connecticut as a “Best Practices
State” for Alternate Route preparation. NCTQ cited that Connecticut offers streamlined programs that meet state needs for new teachers via preparation aligned with appropriate content training and pedagogy, field and clinical placement experiences, and mentoring.
There are currently seven ARC certification offerings including English, Family and Consumer Sciences, Mathematics, Music, Science (Biology, Chemistry, Earth Science, General Science and Physics), Technology Education, and World Languages
ARC is a highly selective and competitive program admitting approximately 43.5% of the candidates who have applied to the program from 1988 to 2012.
Out of 19 approved teacher preparation programs by the Connecticut State Department of Education, ARC is currently the sixth largest preparer of newly certified teachers in Connecticut. ARC is also the fourth largest preparer of minority teacher candidates in the state.
Since the inception of the program in 1988, a total of 4,645 graduates have been prepared for teacher certification.
The overall employment rate for ARC graduates by public school districts since 1988 is 81%.
The total number of *first-time certificates offered to graduates since 1988 is 3,769. A breakdown of certificates offered by subject area since 1988 is available in the RBA summary.
Secondary, 7-12: 1,742 Middle Grades, 4-8: 783 Special Subjects, PreK-12: 1,244 Total: 3,769
*There is a distinction between first-time teacher certificates issued for ARC graduates vs. those issued to graduates from traditional programs. Refer to the information in the next section – “Facts about Graduate Hiring Rates” – for more information about hiring trends during the timeframe of 2007-2012 for shortage and non-shortage certification areas.
Approximate percentage of employed graduates working in the following districts during the timeframe of 1988-2012: Urban: 41.38% Rural/Suburban: 58.61%
Since 2006, ARC has documented 49 teacher-of-the-year and related designations for graduates of the ARC
Program. Most recently in 2012-13, four graduates were recognized in Danbury (Biology), Enfield (Physics and Chemistry), the CT Technical High Schools (Secondary Mathematics), and Weston (Middle Grades, English)
Collaborations with K-12 Districts and Other State Partnerships
ARC has a record of being an innovative training resource, and has created several special programs and satellite operations during times of intensive hiring need, specifically for urban districts. Some examples include the Hartford Teaching Fellows Program, the Urban Fellows Program in New Haven and Waterbury, and satellite training locations in partnership with the Bridgeport and New Haven Public Schools.
During the summer ARC I Program, professional development school partnerships are also in place with several different districts/summer school programs including ConnCAP-Central Connecticut State University,
17
Office of Higher Education
East Hartford, Glastonbury, Middletown, Rocky Hill, Two Rivers Magnet Middle School-East Hartford (CREC), and West Hartford.
ARC also collaborated with United Technologies, Boehringer-Ingelheim Pharmaceuticals and Northeast Utilities to encourage qualified professionals in the STEM fields to enter the teaching profession. Finally, ARC works with community colleges, regional education service centers, Charter Oak State College and other related institutions to offer workshops to citizens interested in teacher certification and career transitions.
Facts about ARC Graduate Hiring Rates
ARC graduates are issued an official first-time teacher certificate upon hire by a public school system for a permanent, contractual ‘’teacher-of-record” position, whereas traditional graduates may apply for a first-time certificate without employment. Thus, the data for ARC certificates issued is a true indication of employment of ARC graduates.
The following data reflects hiring rates for positions offered only in public schools aligned with the issuance of a 90-day certificate. This data does not include official hires in nonpublic schools, education-related K-12 positions such as tutor or paraprofessional, or long-term substitute assignments.
Shortage areas designated in bold are determined by the Connecticut State Department of Education on an annual basis. Shortage area designations change based on district hiring needs and State Department reporting and analysis. An annual list is publicized by the Commissioner of Education for each academic year.
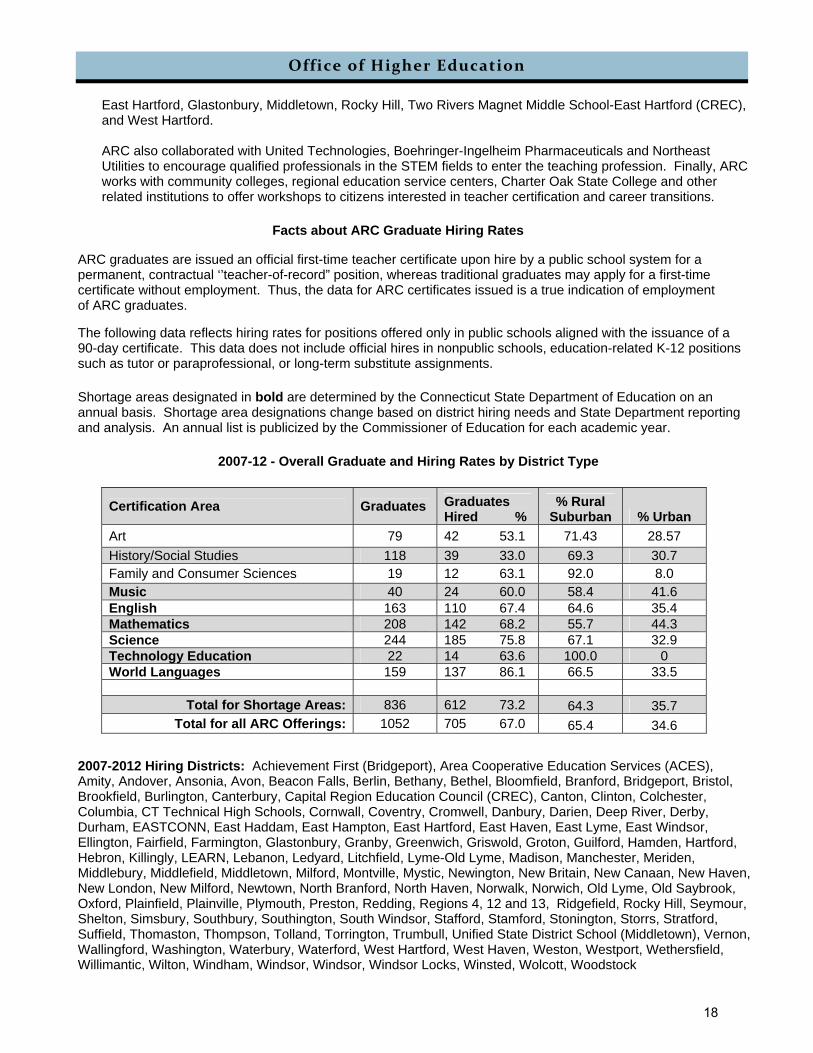
2007-12 - Overall Graduate and Hiring Rates by District Type
Certification Area Graduates Graduates Hired %
% Rural Suburban % Urban
Art 79 42 53.1 71.43 28.57
History/Social Studies 118 39 33.0 69.3 30.7 Family and Consumer Sciences 19 12 63.1 92.0 8.0 Music 40 24 60.0 58.4 41.6 English 163 110 67.4 64.6 35.4 Mathematics 208 142 68.2 55.7 44.3 Science 244 185 75.8 67.1 32.9 Technology Education 22 14 63.6 100.0 0 World Languages 159 137 86.1 66.5 33.5
Total for Shortage Areas: 836 612 73.2 64.3 35.7
Total for all ARC Offerings: 1052 705 67.0 65.4 34.6
2007-2012 Hiring Districts: Achievement First (Bridgeport), Area Cooperative Education Services (ACES), Amity, Andover, Ansonia, Avon, Beacon Falls, Berlin, Bethany, Bethel, Bloomfield, Branford, Bridgeport, Bristol, Brookfield, Burlington, Canterbury, Capital Region Education Council (CREC), Canton, Clinton, Colchester, Columbia, CT Technical High Schools, Cornwall, Coventry, Cromwell, Danbury, Darien, Deep River, Derby, Durham, EASTCONN, East Haddam, East Hampton, East Hartford, East Haven, East Lyme, East Windsor, Ellington, Fairfield, Farmington, Glastonbury, Granby, Greenwich, Griswold, Groton, Guilford, Hamden, Hartford, Hebron, Killingly, LEARN, Lebanon, Ledyard, Litchfield, Lyme-Old Lyme, Madison, Manchester, Meriden, Middlebury, Middlefield, Middletown, Milford, Montville, Mystic, Newington, New Britain, New Canaan, New Haven, New London, New Milford, Newtown, North Branford, North Haven, Norwalk, Norwich, Old Lyme, Old Saybrook, Oxford, Plainfield, Plainville, Plymouth, Preston, Redding, Regions 4, 12 and 13, Ridgefield, Rocky Hill, Seymour, Shelton, Simsbury, Southbury, Southington, South Windsor, Stafford, Stamford, Stonington, Storrs, Stratford, Suffield, Thomaston, Thompson, Tolland, Torrington, Trumbull, Unified State District School (Middletown), Vernon, Wallingford, Washington, Waterbury, Waterford, West Hartford, West Haven, Weston, Westport, Wethersfield, Willimantic, Wilton, Windham, Windsor, Windsor, Windsor Locks, Winsted, Wolcott, Woodstock
18
2013 Program Report Card: Connecticut Alternate Route to Certification (ARC) (DHE)
Quality of Life Result: All Pre-K through 12 Connecticut students achieve success in school.
Contribution to Result: ARC prepares mid-career adults with backgrounds in content disciplines, specifically shortage areas, for careers in teaching and thereby provides a high quality education that contributes to the success of students. Out of 19 approved state preparation programs, ARC is currently the sixth largest preparer of newly certified teachers in Connecticut and is also the fourth largest preparer of minority teacher candidates in the state.
Actual SFY 12 Total Program Expenditures: $713,509 State Funding: $100,000 Federal Funding: $0 Other Funding: $606,325 Estimated SFY 13 Total Program Expenditures: $722,491 State Funding: $81,016 Federal Funding: $0 Other Funding: $429,300
Partners: CSDE, K-12 school districts, corporate, non-profits and federal grants.
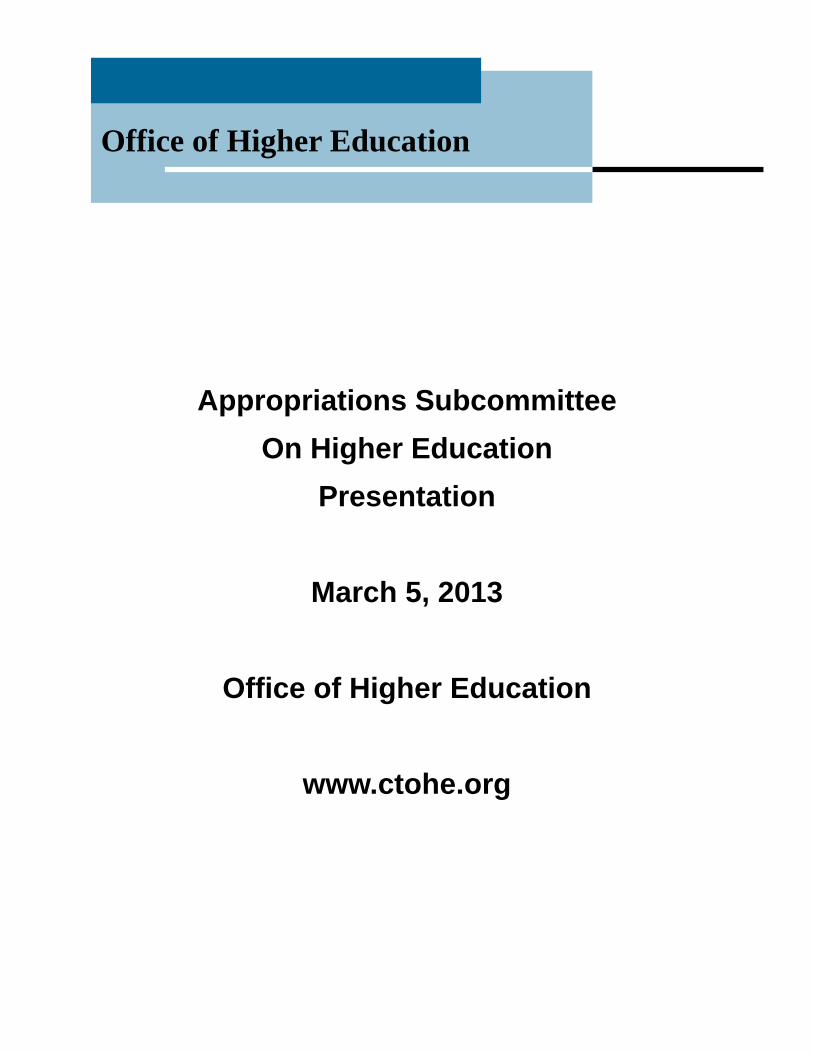
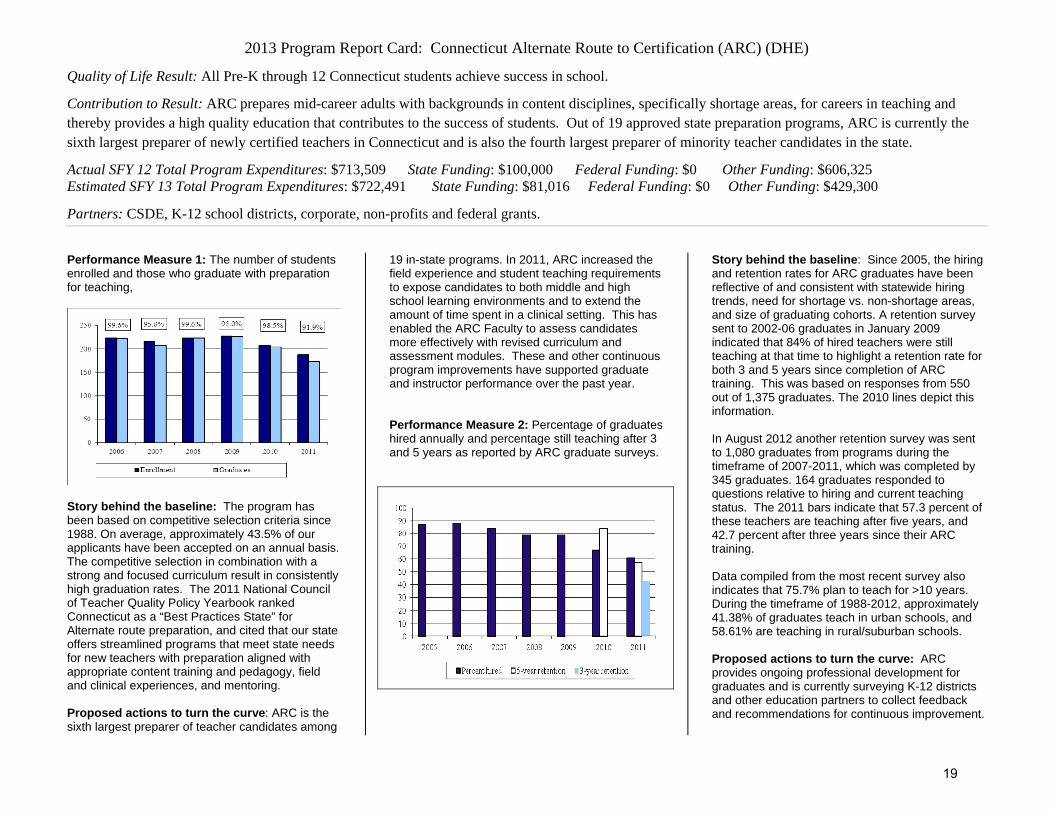
Performance Measure 1: The number of students enrolled and those who graduate with preparation for teaching,
Story behind the baseline: The program has been based on competitive selection criteria since 1988. On average, approximately 43.5% of our applicants have been accepted on an annual basis. The competitive selection in combination with a strong and focused curriculum result in consistently high graduation rates. The 2011 National Council of Teacher Quality Policy Yearbook ranked Connecticut as a “Best Practices State” for Alternate route preparation, and cited that our state offers streamlined programs that meet state needs for new teachers with preparation aligned with appropriate content training and pedagogy, field and clinical experiences, and mentoring. Proposed actions to turn the curve: ARC is the sixth largest preparer of teacher candidates among
19 in-state programs. In 2011, ARC increased the field experience and student teaching requirements to expose candidates to both middle and high school learning environments and to extend the amount of time spent in a clinical setting. This has enabled the ARC Faculty to assess candidates more effectively with revised curriculum and assessment modules. These and other continuous program improvements have supported graduate and instructor performance over the past year. Performance Measure 2: Percentage of graduates hired annually and percentage still teaching after 3 and 5 years as reported by ARC graduate surveys.
Story behind the baseline: Since 2005, the hiring and retention rates for ARC graduates have been reflective of and consistent with statewide hiring trends, need for shortage vs. non-shortage areas, and size of graduating cohorts. A retention survey sent to 2002-06 graduates in January 2009 indicated that 84% of hired teachers were still teaching at that time to highlight a retention rate for both 3 and 5 years since completion of ARC training. This was based on responses from 550 out of 1,375 graduates. The 2010 lines depict this information. In August 2012 another retention survey was sent to 1,080 graduates from programs during the timeframe of 2007-2011, which was completed by 345 graduates. 164 graduates responded to questions relative to hiring and current teaching status. The 2011 bars indicate that 57.3 percent of these teachers are teaching after five years, and 42.7 percent after three years since their ARC training. Data compiled from the most recent survey also indicates that 75.7% plan to teach for >10 years. During the timeframe of 1988-2012, approximately 41.38% of graduates teach in urban schools, and 58.61% are teaching in rural/suburban schools. Proposed actions to turn the curve: ARC provides ongoing professional development for graduates and is currently surveying K-12 districts and other education partners to collect feedback and recommendations for continuous improvement.
19
2013 Program Report Card: Connecticut Alternate Route to Certification (ARC) (DHE)
Quality of Life Result: All Pre-K through 12 Connecticut students achieve success in school.
Contribution to Result: ARC prepares mid-career adults with backgrounds in content disciplines, specifically shortage areas, for careers in teaching and thereby provides a high quality education that contributes to the success of students. Out of 19 approved state preparation programs, ARC is currently the sixth largest preparer of newly certified teachers in Connecticut and is also the fourth largest preparer of minority teacher candidates in the state.
Actual SFY 12 Total Program Expenditures: $713,509 State Funding: $100,000 Federal Funding: $0 Other Funding: $606,325 Estimated SFY 13 Total Program Expenditures: $722,491 State Funding: $81,016 Federal Funding: $0 Other Funding: $429,300
Partners: CSDE, K-12 school districts, corporate, non-profits and federal grants.
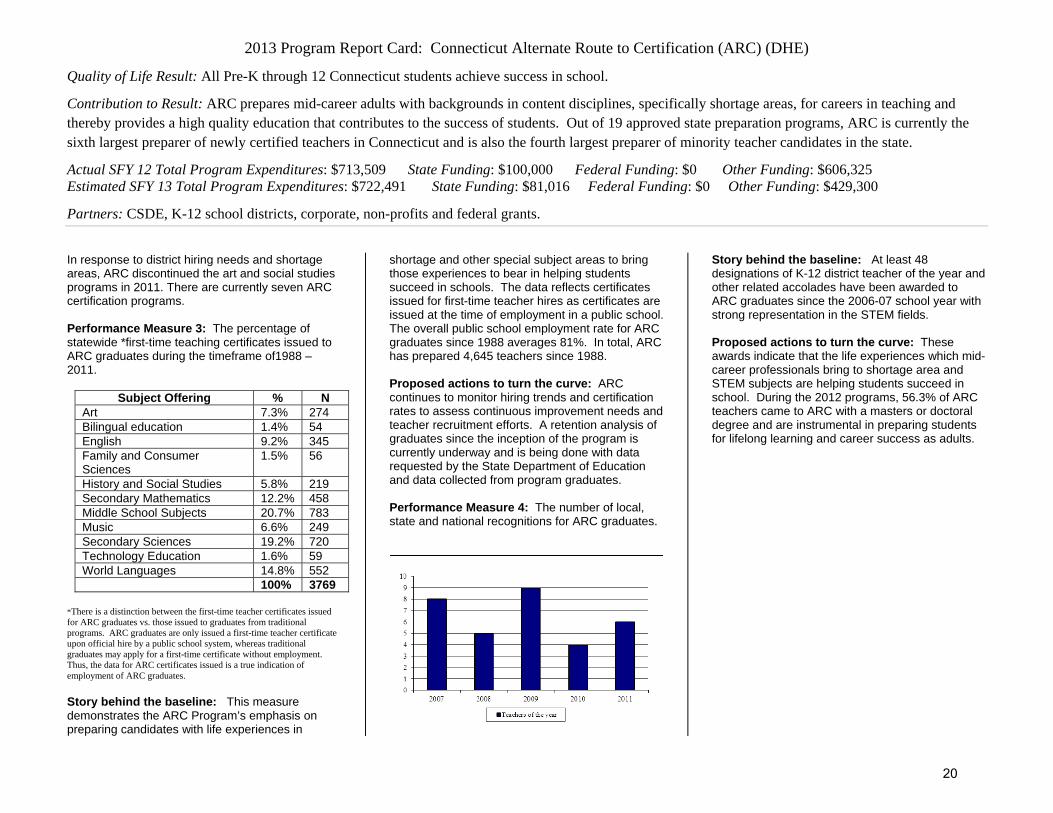
In response to district hiring needs and shortage areas, ARC discontinued the art and social studies programs in 2011. There are currently seven ARC certification programs. Performance Measure 3: The percentage of statewide *first-time teaching certificates issued to ARC graduates during the timeframe of1988 – 2011.
Subject Offering % NArt 7.3% 274 Bilingual education 1.4% 54 English 9.2% 345 Family and Consumer Sciences
1.5% 56
History and Social Studies 5.8% 219 Secondary Mathematics 12.2% 458 Middle School Subjects 20.7% 783 Music 6.6% 249 Secondary Sciences 19.2% 720 Technology Education 1.6% 59 World Languages 14.8% 552 100% 3769
*There is a distinction between the first-time teacher certificates issued for ARC graduates vs. those issued to graduates from traditional programs. ARC graduates are only issued a first-time teacher certificate upon official hire by a public school system, whereas traditional graduates may apply for a first-time certificate without employment. Thus, the data for ARC certificates issued is a true indication of employment of ARC graduates.
Story behind the baseline: This measure demonstrates the ARC Program’s emphasis on preparing candidates with life experiences in
shortage and other special subject areas to bring those experiences to bear in helping students succeed in schools. The data reflects certificates issued for first-time teacher hires as certificates are issued at the time of employment in a public school. The overall public school employment rate for ARC graduates since 1988 averages 81%. In total, ARC has prepared 4,645 teachers since 1988. Proposed actions to turn the curve: ARC continues to monitor hiring trends and certification rates to assess continuous improvement needs and teacher recruitment efforts. A retention analysis of graduates since the inception of the program is currently underway and is being done with data requested by the State Department of Education and data collected from program graduates. Performance Measure 4: The number of local, state and national recognitions for ARC graduates.
Story behind the baseline: At least 48 designations of K-12 district teacher of the year and other related accolades have been awarded to ARC graduates since the 2006-07 school year with strong representation in the STEM fields. Proposed actions to turn the curve: These awards indicate that the life experiences which mid-career professionals bring to shortage area and STEM subjects are helping students succeed in school. During the 2012 programs, 56.3% of ARC teachers came to ARC with a masters or doctoral degree and are instrumental in preparing students for lifelong learning and career success as adults.
20