Embed Size (px)
Citation preview
1
BRIEFINGfor the
PRESIDENT’S COMMISSIONon the
UNITED STATES POSTAL SERVICE
January 8, 2003

2
Outline
BackgroundCurrent Overview Transformation Plan

3
Postal Reorganization Act of 1970
Universal Service Mandate: Access and delivery to virtually everyone, everywhere, everyday.
Statutory Requirement: “ [The Postal Service] shall provide prompt, reliable, and efficient services to patrons in all areas and shall render postal services to all communities.”

4
Postal Reorganization Act of 1970
Universal Service Mandate: Access and delivery to virtually everyone, everywhere, everyday.
Business Model Premise: Moderate volume growth and postage rate increases at or below the economy’s rate of inflation would finance universal service and the ever-expanding delivery network.

5
Universal Delivery Service
3,400 New Carrier Routes
4,800 New 80 New Delivery Facilities
Carriersat $5.0 Million Each

6
1971 – 2002 Comparisons
1971 2002 %Change
81 139 72%Delivery Points (Millions)
87 203 133%Volume (Billions)
731 854 17%Employees (Thousands)

7
CPI vs. First-Class Postage Rates
First-Class Postage
CPI
0
50
100
150
200
250
300
350
400
Cum
ulat
ive
% C
hang
e
May718¢
Mar7410¢
Dec7513¢
May7815¢
Mar8118¢
Nov8120¢
Feb8522¢
Apr8825¢
Feb9129¢
Jan9532¢
Jan9933¢
Jan0134¢
Jun0237¢

8
Post Office Department and Postal Service
Post Office Department1942-1971
United States Postal Service
1972-2002(Cumulative)Financial Results
Revenue $90 $1,108
Expense 109 1,114
Deficit ($19) ($6)
Revenue/Expense 82.6% 99.5%
$Billions
9
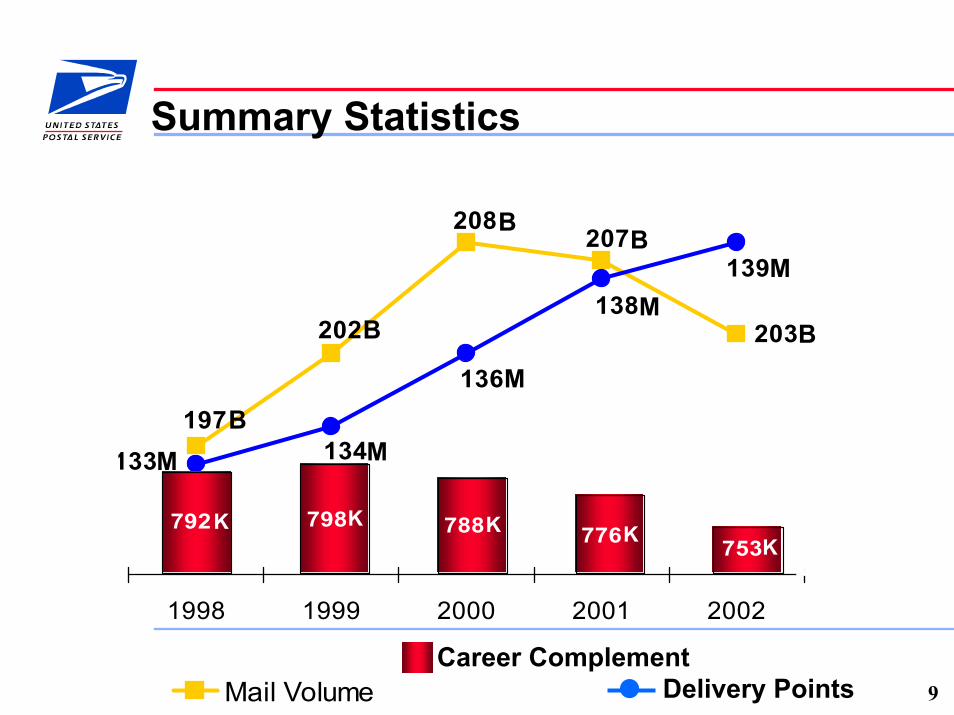
Summary Statistics
203
207208
202
197
139138
136
134133
190192194196198200202204206208210
1998 1999 2000 2001 2002130131132133134135136137138139140
Mail Volume
753776788798792
Delivery Points
B
B
B B
B
MM
M
M
M
K K K K K
Career Complement

10
Annual Net Margin
0.9% 0.6%
-0.3%
-2.6%-1.0%
-5%-4%-3%-2%-1%0%1%2%3%4%5%6%7%8%9%
10%
1998 1999 2000 2001 2002
Net Margin = Net Income (or Loss) / Revenue

11
Growth in Revenue Per Delivery Point
1.9%
3.0%
1.7%
0.5%
-0.7%1998 1999 2000 2001 2002FY
15% Rate Increase: 5%

12
Revenue Composition - FY 2002
First-Class55%
Other 11%
Standard 24%
Package Services 3%Priority 7%
(Mostly Advertising)

13
Expense Composition - FY 2002
Compensation/Benefits 79%
Transportation 8%
Other 13%

14
57%
Volume Variable
43%
"Fixed" $29B
57%
$38B$38B
FY 2001 Expenses

15
“Fixed”vs Volume-Variable Costs FY 2001
Volume-Variable Costs Include:- Transportation− Mail Distribution Work Hours− Mail Containers− Fuel− Retail Transactions− Delivery Carrier Prep in Office
“Fixed” Costs include:- 38,000 Post Office, Station, and
Branch Operations− Del. Rte. Coverage - 240,000 Delivery Rts.− 215,000 Vehicles− Retirement Costs− Overhead
43%
"Fixed" $29B
FY 2001 ExpensesFY 2001 Expenses
57%
Volume-Variable $38B

16
First-Class MailMajor Contribution to “Fixed” Costs
Volume RevenueContribution to“Fixed” Costs
First-Class50%
Other50%
First-Class54%
Other46%
First-Class66% Other
34%
FY 2001
17
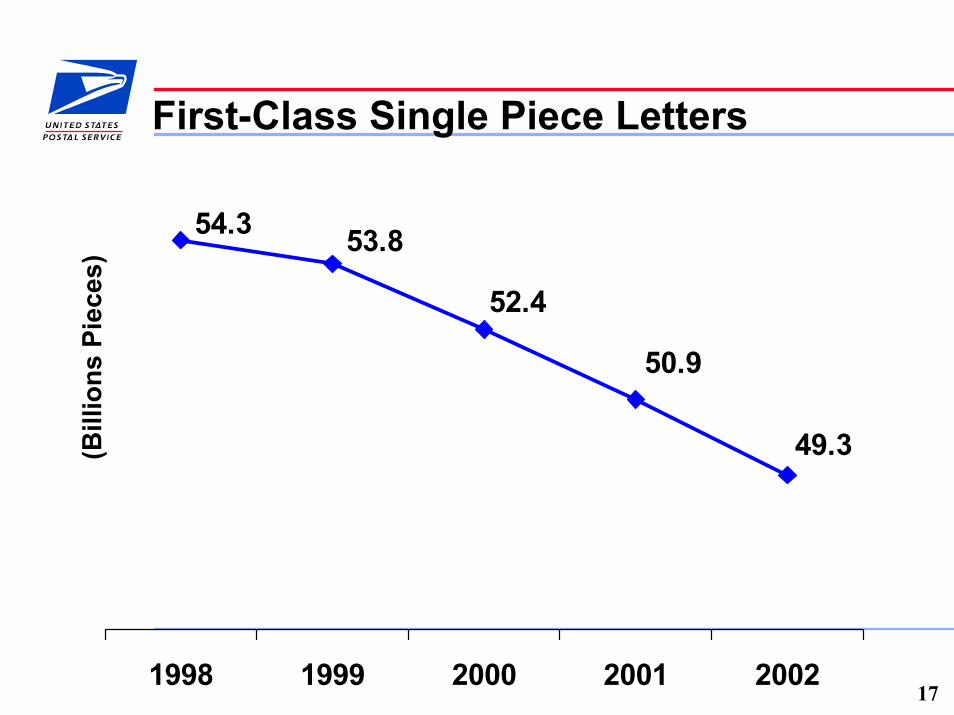
First-Class Single Piece Letters
49.3
50.9
52.4
54.3 53.8
1998 1999 2000 2001 2002
(Bill
ions
Pie
ces)

18
First-Class Mail-Sector Analysis
Household to Nonhousehold
Household toHousehold
Nonhousehold to Household
Nonhousehold to Nonhousehold
9% 7%13% 15%
37%
26%
41%
52%19872001
Source: Household Diary Study

19
Standard Mail Volume 1987 and 2001
4575
15
15
1987 2001
To Households To Nonhouseholds
90B
60BB
B
BB

20
Standard Mail Volume
82.5
85.787.2
89.990.1
1998 1999 2000 2001 2002FY
Bill
ions
of P
iece
s

21
Standard Mail VolumeMarket Share 1972- 2002
20.0% 21.2%
39.7%25.1%
24.6% 28.5%32.1%
14.7% 17.3%
21.0%
34.2%
19.3%
1972 1987 2002
Direct MailDirect MailInternet AdvertisingInternet Advertising
Radio & Television/CableRadio & Television/Cable
Newspapers & MagazinesNewspapers & Magazines
OtherOther
(2.3%)14.7% 17.3% 19.3%
Source: McCann-Erickson WorldGroup

22
UPS78%
FedEx12%
All Other
4%USPS
6%
USPS21%
All Others
3%
FedEx36%
UPS30%
Package Services
Air Ground
Source: Colography Group
Revenue Share FY 2001Airborne
10%

23
First-Class Mail – FY 2001Major Contribution to “Fixed” Costs
Volume RevenueContribution to“Fixed” Costs
First-Class50%
Other50%
First-Class54%
Other46%
First-Class66% Other
34%

24
Financial Effect
Standard Mail
or Priority Mail
or Express Mail
or Parcel Post
7.1 B
313 M
50 M
1.5 B
8%
26%
70%
465%
VolumeIncrease % Growth
From $1 Billion of First-Class Mail RevenueVolume Necessary to Replace Contribution

25
Competition and Technology
First-Class Mail
•Business eMail
•Electronic Bill Payment
Standard Mail
•Print/Broadcast Media
•Internet Advertising
Packages•No Longer the Only Nationwide Package Service
Periodicals
•Internet News Sources
•Lifestyle Changes

26
Strategy: Achieve Lowest Combined CostProgression of Customer Worksharing Options
1970’s 1980’s 1990’s•Presorted Bundles
•Presorted Trays
•Presorted Bundles
•PrebarcodePieces
•PrebarcodePieces
$15 Billion Current Annual Discounts
•Dropship

27
Postal OperationsStrategy: Achieve Lowest Combined Cost
1970’s 1980’s 2000’s1990’s
•Automated Letter Distribution
•Automated Flat and Parcel Processing
•“Network Optimization”
•Mechanized Mail Processing
•Delivery Point Sequencing
1970 Postal Reorganization• Capital Investment Financing• Self-Directed Research• Longer Term Planning

28
Pricing Cycle
Five MonthsFive MonthsPreparationPreparation
Rate Case LitigationRate Case LitigationRate Case LitigationTen MonthsTen Months
Implementation
Governors’ Consideration
ThreeMonthsThreeMonths

29
Rate Increases & Economic ConditionsRate Increases and Economic Conditions
16%18%
10%
3%
15%
25%
30%
15%
33%
10%
33%
11
21
319741975197619771978197919801981198219831984198519861987198819891990199119921993199419951996199719981999200020012002
40%
35%
30%
25%
20%
15%
10%
5%
0%
197 97 97
First-Class First Ounce Rate Increase RecessionsAverage Rate Increase – All Classes – 2001 and 2002 increases implemented in 3 steps

30
Financial Stress
$ 11 BDebt
$ 19 BOther Liabilities
(Excluding CSRS)
($40 – 50 B)Retiree Health
Benefits Obligation
$ 6 BCumulative Losses
(Since 1971)

31
Financial Stress - Equity
-$810-$447
-$646
-$2,326
-$3,002
1998 1999 2000 2001 2002
MM
M
M
M

32
TRANSFORMATION PLAN

33
Transformation Plan
“Push the Envelope”
Legislation – Short Term– Public Policy Issues

34
Transformation Plan
“Push the Envelope”
Growth
Efficiency
Performance Based Culture

35
Transformation Plan – Results to Date
Service
Externally Measured
Service At Record Levels

36
-11M-23M
-77M
FY 2000 FY 2001 FY 2002
Cumulative Work Hour Reductions
-34M
-111M
Transformation Plan – Results to DateWork Hour Reductions
111 Million Work Hour Reduction -Equivalent to 62,960 Full-Time Employees

37
Transformation Plan – Results to Date
-11,685
-22,963
FY 2000 FY 2001 FY 2002
-10,533
-22,218
-45,181
AP 04
Career Complement Reductions

38
Transformation Plan - Results to Date
First Ever Expense Reduction – $200 Million Below 2001 LevelLabor Contracts – In Place to Provide Stability
Record Setting Safety Performance
Negotiated Rate Settlement/Expedited Implementation
Delivered $1.5 Billion of Cost SavingsGoal - $5 Billion By 2006

39
BRIEFINGfor the
PRESIDENT’S COMMISSIONon the
UNITED STATES POSTAL SERVICE
January 8, 2003