Embed Size (px)
Citation preview
This file is part of the following reference:
Briffa, Tony Edward (2004) The partitioning of trace metals in the sediments of Lake Moondarra. PhD
thesis, James Cook University
Access to this file is available from:
http://eprints.jcu.edu.au/11914
The Partitioning of Trace Metals in the Sediments of Lake Moondarra
A thesis presented for the degree of
Doctor of Philosophy
at
James Cook University
by
Tony Edward Briffa
August 2004
Acknowledgements
I would like to thank Mount Isa Mines Limited (MIM) for funding the research that is
reported in this thesis. In particular I would like to acknowledge the help given to me
by Mr. Oscar Kadletz (MIM) , Ian Brown (MIM) and the MIM dive team. Mr.
Michael Ridgeway who allowed me to use the chemical laboratory facilities at MIM.
Mr John Knights (MIM) for his assistance in identifying the mineral components of
the sediment.
I am also grateful for the advice and encouragement given to me by my supervisor Dr.
Michael Ridd.
Finally, I would like to thank my family, Susan, Maree-Louise and Luke for their
patience, understanding and encouragement during the years that I have studied,
culminating in the completion of this thesis.
ii
Statement of sources
I declare that this thesis is my own work and has not been submitted in any form for
another degree or diploma at any university or other institution of tertiary education.
Information derived from published or unpublished work of others has been
acknowledged in the text and a list of references provided.
iv
Statement of access
I, Tony Edward Briffa, the author of this thesis, understand that James Cook
University will not make this thesis available within the University Library without
first obtaining written permission from me prior to allowing access in accordance with
the agreement between James Cook University and myself. This agreement was put in
place at the request of Mount Isa Mines who sponsored the study. All users who have
got written permission to consult this thesis must sign the following statement.
In consulting this thesis I agree not to copy or closely paraphrase it in whole or in part
without the consent of the author, and to make proper written acknowledgment for
any assistance which I have obtained form it.
, / -...... (!.. if P. .f/. ~ P. ~~ ....... .
iii
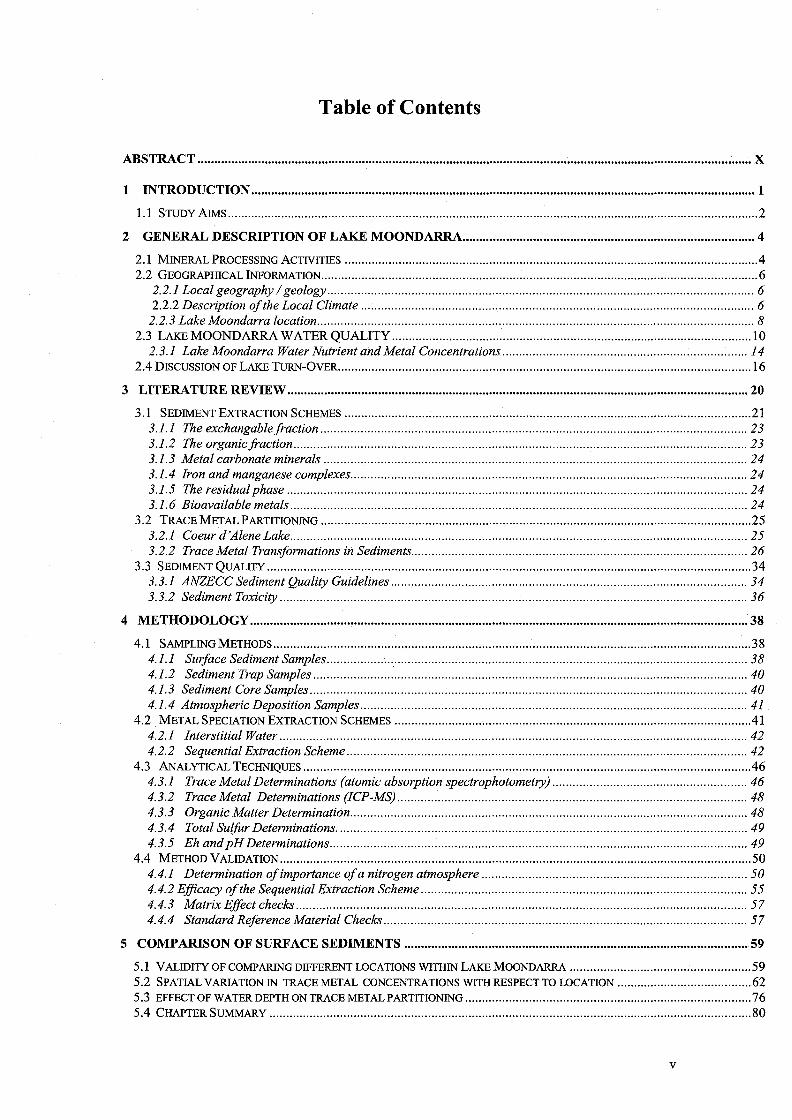
Table of Contents
ABSTRACT ..................................................................................................................................................................... X
1 INTRODUCTION ...................................................................................................................................................... 1
1.1 STUDY AIMs .............................................................................................................................................................. 2
2 GENERAL DESCRIPTION OF LAKE MOONDARRA ....................................................................................... 4
2.1 MINERAL PROCESSING ACTIVITIES ............................................................................................ , .............................. 4
2.2 GEOGRAPHICAL INFORMATION .................................................................................................................................. 6 2.2.1 Local geography / geology ............................................................................................................................... 6 2.2.2 Description of the Local Climate ..................................................................................................................... 6
2.2.3 Lake Moondarra location .............................................. .................................................................................... 8 2.3 LAKE MOONDARRA WATER QUALITY ........................................................................................................... 10
2.3.1 Lake Moondarra Water Nutrient and Metal Concentrations ......................................................................... 14 2.4 DISCUSSION OF LAKE TURN-OVER ........................................................................................................................... 16
3 LITERATURE REVIEW ......................................................................................................................................... 20
3.1 SEDIMENT EXTRACTION SCHEMES ......................................................................................................................... 21 3.1.1 The exchangablefraction .................................... ........................................................................................... 23 3.1.2 The organic fraction ........................................ ............................................................................................... 23 3.1.3 Metal carbonate minerals .............................................................................................................................. 24 3.1.4 Iron and manganese complexes ............................................. ......................................................................... 24 3.1.5 The residual phase ......................................................................................................................................... 24 3.1.6 Bioavailable metals ........................................................................................................................................ 24
3.2 TRACE METAL PARTITIONING ................................................................................................................................ 25 3.2.1 Coeur d'Alene Lake .................................................. ...................................................................................... 25 3.2.2 Trace Metal Transformations in Sediments ........... ......................................................................................... 26
3.3 SEDIMENT QUALITY ................................................................................................................................................ 34 3.3.1 ANZECC Sediment Quality Guidelines .......................................................................................................... 34 3.3.2 Sediment Toxicity ........................................................................................................................................... 36
4 METHODOLOGy .................................................................................................................................................... 38
4.1 SAMPLING METHODS .............................................................................................................................................. 38 4.1.1 Suiface Sediment Samples ............................................... .............................................................................. 38 4.1.2 Sediment Trap Samples ............................................................................................................ ..................... 40 4.1.3 Sediment Core Samples ............................................... ...................................................... ............................. 40 4.1.4 Atmospheric Deposition Samples ................................................................................................................... 41
4.2 METAL SPECIATION EXTRACTION SCHEMES .......................................................................................................... 41 4.2.1 Interstitial Water ........................................................................................................................................... 42 4.2.2 Sequential Extraction Scheme ....................................................................................................................... 42
4.3 ANALYTICAL TECHNIQUES ..................................................................................................................................... 46 4.3.1 Trace Metal Determinations (atomic absorption spectrophotometry) .......................................................... 46 4.3.2 Trace Metal Determinations (ICP-MS) ........................................................................................................ 48 4.3.3 Organic Matter Determination ......................................... ............................................................................. 48 4.3.4 Total Sulfur Determinations . ......................................................................................................................... 49 4.3.5 Eh and pH Determinations ......................................... ................................................................................... 49
4.4 METHOD VALIDATION ............................................................................................................................................ 50 4.4.1 Determination of importance of a nitrogen atmosphere ............................................................................... 50 4.4.2 Efficacy of the Sequential Extraction Scheme ................................................................................................. 55 4.4.3 Matrix Effect checks ...................................................................................................................................... 57 4.4.4 Standard Reference Material Checks ............................................................................................................ 57
5 COMPARISON OF SURFACE SEDIMENTS ...................................................................................................... 59
5.1 VALIDITY OF COMPARING DIFFERENT LOCATIONS WITHIN LAKE MOONDARRA ...................................................... 59 5.2 SPATIAL VARIATION IN TRACE METAL CONCENTRATIONS WITH RESPECT TO LOCATION ........................................ 62 5.3 EFFECT OF WATER DEPTH ON TRACE METALPARTITIONING ..................................................................................... 76 5.4 CHAPTER SUMMARY ............................................................................................................................................... 80
v
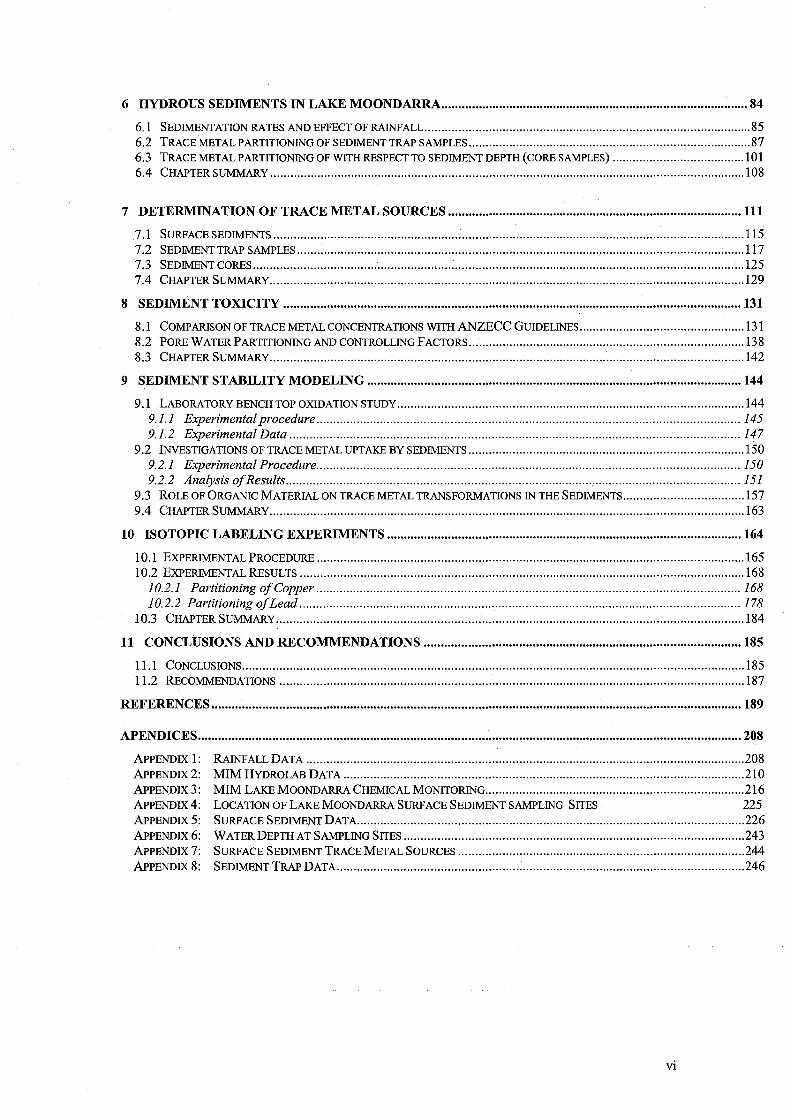
6 HYDROUS SEDIMENTS IN LAKE MOONDARRA ........................................................................................... 84
6.1 SEDIMENTATION RATES AND EFFECTOFRAINFALL. ................................................................................................ 85 6.2 TRACE METAL PARTITIONING OF SEDIMENT TRAP SAMPLES .................................................................................... 87 6.3 TRACE METAL PARTITIONING OF WITH RESPECT TO SEDIMENT DEPTH (CORE SAMPLES) ....................................... 10 1 6.4 CHAPTER SUMMARy ............................................................................................................................................. 1 08
7 DETERMINATION OF TRACE METAL SOURCES ....................................................................................... 111
7 .1 SURFACE SEDIMENTS ................................................................................................................. , .......................... 115 7.2 SEDIMENT TRAP SAMPLES ..................................................................................................................................... 117 7.3 SEDIMENT CORES .................................................................................................................................................. 125 7.4 CHAPTER SUMMARY ............................................................................................................................................. 129
8 SEDIMENT TOXICITY ........................................................................................................................................ 131
8 .1 COMPARISON OF TRACE METAL CONCENTRATIONS WITH ANZECC GUIDELINES ................................................. 131 8.2 PORE WATER PARTITIONING AND CONTROLLING FACTORS .................................................................................. 138 8.3 CHAPTER SUMMARy ............................................................................................................................................. 142
9 SEDIMENT STABILITY MODELING ............................................................................................................... 144
9.1 LABORATORY BENCH TOP OXIDATION STUDy ....................................................................................................... 144 9.1.1 Experimental procedure ............................................. ................................................................................. 145 9.1.2 Experimental Data ...................................................................................................................................... 147
9.2 INVESTIGATIONS OF TRACE METAL UPTAKE BY SEDIMENTS .................................................................................. 150 9.2.1 Experimental Procedure ............................................. ...................................................... ........................... 150 9.2.2 Analysis of Results ............................................. .......................................................................................... 151
9.3 ROLE OF ORGANIC MATERIAL ON TRACE METAL TRANSFORMATIONS IN THE SEDIMENTS .................................... 157 9.4 CHAPTER SUMMARY ............................................................................................................................................. 163
10 ISOTOPIC LABELING EXPERIMENTS ......................................................................................................... 164
10.1 EXPERIMENTALPROCEDURE ............................................................................................................................... 165 10.2 EXPERIMENTAL RESULTS .................................................................................................................................... 168
10.2.1 Partitioning of Copper .............................................................................................................................. 168 10.2.2 Partitioning of Lead ................................................................................................................................... 178
10.3 CHAPTER SUMMARY ........................................................................................................................................... 184
11 CONCLUSIONS AND RECOMMENDATIONS .............................................................................................. 185
11.1 CONCLUSIONS ..................................................................................................................................................... 18 5 11.2 RECOMMENDATIONS .......................................................................................................................................... 187
REFERENCES ............................................................................................................................................................. 189
APENDICES ................................................................................................................................................................. 208
APPENDIX 1: RAINFALL DATA .................................................................................................................................. 208 APPENDIX 2: MIM HYDROLAB DATA ....................................................................................................................... 210 APPENDIX 3: MIM LAKE MOONDARRA CHEMICAL MONITORING ............................................................................. 216 APPENDIX 4: LOCATION OF LAKE MOONDARRA SURFACE SEDIMENT SAMPLING SITES 225 APPENDIX 5: SURFACE SEDIMENT DATA ................................................................................................................... 226 APPENDIX 6: WATER DEPTH AT SAMPLING SITES ..................................................................................................... 243 APPENDIX 7: SURFACE SEDIMENT TRACE METAL SOURCES ..................................................................................... 244 APPENDIX 8: SEDIMENT TRAP DATA ......................................................................................................................... 246
Vl
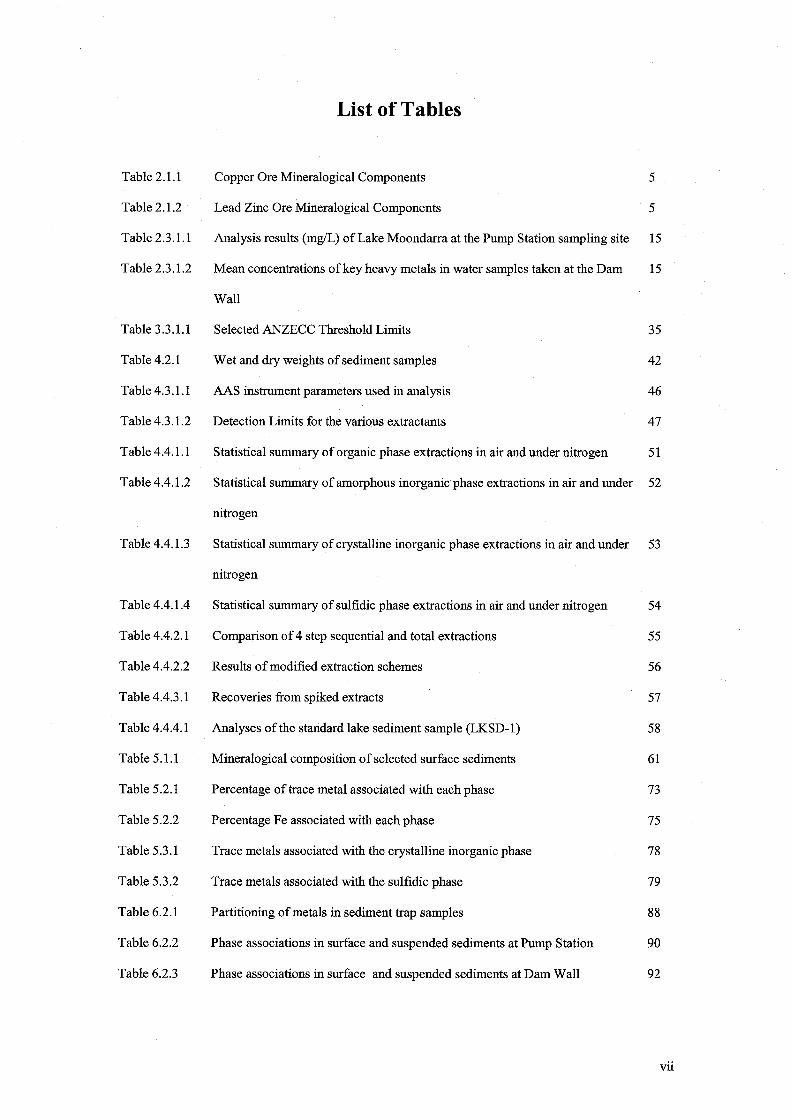
List of Tables
Table 2.1.1 Copper Ore Mineralogical Components 5
Table 2.1.2 Lead Zinc Ore Mineralogical Components 5
Table 2.3.1.1 Analysis results (mg/L) of Lake Moondarra at the Pump Station sampling site 15
Table 2.3.1.2 Mean concentrations of key heavy metals in water samples taken at the Dam 15
Wall
Table 3.3.1.1 Selected ANZECC Threshold Limits 35
Table 4.2.1 Wet and dry weights of sediment samples 42
Table 4.3.1.1 AAS instrument parameters used in analysis 46
Table 4.3.1.2 Detection Limits for the various extractants 47
Table 4.4.1.1 Statistical summary of organic phase extractions in air and under nitrogen 51
Table 4.4.1.2 Statistical summary of amorphous inorganic phase extractions in air and under 52
nitrogen
Table 4.4.1.3 Statistical summary of crystalline inorganic phase extractions in air and under 53
nitrogen
Table 4.4.1.4 Statistical summary of sulfidic phase extractions in air and under nitrogen 54
Table 4.4.2.1 Comparison of 4 step sequential and total extractions 55
Table 4.4.2.2 Results of modified extraction schemes 56
Table 4.4.3.1 Recoveries from spiked extracts 57
Table 4.4.4.1 Analyses of the standard lake sediment sample (LKSD-1) 58
Table 5.1.1 Mineralogical composition of selected surface sediments 61
Table 5.2.1 Percentage of trace metal associated with each phase 73
Table 5.2.2 Percentage Fe associated with each phase 75
Table 5.3.1 Trace metals associated with the crystalline inorganic phase 78
Table 5.3.2 Trace metals associated with the sulfidic phase 79
Table 6.2.1 Partitioning of metals in sediment trap samples 88
Table 6.2.2 Phase associations in surface and suspended sediments at Pump Station 90
Table 6.2.3 Phase associations in surface and suspended sediments at Dam Wall 92
Vll
Table 6.2.4
Table 6.2.5
Table 6.2.6
Table 6.2.7
Table 7.1
Table 7.2.1
Table 7.2.2
Table 7.2.3
Table 7.2.4
Table 7.2.5
Table 7.2.6
Table 7.2.7
Table 7.3.1
Table 7.3.2
Table 7.3.3
Table 8.1.1
Table 8.2.1
Table 8.2.2
Table 9.1.1.1
Table 9.2.2.1
Table 9.2.2.2
Table 9.2.2.3
Table 10.1.1
Table 10.1.2
Table 10.1.3
Phase associations in surface and suspended sediments at Spring Creek
Phase associations at Pump Station during the wet and dry seasons
Phase associations at Dam Wall during the wet and dry seasons
Phase associations at Spring Creek during the wet and dry seasons
Trace metal concentrations in potential sources (%)
Relative contribution of trace metal sources in suspended sediment samples
Surface and suspended sediment trace metal source comparisons at Pump
Station
Surface and suspended sediment trace metal source comparisons at Dam Wall
Surface and suspended sediment trace metal source comparisons at Spring
Creek
Comparison of relative source contributions at Pump Station in wet and dry
seasons
Comparison of relative source contributions at Dam Wall in wet and dry
seasons
Comparison of relative source contributions at Spring Creek in wet and dry
seasons
Relative trace metal source contributors with sediment depth at Pump Station
Relative trace metal source contributors with sediment depth at Dam Wall
Relative trace metal source contributors with sediment depth at Spring Creek
Total trace metal concentration in Rifle Creek Dam surface sediments /lg/g
Pore Water trace metal concentrtaion with respect to location
Pore water trace metal concentration with respect to water4 column depth
Selected surface sediment samples used in oxidation study
Trace metal associated with organic phase compared to total concentrations
Trace metal uptake by sediment
Trace metal removal by sediment with the organic phase removed
Samples used in Isotopic Experiments
Elemental Composition (Ilg/g)
Experimental Chemical Conditions
94
96
98
100
112
117
121
122
122
124
124
125
126
127
128
132
141
142
145
152
154
155
166
166
167
viii
List of Figures
FIGURE 2.2.2.1 :MOUNT ISA AVERAGE MONTHLY RAINFALL ............................................................................................... 7
FIGURE 2.2.2.2:ANNuALRAINFALL IN MOUNT ISA 1926 TO 1997 ...................................................................................... 7
FIGURE 2.2.3.1 :MAP SHOWING THE LOCATION OF LAKE MOONDARRA .............................................................................. 9
FIGURE 2.3.1:A VERAGE DISSOLVED OXYGEN CONTENT 23/8/95 TO 27/5/98 ..................................................................... 10
FIGURE 2.3.2:WATER TEMPERATURE 23/8/95 - 27/5/98 ..................................................................................................... 11
FIGURE 2.3.3:DISSOLVED OXYGEN CONTENT 23/8/95 - 27 /5/98 ........................................................................................ 11
FIGURE 2.3.4:TuRBITY 23/8/95 - 27/5/98 .......................................................................................................................... 12
FIGURE2.3.5:pH AT THE DAM WALL 23/8/95 - 27/5/98 .................................................................................................... 13
FIGURE 2.3.6:pH AT THE PUMP STATION 23/8/95 - 27/5/ 98 .............................................................................................. 13
FIGURE 2.3.7: VARIATION OF AVERAGE pH WITH DISSOLVED OXYGEN AT THE DAM WALL ............................................. 13
FIGURE 3.2.2.1: ANAEROBIC ORGANIC DECOMPOSITION .................................................................................................. 28
FIGURE3.2.2.2:IRON AND ARSENIC CYCLING AT THE REDOX BOUNDARY ....................................................................... 30
FIGURE 3.2.2.3 :POURBAIX DIAGRAM FOR FE .................................................................................................................... 31
FIGURE 4.1.1.1 : SAMPLING SITES IN LAKE MOONDARRA ................................................................................................... 39
FIGURE 5.2.1: SPATIAL DISTRIBUTION OF PB IN LAKE MOONDARRA ................................................................................ 63
FIGURE 5.2.2: SPATIAL DISTRIBUTION OF Cu IN LAKE MOONDARRA ............................................................................... 65
FIGURE 5.2.3: SPATIAL DISTRIBUTION OF CD IN LAKE MOONDARRA ................................................................................ 67
FIGURE 5.2.4: SPATIAL DISTRIBUTION OF ZN IN LAKE MOONDARRA ............................................................................... 69
FIGURE 5.2.5: SPATIAL DISTRIBUTION OF As IN LAKE MOONDARRA ............................................................................... 71
FIGURE 6.1 : AVERAGE TURBIDITY WITH WATER COLUMN DEPTH AT PUMP STATION ........................................................ 84
FIGURE 6.1.1: PUMP STATION SEDIMENTATION RATES ..................................................................................................... 86
FIGURE 6.1.2: DAM WALL SEDIMENTATION RATES .......................................................................................................... 86
FIGURE 6.1.3: SPRING CREEK SEDIMENTATION RATES ..................................................................................................... 87
FIGURE 6.3.1:PB PARTITIONING WITH SEDIMENT DEPTH AT PUMP STATION .................................................................... 102
FIGURE 6.3.2:Cu PARTITIONING WITH SEDIMENT DEPTH AT PUMP STATION ................................................................... 102
FIGURE 6.3.3:ZN PARTITIONING WITH SEDIMENT DEPTH AT PUMP STATION ................................................................... 102
FIGURE 6.3.4:PB PARTITIONING WITH SEDIMENT DEPTH AT DAM WALL.. ....................................................................... 104
FIGURE 6.3.5:Cu PARTITIONING WITH SEDIMENT DEPTH AT DAM WALL ........................................................................ 105
FIGURE 6.3.6:ZN PARTITIONING WITH SEDIMENT DEPTH AT DAM WALL.. ....................................................................... 105
ix
FIGURE 6.3.7:PB PARTITIONING WITH SEDIMENT DEPTH AT SPRING CREEK .................................................................... 107
FIGURE 6.3.8:Cu PARTITIONING WITH SEDIMENT DEPTH AT SPRING CREEK ................................................................... 107
FIGURE 6.3.9:ZN PARTITIONING WITH SEDIMENT DEPTH AT SPRING CREEK .................................................................... 108
FIGURE 7.1.1 : SOURCE CONTRIBUTIONS TO SURFACE SEDIMENT TRACE METAL CONCENTRATIONS ................................. 115
FIGURE 7.2.1: SOURCE CONTRIBUTIONS TO PUMP STATION SUSPENDED SEDIMENT TRACE METAL
CONCENTRATIONS ................................................................................................................................................... 119
FIGURE 7 .2.2:S0URCE CONTRIBUTIONS TO DAM WALL SUSPENDED SEDIMENT TRACE METAL
CONCENTRATIONS ................................................................................................................................................... 120
FIGURE 7.2.3: SOURCE CONTRIBUTIONS TO SPRING CREEK SUSPENDED SEDIMENT TRACE METAL
CONCENTRATIONS ................................................................................................................................................... 120
FIGURE 8.1.1 :ANZECC SEDIMENT QUALITY RISK-BASED DECISION TREE ..................................................................... 133
FIGURE 8.1.2: DISTRIBUTION OF LEAD BETWEEN OPERATIONALLY DEFINED FRACTIONS IN THE
SEDIMENTS OF THE FLOODED LEICHHARDT RIVER BED OF LAKE MOONDARRA ...................................................... 134
FIGURE 8.1.3: DISTRIBUTION OF LEAD BETWEEN OPERATIONALLY DEFINED FRACTIONS IN THE
SEDIMENTS OF THE REST OF LAKE MOONDARRA ..................................................................................................... 135
FIGURE 8.1.4: DISTRIBUTION OF COPPER BETWEEN OPERATIONALLY DEFINED FRACTIONS IN THE
SEDIMENTS OF THE FLOODED LEICHHARDT RIVER BED OF LAKE MOONDARRA ...................................................... 135
FIGURE 8.1.5: DISTRIBUTION OF COPPER BETWEEN OPERATIONALLY DEFINED FRACTIONS IN THE
SEDIMENTS OF THE REST OF LAKE MOONDARRA ..................................................................................................... 136
FIGURE 8.1.6: DISTRIBUTION OF ZINC BETWEEN OPERATIONALLY DEFINED FRACTIONS IN THE SEDIMENTS
OF THE FLOODED LEICHHARDT RIVER BED OF LAKE MOONDARRA ......................................................................... 136
FIGURE 8.1.7: DISTRIBUTION OF ZINC BETWEEN OPERATIONALLY DEFINED FRACTIONS IN THE SEDIMENTS
OF THE REST OF LAKE MOONDARRA ....................................................................................................................... 137
FIGURE 8.2.1: DISTRIBUTION PLOT FOR PB ..................................................................................................................... 139
FIGURE 9.1.2.1: PB, Cu, ZN, CD AND As RELEASE AS CONDITIONS CHANGE ANOXIC TO OXIC ........................................ 147
FIGURE 9.1.2.2: FE AND MN RELEASE AS CONDITIONS CHANGE ANOXIC TO OXIC ........................................................ '" 147
FIGURE 9.1.2.3: PB, Cu, ZN, CD AND As RELEASE AS CONDITIONS CHANGE OXIC TO ANOXIC ........................................ 148
FIGURE 9.1.2.4: FE AND MN RELEASE AS CONDITIONS CHANGE OXIC TO ANOXIC ........................................................... 149
FIGURE 9.2.2.1: SEDIMENT BLANK PB RELEASE WITH MECHANICAL AGITATION OF SEDIMENT ....................................... 153
FIGURE 9.2.2.2: SEDIMENT BLANK Cu RELEASE WITH MECHANICAL AGITATION OF SEDIMENT ....................................... 153
x
FIGURE 9.2.2.3: SEDIMENT BLANK ZN RELEASE WITH MECHANICAL AGITATION OF SEDIMENT ....................................... 154
FIGURE 9.3.1: SURFACE SEDIMENT pKA INFLECTION POINT ............................................................................................ 158
FIGURE 9.3.2: PB EXTRACTED FROM SEDIMENT BY ORGANIC ACIDS ................................................................................ 160
FIGURE 9.3.3: CU EXTRACTED FROM SEDIMENT BY ORGANIC ACIDS ............................................................................... 160
FIGURE 9.3 A: ZN EXTRACTED FROM SEDIMENT BY ORGANIC ACIDS ............................................................................... 161
FIGURE 9.3.5: FE EXTRACTED FROM SEDIMENT BY ORGANIC ACIDS ................................................................................ 161
FIGURE 9.3.6: TRACE METALS EXTRACTED FROM SEDIMENT BY MIXED ORGANIC ACIDS ................................................ 162
FIGURE 10.2.1.1: VARIATION IN CU CONCENTRATION IN FILTERED, UNFILTERED AND PORE WATER IN
COLUMN 1 ............................................................................................................................................................... 169
FIGURE 10.2.1.2: VARIATION IN Cu CONCENTRATION IN FILTERED, UNFILTERED AND PORE WATER IN
COLUMN 2 ............................................................................................................................................................... 171
FIGURE 10.2.1.3: VARIATION IN CU CONCENTRATION IN FILTERED, UNFILTERED AND PORE WATER IN
COLUMN3 ............................................................................................................................................................... 171
FIGURE 1 0.2.104: VARIATION IN FE CONCENTRATION IN COLUMN 3 ............................................................................... 173
FIGURE 10.2.1.5: Cu KD (MODIFIED) WITH SEDIMENT RE-SUSPENSION ........................................................................... 174
FIGURE 10.2 .. 1.6: VARIATION IN CU ISOTOPIC RATIOS IN COLUMN 1 ............................................................................. 176
FIGURE 10.2.1.7: VARIATION IN Cu ISOTOPIC RATIOS IN COLUMN 2 .............................................................................. 176
FIGURE 10.2.1.8: VARIATION IN Cu ISOTOPIC RATIOS IN COLUMN 3 (UNSPIKED) .......................................................... 177
FIGURE 10.2.2.1: VARIATION INPB CONCENTRATION IN FILTERED, UNFILTERED AND PORE WATER IN
COLUMN 1 ............................................................................................................................................................... 179
FIGURE 10.2.2.2: VARIATION IN PB CONCENTRATION IN FILTERED, UNFILTERED AND PORE WATER IN
COLUMN 2 ............................................................................................................................................................... 180
FIGURE 10.2.2.3: VARIATION IN PB CONCENTRATION IN FILTERED, UNFILTERED AND PORE WATER IN
COLUMN 3 ............................................................................................................................................................... 180
FIGURE 10.2.204: PB KD (MODIFIED) WITH SEDIMENT RE-SUSPENSION ............................................................................ 181
FIGURE 10.2.2.5: VARIATION INPB ISOTOPIC RATIOS IN COLUMN 1 .............................................................................. 182
FIGURE 10.2.2.6: VARIATION IN PB ISOTOPIC RATIOS IN COLUMN 2 .............................................................................. 182
FIGURE 10.2.2.7: VARIATION IN PB ISOTOPIC RATIOS IN COLUMN 3(UNSPIKED) ............................................................ 183
xi
Abstract
This study examines the spatial distribution and phase associations of trace metals
within Lake Moondarra sediments for the period from 1998 - 2000. Factors effecting
phase partitioning in the sediments are evaluated, with particular reference to
elements As, Cd, Cu, Pb and Zn. The other aims of this study were to identify the
sources of the trace metals within the sediments of Lake Moondarra and determine the
stability of these sediments with respect to oxidation events.
Because no standard method is used by all researchers for determining the partitioning
of trace metals within the sediments, the first part of this study was devoted to
validating methods. Method testing showed that for sediments collected in Lake
Moondarra sequential extractions of anoxic sediments can be done in air with minimal
impact on the partitioning of the trace metals with the sediment, providing the sample
is stored frozen and thawed in a nitrogen atmosphere.
The flooded Leichhardt River bed contains elevated levels of Pb, Cu, Zn, As, and Cd
compared to the rest of Lake Moondarra. A non linear optimisation technique applied
to the sediment data indicated that the most likely source of the trace metals is
atmospheric fallout and Pb/Zn tailings left in the Leichardt River by now discontinued
waste disposal practices. The fallout and tailings constituted typically less than 5% of
the sediment mass. There is little change in the relative contributions of these with
sediment depth. This suggests that none of the remediation work done by MIM to
remove Pbl Zn tails from the Leichhardt River bed has had an effect on sediment
quality to date as there is no major change in trace metal concentration with sediment
xii
depth. Application of the ANZECC (2000) sediment quality guidelines indicated that
toxicity testing should be done on the sediments of Lake Moondarra, particularly the
flooded Leichhardt River bed.
The sequential extraction results indicate that most trace metals in the sediments of
Lake Moondarra are not present as sulfides. The partitioning data show that the trace
metals have undergone significant transformation either prior to entering Lake
Moondarra or in situ in the benthic sediments. The prevailing belief that the trace
metals in the sediments of Lake Moondarra are present as stable sulfides with low
solubility products and hence have limited impact on the environment is flawed. The
trace metals in the sediment are dynamic with trace metals being released to the water
column under anoxic conditions and re-sorption of trace metals under oxic conditions.
Laboratory testwork on the sediments of Lake Moondarra indicates that iron redox
chemistry and associated adsorption and desorption of trace metals in the suspended
sediment layer is the dominant mechanism in controlling the release or removal of
trace metals from the water column. Laboratory testwork also indicates that anaerobic
decomposition of organic material may play a significant role in phase
transformations within the sediments of Lake Moondarra.
xiii


![Maltese Titles 2017 - Casalini Libri - Home Page in Birkirkara : a dictionary of famous Maltese personalities from Birkirkara / Charles Briffa. - [Malta]: Charles Briffa, 2016 xvii,](https://img.pdfslide.net/doc/110x75/5ae7bdd17f8b9a9e5d8f8edb/maltese-titles-2017-casalini-libri-home-page-in-birkirkara-a-dictionary-of.jpg)