Embed Size (px)
Citation preview
5 4 | N A T U R E | V O L 5 3 6 | 4 A U G U S T 2 0 1 6
LETTERdoi:10.1038/nature18290
Bright carbonate deposits as evidence of aqueous alteration on (1) CeresM. C. De Sanctis1, A. Raponi1, E. Ammannito1,2, M. Ciarniello1, M. J. Toplis3, H. Y. McSween4, J. C. Castillo-Rogez5, B. L. Ehlmann5,6, F. G. Carrozzo1, S. Marchi1,7, F. Tosi1, F. Zambon1, F. Capaccioni1, M. T. Capria1, S. Fonte1, M. Formisano1, A. Frigeri1, M. Giardino1, A. Longobardo1, G. Magni1, E. Palomba1, L. A. McFadden8, C. M. Pieters9, R. Jaumann10, P. Schenk11, R. Mugnuolo12, C. A. Raymond5 & C. T. Russell2
The typically dark surface of the dwarf planet Ceres is punctuated by areas of much higher albedo, most prominently in the Occator crater1. These small bright areas have been tentatively interpreted as containing a large amount of hydrated magnesium sulfate1, in contrast to the average surface, which is a mixture of low-albedo materials and magnesium phyllosilicates, ammoniated phyllosilicates and carbonates2–4. Here we report high spatial and spectral resolution near-infrared observations of the bright areas in the Occator crater on Ceres. Spectra of these bright areas are consistent with a large amount of sodium carbonate, constituting the most concentrated known extraterrestrial occurrence of carbonate on kilometre-wide scales in the Solar System. The carbonates are mixed with a dark component and small amounts of phyllosilicates, as well as ammonium carbonate or ammonium chloride. Some of these compounds have also been detected in the plume of Saturn’s sixth-largest moon Enceladus5. The compounds are endogenous and we propose that they are the solid residue of crystallization of brines and entrained altered solids that reached the surface from below. The heat source may have been transient (triggered by impact heating). Alternatively, internal temperatures may be above the eutectic temperature of subsurface brines, in which case fluids may exist at depth on Ceres today.
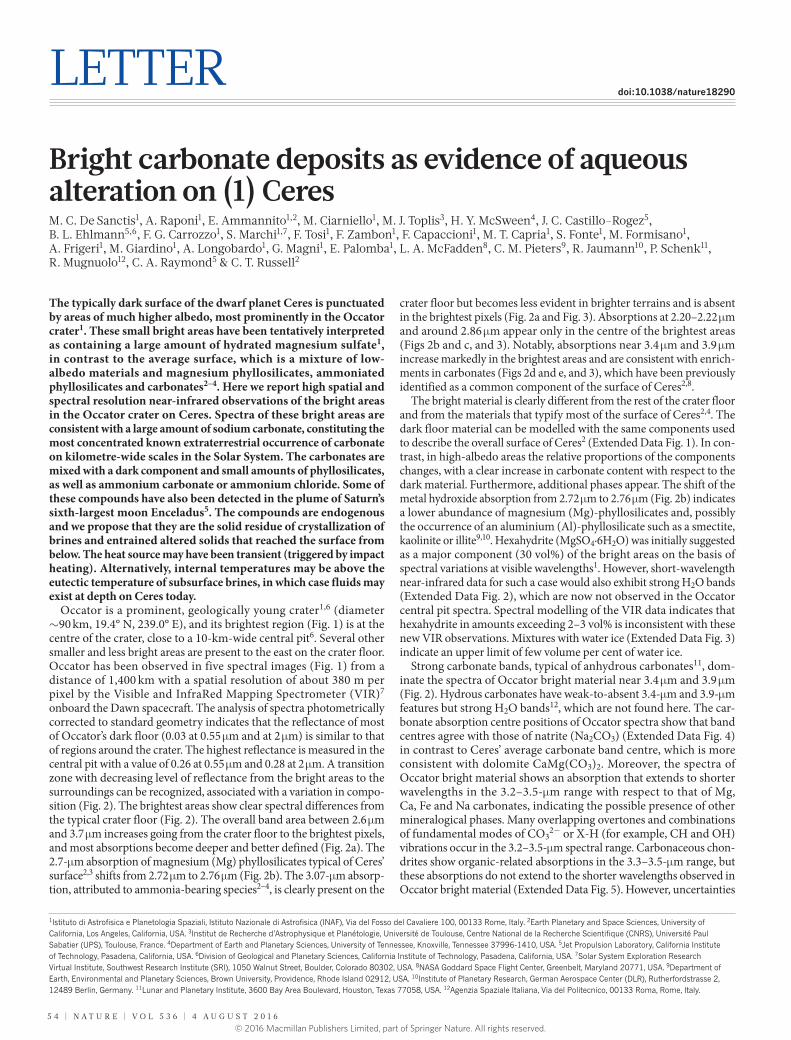
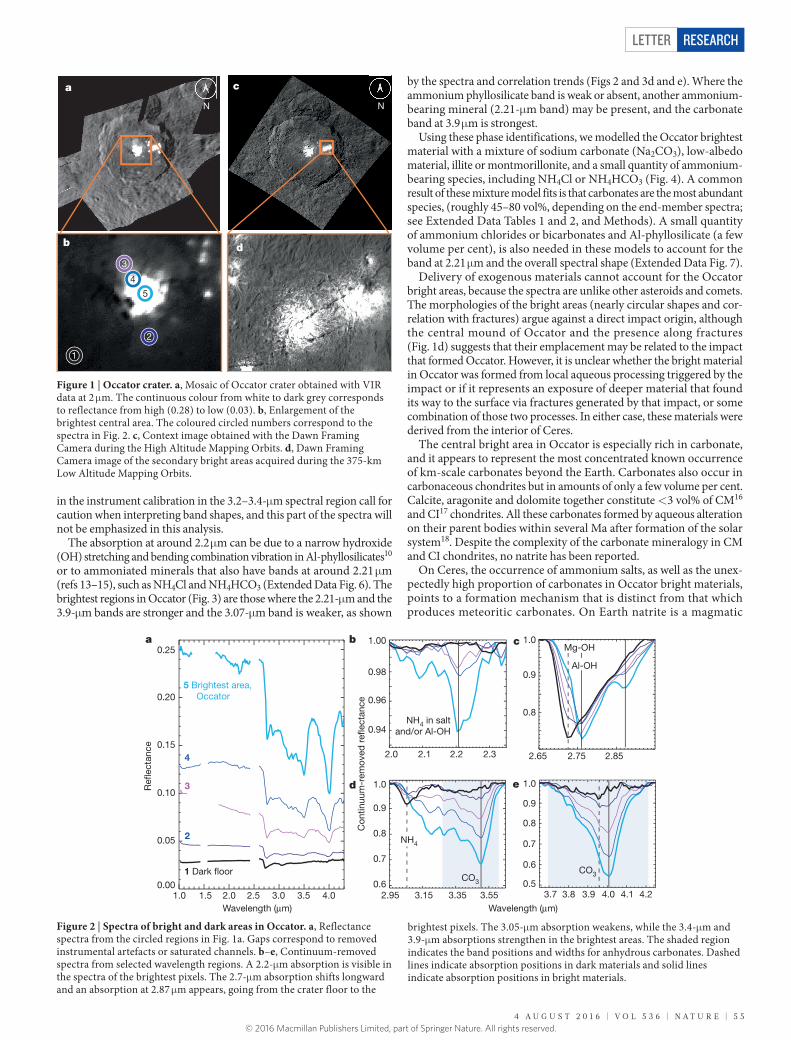
Occator is a prominent, geologically young crater1,6 (diameter ~90 km, 19.4° N, 239.0° E), and its brightest region (Fig. 1) is at the centre of the crater, close to a 10-km-wide central pit6. Several other smaller and less bright areas are present to the east on the crater floor. Occator has been observed in five spectral images (Fig. 1) from a distance of 1,400 km with a spatial resolution of about 380 m per pixel by the Visible and InfraRed Mapping Spectrometer (VIR)7 onboard the Dawn spacecraft. The analysis of spectra photometrically corrected to standard geometry indicates that the reflectance of most of Occator’s dark floor (0.03 at 0.55 μm and at 2 μm) is similar to that of regions around the crater. The highest reflectance is measured in the central pit with a value of 0.26 at 0.55 μm and 0.28 at 2 μm. A transition zone with decreasing level of reflectance from the bright areas to the surroundings can be recognized, associated with a variation in compo-sition (Fig. 2). The brightest areas show clear spectral differences from the typical crater floor (Fig. 2). The overall band area between 2.6 μm and 3.7 μm increases going from the crater floor to the brightest pixels, and most absorptions become deeper and better defined (Fig. 2a). The 2.7-μm absorption of magnesium (Mg) phyllosilicates typical of Ceres’ surface2,3 shifts from 2.72 μm to 2.76 μm (Fig. 2b). The 3.07-μm absorp-tion, attributed to ammonia-bearing species2–4, is clearly present on the
crater floor but becomes less evident in brighter terrains and is absent in the brightest pixels (Fig. 2a and Fig. 3). Absorptions at 2.20–2.22 μm and around 2.86 μm appear only in the centre of the brightest areas (Figs 2b and c, and 3). Notably, absorptions near 3.4 μm and 3.9 μm increase markedly in the brightest areas and are consistent with enrich-ments in carbonates (Figs 2d and e, and 3), which have been previously identified as a common component of the surface of Ceres2,8.
The bright material is clearly different from the rest of the crater floor and from the materials that typify most of the surface of Ceres2,4. The dark floor material can be modelled with the same components used to describe the overall surface of Ceres2 (Extended Data Fig. 1). In con-trast, in high-albedo areas the relative proportions of the components changes, with a clear increase in carbonate content with respect to the dark material. Furthermore, additional phases appear. The shift of the metal hydroxide absorption from 2.72 μm to 2.76 μm (Fig. 2b) indicates a lower abundance of magnesium (Mg)-phyllosilicates and, possibly the occurrence of an aluminium (Al)-phyllosilicate such as a smectite, kaolinite or illite9,10. Hexahydrite (MgSO4·6H2O) was initially suggested as a major component (30 vol%) of the bright areas on the basis of spectral variations at visible wavelengths1. However, short-wavelength near-infrared data for such a case would also exhibit strong H2O bands (Extended Data Fig. 2), which are now not observed in the Occator central pit spectra. Spectral modelling of the VIR data indicates that hexahydrite in amounts exceeding 2–3 vol% is inconsistent with these new VIR observations. Mixtures with water ice (Extended Data Fig. 3) indicate an upper limit of few volume per cent of water ice.
Strong carbonate bands, typical of anhydrous carbonates11, dom-inate the spectra of Occator bright material near 3.4 μm and 3.9 μm (Fig. 2). Hydrous carbonates have weak-to-absent 3.4-μm and 3.9-μm features but strong H2O bands12, which are not found here. The car-bonate absorption centre positions of Occator spectra show that band centres agree with those of natrite (Na2CO3) (Extended Data Fig. 4) in contrast to Ceres’ average carbonate band centre, which is more consistent with dolomite CaMg(CO3)2. Moreover, the spectra of Occator bright material shows an absorption that extends to shorter wavelengths in the 3.2–3.5-μm range with respect to that of Mg, Ca, Fe and Na carbonates, indicating the possible presence of other mineralogical phases. Many overlapping overtones and combinations of fundamental modes of CO3
2− or X-H (for example, CH and OH) vibrations occur in the 3.2–3.5-μm spectral range. Carbonaceous chon-drites show organic-related absorptions in the 3.3–3.5-μm range, but these absorptions do not extend to the shorter wavelengths observed in Occator bright material (Extended Data Fig. 5). However, uncertainties
1Istituto di Astrofisica e Planetologia Spaziali, Istituto Nazionale di Astrofisica (INAF), Via del Fosso del Cavaliere 100, 00133 Rome, Italy. 2Earth Planetary and Space Sciences, University of California, Los Angeles, California, USA. 3Institut de Recherche d’Astrophysique et Planétologie, Université de Toulouse, Centre National de la Recherche Scientifique (CNRS), Université Paul Sabatier (UPS), Toulouse, France. 4Department of Earth and Planetary Sciences, University of Tennessee, Knoxville, Tennessee 37996-1410, USA. 5Jet Propulsion Laboratory, California Institute of Technology, Pasadena, California, USA. 6Division of Geological and Planetary Sciences, California Institute of Technology, Pasadena, California, USA. 7Solar System Exploration Research Virtual Institute, Southwest Research Institute (SRI), 1050 Walnut Street, Boulder, Colorado 80302, USA. 8NASA Goddard Space Flight Center, Greenbelt, Maryland 20771, USA. 9Department of Earth, Environmental and Planetary Sciences, Brown University, Providence, Rhode Island 02912, USA. 10Institute of Planetary Research, German Aerospace Center (DLR), Rutherfordstrasse 2, 12489 Berlin, Germany. 11Lunar and Planetary Institute, 3600 Bay Area Boulevard, Houston, Texas 77058, USA. 12Agenzia Spaziale Italiana, Via del Politecnico, 00133 Roma, Rome, Italy.
© 2016 Macmillan Publishers Limited, part of Springer Nature. All rights reserved.
4 A U G U S T 2 0 1 6 | V O L 5 3 6 | N A T U R E | 5 5
LETTER RESEARCH
in the instrument calibration in the 3.2–3.4-μm spectral region call for caution when interpreting band shapes, and this part of the spectra will not be emphasized in this analysis.
The absorption at around 2.2 μm can be due to a narrow hydroxide (OH) stretching and bending combination vibration in Al-phyllosilicates10 or to ammoniated minerals that also have bands at around 2.21 μm (refs 13–15), such as NH4Cl and NH4HCO3 (Extended Data Fig. 6). The brightest regions in Occator (Fig. 3) are those where the 2.21-μm and the 3.9-μm bands are stronger and the 3.07-μm band is weaker, as shown
by the spectra and correlation trends (Figs 2 and 3d and e). Where the ammonium phyllosilicate band is weak or absent, another ammonium- bearing mineral (2.21-μm band) may be present, and the carbonate band at 3.9 μm is strongest.
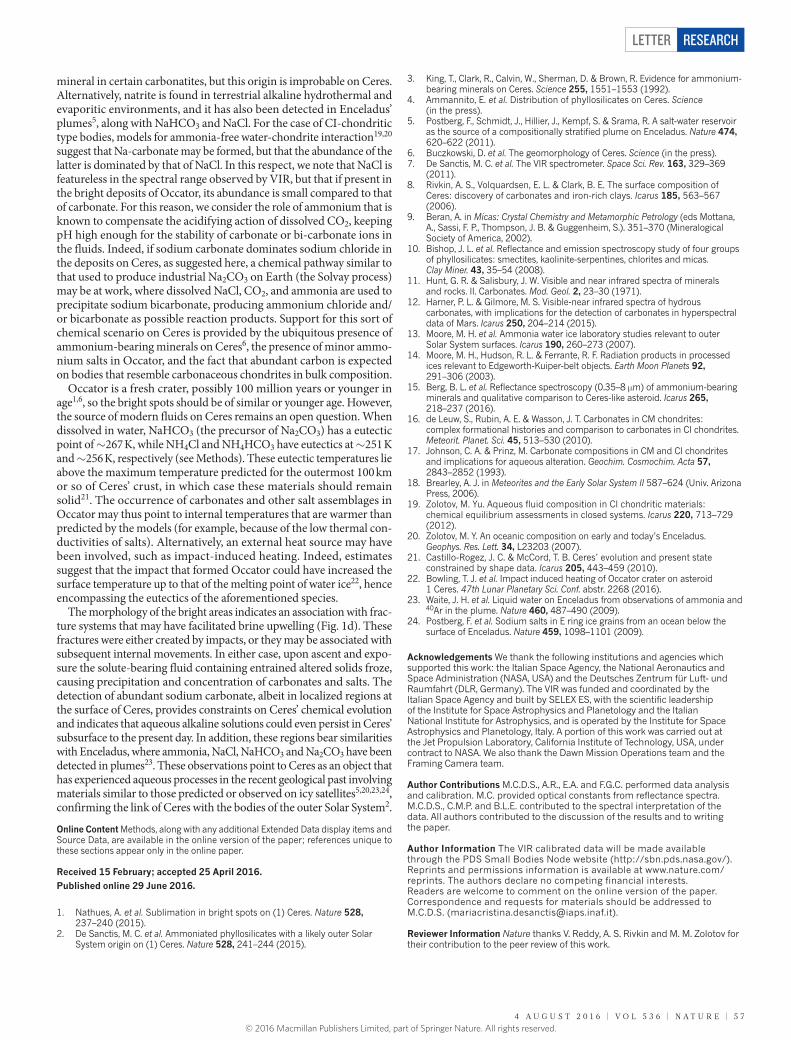
Using these phase identifications, we modelled the Occator brightest material with a mixture of sodium carbonate (Na2CO3), low-albedo material, illite or montmorillonite, and a small quantity of ammonium- bearing species, including NH4Cl or NH4HCO3 (Fig. 4). A common result of these mixture model fits is that carbonates are the most abundant species, (roughly 45–80 vol%, depending on the end-member spectra; see Extended Data Tables 1 and 2, and Methods). A small quantity of ammonium chlorides or bicarbonates and Al-phyllosilicate (a few volume per cent), is also needed in these models to account for the band at 2.21 μm and the overall spectral shape (Extended Data Fig. 7).
Delivery of exogenous materials cannot account for the Occator bright areas, because the spectra are unlike other asteroids and comets. The morphologies of the bright areas (nearly circular shapes and cor-relation with fractures) argue against a direct impact origin, although the central mound of Occator and the presence along fractures (Fig. 1d) suggests that their emplacement may be related to the impact that formed Occator. However, it is unclear whether the bright material in Occator was formed from local aqueous processing triggered by the impact or if it represents an exposure of deeper material that found its way to the surface via fractures generated by that impact, or some combination of those two processes. In either case, these materials were derived from the interior of Ceres.
The central bright area in Occator is especially rich in carbonate, and it appears to represent the most concentrated known occurrence of km-scale carbonates beyond the Earth. Carbonates also occur in carbonaceous chondrites but in amounts of only a few volume per cent. Calcite, aragonite and dolomite together constitute <3 vol% of CM16 and CI17 chondrites. All these carbonates formed by aqueous alteration on their parent bodies within several Ma after formation of the solar system18. Despite the complexity of the carbonate mineralogy in CM and CI chondrites, no natrite has been reported.
On Ceres, the occurrence of ammonium salts, as well as the unex-pectedly high proportion of carbonates in Occator bright materials, points to a formation mechanism that is distinct from that which produces meteoritic carbonates. On Earth natrite is a magmatic
ab
c
d1
2
3
4
5
a
b
c
d
NN
Figure 1 | Occator crater. a, Mosaic of Occator crater obtained with VIR data at 2 μm. The continuous colour from white to dark grey corresponds to reflectance from high (0.28) to low (0.03). b, Enlargement of the brightest central area. The coloured circled numbers correspond to the spectra in Fig. 2. c, Context image obtained with the Dawn Framing Camera during the High Altitude Mapping Orbits. d, Dawn Framing Camera image of the secondary bright areas acquired during the 375-km Low Altitude Mapping Orbits.
a b c
d e
5 Brightest area, Occator
1 Dark �oor
3
4
2 NH4
CO3
CO3
Mg-OH
Al-OH
NH4 in saltand/or Al-OH
0.25
0.20
0.15
0.10
0.05
0.00
Re�
ecta
nce
1.0 1.5 2.0 2.5 3.0 3.5 4.0Wavelength (μm)
1.00
0.98
0.96
0.94
1.0
0.9
0.8
0.7
1.0
0.9
0.8
1.0
0.9
0.8
0.7
2.95 3.15 3.35 3.550.6
Con
tinuu
m-r
emov
ed r
e�ec
tanc
e
2.65 2.75 2.852.0 2.1 2.2 2.3
0.6
0.53.7 3.9 4.1 4.2
Wavelength (μm)
4.03.8
Figure 2 | Spectra of bright and dark areas in Occator. a, Reflectance spectra from the circled regions in Fig. 1a. Gaps correspond to removed instrumental artefacts or saturated channels. b–e, Continuum-removed spectra from selected wavelength regions. A 2.2-μm absorption is visible in the spectra of the brightest pixels. The 2.7-μm absorption shifts longward and an absorption at 2.87 μm appears, going from the crater floor to the
brightest pixels. The 3.05-μm absorption weakens, while the 3.4-μm and 3.9-μm absorptions strengthen in the brightest areas. The shaded region indicates the band positions and widths for anhydrous carbonates. Dashed lines indicate absorption positions in dark materials and solid lines indicate absorption positions in bright materials.
© 2016 Macmillan Publishers Limited, part of Springer Nature. All rights reserved.
5 6 | N A T U R E | V O L 5 3 6 | 4 A U G U S T 2 0 1 6
LETTERRESEARCH
1.0 1.021 .05 1.55 0.85 0.95
a b c
0.8
0.85
0.9
0.95
1
1.05
1.1
1 1.2 1.4 1.6 1.8 2 2.2
Re�
ecta
nce
at 3
.0 μ
m/
re�e
ctan
ce a
t 3.
07 μ
m
0.96
0.98
1
1.02
1.04
1.06
1.08
1 1.2 1.4 1.6 1.8 2 2.2
Re�
ecta
nce
at 1
.98 μm
/re
�ect
ance
at
2.2 μm
Re�ectance at 3.6 μm/re�ectance at 3.9 μm
d e
2.05 2.55 1.0 1.05 1.1 1.04 1.06 1.08
Increas
ing brightnes
sIncreasing brightness
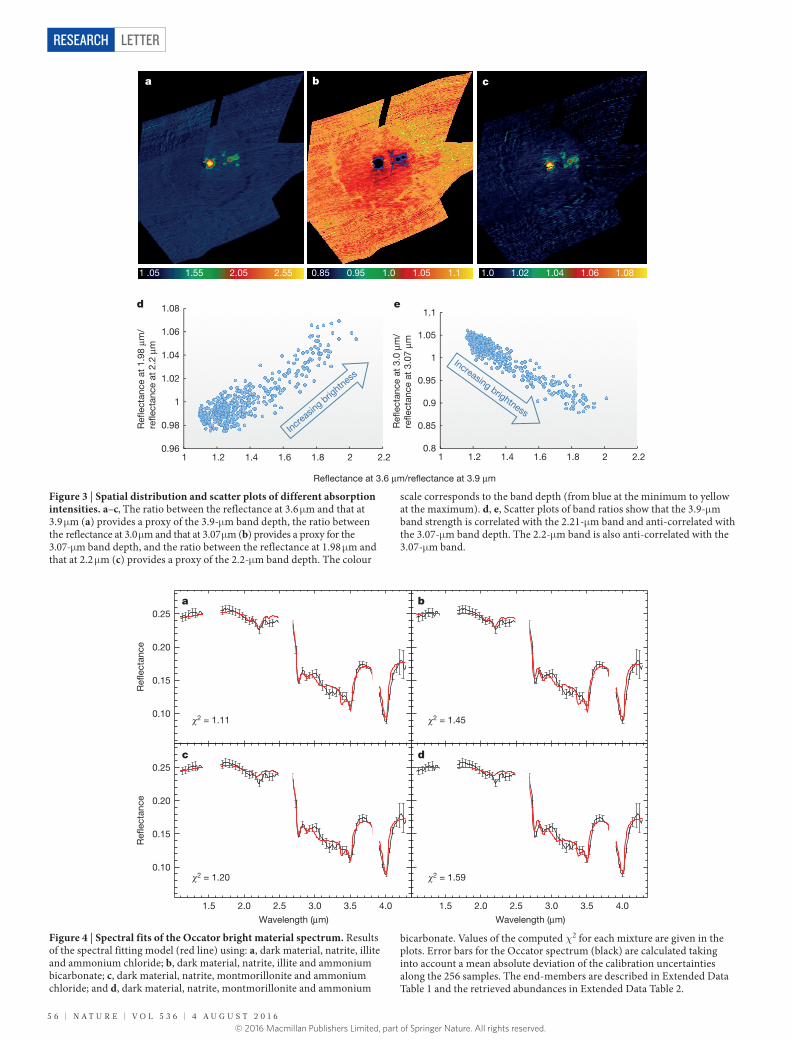
Figure 3 | Spatial distribution and scatter plots of different absorption intensities. a–c, The ratio between the reflectance at 3.6 μm and that at 3.9 μm (a) provides a proxy of the 3.9-μm band depth, the ratio between the reflectance at 3.0 μm and that at 3.07 μm (b) provides a proxy for the 3.07-μm band depth, and the ratio between the reflectance at 1.98 μm and that at 2.2 μm (c) provides a proxy of the 2.2-μm band depth. The colour
scale corresponds to the band depth (from blue at the minimum to yellow at the maximum). d, e, Scatter plots of band ratios show that the 3.9-μm band strength is correlated with the 2.21-μm band and anti-correlated with the 3.07-μm band depth. The 2.2-μm band is also anti-correlated with the 3.07-μm band.
0.10
0.15
0.20
0.25
Re�
ecta
nce
2 = 1.11
a
2 = 1.45
b
1.5 2.0 2.5 3.0 3.5 4.0
Wavelength (μm)
0.10
0.15
0.20
0.25
Re�
ecta
nce
2 = 1.20
c
1.5 2.0 2.5 3.0 3.5 4.0
Wavelength (μm)
2 = 1.59
d
Figure 4 | Spectral fits of the Occator bright material spectrum. Results of the spectral fitting model (red line) using: a, dark material, natrite, illite and ammonium chloride; b, dark material, natrite, illite and ammonium bicarbonate; c, dark material, natrite, montmorillonite and ammonium chloride; and d, dark material, natrite, montmorillonite and ammonium
bicarbonate. Values of the computed χ2 for each mixture are given in the plots. Error bars for the Occator spectrum (black) are calculated taking into account a mean absolute deviation of the calibration uncertainties along the 256 samples. The end-members are described in Extended Data Table 1 and the retrieved abundances in Extended Data Table 2.
© 2016 Macmillan Publishers Limited, part of Springer Nature. All rights reserved.
4 A U G U S T 2 0 1 6 | V O L 5 3 6 | N A T U R E | 5 7
LETTER RESEARCH
mineral in certain carbonatites, but this origin is improbable on Ceres. Alternatively, natrite is found in terrestrial alkaline hydrothermal and evaporitic environments, and it has also been detected in Enceladus’ plumes5, along with NaHCO3 and NaCl. For the case of CI-chondritic type bodies, models for ammonia-free water-chondrite interaction19,20 suggest that Na-carbonate may be formed, but that the abundance of the latter is dominated by that of NaCl. In this respect, we note that NaCl is featureless in the spectral range observed by VIR, but that if present in the bright deposits of Occator, its abundance is small compared to that of carbonate. For this reason, we consider the role of ammonium that is known to compensate the acidifying action of dissolved CO2, keeping pH high enough for the stability of carbonate or bi-carbonate ions in the fluids. Indeed, if sodium carbonate dominates sodium chloride in the deposits on Ceres, as suggested here, a chemical pathway similar to that used to produce industrial Na2CO3 on Earth (the Solvay process) may be at work, where dissolved NaCl, CO2, and ammonia are used to precipitate sodium bicarbonate, producing ammonium chloride and/or bicarbonate as possible reaction products. Support for this sort of chemical scenario on Ceres is provided by the ubiquitous presence of ammonium-bearing minerals on Ceres6, the presence of minor ammo-nium salts in Occator, and the fact that abundant carbon is expected on bodies that resemble carbonaceous chondrites in bulk composition.
Occator is a fresh crater, possibly 100 million years or younger in age1,6, so the bright spots should be of similar or younger age. However, the source of modern fluids on Ceres remains an open question. When dissolved in water, NaHCO3 (the precursor of Na2CO3) has a eutectic point of ~267 K, while NH4Cl and NH4HCO3 have eutectics at ~251 K and ~256 K, respectively (see Methods). These eutectic temperatures lie above the maximum temperature predicted for the outermost 100 km or so of Ceres’ crust, in which case these materials should remain solid21. The occurrence of carbonates and other salt assemblages in Occator may thus point to internal temperatures that are warmer than predicted by the models (for example, because of the low thermal con-ductivities of salts). Alternatively, an external heat source may have been involved, such as impact-induced heating. Indeed, estimates suggest that the impact that formed Occator could have increased the surface temperature up to that of the melting point of water ice22, hence encompassing the eutectics of the aforementioned species.
The morphology of the bright areas indicates an association with frac-ture systems that may have facilitated brine upwelling (Fig. 1d). These fractures were either created by impacts, or they may be associated with subsequent internal movements. In either case, upon ascent and expo-sure the solute-bearing fluid containing entrained altered solids froze, causing precipitation and concentration of carbonates and salts. The detection of abundant sodium carbonate, albeit in localized regions at the surface of Ceres, provides constraints on Ceres’ chemical evolution and indicates that aqueous alkaline solutions could even persist in Ceres’ subsurface to the present day. In addition, these regions bear similarities with Enceladus, where ammonia, NaCl, NaHCO3 and Na2CO3 have been detected in plumes23. These observations point to Ceres as an object that has experienced aqueous processes in the recent geological past involving materials similar to those predicted or observed on icy satellites5,20,23,24, confirming the link of Ceres with the bodies of the outer Solar System2.
Online Content Methods, along with any additional Extended Data display items and Source Data, are available in the online version of the paper; references unique to these sections appear only in the online paper.
Received 15 February; accepted 25 April 2016.
Published online 29 June 2016.
1. Nathues, A. et al. Sublimation in bright spots on (1) Ceres. Nature 528, 237–240 (2015).
2. De Sanctis, M. C. et al. Ammoniated phyllosilicates with a likely outer Solar System origin on (1) Ceres. Nature 528, 241–244 (2015).
3. King, T., Clark, R., Calvin, W., Sherman, D. & Brown, R. Evidence for ammonium-bearing minerals on Ceres. Science 255, 1551–1553 (1992).
4. Ammannito, E. et al. Distribution of phyllosilicates on Ceres. Science (in the press).
5. Postberg, F., Schmidt, J., Hillier, J., Kempf, S. & Srama, R. A salt-water reservoir as the source of a compositionally stratified plume on Enceladus. Nature 474, 620–622 (2011).
6. Buczkowski, D. et al. The geomorphology of Ceres. Science (in the press).7. De Sanctis, M. C. et al. The VIR spectrometer. Space Sci. Rev. 163, 329–369
(2011).8. Rivkin, A. S., Volquardsen, E. L. & Clark, B. E. The surface composition of
Ceres: discovery of carbonates and iron-rich clays. Icarus 185, 563–567 (2006).
9. Beran, A. in Micas: Crystal Chemistry and Metamorphic Petrology (eds Mottana, A., Sassi, F. P., Thompson, J. B. & Guggenheim, S.). 351–370 (Mineralogical Society of America, 2002).
10. Bishop, J. L. et al. Reflectance and emission spectroscopy study of four groups of phyllosilicates: smectites, kaolinite-serpentines, chlorites and micas. Clay Miner. 43, 35–54 (2008).
11. Hunt, G. R. & Salisbury, J. W. Visible and near infrared spectra of minerals and rocks. II. Carbonates. Mod. Geol. 2, 23–30 (1971).
12. Harner, P. L. & Gilmore, M. S. Visible-near infrared spectra of hydrous carbonates, with implications for the detection of carbonates in hyperspectral data of Mars. Icarus 250, 204–214 (2015).
13. Moore, M. H. et al. Ammonia water ice laboratory studies relevant to outer Solar System surfaces. Icarus 190, 260–273 (2007).
14. Moore, M. H., Hudson, R. L. & Ferrante, R. F. Radiation products in processed ices relevant to Edgeworth-Kuiper-belt objects. Earth Moon Planets 92, 291–306 (2003).
15. Berg, B. L. et al. Reflectance spectroscopy (0.35–8 μm) of ammonium-bearing minerals and qualitative comparison to Ceres-like asteroid. Icarus 265, 218–237 (2016).
16. de Leuw, S., Rubin, A. E. & Wasson, J. T. Carbonates in CM chondrites: complex formational histories and comparison to carbonates in CI chondrites. Meteorit. Planet. Sci. 45, 513–530 (2010).
17. Johnson, C. A. & Prinz, M. Carbonate compositions in CM and CI chondrites and implications for aqueous alteration. Geochim. Cosmochim. Acta 57, 2843–2852 (1993).
18. Brearley, A. J. in Meteorites and the Early Solar System II 587–624 (Univ. Arizona Press, 2006).
19. Zolotov, M. Yu. Aqueous fluid composition in CI chondritic materials: chemical equilibrium assessments in closed systems. Icarus 220, 713–729 (2012).
20. Zolotov, M. Y. An oceanic composition on early and today’s Enceladus. Geophys. Res. Lett. 34, L23203 (2007).
21. Castillo-Rogez, J. C. & McCord, T. B. Ceres’ evolution and present state constrained by shape data. Icarus 205, 443–459 (2010).
22. Bowling, T. J. et al. Impact induced heating of Occator crater on asteroid 1 Ceres. 47th Lunar Planetary Sci. Conf. abstr. 2268 (2016).
23. Waite, J. H. et al. Liquid water on Enceladus from observations of ammonia and 40Ar in the plume. Nature 460, 487–490 (2009).
24. Postberg, F. et al. Sodium salts in E ring ice grains from an ocean below the surface of Enceladus. Nature 459, 1098–1101 (2009).
Acknowledgements We thank the following institutions and agencies which supported this work: the Italian Space Agency, the National Aeronautics and Space Administration (NASA, USA) and the Deutsches Zentrum für Luft- und Raumfahrt (DLR, Germany). The VIR was funded and coordinated by the Italian Space Agency and built by SELEX ES, with the scientific leadership of the Institute for Space Astrophysics and Planetology and the Italian National Institute for Astrophysics, and is operated by the Institute for Space Astrophysics and Planetology, Italy. A portion of this work was carried out at the Jet Propulsion Laboratory, California Institute of Technology, USA, under contract to NASA. We also thank the Dawn Mission Operations team and the Framing Camera team.
Author Contributions M.C.D.S., A.R., E.A. and F.G.C. performed data analysis and calibration. M.C. provided optical constants from reflectance spectra. M.C.D.S., C.M.P. and B.L.E. contributed to the spectral interpretation of the data. All authors contributed to the discussion of the results and to writing the paper.
Author Information The VIR calibrated data will be made available through the PDS Small Bodies Node website (http://sbn.pds.nasa.gov/). Reprints and permissions information is available at www.nature.com/ reprints. The authors declare no competing financial interests. Readers are welcome to comment on the online version of the paper. Correspondence and requests for materials should be addressed to M.C.D.S. ([email protected]).
Reviewer Information Nature thanks V. Reddy, A. S. Rivkin and M. M. Zolotov for their contribution to the peer review of this work.
© 2016 Macmillan Publishers Limited, part of Springer Nature. All rights reserved.
LETTERRESEARCH
25. Hapke, B. Theory of Reflectance and Emittance Spectroscopy (Cambridge Univ. Press, 2012).
26. Carli, C., Ciarniello, M., Capaccioni, F., Serventi, G. & Sgavetti, M. Spectral variability of plagioclase-mafic mixtures (2): investigation of the optical constant and retrieved mineral abundance dependence on particle size distribution. Icarus 235, 207–219 (2014).
27. Raponi, A. Spectrophotometric analysis of cometary nuclei from in situ observations. PhD thesis, Univ. degli studi di Roma Tor Vergata; preprint at http://arxiv.org/abs/1503.08172 (2015).
28. De Sanctis, M. C. et al. The diurnal cycle of water ice on comet 67P/Churyumov–Gerasimenko. Nature 525, 500–503 (2015).
29. Filacchione, G. et al. Exposed water ice on the nucleus of comet 67P/Churyumov–Gerasimenko. Nature 529, 368–372 (2016).
30. Warren, S. G. Optical constants of ice from the ultraviolet to the microwave. Appl. Opt. 23, 1206–1225 (1984).
31. Mastrapa, R. M. et al. Optical constants of amorphous and crystalline H2O-ice in the near infrared from 1.1 to 2.6 μm. Icarus 197, 307–320 (2008).
32. Mastrapa, R. M. et al. Optical constants of amorphous and crystalline H2O-ice: 2.5–22 μm (4000–455 cm−1) optical constants of H2O-ice. Astrophys. J. 701, 1347–1356 (2009).
33. Clark, R. N. et al. The surface composition of Iapetus: mapping results from Cassini VIMS. Icarus 218, 831–860 (2012).
34. Kiefer, D. M. Soda ash, Solvay style. Today's Chemist at Work 11 (2), 87–88, 90 (2002).
35. Clark, R. N. et al. Splib06a. US Geol. Surv. Data 231, http://speclab.cr.usgs.gov/spectral.lib06/ (USGS Digital Spectral Library, 2007).
36. Takir, D. et al. Nature and degree of aqueous alteration in CM and CI carbonaceous chondrites. Meteorit. Planet. Sci. 48, 1618–1637 (2013).
37. Milliken, R. E. & Mustard, J. F. Quantifying absolute water content of minerals using near infrared reflectance spectroscopy. J. Geophys. Res. 110, E12001 (2005).
METHODSComposition analysis. The spectra analysed here have been corrected for standard geometry (incidence angle 30°, emission angle 0°, phase angle 30°) to derive the values of reflectance. In particular, the central Occator bright spectrum reported in the main text is derived as an average of the four brightest spectra acquired during acquisition number 498468846 with the following viewing geometry: phase angle 45°, incidence angle 18°, emission angle 41°. The resulting spectrum has also been corrected for thermal emission.
We model Ceres’ average spectrum as an intimate mixture of different end-members, by means of Hapke theory25, which characterizes light scattering in particulate media. The optical constants are derived from reflectance spectra as in ref. 26. Abundances and grain size of the components are free parameters, and a best fit is obtained by means of a least-squares optimization algorithm27–29. The model accounts for the viewing geometry (incidence, emission and phase angle) which is calculated according to the shape model, the spacecraft attitude, and the latitude and longitude of a given pixel on the surface. The model also accounts for the single particle phase function, which is a free parameter in the fitting procedure.
We take advantage of the modelling performed for the overall surface of Ceres6 as a starting point for the bright spot composition. A first fit is made by adding water ice to the end-members listed in Extended Data Table 1 (magnetite, antigorite, NH4-montmorillonite and dolomite). Although the model can roughly account for the increase in the depth of the complex 3-μm band, this fit is unsatisfactory. Absorption bands of carbonates (3.5 μm, 4.0 μm) are poorly fitted; other minor absorption bands in the measured spectrum (2.2 μm, 2.9 μm) are absent in the model; conversely, some bands required by the model, like the 2.0-μm absorption band of water ice, have not been observed.
As discussed in the main text, the best fit is obtained by changing the kind of car-bonate and phyllosilicate with respect to the average composition of the surface2 and adding ammonium chloride, or ammonium bicarbonate (Extended Data Table 1 and 2). The components used to produce the best fit (Fig. 4) and the references for the spectra used for the analysis are listed in Extended Data Table 1. The model with water ice30–33 does not improve the fits. However, a small amount (1 vol%) is still compatible (Extended Data Table 2). The parameters obtained are listed in Extended Data Table 2.
In the case of dark materials, the albedo is weakly linked to grain size, so grain size cannot be determined unequivocally. However, it can be constrained to be within the range 20–100 μm, which is reasonable for surface regolith. For each combination of end-members, the best fit is repeated for the two grain size limits of the dark material. From the distribution of the results (Extended Data Table 2), one can evaluate the mean value and the uncertainties on the retrieved parameters.Formation of Occator’s bright area material. The abundant carbonate in Occator’s bright area requires (i) substantial amounts of carbon in solution, perhaps derived from the dissolution of organics, which are found in carbonaceous chondrites, and potentially augmented by CO/CO2-bearing ices that may have accompanied the nitrogen-bearing material from the outer Solar System2; (ii) substantial amounts of fluid with dilute carbonate and bicarbonate ions, and/or (iii) a concentration of carbonate at or near the surface by migration and evaporation of fluids near the
surface of Ceres, similar to evaporates or ‘caliche’ in terrestrial soils. Ammonium may be present in the form of ammoniated salts from freezing of the early ocean in which the observed surface mineralogy formed, or it may be derived from brines interacting with the NH4 present in typical Ceres surface materials2.
Ammonium makes the solution basic, converting dissolved carbonate anions into bicarbonate anions, which then readily associate with ammonium cations. However, in the presence of dissolved NaCl, the ammonium preferentially com-bines with chlorine while sodium combines with bicarbonate. This assemblage can be exposed on the surface of Ceres, through fractures or cratering events, following emplacement and sublimation of the ice.
The association of sodium carbonate and ammonium chloride (and/or ammo-nium carbonate) described in the Occator bright spots is thus consistent with the freezing or evaporation products of a salt solution bearing carbon species and ammonium ions. This process is similar to that employed for the synthesis of industrial sodium carbonate on Earth34, except that the saturation of the solution in CO2 does not require the high-temperature breakdown of calcite or limestone if alternative sources of carbon are already present in solution.Code availability. We have opted not to make the code available for fitting the data because it is a numerical code developed specifically for this purpose, but the code is described in refs 27, 28 and 29.
© 2016 Macmillan Publishers Limited, part of Springer Nature. All rights reserved.
LETTER RESEARCH
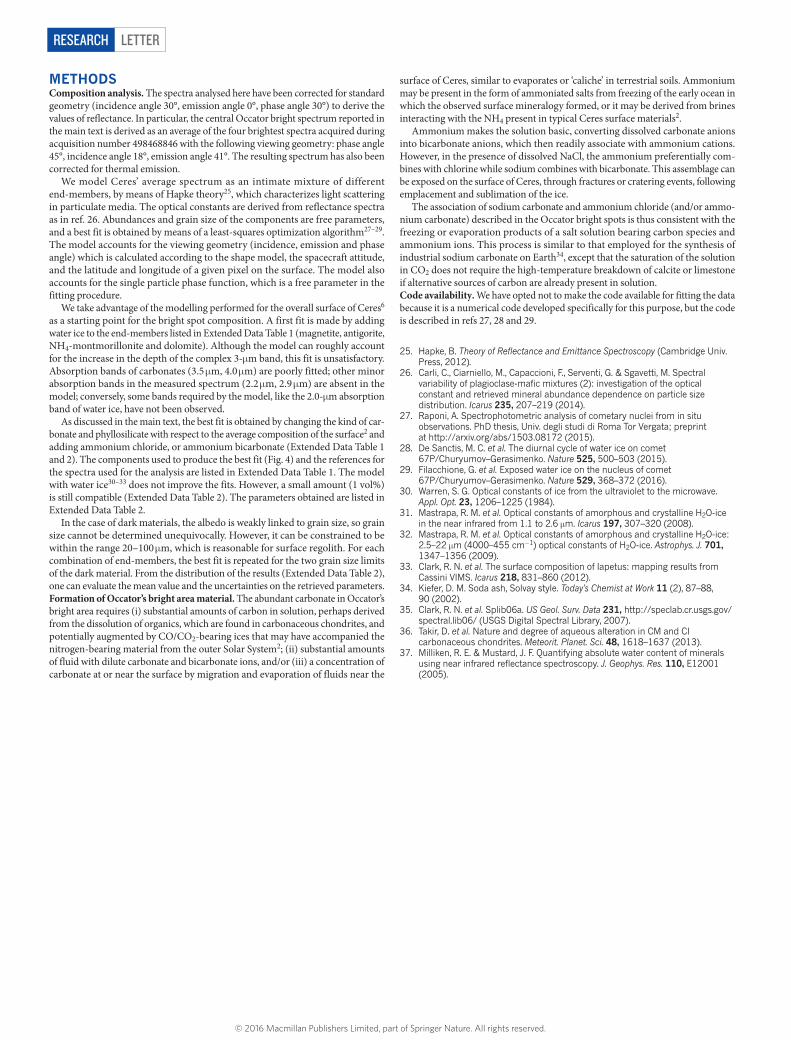
Extended Data Figure 1 | Occator floor spectrum. Spectral fit (red) of the reflectance spectrum of the floor of the Occator crater (black) using the same end-members as discussed for the average surface2. The computed χ2 for the mixture is given in the plot. Error bars for the Occator floor spectrum are calculated taking into account a mean absolute deviation of the calibration uncertainties along the 256 samples.
© 2016 Macmillan Publishers Limited, part of Springer Nature. All rights reserved.
LETTERRESEARCH
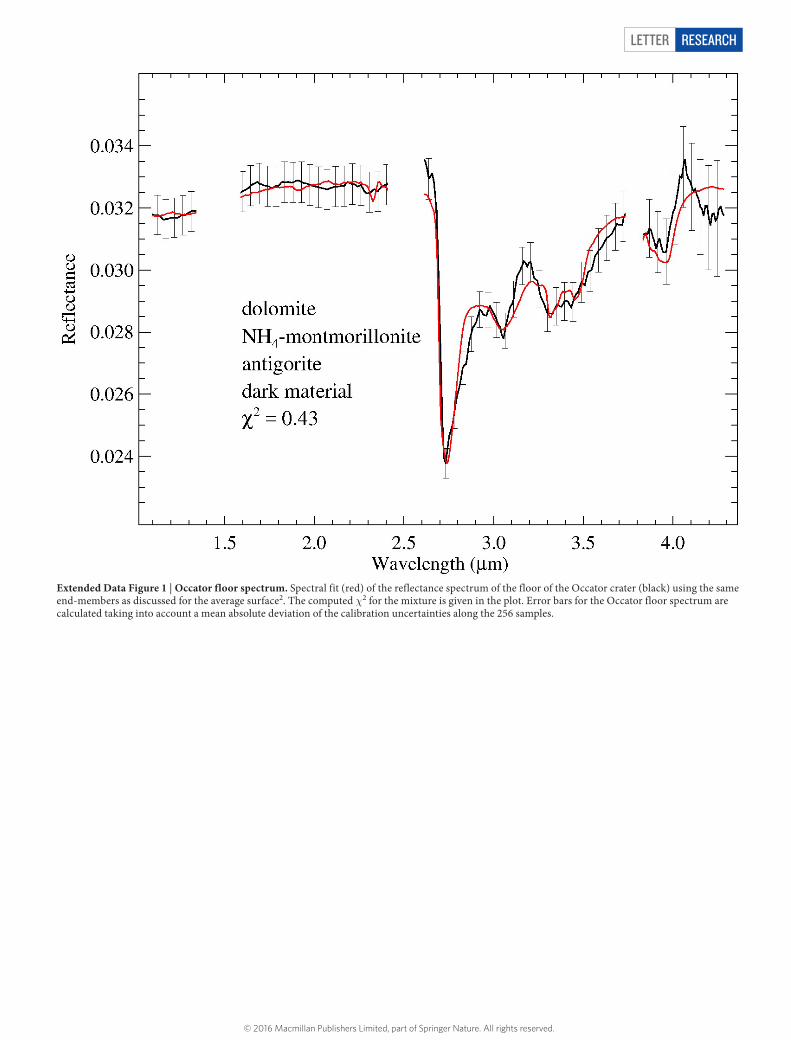
Extended Data Figure 2 | Spectral fit with hexahydrite. Modelled spectrum (red) of a mixture of hexahydrite (MgSO4·6H2O) (30 vol%) with the average for Ceres (70 vol%). Strong absorptions bands due to H2O are visible at 1.4 μm, 1.95 μm, 2.45 μm and 3 μm in the modelled spectrum,
which are not observed in the Occator bright spectrum (black). Error bars for the Occator spectrum are calculated taking into account a mean absolute deviation of the calibration uncertainties along the 256 samples.
© 2016 Macmillan Publishers Limited, part of Springer Nature. All rights reserved.
LETTER RESEARCH
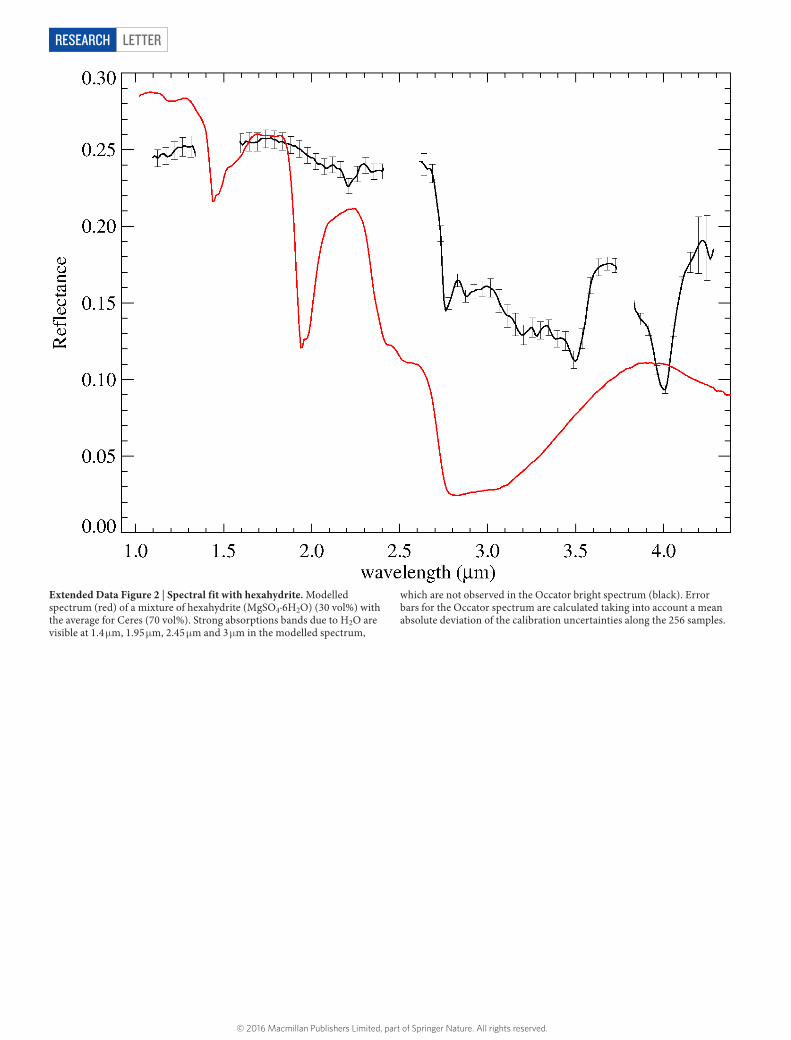
Extended Data Figure 3 | Spectral fit with water ice. Spectral fit (red) of the reflectance spectrum of the bright spot in Occator (black) using the same end-members discussed for the average surface2 and adding water ice (Extended Data Table 1). Resulting parameters are reported in Extended Data Table 2. Several absorptions present are poorly fitted, and several
absorptions predicted by the best-fit model are absent. The computed χ2 for the mixture is given in the plot. Error bars for the Occator spectrum are calculated taking into account a mean absolute deviation of the calibration uncertainties along the 256 samples.
© 2016 Macmillan Publishers Limited, part of Springer Nature. All rights reserved.
LETTERRESEARCH
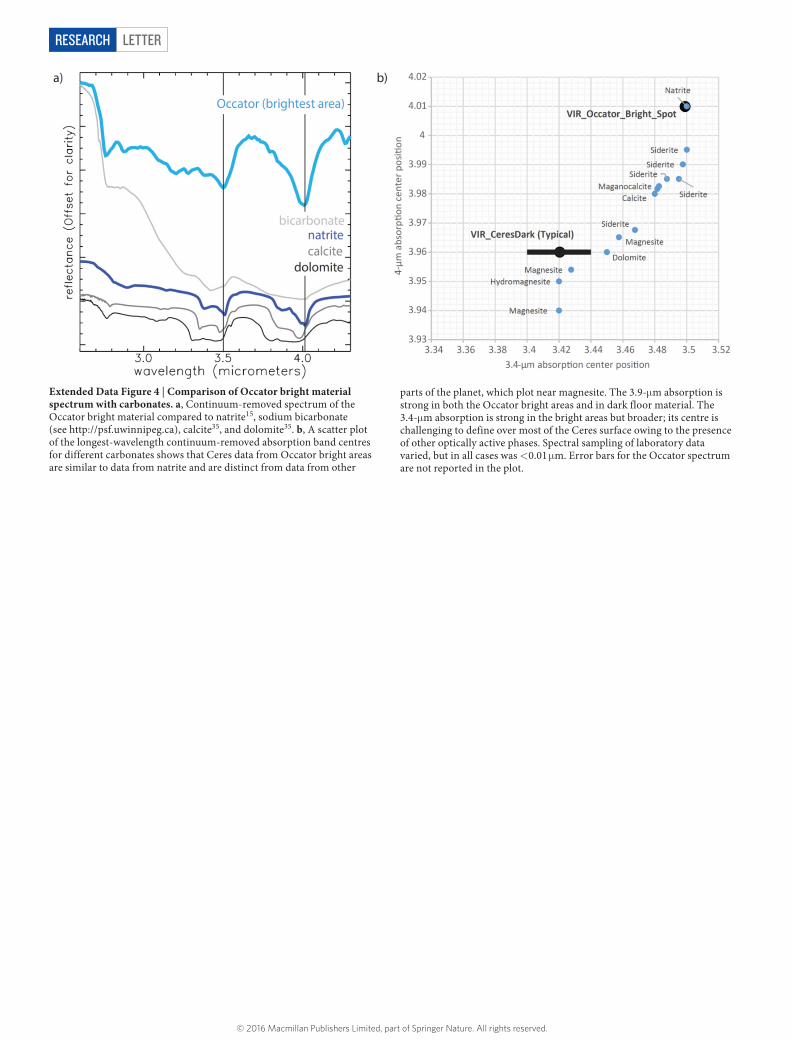
Extended Data Figure 4 | Comparison of Occator bright material spectrum with carbonates. a, Continuum-removed spectrum of the Occator bright material compared to natrite15, sodium bicarbonate (see http://psf.uwinnipeg.ca), calcite35, and dolomite35. b, A scatter plot of the longest-wavelength continuum-removed absorption band centres for different carbonates shows that Ceres data from Occator bright areas are similar to data from natrite and are distinct from data from other
parts of the planet, which plot near magnesite. The 3.9-μm absorption is strong in both the Occator bright areas and in dark floor material. The 3.4-μm absorption is strong in the bright areas but broader; its centre is challenging to define over most of the Ceres surface owing to the presence of other optically active phases. Spectral sampling of laboratory data varied, but in all cases was <0.01 μm. Error bars for the Occator spectrum are not reported in the plot.
© 2016 Macmillan Publishers Limited, part of Springer Nature. All rights reserved.
LETTER RESEARCH
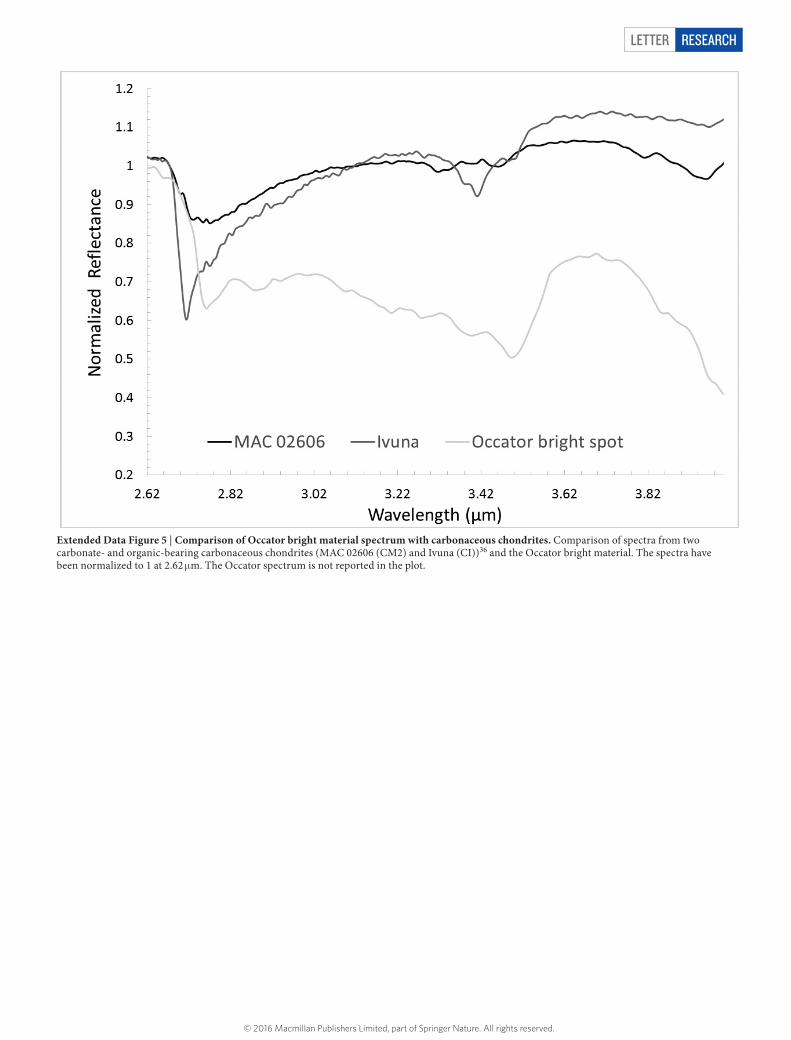
Extended Data Figure 5 | Comparison of Occator bright material spectrum with carbonaceous chondrites. Comparison of spectra from two carbonate- and organic-bearing carbonaceous chondrites (MAC 02606 (CM2) and Ivuna (CI))36 and the Occator bright material. The spectra have been normalized to 1 at 2.62 μm. The Occator spectrum is not reported in the plot.
© 2016 Macmillan Publishers Limited, part of Springer Nature. All rights reserved.
LETTERRESEARCH
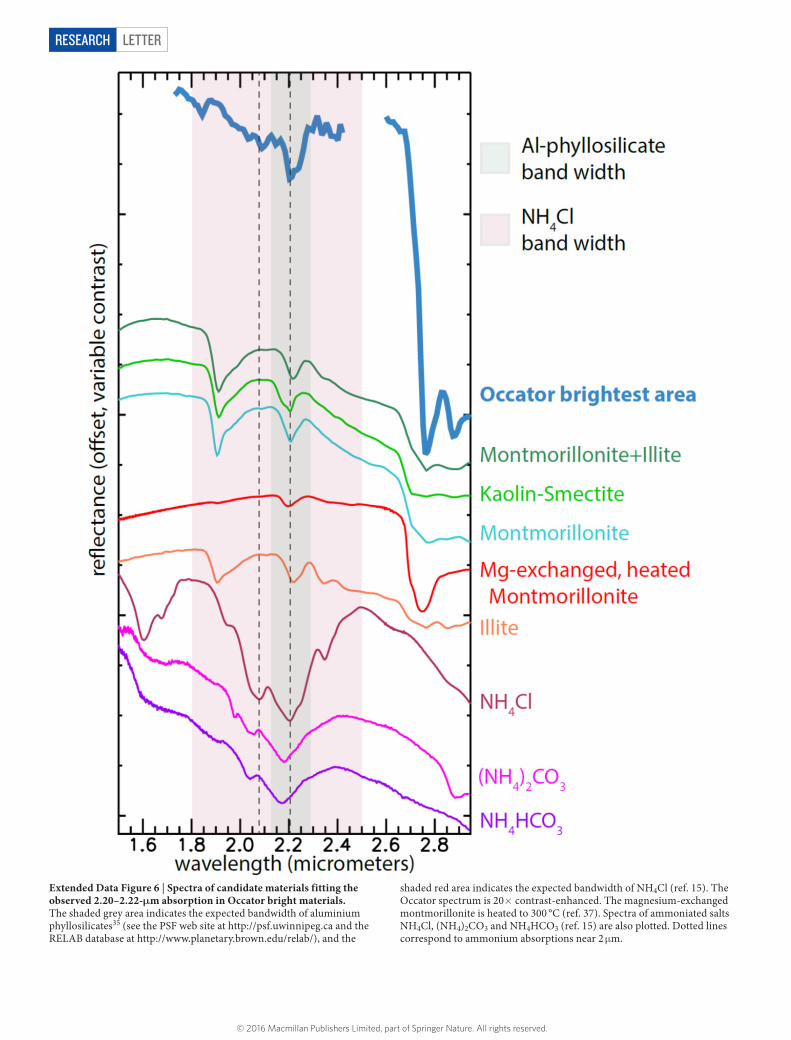
Extended Data Figure 6 | Spectra of candidate materials fitting the observed 2.20–2.22-μm absorption in Occator bright materials. The shaded grey area indicates the expected bandwidth of aluminium phyllosilicates35 (see the PSF web site at http://psf.uwinnipeg.ca and the RELAB database at http://www.planetary.brown.edu/relab/), and the
shaded red area indicates the expected bandwidth of NH4Cl (ref. 15). The Occator spectrum is 20× contrast-enhanced. The magnesium-exchanged montmorillonite is heated to 300 °C (ref. 37). Spectra of ammoniated salts NH4Cl, (NH4)2CO3 and NH4HCO3 (ref. 15) are also plotted. Dotted lines correspond to ammonium absorptions near 2 μm.
© 2016 Macmillan Publishers Limited, part of Springer Nature. All rights reserved.
LETTER RESEARCH
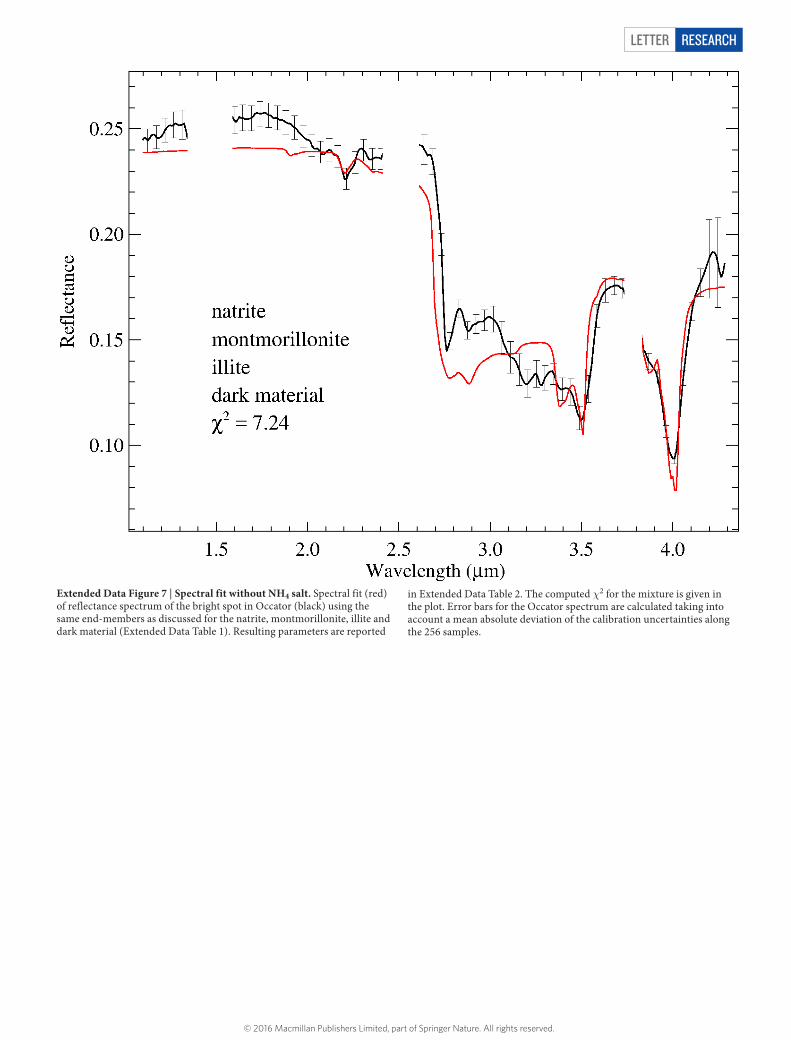
Extended Data Figure 7 | Spectral fit without NH4 salt. Spectral fit (red) of reflectance spectrum of the bright spot in Occator (black) using the same end-members as discussed for the natrite, montmorillonite, illite and dark material (Extended Data Table 1). Resulting parameters are reported
in Extended Data Table 2. The computed χ2 for the mixture is given in the plot. Error bars for the Occator spectrum are calculated taking into account a mean absolute deviation of the calibration uncertainties along the 256 samples.
© 2016 Macmillan Publishers Limited, part of Springer Nature. All rights reserved.
LETTERRESEARCH
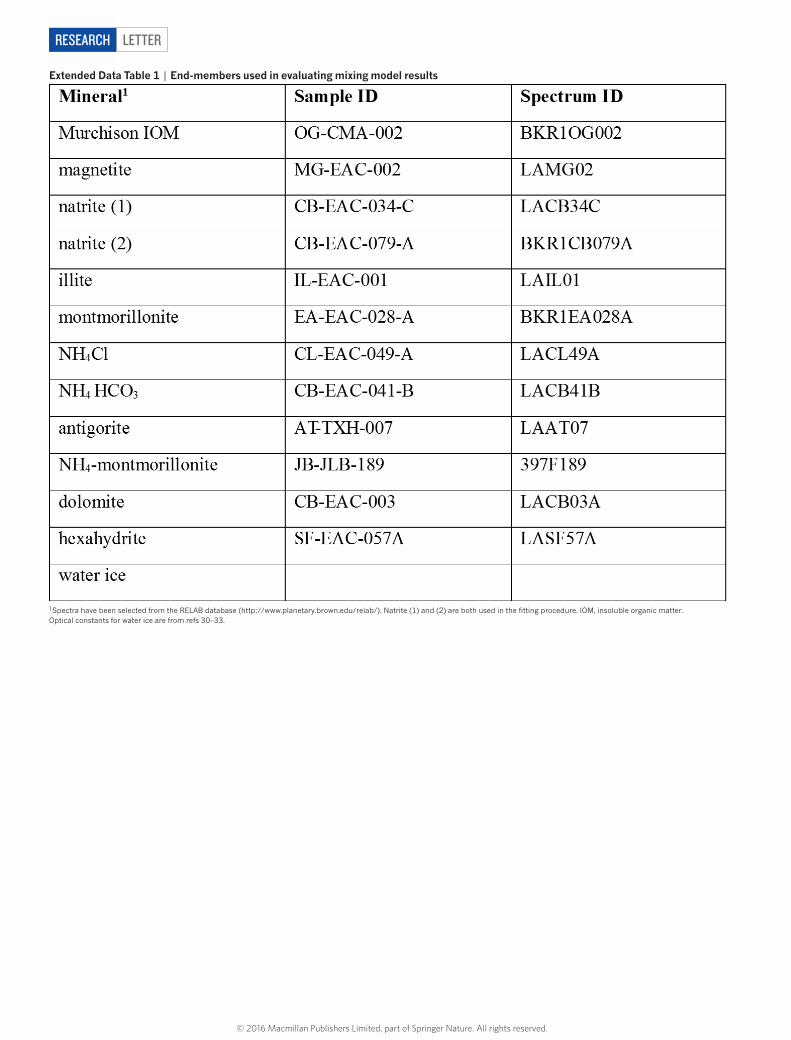
Extended Data Table 1 | End-members used in evaluating mixing model results
1Spectra have been selected from the RELAB database (http://www.planetary.brown.edu/relab/). Natrite (1) and (2) are both used in the fitting procedure. IOM, insoluble organic matter. Optical constants for water ice are from refs 30–33.
© 2016 Macmillan Publishers Limited, part of Springer Nature. All rights reserved.
LETTER RESEARCH
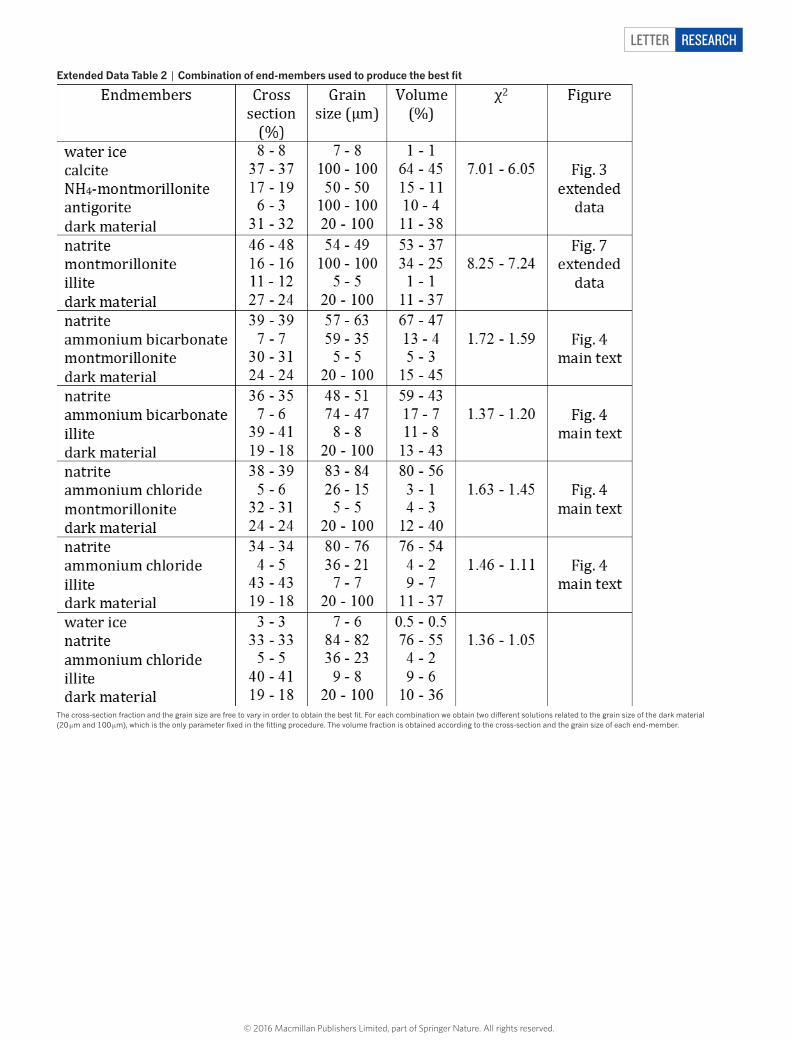
Extended Data Table 2 | Combination of end-members used to produce the best fit
The cross-section fraction and the grain size are free to vary in order to obtain the best fit. For each combination we obtain two different solutions related to the grain size of the dark material (20 μm and 100 μm), which is the only parameter fixed in the fitting procedure. The volume fraction is obtained according to the cross-section and the grain size of each end-member.
© 2016 Macmillan Publishers Limited, part of Springer Nature. All rights reserved.


![Research Article Influence of Ammonium Zirconium Carbonate ...downloads.hindawi.com/journals/jnm/2015/810464.pdf · of quaternary ammonium salt reagents [ ]. Acetylated ara-binoxylans](https://img.pdfslide.net/doc/110x75/6078011d1d99d7226372d0b8/research-article-influence-of-ammonium-zirconium-carbonate-of-quaternary-ammonium.jpg)