Embed Size (px)
Citation preview
Bring real, hands-on EPR experiments and teaching into your classroom!
Dr. Kalina Ranguelova Application Scientist, Bruker BioSpin
Dr. Ralph T. Weber Application Scientist, Bruker BioSpin
Webinar - November 5, 2014
Would you like to learn more? Contact a customer service representative.
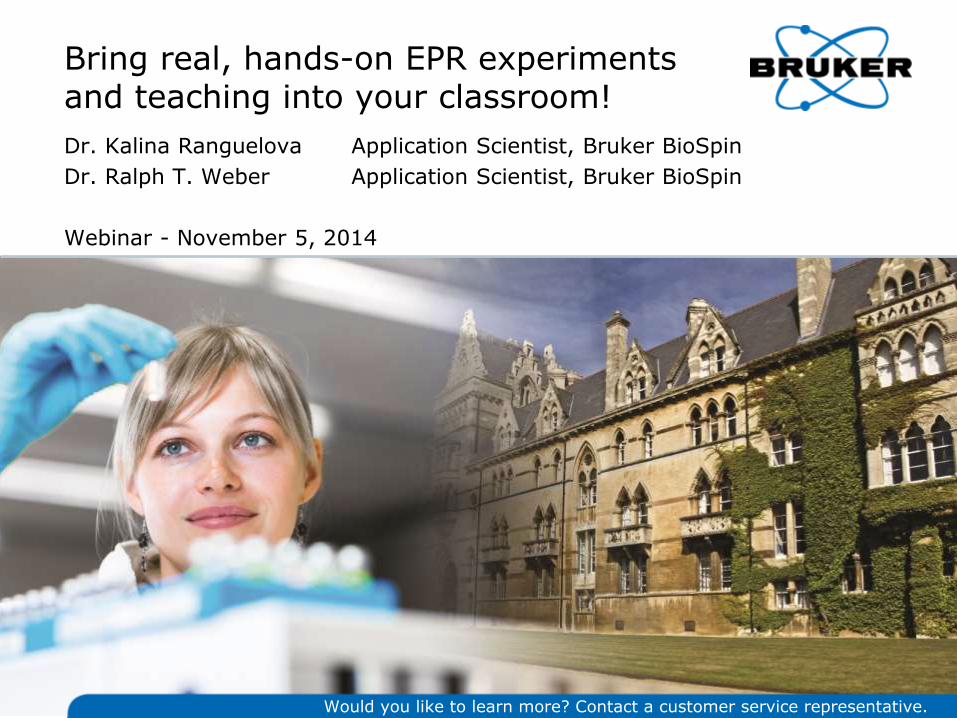
The Next Generation – EPR LabExperiments in the Curriculum
2Innovation with Integrity
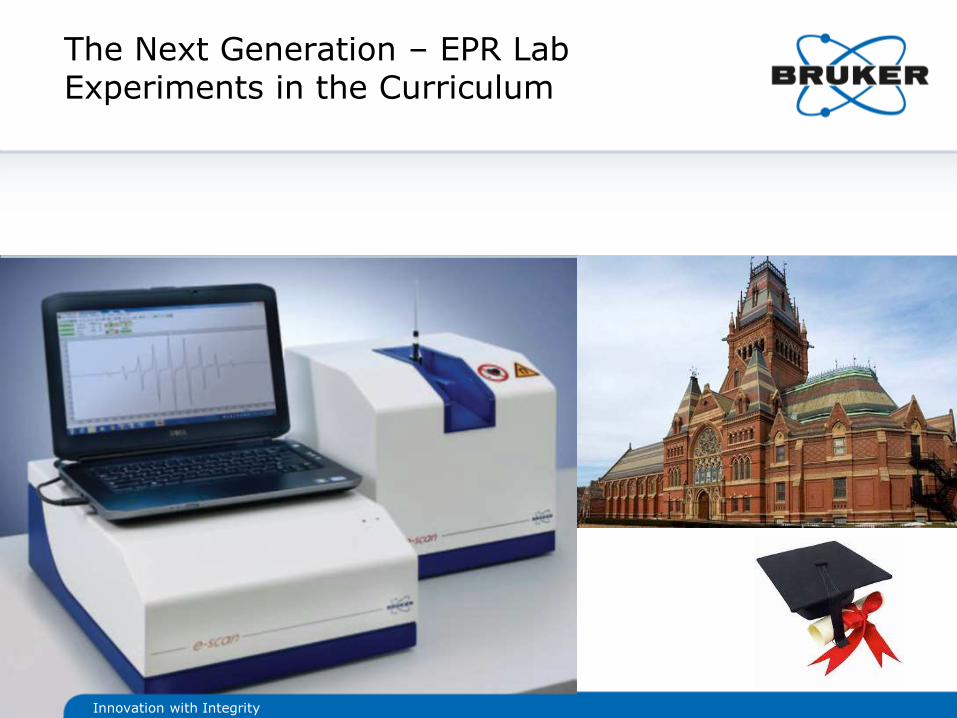
What is EPR?
• EPR stands for Electron Paramagnetic Resonance
• It is also called Electron Spin Resonance (ESR)
• EPR is a spectroscopic technique that detects unpaired electrons in paramagnetic substances
• Unpaired electrons occur in free radicals and many transition metals
• EPR is the only technique that unambiguously detects free radicals
3
Ascorbic Acid AscorbateRadical
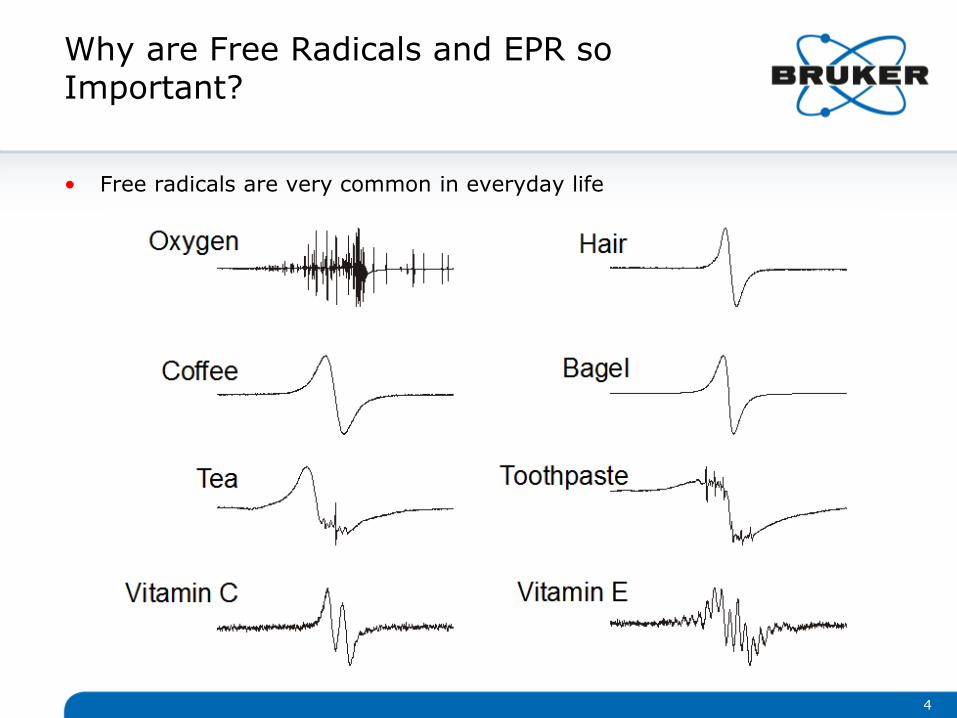
Why are Free Radicals and EPR so Important?
• Free radicals are very common in everyday life
4
Why are Free Radicals and EPR so Important?
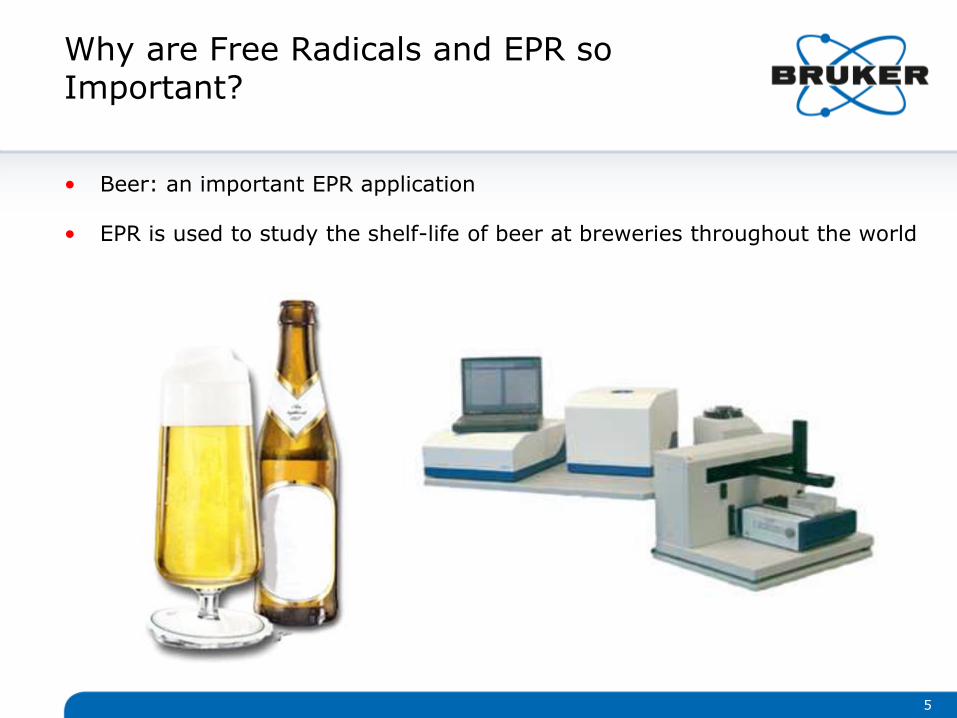
• Beer: an important EPR application
• EPR is used to study the shelf-life of beer at breweries throughout the world
5
Why are Free Radicals and EPR so Important?
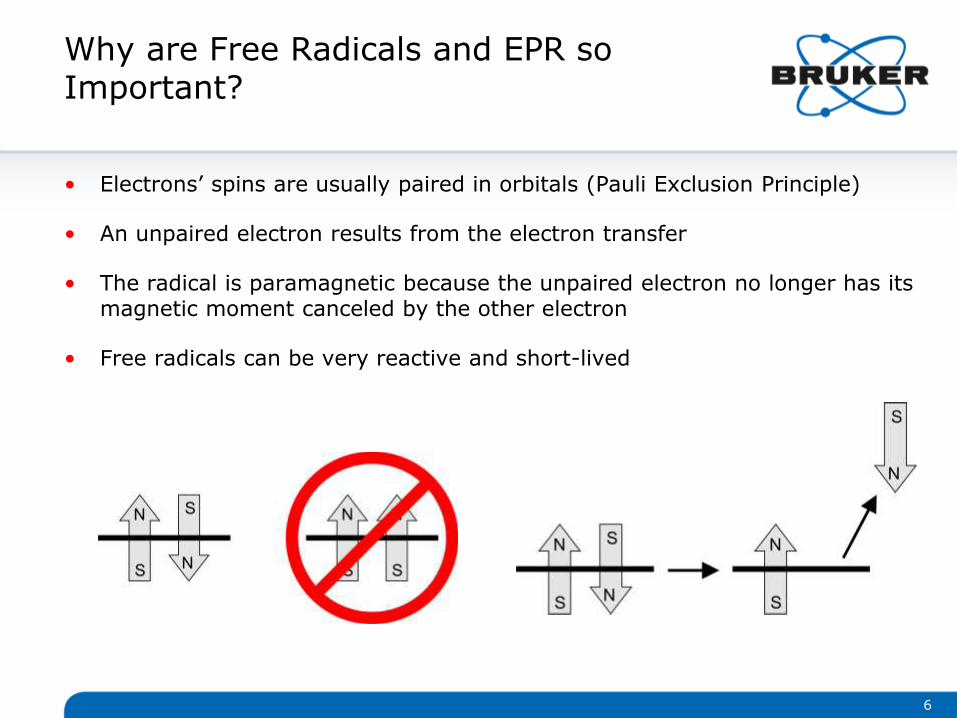
• Electrons’ spins are usually paired in orbitals (Pauli Exclusion Principle)
• An unpaired electron results from the electron transfer
• The radical is paramagnetic because the unpaired electron no longer has its magnetic moment canceled by the other electron
• Free radicals can be very reactive and short-lived
6
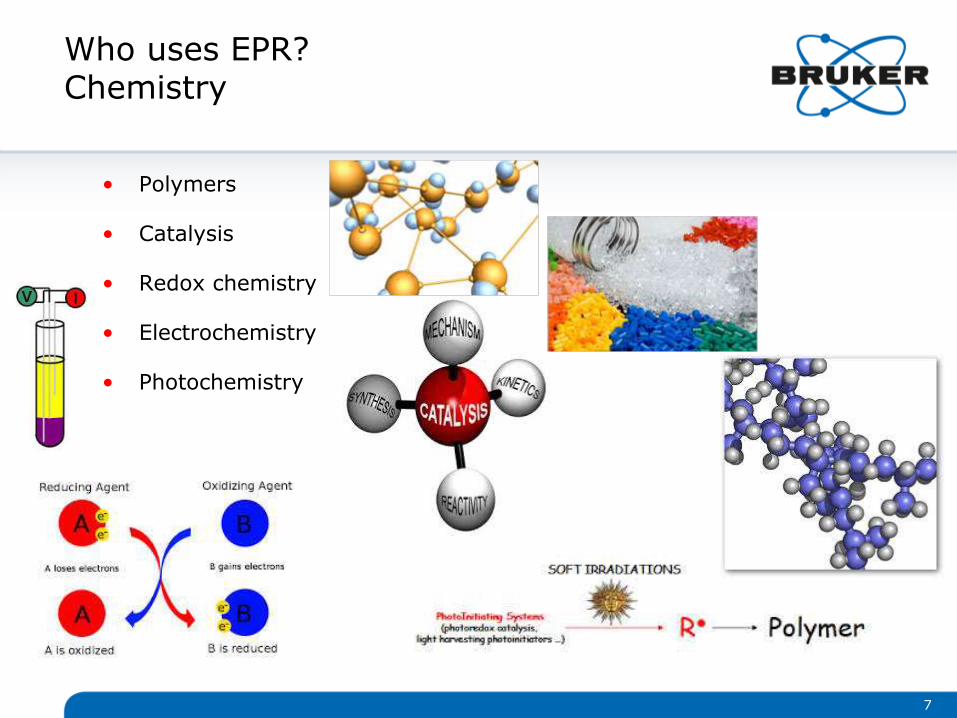
Who uses EPR?Chemistry
• Polymers
• Catalysis
• Redox chemistry
• Electrochemistry
• Photochemistry
7
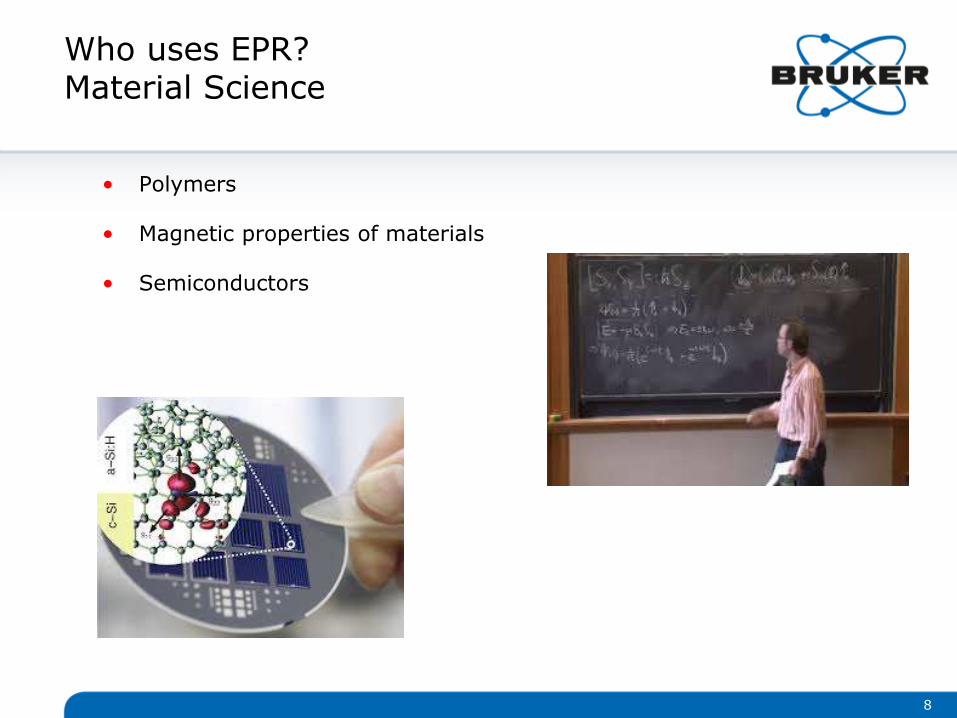
Who uses EPR?Material Science
• Polymers
• Magnetic properties of materials
• Semiconductors
8
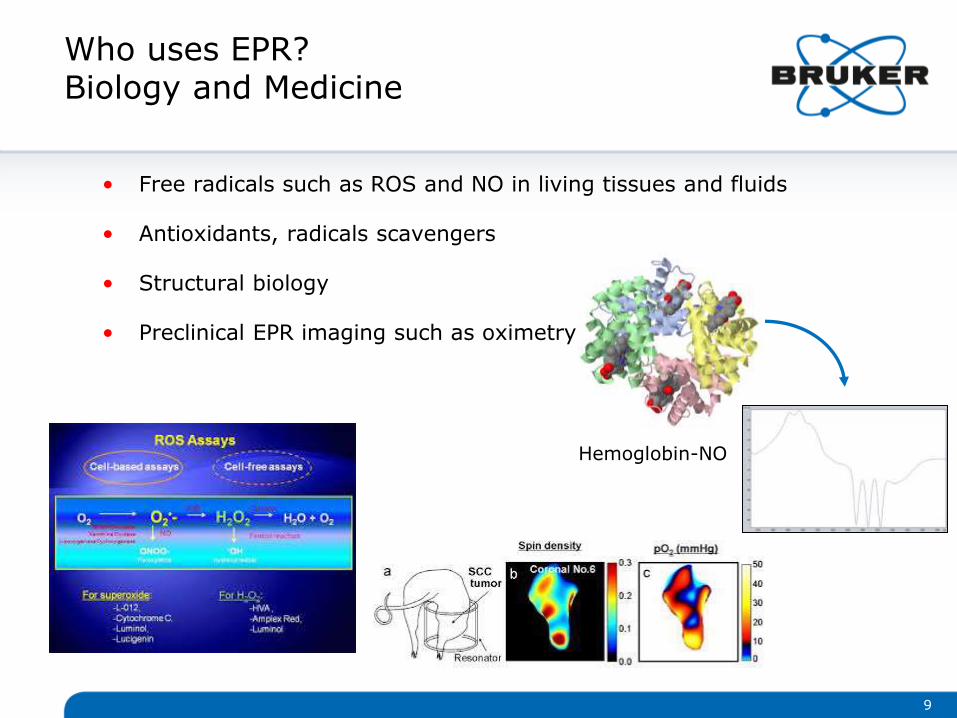
Who uses EPR?Biology and Medicine
• Free radicals such as ROS and NO in living tissues and fluids
• Antioxidants, radicals scavengers
• Structural biology
• Preclinical EPR imaging such as oximetry
9
Hemoglobin-NO
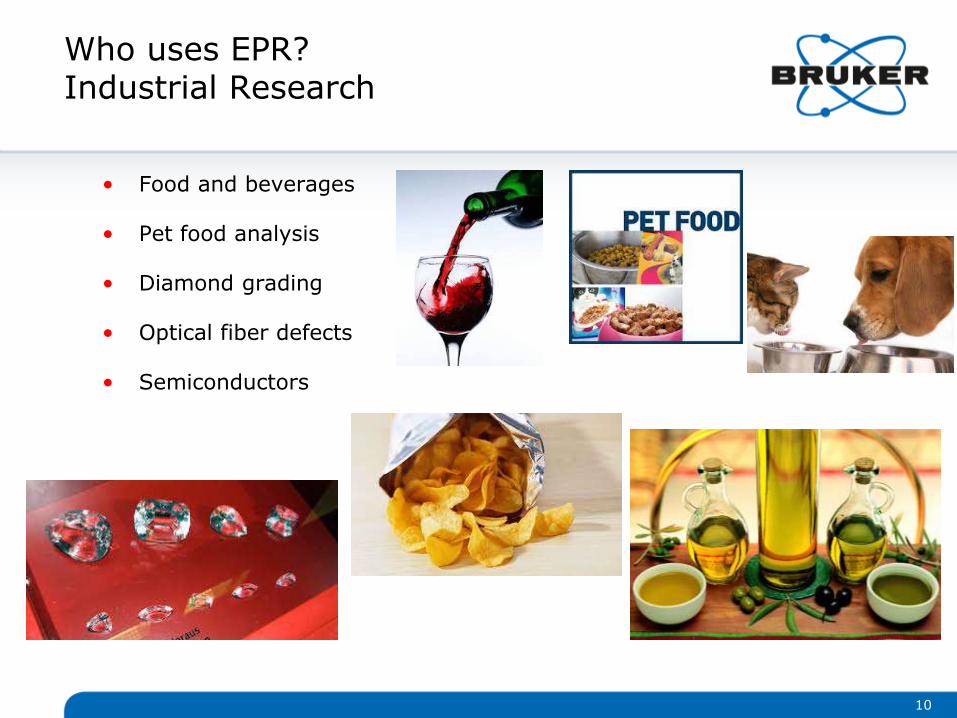
Who uses EPR?Industrial Research
• Food and beverages
• Pet food analysis
• Diamond grading
• Optical fiber defects
• Semiconductors
10
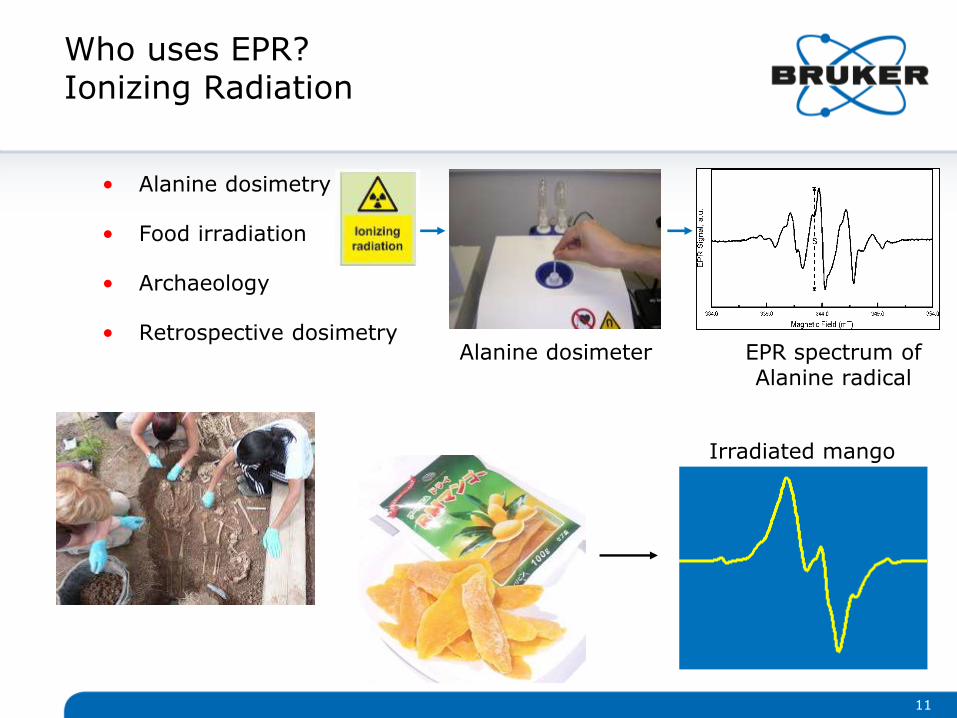
Who uses EPR?Ionizing Radiation
• Alanine dosimetry
• Food irradiation
• Archaeology
• Retrospective dosimetry
11
Irradiated mango
Alanine dosimeter EPR spectrum of Alanine radical
Why is it Important to Develop an Undergraduate EPR Curriculum?
• EPR offers a wealth of solutions for many scientific problems and questions
• Most undergraduates are not exposed to EPR during their education
• EPR is quite often seen as difficult to understand
and difficult to teach
• Bruker has developed an ideal EPR teaching package
• It offers the students an exciting
and interactive learning experience
12
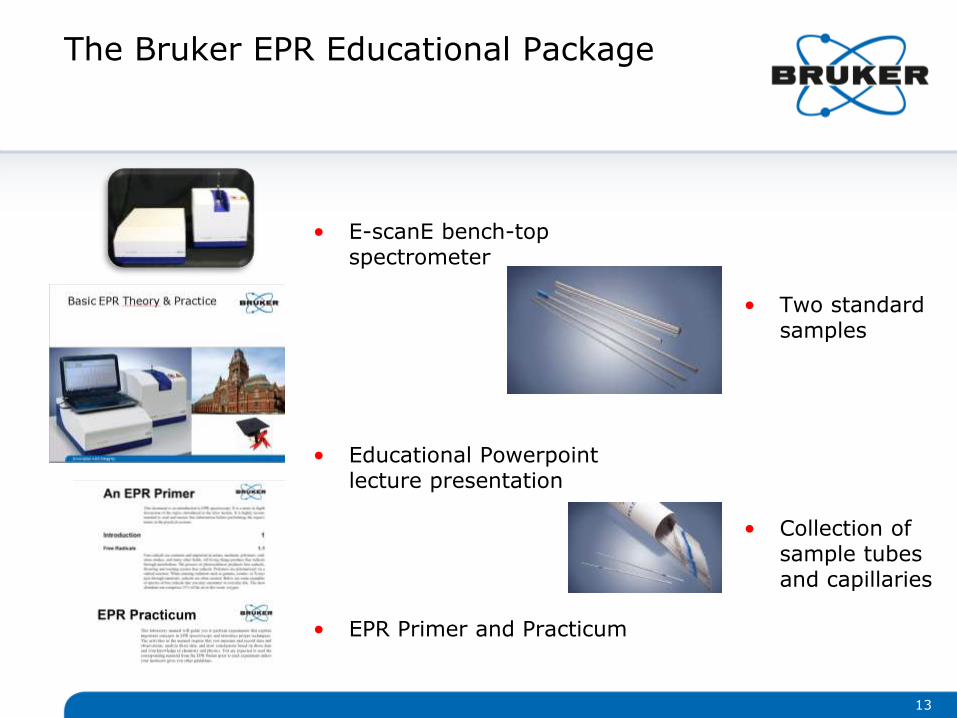
The Bruker EPR Educational Package
• E-scanE bench-top spectrometer
• Educational Powerpointlecture presentation
• EPR Primer and Practicum
13
• Two standard samples
• Collection of sample tubes and capillaries
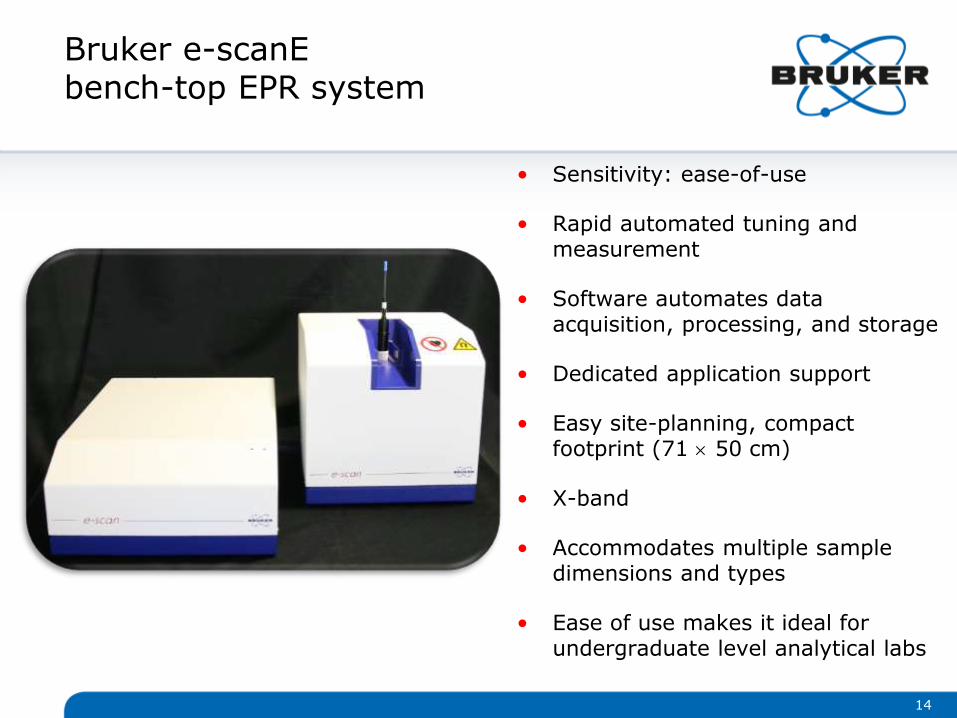
Bruker e-scanEbench-top EPR system
• Sensitivity: ease-of-use
• Rapid automated tuning and measurement
• Software automates data acquisition, processing, and storage
• Dedicated application support
• Easy site-planning, compact footprint (71 50 cm)
• X-band
• Accommodates multiple sample dimensions and types
• Ease of use makes it ideal for undergraduate level analytical labs
14
A Brief Powerpoint Lecture
15
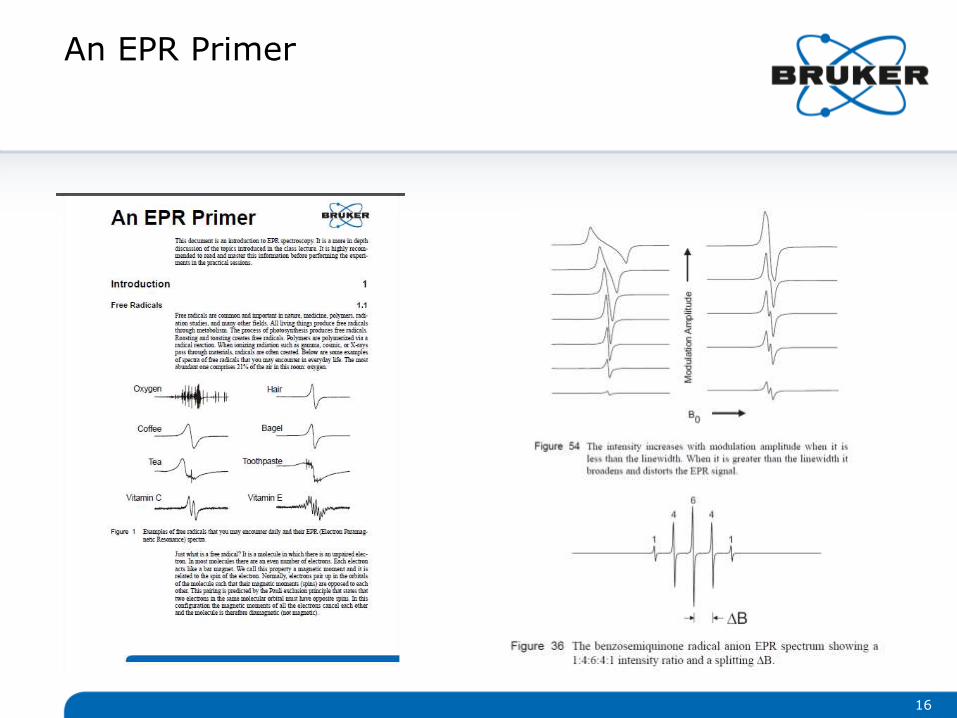
An EPR Primer
16
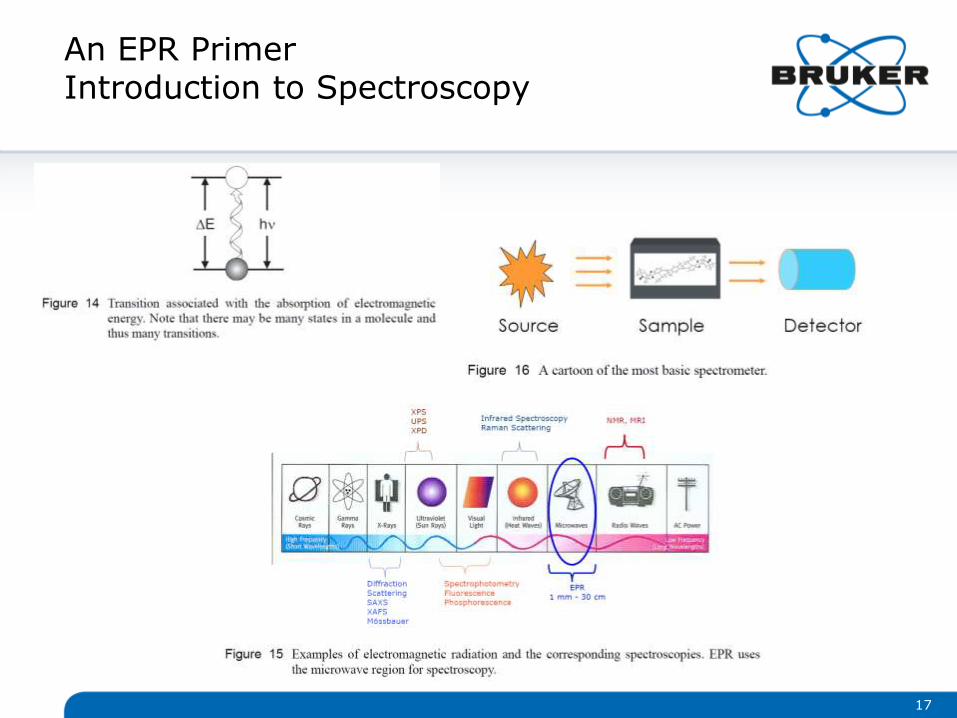
An EPR PrimerIntroduction to Spectroscopy
17
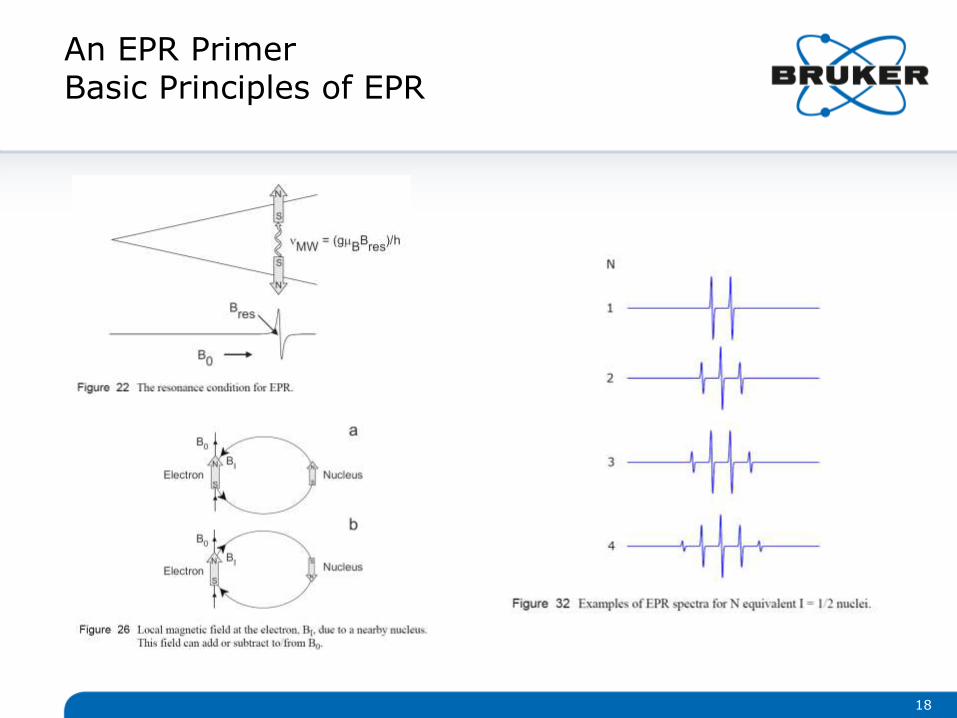
An EPR PrimerBasic Principles of EPR
18
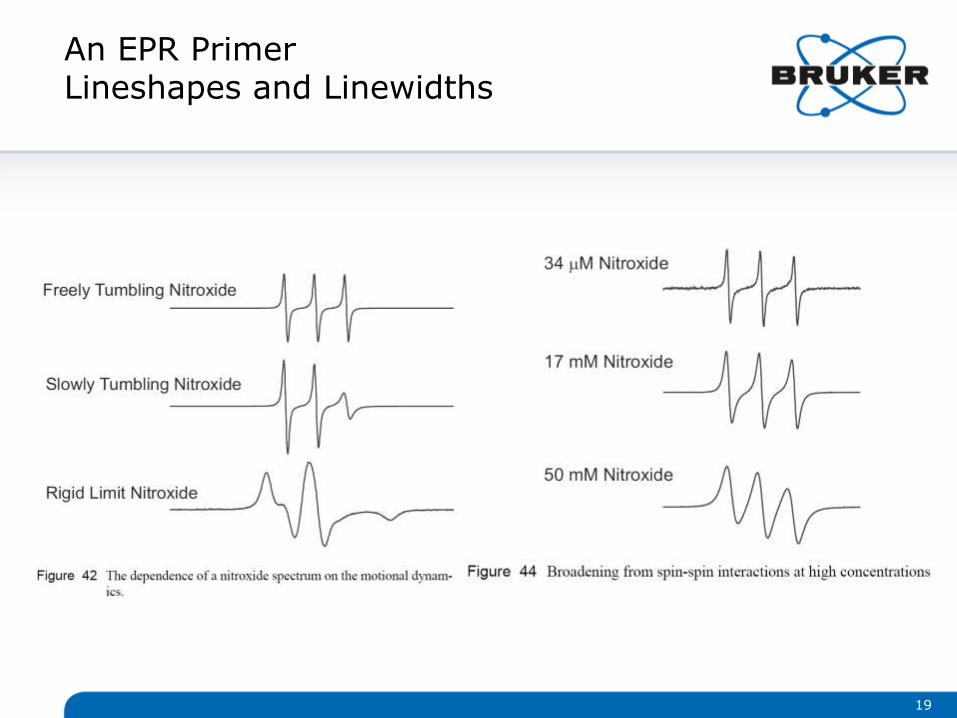
An EPR PrimerLineshapes and Linewidths
19
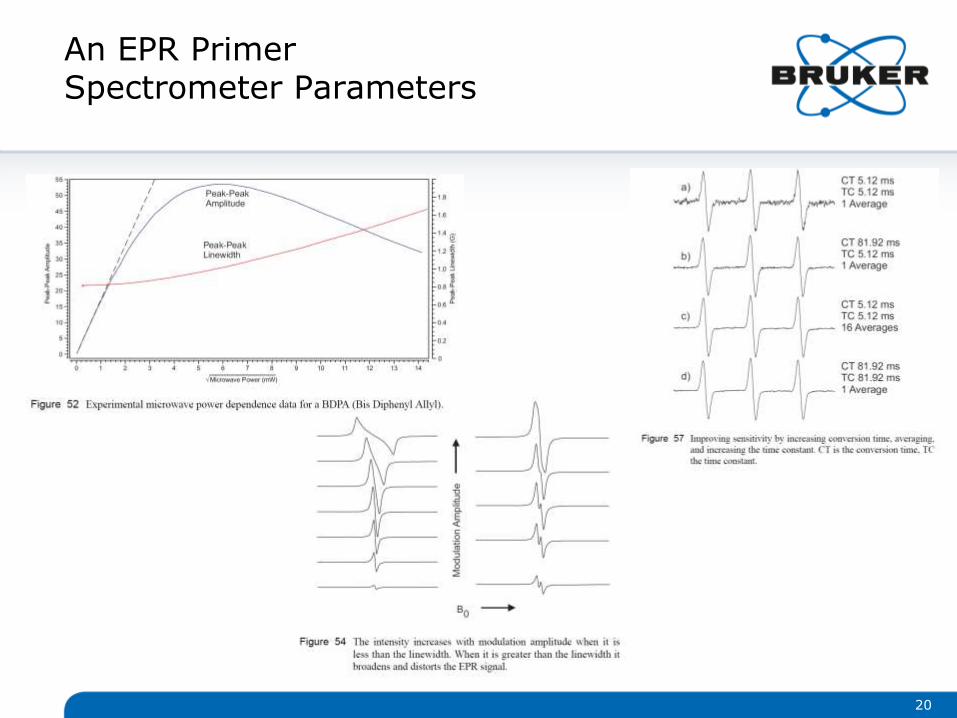
An EPR PrimerSpectrometer Parameters
20
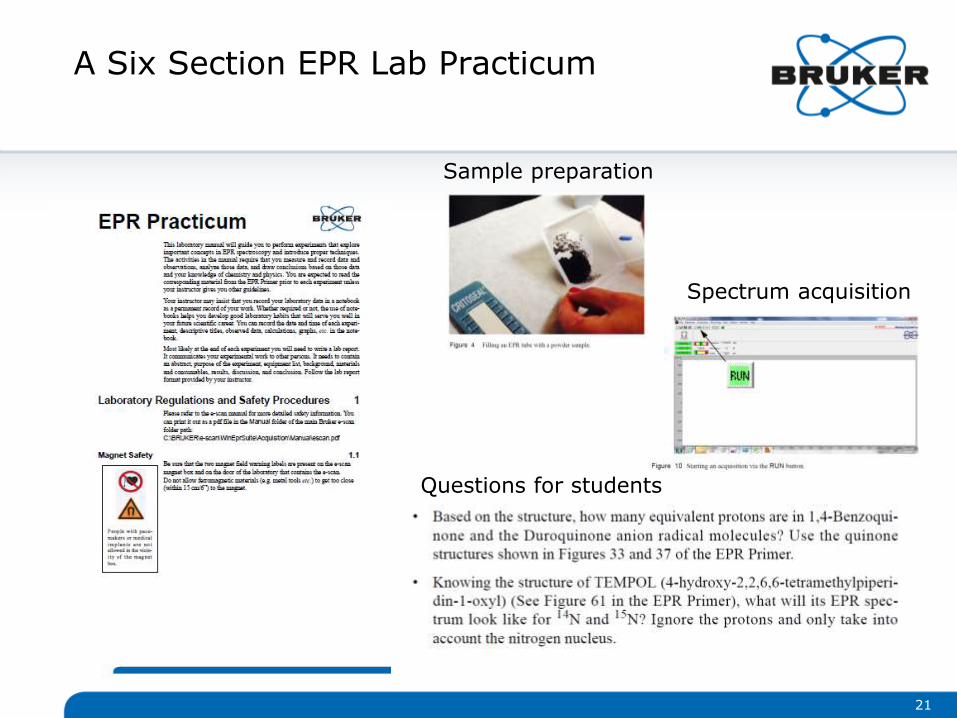
A Six Section EPR Lab Practicum
21
Sample preparation
Spectrum acquisition
Questions for students
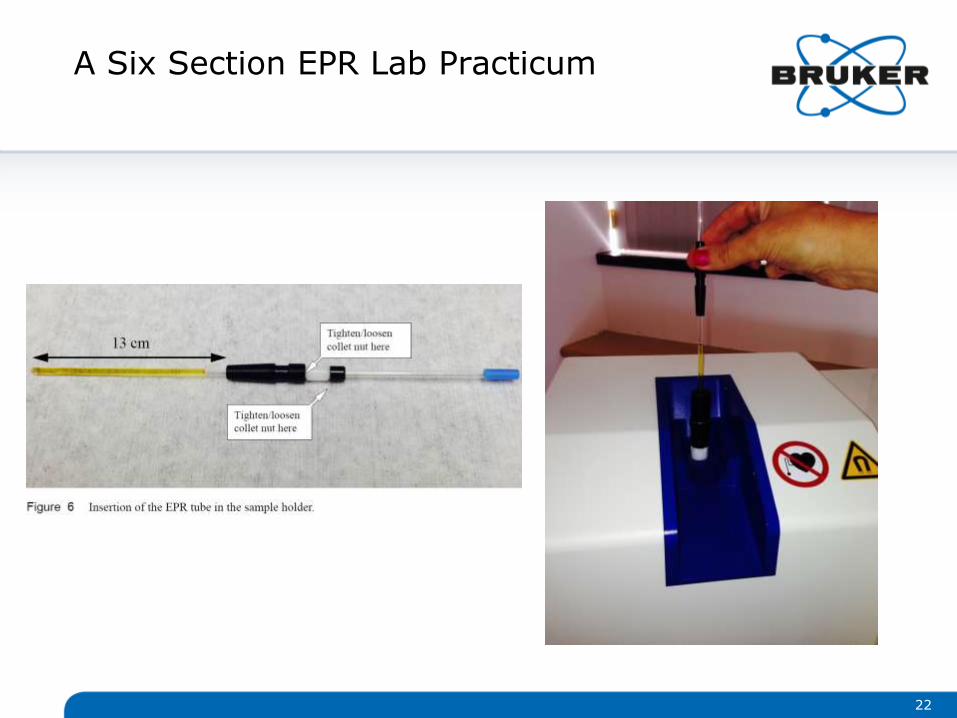
A Six Section EPR Lab Practicum
22
23
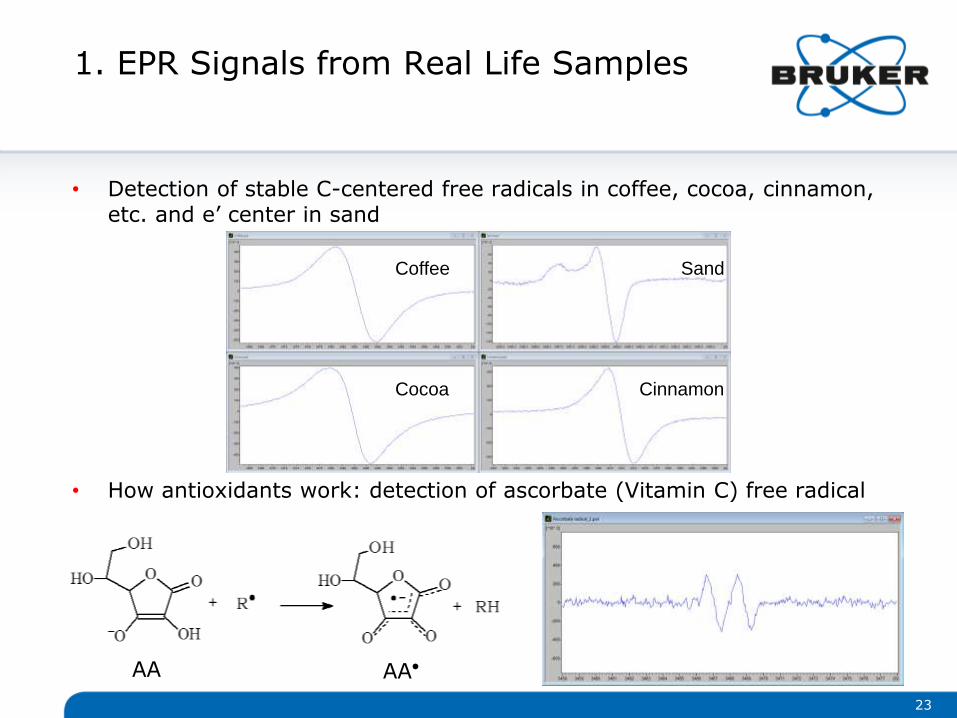
1. EPR Signals from Real Life Samples
• Detection of stable C-centered free radicals in coffee, cocoa, cinnamon, etc. and e’ center in sand
• How antioxidants work: detection of ascorbate (Vitamin C) free radical
AA AA●
Coffee Sand
Cocoa Cinnamon
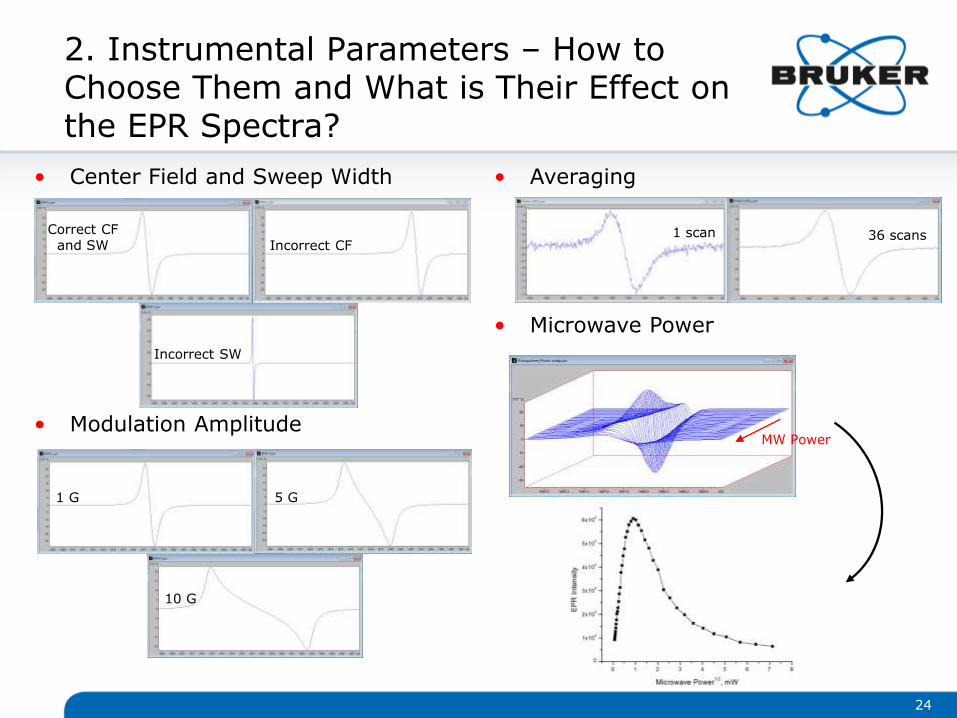
Correct CF and SW Incorrect CF
Incorrect SW
1 G 5 G
10 G
1 scan 36 scans
MW Power
2. Instrumental Parameters – How to Choose Them and What is Their Effect on the EPR Spectra?
• Center Field and Sweep Width
• Modulation Amplitude
24
• Averaging
• Microwave Power
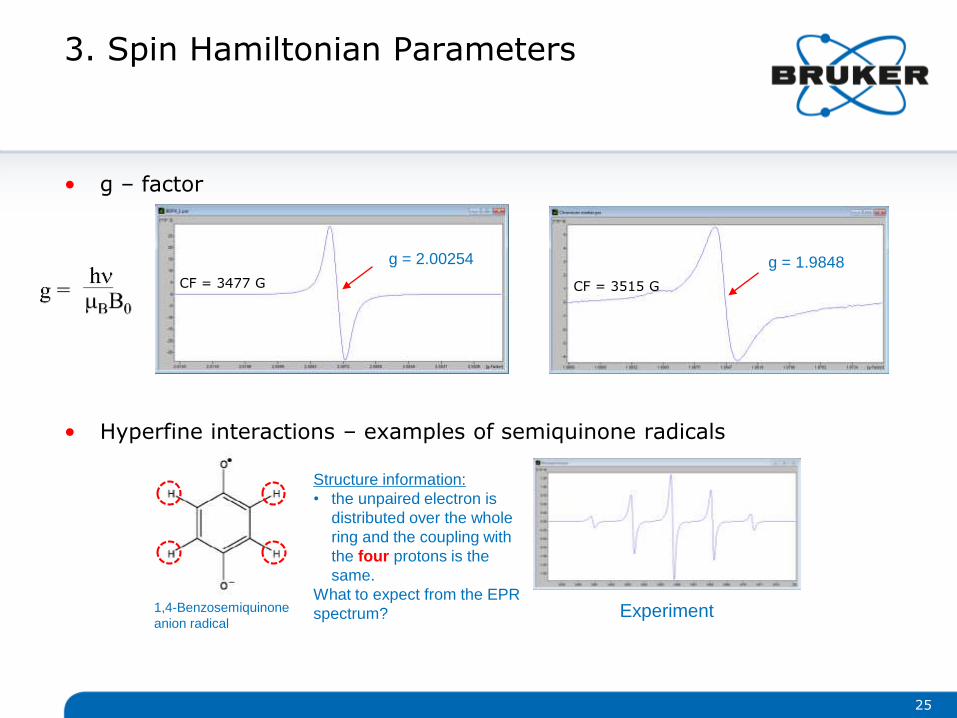
g = 2.00254
CF = 3477 G
1,4-Benzosemiquinone anion radical
Structure information: • the unpaired electron is
distributed over the whole ring and the coupling with the four protons is the same.
What to expect from the EPRspectrum? Experiment
CF = 3515 G
g = 1.9848
3. Spin Hamiltonian Parameters
• g – factor
• Hyperfine interactions – examples of semiquinone radicals
25
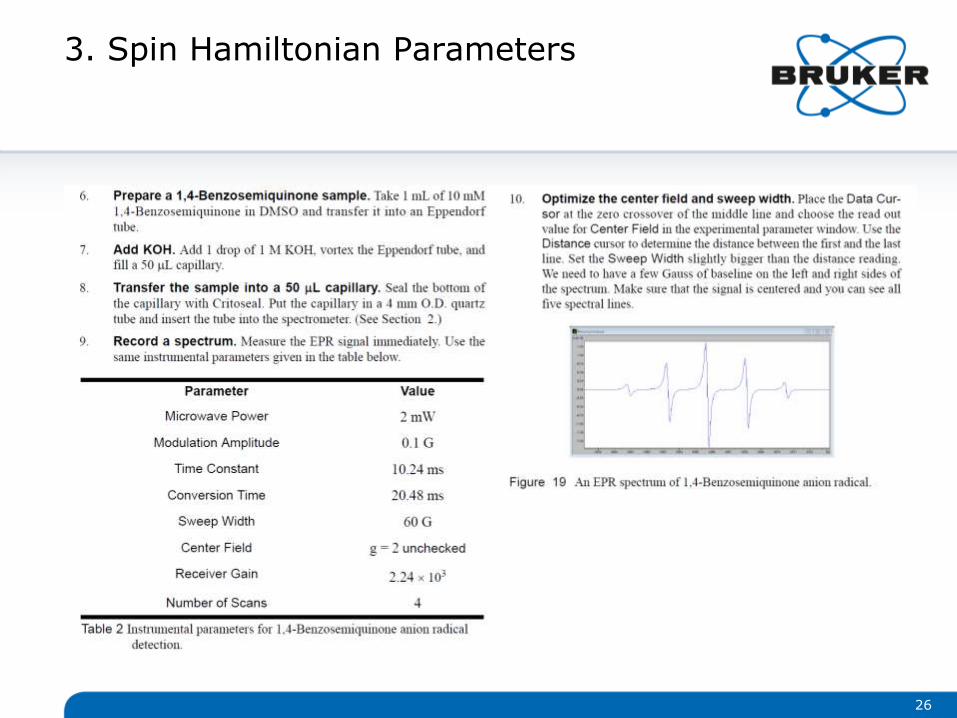
3. Spin Hamiltonian Parameters
26
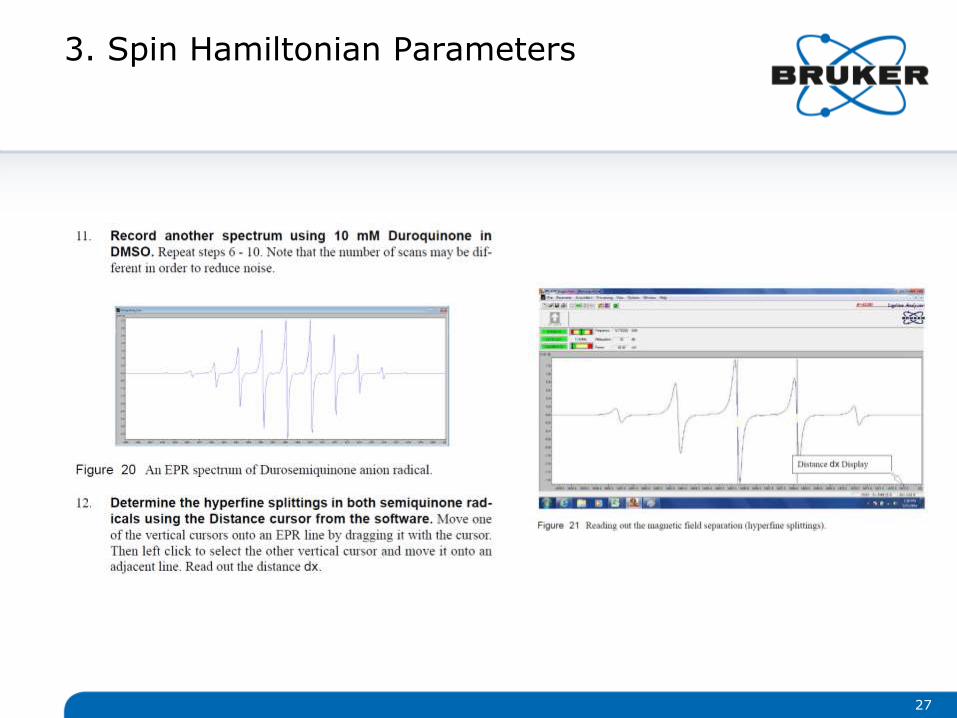
3. Spin Hamiltonian Parameters
27
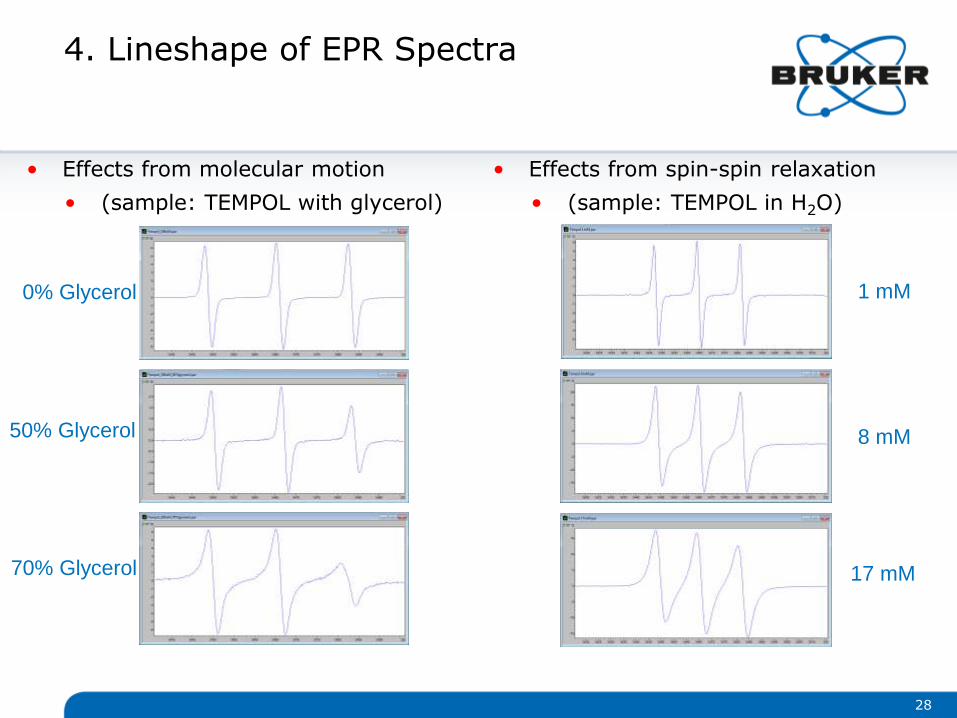
0% Glycerol
50% Glycerol
70% Glycerol
1 mM
8 mM
17 mM
4. Lineshape of EPR Spectra
• Effects from molecular motion
• (sample: TEMPOL with glycerol)
• Effects from spin-spin relaxation
• (sample: TEMPOL in H2O)
28
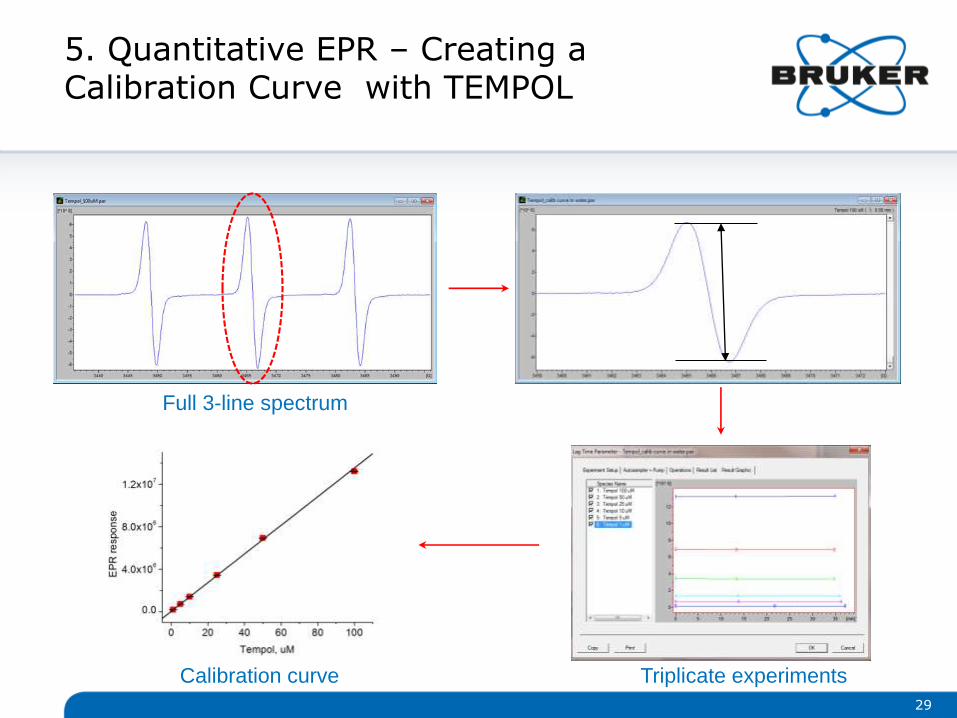
Full 3-line spectrum
Calibration curve Triplicate experiments
5. Quantitative EPR – Creating a Calibration Curve with TEMPOL
29
30
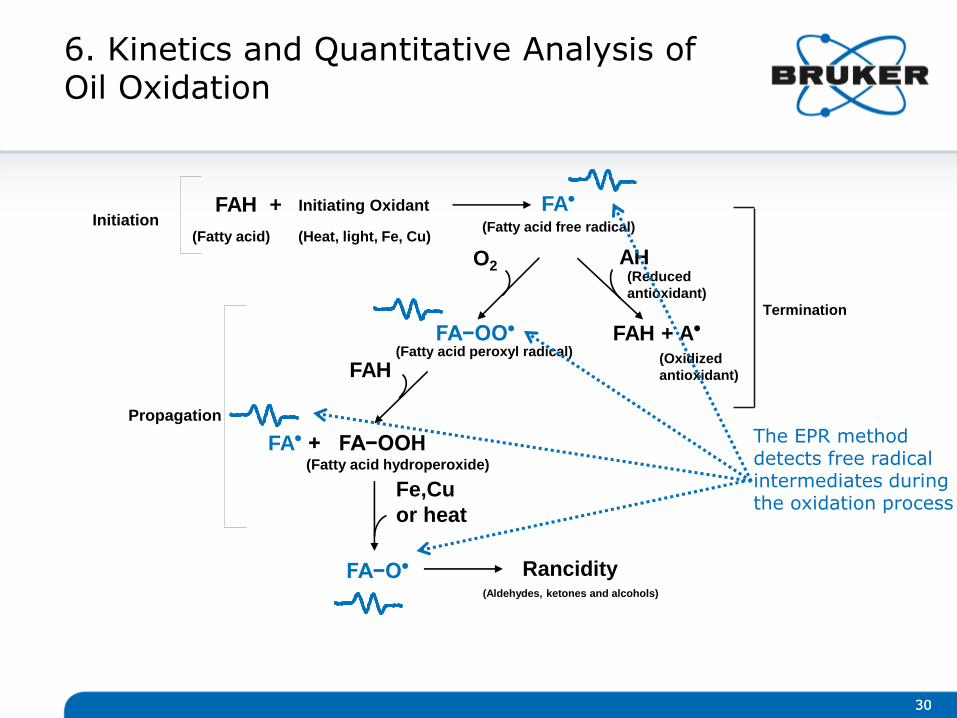
6. Kinetics and Quantitative Analysis of Oil Oxidation
30
FAH + Initiating Oxidant FA●
(Fatty acid)
Fe,Cuor heat
Initiation
Propagation
Termination
Rancidity(Aldehydes, ketones and alcohols)
(Fatty acid free radical)
AH(Reducedantioxidant)
FAH + A●
O2
FA−OO●
(Fatty acid peroxyl radical)
FAH
FA● + FA−OOH
(Oxidized antioxidant)
(Fatty acid hydroperoxide)
FA−O●
The EPR method detects free radical intermediates during the oxidation process
(Heat, light, Fe, Cu)
31
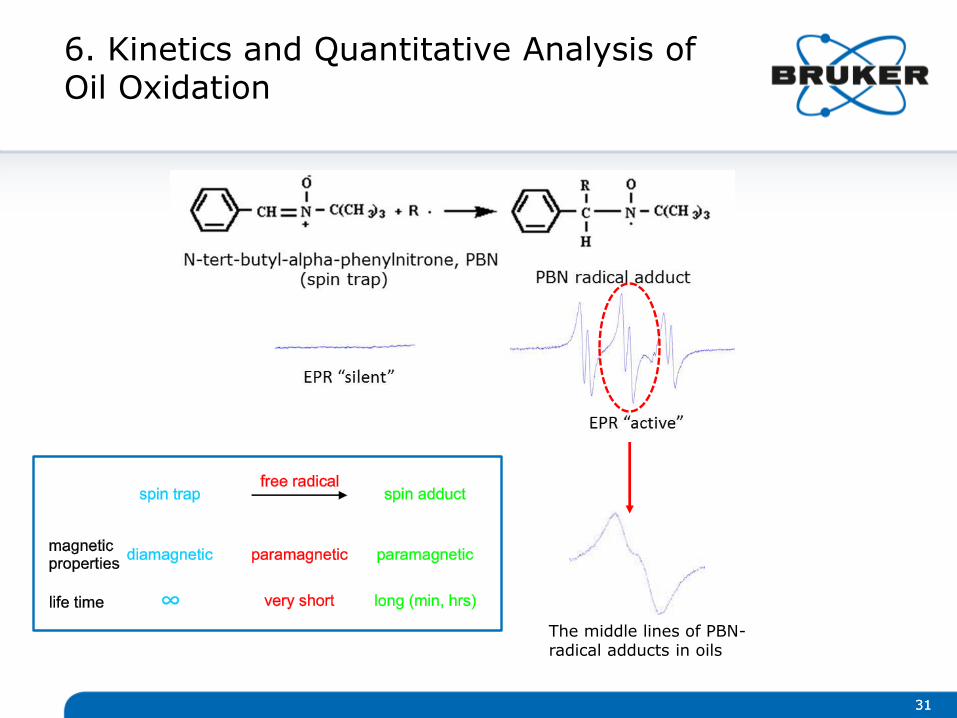
6. Kinetics and Quantitative Analysis of Oil Oxidation
31
The middle lines of PBN-radical adducts in oils
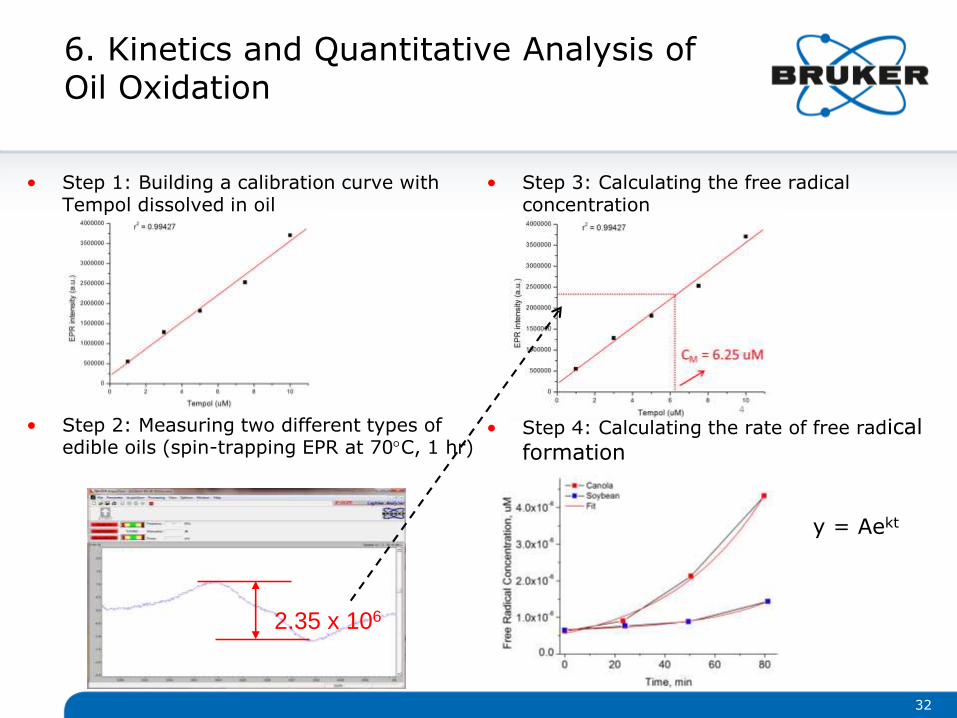
• Step 1: Building a calibration curve with Tempol dissolved in oil
• Step 2: Measuring two different types of edible oils (spin-trapping EPR at 70C, 1 hr)
• Step 3: Calculating the free radical concentration
• Step 4: Calculating the rate of free radical formation
2.35 x 10⁶
32
y = Aekt
6. Kinetics and Quantitative Analysis of Oil Oxidation
32
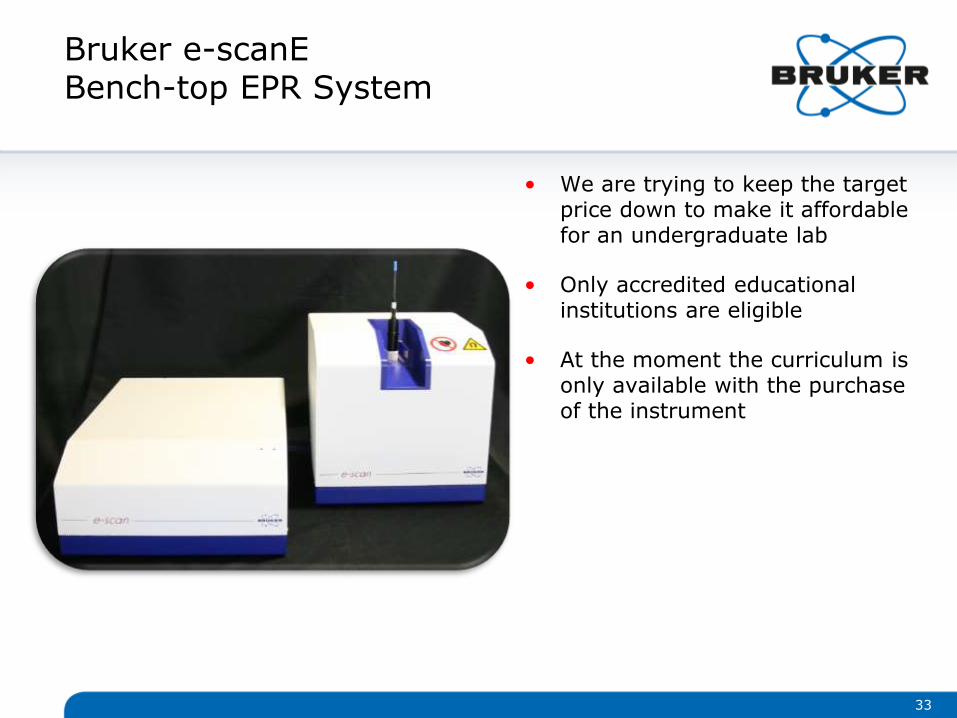
Bruker e-scanEBench-top EPR System
• We are trying to keep the target price down to make it affordable for an undergraduate lab
• Only accredited educational institutions are eligible
• At the moment the curriculum is only available with the purchase of the instrument
33
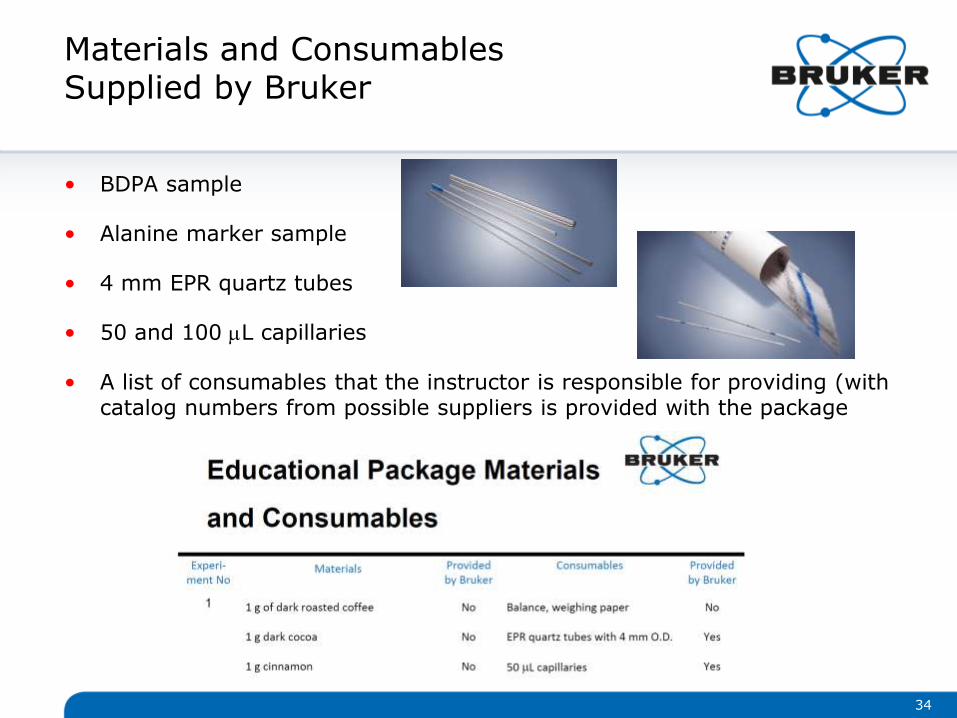
Materials and ConsumablesSupplied by Bruker
• BDPA sample
• Alanine marker sample
• 4 mm EPR quartz tubes
• 50 and 100 L capillaries
• A list of consumables that the instructor is responsible for providing (with catalog numbers from possible suppliers is provided with the package
34
Q & A
Any questions?
Please type any questions you may have for our speakers in the Q&A panel and click Send.
How did we do?
When you exit the webinar, please fill out our evaluation survey to let us know. We appreciate your feedback.
Thank you!
Would you like to learn more? Contact a customer service representative.