Embed Size (px)
Citation preview
Bristol Bay’s Wild Salmon Ecosystems and the Pebble Mine:Key Considerations for a Large-Scale Mine Proposal


This report was produced in partnership by Wild Salmon Center and Trout Unlimited.
Primary Contributing Authors
Dave Chambers, Ph.D.
Robert Moran, Ph.D.
Lance Trasky
Edited by Mark Trenholm
Layout and Design by Lori Howk
January 2012
Bristol Bay’s Wild Salmon Ecosystems and the Pebble Mine:Key Considerations for a Large-Scale Mine Proposal

Acknowledgments
This report was made possible through the generous financial support of Stone Gossard and The Tiffany & Co. Foundation.
Wild Salmon Center and Trout Unlimited would like to thank the primary contributing authors to this report, including Dave Chambers, Robert Moran, and Lance Trasky, for their time and expertise. We are also
grateful for the assistance provided to us by several additional contributors to this report, including: Sandy Bryce, Luke Danielson, Laurele Fulkerson, Jessica Goin, Robert Hughes, Jan Konigsberg, Robert Spies,
Greg Thomas, Mark Trenholm, and Tim Wigington.
We would also like to recognize and thank those who reviewed this document during its development and provided critical feedback and/or editorial support, including: Jeff Baumgartner, Mihael Blikshteyn,
Greg Block, Shoren Brown, Paula Burgess, Samantha Chilcote, Kristin Dizon, Randy Ericksen, Kurt Fesenmyer, David Finkel, Julia Gibson, Leah Hair, Sarah O’Neal, Hans Radke, Guido Rahr, Pete Rand, Bob Waldrop,
Amber Gladieux, Trozell Weaver, Jack Williams, Laura Williams, and Carol Ann Woody.
We are indebted to the contributions of photographers who have donated photos to this report, including: Steve Baird, Amy Gulick, Ben Knight, Erin McKittrick (Ground Truth Trekking), Ken Morrish (Fly Water
Travel), Paul Vescei, and Bob Waldrop.
Finally, we would like to thank our supporters and friends who are committed to the long-term conservation of Alaska’s wild salmon ecosystems. Their support helps make our work possible.

Acronyms
ACFEC – Alaska Commercial Fisheries Entry Commission
ACMP – Alaska Coastal Management Program
ADEC – Alaska Department of Environmental Conservation
ADFG – Alaska Department of Fish and Game
ADNR – Alaska Department of Natural Resources
AMD – acid mine drainage
ARCO – Atlantic Richfield Company
ASARCO – American Smelting and Refining Company
AWC – Anadromous Waters Catalog
BBNC – Bristol Bay Native Corporation
CDA – Coeur d'Alene area
CERCLA – Comprehensive Environmental Response, Compensation, and Liability Act
CFB – Clark Fork Basin
CWA – Clean Water Act
DEQ – Department of Environmental Quality
DOGAMI – Department of Geology and Mineral Industries
EIS – environmental impact statement
ESA – Endangered Species Act
FBT – Fisheries Business Tax
FEI – Formosa Exploration Inc.
ICOLD – International Commission on Large Dams
LNG – liquefied natural gas
MIBC – methyl isobutyl carbinol
NEPA – National Environmental Policy Act
NEV – net economic value
NMED – New Mexico Environmental Department
NMFS – National Marine Fisheries Service
NOAA – National Oceanic and Atmospheric Administration
NPUV – nonmarket passive use value
NPV – net present value
NRC – National Research Council
NTU – nephelometric turbidity unit
PLC – public limited company
PLP – Pebble Limited Partnership
SDT – Seafood Development Tax
SDWA – Safe Drinking Water Act
SMA – Seafood Marketing Assessment
TDS – total dissolved solids
TSF – tailings storage facility
USEPA – United States Environmental Protection Agency
USFS – United States Forest Service
USFWS – United States Fish and Wildlife Service
USGS – United States Geological Survey
WHO – World Health Organization
WISE – World Information Service on Energy

Lake Iliamna (photo by Ben Knight).

Executive Summary . . . . . . . . . . . . . . . . . . . . 3
Introduction . . . . . . . . . . . . . . . . . . . . . . . . . . 7
The Bristol Bay Basin . . . . . . . . . . . . . . . . . 11
The Pebble Project . . . . . . . . . . . . . . . . . . . . 15
2.1 Pebble Mine Project Overview . . . . . . . . . . 15
2.2 Mine Waste Facilities . . . . . . . . . . . . . . . . . 16
2.3 Chemicals Used and Tailings Produced . . . 20
2.4 The Pebble Mine and the Emergence of the Bristol Bay Mining District . . . . . . . . . . . . 23
Potential Sources of Contamination . . . . . . . 27 3.1 Mine Rock-Water Interactions: Effluents . . 28
3.2 Waste Rock . . . . . . . . . . . . . . . . . . . . . . . . 28
3.3 Tailings . . . . . . . . . . . . . . . . . . . . . . . . . . . 31
3.4 Process Water and Concentrates . . . . . . . . 32
3.5 Post-mining Pit Lake . . . . . . . . . . . . . . . . . 32
3.6 Pipeline Failures . . . . . . . . . . . . . . . . . . . . 32
3.7 Tailings Dam Failures . . . . . . . . . . . . . . . . 35
The Salmonids of Bristol Bay . . . . . . . . . . . . 41 4.1 Habitat and Adaptation . . . . . . . . . . . . . . 41
4.2 Ecological Importance of Bristol Bay Salmon . . . . . . . . . . . . . . . . . . . . . . . . . . . 43
4.3 Salmon Species of Bristol Bay . . . . . . . . . . 44
Potential Effects of the Pebble Mine on Salmon . . . . . . . . . . . . . . . . . . . . . . 51
5.1 Acid Mine Drainage and Changes in pH . . 51
5.2 Acid Mine Drainage and Copper Toxicity . 56
5.3 Whole Effluent Toxicity and Community Effects . . . . . . . . . . . . . . . . . . . . . . . . . . . . 58
5.4 Water Appropriations . . . . . . . . . . . . . . . . 60
5.5 Sediment and Turbidity . . . . . . . . . . . . . . . 64
5.6 Predictions versus Performance in Maintaining Water Quality . . . . . . . . . . . . . . . . . . . . . . 66
Table of Contents
Pebble Mine Permitting Process . . . . . . . . . . 69
6.1 State Process and Regulatory Requirements . . . . . . . . . . . . . . . . . . . . . . 69
6.2 Federal Statutory and Regulatory Requirements . . . . . . . . . . . . . . . . . . . . . . 73
6.3 Additional Requirements for Pebble Mine Infrastructure . . . . . . . . . . . . . . . . . . . . . . 76
6.4 Other Considerations . . . . . . . . . . . . . . . . 77
Economic Valuations of a Wild Salmon Ecosystem . . . . . . . . . . . . . . . . . . . . . . . . . . 81 7.1 Comparing the Economic Values of a Wild
Salmon Ecosystem and the Pebble Mine . . 81
7.2 Regional Economic Expenditures in Wild Salmon . . . . . . . . . . . . . . . . . . . . . . . . . . . 81
7.3 Willingness to Pay . . . . . . . . . . . . . . . . . . . 82
7.4 Non-market Passive Use Value . . . . . . . . . 83
7.5 Taxation and Local Revenues . . . . . . . . . . 84
7.6 Local Employment and Native Communities . . . . . . . . . . . . . . . . . . . . . . . 85
7.7 Potential Treatment Costs and Liabilities. . 86
Conclusions . . . . . . . . . . . . . . . . . . . . . . . . . 91
Literature Cited . . . . . . . . . . . . . . . . . . . . . . 97
Front cover: top left, Wild Salmon Center; additional photos by Ben Knight.

Cape Newenham
57°N
56°N
55°N
54°N
53°N
58°N
59°N
60°N
170°W 165°W
170°W 165°W
Maps Bristol Bay Watersheds . . . . . . . . . . . . . . . . . . . . 11
Pebble Mine Project Footprint . . . . . . . . . . . . . . 16
Pebble Mine and Mining District . . . . . . . . . . . . 21
Growth of the Mining District . . . . . . . . . . . . . . 22
Potential Sources of Contamination . . . . . . . . . . 27
Faults and Seismic Activity . . . . . . . . . . . . . . . . . 36
Anadromous Waters Catalog . . . . . . . . . . . . . . . 48
Case Studies
Tunnel Drainage Failure . . . . . . . . . . . . . . . . . . . 29 Holden Copper Mine (Washington)
Pit Lake Failure . . . . . . . . . . . . . . . . . . . . . . . . . 33Grouse Creek Gold Mine (Idaho)
Pipeline Failures . . . . . . . . . . . . . . . . . . . . . . . . . 34 Black Mesa Pipeline (Arizona) Century Mine (Ohio) Alumbria Mine (Argentina) El Chino Mine (New Mexico)
Tailings Dam Failures . . . . . . . . . . . . . . . . . . . . . 35 Martin County Coal Corporation (Kentucky) Brewer Gold Mine (South Carolina) Buffalo Creek Valley (West Virginia)
Acid Mine DrainageFormosa Copper Mine (Oregon) . . . . . . . . . . . . . . . . 53 Mount Washington Copper Mine (British Columbia) . 55
Ground Water Contamination . . . . . . . . . . . . . . 59Bingham Canyon Mine (Utah)
Failures at Alaska’s Largest Mine . . . . . . . . . . . . 78Red Dog Mine (Alaska)
The True Cost of Mining Couer d’Alene (Idaho) . . . . . . . . . . . . . . . . . . . . . . 86Clark Fork Basin (Montana) . . . . . . . . . . . . . . . . . 87Zortman and Landusky (Montana) . . . . . . . . . . . . . 88

Iliamna Lake
Becharof Lake
Katmai Nat’l ParK
laKe ClarK Nat’l ParK
Cook Inlet
Kvichak Bay
Bristol Bay
Pebble mine Claim
Bristol Bay Drainage BoundaryNational Park
Nus
haga
k R.
Mulchatna R.
Togia
k R.
Kvich
ak R.
Egegik R.
Naknek R.
Ugashik R.
57°N
56°N
55°N
54°N
61°N
160°W 155°W 150°W
160°W 155°W 150°W
58°N
59°N
60°N
0 25 50 75 100miles
N

2
Small stream near the Pebble Mine site (photo by Steve Baird).
3Executive Summary
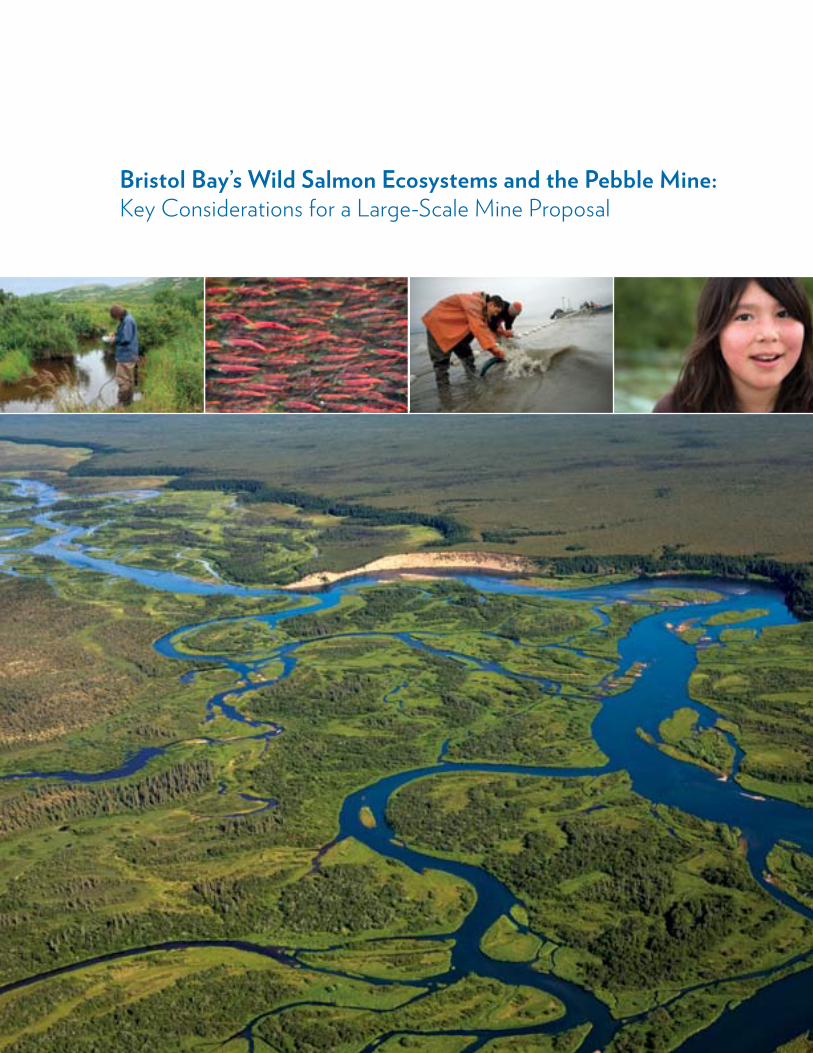
Executive SummaryLocated in southwestern Alaska, the Bristol Bay
basin annually produces hundreds of millions of juve-nile salmon, yielding tens of millions of adults. The most abundant wild salmon fishery in North America, this resource is vital to the economy and culture of the region and integral to the health and function of the Bristol Bay ecosystem. Supporting robust subsistence, recreational, and commercial harvests, the Bristol Bay sockeye salmon fishery is the largest in the world and the greatest source of private sector income in the Bristol Bay region.
In 2007, a wholly-owned affiliate of the Canadian mining company Northern Dynasty Minerals Ltd. (Northern Dynasty) and a wholly-owned subsidiary of London-based Anglo American PLC established the Pebble Limited Partnership (PLP) to develop one of the world’s largest copper-gold-molybdenum mines in the headwaters of Bristol Bay. At the time of this report’s publication, PLP has yet to release a pre-feasibility study describing the scope and scale of the Pebble Mine, however, preliminary proposals as well as subsequent resource and revenue estimates indicate that the endeavor will be massive. If PLP exploits the full deposit, the operation will mine over 10.8 billion metric tons of ore.
Information presented in this report is intended to aid the public, resource managers, and decision-makers in understanding the potential impacts of mine devel-opment on the Bristol Bay region’s wild salmon ecosys-tems. In addition, the report highlights key economic, regulatory, and historical considerations to inform a comprehensive evaluation of the Pebble Mine proposal.
* * *
If constructed, the Pebble Mine will be a large-scale copper-gold-molybdenum mine. Preliminary con-cepts presented for the mine have indicated that PLP will excavate an open pit as well as undertake exten-sive underground excavation. To support resource extraction and distribution, PLP will also construct an extensive road system, pipelines, a mill, power plant, deep-water port, and other facilities. Additionally, mine operations will require massive withdrawals of fresh water.
When hard rock mining processes expose sulfide-bearing rock (like the Pebble deposit) to air and water, oxidation processes form sulfuric acid, which dissolves harmful metals, metalloids, and non-metals in the sur-rounding rock. Known as acid mine drainage, this process—if uncontrolled at a mine site—poses substan-tial threats to the health and stability of surrounding
aquatic ecosystems. Because mineralized rock is exposed to air and water in numerous mining loca-tions, keeping contaminated water controlled on-site in perpetuity represents one of the greatest environmental challenges to a hard rock mining operation like Pebble. While acid mine drainage is a primary threat at mine sites, neutral and alkaline pH drainage can also release mine-related contaminants into the environment.
Data produced by PLP document that much of the site rock has sulfide-sulfur concentrations between 1% and 5%, sometimes up to 9% or greater. Significant volumes of rock containing 1% – 5% sulfide suggest a concern for the development of acid mine drainage at the Pebble site. Thus, PLP proposes to permanently store mine tailings and most of the waste rock in flooded impoundments, known as tailings storage facilities. Storage of the billions of tons of Pebble Mine's waste will involve construction of one of the world’s largest—if not the largest—impoundment of toxic mine waste, including hundreds of mineral and chemical com-pounds that are highly harmful to salmon and salmon ecosystems. Any failure of a tailings dam represents a catastrophic threat to the Bristol Bay region, where considerable seismic activity and extreme weather con-ditions call into question whether acid generating ore and other mine wastes can be safely stored in perpetu-ity. The technical literature fails to show an example of any similar metal-mine tailings impoundment that has not released toxic contaminants into the environment over the long-term via chronic seepage—especially fol-lowing site closure.
In addition to the primary threats posed by acid mine drainage and tailings dam failure, mining-related contamination of ground and surface waters can also result from: accidental discharge of process water; leakage from a post-mining pit lake; pipeline fail-ures; toxic dust; and “settleable” and suspended solids deposited in lakes and streams. These and other sources of contamination can have a variety of impacts on the health and function of aquatic ecosystems and asso-ciated salmon populations. Major potential impacts include changes in water chemistry, altered hydrology, increased sedimentation, and food web disruption.
If the Pebble Mine is constructed, these and other impacts may be exacerbated by the development and operation of additional mines in the Bristol Bay basin. The development of the Pebble Mine and its supporting infrastructure will pave the way for additional mining proposals in Bristol Bay watersheds. Since PLP’s estab-lishment, seven different operators have established claims and initiated leases covering 793 square miles. The majority of these claims cannot be exploited without development of the Pebble Mine infrastruc-ture. The total, cumulative impacts of the Pebble

4
by challenges in predicting ground and surface water quality impacts. Given the industry’s poor track record in meeting its water quality goals and the singular value of Bristol Bay’s wild salmon ecosystem, construction of the Pebble Mine represents a monumental gamble. This report concludes that there is simply too much at stake to conduct an experiment of this scale with a resource of such extraordinary economic, ecological, and cultural importance.
proposal on the Bristol Bay basin may therefore be far greater than those directly associated with the mine’s initial development and operation.
Before the Pebble Mine can be excavated, permits must be issued for major facets of construction. At first glance, state and federal permitting requirements and related regulations may appear sufficient to ensure that Bristol Bay’s wild salmon ecosystems will be safe-guarded. However, a closer review calls this assump-tion into question. For example, though the National Environmental Policy Act (NEPA) requires disclosure and analysis of potential environmental impacts, in practice, NEPA is largely procedural and does not ensure that the chosen action will be environmentally sound. In addition, Alaska’s large mine permitting process and associated state statutes and regional land use plans place greater importance on resource extrac-tion than on the conservation of renewable resources. As a result, the State of Alaska has never denied a permit for a large mine.
The direct economic impacts generated by Bristol Bay’s healthy wild salmon ecosystem are estimated between $318 and $573 million annually, generating almost 5,000 jobs. While the Pebble mineral deposit appears to be considerably more valuable at first glance, an accurate comparison of economic worth must eval-uate Bristol Bay’s renewable wild salmon resources through multiple frameworks. Comparisons should include: 1) the direct and indirect economic benefits of both Bristol Bay’s salmon fisheries and the region’s ecosystems; 2) the intrinsic value of the watershed and its salmon; and 3) the short-term tax revenue generated from the mine versus the long-term tax revenue gen-erated from the watershed. The projected economic returns from mining also become less compelling when taking into consideration many of Bristol Bay’s indig-enous peoples, who rely on a subsistence way of life that is susceptible to collapse under the boom and bust cycle typical of mining.
The proposed Pebble Mine and the regional mining district it will foster present serious and potentially catastrophic threats to the continued health of Bristol Bay’s aquatic and terrestrial habitats and to the out-standing salmon fisheries that these habitats sustain. Attempting to contain contaminants from one of the world’s largest impoundments of toxic mine waste in perpetuity in a region that is seismically active, subject to extreme weather conditions, and characterized by complex hydrology constitutes an enormous risk. Even if an attractive mitigation and containment strategy is proposed on paper, virtually all of the safeguards must work forever. While mining technology and best practices have improved considerably over the years, large-scale mining projects continue to be plagued
Bristol Bay sockeye salmon (photo by Ken Morrish, Fly Water Travel).

5Executive Summary

6
Bristol Bay salmon (photo by Ben Knight).

7Introduction
Introduction
This report reviews the potential impacts of the development and operation of a major hard rock mine in the headwaters of one of the world’s most productive salmon ecosystems—Alaska’s Bristol Bay . It also seeks to highlight key economic, regulatory, and historical considerations that can promote a more comprehensive evaluation of the Pebble Mine concept .
Why Salmon?
It is impossible to ignore the profound benefits that healthy wild salmon populations and productive wild salmon ecosystems bring to bear on human health, economies, and cultures. While the ecological threats posed by mining—and other resource-extraction indus-tries—are not limited to salmonids, lost and degraded salmon populations threaten a range of human values that define our well-being and sustain our quality of life.
To begin with, Bristol Bay subsistence fishing has figured prominently among native peoples for thou-sands of years. The Athabaskan, Aleut, and Yup’ik peoples of Bristol Bay harvest roughly 150,000 salmon annually, which they eat fresh and dry, smoke, salt, pickle, can, and store for winter sustenance (Fall et al. 1996, 2006, ADFG 2008a). This subsistence way of life not only results in a flexible seasonal work pattern that allows for communal time, it also provides spiritual empowerment, cultural understanding, deep connec-tions with natural rhythms, intergenerational educa-tion, and a sense of hope and pride (McDiarmid et al. 1998, Thornton and Wheeler 2005, Haley et al. 2008, Haley and Magdanz 2008). Ultimately, these benefits forge an irreplaceable cultural identity, while stimulat-ing a sense of reciprocity, trust, and cooperation among community members (Martin 2004, Haley et al. 2008, Haley and Magdanz 2008). Subsistence fisheries, there-fore, are not just a food source, but rather the linchpin to a traditional way of life that has linked native genera-tions in Bristol Bay for 3,000 to 4,000 years (Bristol Bay Borough 2010).
While the cultural and spiritual relationships of Alaska’s more recent settlers with salmon are less pronounced, the economic value derived from over a century of commercial and recreational harvests is simi-larly remarkable. In addition to the subsistence harvest, Duffield (2009) estimates annual expenditures of $318 to $572 million on services supplied by Bristol Bay’s wild salmon ecosystem, resulting in an average of 4,837 full-time equivalent jobs and $196 million in annual gross income. The majority of these benefits were gener-ated from commercial fish harvest. On average, roughly 33 million salmon return to Bristol Bay each year, and according to ADFG (2010a), the 31 million salmon
harvested in the stronger-than-average returns of 2010 produced a preliminary ex-vessel value of over $153 million. Despite this tremendous harvest, in the same year 11.5 million sockeye escaped the nets and returned to their natal waters to spawn.
While salmon sustain human populations, they are also a keystone species, providing a vital source of food to marine, freshwater, terrestrial, and avian communi-ties. At least 138 animal species, from killer whales to owls, depend on salmon for sustenance to some degree (Willson and Halupka 1995, Cederholm et al. 2001). In the United States Pacific Northwest, salmon declines have adversely affected many other species, including bald eagles, grizzly bears, black bears, ospreys, harle-quin ducks, Caspian terns, and river otters (Willson and Halupka 1995, Cederholm et al. 2001). Salmon are also a critical source of nutrients in many watersheds. Marine-derived nutrients, which are carried by salmon from the ocean and deposited by spawned-out individu-als, are supplied to nutrient-limited lakes and streams, supplementing the base of the food web and maintain-ing future salmon production (Kline et al. 1993). While these nutrients are readily used by a variety of aquatic organisms, trees and other vegetation also benefit significantly from the marine-derived nutrients pro-vided by returning salmon. In fact, Hilderbrand et al. (1999) found that 15.5% to 17.8% of the total nitro-gen in spruce foliage within 500 meters of the stream was derived from salmon that had been consumed by bears and was redistributed through urine and feces in the riparian area. A recent study examining nutri-ent loading from Pacific salmon in British Columbia found that nutrients from decaying salmon taken up by terrestrial plants shifted entire plant communities, significantly affecting the diversity and productivity of salmon-bearing ecosystems (Hocking and Reynolds 2011).
The Forest for the Trees
Mine proponents may assert that an analysis of mine impacts on salmon and the environment is prema-ture until additional exploration and assessment have been completed and mine operation plans have been finalized. We contend that delaying evaluation of the
Throughout the North Pacific region, the largest cross-ecosystem movement of animals is the annual migration of wild salmon from the ocean into freshwater streams and lakes, where they spawn and die .
—"Impacts of Salmon on Riparian Plant Diversity" (Hocking and Reynolds 2011)

8
project until these activities are complete significantly diminishes opportunities for both the public and deci-sion-makers to assess the Pebble proposal in its entirety. Because of the extraordinary scope of the Pebble Mine proposal, broad public review and targeted agency analyses of permit applications will focus on hundreds or perhaps thousands of individual development activi-ties. Just as the ecological impacts of a clear-cut cannot be determined by scrutinizing the felling of each tree, a proposal of the magnitude of the Pebble Mine cannot be properly evaluated by breaking it down into its compo-nent parts. While an environmental impact statement, which will be required when PLP applies for dredge and fill permits, must evaluate impacts relative to the whole project, the sheer volume and complexity of the information presented will make a thorough review virtually impossible under the timeline provided by the public review comment period. The opportunity for a thorough independent review and widespread under-standing of the full proposal—not merely its constitu-ent parts—is critical. In this report, we hope to high-light key considerations for evaluating a development concept of this magnitude in a region of extraordinary health and productivity.
Sufficient information currently exists from which to complete an informed preliminary analysis of the overall Pebble Mine concept. Site specific data on the ore deposit, information provided to permitting agen-cies and investors, reviews of modern mining technol-ogy and techniques, and knowledge of stream ecology form the backbone of this analysis. While this report recognizes and highlights cultural, economic, and reg-ulatory considerations of the Pebble Mine concept, it focuses primarily on the mine’s potential ecological impacts. In doing so, this report attempts to provide a succinct summary of the most common environmental issues arising at metal mines and their biological con-sequences. The potential impacts reviewed here occur routinely at similar sulfide metal mines around the world.
Report Assumptions
Developers of the Pebble Mine prospect have not yet filed permits for mine construction. Therefore, this report assumes the following:
• The Pebble Mine will be operated by competent, dili-gent mine operators and consultants, using state-of-the-art technology for design and operations.
• Potential environmental impacts of the mine will be evaluated and the mine will be permitted under exist-ing state and federal statutes and regulations.
• The company developing the Pebble prospect will seek permits for open pit mining, underground mining, or both. It is possible that the company initially may mine the two major deposits, Pebble East and Pebble West, sequentially. In this case, the operators may seek permits first for an open pit mine and apply later for an underground mine.
• Whether operating an underground mine or an open pit mine, mineral extraction from low-grade Pebble ore deposits will generate billions of tons of acid-gen-erating waste.
Chum salmon (photo by Paul Vecsei).
Bristol Bay resident (photo by Ben Knight).

9Introduction
This report is not an attempt to discredit mining, resource development, or the significant economic and social benefits that this important sector generates. Mining systems and technology have improved mark-edly in recent decades, and many leading mining enter-prises take their social responsibility commitments seri-ously. Indeed, PLP appears to be going to considerable lengths to promote “a healthy, respectful and sustain-able co-existence with the environment and Southwest Alaska culture” (PLP 2011a). However, if this mine is developed, significant resource trade-offs will occur between non-renewable mineral resource development and the renewable salmon resources of Bristol Bay. Information presented in this report is intended to aid the public, resource managers, and decision makers in understanding the potential environmental conse-quences resulting from these trade-offs, particularly as they relate to the currently abundant wild salmon resources in the Bristol Bay watershed.
We encourage the public and decision makers to take this opportunity to view the Pebble Mine concept as a whole and to ask several overarch-ing questions when considering the final plan:
• Has a mine of this size and type ever oper-ated in a similar salmon ecosystem without adversely impairing aquatic resources?
• What is the cumulative risk of all of the scien-tific and policy uncertainties with respect to mine development, operations, and closure?
• Given these uncertainties, are precautionary principles being applied to decision-making, and where does the burden of proof lie?

10
Nushagak watershed (photo by Wild Salmon Center).

11Chapter 1: The Bristol Bay Basin
area for not only sockeye, but also chum, pink, and Chinook salmon and rainbow trout.
As detailed in chapter 4, Bristol Bay salmon play a unique and critical role in maintaining the health and productivity of the rich Bristol Bay ecosystem. Salmon begin life as eggs in a redd, a nest dug into stream or lake bottom gravel. The eggs hatch into fry that grow into juveniles and migrate to the ocean, where they develop into adult salmon. Individuals may spend one to five
Chapter 1
The Bristol Bay Basin
Bristol Bay is a large gulf of the southeastern Bering Sea, extending from Cape Newenham in the north to the largest and easternmost island in the Aleutian chain, Unimak Island, in the south (Orth 1971). Fresh water flowing into Bristol Bay drains six distinct ecore-gions characterized by diverse topography, ranging from rugged, glaciated mountains to broad coastal plains (Wahrhaftig 1965, Viereck et al. 1992, Nowacki et al. 2001). Pleistocene glaciers descending from the encircling Ahklun Mountains and Aleutian Range shaped the landscape, depositing moraines and gravelly glacial till and carving large lakes. Today, lakes such as Lake Clark and Iliamna Lake are vital to the region’s ecosystems, local culture, and economy (Manley and Kaufman 2002).
Wild Pacific salmon have traversed the salt and fresh waters of the Bristol Bay ecosystem for thousands of years, and the Bristol Bay basin today is one of the top salmon-producing systems in the North Pacific Ocean, rivaled only by a few rivers on Russia’s Kamchatka Peninsula (Augerot 2005). The Bristol Bay basin annu-ally produces hundreds of millions of juvenile salmo-nids, yielding tens of millions of adults (Eggers and Yuen 1984, Salomone et al. 2007).
The Bristol Bay basin is made up of six major watersheds—the Togiak, Nushagak, Kvichak, Naknek, Egegik, and Ugashik—and numerous smaller ones (Figure 1). Together, two of these watersheds—the Nushagak and Kvichak—comprise over half of the land area of the Bristol Bay basin and produce more than half of its salmon (ADFG 2010b). In total, the Nushagak and Kvichak’s unique wetland and riverine complex supports 35 fish species in 11 families, includ-ing five salmon species, five whitefish species, three smelt species, lake trout, Dolly Varden, rainbow trout, arctic char, arctic grayling, northern pike, and burbot (Mecklenburg et al. 2002, ADFG 2008b). The Pebble Mine is being considered for development at the head-waters of these two systems.
About 80% of sockeye salmon production in the Kvichak River watershed occurs in Iliamna Lake and its associated tributaries. Almost twice the area of Louisiana’s Lake Pontchartrain, Iliamna is Alaska’s largest lake (2,622 km2) and the largest undeveloped lake in the United States. In addition to supporting one of only two freshwater harbor seal populations in North America, the lake is the world’s largest sockeye salmon nursery, supporting millions to billions of rearing fry annually (Withrow and Yano 2008). Below Iliamna Lake, the lower Kvichak mainstem is a key spawning
Figure 1. Major Bristol Bay Watersheds, Alaska. The Bristol Bay drainage is made up of six major watersheds: the Togiak, Nushagak, Kvichak, Naknek, Egegik, and Ugashik.
Pebble mine Claim
Bristol Bay Drainage BoundaryNational Park
Bristol Bay
Nus
haga
k R.
Kvichak R.
Egegik R.
Naknek R.
Ugashik R.
Togia
k R.
Iliamna Lake
0 25 50 75 100miles
The Bristol Bay Region is one of Alaska’s most varied, beautiful, and bountiful . From Togiak to Nondalton and south to Ivanof Bay, it is home to myriad mountains, lakes, and islands . Situated 150 miles southwest of Anchorage, the region's com-munities are geographically isolated from the rest of the state – and in most cases from one another . Most of the communities in the Bristol Bay region are self-reliant, operating without the benefit of interconnected road and utility systems . The vast majority of households rely on subsistence fishing and hunting for a large percentage of their food…The watershed of the Bristol Bay is a sprawling, permeable, porous network of creeks and streams perfectly designed to produce salmon .
—Letter from the Bristol Bay Native Corporation to the USEPA (BBNC 2010)

12
years in the ocean before making the difficult journey upstream to spawn in the stream or lake in which they were born. The death and decomposition of adult salmon after spawning provides marine-derived nutri-ents to the system, which drives primary and secondary production in streams, lakes, and terrestrial habitats. Bristol Bay salmon—and the nutrients that they deliver to their natal streams—are essential to the health and ecological function of the entire watershed (Kline et al. 1993, Willson and Halupka 1995, Wipfli et al. 2003).
In addition to this function as a keystone species, salmon drive the health and well-being of many of Bristol Bay’s human communities as well. As described in this report’s Introduction, salmon are woven into the fabric of Native Alaskan culture. For thousands of years, tribal members living in and around Bristol Bay have subsisted on salmon (and other native fish), con-tributing to a subsitance harvest of up to 2.1 million pounds of salmon annually (Duffield 2009). When surveyed, native people in Alaska indicated that sub-sistence activities and the social relationships they promote, were the most important reasons they choose to stay in native communities like those found in Bristol Bay (Goldsmith 2007, Haley et al. 2008).
The extraordinary productivity of the Bristol Bay ecosystem also supports Alaska’s richest commercial fishery. According to ADFG (2011a), between 1990 and 2009, the average annual sockeye salmon harvest in Bristol Bay totaled 25.8 million fish, with 8.2 and 5.5 million fish harvested within the Kvichak-Nanek and Nushagak Districts respectively. Over this 20-year period, the estimated ex-vessel value of the commercial sockeye fishery throughout the bay averaged almost $115 million. The strong 2010 run, which produced a harvest of 28.6 million sockeye, yielded an ex-vessel value of just under $150 million. The unparalleled and sustained harvest of wild sockeye complements harvests of four other species of wild salmon, including average annual harvests (between 1990-2009) of 987,000 chum, 182,000 pink (every other year), 88,000 coho, and 64,000 Chinook salmon (ADFG 2011a).
Recreational angling is also an important contribu-tor to the region’s economy and culture. More than 40 commercial fishing lodges dot Bristol Bay tributaries, and based on 2008 estimates, non-resident anglers take an estimated 16,000 fishing trips annually to Bristol Bay, spending $66 million (Duffield (2009). These expenditures drive a recreation and tourism industry in the Bristol Bay region that contributes over $100 million annually to the Alaska economy, generating over 1,200 full time equivalent jobs (Duffield 2009).
Lydia Olympic of Igiugig hangs salmon to dry (photo by Ben Knight).

13Chapter 1: The Bristol Bay Basin
Lydia Olympic of Igiugig hangs salmon to dry (photo by Ben Knight).

14
Upper Talarik Creek near the proposed Pebble Mine site (photo by Erin McKittrick).
15Chapter 2: The Pebble Project
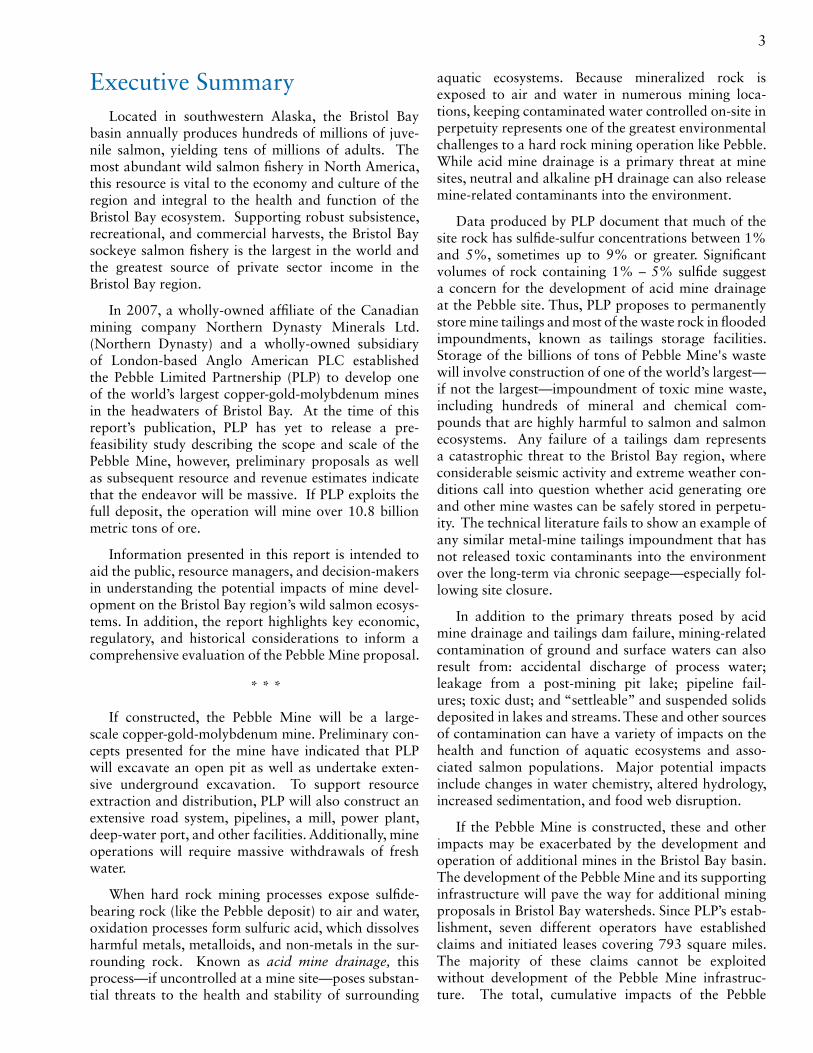
between the largely unforested coastal lowlands and the forested interior uplands. In the watersheds’ lower elevations, patches of willow and alder cover a gently rolling terrain studded with lakes, kettle ponds, sedge meadows, and wetlands. Further up the drainages, at the prospect site, the soils and vegetation are mostly hydric, indicating high connectivity between surface and groundwater. Intersecting this complex landscape, mainstem rivers meander through broad floodplains that support stands of spruce, birch, and balsam poplar (Viereck et al. 1992, Gallant et al. 1995, Nowacki et al. 2001).
The Pebble deposit is composed primarily of chal-copyrite (CuFeS2) and bornite (Cu5FeS4) (NDM Ltd. 2007). Both deposits are referred to as sulfide ores, because copper is combined with iron and sulfur. Sulfide ores typically form sulfuric acid when exposed to oxygen and water.
Copper (Cu), gold (Au), and molybdenum (Mo) are the primary commercially valuable minerals that will be extracted from the Pebble Mine, although in similar porphyry copper deposits around the world, additional metals and metalloids are sometimes extracted, such as selenium, mercury, and uranium. Silver, rhenium, and palladium are expected to be extracted as accessory products (Ghaffari et al. 2011).
The region of copper-gold-molybdenum mineral-ization includes an area of roughly 5.3 square miles situated on a drainage divide, with the Upper Talarik Creek draining to the southeast, and the North and South forks of the Koktuli River draining to the west and southwest (Knight Piesold Consulting 2006a). The deposit reaches a depth of 2,000 feet in its western reach, known as Pebble West, and at least 5,000 feet in its eastern zone, Pebble East (Figure 3) (Ghaffari et al. 2011).
Commissioned by Northern Dynasty, the Preliminary Assessment provides three Pebble Mine “develop-ment cases”, which consider mining operations under 25, 45, and 78-year time horizons. According to the
Chapter 2
The Pebble Project
In 1988, Cominco America Inc. began investigat-ing a low-grade copper-gold-molybdenum ore body on Alaska state land in a region within the Bristol Bay basin now known as the Pebble deposit. In 2001, Cominco sold its claims to Vancouver, B.C.-based Northern Dynasty Minerals, which further explored the pros-pect, found additional resources, and announced plans to mine the deposit. In 2007, a wholly-owned affiliate of Northern Dynasty joined a wholly-owned subsidiary of England’s Anglo American PLC, one of the largest mining and natural resource corporations in the world, to create the Pebble Limited Partnership (PLP) and to mine the prospect.
One year prior to this merger, in support of water withdrawal permit applications that were subsequently suspended, Northern Dynasty submitted preliminary designs for a large-scale hard rock mine at the Pebble prospect. This initial concept, shown in Figures 2a and 6, proposed two large tailings storage facilities in addi-tion to an open pit, process plant, road/pipeline cor-ridor, port, and other infrastructure (Knight Piesold Consulting 2006a, 2006b). In early 2011, Wardrop Engineering Inc., working on behalf of Northern Dynasty, completed the “Preliminary Assessment of the Pebble Project” (Preliminary Assessment), which presented—among other scenarios—a short-term (25-year) development concept envisioning a single large tailings storage facility, shown in Figure 2b (Ghaffari et al. 2011). The Preliminary Assessment also called for a 378 MW on-site power plant.
The preliminary plans and designs described in these documents represent the most comprehensive and up-to-date scenarios available for consideration of a large-scale mining operation at the Pebble site. The authors of this report have used these preliminary plans to charac-terize the scope and extent of the scenarios most likely being considered to mine the Pebble deposit. The PLP is expected to release a formal Prefeasibility Study of the Pebble Mine and to initiate the permitting process in 2012. However, it is routine for numerous operating details to change after permits have been approved.
2.1 Pebble Mine Project Overview The Pebble Mine claim lies within the headwa-
ters of the Nushagak and Kvichak watersheds, two of the world’s largest sockeye salmon-producing rivers (Burgner 1991, Sands et al. 2008). The site includes currently productive salmon habitat (Woody and O’Neal 2010) and encompasses a transition zone
The Pebble Project will be a large industrial facility located within a vast region of Alaska notable for its undeveloped wilderness, isolated and sparsely populated communities, Alaska Native culture and traditional ways of life, signifi-cant salmon fisheries, and other fish and wildlife populations .
—“Preliminary Assessment of the Pebble Project” (Ghaffari et al. 2011)

16
Preliminary Assessment, mine development is likely to begin with excavation of an open pit to access the minerals closest to the surface in both Pebble East and West. When the minerals in the shallower Pebble West deposit have been exploited, excavation will continue in Pebble East. Various stream diversion channels, wells, and other infrastructure will dewater the pit and extract all ground and surface water within the mine area to support mine processes (Ghaffari et al. 2011).
Figure 3 shows a cross section of the Pebble deposit and potential open pit dimensions according to the three development scenarios. In order to process the 1.8 billion metric tons of ore projected in the Preliminary Assessment’s 25-year scenario, the open pit would need to be roughly 2,500 feet deep and 12,000 feet (approxi-mately 2.3 miles) wide. Under the longer-term designs, the pit would be approximately 2,800 feet deep and 14,000 feet wide (45-year scenario), and 4,000 feet deep and 17,000 feet wide (78-year scenario). These scenarios process 32% and 55% of the total estimated Pebble mineral resource, respectively. While initial short and mid-term (25 and 45-year) development sce-narios propose open pit mining, underground “block-caving” techniques may be used during these phases and ultimately mine Pebble East to a depth of 5,000 feet (Ghaffari et al. 2011).
2.2 Mine Waste FacilitiesThe Pebble mineral deposit that is accessible by
both open pit and underground mining is estimated to include 10.8 billion metric tons of ore, yielding roughly 40.3 million tons of copper, 2.8 million tons of molyb-denum, and 3,400 tons of gold (Ghaffari et al. 2011). Thus, over 99% of the ore mined would become tail-ings (rock that has been processed to remove valuable metals) and waste rock (rock that does not contain eco-nomic concentrations of metal). These waste materials would remain on-site forever.
According to the applications submitted by Northern Dynasty in 2006, the mine waste (tailings and waste rock) would be stored in two tailings storage facilities (TSFs), “TSF A” and “TSF G,” shown in Figures 2a and 6. Tailings embankments (essentially dams), illustrated in Figure 5a, would be constructed with mine waste rock and progressively raised in a series of staged expan-sions (Knight Piesold Consulting 2006a). The embank-ments would cut across currently productive salmon rivers (Woody and O’Neal 2010) and would produce storage reservoirs with a combined surface area of over 10 square miles (Ecology and Environment, Inc. 2010).
TSF A would store approximately 2 billion tons of waste and would incorporate three embankment structures situated in the headwaters of the South Fork
N. F. Koktuli R.
S. F. Koktuli R.
U. Talarik Crk.
tSF Site G
tSF Site A
mill
Pebble Mine claimPebble Mine footprint
Pit
Figure 2a. Preliminary designs presented by Northern Dynasty in 2006 proposed two tailings storage facilities (TSFs) at Sites A and G (Knight Piesold Consulting 2006a, 2006b). Combined, these TSFs can store 2.5 billion tons of mine waste, less than a quarter of the estimated 10.8 billion tons of ore on site.
Frying Pan Lake
Mineralized rock containing economically valuable mineral content is called ore. Ore is mined from either open pits or underground excavations using explosives and then transported to a processing plant using huge trucks or conveyer belts. Much of the rock removed from either an open pit or underground workings contains metal concentrations that are too low to be processed economically. This material, waste rock, is often discarded in huge piles somewhere near the pit perimeter.At mines similar to the proposed Pebble operation, the ore is transported to a process plant where it is crushed. Massive quantities of process chemicals and water are added to the ore to extract the commercial metals. The result-ing waste is often a mix of approximately 50% liquid and 50% solid particles, called tailings. This mix—a “chemical soup” containing literally hundreds of different potentially toxic compounds—is then discharged to a tailings impoundment, where the tailings are stored forever.
MininG And MinerAl ProcessinG BAsics
Figure 2b. An updated site plan contained in the Preliminary As-sessment shows only a single TSF (site G), which could store two billion tons of waste under a 25 year operating scenario (Ghaffari et al. 2011). The Preliminary Assessment considers revenue potential associated with longer term scenarios (45 and 78 years) but does not describe how or where additional waste would be stored.
Flooded TailingsWaste Rock Embankment
Facilities Tailings PipelineReclaim Pipeline
Mining Road and Pipeline Route
0 10,000 ft
Adapted from Ghaffari et al. 2011

Figure 3. Pebble Deposit Cross Section. The Pebble deposit reaches a depth of 2,000 feet in its western reach, known as Pebble West, and at least 5,000 feet in Pebble East (Ghaffari et al. 2011). Mine waste, including tailings and waste rock, comprises roughly 99% of the approximately 10.8 billion metric tons of ore on site (Knight Piesold Consulting 2006a, 2006b).
Pebble Deposit Ore (10.8 b tons)
Metals Contained: Copper (80.6 b lbs/40.3 m tons) Molybdenum (5.6 b lbs/2.8 m tons) Gold (107.4 m oz/3,400 tons)
99.6% Ore Waste Rock (10.8 b tons)
0.4% Metals Contained
Adapted from Ghaffari et al. 2011
Post-mining Pit LakeUpon completion of mining operations, groundwater which will be pumped from the open pit and underground workings during mining operations, will be allowed to fill these areas, forming a post-mining pit lake.
Figure 4. Pebble Pit. Although operations are likely to also include underground mining (“block caving”), the Preliminary Assessment presents design scenarios for an open pit under three “development cases”, which include 25, 45, and 78 year time horizons (Ghaffari et al. 2011).
DepositCover RocksDevelopment Scenario
25 yr: 2 b tons of ore processed (>20% of mineral resource)45 yr: 3.8 b tons (32%)78 yr: 6.5 b tons (55%)
12,000 ft (over 2 mi)
,14,000 ft (over 2 mi)17,000 ft (over 3 mi)
1,000 ft
0 ft ASL
-1,000 ft
-2,000 ft
-3,000 ft
-4,000 ft
4,000 ft
4,000 ft0
78 yrs: 4,000 ft
45 yrs: 2,800 ft25 yrs: 2,500 ft
Crater Lake 1,949 ft (deepest U.S. lake )
Red Dog Mine 986 ft
12,000 ft (over 2 mi)
14,000 ft (over 2 mi)17,000 ft (over 3 mi)
ZG1 Fault
SW Face
W Face
NW Face
14,000 ft (over 2 mi)17,000 ft (over 3 mi)
12,000 ft (over 2 mi)
Pebble Mine Deposit
To process the roughly 2 billion metric tons of ore projected in the Preliminary Assessment’s 25-year scenario, the open pit would need to be roughly 2,500 feet deep and 12,000 feet wide. Under the longer-term designs, the pit would be approximately 2,800 feet deep and 14,000 feet wide (45-year scenario), and 4,000 feet deep and 17,000 feet wide (78-year). Because Pebble East lies under a wedge of unmineralized overburden that is too thick to mine economically by open pit method, it will most likely be mined by underground block caving. While the final proposed open pit dimensions will probably resemble the 25 year scenario, block caving could facilitate mining to a depth of 5,000 feet or more (Ghaffari et al. 2011).
Following mining, the open pit and underground workings will be flooded forming a pit lake (Ghaffari et al. 2011). Pit water will be impacted by the com-position of the rock remaining in the pit walls, especially that material which has been further exposed by fracturing and crushing. If the hydrology of the site is such that water from the pit can migrate down gradient to ground and surface waters, there could be long-term impacts to water off of the mine site. Because the Pebble Mine sits atop a watershed divide in a region with extensive hydrologic connection, management of contaminated pit water should be a key consideration in review of the Pebble Mine proposal.
Pebble EastPebble West
17
The Pebble Project Site
Frying Pan Lake
Upper Talarik Creek Valley
The Pebble Mine claim lies within the headwaters of the Nushagak and Kvichak watersheds, two of the world’s largest sockeye salmon produc-ing rivers (Burgner 1991, Sands et al. 2008). The region of copper-gold-molybdenum mineralization includes an area of roughly 5.3 square miles situated on a drainage divide, with the Upper Talarik Creek watershed draining to the southeast, and the North and South Forks of the Koktuli River draining to the west and southwest, respectively (Knight Piesold Consulting 2006a) (see Figure 6 map). Frying Pan Lake and much of the Upper Talarik Creek valley pictured here would be lost to development of the open pit, tailings storage facilities, and other mine infrastructure (photos by Erin McKittrick).
Chapter 2: The Pebble Project
Adapted from Ghaffari et al. 2011
Less than 0.3% Copper (CuEQ)
Less than 0.6% Copper (CuEQ)
How much is 10.8 billion tons? If PLP used rail cars capable of carrying 100 tons each to transport the roughly 10.8 billion tons of ore, the effort would require 108 million rail cars. With standard 65-foot-long hopper rail cars, the train would measure 1.33 million miles, long enough to circle the Earth at its equator over 50 times.
Adapted from Ghaffari et al. 20110 2,000 4,000 ft
25 yr: 2 b tons of ore processed (< 20% of ore resource)
45 yr: 3.8 b tons (32%)
78 yr: 6.5 b tons (55%)
Development Scenario

Proposed Pebble tailing dam: 740 ft
Hoover Dam 1244 ft
3 River Gorges Dam 607 ft
Estimated size of tailing dam to hold 10.8 billion tons of waste : 1000 ft tall and 9 miles wide
Three River Gorges Dam 1.45 mi
MILES 1 2 3 4 5 6 7 8 9
Statue of Liberty
151 ft
Washington Monument 555 ft
Hoover Dam 726 ft
Chrysler Building 1046 ft
NY Times Tower 748 ft(to roof)
Hoover Dam 1,244 ft
Three River Gorges Dam 1.45 mi Estimated linear miles of Pebble Tailings: 9 mi
Estimated linear miles of Pebble Tailings: 9 mi
Site A, longest of the proposed Pebble Tailings: 4.5 mi
MILES 1 2 3 4 5 6 7 8 9
Site A, longest of the proposed Pebble Tailings: 4.5 mi
MILES 1 2 3 4 5 6 7 8 9
LEnG
th
Figure 5a. Pebble Tailings Dam. The height of the proposed Pebble Mine tailings dams (Sites A and G) compared to well-known existing dams and landmarks (Knight Piesold Consulting 2006a, 2006b; Ghaffari et al. 2011). Waste rock will be used to build massive dams that will contain reservoirs of flooded pyritic tailings (acid-generating rock) and processing reagents that will need to be stored permanently.
Figure 5b. Pebble Tailings Dam Length. The length of the proposed Pebble Mine tailings dams at Site A compared to existing dams (Knight Piesold Consulting 2006a).
Tailings Dams Length
Original ground surface
clay liner
surface
clay linerStatue of
Liberty 151 ft
Washington Monument 555 ft
3 River Gorges Dam 594 ft
Hoover Dam 726 ft
Chrysler Building 1046 ft
NY Times Tower 748 ft(to roof)
hEIG
ht (i
n ft.)
Tailings Dam Height
Waste Rock
Tailings Reservoir
Pebble Mine Waste
According to applications submitted by Northern Dynasty in 2006 (Knight Piesold Consulting 2006a, 2006b), mine waste would be stored in two tailings storage facilities (TSFs). TSF A would store approxi-mately 2 billion tons of waste behind three embankments that would be constructed in stages, ultimately reaching heights ranging from 700 to 740 feet. If constructed according to these preliminary plans, the longest dam (at 4.5 miles) would be the largest dam in North America. The TSF G described in the 2006 applications would provide storage for an additional 500 million tons of waste. The Preliminary Assessment uses Site G as the primary TSF, proposing 2 billion tons of storage over a 25 year development scenario (Ghaffari et al. 2011).
It is important to note that the estimated 10.8 billion metric tons of waste rock associated with the Pebble mineral resource far exceeds the total proposed storage capacity of the two preliminarily described TSFs. This strongly implies that the required waste storage space for the mine will have to be several times larger than indicated in either the Tailings Impoundment Applications made by Northern Dynasty in 2006 or considered in the Preliminary Assessment completed in 2011. It’s unknown where additional waste-storage capacity would be located and what additional non-mine resources would be affected. Project developers will likely seek permits to store a small amount of waste (relative to the size of the deposit), and once opera-tions are underway, return to seek additional permits for storage space that currently cannot be defined.
* Knight Piesold Consulting 2006a, 2006b ** Ghaffari et al. 2011
18
Adapted from Ghaffari et al. 2011
TSF G, 25 yrs: 685 ft, 2.0 b tons (m)**
TSF A: 740 ft, 2.5 b tons (m)*
The Pebble Project Site
Lake Iliamna
Upper Talarik Creek Valley
Sharp Mountain
Upper Talarik Creek Valley
Frying Pan LakeAbove: View of the Pebble Mine claim area facing northeast towards Groundhog Mountain and Lake Iliamna. Right: Facing south/southwest toward Sharp Mountain. Frying Pan Lake (pictured on the right) and much of the Upper Talarik Creek valley would be lost to development of the proposed mine pit and tailings reservoirs (photos by Erin McKittrick).
Site A, longest of the proposed Pebble tailings dams: 4.5 mi
Estimated linear miles of Pebble tailings dams: 9 mi

19Chapter 2: The Pebble Project
Koktuli River. These embankments would be among the tallest dams in the world. The north embankment would ultimately reach a height of 700 feet, and the southeast and southwest embankments would attain heights of 710 feet and 740 feet, respectively. The taller of these two structures would rise higher than the Colorado River’s 726-foot Hoover Dam. If this dam reaches 4.5 miles in length, as conceived in submitted documents (Knight Piesold Consulting 2006a), it would be the largest dam in North America (Figure 5b).
TSF G would provide storage for approximately 500 million tons of tailings and waste rock. The design includes a main embankment along the outlet of an unnamed tributary to the North Fork Koktuli River, as well as a smaller saddle dam constructed during staged expansions of the tailings impoundment. The main dam would reach an ultimate height of 450 feet, and the saddle dam a height of 175 feet (Knight Piesold Consulting 2006b).
The storage scenario presented in the recently com-pleted Preliminary Assessment indicates a preference to begin operations using TSF G to store tailings and waste rock. Under the 25-year operating life scenario, TSF G would utilize three embankments, with the north structure ultimately rising to a height of 685 feet and extending roughly three miles.
Although PLP has not yet applied for permits, several statements in the Preliminary Assessment indicate that it will likely seek approval for a project under this short-term scenario. First, the Preliminary Assessment states “phases of development beyond 25 years will require separate permitting and develop-ment decisions to be made in the future.” Second, the 25-year scenario is indicated as the case “upon which a decision to initiate mine permitting, construction and operations may be based.” Finally, the 25-year sce-nario has been the most “comprehensively engineered” (Ghaffari et al. 2011). Although initial permit applica-tions may present a short-term development scenario, it is important to note that the 25-year case presented in the Preliminary Assessment processes less than 20% of the total estimated mineral resource present at the Pebble site (Figure 4). Therefore, the actual mine life may extend well beyond the development case pre-sented in the initial development proposal that is used to secure permits. In fact, since the 78-year scenario processes only 55% of the mineral present at Pebble (and 6.5 billion metric tons of ore), if permitted it is likely that the mine will remain operational well into the 22nd century.
This potential for inconsistency between the devel-opment scenario presented in PLP’s impending permit applications relative to the enormous size of the Pebble
Pebble Mine drill rig (photo by Steve Baird).

20
quantities of ore that will be processed at Pebble, tre-mendous amounts of reagents will be used and tailings produced.
The ore at Pebble will be processed to create several metal concentrates, including (but not limited to) a copper-gold concentrate and a molybdenum con-centrate, which will be shipped off-site for final pro-cessing (Ghaffari et al. 2011). Generally, this process begins with rock being crushed to pieces that are approximately 6 inches or less, which are then ground
mineral deposit should be carefully considered in eval-uating the Pebble Mine concept. The estimated 10.8 billion metric tons of waste rock associated with the Pebble mineral resource far exceeds the total proposed storage capacity of the TSF designs presented in both the initial permit applications—2.5 billion tons (Knight Piesold Consulting 2006a, 2006b)—and the 25-year scenario presented in the more recent Preliminary Assessment—2 billion tons (Ghaffari et al. 2011). The need for perpetual storage of wastes generated beyond a 25-year timeline raises important technical questions that have not yet been answered. In short, it is unknown where additional waste-storage capacity would be located and what additional non-mine resources would be affected.
2.3 Chemicals Used and Tailings Produced
After being blasted from the open pit or under-ground, ore from the Pebble deposit will be moved from the mine to the mill, and waste rock will be either dumped in the tailings reservoir or used to construct the embankments. At the mill, the ore will be physically and chemically processed to separate copper, gold, and molybdenum from the source rock, in what is known as the flotation process. At mines similar to the proposed Pebble operation, the flotation process relies heavily on chemicals—called reagents—that are added to the ore to extract the metals. These chemicals are mixed with the crushed ore and water in various complex stages to extract the desired metals. The resulting waste—called tailings—is discharged to a tailings impoundment (the TSFs described earlier). Because of the massive
collecting Agents. Collectors induce specific minerals to adhere to froth bubbles. Modifying agents may be used with collecting agents to induce or depress adhesion of specific minerals to the bubbles. The collectors are organic molecules or ions that are absorbed selectively on certain surfaces to make them hydrophobic (or insoluble in water). Collecting agents are the most important of all the flotation process agents. Typical flotation agents include ethyl, butyl, propyl, and amyl xanthates (e.g., potassium amyl xanthate).Frothing Agents. Frothers are organic surfactants that are absorbed at the air/water interfaces (bubbles), creating suds that allow the minerals bonded with xanthates to attach themselves to air bubbles in the froth. The two main functions of frothers (e.g., methyl isobutyl carbinol [MIBC], pine oil, and cresylic acid) are to ensure the dispersion of fine bubbles in the ore pulp and to maintain an adequate stability of the froth on top of the pulp.Activators. Activators are generally soluble salts that ionize (dissolve) in water. The ions in solution react with the mineral surfaces to favor the absorption of a collector. Activators are used when collectors and frothers cannot adequately float the concentrate.
depressors. Depressors are inorganic compounds that selectively cover the mineral surfaces to make them hydrophilic (increasing their affinity for water while decreasing their affinity for collectors). The use of depressors increases the selectivity of flotation by preventing flotation of undesirable molecules such as cyanide. While cyanide is primarily used to dissolve gold from ore concen-trate, it is sometimes used in small amounts in base metal flotation operations to keep pyrite from being collected in the flotation cells.Flocculants. Flocculants are used to collect suspended particles to help sepa-rate water and solids. Flocculants are polymers, essentially water-in-oil emul-sions. Flocculants are found in tailings, but they generally adhere to particles and are not typically mobile in the soil. lime. Lime is used primarily to raise the alkalinity of the processing solution to the desired level.Acid. Acid might be added at the end of the water-treatment process to reduce the alkalinity of the discharge water to meet water quality standards, as waste water may have an elevated pH due to the addition of lime.
FlotAtion Process cheMicAls
Fuels/oils and Greases/Antifreeze. Modern mine operations are highly mechanized, employing trucks and equipment that require immense quan-tities of fuels (diesel, gasoline, kerosene), oils and greases, and antifreeze compounds, all of which are stored and used on-site. These organic com-pounds frequently leak from their storage containers or are spilled during normal use or in accidents. All may be highly toxic to aquatic organisms. explosives. Constructing underground mine workings, open pits, roads, etc., requires tremendous quantities of blasting compounds. When exploded, they leave soluble residues (organic compounds, nitrate, ammonia) on the rock surfaces, which wash off into the environment after rainstorms. One of these residues, ammonia, is roughly as toxic to fish as free cyanide. Water treatment, sewage Facilities, laboratories. All similar mines must operate facilities for their workers, which includes constructing camps with water treatment and sewage facilities. In addition, they maintain labo-ratories. All such functions use chemicals and often release chemical and bacteriologic wastes into the environment. Miscellaneous operations. Depending on the physical environment, many mines use significant quantities of herbicides, pesticides, and road-deicing compounds—all of which can be toxic to organisms.
sources oF AdditionAl cheMicAl contAMinAnts

Cook Inlet
Iniskin Bay
Iliamna Lake
Newhalen
Pile BayPedro Bay
Williamsport
Proposed Port Site
Iliamna
Nondalton
Koktuli Mtn
Groundhog Mtn
S. F. Koktuli R
.
N. F. K
oktu
li R.
U. T
alar
ik C
reek
New
hale
n R
.
Kaskanak Mtn
Sharp Mtn
Upper Koktuli valley and Sharp Mountain, from the ridge between Upper Talarik Creek and the mine site.
1
Looking across Upper Talarik Creek valley to the Newhalen River valley and Lake Iliamna.
2
Overlooking Frying Pan Lake, from a ridge that would be under-neath the tailings reservoir.
3
Upper Talarik Creek valley and Groundhog Mountain, from a high peak over the mine site.
4
Figure 6. The Pebble Project. Geography and terrain of the site of the proposed Pebble Mine and Mining District, as well as facilities required to support mineral extraction and distribution, including an extensive road system, pipelines, and a deep water port (Ghaffari et al. 2011) (photos by Erin McKittrick).
Mining District ClaimsPebble Mine Claim Proposed Mining Road and Pipeline RouteExisting RoadsMountains
0 10Miles
4
1
5
2
Looking over the headwaters of Upper Talarik Creek from Groundhog Mountain, with the mine site, Frying Pan Lake, and Sharp Mountain in background.
5 6
Thunderstorm approaching the mine site from Koktuli Mountain.
21Chapter 2: The Pebble Project
3
6
N
TSF Site A
Mill
TSF Site G
Pit

Combined Claims 793 sq miles
Fredericksburg, VA
Baltimore, MD
Washington, D.C.
Pebble Mine Claim 186 sq miles
Iliamna Lake
0 10Miles Fairbanks, AK 32.7 sq. mi.
Manhattan Island, NY 33.7 sq. mi.Washington D.C., 68.3 sq. mi.Kenai Fjords, AK 1,684 sq. mi.
How big is 793 square miles? The size of Pebble Mine and associated mining district claims compared to the greater Washing-ton, D.C. area.
Figure 7. Growth of the Mining District. Mining claims by Northern Dynasty and other developers. Since PLP’s establishment, seven different operators have established claims and initiated leases covering 793 square miles (ADNR 2010a).
KaskanakCreek
Mulchatna River
Kvichak River and Lake Iliamna
Nushagak Mouth and Iowithla River
Kvichak River Lower Mainstem
Nushagak Lower Mainstem
0 25 50 75 10012.5Miles
Pebble East and West Claim
Potentially Impacted Watersheds
Anadromous Waters Catalog
Other Streams
National Park
±
Iliamna Lake
Mul
chat
na Rive
r
Nus
haga
k River
Kvichak River
Kaktuli RiverNewhalen River
Pebble Mine Location
LAKE CLARK NATIONAL PARK
KATMAINATIONAL PARK
ALAGNAK NATIONAL PARK
Years Claims Were Steaked
1983 - 1985
1986 - 1988
1989 - 1991
1992 - 1994
1995 - 1997
1998 - 1999
2000 - 2002
2003 - 2005
2006 - 2007
2008 - 2010
1985–19871988–19901991–19931994–19961997–19992000–20022003–20052006–20082009–2010
Pebble Mine Claim
Claims by Year
Combined Claims 793 sq miles
Pebble Mine Claim 186 sq miles
22
N
23Chapter 2: The Pebble Project
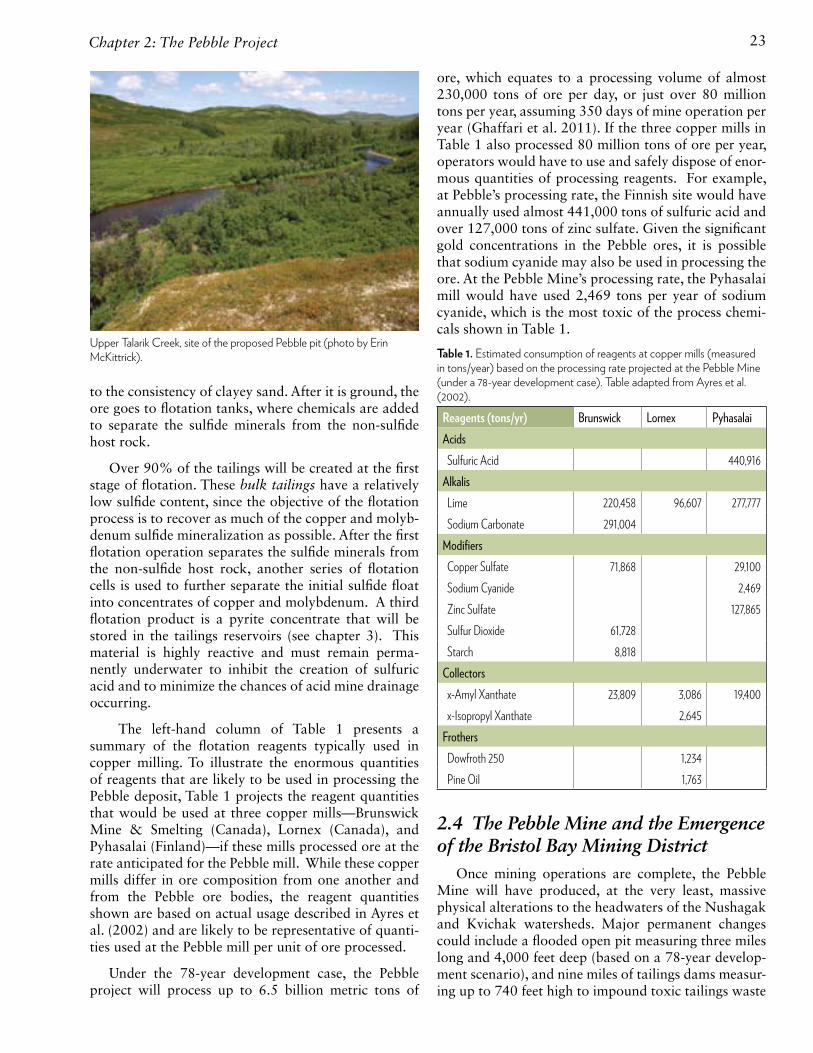
ore, which equates to a processing volume of almost 230,000 tons of ore per day, or just over 80 million tons per year, assuming 350 days of mine operation per year (Ghaffari et al. 2011). If the three copper mills in Table 1 also processed 80 million tons of ore per year, operators would have to use and safely dispose of enor-mous quantities of processing reagents. For example, at Pebble’s processing rate, the Finnish site would have annually used almost 441,000 tons of sulfuric acid and over 127,000 tons of zinc sulfate. Given the significant gold concentrations in the Pebble ores, it is possible that sodium cyanide may also be used in processing the ore. At the Pebble Mine’s processing rate, the Pyhasalai mill would have used 2,469 tons per year of sodium cyanide, which is the most toxic of the process chemi-cals shown in Table 1.
Table 1. Estimated consumption of reagents at copper mills (measured in tons/year) based on the processing rate projected at the Pebble Mine (under a 78-year development case). Table adapted from Ayres et al. (2002).
reagents (tons/yr) Brunswick lornex Pyhasalai
acids
Sulfuric Acid 440,916
alkalis
Lime 220,458 96,607 277,777
Sodium Carbonate 291,004
modifiers
Copper Sulfate 71,868 29,100
Sodium Cyanide 2,469
Zinc Sulfate 127,865
Sulfur Dioxide 61,728
Starch 8,818
Collectors
x-Amyl Xanthate 23,809 3,086 19,400
x-Isopropyl Xanthate 2,645
Frothers
Dowfroth 250 1,234
Pine Oil 1,763
2.4 The Pebble Mine and the Emergence of the Bristol Bay Mining District
Once mining operations are complete, the Pebble Mine will have produced, at the very least, massive physical alterations to the headwaters of the Nushagak and Kvichak watersheds. Major permanent changes could include a flooded open pit measuring three miles long and 4,000 feet deep (based on a 78-year develop-ment scenario), and nine miles of tailings dams measur-ing up to 740 feet high to impound toxic tailings waste
to the consistency of clayey sand. After it is ground, the ore goes to flotation tanks, where chemicals are added to separate the sulfide minerals from the non-sulfide host rock.
Over 90% of the tailings will be created at the first stage of flotation. These bulk tailings have a relatively low sulfide content, since the objective of the flotation process is to recover as much of the copper and molyb-denum sulfide mineralization as possible. After the first flotation operation separates the sulfide minerals from the non-sulfide host rock, another series of flotation cells is used to further separate the initial sulfide float into concentrates of copper and molybdenum. A third flotation product is a pyrite concentrate that will be stored in the tailings reservoirs (see chapter 3). This material is highly reactive and must remain perma-nently underwater to inhibit the creation of sulfuric acid and to minimize the chances of acid mine drainage occurring.
The left-hand column of Table 1 presents a summary of the flotation reagents typically used in copper milling. To illustrate the enormous quantities of reagents that are likely to be used in processing the Pebble deposit, Table 1 projects the reagent quantities that would be used at three copper mills—Brunswick Mine & Smelting (Canada), Lornex (Canada), and Pyhasalai (Finland)—if these mills processed ore at the rate anticipated for the Pebble mill. While these copper mills differ in ore composition from one another and from the Pebble ore bodies, the reagent quantities shown are based on actual usage described in Ayres et al. (2002) and are likely to be representative of quanti-ties used at the Pebble mill per unit of ore processed.
Under the 78-year development case, the Pebble project will process up to 6.5 billion metric tons of
Upper Talarik Creek, site of the proposed Pebble pit (photo by Erin McKittrick).

24
and chemicals within 10 square miles of contaminated reservoirs (based on preliminary permit applications).
These massive developments represent just a part of the imprint that the Pebble Mine will leave on the Bristol Bay landscape. First, PLP will construct a deep-water port on Iniskin Bay on the west side of Cook Inlet to ship the mineral concentrate to off-shore smelt-ers and other processors. The port will also enable delivery of equipment, supplies, labor, diesel fuel, and other resources, including natural gas. According to the Preliminary Assessment, “natural gas will fire a new 378 MW natural gas turbine plant, which will be constructed at the mine site to serve the Pebble Mine’s power needs. Natural gas will be sourced from other regions of Alaska or imported as liquefied natural gas (LNG) and trans-ported by pipeline across Cook Inlet via a sea-bottom line to the port, and along the transportation corridor to the mine site” (Ghaffari et al. 2011).
The Preliminary Assessment describes the transpor-tation corridor as follows: “[A]n 86-mile transporta-tion corridor will be developed to link the Pebble Mine to [the] deep-water port on Cook Inlet, 66 miles to the east [of the mine]. About 80% of the transportation corridor is on private land owned by various Alaska Native Village Corporations, with which [PLP] has existing commercial partnerships. The balance of the transportation corridor is on land owned by the State of Alaska. The transportation corridor will include a two-lane, all-weather permanent access road. The primary purpose of the road will be to transport freight by con-ventional highway tractors and trailers, although criti-cal elements of the design will be dictated by specific oversize and overweight loads associated with project construction.” The Preliminary Assessment further states that “[t]he transportation corridor will also include four buried, parallel pipelines, including:
• a copper-gold concentrate slurry pipeline from the mine site to the port;
• a return water pipeline from the port site to the mine;
• a natural gas pipeline from the port site to the mine…; and
• a diesel fuel pipeline from the port site to the mine” (Ghaffari et al. 2011).
While the potential impacts on Bristol Bay’s wild salmon ecosystems resulting from these developments are substantial (as described in chapter 3), of equal and perhaps even greater long-term consequence is the opportunity that this infrastructure creates for further mineral exploration within the Bristol Bay region. Since PLP’s establishment, seven different operators have established claims and initiated leases covering 793 square miles of the Bristol Bay basin (Figure 7). The
proposed development of the Pebble Mine and its sup-porting infrastructure—including its roads, pipelines, power-generating facilities, and port—will leverage the initiation of numerous additional proposals for mining operations in the Bristol Bay watershed. The majority of these claims cannot be exploited without develop-ment of the Pebble Mine infrastructure. Therefore, the total impact of the Pebble proposal on the Bristol Bay watershed may be far greater than those directly associ-ated with the initial mine’s development and operation.
Figure 8 shows the potential impact of increased mine densities in a watershed. Once a metal mine is developed in a watershed, fish that are intolerant of anthropogenic disturbance, such as salmon and trout, do not generally persist in sustainable numbers. As shown in Figure 8, a very low incidence of mines in a catchment or near a stream sampling site is associ-ated with reduced proportions of intolerant individu-als in fish assemblages. With only four exceptions, once catchment mine density exceeds one mine per five square kilometers, the proportion of intolerant fish in the assemblage is less than 0.15. This indicates that sig-nificant reductions in salmon populations are likely to result from the increase in mine development brought about by the Pebble Mine. It also underscores the threat posed by the development of a mining district in the most productive sockeye salmon nursery in the world.
In evaluating the Pebble concept, it should be care-fully considezred, therefore, that development of this district is only made possible through the construction of the Pebble Mine and its sprawling infrastructure.
Prop
ortio
n of i
ntole
rant
indiv
iduals
mine Density in Network Catchment (#/km2)0.0 0.1 0.2 0.3 0.4
1.0
0.9
0.8
0.7
0.6
0.5
0.4
0.3
0.2
0.1
0
Figure 8. Mine Density and Intolerance of Fish. Proportion of the fish assemblage composed of individuals that are intolerant of anthropogenic disturbance versus catchment mine density (Peter Esselman, Michigan State University, unpublished report).

25Chapter 2: The Pebble Project
Bristol Bay salmon (photo by Ben Knight).
26
Nushagak River near the Mulchatna River confluences (photo by Erin McKittrick).

27Chapter 2: The Pebble Project
in the United States with past or potential Superfund liabilities of $1 million or more.
Mining-related contamination of ground and surface waters frequently results from contact with mineralized rock in open pits and underground workings, discharge of process water, slurry pipeline breaks, spills of indus-trial chemicals, drainage from post-mining pit lakes, waste rock piles, underground workings, discharge and seepage from tailings storage facilities, and dust from blasting, hauling, and storing mine wastes (Figure 9). Other sources of contamination include settleable and suspended solids from related activities, such as blasting, construction, and maintenance of the pit and underground mines, roads, pipelines, and ports.
Chapter 3
Potential Sources of Contamination
Metal mining operations routinely release metals and other chemicals into the surrounding environment from two distinct sources: the natural, mineralized rock and the large quantities of chemicals, fuels, and explo-sives that are used throughout the mining and mineral-extraction processes. Pollution of ground and surface waters from mines and associated mineral-processing facilities is a common occurrence.
The Environmental Protection Agency (EPA) com-piled a summary of pollution case studies for mines and mineral-processing facilities in Arizona, Florida, Missouri, and Nevada that polluted ground and surface waters from 1990 to 1997 (USEPA 1997). These releases included metals like copper, mercury, cadmium, and lead; chemicals used in mineral processing, such as cyanide and acids; and radioactive materials. During that seven-year period, the EPA filed 91 environmen-tal damage reports, of which 26 were for discharges from copper mines. In a more recent report, the EPA (USEPA 2004) identified 156 hard rock mining sites
In productive Bristol Bay salmon streams, a major failure of a tailings storage facility could kill hundreds of thousands to millions of adult salmon and resident fish, depending on when and where the spill occurred .
—“An Assessment of Ecological Risk to Wild Salmon Systems from Large-Scale Mining in the Nushagak and Kvichak Watersheds of the Bristol Bay Basin” (Ecology and Environment, Inc. 2010)
Figure 9. Contamination Risks at Mine Site and Along the Proposed Road and Slurry Pipeline. The Pebble Mine poses threats to salmon ecosystems not only at the mine site but also across its far-reaching infrastructure. This infrastructure may also facilitate additional proposals for mining operations in the Bristol Bay basin that were not previously feasible.
at mine Site:
• Exposed Tailings• Exposed Waste Rock• Tunnel Drainage• Pit Drainage• Process Water• Dust
in route:
• Pipeline Breaks• Truck Spills• Dust
at Port:
• Slurry Transfer• Dewatering• Process Water
Iliamna Lake
laKe ClarK Nat’l ParK
Mining District ClaimsPebble Mine Claim Pebble Mine FootprintProposed Mining Road and Pipeline RouteExisting RoadsNational Park Streams
0 20miles
N

28
3.1 Mine Rock-Water Interactions: Effluents
Mining and preliminary physical ore processing—including blasting, crushing, and grinding—convert the rock from a solid into smaller particles that have much greater surface area. These processes facilitate chemi-cal processing. However, increased surface area also increases the potential for undesirable chemical and bacteriological reactions between the rock minerals, water, and air. As a result, higher concentrations of soluble chemical constituents can be released from fine materials into local waters than would be released from the original, unbroken rock.
The most significant mine-related environmental and economic impacts generally result from the pro-duction of acid effluents, often called acid mine drain-age (AMD), which is discussed in detail later in this
chapter. Such acid effluents occur where the exposed rock contains significant sulfide concentrations. They are commonly released from waste rock piles, exposed surfaces in open pits and underground workings, tail-ings, road materials constructed with waste rock, etc.
Some mine wastes release alkaline or near-neutral pH effluents, either because of the alkaline composi-tion of the original rock or due to the addition of alka-line process chemicals. The concentrations of many chemical constituents (metals, metalloids, non-metals, etc.) will increase greatly when in contact with acidic waters. Similarly, concentrations of some chemical con-stituents, especially those that form negatively charged anions in natural waters (e.g., aluminum, arsenic, anti-mony, selenium, manganese, molybdenum, vanadium, uranium, chromium, and nickel), will increase as the pH rises above about 8.5. Even when waters of nearly neutral pH react with mineralized geologic materials, concentrations of soluble constituents will increase when reacting with small rock particles.
Copper tailings discharges are often alkaline, having an initial pH between about 9.5 and 12.0. As the tail-ings age, and the solids react with the liquids and air, the liquid pH may over many years become acidic. Waste rock may also release initial discharges that have alkaline or near-neutral pHs, but as the alkaline rock minerals (e.g., feldspars and carbonates) decom-pose, the effluents can become acidic. It may be many years before the presence of acid discharges becomes obvious, and this may occur after mine closure.
Numerous types of mine rock-water interactions also increase the concentrations and loads of suspended sediment particles released into local waters.
3.2 Waste RockWaste rock is the mineralized, but uneconomic
rock, which is removed to access the ore. Generally, it is stacked in large piles at the margins of the pit or underground workings, on land surfaces that lack any sort of underlying liner. Such waste rock accumula-tions are often the largest sources of acids and other toxic constituents at mine sites (USEPA 1997, 2004). Where waste rock contains significant concentrations of sulfide minerals, predominantly iron sulfide minerals such as pyrite or marcasite, chemical reactions between the rock minerals, water, air, and bacteria often gen-erate acid effluents—acid mine drainage (Singer and Stumm 1970).
Mining processes invariably increase the concentra-tions of contaminants released into the aqueous envi-ronment, even when the rock mined (waste rock and ores) does not release acidic effluents (Moran 2007).
mineral Ore
H2SO4 (Sulfuric acid)
Cu+2 Zn+2+ +or
Oxygen/air
Water/rain
Acid Mine drAinAGe
As little as 0.2% sulfide can generate acidic water (USBLM 1995).
sulfide-sulfur concentrations of ore at the Pebble Mine site were typically 1–5%, with a maximum near 9% (NDM Inc. 2005).
amD likely
amD possible
amD unlikely
mod
ified N
P (k
g CaC
O3/to
nne)
aP (kg CaCO3/tonne)
200
150
100
50
00 50 100 150 200 250 300 350
In samples collected from the Pebble Mine site low neutralization potential (NP) plus high acid potential (AP) correlates to a greater likelihood of acid mine drainage (AMD).
Figure 10a. Acid Mine Drainage. When metal sulfides are exposed to air and water, they react to form a sulfuric acid solution known as acid mine drainage (AMD), which is toxic to aquatic life.
Figure 10b. Likelihood of AMD. The graph below depicts 399 samples from 65 holes drilled between 1988 and 2003 by Northern Dynasty at the Pebble Mine claim (NDM Inc. 2005). NP = neutralization potential or concentration of calcium carbonate; AP = acid potential or the concentration of sulfide–sulfur.

29Chapter 3: Potential Sources of Contamination
Copper Creek will be put in a lined ditch where it passes through the tailings piles. Railroad Creek will be riprapped to protect it from tailings erosion. French drains will be constructed above the tailings and waste rock piles and maintained in perpetuity to reduce the amount of run-off that could contact the materials. Airflow restriction devices will be installed at the mine portals to reduce air contact with the mine tunnel walls and thereby reduce the production of acidic runoff. It will not affect the acidic groundwater already flowing from the flooded tunnels. Water-control structures will be placed at the mine portals to meter the flow of water leaving the mine.
One or more water-treatment plants will be required to treat the mine efflu-ent before discharging it to Railroad Creek. It is not yet known where the best collection points will be for the multitude of surface and groundwater discharges from the mine. Significant electric power will be needed to main-tain the site, particularly for the water-treatment plants. In this remote loca-tion, power generation will require multiple diesel generators. Water quality assessment and the many other components of mitigation will require monitoring, maintenance, and replacement forever.
Cost: The mitigation project which has been 10 years in planning will be built in stages over the next decade. The cost estimate for the chosen alter-native, including costs for construction and the present value of long-term maintenance and water treatment, is $107 million (Day 2010). The Howe Sound Company earned $67 million from the Holden Mine by the time it closed in 1957. Considering that a 1957 dollar is worth $7.82 in 2010, Howe Sound’s earnings would be $523,940,000 today in dollar equivalents plus the added present value of the mined metals. In other words, mitigation of the Holden mine at $107 million is more than 20% of the total earnings of the mine’s production over 19 years.
CaSe StuDy: tuNNel DraiNage
holden copper Mine (Washington)
Howe Sound Company mined the Holden deposit for copper, zinc, silver, and gold between 1938 and 1957, when the mine closed due to falling copper prices. Holden is an underground mine with 57 miles of tunnels penetrating a massive sulfide deposit. The tunnels create a huge reactive surface area of sulfide rock that produces acid mine drainage on contact with air and water (Day 2010). The mine also produces a steady stream of heavy metal pollution, including copper, that flows from the mine portals. Elevated levels of dissolved copper affect salmonids physically and also degrade salmonid habitat by reducing the fish's aquatic insect food supply. The presence of copper and aluminum may also increase the toxicity of other metals (e.g., lead, iron, nickel, cadmium, and manganese) and the effects of other envi-ronmental stressors (e.g., excess temperature, excess sediment) (Sayer et al. 1991). Reclamation of the mine is also a human health and safety priority with the village of Holden, a wilderness entry point near Lake Chelan, posi-tioned right at the base of the mine.
impact: • Theminingoperationleft8.5 million tons of tailings in piles that fill the
narrow Railroad Creek valley floor. Heavy metals in soils and tailings near Holden exceed criteria for human contact. There is a risk that the unstable tailings pile may collapse into Railroad Creek during a flood or seismic event. The U.S. Forest Service has already tried to protect the creek from tailings erosion where it runs along the base of the tailings pile.
• Thelowerportionsoftheundergroundmineareflooded,andacidminedrainage flows from the mine portals and from beneath the tailings piles; the water is a milky white or orange color, depending on its chemical precipitate (aluminum hydroxides or iron). There is a direct connection between groundwater beneath the tailings pile and Railroad Creek.
• Iron, zinc, copper, and cadmium exceed criteria for the protection ofaquatic life. A Washington State Department of Ecology study showed that the density of aquatic insects declined from over 3,000 individu-als/m2 above the mine site to just 50 individuals/m2 below it, due to heavy metals pollution and the armoring of stream substrates by iron precipitates (creating ferricrete) (Johnson et al. 1997). Twelve miles downstream, where Railroad Creek empties into Lake Chelan, aquatic insect densities still only reached 361 individuals/m2. The sediments composing Lucerne Bar, created by the plume of sediments carried into Lake Chelan by Railroad Creek, exceed the sediment criteria for zinc (Johnson et al. 1997) .
mitigation: Though there were several attempts over the years to reduce the wind and water erosion from the tailings dump, it was only after Superfund designation, that a concerted effort has been made toward full reclamation and restoration of the mine area; Howe Sound Company’s successor, Intalco, was directed to conduct a remediation study of the inactive Holden Mine under authority of the Superfund Act (Einan and Klasner 2010). A consor-tium of state and federal agencies and the mining company considered 14 alternative approaches (with citizen input) before settling on a mitigation strategy for protecting Holden Village and isolating Railroad Creek from the effects of Holden Mine (Day 2010, Einan and Klasner 2010):
• 8.5milliontonsofexposedtailings
• Acidmine drainage leaks from the flooded tunnels and tailingspiles to groundwater and nearby railroad Creek
• Iron, zinc, copper, and cadmium exceed criteria for the protec-tionofaquaticlife,withaquaticinsectsreducedtolessthan2%inareas
• $107millionformitigation(20%oftotalmineearnings)
Above: Acid mine drainage from tailings leaked into groundwater and nearby Railroad Creek (photo by U.S. Forest Service).

30
At metal-mine sites like Pebble, such waste rock rou-tinely contains significant concentrations of dozens of chemical constituents that can be released into the envi-ronment, such as: aluminum, antimony, arsenic, chro-mium, copper, iron, lead, manganese, molybdenum, nickel, selenium, uranium, vanadium, zinc, and natural radioactive constituents.
Preliminary concepts for the Pebble (Knight Piesold Consulting 2006a, 2006b) suggest that contamination will be avoided by storing all or portions of the waste rock and all of the potentially acid-generating tail-ings under water in a tailings storage facility. Storing mine wastes underwater will only slow—not stop—the chemical reaction rates. Experience at hundreds of operating mine sites around the world indicates that all waste impoundments, liners, and dams leak to some extent, over time (Ripley et al. 1996, ICOLD 2001, IIED 2002, Lottermoser 2010). Thus, some volume of contaminants will continually be released into local ground and surface waters, even though most of the wastes remain inundated and contained. The inflow-ing water will eventually pass through, around, or under the tailings dam and into downstream systems and Iliamna Lake, mobilizing AMD, metals, metalloids, organic reagents, and so on.
It seems probable that effluents from the waste rock and tailings will require collection and active water treatment during operations and following mine closure, in perpetuity. Because mine wastes will remain on-site forever, these waste facilities will require perpet-ual physical maintenance to prevent erosion and release of the toxic contaminants—both solids and liquids.
Scenarios presented more recently (Ghaffari et al. 2011) indicate that waste rock not used for tailings dam construction would be stored in conventional waste rock piles near the pit, with the potentially
acid-generating (PAG) material eventually processed at the end of mine life. In the 25-year scenario described in chapter 2, two billion tons of waste rock would be generated (Ghaffari et al. 2011). Segregating PAG from non-PAG waste has always been one of the most diffi-cult things to predict and manage at a mine (Chambers and Moran 2007). Even when the PAG and non-PAG materials have been adequately defined, it is often difficult to actually separate them given that waste is defined on the basis of tests from small samples of large amounts of material, and the waste segregation is physically performed with massive, often imprecise, mechanical equipment (Chambers and Moran 2007).
Acid Mine Drainage
The Pebble deposit rocks contain significant con-centrations of iron, copper, molybdenum, and other metal-sulfide minerals, such as chalcopyrite, pyrite, bornite, and molybdenite (Rebagliati 2007, Kelly et al. 2010). Some of these metal-sulfide minerals present a high risk of producing AMD (USEPA 1994a). When iron sulfide minerals (e.g., pyrite, pyrrhotite, and mar-casite) and some other metal-sulfide minerals (e.g., enargite and arsenopyrite [Fey 2003]) are exposed to oxygen-rich water, the sulfide oxidizes to sulfate, the iron oxidizes to iron oxide or hydroxide, and sulfuric acid is released (USEPA 1994a). These processes are greatly accelerated when certain iron and sulfur bacte-ria are present. The increased acidity (lower pH) accel-erates the dissolution of minerals in the pit walls, waste rock, and so on, releasing numerous rock constituents (e.g., aluminum, arsenic, antimony, copper, lead, nickel, zinc, and sulfate) into the surrounding environment in various mobile forms: dissolved, colloidal, and particu-late (Singer and Stumm 1970, Moran and Wentz 1974). Many of the chemical constituents contained in these acidic effluents are toxic to aquatic life, especially cold-water fish, as described in chapter 5.
Thus, at mine operations, mineralized rock is exposed to air and water in numerous locations: open pit walls, underground workings, waste rock piles, exposed tail-ings, ore stockpiles, and roads. The originally solid rock is broken and crushed, creating much greater exposed surface area, which greatly increases the rates at which chemical reactions can occur. Chemical reactions of the broken or crushed rock with air, water, and bacteria yield effluents with elevated concentrations of several contaminants. Long-term, the most detrimental mine waste effluents have acidic pHs (often between 3.0 and 5.0, sometimes below 2.0), which mobilize elevated concentrations of the minerals in the rock, including numerous metals and metal-like constituents that may be toxic to humans and aquatic life—especially fish.
Pebble Limited Partnership has not released the
Rio Tinto in Spain is very acidic (pH 2.0) with high concentrations of heavy metals as a result of mining (photo by Carol Stoker, NASA).

31Chapter 3: Potential Sources of Contamination
detailed geochemical information necessary to ade-quately evaluate the sulfide content or long-term chemical reactivity of the ores, waste rock, and tailings. Nevertheless, the publicly available NDM/PLP data clearly show that much of the ore and waste rock con-tains elevated sulfide concentrations that will generate net acidity over time. For example, Northern Dynasty Inc. (2005) presented preliminary data from geochemi-cal testing indicating that much of the site rock has geochemically significant concentrations of sulfide-sul-fur. The authors state: “[S]ulfur concentrations in the pre-Tertiary rock types (comprising much of the ore and non-overburden waste) are typically between 1% and 5% sulfur up to maximum concentrations near nine percent” (NDM Inc. 2005). Significant volumes of rock containing 1% to 5% sulfur-as-sulfides indi-cate that AMD is likely to develop over the long term at the Pebble site (Morin and Hutt 1997, Price 1997, Lapakko 2003).
AMD has been documented at much lower sulfide-sulfur concentrations, including concentrations as low as 0.1% to 0.3% (Lapakko and Antonson 1994, Li 2000). At the Zortman-Landusky Mine, in Montana, waste rock having as little as 0.2% sulfide generated acidic water (USDOI 1995). (See the case study on pp. 88–89). In an industry-funded study of hundreds of metal-sulfide mines throughout North America, Todd and Struhsacker (1997) found that all sites exhibited some degree of water quality degradation, over time.
Once acid rock drainage develops, it is often a truly long-term problem. Davis, et al.(2000) report evidence that acid conditions have existed for thousands of years in the Rio Tinto region of southern Spain, the source of the corporate name of the Rio Tinto Group.
Mine Rock as Construction Material and Dust
Using mine waste rock as construction or road material carries great risk because it contains elevated, mobile metal/contaminant concentrations. Blasting, loading, and hauling ore and waste along mine roads and conveyors raise dust. The chemical composition of the dust may be of concern because of its metal content. Between 1989 and 2000, trucks hauling lead-zinc concentrate on the 55-mile long haul road from the Red Dog Mine in Northwest Alaska, contaminated over 143,000 acres of Cape Krusenstern National Monument with harmful levels of lead and cadmium (Hasselbach et al. 2005) (See case study pp. 78–79). High levels of dust contamination were also found at the port site on the Chukchi Sea and around the mine.
Data presented in NDM Inc. (2005) indicate that numerous metals/metalloids of potential concern (e.g., arsenic, copper, mercury, molybdenum, and lead) are present in the dust from the Pebble Mine. Employing
state-of-the-art dust control will reduce the quantity of dust generated by mine operations, but some dust will escape the mine site and the haul road to contaminate surrounding lands and waters.
3.3 TailingsAt mines similar to the proposed Pebble operation,
the ore is transported to a mill/process plant where it is crushed. Massive quantities of process chemicals and water are added to the ore to extract the commercial metals (see Section 2.3). The resulting waste is often a mix of approximately 50% liquid and 50% solid par-ticles, called tailings (Ripley et al. 1996, Lottermoser 2007). This mix—a “chemical soup” containing lit-erally hundreds of different potentially toxic com-pounds—is then discharged to a tailings impoundment, where the tailings are stored forever. Although modern mine operations attempt to collect and contain as much chemical waste as possible, all tailings impoundments, dams, and associated liners leak to some extent over time (Ripley et al. 1996, ICOLD 2001, IIED 2002, Lottermoser 2007).
The slow, semi-invisible seepage from tailings impoundments has contaminated nearby ground and surface waters and has generated the most costly long-term impacts at numerous metal-mining sites. Impacts from such chronic tailings seepage are much more common, statistically, than the impacts related to a cat-astrophic collapse of the tailings impoundment (see dis-cussion below). Of greater concern, these impacts often take place over decades and may not become apparent until after an operation has closed and financial bonds have been returned to the operator.
The Pebble tailings storage facility would require perpetual maintenance of the physical structures to prevent release of the contaminated liquids and solids. Following site closure, either the state or some other operator will be required to collect and treat contami-nated waters seeping from the TSF. Given the extremely-pure, salmon-laden waters, a high-technology water-treatment plant would be required to produce an effluent suitable for discharge into this environment. Such operations would likely continue forever, follow-ing mine closure, potentially creating long-term public liabilities. (See discussion in chapter 7).
Mine proponents may assert that compaction of the TSF’s will mitigate the need for long-term site mainte-nance. However, no evidence exists in the mining tech-nical literature to demonstrate that any similar, large-scale metal mine tailings/waste facility has ever been successfully closed, in a similarly fragile environment, without producing negative impacts to local/regional water quality over the long-term.
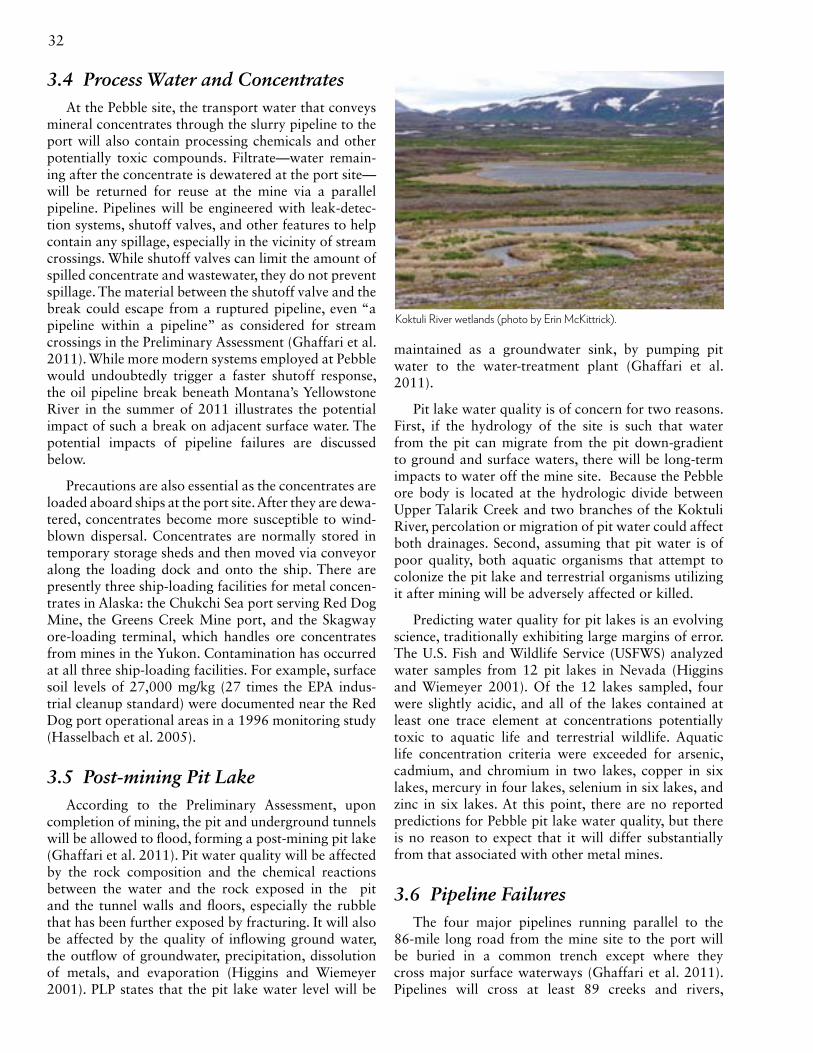
32
maintained as a groundwater sink, by pumping pit water to the water-treatment plant (Ghaffari et al. 2011).
Pit lake water quality is of concern for two reasons. First, if the hydrology of the site is such that water from the pit can migrate from the pit down-gradient to ground and surface waters, there will be long-term impacts to water off the mine site. Because the Pebble ore body is located at the hydrologic divide between Upper Talarik Creek and two branches of the Koktuli River, percolation or migration of pit water could affect both drainages. Second, assuming that pit water is of poor quality, both aquatic organisms that attempt to colonize the pit lake and terrestrial organisms utilizing it after mining will be adversely affected or killed.
Predicting water quality for pit lakes is an evolving science, traditionally exhibiting large margins of error. The U.S. Fish and Wildlife Service (USFWS) analyzed water samples from 12 pit lakes in Nevada (Higgins and Wiemeyer 2001). Of the 12 lakes sampled, four were slightly acidic, and all of the lakes contained at least one trace element at concentrations potentially toxic to aquatic life and terrestrial wildlife. Aquatic life concentration criteria were exceeded for arsenic, cadmium, and chromium in two lakes, copper in six lakes, mercury in four lakes, selenium in six lakes, and zinc in six lakes. At this point, there are no reported predictions for Pebble pit lake water quality, but there is no reason to expect that it will differ substantially from that associated with other metal mines.
3.6 Pipeline FailuresThe four major pipelines running parallel to the
86-mile long road from the mine site to the port will be buried in a common trench except where they cross major surface waterways (Ghaffari et al. 2011). Pipelines will cross at least 89 creeks and rivers,
3.4 Process Water and ConcentratesAt the Pebble site, the transport water that conveys
mineral concentrates through the slurry pipeline to the port will also contain processing chemicals and other potentially toxic compounds. Filtrate—water remain-ing after the concentrate is dewatered at the port site—will be returned for reuse at the mine via a parallel pipeline. Pipelines will be engineered with leak-detec-tion systems, shutoff valves, and other features to help contain any spillage, especially in the vicinity of stream crossings. While shutoff valves can limit the amount of spilled concentrate and wastewater, they do not prevent spillage. The material between the shutoff valve and the break could escape from a ruptured pipeline, even “a pipeline within a pipeline” as considered for stream crossings in the Preliminary Assessment (Ghaffari et al. 2011). While more modern systems employed at Pebble would undoubtedly trigger a faster shutoff response, the oil pipeline break beneath Montana’s Yellowstone River in the summer of 2011 illustrates the potential impact of such a break on adjacent surface water. The potential impacts of pipeline failures are discussed below.
Precautions are also essential as the concentrates are loaded aboard ships at the port site. After they are dewa-tered, concentrates become more susceptible to wind-blown dispersal. Concentrates are normally stored in temporary storage sheds and then moved via conveyor along the loading dock and onto the ship. There are presently three ship-loading facilities for metal concen-trates in Alaska: the Chukchi Sea port serving Red Dog Mine, the Greens Creek Mine port, and the Skagway ore-loading terminal, which handles ore concentrates from mines in the Yukon. Contamination has occurred at all three ship-loading facilities. For example, surface soil levels of 27,000 mg/kg (27 times the EPA indus-trial cleanup standard) were documented near the Red Dog port operational areas in a 1996 monitoring study (Hasselbach et al. 2005).
3.5 Post-mining Pit Lake According to the Preliminary Assessment, upon
completion of mining, the pit and underground tunnels will be allowed to flood, forming a post-mining pit lake (Ghaffari et al. 2011). Pit water quality will be affected by the rock composition and the chemical reactions between the water and the rock exposed in the pit and the tunnel walls and floors, especially the rubble that has been further exposed by fracturing. It will also be affected by the quality of inflowing ground water, the outflow of groundwater, precipitation, dissolution of metals, and evaporation (Higgins and Wiemeyer 2001). PLP states that the pit lake water level will be
Koktuli River wetlands (photo by Erin McKittrick).

33Chapter 3: Potential Sources of Contamination
mitigation: Cyanide-bearing waters have been contained in ponds or intercepted by groundwater wells and treated prior to release into Jordan Creek. The tailings impoundment will be reclaimed to serve as a floodway for storm water removal at one end and a passive water treatment facil-ity at the other end. A sulfate-reducing bioreactor with aerobic polishing is expected to perform water treatment for most of the year except for spring runoff when lime treatment will have to be added to the process to accom-modate the excess flow (Gross 2008).
Cost: Hecla Mining Company was required to post a typical and inadequate $7 million bond. The estimate for the tailings pond removal action is $1.7 million. An update of reclamation costs prepared in 2001 estimated $60 million in land reclamation (finite) and water treatment in perpetu-ity (SAIC 2001). Thus far, Hecla Mining has not abandoned the site nor ignored their financial responsibilities, as many other mining companies have done.
CaSe StuDy: Pit laKe Failure
Grouse creek Gold Mine (idaho)
In 1992, the U.S. Environmental Protection Agency (EPA), U.S. Forest Service (USDA FS), National Marine Fisheries Service (NMFS), and the state of Idaho granted permits to Hecla Mining Company of Coeur d’Alene, Idaho, allowing the company to build the Grouse Creek cyanide heap leach gold mine on Jordan Creek near Stanley, Idaho. Jordan Creek provides important habitat for endangered Chinook salmon, steelhead, and bull trout. The Challis National Forest Final Environmental Impact Statement assured the public that no significant impacts to water quality were expected to occur from the mine because the tailings impoundment was designed to be a zero discharge facility (USDA FS 1992). The mining news-paper Northern Miner called Grouse Creek a “state of the art” mine (Kilburn 1995), and in 1995, Idaho presented the Hecla Mining Company with two awards for environmental excellence in reclamation.
“The Grouse Creek project was developed to protect and, in certain cases, enhance the quality of the environment. During development of the mine, 80 acres of sedge wetlands were created or enhanced and 10 acres of historic gold dredge tailings were replaced with riparian wetlands and salmon habitat. The planned design of the facility will have a lasting positive impact on the surrounding area by reducing sedimentation to streams through an extensive stormwater runoff control system. In addition, all process water is stored in a double-lined tailings pond and recycled through the mill with none being discharged to the environment.”
–Hecla Mining Company, 1994.
Failure: The plastic liner under the tailings impoundment failed less than a year after the grouse Creek mine began producing its first gold in 1994. Monitoring agencies also noted that in the late 1990s and early 2000s after the mine closed, the tailings impoundment filled faster than expected and threatened to overtop the dam (USDA FS and USEPA 2003).
impact: • Thebreachinthetailingspondreleasednearly10,000gallonsofcya-
nide-bearing tailings and water (USDA FS and USEPA 2003).
• Before the mine closed in 1997, two and a half years after opening,Hecla Mining had been cited for 258 violations of its discharge permit (Earthworks 2004).
• Water quality violations continued after closure. Two years after themine quit operating, cyanide was still flowing into Jordan Creek at over 12 times the levels at which chronic exposure to the chemical nega-tively affects fish and other aquatic organisms. Cyanide was detected in springs and seeps feeding Jordan Creek as well, indicating groundwater-surface water connectivity and contamination (USDA FS and USEPA 2003).
• In2003,theEPAandtheUSFSdeclaredthemineaSuperfund site and the tailings impoundment an imminent threat, and the agencies ordered the dewatering of the tailings impoundment.
• 258violationsofdischargepermit
• 10,000gallonsofcyanide-bearingtoxinsescaped,contaminatingarea groundwater and surface water
• Cyanide12timesthelevelatwhichfishandaquaticlifearenegatively impacted
• DeclaredaSuperfundsitebytheEPA
• Estimatedreclamationcosts:$60million (original bond: $7 million)
Above: Grouse Creek Gold Mine (photo by Lynne Stone).

34
14 of which have been designated as anadromous waters under the Catalog of Waters Important for the Spawning, Rearing or Migration of Anadromous Fish (Ecology and Environment, Inc. 2010), adminis-tered by the Alaska Department of Fish and Game. As shown in Figure 16 (pp. 48-49), 36 rivers, streams, and small tributaries enter the north shore of Iliamna Lake (Kvichak River basin) providing salmon and resident fish habitat, which could be severely affected by a pipe-line failure. The streams identified in the Anadromous Waters Catalog include important sockeye, Chinook, and coho salmon producers, such as the Newhalen River, Knutson Creek, Canyon Creek, Chekok Creek, Pile Bay River, and Iliamna River. According to the Preliminary Assessment, pipelines will either be buried beneath these rivers and creeks or run along bridges —or, in the case of Iliamna Lake, a causeway—above them. Twenty bridges are projected, ranging in size from 40 to 600 feet, and almost 2,000 feet of cause-way will cross the northwest portion of Iliamna Lake (Ghaffari et al. 2011).
Although slurry pipelines are an economical way to transport large quantities of mineral to the port, there is risk that the pipeline carrying abrasive and cor-rosive copper-gold concentrate slurry (or any of the other three pipelines) may leak or break. According to Ecology and Environment Inc. (2010) “a pipeline break or spill could result in thousands of gallons of metal-laden slurry being deposited into sensitive anadromous streams.” Most slurry pipeline breaks occur as the result of abrasion and corrosion, but earthquakes have caused at least one major spill (Mining Watch 2005). In Alaska, there is also a risk that the concentrate might freeze and break the pipe if the flow stopped because of a pump failure in the winter (Coulter 1976, McKetta 1992, Julien et al. 2002).
CaSe StuDieS: PiPeliNe FailureS
Black Mesa Pipeline (Arizona)
Corrosion in the 273-mile-long Black Mesa coal slurry pipeline caused ruptures and seven spills between 1997 and July 1999 (Shafer 2002). Eight additional spills occurred in 2001–2002. The most recent incident occurred on January 19, 2002, when 500 tons of coal slurry spilled into Willow Creek, a tributary of the Big Sandy River in northwestern Arizona. Coal sludge in Willow Creek was eight inches deep. The company did not report the spill as required by the Comprehensive Environmental Response and Liability Act (CERCLA). The Arizona Department of Environmental Quality and the EPA say the pipeline, maintained by Black Mesa Pipeline, Inc., has leaked more than half a million gallons of coal slurry in 15 separate spills. The pipeline company was fined $128,000 in 2001 for illegally discharging 485,000 gallons of coal slurry in seven spills between December 1997 and July 1999 (USJD 2001).
century Mine (ohio)
In 2005, more than 30,000gallonsofcoalsludge spilled from a pipe-line in Ohio, killing most of the fish in Captina Creek. The spill resulted from a fist-sized hole in the three-mile-long pipeline that runs from American Energy Corporation Century Mine to a disposal area for slurry (OEPA 2011, OHC 2011).
Alumbrera Mine (Argentina)
An earthquake on September 17, 2004, measuring 6.5 on the Richter scale, caused a pipeline to break at the Alumbrera mine in Argentina, sending copper and gold concentrate into the Villa Vil River. An unknown amount of mineral concentrate filled approximately two kilo-meters of the river, which provides water for domestic consumption and irrigation to the municipality of Andalgalá in Catamarca Province. While the flood of concentrate, which reached 12 meters in height, left a layer of solids on top of the riverbed and river banks, the water component of the slurry penetrated up to two meters deep, carrying with it the toxic metals (Mining Watch 2005).
el chino Mine (new Mexico)
Phelps Dodge Corporation paid a $42,150 civil penalty to the New Mexico Environment Department (NMED) over contamination result-ing from pipeline spills at the company’s Chino Mine in New Mexico (Guerriere 2003). The Phoenix-based copper producer also agreed to replace the pipeline and improve pipeline operating procedures. The settlement covered three spills of tailing slurry and process water from Chino pipelines: a 480,000-gallon spill on December 8, 2000, an 18,000-gallon spill on December 21, 2000 and a 20,000-gallon spill on January 19, 2001. According to the NMED, 45 spills occurred at the Chino Mine between 1990 and 2001.
Forty-five pipeline spills occurred at New Mexico’s Chino Copper Mine over an 11-year period (photo by Eric Guinther).

35Chapter 3: Potential Sources of Contamination
3.7 Tailings Dam Failures In addition to the slow, chronic release of con-
taminants from the tailings and potential leakage into ground and surface waters, it is important to recognize the large-scale pollution events that could result from a tailings dam failure. Unlike a dam built to impound water, which can be drained if the dam loses struc-tural integrity, tailings embankments must be built to function in perpetuity (Figure 13, p. 38). Despite the manifest need for perpetual stability, since 1970 the number of tailings dam failures has greatly exceeded the failures of dams used for water supply (ICOLD 2001). State and federal permits for all large mines in the United States specify construction standards to prevent the accidental discharge of toxic effluents and the catastrophic failure of mine dams. Nonetheless, several tailings dams have failed in the United States and elsewhere around the world (WISE 2011).
The International Commission on Large Dams (ICOLD) has compiled global data on reported tail-ings dams failures, breaches, and mudflows worldwide (ICOLD 2001, Cambridge 2005). ICOLD reported 72 tailings dam accidents in the United States and 11 in Canada between 1960 and 2000 (ICOLD 2001). Similarly, according to the World Information Service on Energy (WISE), 85 major mine tailings dams failed between 1960 and 2006 (WISE 2011). Twenty-four of the 85 tailings dams that failed were copper or gold mines (Figure 11), and failures occurred in all types of tailings dam construction (USSD 1994). The majority of failures happened at operating mines, and 39% of them occurred in the United States, indicating that fail-ures are not merely a consequence of dated technology or limited regulation.
Precipitation and Flooding
Rico et al. (2008) analyzed these and other data, categorizing the most common causes of tailings dam failure across Europe and the world. They found that the primary causes of failure related to meteorologi-cal events, such as unusual snow and rainfall events or periods. These accounted for 25% of the cases world-wide and 35% in Europe. Saturation of part or all of a tailings dam can lead to static load-induced liquefac-tion, which refers to the loss of strength in saturated material because of the build-up of pore water pres-sures unrelated to dynamic forces like earthquakes (Davies et al. 2002). Static load-induced liquefaction is much better understood today than it was even 10 years ago, and the engineering considerations required to avoid this type of failure are now routinely applied during the design of tailings dams. However, the risk of static liquefaction has not been fully eliminated.
Martin county coal corporation (Kentucky)
Failure: In 2000, a coal tailings dam failed, releasing slurry consisting of an estimated 250milliongallonsofwaterand155,000cubicyardsofcoalwaste into local streams (American Geological Institute 2003).
impact: About 75 miles of rivers and streams turned an iridescent black, causing a fish kill along the Tug Fork of the Big Sandy River and some of its tributaries. At least 395,000 fish were killed, and towns along the Tug River were forced to turn off their drinking water intakes. The spill contained measurable amounts of metals, including arsenic, mercury, lead, copper, and chromium (but not enough to pose health problems in treated water).
Cost: Over $46 million (American Geological Institute 2003). The full extent of the environmental damage is not yet known, and estimates of the cleanup costs go as high as $60 million (WISE 2008).
Brewer Gold Mine (south carolina)
Failure: In 1990, a tailings dam failed after heavy rains and spilled 10 million gallons of sodium cyanide solution into Little Fork Creek (USEPA 2005).
impact: Fish died in the Lynches River at least 49 miles downstream (USEPA 1991).
Cost: The British mining company that operated the mine abandoned the site in 1999, and EPA declared it a Superfund site in 2004 because of heavy metals pollution and acid mine drainage.
Buffalo creek Valley (West Virginia)
Failure: In 1972, a coal waste impoundment at the head of Buffalo Creek failed.
impact: 125 people killed, 500 homes destroyed, water quality degradation.
Cost: Over $400 million (ASDO, 2007).
CaSe StuDieS: tailiNgS Dam FailureS
earthquakes (11)Flooding/heavy rain (17)Structural problems (47)Othersources(10):landslides,changingweatherpatterns,internaldamerosion,staticliquefaction
sources of tailings dam Failures
Figure 11. According to a study by the World Information Service on Energy (WISE), 85 major mine tailings dams failed between 1960 and 2006. Common causes included structural problems, flooding or rain, and earthquakes (WISE 2011).

36
In addition to liquefaction, rain and snow events may also lead to flooding. Precipitation and flood models are used to inform dam design, but the limited stream-flow and weather data available for the Pebble Mine site may not yield accurate predictions of 100, 500, or 1,000-year flood events in the area. At the Red Dog Mine in the Brooks Range north of Kotzebue, Alaska, wastewater was released when unanticipated levels of
snowmelt and rainfall threatened to overtop the dam the year after the mine opened (Ott and Scannell 1993). Flood projections also may not accurately account for climate changes predicted to produce heavier and more frequent rainfall and increased rain-on-snow events (IPCC 2007). United States Geological Survey (USGS) predictions of 100-year or greater flood flows for the Kenai Peninsula—where three floods exceeding USGS 100-year flood predictions have occurred in a 20-year period—may have to be revised because of rapidly melting glaciers and more severe rainstorms (Eash and Rickman 2004). Long-term climate change and likely impacts to formerly frozen or partially frozen ground will impact many assumptions concerning water man-agement and the stability of facilities at the Pebble site.
Earthquakes
Seismic liquefaction has been identified as the second most common cause of tailings dam failure worldwide (Rico et al. 2008). The Pebble tailings dams will be constructed on top of glacial till and fractured bedrock (Knight Piesold Consulting 2006a, 2006b) in a seismi-cally active area (Haeussler et al. 2005). The design of the dams, constructed of waste rock and overburden, is based in part on current understanding of the location of local faults and the potential force of future earth-quakes. (Figure 12 summarizes recent seismic activ-ity and future earthquake probabilities in the Bristol Bay region.) The Preliminary Assessment recognizes two seismic zones that could affect the Pebble Project, including the large Pacific Plate–North American Plate subduction zone located offshore, and the Lake Clark Fault (Ghaffari et al. 2011).
Dams are engineered to withstand overtopping from the probable maximum flood and shaking resulting from large earthquakes, but in each of these instances, assumptions must be made as to the magnitude of these “maximum” events. While the Preliminary Assessment characterizes as “conservative” the parameters used to determine seismic events—and the seismic design of the tailings storage facility—assumptions made in determining both the location and return period (which influences the calculation of the force) of future seismic events call into question just how conservative these determinations may be (Chambers et al. 2011). For example, although Northern Dynasty consultants esti-mated the Lake Clark Fault to be 18 miles from the Pebble Mine site (Knight Piesold Consulting 2006a), according to Chambers et al. (2011) “the location of the Lake Clark Fault is not known, and it is possible that it runs directly through the area of proposed devel-opment at Pebble.” It is worth noting that the 2002 magnitude 7.9 Denali Fault earthquake revealed an unknown fault now named the Susitna Glacier Fault (Crone et al. 2004).
Figure 12. Seismic activity between 1990 and 2009; probability of future earthquakes; and major fault lines in and around the mining district (Higman and Mattox 2009, USGS 2010a, 2010b). Since 1899, there have been numerous 6.0-6.9 earthquakes and three 7.0+ earthquakes within 125 miles of the Pebble site.
lake Clark Fault
Probability model of 6.0 magnitude earthquake100 years
Proposed Pebble Mine pipelinePebble Mine claim
1000 years
-158˚ -158˚-155˚ -155˚-152˚ -152˚
1.000.900.800.700.600.500.400.300.200.100.00
Probability (1.0=100%)
Major and minor faults near proposed Pebble Mine
Cook Inlet FoldsFaultsPebble Mine ClaimOther Mining ClaimsNational Park
Seismic Activity in Alaska 1990–2009
Magnitude < 5.9 6 7 8 9
180˚
60˚
50˚
0
70
300
DEPT
H (k
m)
800
170˚ 160˚ 150˚ 140˚ 130˚190˚

37Chapter 3: Potential Sources of Contamination
If one earthquake in the next 1,000 years is stronger than the maximum predicted, or if a previously unde-tected fault extending into the mine area triggers a sig-nificant earthquake, the tailings storage dams may fail and release the stored waste into the Nushagak and/or Kvichak watersheds. With the largest dam poten-tially reaching a height of 740 feet (Knight Piesold Consulting 2006a) and the Bristol Bay region experi-encing 5.0-magnitude earthquakes an average of once per year, it is possible that a seismic event could cause a tailings dam failure of very large proportions (Haeussler and Plakfer 1995, AA 2009a, USGS 2009a, 2009b, 2009c). The probability of such a massive failure is relatively low in the short term, but the consequences (discussed later in this section) should it occur could be catastrophic. The longer a tailings dam is in place, the greater the probability of catastrophic failure.
An earthquake would not have to destroy the dams to release the toxic materials into the groundwater and into adjacent salmon-spawning streams. If an
earthquake opened cracks in the bedrock below the dam or cracked the seepage-collection system, it could allow the hundreds of billions of cubic feet of contami-nated water stored in the facility to leak into ground and surface waters.
Deterioration of Infrastructure
Man-made structures deteriorate as they age, and Rico et al. (2008) identified several types of infrastruc-ture failure as causes of tailings dam failure. Over time, the complex system of liners, pipes, drains, and pumps necessary to control leakage under a mine waste—and maintain the stability of a dam—deteriorate and fail in the corrosive environment and under the crushing weight of millions—or in the case of the Pebble Mine—billions of tons of fluid tailings. Pollutions control structures placed in or under tailings impoundments or earth-fill dams are extremely expensive and logistically challeng-ing to repair or replace. And unlike work in a typical reservoir, operators cannot simply release water con-taminated by acid mine drainage before making repairs.
According to Woody and Higman (2011), “at least four glacial advances left their imprint on Bristol Bay in the form of coarse, porous, layers of alluvial sediments, which can both store and transmit large volumes of groundwater…..Hydrologic exchange patterns between ground and surface waters in alluvial systems can be highly complex and difficult to map and predict.” Such complex interactions between surface and groundwater systems exacerbate the significant challenge of controlling mining related contamination (photo by Erin McKittrick).

38
Impacts of Failure
A failure of one of the massive tailings dams planned for the Pebble Mine would have devastating short and long-term consequences for the receiving waters. Even a relatively small event could release a torrent of polluted water downstream, burying the receiving water body in a sludge of mine wastes. Further down-stream, silt could clog stream gravels and turn the clear streams turbid, eliminating critical salmon habitat. The failure of the much smaller tailings dam at the Brewer Gold Mine in South Carolina killed all of the fish in the Lynches River for 49 miles downstream (USEPA 2005). In Kentucky, the failure of the Martin County Coal Corporation’s tailings dam, which contained 250 million gallons of liquid waste and 155,000 cubic yards of solids, contaminated 75 miles of the Big Sandy Fork River (see the sidebar on p. 35). These are small spills, however, in comparison to the billions of gallons of water and over 10 billion tons of waste that could be released in a failure at the Pebble site.
A major tailings dam failure due to an earthquake, flood, structural flaw, or any combination of these could release billions of tons of mine waste into the North or South Fork of the Koktuli River. This mate-rial would then flow downstream into the Nushagak or Kvichak River drainages. Mine tailings washed down-stream would expose the pyritic tailings to oxygen, potentially leading to acid waters. Introduction of acid waters into streams would extirpate salmon at least in the upper reaches (Parsons 1977, Ledin and Pedersen 1996, Levings et al. 2004, Dubé et al. 2005); the lower reaches of the streams would see elevated contaminant concentrations and reduced prey for salmon consump-tion (Levings et al. 2004).
If acid waters reached Lake Iliamna, some percent-age of the billions of fry that rear in the lake could be harmed, potentially removing generations of pro-duction. In British Columbia, exposure of juvenile
Chinook salmon to waters mixed with acid mine drain-age led to 100% mortality within just two days (Barry et al. 2000). In the extraordinarily productive Bristol Bay tributaries, a major failure of a tailings storage facility could kill hundreds of thousands to millions of adult salmon and resident fish, depending on when and where the spill occurred. Furthermore, fish produc-tion might be permanently eliminated or impaired in the streams directly affected by the spill, and salmonid migrations would be impaired until the toxic tailings are removed (Ecology and Environment, Inc. 2010). According to Hughes (1985), in some instances, the effects of toxic sediments resulting from tailings dam accidents are still being reported over a century after the incident took place.
The sizes and locations of tailings storage facilities required for the Pebble Mine, coupled with the need for these facilities to remain intact and fully functional for thousands of years after the mine is closed, present a substantial threat to downstream fish populations. In the short term, the risk that the tailings dams will leak or fail in any given year may be small. Over the long time span that these dams must contain their toxic con-tents in place, however, the probability that a release will occur becomes much higher.
Even if accurate projections of earthquake location, frequency, and force coupled with conservative tailings dam designs allow wastes to be fully controlled over the long term, it is worth noting that “human manage-ment/operation” and “unknown causes” ranked as the third and fourth highest causes of tailings dam failure worldwide and in Europe (Rico et al. 2008). This point requires little discussion. Over the long term, technol-ogy and engineering are only as reliable as the inevita-bly flawed humans who apply them.
Figure 13. Engineering for Perpetual Storage. The longest time horizon formally considered for the active life of the Pebble Mine is 78 years (Ghaffari et al. 2011). The mine’s pollution-control facilities, however, must function forever to protect the aquatic resources of the Bristol Bay basin. Unlike a dam built to impound water, which can be drained if the dam loses its structural integrity, tailings dams must be built to function in perpetuity (Higman 2010).
Possible lifespan of the Pebble mineCO2 storage
Typicalhazardouslifespanofradioactivewastemetal sulfide tailings storage
Coal combustion waste storage
Oldest engineered structure united States
Mechanizedminingtechniques235236 781,000+10,000+
ForeverForever
Past Future (years)
4650 (Egyptian pyramids)
Present day
Adapted from Higman 2010

39Chapter 3: Potential Sources of Contamination
Bristol Bay fisherman (photo by Bob Waldrop).

40
Sockeye salmon in Bristol Bay (photo by Ken Morrish, Fly Water Travel).

41Chapter 4: The Salmonids of Bristol Bay
Bristol Bay salmon returns is 2.2 times lower than it would be if the system consisted of a single population, rather than the several hundred discrete populations it currently consists of.” Population and life history diversity reduce variability in production at the basin or stock scale (Bristol Bay has 15 discrete stocks) because the impacts of disturbance or unfavorable environmen-tal conditions can be minimized. For example, juvenile sockeye exhibit a variety of strategies when migrating to or returning from the ocean. Some spend one year rearing in freshwater while others spend two; similarly, sockeye may remain in the ocean for one to three years before returning to spawn as adults. This complex age structure within a population increases the likelihood that temporally or spatially limited disturbances (i.e., environmental changes that do not impact the entire basin or persist over many years) do not impact all of the individuals in a particular cohort.
This dampening effect on the impact of disturbance is critical in maintaining the productivity of the entire system and allowing sustainable commercial, recre-ational, and subsistence harvests year after year. In fact, Schindler et al. (2010) found that if Bristol Bay produced just a single homogeneous population, the resulting increased variability in run size would “lead to ten times more frequent fisheries closures.” In addi-tion to the bounty enjoyed by humans, the benefits of sustained salmon runs are shared among numerous other species (discussed in section 4.2).
Although Bristol Bay’s population diversity and population-level habitat specialization ensures that salmon can take advantage of a wide range of habi-tats and limits the impacts of environmental distur-bance, it leaves them vulnerable to larger scale habitat alterations. For example, to sustain genetically adapted local populations, water quality characteristics must remain within a narrow range, and small changes, such as increases in dissolved copper concentrations, can be lethal or highly disruptive to survival (Eisler 2000, Baldwin et al. 2003, Sandahl et al. 2006, Hecht et al. 2007, Sandahl et al. 2007, Tierney et al. 2010). Once genetic diversity is lost from salmon popula-tions through habitat destruction or degradation, the
Chapter 4
The Salmonids of Bristol Bay
In 2010, over 40 million wild sockeye salmon returned from the ocean to spawn in the Bristol Bay basin. The 28.5 million sockeye harvested commercially in the bay that year produced an ex-vessel value of just under $150 million (ADFG 2011a), a figure that does not include the retail, recreational, or cultural value of the harvest (discussed in chapter 7). Over 11 million sockeye escaped the nets to spawn in 2010 (ADFG 2011a), ensuring the continued viability of the largest sustainable harvest of wild salmon on the planet.
4.1 Habitat and AdaptationSalmon require several different types of freshwater
habitat to successfully complete their lifecycles, includ-ing areas suitable for spawning, incubation, rearing, and migration (Meehan 1991). The unique richness and diversity of Bristol Bay’s salmon populations are driven by the region’s extraordinary abundance of varied, near-pristine, hydrologically well-connected, and pro-ductive freshwater habitats. The region’s habitat com-plexity, coupled with salmon’s strong natal homing tendencies, creates distinct, locally adapted populations with a high degree of adaptive specialization to individ-ual stream conditions (Hilborn et al. 2003 , Ramstad et al. 2009).
The Kvichak River provides a good example of habitat-driven genetic adaptation for sockeye. At least 150 sockeye populations have been identified in the Kvichak watershed, 38 of which reside in Lake Clark and the upper Newhalen River (Demory et al. 1964, Young and Woody 2007). It is possible that as many as 200 to 300 discrete spawning aggregates occupy the Kvichak system alone (Habicht et al. 2004, Ramstad et al. 2004, Ramstad et al. 2009). Local genetic adapta-tions include size and age at maturity, which depends to a large degree on stream size, and timing of spawn-ing (Hilborn et al. 2003, Woody 2004, Ramstad et al. 2009). Habicht et al. (2007) found that 97.2% of the genetic diversity of Bristol Bay sockeye salmon could be explained by differentiating among the spawning sites where they were collected.
This habitat-dependent population diversity limits the fluctuations in salmon runs commonly seen in systems with less complex and available habitats. In a recently published paper, Schindler et al. (2010) use 50 years of Bristol Bay sockeye population data to high-light the role that life history and population diversity play in sustaining a steady yield of a heavily exploited species. The research finds that “variability in annual
[T]he net result of losing [Bristol Bay sockeye] population and life history diversity could be a tenfold increase in the frequency of fishery clo-sures, generating considerable hardship for people who rely on consistent annual returns for their livelihoods .
—“Population Diversity and the Portfolio Effect in an Exploited Species” (Schindler et al. 2010)

42
Family Name Common Name Scientific Name Principal life History
Petromyzontidae/lampreys arctic lamprey Lethenteron camtschaticum ANA
Petromyzontidae Alaskan brook lamprey Lethenteron alaskense NON
Petromyzontidae Pacific lamprey Entosphenus tridentatus ANA
Clupeidae/herrings Pacific herring Clupea pallasii AMP
Catostomidae/suckers longnose sucker Catostomus catostomus NON
Esocidae/pikes northern pike Esox lucius NON
Umbridae/mudminnows Alaska blackfish Dallia pectoralis NON
Osmeridae/smelts rainbow smelt Osmerus mordax ANA
Osmeridae pond smelt Hypomesus olidus NON
Osmeridae eulachon Thaleichthys pacificus ANA
Salmonidae/salmonids Bering cisco Coregonus laurettae ANA and NON
Salmonidae humpback whitefish Coregonus pidschian ANA and NON
Salmonidae least cisco Coregonus sardinella ANA and NON
Salmonidae pygmy whitefish Prosopium coulteri NON
Salmonidae round whitefish Prosopium cylindraceum NON
Salmonidae coho salmon Oncorhynchus kisutch ANA
Salmonidae Chinook salmon Oncorhynchus tshawytscha ANA
Salmonidae sockeye salmon Oncorhynchus nerka ANA
Salmonidae chum salmon Oncorhynchus keta ANA
Salmonidae pink salmon Oncorhynchus gorbuscha ANA
Salmonidae rainbow trout Oncorhynchus mykiss POT and ANA
Salmonidae arctic char Salvelinus alpinus POT
Salmonidae Dolly Varden Salvelinus malma ANA and POT
Salmonidae lake trout Salvelinus namaycush NON
Salmonidae arctic grayling Thymallus arcticus POT
Gadidae/cods burbot Lota lota POT
Gadidae Pacific cod Gadus macrocephalus AMP
Gadidae saffron cod Eleginus gracilis AMP
Gasterosteidae/sticklebacks threespine stickleback Gasterosteus aculeatus NON and ANA
Gasterosteidae ninespine stickleback Pungitius pungitius NON
Cottidae/sculpins coastrange sculpin Cottus aleuticus NON
Cottidae slimy sculpin Cottus cognatus NON
Cottidae Pacific staghorn sculpin Leptocottus armatus AMP
Pleuronectidae/ flounders arctic flounder Pleuronectes glacialis AMP
Pleuronectidae starry flounder Platichthys stellatus AMP
Coho salmon (photo by Barrie Kovish).
Sockeye salmon (photo by Barrie Kovish).
rainbow trout (photo by Wild Salmon Center).
Dolly Varden (photo by Wild Salmon Center).
Chum salmon (photo by Paul Vecsei).
Table 2. Fish Species in Bristol Bay Drainages. All salmon spawn in fresh water. Anadromous fish (indicated by “ANA” in the table) spawn in fresh waters and migrate to marine waters to feed. Resident, non-anadromous fish (“NON”) spawn and feed entirely in fresh water, often with substantial seasonal movements between habitats within a given drainage (Quinn 2004). These are known as potamodromous (POT). In amphidromous (AMP) populations, juveniles move from salt water to the lower rivers to feed.
In some Bristol Bay species (including salmon), essentially all individuals have anadromous life histories. In others, all individuals have nonanadromous life histories (lake trout, arctic grayling, and pygmy and round whitefish). And in yet other species, individual fish may exhibit either anadromous or nonanadromous life histories (rainbow trout/steelhead, Dolly Varden, Bering cisco, least cisco, humpback whitefish). Salmon are “semelparous”, mean-ing they reproduce only once per lifetime and then die. Other Bristol Bay salmonids are “iteroparous” and can spawn multiple times during a lifetime (Morrow 1980, Stearns 1992, Mecklenburg et al. 2002, ADFG 2008b, Brown et al. 2009).

43Chapter 4: The Salmonids of Bristol Bay
wrens, hawks and eagles (Willson and Halupka 1995). When these and other species drag and carry carcasses from the beaches and rivers into riparian zones, they deliver critical nutrients to a variety of plant and other animal species. In some areas, carcass densities have been measured as high as 4000 kg/ha within riparian areas, and salmon-derived nutrients have accounted for 20% of tree metabolism (Reimchen 1994, Hilderbrand et al. 1999). In coastal Alaska, brown bears obtain virtu-ally all of their carbon and nitrogen from salmon (94% ± 9% of total), while the timing of mink reproduction can be influenced by the timing of salmon spawning (Hilderbrand et al. 1996, Ben-David 1997). Phosphorus and calcium from bones are especially important in oli-gotrophic waters and acidic soils, where these nutrients are naturally in low concentrations. Gende et al. (2002) describe major dispersal pathways for salmon-derived nutrients during and after spawning (Figure 14).
Healthy salmon returns also directly support the continued productivity of fish populations (Koenings and Burkett 1987). Carcasses of spawned-out adults and eggs from spawning fish are important seasonal parts of the diet of rearing juvenile salmon, rainbow trout, Dolly Varden, and arctic grayling (Bilby et al. 1998, Lang et al. 2006). Wipfli et al. (2003) found that salmon carcasses increased growth rates of stream -dwelling salmonids and that more carcasses translated into greater growth. Juvenile salmon and smolts are an important food source for the large populations of resi-dent fish species, such as rainbow trout, Dolly Varden, and arctic grayling, found in Bristol Bay streams. In this way, salmon provide a rich food source up and down Bristol Bay rivers across many months of the year and are key to the success of trout, char, and grayling pop-ulations. Without large salmon escapements and the associated input of marine nutrients, the productivity
likelihood of the species surviving over the long term is diminished (Rich 1939, Nehlsen et al. 1991, Spence et al. 1996, Hilborn et al. 2003, Schindler et al. 2010). This fact has been demonstrated repeatedly. Salmon populations prospered in cold waters throughout large regions of North America for thousands of years, but over the last century they have been extirpated from substantial portions of their ranges as a result of human changes to their habitats (Nehlsen et al. 1991). Decades of resource extraction, construction of migration barri-ers, hatchery production, and harvest have caused the decline and extinction of many populations (Nehlsen et al. 1991, Frissell 1993, Huntington et al. 1996).
If a major disturbance, such as a flood, volcano, freeze, disease, or tailings dam failure eliminates all salmon from a system, populations in other watersheds can remain productive and eventually re-colonize the disrupted system once the affected habitat has recov-ered (Waples et al. 2008). However, the genetic diver-sity can only be replaced through genetic mutation or individual straying, both long term processes that make recovery difficult. The straying rate for sockeye is the lowest among all of the Pacific salmon, estimated at less than 3% per year (Quinn et al. 1987).
4.2 Ecological Importance of Bristol Bay Salmon
Anadromous salmon and steelhead have evolved into seven distinct species across the north Pacific Ocean, adapting to the varied environments of hun-dreds of thousands of rivers and streams. Throughout their ranges, these species play a vital role in increasing the productivity of a variety of terrestrial and aquatic ecosystems by delivering marine nutrients inland to headwater streams (Kline et al. 1993, Schindler et al. 2003, Wipfli and Baxter 2010). Pacific salmon leave freshwater as 6 to 19 gram (0.2 to 0.4 ounce) smolts and attain more than 98% of their final mature weight at sea (Quinn 2004). When they return to freshwater to spawn, they transport and distribute tons of marine-derived nutrients to Alaska’s nutrient-poor freshwaters (Kline et al. 1993, Schindler 2003, Stockner 2003). Donaldson (1967) estimated that a record escapement of 24.3 million sockeye to the Kvichak River in 1965 deposited, after death, 169.3 metric tons of phospho-rus, a nutrient essential to the health and productivity of the watershed.
Such annual nutrient influxes by salmon maintain the productivity of lakes, streams, and riparian areas while supporting a diversity of wildlife (Naiman et al. 2002). Salmon and salmon carcasses are a major food source for terrestrial and avian predators and scaven-gers, including bears, wolves, foxes, mink, mice, ducks,
Bristol Bay’s resident salmonids and ocean-going species, such as this coho, are genetically adapted to live within a relatively narrow range of physical, chemical, and biological habitat conditions during their freshwa-ter life cycles (photo by Wild Salmon Center).

44
of the region and the numbers of freshwater and terres-trial species would decline in Bristol Bay as they have in the western conterminous United States and elsewhere (Gresh et al. 2000, Wipfli and Baxter 2010).
4.3 Salmon Species of Bristol BayAs listed in Table 2, Bristol Bay river systems support
diverse and robust populations of fish, representing at least 11 families, 22 genera, and 35 species. The 15 extant salmonid species (family Salmonidae) dwarf most Bristol Bay freshwater fish assemblages in abundance, diversity, ecosystem function, and human use and inter-est. The salmonid family comprises three subfamilies, each with representatives in Bristol Bay: salmon, trout, and char (Salmoninae), grayling (Thymallinae), and whitefish (Coregoninae) (Mecklenburg et al. 2002). The following provides general information on the life his-tories and commercial value of the five salmon species present in Bristol Bay.
Increased N&P Concentrations, Increased Algal Biomass and Primary Production Increased Riparian Vegetation Growth
Increased N&P Concentrations, Increased Algal Biomass, Primary Production Epilithic Biofilm Development, Increased PP Increased Respiration Increased Soil Nutrients Increased Riparian Vegetation Growth
Same
?
Increased Over-Winter Survival, Fecundity, Size, Densities & Health
Increased Growth, Survival, Smolt Size, & Ocean Survival
Same
Same
Increased Densities, Biomass Growth, & Changes in Community Structure
Same
Same
?
recycling
Potential effects Potential effectsProduct Process ProductProcess
Figure 14. Major dispersal pathways for salmon-derived materials during spawning (Gende et al. 2002).
direct consumption
Salmon are genetically adapted to a relatively narrow and unique range of habitat and water quality parameters within their natal streams. The extraordinary productivity of the Bristol Bay is attributable, in part, to the adaptation of sockeye to the diverse and complex array of habitats and environmental conditions in the Bristol Bay basin (Hilborn et al. 2003, Schindler et al. 2010). These adaptations have produced a unique diversity of sockeye populations and life histories within Bristol Bay sockeye. This diversity mitigates population fluctuations in the event of environmental disturbances (Schindler et al. 2010) (photo by Wild Salmon Center).

45Chapter 4: The Salmonids of Bristol Bay
The details of salmon life history (e.g., age and size at seaward migration, age and size at maturity, timing of migration and reproduction) vary among species, years, and within and across watersheds. In Bristol Bay, essentially all salmon spawning occurs in the last half of the calendar year, when eggs are deposited and immediately fertilized in redds (depressions) excavated by the adult female in stream or lake substrates. The eggs incubate until mid-winter and then hatch into alevin (fry with large attached yolk sacs) (Figure 15). The alevins remain in the spawning gravels through spring to early summer of the following year, absorb-ing their yolk sacs, before emerging as free-swimming juveniles (fry). The length of time between spawning and fry emergence varies with species, population, and water temperature (Murray and McPhail 1988, Quinn 2004).
After emergence, chum and pink salmon migrate directly to marine waters, meaning they have short freshwater residencies (measured in days) as juvenile fry (Quinn 2004). However, almost all Bristol Bay coho, Chinook, and sockeye salmon rear in lakes and streams for a year or more before migrating to the ocean as
smolts (Yuen and Nelson 1984). For juveniles of these three species, summer feeding and overwintering habi-tats may be in different locations, requiring migrations between seasonal freshwater habitats.
Salmon Life Cycles
Alevins hatch in late winter through summer depending on population
Fertilized eggs in redd develop
into embryos
Fry feed on aquatic & riparian terrestrial invertebrates
Spawned-out carcasses break down into organic matter
Nutrients and energy enrich freshwater food web
Coastal juveniles mature during 1–5 years in the ocean
Anadromous adults move upstream
Steelhead anadromous repeat spawners return to ocean as kelts
©2004 Kate Spencer
B
CD
Most sockeyeA
Pink, chum, some Chinook
Coho and some masu, steelhead, Chinook,
and sockeye
Fry migrate to freshwater
lakesFry migrants smoltify
Stream parr spend 1–5 winters
in streamsLake parr
spend 1–2 years in lakes
Juveniles move into deeper water at some point Smolts
migrate to ocean
Smolts migrate to oceanResident rainbow and masu
remain in fresh water
Fry disperse
Adults spawn in their natal streams (any season depending on population)
Rainbow and resident masu
Figure 15. Salmon life cycle. Although Pacific salmon share a common life cycle, considerable variation exists across both the different species and the many unique populations that can be found within a species. (© Kate Spencer).
Newly hatched alevin will remain in streambed cobbles through the winter to emerge as free-swimming fry the following spring or early summer (photo by Rich Grost).

46
Sockeye Salmon (Oncorhynchus nerka)
With minor exceptions in lakes where egress has become blocked (USNPS 2006), or as a very small com-ponent of an otherwise anadromous stock (Hodgson and Quinn 2002), all Bristol Bay sockeye salmon are anadromous. In Bristol Bay, adult run timing varies between drainages, but commercial harvest generally occurs from mid-June through early August, peaking in early July (Yuen et al. 1984). Between 1990 and 2009, the Bristol Bay commercial harvest averaged 25.8 million fish, which supported $114.7 million of the $116.7 million Bristol Bay commercial salmon fishery (ex-vessel value). Subsistence harvest during this same time period averaged 141,000 fish (ADFG 2011a). In total, the average production of Bristol Bay sockeye during this 20-year period was 37.49 million fish; in 2010, this number exceeded 40.1 million (ADFG 2011a).
Sockeye spawning occurs from July into January (Russell 1980, Hodgson and Quinn 2002, Woody et
al. 2003). Most Bristol Bay sockeye populations spawn along the beaches of large glacially-carved lakes or in streams flowing to, or draining out of these lakes, and these lakes serve as nurseries for rearing juve-niles. However, in some river systems, particularly in the Nushagak—Mulchatna drainage, sockeye salmon spawn and rear in larger, often braided, rivers (ADFG 2008b). The many large lakes in the region provide ideal sockeye salmon habitat, and sockeye are well-distributed throughout the basin, except in the slow-moving streams draining the broad coastal plain of inner Bristol Bay.
After fry emerge in the spring, most juvenile sockeye salmon rear in fresh water for one to two years. The production of juvenile sockeye salmon in Bristol Bay’s large rearing lakes is phenomenal. The migration of juvenile sockeye leaving Iliamna Lake in late May and early June just after lake ice-melt has been estimated at over 200 million fish in a three-week period (Bill 1984). Sockeye live in the ocean for two to three years before returning to spawn (Yuen et al. 1984, Stratton and Cross 1990).
Coho Salmon (Oncorhynchus kisutch)
Bristol Bay coho salmon populations are all anad-romous, with possible minor exceptions in local fresh-water habitats that suddenly become inescapable. The adult coho salmon spawning return occurs later in the year than the returns of the other four Bristol Bay salmon species. The inshore commercial harvest of returning adults occurs from late July through September (Yuen et al. 1984), but the end of the harvest probably reflects the loss of fishing interest rather than the absence of fresh fish. Between 1990 and 2009, an average of 88,000 coho were commercially harvested annually (ADFG 2011a).
Spawning occurs from September through October (Russell 1980), and may continue in specific areas well into winter. Coho spawn and rear from headwater streams to moderate-sized rivers. They generally do not use the sluggish streams draining the flat coastal plain. Coho salmon eggs and alevins incubate in spawning substrates through the winter, and fry emerge in spring to early summer. After they emerge, juvenile Bristol Bay coho salmon typically rear in fresh water for one to three years before migrating to sea, and different juvenile age classes may occupy different microhabi-tats (ADFG 2008b). Bristol Bay coho salmon fry rear in diverse habitats ranging from spring-fed headwater springs, to beaver ponds, to side-channels and sloughs of large rivers. In surveyed regions of Bristol Bay, coho salmon are documented throughout the Nushagak-Mulchatna watershed, and the Kvichak watershed (Woody and O’Neal 2010, ADFG 2011b). Most
Spawning Sea-run
Coho
Chinook
Chum
Pink
Sockeye
Salmon Species in Bristol Bay Drainages. All Bristol Bay salmon species have a noticeable change in color moving from ocean back to freshwater to spawn (© Fisheries and Oceans Canada).

47Chapter 4: The Salmonids of Bristol Bay
Bristol Bay coho salmon spend slightly more than one year feeding in the ocean before returning to spawn (Yuen et al. 1984, Stratton and Cross 1990, Edwards and Larson 2003).
Chinook Salmon (Oncorhynchus tshawytscha)
Bristol Bay Chinook salmon populations are anad-romous, with minor exceptions where local habi-tats become inescapable (Nelle 2002). In Bristol Bay, Chinook are the first salmon to return each year to spawn. Commercial harvest of the run occurs from late May through early August, peaking in June (Yuen et al. 1984). The commercial Chinook harvest throughout Bristol Bay between 1990 and 2009 averaged 64,000 fish. The vast majority of these were produced in the Nushagak watershed with an average of 53,000 fish harvested in the Nushagak District (ADFG 2011a).
Most Chinook spawning occurs from late July through early September (ADFG 2008b). Chinook spawn and rear from high in stream networks to large-sized mainstem rivers. They generally do not use streams draining the flat coastal plain. After fry emerge from spawning gravels in the spring, most rear in fresh water for one year before migrating to the ocean where they feed for two to five years before returning to spawn (Yuen et al. 1984, Stratton and Cross 1990). Within their general range, juveniles typically seek areas immediately adjacent to cut banks and next to faster flowing water. Chinook salmon occur through-out the Nushagak—Mulchatna drainage, but are seldom encountered in the Lake Clark portion of the Kvichak River drainage.
Chum Salmon (Oncorhynchus keta)
All Bristol Bay chum salmon populations are anad-romous. In Bristol Bay, adult run timing varies between drainages, but commercial chum salmon harvest gen-erally occurs from mid-June through August, peaking in late July and early August (Yuen et al. 1984). The commercial chum harvest over the 20-year period from 1990 through 2009 numbered 986,530 fish (ADFG 2011a). Spawning occurs from July into September in moderate-sized streams and rivers (ADFG 2008b).
After fry emerge from spawning gravels in spring, juvenile chum salmon migrate immediately to marine waters; they have no extended fresh water rearing period. Most Bristol Bay chum salmon feed three to four years in the ocean before returning to spawn (Yuen et al. 1984, Stratton and Cross 1990). Chum salmon occur throughout Bristol Bay, but are seldom encountered in the Lake Clark portion of the Kvichak River drainage or in the slow-moving streams draining the broad, flat coastal plain.
Pink Salmon (Oncorhynchus gorbuscha)
All Bristol Bay pink salmon populations are anad-romous. In Bristol Bay, adult run timing varies between drainages, but commercial pink salmon harvest gener-ally occurs from mid-July through mid-August (Yuen et al. 1984), and spawning occurs from July into September (ADFG 2008b). Among the five salmon species of Bristol Bay, pink salmon have the most limited freshwater distribution. They spawn in rela-tively few moderate-sized streams and rivers. Because juveniles migrate to the ocean immediately after emer-gence, they have no extended freshwater rearing period and do not use freshwater rearing habitat.
All Bristol Bay pink salmon feed a little more than a year in the ocean before returning to spawn. This unwavering life history pattern of no fresh water resi-dency and only one year of ocean feeding produces a strong biannual run cycle. In Bristol Bay, strong returns of pink salmon occur in even years and essentially no pink salmon return in odd years (Yuen et al. 1984). Commercial interest in pink salmon has been relatively small with an average of only 182,000 fish harvested every other year. A significant market in the Nushagak District in 2010 increased the commercial harvest of pink salmon to 1.3 million fish (ADFG 2011a).
Pink salmon are infrequently encountered far up the major drainages. While they are mapped high in the Nushagak and Mulchatna Rivers, they are not frequently observed in these areas (ADFG 2008b). In the Kvichak system, the Alagnak River is the species’ most important spawning stream (Yuen et al. 1984). In the Nushagak-Mulchatna drainage, the Nuyakuk and Tikchik Rivers provide most of the pink salmon spawning habitat (Nelson 1965).
Pink salmon (photo by Barrie Kovish).

48
Iliamna Lake
Newhalen
Kokhanok
Iliamna
Nondalton

49Chapter 4: The Salmonids of Bristol Bay
Cook Inlet
Proposed Port Site
Pile BayPedro Bay
Williamsport
The Anadromous Fish Act (ALASKA STAT. §16.05.871) mandates that the ADFG Commissioner specify the “various… streams or parts of them that are important for the spawning, rearing, or migration of anadromous fish.” However, only about half of the “waters” in Alaska that are important for anadromous fish are identified in the Anadromous Waters Catalog (AWC) (Buckwalter 2009). This is largely due to the fact that they have never been surveyed due to their remoteness, and in addition the statutory standards are vague and without statutory definition as to when, how, and under what cir-cumstances the commissioner may make this designation (Parker et al. 2008).
In August 2008, over a period of just one week, a team of independent fishery biologists conducted salmon surveys in 37 water bodies within and adjacent to the mine permit boundary and found salmon in 20 streams, resulting in the nomination of 28 miles of additional salmon-bearing streams to the AWC (Woody 2009). In subsequent surveys conducted in 2009 and 2010, an addi-tional 76 miles were documented (Woody and O’Neal 2010). Once a stream is added to the AWC, the commissioner of ADFG can require a developer whose plans will affect the designated waters to provide complete “specifications for the proper protection of fish… in connection with the construction or work, or in connection with the use.” If such plans are deemed “insufficient for the protection of fish,” the commissioner can deny approval.
The proposed road and pipelines from the Pebble Mine site to the deep-water port in Cook Inlet would cross approximately 89 creeks and rivers with permanent flows, 14 of which have already been designated as “anadromous waters” under the Catalog of Waters Important for the Spawning, Rearing or Migration of Anadromous Fish (Ecology and Environment, Inc. 2010). Many of these streams provide spawning and rearing habitat for one or more of the five Alaskan salmon species plus highly valued species such as rainbow trout, Dolly Varden, and arctic grayling. To meet the intent of the Anadromous Fish Act, increased monitoring is required to determine the full distribution of populations within this region and to ensure their conservation.
AnAdroMous WAters cAtAloG
Since 2008, biologists have been surveying streams within and adjacent to the Pebble Mine boundary to determine the presence or absence of anadromous fish (photo by Steve Baird).
Proposed Port Site
Cook Inlet
Iniskin Bay
Pile BayPedro Bay
Williamsport
Salmonid species docu-mented per stretch of body of water*
6 54321
Mining District ClaimsPebble Mine Claim Pebble Mine FootprintProposed Mining Road and Pipeline RouteExisting Roads
National ParkAnadromous Catalog StreamsOther Streams
Key
*Species documented include sockeye, pink, chum, coho, Chinook, steelhead, and Dolly Varden.
0 10miles
Figure 16. Anadromous Fish Catalog Surveys* Superimposed on Proposed Pebble Mine, Mining District, and Facilities (Woody 2009, Woody and O’Neal 2010, Ghaffari et al. 2011).
N

50
The Pebble claim area is characterized by a network of streams, ponds, and wetlands (photo by Erin McKittrick).

51Chapter 5: Potential Effects of the Pebble Mine on Salmon
and the State of Alaska lend support to this statement (ADEC 2003).
5.1 Acid Mine Drainage and Changes in pH
As described in chapter 3, the Pebble Mine presents a high risk of developing AMD because the deposit is composed primarily of metal-sulfide ores (USEPA 1994a, NDM Ltd. 2007). The AMD from a mine’s pit, tunnels, waste rock/ore piles, and tailings storage facili-ties is the primary source of mining-related pH changes in ground and surface waters (USEPA 1994a).
Numerous chemical reactions release ionized hydro-gen, H+, into the environment. Elevated concentrations of free H+ ions render the water acidic. Low concen-trations of H+, together with the presence of other compounds, especially carbonate constituents (CO2-HCO3-CO3) in fresh waters, produce waters referred to as alkaline (basic). Variations in the hydrogen ion content (activity) of waters (and soils) are measured using the pH scale, which reports the negative logarithm of the hydrogen ion concentration (Hem 1985, Mazor 1991).
The pH scale for most solutions is from 0 to 14.0, but it can extend both higher and lower. Waters with a pH of 7.0 are considered to be neutral, those with a pH below 7.0 are considered to be acidic, and those with a pH greater than 7.0 are considered to be basic (alkaline). A solution at pH 6.0 contains 10 times more hydrogen ions than at pH 7.0 (Lewis and Bamforth 2007). Thus, pH 4.0 waters are ten times more acidic than those at pH 5.0, and 100 times (10 times 10) more acidic than those at pH 6.0. The pH of a waterbody is important because too much acidity or alkalinity will reduce or eliminate fish and other aquatic life from the water body.
Effects of pH on Salmon
AMD-induced changes in the pH of surface waters are dependent on several factors, including the flow
Chapter 5
Potential Effects of the Pebble Mine on Salmon
Unlike many mine sites, the proposed Pebble project is in a largely pristine, unimpacted region. Typical spring and surface waters contain extremely low con-centrations of dissolved minerals. The introduction of even small amounts of additional dissolved mineral contaminants into the Pebble waters can produce sig-nificant changes in the water chemistry, more signifi-cant than would be expected in waters that have higher dissolved mineral content.
All salmon species require suitable freshwater habi-tats during their life cycles (Meehan 1991, Groot and Margolis 2001). Due to the narrow habitat require-ments of salmon, any activities that directly or indi-rectly alter water quality, water quantity, physical habitat structure, food supply, flow regime, or fish passage can alter fishery productivity (Meehan 1991, Spence et al. 1996). Historically, as a result of metal mining, even very small increases in contaminants, sediment, and turbidity and decreases in stream-flow and pH have resulted in dramatic decreases in salmon and their macroinvertebrate prey (Hughes 1985, Clements et al. 2000, Maret and MacCoy 2002, Maret et al. 2003). Large increases in these parameters have completely eliminated salmon from the affected habi-tats (Hughes 1985). Although salmon are resilient, it takes many generations and several human lifetimes for adaptation to occur in response to fundamental ecosys-tem changes, if they can occur at all.
The single greatest threat to salmon and salmon habitat in the Nushagak and Kvichak River drainages from the proposed Pebble Mine is from acid mine drain-age (AMD). Acid mine drainage impacts water quality in two critical ways. First, it lowers pH (increases acidity), and second, it increases the presence of dissolved metals, potentially to toxic levels. In addition to AMD and its effects on water quality, the cumulative effects of habitat loss, altered flows, increased sedimentation, tur-bidity, and increased water temperature resulting from mining also threaten salmon populations.
Although AMD is the primary threat, Pebble waters may become toxic to salmon and other aquatic life even without the development of AMD. Given the chemical “fragility” of these waters, relatively small increases in the concentrations of several metals/metalloids and other contaminants, (e.g., arsenic, antimony, copper, selenium, zinc, and ammonia) could negatively impact salmon populations. The extremely low Aquatic Life Water Quality Criteria promulgated by both the EPA
Surface water becoming groundwater becom-ing surface water again is one of the features of the country north of Iliamna Lake—and it’s why sockeye favor this body of water . Springs replenish the gravel-bottomed shores of the lake’s islands with highly oxygenated water, which salmon eggs need to mature . Any accidental acid mine drainage into this intricately connected natural system could be disastrous .
—“Alaska’s Choice: Salmon or Gold” (Dobb 2010)

52
rate, the amount of dilution, and the alkalinity of the receiving waters (USEPA 1994a, Earle and Callaghan 1998). At low pH, sensitive species such as salmon may be completely eliminated, while less sensitive species such as northern pike and sticklebacks may proliferate (Meehan 1991). At higher pH (5.5–6.5), fish behavior is affected, the reproductive capacity of adults is impaired, and the viability of eggs, alevins, and fry is reduced.
Salmon populations are adversely impacted by both acute and chronic exposure to low pH. For salmon and many other aquatic organisms, pH levels of 7.0 to 8.0 are considered optimal to maintain a productive ecosys-tem (Figure 17). Low pH harms fish because it causes an imbalance of the sodium and chloride ions in the blood (Morris et al, 1989). If pH falls below the tolerance range even for a short period, death can occur due to respiratory or osmoregulatory failure (Kimmel 1983). Acid water also increases the permeability of fish gills to water, adversely affecting gill function. Ionic imbal-ance in fish may begin at a pH of 5.5 or higher, depend-ing on species tolerance (Potts and McWilliams 1989). The author of a study of the physiological reactions of rainbow trout (Oncorhynchus, mykiss) to low pH and varied calcium ion concentrations concluded that the extinction of fish populations in waters acidified by AMD or acid rain usually occurs through reproductive (recruitment) failure (Nelson 1982). Low pH caused decreased cardiac rate, ossification, slower growth, less pigmentation, delayed hatching, and increased mortality.
Acidification affects fish assemblages in a number of ways and is dependent on several biotic and abiotic
Acid mine drainage from dumping high-sulfide material, Formosa Cop-per Mine (photo by Umpqua Watersheds Inc., Frances Eatherington).
Figure 17. The effects of pH and alkalinity on aquatic life (Mills 1985, Rosseland 1986, DeWalle et al. 1987, Eshleman 1988, Schindler 1988, Kaufmann et al. 1991, Meehan 1991, Wurts 1993, ADEC 2003, NDM, Inc. 2005, ADEC 2006, HDR Alaska and CH2M Hill 2008, Zamzow 2011).
less than 4.5 Death or displaced. Primary prey species will not survive.
4.5 to 5.5 Chronic mortality or avoidance. Primary prey species absent or significantly reduced.
5.6 to 6.4Interferencewiththeabsorption,circulation,andeliminationofessentialbodyfluids.
More than 8.5Behaviorisaffected,thereproductivecapacityofadultsisimpaired,andtheviabilityofeggs,alevins,andfryisreduced.
1.61 to 2.83 the range in pH of acid mine drainage measured at four metal mines in California.
ph is a measure of the acidity of a solution. At low pH levels, sensitive species (such as salmonids) are eliminated, and the overall density and diversity of aquatic organisms are reduced.
40–100 ppm Acceptable level for salmonids
50 ppm or belowStreamsarehighlyacidsensitive,pronetoperiodicacidificationevents,andvulnerableto chronic acidification.
16–56 ppm upper talarik Creek11–32 ppm North Fork of the Koktuli river7–35 ppm South Fork of the Koktuli river
Alkalinity is a measure of the capacity of substances dissolved in water to neutralize acidic pollution, such as acid mine drainage. Alkalinity protects or buffers water against rapid pH changes.
Below 7.0 low-level chronic effects.
6.5 to 8.5 alaska Water Quality Standard (+/– 0.5)
7.0 to 8.0 optimal level for salmonids.
9.5
8.5
8.0 7.0
6.5
5.5
4.5
3.5
2.5
1.5
20 ppm alaska Department of environmental Conservation minimum acceptable alkalinity
100
90
80
70
60
50
40
30
20
10
0
8.0 7.0

53Chapter 5: Potential Effects of the Pebble Mine on Salmon
CaSe StuDy: aCiD miNe DraiNage
Formosa copper Mine (oregon)
The Formosa copper mine is located in the Siskiyou Mountains in south-western Oregon. The site was initially mined between 1926 and 1937. Formosa Exploration Inc. (FEI, a partnership of Canadian and Japanese companies) reopened the mine in 1990. Between 1990 and 1993, FEI mined 350 to 400 tons per day of copper and zinc. The copper concentrate was sent to Japan. Because zinc prices were low at the time, the ore was stored on-site and remains there today (Throop 1995). The mine covers the head-waters of Middle Creek which drains into Cow Creek, the water source for the town of Riddle, Oregon.
Failures:• Inadequateinspectionsandmonitoringbystateagenciesfrom1990to
1993.
• In 1993, Oregon’s Department of Geology and Mineral Industries(DOGAMI) issued a Notice of Violation to FEI for numerous violations of permit conditions, such as illegal dumping of waste rock and storage of acid-producing pyrite. By August 1993, DOGAMI issued a Closure Notice for failing to correct the problems within the 30-day compliance period (USEPA 2009a).
• Dumping of high-sulfide material back into the mine tunnels. Theunderground workings are reported to contain large quantities of highly reactive acid-generating rock and tailings (ODHS 2010).
• Incomplete reclamation between 1994 and 1996, costing about $1 million.
• Failure of the drainage system throughout the 1990s and 2000s topresent.
impact: • Atleast5 million gallons of acid mine drainage, heavy with toxic metals,
were leaked into the creeks annually, through both ground and surface waters (USEPA 2007a). Acid rock drainage formed in the network of underground workings and flowed out of the lower mine adits (shafts) and into the headwaters of Middle Creek (Throop 1994).
• WaterdrainingfromtheminetoMiddleCreekhadhighconcentrationsof cadmium, copper, and zinc; concentrations of heavy metals fluctu-ate as groundwater levels rise or fall seasonally (USEPA 2009a). Mine drainage was stained bright orange with iron or blue-green with copper deposits.
• eighteen miles of fish habitat downstream from the mine has been destroyed. The Middle Creek watersheds were historically productive fisheries for salmonids, including coho salmon and steelhead. Upper Middle Creek and South Fork Middle Creek have not supported spawn-ing runs since the mine reopened in 1990; heavy metal pollution and poor flow characteristics now limit the use of these important spawning grounds (USEPA 2009a, ODHS 2010).
• ABureauofLandManagement/OregonDepartmentofEnvironmentalQuality survey in 1999 found a correlation between increasing concen-trations of zinc in the surface water and the decline of macroinvertebrate
(aquatic insect) abundance in the Middle Creek watershed. Comparisons of 1999 data with data from pre-mining surveys found that at two sites the total density and numbers of sensitive macroinverte-brate species were reduced by 96% and 98%. Data from Cow Creek downstream from the Cow Creek and Middle Creek confluence also indicates that macroinvertebrate communities have experienced stress at lower elevations due to the releases of heavy metals (USEPA 2009a).
mitigation: The mining company FEI, state agencies, and the Bureau of Land Management cooperated in major reclamation activities in 1994, removing tailings dumps and backfilling the material into the underground mine tunnels. Twenty tons of tailings were also removed from Middle Creek (USEPA 2009a). FEI filled in the former tailings pond with the ore and waste rock and capped it with a bentonite/geotextile composite and drainage layer. The mine owners sealed the portals with limestone rock and concrete and installed drains, although the drains soon failed (ODHS 2010).
After FEI abandoned the site, the state of Oregon did not have enough money to reclaim the mine site and could only repair the most critical fail-ures. In the 2000s, pipelines draining the mine were repeatedly found to be crushed, plugged, or severed, sending mine drainage directly into Middle Creek. Sumps and water-collection systems overflowed. A limestone channel built to reduce the acidity of the mine drainage became encrusted with iron scale and ceased to function (USEPA 2009a). In 2007, the EPA placed the Formosa Mine Superfund Site on the National Priorities List. Plans for removal of the most reactive tailings dumped in the underground tunnels are hampered by limited knowledge of the extent of the tunnel network.
Cost: The bond money originally requested in the 1990 operating permit was inadequate for restoration at the site after closure. The reclamation bond administered by DOGAMI was eventually increased from $500,000 to $980,000 (Throop 1995), but the bond was inadequate to pay the cost of cleanup, perpetual treatment, and monitoring. Taxpayer funding of the reclamation costs began in 1996 when FEI abandoned the mine and it became an orphan site. An estimate of the Superfund cleanup costs to remove underground tailings and to construct an acid drainage collection and treatment system is not possible until the local hydrology is better understood and a more thorough mapping of the underground tunnel complex is completed.
• Numerousviolationsofpermit,includingdumpingofhigh-sulfidematerialintominetunnels,leadingtoacidminedrainage
• Developer abandoned site after failed attempts at reclamation;ePa declared it a Superfund site
• 18milesoffishhabitatdestroyed
• Significantdeclineofmacroinvertebrates(upto98%)

54
• pH 4.5 to 5.5: Salmon will be severely distressed from ionic imbalance or toxic synergistic effects with metals or disease and will likely be absent because of chronic mortality or avoidance. Primary prey species will be absent or present in low numbers. Acid-tolerant species, such as northern pike and sticklebacks, may be present.
• pH 5.6 to 6.4: Salmon may be present, though dis-solved metals are present. Salmon will be under stress resulting from interference with the absorp-tion, circulation, and elimination of essential body fluids. These pH levels inhibit homing and spawning behavior in sockeye salmon. A pH of 6.0 is toxic to juvenile Chinook and chum salmon if dissolved metals are present. Sensitive macroinvertebrate prey species will begin to decline as pH drops below 7.0.
• pH 6.5 to 8.5: Salmon can persist. However, low-level chronic effects on salmon and habitat may begin to occur as pH levels decline below 7.0.
While acidification has significant effects on salmon, waters with higher pH also have predictable effects. High pH can kill adult fish and invertebrate life directly and can damage developing juvenile fish. When the pH of freshwater becomes highly alkaline, the effects on fish may include death; damage to outer surfaces like gills, eyes and skin; and an inability to dispose of metabolic wastes. High pH may also increase the toxicity of other substances. For example, the toxicity of ammonia is ten times more severe at pH 8.6 than at pH 7.0 (Lenntech 2011).
Effects of pH on Salmon Habitat
Water bodies with low pH are poor salmon habitat. Acid waters have fewer invertebrate species and lower abundance and biodiversity than near neutral waters (Earle and Callagan 1998). As pH levels rise in waters with AMD, the precipitation of iron, aluminum, and other metals can coat substrate and smother aquatic life (Martin and Platts 1981). Hoehn and Sizemore (1977) studied a Virginia stream in which AMD had eliminated all benthic macro-invertebrates over a six mile reach below the point of discharge. The natural low alkalinity of the stream (>25 mg/l) was reduced to less than 5mg/l (the role of alkalinity is discussed later), and the pH was reduced from 7.2 to 6.3. Increased concentration of iron from less than 0.01 mg/l to more than 4.0 mg/l was accompanied by the deposition of a coating of iron hydroxide on the stream bed, a phenomenon most likely responsible for the absence of macroinvertebrates. In a study of 34 stream sites differing in pH and invertebrate species richness, Hildrew et al. (1984) found that the pool of locally available, suitably adapted species was smaller in acid streams. Diversity of feeding categories
factors. The most important biotic factors are fish species, development stages, and spawning strategy (Rosseland 1986). While recruitment failure has been identified as the primary source of population decline, the life stage that is most affected differs from one popu-lation to another, even within the same species. Eggs and alevins are believed to be the most sensitive life stages, but significant mortality has occurred in post-spawning adults (Rosseland 1986). Salmon are particularly vul-nerable to low pH during the physiological changes that occur during salmon smolts’ transitions from freshwa-ter to salt water and adult spawners’ transitions from salt water to freshwater.
Stress, gill damage, ionic imbalance, and other effects of low pH can act in concert with other harmful agents such as metals and diseases to increase mortality in salmon populations. Acid water often increases the toxicity of other pollutants (such as metals) to fish that are already under stress from low pH conditions. At low pH levels (<5.0), metals contained in waste rock or sus-pended sediments may be released, adding other toxic pollutants to the aquatic system (Sorenson et al. 1971). Rainbow trout under low pH conditions acquired heavy infections of the gill parasite, Trychophyra intermedia, which was not related to mechanical gill damage (Balm et al. 1996). This suggests that the parasite may have a primary effect on gill function under acid conditions.
In addition to physiological responses to acid water, salmon also exhibit behavioral changes that impact reproductive success. Japanese scientists who studied the effects of acidification on salmon found that a pH of 5.8 completely inhibited the migratory homing behavior of landlocked sockeye salmon (Oncorhynchus nerka), and slight acidification (around pH 6.0) inhibited their spawning behavior (Ikuta et al. 2001). Sub-lethal acid stress at pH 5.0 and lower stimulated avoidance of acidic areas or induced failure of endocrine-related immune and reproductive functions. Ikuta et al. (2003) studied the upstream migratory behavior and redd-dig-ging behavior of mature sockeye salmon, brown trout, and Japanese char (Salvelinus leucomaenis) in response to low pH. Digging and upstream behavior were signifi-cantly inhibited in weakly acidic water (pH 5.8–6.4). Of the three species, sockeye salmon were the most sensi-tive to changes in pH.
Although acidification affects fish assemblages dif-ferently, salmon exhibit predictable responses to pH values at certain thresholds and within general ranges. According to Trasky (2008), the following responses can be expected:
• pH less than 4.5: All salmon and other fish species will die or be displaced from a water body. Primary prey species will not survive.

55Chapter 5: Potential Effects of the Pebble Mine on Salmon
In 2003, a partnership committee was formed between industry, govern-ment and the public with a goal to seek long-term solutions to address copper leaching impacts from the abandoned open pit mine site. In 2006, a grant allowed the Tsolum River partners to undertake an engineering study to select and design a viable remediation plan to address decades of acid rock drainage impacting the Tsolum River ecosystem. In 2007, detailed cost and site-specific designs for the remediation work were produced.
Costs: • $1.5millionforthefailedpartialcap.
• $50,000forengineeringstudytodesignremediation
• Estimated$6to10milliontoimplementremediation.
CaSe StuDy: aCiD miNe DraiNage
Mount Washington copper Mine (British columbia)
A small open pit copper mine operated on Mount Washington, on Vancouver Island, from 1964 to 1967 prior to going bankrupt after only four years of operation. The site was abandoned, leaving an open scar on the hillside above the Comox Valley and the Tsolum River.
In the past, the Tsolum River supported large populations of steelhead and resident rainbow trout, sea-run cutthroat trout, and coho, pink, and (to a lesser extent) chum salmon (BCME 2011).
Failures: • Theabandonedminesitegeneratedtoxiccopper leachate(acidmine
drainage) through the 1980s.
impact: • By 1993, Tsolum River was barely able to support any fish or other
aquatic life; 18 miles of fish habitat were destroyed.
• In2000,theDepartmentofFisheriesandOceans(DFO)declaredtheTsolum River dead.
• TsolumRiverdidnotmeetwaterqualitystandards.
Acid mine drainage from the Mount Washington copper mine is con-sidered the primary reason fisheries have declined in the basin. There are other potential contributing factors, including the reduction of summer low flows by irrigation withdrawals, over-fishing, logging, and gravel extraction. However, the neighboring Puntledge River which has experienced these same disturbances with no mine present, has continued to support strong salmon and trout populations (BCME 2011). In late spring and fall, when snowmelt and heavy rains add volume to the Tsolum River, lethal copper leaching increases.
mitigation: In 1987, federal and provincial agencies funded studies moni-toring and on-site projects to address the problem. Mediation work began in 1988. Partial covers, segregated drainage, and other steps were taken to reduce the volume of toxic concentrations of copper entering and impact-ing the Tsolum River ecosystem. A partial cap was placed over a consoli-dated pile of volatile rock, at a cost of $1.5 million, but was declared a failure. Though work completed over this period was successful in reducing the levels of copper in the water, fish populations continued to decline and water quality did not significantly improve.
In 1999, the Outdoor Recreation Council declared the Tsolum River the most threatened river in British Columbia. A 2000 report published by SRK Consultants on remediation options for the Mount Washington mine recommended that to achieve full remediation, the site itself would require an engineered cover to provide source control. Partners agreed that it was the right solution, but the estimate of $6 to 10 million was beyond their resources.
It was determined that with the limited funds available, low flows, habitat restoration, stock enhancement, community awareness, and protection of the watershed would be the focus, while lobbying for source control continued.
• Developerwentbankruptafteronlyfouryearsofoperation
• DepartmentofFisheriesandOceans(DFO)declaredtheTsolumriver dead
• Salmonidstocks intheTsolumRiverhadallbutbecomeextinct; 18 miles of fish habitat destroyed
• $1.5millionspenttodateonfailedcap;truecostnotyetknownAbove: Mount Washington Copper Mine (Google Earth).
49.7651544N 125.3033906W49.7651544N 125.3033906W
Wikimapia - Let's describe the whole world! http://wikimapia.org/#lat=49.7651544&lon=-125.3033906&z=15&l=0&m=b&&show=/78425...
1 of 1 8/25/2010 5:05 PM

56
increased with species richness, indicating that a greater range of food resources was available in the less acid, more species-rich communities.
The current Alaska water quality standard requires a pH between 6.5 and 8.5, which may not vary by more than 0.5 pH units from natural conditions (ADEC 2006). This standard may not adequately protect salmon. If a stream with a background pH of 6.5 were allowed to decline by 0.5 pH units to 6.0, it would be acidic enough to inhibit salmon homing, spawning, and osmoregula-tion. Prey species may be present in low numbers or absent.
Alkalinity in the Pebble Mine Area
Alkalinity is a measure of the capacity of substances (usually bicarbonate and carbonate) dissolved in water to neutralize acidic pollution such as AMD. The mea-surement is important because high-alkalinity protects or buffers water against rapid pH changes that are harmful to fish and other aquatic life. When acid is intro-duced, the pH levels in low-alkalinity streams can drop to a point that eliminates fish and acid-intolerant forms of aquatic life. Conversely, high-alkalinity streams can offset the effects of introduced acid water. Moon and Lucostic (1979) reported that a mitigating alkaline dis-charge downstream from a mine releasing AMD kept stream pH between 5.8 and 7.0 for 18 months. It should be noted that although pH was maintained above lethal levels, the benthic macroinvertebrate assemblage was smothered by ferric hydroxide, which precipitated out with the increase in alkalinity. This illustrates how AMD can impact salmon habitat even when acidity is ameliorated by the input or presence of alkaline water.
An acceptable alkalinity level for salmon culture is in the 40 to 100 ppm range (Wurts 1993). The Alaska Department of Environmental Conservation (ADEC) states that alkalinity should be at least 20 ppm calcium carbonate equivalent (ADEC 2003). This may be mini-mally adequate to maintain aquatic life and function under normal conditions; however, 20 ppm is insufficient to protect a water body from detrimental pH changes if it receives AMD.
Typical spring and surface waters in the Pebble Mine area contain extremely low concentrations of dissolved minerals, as is demonstrated by the very low field specific conductance measurements reported by both Northern Dynasty (NDM Inc. 2005) and the U.S. Geological Survey (Eppinger et al. 2009). The median specific con-ductance measurement for these waters reported by the USGS was 48 microS/cm, which would convert to a total dissolved solids concentration of approximately 30 to 35 mg/L, indicating that these are extremely dilute waters. The Northern Dynasty (NDM Inc. 2005) data showed that minor and trace constituent concentrations were
consistently low or nondetectable in these waters and that pHs were typically near neutral, unless in contact with exposed ores. Northern Dynasty recorded alkalin-ity concentrations in the Pebble Mine study area ranging from 11 to 32 ppm for the North Fork of the Koktuli River; 7 to 35 ppm for the South Fork of the Koktuli River; and 16 to 56 ppm for Upper Talarik Creek (NDM Inc. 2005, HDR Alaska and CH2M-Hill 2008).
Although the pH range reported for sampled Pebble Project area streams falls within the acceptable range for salmon established under Alaska state water quality standards, these data indicate that the acid-neutralizing capacity of Pebble area streams is limited. Streams with alkalinities of less than 50 ppm are considered highly acid sensitive, prone to periodic acidification events, and vulnerable to chronic acidification (DeWalle et al. 1987, Eshleman 1988, Schindler 1988, Kaufmann et al. 1991).
5.2 Acid Mine Drainage and Copper Toxicity
Copper (Cu) is essential to the growth and metab-olism of fish and other aquatic life, but it can cause irreversible harm at levels slightly higher than those required for growth and reproduction (Eisler 2000). As a result, copper is a serious pollutant in the aquatic
Testing water quality of an inlet to Frying Pan Lake. Although dissolved copper would likely be the most significant metal contaminant produced from the Pebble Mine, many other heavy metals and elements are present, including antimony, arsenic, cadmium, chromium, lead, mercury, nickel, selenium, and zinc. The introduction of even small amounts of additional dissolved mineral contaminants into the Pebble waters can produce significant changes in the water chemistry, more significant than would be expected in waters that have higher dissolved mineral content (photo by Wild Salmon Center).

57Chapter 5: Potential Effects of the Pebble Mine on Salmon
environment, and its toxicity to a variety of species has been well studied (Sorenson 1991, Eisler 2000). Elevated levels of dissolved copper have acute toxic effects on all life stages of salmonids. As detailed in Trasky (2008), acute toxic effects of dissolved copper on adult and juvenile salmon occur from 17 to 54 ug/l, and adverse sub-lethal effects of dissolved copper on salmonid metabolism, growth, reproduction, migra-tion, prey location, and avoidance of toxic situations occur at concentrations between 0.7 and 23 ug/l. Consequently, the current Alaska criteria (ADEC 2003) for exposure of aquatic life to dissolved copper (acute/one-hour exposure: 3.8 to 52 ug/l; chronic 96-hour exposure: 2.9 to 30 ug/l) may not protect salmonids from the chronic or behavioral effects of copper. Additionally, these criteria fail to consider synergistic effects between copper and other metals or other likely co-occurring stressors.
Effects of Copper on Salmon
Very low concentrations of dissolved copper (in the low parts per billion to high parts per trillion range) can have acute and chronic toxic effects on fish and their prey (Hamilton et al. 1990, Eisler 2000, USEPA 2007b, Tierney et al. 2010). In adults, acute exposure to copper causes ionoregulatory and respiratory problems. Wilson and Taylor (1992) found that exposure to 49 ppb of dissolved copper for 24 hours caused a rapid decline in blood sodium, chloride, and oxygen tension, while increasing heart rate and arterial blood pressure rate in rainbow trout, conditions that eventually led to death. Researchers in juvenile salmonids at the EPA’s Corvallis Environmental Research Laboratory found that dis-solved copper was acutely toxic to juvenile Chinook salmon and steelhead trout at levels of 17 to 38 ppb. Steelhead trout were more sensitive than Chinook salmon, and salmon fry and smolts were more sensi-tive than newly hatched alevins (Chapman 1978). They also found that copper was acutely toxic to adult male coho salmon and adult male steelhead at 46 and 57 ppb, respectively (Chapman and Stevens 1978). Table 3 highlights copper toxicity levels for salmonids and other aquatic organisms based on USEPA (2007b) data.
Giattina et al. (1982), observed that at sub-lethal concentrations of copper (6.4 ppb), rainbow trout avoided contaminated water, but as levels gradually increased, individuals were attracted to higher con-centrations that are considered lethal (330–390 ppb). Pedder and Maly (1985) found that when exposed to lethal concentrations of copper (0.5 to 4.0 ppm) without the gradual increase, there was an initial attraction period and then subsequent avoidance, indi-cating that individual behavior subsequent to copper discharges contributed to high mortality. These results suggest that environmental impacts predicted on the
basis of toxicity tests alone do not reflect potentially important behavioral changes caused by chronic and sub-chronic concentrations of copper.
According to Trasky (2008), studies revealed that when fertilized sockeye and pink salmon eggs were exposed to copper, the incipient lethal level was between 37 and 78 ppb for sockeye salmon and between 25 and 55 ppb for pink salmon during the egg-to-fry stage. Copper inhibited the softening of egg capsules, but associated mortalities during hatching occurred only at concentrations also lethal to eggs and alevins. Copper was concentrated by eggs, alevins, and fry in propor-tion to exposure concentrations. Several studies found that dissolved copper levels toxic to salmon fry, smolts, and adults were lower than levels toxic to developing eggs (Trasky 2008).
Exposure to sublethal levels of copper increases the susceptibility of salmon to disease and infections. According to Baker et al. (1983), exposure to sublethal levels of copper increased the susceptibility of Chinook salmon and rainbow trout to Vibrio anguillarum infec-tions. Vibrio is a serious and often fatal disease of fish. At exposure levels of 9% (parts per trillion range) of copper LC50 (i.e., the dose that will kill one-half of the population) for 96 hours, vibriosis mortality was greater in fish exposed to copper than in those exposed to just Vibrio. Likewise, rainbow trout stressed by copper required 50% fewer pathogens to induce a fatal infection than did non-exposed fish (Baker et al. 1983). Similar results were observed by Hetrick et al. (1979), who found that the exposure of rainbow trout to sub-lethal levels of copper in water increased their suscep-tibility to the infectious hematopoietic necrosis (IHN) virus. In most instances, the percent mortality was twice as great in the copper-stressed groups compared with those groups that were not stressed but received the same virus dose.
coPPer toxicity
TaxonAcute Toxicity (ug/l)
Behavioral Effect (ug/l)
Chronic Toxicity (ug/l)
Water fleas 6 8.96
Amphipods 9.6
Coho adults 22.93
Brook trout adults 60.4
Chinook adults 25.02 6.9–23
Bull trout 25.02 19.7
Rainbow trout adults 22.19–49 2.2–14 1.6–6.4
Sockeye adults 54.82
Table 3. Dissolved Copper Toxicity to Salmonids and Other Aquatic Organisms. Note: 1 ug/l = 1 part per billion (ppb) assuming comparable densities; 1 ppb = approximately 1 second in 100 years (USEPA 2007b).

58
Pebble operations are likely to release concentra-tions of several other non-metallic constituents known to be potentially toxic to salmon and other aquatic life. These include nitrates, ammonia, sulfate, fluoride, chlo-ride, and process chemicals. For example, xanthates are reported to be toxic to fish and aquatic invertebrates (Alto et al. 1977, Australian Government Publishing Service 1995)
5.3 Whole Effluent Toxicity and Community Effects
Mine and mineral-processing wastes include complex combinations of inorganic and organic com-pounds. The constituents released from mines, waste rock, tailings, and spoil pits are essentially a chemi-cal soup. When contaminants are released into nearby ground or surface waters, they can be toxic not only to salmonids but also to aquatic and riparian organisms, like macroinvertebrates, if present in toxic concentra-tions. Like the examples described earlier for copper and pH, the additive and synergistic effects of these com-pounds are much more complex than the effects of any one component. For example, mine effluents that enter nearby surface waters from point or diffuse sources chemically react to produce insoluble substances that settle to the river bottoms. These precipitates are pre-dominantly composed of aluminum, iron, and man-ganese compounds, but also include other metals and metalloids (e.g., antimony, arsenic, cadmium, copper, lead, mercury, and zinc) that can coat substrates and smother aquatic life (Moran 1974, Martin and Platts 1981). These precipitates may be consumed by aquatic bottom-dwelling organisms, which are in turn con-sumed by fish, resulting in potentially toxic biologi-cal accumulations (Clements et al. 2000, Maret et al. 2003).
One can get a sense of potential chemical contam-inants in waters downstream of the Pebble Mine site by examining data from other copper mines. Table 4 shows actual constituent concentrations from waters at three copper mine sites: Kennecott Utah Copper in Utah, the Globe-Miami area in Arizona, and Southern Peru Copper in Peru. All of the examples in Table 4 had unlined tailings impoundments or no tailings impound-ment, and their lithologies and metals differed some-what from one another and from those likely to be pro-posed for the Pebble Mine. However, all concentrations shown in Table 4 and many of those in waste effluents at other copper mines far exceed their water quality cri-teria and standards.
Metals in aquatic ecosystems can impair the algae food base of lake and stream-dwelling salmon. Many studies have demonstrated that phytoplankton, such
Juvenile salmon appear to be the most sensitive to the effects of dissolved copper, most likely due to physi-ological changes related to growth and smolting (Hecht et al. 2007). In a study of juvenile coho, individuals exposed to sublethal levels of aqueous copper (one-quarter and one-half of the LC50 dose over four days) ceased growing or showed decreased rates of growth (Buckley et al. 1982). National Marine Fisheries Service researchers found that a three-hour exposure to <10 mg/l dissolved copper reduced or eliminated juvenile coho salmon’s neurophysical and behavioral responses to an alarm pheromone (Baldwin et al. 2003). Similarly, a 20 mg/l concentration of dissolved copper inhibited coho salmon olfaction by 80% (McIntyre et al. 2008).
In addition to physiological impacts, exposure to sublethal levels of copper and other heavy metals may also cause serious damage to the life processes of sal-monids (Baatrup 1991). As described in Trasky (2008), fish depend on an intact nervous system, including their sensory organs, to locate food, recognize preda-tors, migrate, communicate, and orientate. The nervous system is very vulnerable to damage from metallic pol-lutants, and injury may drastically alter the behavior and subsequently the survival of fish. Metals' affinity for a number of ligands and macromolecules in the nervous system makes them potent neurotoxins, which affect the integrity of the fish nervous system structur-ally, physiologically, and biochemically. The interaction of copper and other metals with chemical stimuli in the nervous system may interfere with communication between the fish and the environment.
Synergistic Effects
Dissolved copper may be the most significant metal contaminant produced by the Pebble Mine. However, water samples from the Pebble Mine area indicate the presence of many of the other metals and chemi-cal constituents on the EPA's list of priority pollutants, including antimony, arsenic, cadmium, chromium, lead, mercury, nickel, selenium, and zinc. While these other metals are also toxic to salmon and other aquatic life at very low concentrations (Eisler 2000), copper also produces negative synergistic effects with them. The cumulative effects of interactions between and among metals and water quality variables such as temperature, alkalinity, and acidity are important because many variables concurrently influence fish growth and sur-vival (Molony 2001). For example, copper becomes more toxic to salmon as pH and alkalinity decrease (Waiwood and Beamish 1978, Chakoumakos et al. 1979, Lauren and McDonald 1985, Welsh et al. 2000). Because alkalinity levels in Upper Talarik Creek and Koktuli River watersheds are low, copper (and other metal/metalloid) toxicity is likely to be high.

59Chapter 5: Potential Effects of the Pebble Mine on Salmon
contAMinAnt 1 (water quality criterion)
Kennecott copper (ut)2 Globe-Miami (AZ)3 southern copper (Peru)4
groundwater (down-gradient of waste rock)
groundwater (near tailings) tailings Waters Wells tailings Waters
arsenic (10) 4–200 87–281 3,100–13,000 190–2,500 5–162
Cadmium (0.1) 70–380 100–1,000 0.5–6.4
Chromium (24) 19,200–39,400 5–46
Copper (1.5) 112,000–128,000 40 227,000–456,000 18,000–150,000 5–11,300
Nickel (16) 20,000–22,200 870–3,000 5–46
Selenium (4.6) 70–170 5,000–10,000 13–33
Silver (0.32) 30 3–23
lead (0.54) 3,400–9,800 2–243
aluminum-D (87) 16,000–230,000
Cobalt-D (50) 1,600–10,000
iron-D (300) 130,000– 2,710,000 30–144,000
manganese-D (50) 42,000–670,000 1.0–4,120
molybdenum (10) 279–826
Zinc-D (36) 2,900–24,000 28–1,010
Sulfate (mg/l) 7,000–9,000 231–1,930
Chloride (mg/l) 220–440 49–115
ammonia (32–49) 2,000–9,000
Table 4. Water Contamination. Actual constituent concentrations from waters at three copper mine sites: Kennecott Utah Copper, Utah; the Globe-Miami area, Arizona; and Southern Peru Copper, Peru. These data are included for comparative purposes and to indicate concentrations that have been released into the environment via water pathways. Their inclusion is not intended to imply that the future Pebble Mine waste waters will have these con-centrations. These examples include only a few of the chemical constituents actually present in the site waters; many constituents were not determined or the data were not made public (photo by Tim Jarrett).
CaSe StuDy: grOuNDWater CONtamiNatiON
Bingham canyon Mine (utah)
Bingham Canyon Mine (also pictured in the table above) is owned by Kennecott Utah Copper Corporation. With a pit over 0.75 miles deep, 2.5 miles wide, and covering 1,900 acres (Rio Tinto 2007) it is currently the largest mine in North America. According to Earthworks (2010), pollution from the mine has contaminated 60 square miles of groundwater near Salt Lake City, making water unusable for at least 4,300 households. Kennecott, a subsidiary of Rio Tinto, built a multi-million-dollar water-treatment facil-ity, the largest of its kind in the United States, to treat an estimated 2.7 billion gallons of polluted water annually for at least the next 40 years. As of 2006, “Kennecott had spent $370 million on cleanup and source control, and will be required to pump and treat aquifer water for at least the next 40 years” (Earthworks 2010). The Bingham Canyon Mine contains an ore body roughly half the size of Pebble.
Right: Bingham Canyon Mine as seen from the International Space Station (Johnson Space Center).
• Contaminated60squaremilesofgroundwater,makingitunusablefor4,300households,andmusttreat2.7billiongallonsannually
• $370millionspentoncleanupandsourcecontrolasof2006
1. Water quality criteria are shown in parentheses for each contaminant. Data are from either aquatic toxicity criteria from USEPA or ADEC or drinking water standards from these agencies (ADEC 2003, USEPA 2006, 2007a). Criteria are in ppb, unless otherwise noted. D = dissolved.
2. Data are from USEPA (1994b) and represent ground waters down-gradient of waste rock piles; ground waters near the tailings; and tailings waters. 3. Data are from USGS (1990) and represent ground waters contaminated by waste rock drainage and possible tailings effluents that have migrated into
the local ground waters. 4. Data are from Woodward Clyde (1994) and come from tailings waters.

60
genera Epeorus, Megarcys, and Pteronarcys (mayflies and stoneflies), did not reappear at all.
5.4 Water Appropriations The Pebble operations would require a tremendous
volume of water. This water would be used for pro-cessing ore, slurrying as much as 10.8 billion tons of mine waste from the mill to the waste-storage facili-ties, and slurrying concentrate along the 86-mile pipe-line from the mine to the port (Ghaffari et al. 2011). Northern Dynasty has applied for all of the ground and surface waters within the boundaries of the mine area, upgradient of the downstream limit of water extraction (Table 5). These appropriations, which were requested in water rights applications submitted in 2006, would eliminate or reduce flow in sections of Upper Talarik Creek (a tributary of the Kvichak River) and the North and South Forks of the Koktuli River (tributaries of the Mulchatna River, which feeds the Nushagak) (NDM Inc. 2006a, 2006b, 2006c). Waters would be removed via pumping, gravity, and channeling.
Maintaining stream flows is one of the most impor-tant measures in maintaining salmon habitat and popu-lations (Trasky 2008). Loss of salmon and resident fish habitat resulting from reduced and altered stream and groundwater flows is well documented in the scientific literature and is a major cause of salmon declines in the Pacific Northwest (Heggnes et al. 1996, NRC 1996). Appropriation of all water in a stream would eliminate all fish habitat. Reductions in stream flow would reduce the amount of available stream habitat, alter critical stream temperature regimes, impact stream velocity and morphology, and lower the quality and carrying capacity of salmon habitat (Berg and Northcote 1985, Poff et al. 1997, Madej et al. 2006, Poff et al. 2010).
Surface Water
Fish absorb oxygen through their gills, and any disruption in the water supply can result in increased stress and mortality. Some fish may survive short-term disruptions in water supply by taking refuge in remain-ing pools, but when their medium for life is diverted for other purposes, mortality occurs (Gillilan and Brown 1997). The surface water appropriation for the mine and tailings storage facilities would eliminate all flow
as diatoms, are highly sensitive to metal exposure (Hollibaugh et al. 1980, Franklin et al. 2002, Nayar et al. 2004). Copper and mercury are particularly toxic to plankton, although other metals (such as nickel, cadmium, lead, and zinc) are also known to inhibit the growth of some species (Hollibaugh et al. 1980, Thomas et al. 1980, French and Evans 1988, Enserink et al. 1991, Balczon and Pratt 1994, Dahl and Blanck 1996, Nayar et al. 2004). Metal concentrations in parts per billion released from contaminated sediments have been associated with reductions in phytoplankton pro-duction, phytoplankton abundance, and chlorophyll concentration (Nayar et al. 2004).
Zooplankton species, which are the key prey for lake-dwelling sockeye salmon juveniles, vary in their sensitivities to different metals (Enserink et al. 1991, Jak et al. 1996). For instance, EC50 (halfway between baseline and maximum response concentration) values for growth inhibition in the water flea Daphnia magna were demonstrated to vary from 1.3 ppb for mercury, 16.1 ppb for copper, 570 ppb for zinc, and 3,200 ppb for arsenic (Enserink et al. 1991). Other common zoo-plankton species were shown to be more sensitive to metals than D . magna, whereas copepods were less sensitive and rotifers were about as sensitive (Jak et al. 1996). Such trace metal concentrations could change zooplankton assemblage structure and reduce the salmon food supply, resulting in lower salmon produc-tion in Iliamna Lake (Walsh 1978).
Aquatic insects form the major prey base for juve-nile salmon. Particular aquatic insect species respond across a broad spectrum of tolerance or intolerance to acid mine drainage and excess metal concentrations. However, many major salmonid prey species occur in the taxonomic orders Ephemeroptera, Plecoptera, and Trichoptera (mayflies, stoneflies, and caddisflies, respectively), which contain many sensitive aquatic insect species. A Washington Department of Ecology survey conducted in 1996 found a precipitous decline in aquatic insects above and below the Holden Copper Mine near Lake Chelan in north central Washington State (Johnson et al. 1997). (See the case study p. 29). The average density of aquatic insects reached a high of 3,130 organisms per square meter above the mine at the Glacier Peak Wilderness boundary and fell to just 50 organisms per square meter at a site on Railroad Creek just below the mine’s tailings pile three miles farther downstream. Results showed a small recovery in numbers (to 361 organisms per square meter) at the mouth of Railroad Creek near its outflow at Lake Chelan, eight miles below the mine. However, only insect species tolerant of excess metals were reestab-lished in the eight miles of stream below the mine, and insect taxa known to be sensitive, such as those in the
location surface Water Groundwater
South Fork Koktuli 12.0 billion 2.8 billion
North Fork Koktuli 8.0 billion 0.2 billion
Upper Talarik Creek 6.8 billion 1.7 billion
Table 5. Water Appropriation for the Pebble Mine (NDM, Inc. 2006a, 2006b, 2006c).

61Chapter 5: Potential Effects of the Pebble Mine on Salmon
Collings 1974, Boehne and House 1983). The reduc-tion of habitat (stream width and depth) from mine appropriations could substantially reduce available spawning and rearing habitat particularly during the summer low flow period when Chinook, sockeye, and chum salmon are spawning. Similarly, reduced flows would diminish the amount of available over wintering habitat for juvenile salmon during critical low winter flows. Englund and Malmqvist (1996) also found that reductions in stream-flow or alteration of stream-flow patterns reduced the productivity of stream habitat, including the productivity of aquatic invertebrates that comprise the primary food source for juvenile salmon.
Groundwater
The abundant wetlands, lakes, and ponds present in the proposed Pebble Mine area indicate high ground-water levels and interconnected ground and surface waters. According to Trasky (2008), groundwater directly affects the productivity of salmon-bearing streams by (1) sustaining stream base flows and mod-erating water level in groundwater-fed lakes and streams; (2) providing stable temperature regimes and refugia; (3) providing nutrients and inorganic ions; and (4) providing stable spawning habitat. In 2006, Northern Dynasty submitted separate groundwater applications for 19.4 cubic feet per second (cfs) from the Upper Talarik Creek drainage, 11.78 cfs from the South Fork Koktuli watershed, and 12 cfs from the North Fork Koktuli River drainage (NDM Inc. 2006d, 2006e, 2006f). These groundwater withdrawals create a clear potential for substantially decreased flows and water levels in the interconnected streams and lakes common in and around the Pebble Mine site (Ecology and Environment, Inc. 2010).
The groundwater system in the area is recharged by precipitation that flows to lakes and streams through the groundwater system (USGS 2008a). Water pumped from the groundwater system to service mine opera-tions and to prevent flooding of the pit and tunnels will lower the water table and alter the direction of water movement, as illustrated in Figure 19 (Moran 2007, USGS 2008b). Water that currently flows to the Upper Talarik Creek and the North and South Forks of the Koktuli River from this area would no longer do so. Heavy pumping may also draw water from adjacent streams, such as Upper Talarik Creek, into the ground-water system, further reducing the amount of stream flow (USGS 2008a, Stratus 2009).
Groundwater flowing down-gradient from the mine area appears to provide the majority of flow to the North and South Forks of the Koktuli River and Upper Talarik Creek during July and August (NDM Inc. 2005) when Chinook, chum, and sockeye salmon
and fish habitat in the upper main stem of the South Fork Koktuli and its headwater tributaries, a tributary to the North Fork Koktuli, and the tributaries to Upper Talarik Creek (NDM Inc. 2006a, 2006b, 2006c). In the mine area, dewatering lakes and streams will result in the permanent loss of fish that currently use those habitats.
Below the mine, stream flow would be reduced, and fish habitat would be dried up or diminished down-stream. Headwater catchments produce about 55% of the flows in large rivers (Alexander et al. 2007), so loss of headwater streams and the groundwater that produce them will alter flows and water quality down-stream. According to Northern Dynasty's surface water rights applications, the net reductions in stream flow projected for each of the three surface water bodies are as follows: 8% on the North Fork Koktuli, 18 miles downstream; 16% on the South Fork Koktuli, 12 miles downstream; and 9% on Upper Talarik Creek, 18 miles downstream (NDM Inc. 2006a, 2006b, and 2006c).
Loss of flow in the most severely affected areas could affect upstream salmon migration. Fish migrat-ing upstream must have stream flows that provide suit-able water depth and velocities for successful upstream passage (Bjornn and Reiser 1991). Baxter (1961) reported from a study in Scotland that salmon need 30% to 50% of the average annual flow for passage through the lower and middle reaches of rivers, and up to 70% for passage up headwaters streams.
Stream flow also dictates the amount of spawning area available in any stream by regulating the area covered by water and the velocities and depths of water over the gravel beds (Bjornn and Reiser 1991). Decreasing stream flow exposes more gravel and reduces the area suitable for spawning. A number of studies have documented the importance of stream flow in the amount of available spawning habitat (Collings 1972,
Figure 18. Estimated Pebble Mine water usage in billions of gallons per year (NDM Inc. 2006, Moran and Galloway 2007, ADNR 2008a).
0
10
20
30
40
11 billion gallonsanchorage
35 billion gallonsPebble mine
1.4 billion gallonsred Dog mine

62
salmon redds in areas of groundwater upwelling was significantly higher (84%) than in redds where no groundwater was detected (66%)(Garrett et al. 1998). Temperatures in upwelling sites 2.4° to 2.6° C above stream temperature accelerated rates of development, protected embryos from freezing, and increased fry survival. Bull trout (Salvelinus confluentus) select zones of upwelling within the stream reaches they inhabit, although when spawning, females dig redds in areas with down-welling (Baxter and Hauer 2000).
Over the life of the mine, Northern Dynasty has applied to take a total of approximately 136 cfs of ground and surface waters from the three watersheds that drain the site (NDM Inc. 2006a, 2006b, 2006c). Under the 78-year scenario considered in Ghaffari et al. (2011), this could add up to over 300 billion cubic feet of water during that period. Predicting the effects of such a massive reduction in headwater water quan-tity on fish production at a broader scale is complex and imprecise. However, there is little question that the total loss of fish habitat in the mine area, coupled with reduced availability of ground and surface waters below the mine and tailings ponds, will reduce spawn-ing and rearing habitat, as well as fish production. An ecological risk assessment completed by The Nature
are spawning (ADFG 2008b). From January through March, when surface runoff slows or stops, ground-water is the primary source of critical winter flows for incubating salmon eggs and over-wintering juve-niles. The temperature of groundwater is very stable compared to surface water and is equal to the average annual temperature of the ground surface, which in turn is approximately equal to the mean annual air temperature (Douglas 2006). Removing or reducing groundwater would reduce summer and winter stream flows, increase summer stream temperatures, and reduce winter water temperatures—all of which would be detrimental to salmon and their food supplies.
Groundwater from the mine area is the source of many of the seeps and upwelling areas in streams cur-rently used by spawning salmon (NDM Inc. 2005). Sites with upwelling groundwater are preferentially selected by salmon for spawning (Garrett et al. 1998, Baxter and McPhail 1999, Malcolm et al. 2004). In northern rivers, low surface flows, low temperatures, and freez-ing are threats to egg and alevin survival, and salmon seek areas of upwelling for spawning (Leman 1993). For example, upwelling groundwater was detected in nearly 60% of Taku River (Alaska) sockeye salmon redds (Leman 1993). Egg-to-fry survival in kokanee
Figure 19. Effects of Groundwater Pumping. Groundwater directly affects the productivity of salmon-bearing streams by: (1) sustaining stream base flows and moderating water level; (2) providing stable temperature regimes; (3) providing nutrients and inorganic ions; and (4) providing stable spawning habitat. The massive withdrawal of groundwater required to service the mine threatens all of these values (© Elizabeth Morales).
Theabundantwetlands,lakes,and ponds indicate high ground water levels. Water pumped from the ground
water system will lower the water table and alter the direction of water movement.
reducing ground water levels wouldreducestreamflows,increasesummerstreamtemperatures,andreduce winter water temperatures—all of which would be detrimental to salmon and their food supplies.
reduced water table

63Chapter 5: Potential Effects of the Pebble Mine on Salmon
Conservancy (Ecology and Environment, Inc. 2010) summarized the impacts of ground and surface water withdrawals, which would include 33 square miles of drainage area lost, including 68 miles of stream (14 of which are designated in the Anadromous Waters Catalog), plus an additional 78 stream miles that would “exhibit some form of flow reduction in the three watersheds evaluated.”
Finally, as highlighted throughout this report, if there is no discharge from the mine as planned, all of the water withdrawn, minus evaporation, would ulti-mately be stored in the tailings storage facilities along with billions of tons of mine waste. However, as stated earlier, the technical literature fails to provide any examples of metal-mine tailings impoundments/storage facilities that have not leaked some volumes of con-taminants over the long-term (Ripley et al. 1996, IIED 2002, Lottermoser 2007, Moran 2007).
Temperature
Changes in water temperature as a result of pro-posed surface and ground water appropriations are also likely to affect salmon habitat in Upper Talarik Creek and the North and South Forks of the Koktuli River. Water temperature is one of the most important factors governing the well-being of stream ecosystems and salmon populations (Spence et al. 1996, Myrick and Cech 2004). Salmon body temperatures are the same as the temperature of the ambient water, and they are adapted to the relatively narrow temperature regimes in their home stream habitats (Knudsen et al. 1999). Temperature affects the timing of adult and juvenile salmon migrations, spawning, egg incubation, metab-olism rate, food consumption, growth rates, behavior, and resistance to disease and parasites (Spence et al. 1996). The temperature of an aquatic ecosystem also affects the amount of dissolved oxygen in the water, the rate at which algae and aquatic plants photosynthesize, and the rates at which terrestrial litter becomes suitable as a food source for aquatic macroinvertebrates.
Water temperature affects the egg incubation, metab-olism rate, food consumption, growth rate, maturation, resistance to disease and parasites, and emergence timing of aquatic insects (Hynes 1970). Thus, temperature is an important factor governing the number and types of food organisms available for salmon. Temperatures above or below normal home stream temperature ranges can add biological, physical, or chemical stresses, possibly resulting in habitat avoidance, reduced growth, greater susceptibility to disease, and lower survival.
Additional temperature increases associated with climate change should also be considered when deter-mining allowable water temperatures resulting from development of the Pebble Mine. Because salmon in
Bristol Bay are genetically adapted to a cold tempera-ture regime, even small water temperature increases as a result of mining, coupled with projected temperature increases of 3° to 9°C from climate change, could mark-edly reduce salmon survival and production in affected streams (Rouse et al. 1998, Kyle and Brabets 2001, Perry et al. 2007). Climate change is projected to sig-nificantly diminish the ranges of many populations of anadromous and resident salmonids in the contermi-nous United States and has already altered many species’ ranges globally (Parmesan and Yohe 2003, Flebbe et al. 2006, Battin et al. 2007, Rieman et al. 2007).
The ADEC (2006) temperature criteria do not provide a high level of protection for salmon. The cri-teria state that “[temperatures] may not exceed 20°C at any time. The following maximum temperatures may not be exceeded, where applicable: migration routes 15°C, spawning areas 13°C, rearing areas 15°C, and egg and fry incubation 13°C.” Maximum allowable temperatures under this standard are all at the upper end of optimum temperatures for more southern stocks of salmon, which have genetic adaptations for higher water temperatures. Some life functions that are par-ticularly sensitive to temperatures are not addressed. For example, temperatures above 12° to 15°C have been reported to impair Chinook salmon smolting (McCullough et al. 2001). In addition, Chinook eggs have been reported to survive temperatures between 1.7° and 16.7°C, but mortality greatly increases near the temperature extremes. The ADEC criterion for fry and egg incubation is 13°C; however, the highest sur-vival rates for steelhead and rainbow trout eggs and alevins occur between 5° and 10°C, and mortality is
AccordingtoADECcriteria,temperatures may not exceed:
20˚ at any time
15˚ for migration routes and rearing13˚ for spawning areas and egg
and fry incubation10˚
5˚
0˚
Highest survival rates for steelhead and rainbow trout eggs and alevins
Increased mortality for Chinook eggs
Increased mortality for migrating sockeye; impaired Chinook smolting
ADEC standards are set at the upper end of optimum temperatures for more southern stocks of salmon. Potential increases due to climate change are not taken into consideration. ºc
Figure 20. Effects of water temperature on salmonids (McCullough et al. 2001, Myrick and Cech 2004, ADEC 2006).

64
leaks resulting from human error, floods, landslides, and earthquakes would add to those sediment levels.
Sediment enters water bodies naturally in undis-turbed watersheds at moderate levels and at a wide range of particle sizes that contribute to increased salmon habitat complexity. However, major disruptions of aquatic ecosystems occur when the sediment deposi-tion rates or volumes of suspended sediment become excessive or chronic (Martin and Platts 1981, Bryce et al. 2008, 2010). For salmon specifically, increased sedi-ment levels impair life functions and reduce survival and production over time (Crouse et al. 1981, Reeves et al. 1993). Very high concentrations of sediment can kill adult salmon, eggs, and larvae. Lower concentrations increase mortality rates and cause adverse behavioral effects (Newcombe and MacDonald 1991), including adverse effects on feeding, predator avoidance, and reproduction (Figure 21) (Birtwell 1999).
Turbidity affects salmon by altering their physiol-ogy, behavior, and habitat, all of which may lead to physiological stress and reduced survival rates (Bash et al. 2001). Based on a review of the scientific liter-ature by Trasky (2008) and as summarized in Table 6, acute toxic effects of suspended solids on adults, juveniles, eggs, and larvae have been reported within an extremely large range (20 to 202,000 ppm). Death occurred within 1 to 504 hours, depending on concen-tration, duration, life stage, and species. Chronic effects, such as growth reduction, stress, and gill tissue damage, have been reported for suspended sediment concentra-tions in the 3 to 1,500 ppm range. Detrimental effects occurred within three to 42 days of exposure to elevated levels of suspended sediments. Behavioral effects, such as avoidance of turbid areas, interference with homing behavior, and reduced feeding, occurred as the result of exposures in the 5 to 650 ppm range.
Suspended and deposited sediments also have direct behavioral effects on (acute or chronic) biota and reduce the productivity of salmon habitat (USEPA 2006). Sedimentation rates above natural levels
significantly increased at the extremes (Myrick and Cech 2004). Mortalities to returning adult salmon from sockeye salmon virus are high at temperatures from 12.2° to 15°C, but the ADEC standard for adult migra-tion routes allows increases up to 15°C (Figure 20).
5.5 Sediment and TurbidityNumerous studies have shown that mining can
produce significant sources of bedload sediment and can cause suspended solids to enter aquatic ecosys-tems (Moran and Wentz 1974, Martin and Platts 1981, Jennings et al. 2008). As preliminarily proposed, the Pebble Mine and it's associated facilities would gener-ate and be required to manage a tremendous amount of sediment from land clearing and gravel extraction associated with virtually all of the major elements of the plan, including construction of: the tailings storage facilities and open pit mine; roads, pipelines, the mill, power plant, housing, and other infrastructure; the Cook Inlet deep-water port facilities; and several miles of large earth-fill dams to enclose the tailings reservoirs (NDM Inc. 2005, Knight Piesold Consulting 2006a, 2006b, Ghaffari et al. 2011). Although it is assumed that modern sediment control measures would be required, sediment levels throughout streams in the mine area and road/pipeline corridor would increase during mine construction and operation (Martin and Platts 1981, Ruediger and Ruediger 1999). The eventual spills and
Suspended particles (parts per million)
susPended sediMents
Effects Interval
20–202,000 ppm acute toxic effects on adults, juveniles, eggs, and larvae
Death occurred within 1–504 hours
3–1,500 ppm Chronic effects such as growth reduction, stress, and gill tissue damage
Detrimental effects within 3–42 days
5–650 ppm Behavioral effects such as avoidance of turbid areas, interference with homing behavior, and reduced feeding
Table 6. Effects of Suspended Sediment on Salmonids (Trasky 2008).
Figure 21. Effect of turbidity on freshwater fish. Newcombe and MacDonald (1991) reviewed the scientific literature on suspended sediment effects and concluded that the effect of turbidity on sal-monids is related to both the concentration of suspended sediment and the duration of exposure. In addition, the frequency of pollution episodes, ambient water quality, species and life history, life stage, and the presence of disease organisms may all affect the toxicity of suspended solids (Newcombe and MacDonald 1991).

65Chapter 5: Potential Effects of the Pebble Mine on Salmon
between fry emergence success in westslope cutthroat trout (Oncorhynchus clarki) and the percentage of sub-strate material less than 6.35 mm in redds. Following current USEPA guidance, Bryce et al. (2010) deter-mined that for salmon, minimum-effect levels were 5% for percent fines (≤0.06 mm) and 13% for percent sand and fines (≤2 mm), both expressed as a real percentage of the wetted streambed surface (Cantilli et al. 2006). For chief salmon prey organisms (aquatic macroinver-tebrates that live on stream bottoms and are thus more sensitive to sedimentation), the minimum-effect levels for the two sediment size classes were 3% and 10%, respectively (Bryce et al. 2010). The Alaska criterion also does not address behavioral or synergistic effects between sediment and other stressors on salmon.
Similarly, the ADEC (2006) criterion for turbidity, which states, “[Turbidity] may not exceed 25 NTU (nephelometric turbidity units) above natural condi-tions; for all lake waters, may not exceed 5 NTU above natural conditions,” does not provide a sufficient level of protection for salmon and salmon habitat. Harmful effects to both salmon and benthic organisms have been documented at levels below the 25 NTU increase allowed in streams (Bash et al. 2001). Many other states, including Minnesota, Washington, and California, allow much smaller increases in turbidity in cold-water salmon streams than Alaska does. Minnesota allows 10 NTU above background. California’s standard states, “[W]here natural turbidity is between 1 and 5 NTU, increases shall not exceed 1 NTU. Where natural tur-bidity is between 5 and 50 NTU, increases shall not exceed 20%.” Washington only allows “6 NTU over background turbidity when the background turbidity is 50 NTU or less or more than a 10% increase in turbid-ity when the background turbidity is greater than 50 NTU” (ODEQ 2005).
Even with modern erosion-control measures, sedi-ment and turbidity in streams in the Pebble Mine area, road/pipeline corridor, and port site are likely to increase. Suspended solids that enter streams from any of these sites may contain other organic and inorganic materials that are harmful to salmonids and aquatic life (Lenhardt and Lehman 2006). These include hydrocar-bons; nitrates from blasting; heavy metals from dust, mineral processing, and tailings storage areas; chemi-cals used in processing ore and oil; and grease from machinery and fuel spills. Elevated levels of turbidity and suspended solids may act in concert with other pol-lutants such as disease pathogens, heavy metals, and hydrocarbons, to increase harmful effects above that of each individual pollutant (Berry et al. 2003, Moran 2007). Because settleable and suspended solids usually enter surface waters from non-point sources, the effects will be difficult to measure and control.
decrease the carrying capacity of lakes and streams by clogging spawning gravels, smothering food organisms, and changing the species composition of benthic com-munities (Hall 1986, Waters 1995, Reiser and White 1998, Zweig and Rabeni 2001, Kaller and Hartman 2004, Carlisle et al. 2007, Fudge et al. 2008, Bryce et al. 2010). Excess fine sediments were reported to be a major stressor of fish and macroinvertebrate assem-blages in the western United States and of macroinver-tebrates nationally (Stoddard et al. 2005, Paulsen et al. 2008). Two of the most important indirect effects of elevated levels of suspended sediment are the loss of epiphyton (attached algae) through shading and the loss of epiphytic invertebrates due to abrasion and clogging (Berry et al. 2003). The scientific literature indicates that the invertebrates that stream-dwelling salmon feed on are more sensitive to turbidity than juvenile and adult salmon. Benthic invertebrate popula-tions declined 50% to 77% when exposed to increases of 8 to 62 ppm suspended solids (Rosenberg and Wiens 1978, Wagener and LaPerriere 1985). In addition, ele-vated levels of suspended solids often shift invertebrate populations from preferred grazing to burrowing taxa that are less available to salmon. A large decline in primary production and food organisms as a result of turbidity will be reflected in a decline in salmon popula-tions, even though the fish may not be directly harmed.
The current Alaska Water Quality Standard for sed-imentation reads: “In no case may the 0.1 mm to 4.0 mm fine sediment range in those gravel beds exceed a maximum of 30% by weight.” This standard does not provide sufficient protection to salmon. In a study of Atlantic salmon spawning habitat in a Scottish river, researchers found that when fine sediment less than 2 mm in diameter reached 20% by mass (for this purpose, mass and weight can be considered the same), egg mor-talities reached as high as 85% (Soulsby et al. 2001). Weaver and Fraley (1993) found an inverse relationship
Beaver pond at the headwaters of the Kvichak River (photo by Erin McKittrick).

66
5.6 Predictions versus Performance in Maintaining Water Quality
The past history of other recently-permitted sulfide mines and data from Northern Dynasty indicate two things: (1) the Pebble Mine will produce acid mine drainage and other forms of water quality contami-nation, and (2) substantial releases of contaminated effluents into local waters will occur during operations or after closure (NDM Inc. 2005, Kuipers et al. 2006, Moran 2007). Such incidents could take numerous forms; acid and other mine drainages from the mine pit and underground workings could contaminate ground-water and seep into the South Fork Koktuli or Upper Talarik Creek, or pollutant-laden water could leak from tailings dams into the North or South Fork of the Koktuli River. These or numerous other scenarios could eliminate aquatic life for many kilometers downstream; the extent of the damage varying with the volume and toxicity of the discharge. As described in this chapter, even small increases in copper and other metal levels in streams draining the Pebble Mine site could reduce or eliminate salmon and resident fish populations or cause secondary effects, such as habitat avoidance, reduced resistance to disease outbreaks, or habitat degradation. Because of the size of the Pebble Mine and the amount of waste stored on site, the effect of a large-scale release from a tailings dam failure could extend as far as the main-stem Nushagak River or Iliamna Lake (Ecology and Environment, Inc. 2010). Long-term experience from actual metal-mine operations indicates, however, that the most costly impacts are likely to result from the slow, semi-invisible, chronic seepage of contaminants from the wastes that will be stored on-site forever.
Pebble Limited Partnership has promised to employ considerable safeguards to control acid mine drainage and other adverse impacts at the site. Nevertheless, the mining industry has a poor history of accurately pre-dicting its performance. Kuipers et al. (2006) investi-gated the industry’s success in predicting water quality
outcomes from mining operations. They compared the actual impacts of mining on water quality with the mine developers’ earlier predictions of expected perfor-mance in environmental impact statements and related analyses.
The authors of this study concluded the following:
• 100% of the mines predicted compliance with water quality standards before operations began (assuming pre-operations water quality was in compliance).
• 76% of the mines that were studied in detail (25 mines) exceeded water quality standards due to mining activity.
• Mitigation measures predicted to prevent water quality exceedances failed at 64% of the mines studied in detail.
• 85% of the mines near surface water with elevated potential for acid drainage or contaminant leaching exceeded water quality standards.
• 93% of the mines near groundwater with elevated potential for acid drainage or contaminant leaching exceeded water quality standards.
• Of the sites that did develop acid drainage, 89% had predicted low acid drainage potential initially or offered no information on acid drainage potential.
This research tracked actual impacts years and decades after the developers’ assessments. To ensure the continued health of one of the world’s most productive salmon ecosystems, PLP will have to maintain one of the largest toxic impoundments in the world in perpe-tuity . In considering the PLP’s projections of “no net loss” of fisheries over this time frame, strong consid-eration should be given to the industry’s demonstrated inability to accurately project water quality impacts over far shorter horizons (Todd and Struhsacker 1997, NRC 2005, Kuipers et al. 2006, Septoff 2006).
Confluence of the Nushagak and Mulchatna Rivers (photo by Erin McKittrick).

67Chapter 5: Potential Effects of the Pebble Mine on Salmon
Sockeye salmon in Bristol Bay (photo by Ken Morrish, Fly Water Travel).

68
Nushagak River Basin (photo by Wild Salmon Center).
69Chapter 6: Pebble Mine Permitting Process
activities affect the “public interest,” the agency has very broad discretion in permitting large mine activi-ties (ALASKA STAT. § 38.05.035(e)(6)).
Further, the ADNR is guided by a statute that instructs it to prefer the land use that “will be of the greatest economic benefit to the state and the develop-ment of its resources” (ALASKA STAT. § 38.05.850(a)). This has resulted in a large mine permitting process that is likely to favor the rapid economic growth typically resulting from intensive short-term resource extraction over longer-term economic development derived from the sustainable use of natural resources. Though design changes are often required throughout the permitting process, as a result of this statutory direction, a large mine project that has begun the permitting process has never been rejected by the State of Alaska (ADNR 2008b).
In 2006, Northern Dynasty submitted 11 prelimi-nary permit applications to the ADNR, including five to build large earthen-fill dams or embankments to contain waste from the mine and six to obtain appropriations of ground and surface waters from the Koktuli River and Upper Talarik Creek (ADNR 2008c). However, NDM requested that the ADNR delay adjudication of the applications indefinitely, thereby suspending public review (ADNR 2006). PLP now expects to initiate the permitting process in 2012.
Alaska Coastal Management Program
The Alaska Coastal Management Program (ACMP)—authorized by the Coastal Zone Management Act of 1972 and federally approved by the National Oceanic and Atmospheric Administration (NOAA) in 1979—is a voluntary state program created to enable the state and local districts to influence federal develop-ment projects within Alaska’s coastal zone and obtain federal funds to develop and administer coastal pro-grams (ADNR 2011, LaRoche and Shelton 2011). Until recently, the ADNR’s Division of Coastal and Ocean Management was required to conduct a review process to ensure that proposed or federally-permitted coastal development activities are consistent with state stan-dards and the district policies of approved coastal pro-grams (AAC Title 11, § 110; ADNR 2011). Twenty-five of the 28 local districts that elected to participate in the
Chapter 6
Pebble Mine Permitting Process
Before the Pebble Limited Partnership (PLP) can proceed with the Pebble Mine project, it must obtain federal and state permits related to development, including construction of tailings dams; siting and con-struction of a new power source; development of roads, transmission lines, slurry and waste transmission pipes; and construction of a deep-water port. According to PLP, the Pebble Mine project will be subject to at least 67 different local, state, and federal permits (PLP 2009b). These and other requirements described in this chapter may appear to be adequate safeguards to ensure that Bristol Bay’s wild salmon ecosystems are not adversely impacted. However, they may in fact be insufficient due to limitations in Alaska’s large mine permitting process and related land use statutes and regional plans. This chapter highlights these and other concerns as they relate to some of the key elements of the permitting process.
6.1 State Process and Regulatory Requirements
Alaska's Large Mine Permitting Process
The Alaska Department of Natural Resources (ADNR) is the lead agency for “all matters relating to the exploration, development, and management of mining” (ALASKA STAT. § 27.05.010(b)). The Agency’s Office of Project Management and Permitting coordinates the permitting activities of the Large Mine Project Team, which comprises numerous Alaska state agencies, including the Alaska Department of Fish and Game (ADFG), the Department of Environmental Conservation, the Department of Transportation and Public Facilities, the Department of Commerce, Community and Economic Development, the Department of Law, and the Department of Health and Social Services (ADNR 2008b). The primary goal of the team is to coordinate the timing and completion of required state permits, from pre-permitting to post-closure (ADNR 2008b).
In designating the ADNR as the “lead agency” with respect to mining in Alaska, the Alaska State Legislature failed to mandate a clear standard for the ADNR to meet in coordinating mining activities on state lands. The agency must merely “provide for maximum use of state land consistent with the public interest” (ALASKA STAT. § 38.04.005(a)). Since what constitutes the “public interest” is not clearly defined, and since the ADNR is now statutorily exempted from providing written findings as to how proposed mining-related
The Bristol Bay watershed is essential to the health, environment and economy of Alaska . Gathering data and getting public input now, before development occurs, just makes sense .
—Dennis McLerran, EPA Regional Administrator Region 10 (EPA 2011c)

70
local implementation efforts of the ACMP have state-approved district coastal management plans, including Bristol Bay Borough and Bristol Bay Coastal Resource Service Area (Alaska State Legislature 2010).
Since its inception, the ACMP underwent revi-sions that significantly altered the original intent of the program. In 2003 in response to an initiative proposed by Governor Frank Murkowski at the urging of mining and other development interests, the Alaska State Legislature transferred the ACMP from the governor’s office to the ADNR, eliminating the Coastal Policy Council and centralizing decision-making authority for approving coastal district management plans and reviewing consistency determinations with the ADNR commissioner (Gray 2005, Epler 2011b). The state leg-islature also revised the applicable ACMP statutes to (1) remove consideration of air and water quality matters from consistency review consideration, (2) eliminate a citizen’s right of judicial enforcement, (3) reduce the boundaries of local coastal plans, and (4) require the ADNR to rewrite ACMP regulations affecting the con-sistency review process, statewide standards, and dis-trict plan criteria (ALASKA STAT. §§ 46.39.010–.040, Gray 2005).
In 2004, the ADNR revised the ACMP regulations, substantially restricting local districts’ ability to craft local enforceable standards. The ADNR set statewide standards as the ceiling and eliminated local districts’ ability to establish policies for matters “adequately addressed” by state and federal agencies. The ADNR also reduced the effectiveness of statewide standards by weakening criteria for habitat conservation and subsis-tence, and precluding the applicability of certain stan-dards and district policies to federal lands and waters (Gray 2005).
Changes to the wetlands standard, in particular, could have a major impact on the consistency review determination for the Pebble Mine project. The ADNR significantly narrowed the wetlands standard from the
previous regulations, which required that wetlands be managed “to assure adequate water flow, nutrients, and oxygen levels and avoid adverse effects on natural drainage patterns, the destruction of important habitat, and the discharge of toxic substances,” to merely requir-ing that projects “avoid, minimize, or mitigate signifi-cant adverse impacts to water flow and natural drain-age patterns” (AAC Title 11, § 80.130(a)(3); AAC Title 11, § 112.300(b)(3); Alaska State Legislature 2010). In its review of the State’s plan in 2008, the EPA stated, “While the old standard made achieving consistency extremely difficult, the current standard makes protect-ing the ecological integrity of the coastal habitats nearly impossible . . . because the functioning of a habitat such as a wetland is not solely dependent on maintaining water flow and natural drainage patterns” (USEPA 2008; Alaska State Legislature 2010). The Alaska Department of Fish and Game expressed similar con-cerns in its reevaluation of the ACMP (ANDR 2008c, Alaska State Legislature 2010).
The Alaska Coastal Management Program expired on June 30, 2011 and the ADNR’s Division of Coastal and Ocean Management was dissolved (ALASKA STAT. § 44.66.020(a)), ADNR 2011). During the 2010 and 2011 legislative sessions, there were numerous attempts by the coastal districts, the Parnell adminis-tration, and members of the Alaska State Legislature to revamp the coastal management program and extend it (Epler 2011a). Proposals covered a broad spectrum, including (1) a year-long extension that would provide more time to revise the ACMP to increase local enforce-ment authority, (2) a six-year extension of the program as is, and (3) a compromise bill (H.B. 106) that would give local communities more input in coastal develop-ment proposals in their districts without giving them veto authority over projects of “statewide interest” (Epler 2011b). The first two proposals did not gain much traction in the legislature. While H.B. 106 passed the House, the Senate version of the bill failed to pass before the Alaska State Legislature adjourned in May 2011 (SitNews 2011).
Since none of the ACMP bills passed during the June 2011 legislative session, it will likely take two to three years to get the program up and running again (SitNews 2011). During that time, coastal development proposals, including mining projects, will fall under federal purview (Epler 2011d). Whether the Pebble Mine project will be subject to state and local review under the ACMP depends largely on how the large mine permitting process and the ACMP reauthoriza-tion timelines coincide.
Bristol Bay Area Plan
Alaska land use plans provide a road map to the ADNR regarding the use of state land, determining
Frying Pan Lake (photo by Erin McKittrick).

71Chapter 6: Pebble Mine Permitting Process
allowable land uses and whether land is open or closed to mineral staking (ADNR 2008b). Generally, all state lands are open to mineral location unless specifically closed (AAC Title 11, § 97). The ADNR commissioner is required to designate land uses, which are classified as general use, primary designated use, or co-designated use (ALASKA STAT. § 38.05.300, ADNR 2005).
The Bristol Bay Area Plan (BBAP) is the primary land use plan for state lands in Bristol Bay, including lands in the proposed Pebble Mine project area. In 1984, the ADNR classified nearly all 12 million acres of uplands and shorelands in the BBAP as “wildlife habitat,” primarily as a co-designated use. However, in its 2005 revision of the BBAP, the ADNR reduced the area designated as habitat for fish and wildlife by 90%—from 12 million acres to less than 800,000 acres. The ADNR also reclassified mining as a blanket “co-designated use” unless the land is closed to mineral entry. Since a significant portion of the plan area has no secondary or co-designated uses listed, including 9.4 million acres classified as “resource management land,” the plan largely favors mining as the preferred use. In effect, the revised BBAP prohibits other uses not spe-cifically listed or designated if they are considered to be in conflict with mining (ADNR 2005; Nondalton et al., No. 3DI-09-46 CI [Alaska Super. Ct. 3rd Jud. Dist. at Dillingham, June 9, 2009]).
Currently, the legality of the 2005 BBAP is being chal-lenged in Alaska state court by six federally recognized tribes, the Alaska Independent Fishermen’s Marketing Association, and Trout Unlimited (Nondalton et al., No. 3DI-09-46 CI [Alaska Super. Ct. 3rd Jud. Dist. at Dillingham, June 9, 2009]; AA 2009a; TU 2010). If the court requires that the 2005 land use plan be rewrit-ten, the development of a new land use plan could sig-nificantly extend the timeline for the Pebble permitting process (AA 2009a). If no such revision is required, the ADNR will continue to lead the state permitting process with wide discretion and without clear conservation standards (Nunamta Aulukestai and TU Alaska 2009).
Anadromous Fish Act
The Anadromous Fish Act mandates that the ADFG Commissioner specify the “various . . . streams or parts of them that are important for the spawning, rearing, or migration of anadromous fish” (ALASKA STAT. § 16.05.871(a)). Once a stream is added to the Anadromous Waters Catalog (AWC), the ADFG Commissioner can require a developer whose plans will affect the designated waters to provide complete “specifications for the proper protection of fish . . . in connection with the construction or work, or in connec-tion with the use” (ALASKA STAT. § 16.05.871(c)(2)). If such plans are deemed “insufficient for the protection
Bristol Bay sockeye salmon (photo by Bob Waldrop).

72
every “obstruction . . . built across a stream frequented by salmon or other fish . . . a durable and efficient fishway” must be provided and must be kept “open, unobstructed and supplied with enough water to admit freely the passage of fish through it” (ALASKA STAT. § 16.05.841). However, “[i]f a fishway over a dam or obstruction is considered impracticable by the com-missioner because of cost, the owner of the dam or obstruction” is merely required to compensate for the loss by (1) paying a fee agreed upon by the commis-sioner into the state fish and game fund, (2) donating land and funding, as agreed upon by the commissioner, for construction, operation, and maintenance of a fish hatchery and related infrastructure, or (3) enter-ing into an agreement with the commissioner to pay into the state fish and game fund to support the expan-sion, maintenance, and operation of existing hatcheries within a reasonable distance of the dam or obstruction (ALASKA STAT. § 16.05.851).
6.2 Federal Statutory and Regulatory Requirements
National Environmental Policy Act
The National Environmental Policy Act (NEPA) requires the completion of an environmental impact statement (EIS) for major federal actions that may
of fish,” the commissioner can deny approval. If denied, the applicant may challenge the finding and be granted a hearing (ALASKA STAT. § 16.05.871 (d)(2)).
Only about half of the “waters” in Alaska that are important for anadromous fish are identified in the AWC largely because they have never been surveyed due to their remoteness and because the statutory stan-dards are vague and without statutory definition as to when, how, and under what circumstances the commis-sioner may make this designation (Parker et al. 2008, ADFG 2011b). As described previously in this report, recent efforts (2008–2010) to catalog salmon-bearing waters in and around the Pebble prospect resulted in the nomination of 103 miles of previously undocumented salmon-bearing streams to the state’s AWC. Further nominations of Bristol Bay water bodies are likely if and when additional surveying occurs, which could require alterations to PLP’s proposal or result in project denial. However, to date no commissioner has denied approval of any project based on these considerations.
Fishway Act
The construction of tailings dams, roads, and other mining infrastructure will create formidable obsta-cles to fish passage due to significant stream diver-sion and blockage. The Fishway Act states that if the ADFG Commissioner determines it necessary, for
Stream near the Pebble Mine claim (photo by Steve Baird).

73Chapter 6: Pebble Mine Permitting Process
if another federal agency can show compelling reasons of national policy for an extension (40 C.F.R. § 1506.10(d)). Given the massive scope of the proposed Pebble project, which will likely contain volumes of complex scientific data and tens of thousands of pages of documentation, the Corps would be well advised to grant a comment period extension. While an extension will not necessarily enable the public to adequately parse the EIS, it will at least enable a more thorough review.
Although an EIS is meant to serve as a guiding docu-ment for federal permitting review, it is also the only real opportunity for the general public to comment on most of the required Alaska state permits. The ADNR par-ticipates as a cooperating agency in the NEPA process, using the EIS process to assist in its permit adjudication process and to facilitate public comment (40 C.F.R. § 1506.2, USEPA 2003, ADNR 2010b). Only two Alaska state statutes and regulations require independent public notice and comment periods for permits related to large-scale mining (Parker et al. 2008).
Clean Water Act
According to PLP’s initial proposal, 99% of the materials removed from mining operations will be waste that must be stored in reservoirs contained by one or more massive tailings dams. The solid waste held in these reservoirs will provide significant contamination
significantly affect the environment (NEPA § 4332(C)). NEPA applies to all decisions that have a federal nexus—those that involve the use of federal funds, the need for federal approval in the form of permits, or are located on federal land (40 C.F.R. § 1508.18). The NEPA process will likely be triggered when PLP applies for dredge and fill permits under Section 404 of the Clean Water Act (CWA) (PLP 2009a).
In issuing CWA Section 404 wetland fill permits, the U.S. Army Corps of Engineers (the Corps) is required to evaluate the environmental impacts related to the entirety of the project under NEPA (not just the area affected by the wetland fill permit) if the jurisdictional waters are dispersed throughout the project site, and the project could not go forward without the permits (White Tanks Concerned Citizens, 563 F.3d at 1033, 1039). An EIS evaluating the impacts of the entire Pebble Mine project will be required for two reasons. First, jurisdictional waters are dispersed throughout the Pebble project site such that development of any of the tailings storage facilities or stream diversion chan-nels, wells, and devices proposed to dewater the pit and extract ground and surface waters for mine processes would not be possible without affecting those waters. Second, the Pebble Mine project could not go forward without related CWA Section 404 permits.
Though the requirement to develop an EIS under NEPA was intended to be an action-forcing mechanism to ensure compliance with the substantive goals of the Act, it is considered largely a procedural requirement by the courts. The U.S. Supreme Court has taken a def-erential review of final agency decisions under NEPA, giving the agencies broad discretion “to decide how to implement a decision once the required environ-mental review is complete, even if the chosen course is not the most environmentally sound” (National Environmental Policy 1969; Alfano 2009; Department of Transportation, 541 U.S. 752, 775; Robertson, 490 U.S. at 332, 350). According to the Supreme Court, “[O]nce an agency has made a decision subject to NEPA’s procedural requirements, the only role for a court is to insure that the agency has considered the environmen-tal consequences; it cannot interject itself within the area of discretion of the executive as to the choice of the action to be taken” (Strycker’s Bay Neighborhood Council, Inc., 444 U.S. at 223, 227-228; Kleppe, 427 U.S. at 390, 410 n. 21). Accordingly, NEPA is limited in scope and requires that environmental impacts are taken into consideration and documented, but not nec-essarily prevented.
The public comment period for an environmental review under NEPA is limited to 90 days for a draft EIS and 30 days for a final EIS (40 C.F.R. § 1506.10(b)). However, the Corps may extend the comment period
This tributary feeds into Talarik Creek, the proposed location of the open pit (photo by Erin McKittrick).

74
violations of state water quality standards, (2) violates toxic effluent standards or prohibitions under CWA Section 307, (3) jeopardizes the continued existence of species listed under the Endangered Species Act or adversely modifies critical habitat, or (4) violates requirements to protect federally designated marine sanctuaries (40 C.F.R. § 230.10(b)(1-4)). Further, CWA Section 404(b)(1) guidelines require permit denial if the project will cause or contribute to significant degrada-tion of the waters of the U.S. (40 C.F.R. § 230.10(c)). Significant degradation is defined as including, among other things, significant adverse effects “on life stages of aquatic life and other wildlife dependent on aquatic ecosystems, including the transfer, concentration, and spread of pollutants or their byproducts outside of the disposal site through biological, physical, and chemical processes” (40 C.F.R. § 230.10(c)(2)).
CWA Section 404(b)(1) guidelines prohibit dis-charges of dredged and fill material if there is “a prac-ticable alternative to the proposed discharge which would have less adverse impact on the aquatic eco-system, so long as the alternative does not have other significant adverse environmental consequences” (com-monly referred to as a less environmentally damag-ing practicable alternative, or LEDPA) (40 C.F.R. § 230.10(a)). An alternative is considered “practicable”
and control issues that will be scrutinized by the Corps and the Environmental Protection Agency (EPA) under Section 404 of the Clean Water Act (CWA) once the permitting process is initiated.
CWA Section 404(a) authorizes the Corps or an authorized state to issue permits for discharge of dredged or fill material at specified sites in waters of the United States (U.S.) (CWA § 404(a),(h)). Michigan and New Jersey are currently the only states authorized to issue Section 404 permits in nonnavigable waters, so the Corps retains this authority in Alaska, along with jurisdiction over tidal and navigable waters and adja-cent wetlands (USEPA 2011d).
According to CWA Section 404(b)(1) guidelines, “[D]redged or fill material should not be discharged into the aquatic ecosystem, unless it can be demon-strated that such a discharge will not have an unac-ceptable adverse impact either individually or in combination with known and/or probable impacts of other activities affecting the ecosystems of concern” (40 C.F.R. § 230.1(c)). “The degradation or destruc-tion of special aquatic sites, such as filling operations in wetlands, is considered to be among the most severe environmental impacts” (40 C.F.R. § 230.1(d)). A dis-charge is prohibited if it: (1) causes or contributes to
The Clean Water Act appliess not only to municipal water supplies, but also to fisheries and wildlife habitat (photo by Ken Morrish, Fly Water Travel).

75Chapter 6: Pebble Mine Permitting Process
been submitted to or approved by the Corps, or veto the Corps’ Section 404(b)(1) permit approval (CWA § 404(c), 40 C.F.R. § 231.1). According to EPA regula-tions, “Unacceptable adverse effect means impact on an aquatic or wetland ecosystem which is likely to result in significant degradation of municipal water supplies (including surface or groundwater) or significant loss of or damage to fisheries, shellfishing, or wildlife habitat or recreation areas” (40 C.F.R. § 231.2(e)). In the pre-amble to CWA Section 404(c) regulations, the EPA stated that “where it is possible it is much preferable to exercise this authority before the Corps . . . has issued a permit, and before the permit holder has begun opera-tions” (Denial or Restriction of Disposal Sites, Section 404(c) Procedures, 44 Fed. Reg. at 58,077). The EPA has only exercised its Section 404(c) authority 13 times since 1972 and only once preemptively (USEPA 2009b and 2009c).
The EPA does not need to wait to see the details of an application to determine that unacceptable effects will result from mining operations in the Bristol Bay watershed. In crafting the Section 404(c) regulations, the EPA noted that even in the absence of a permit application identifying specific discharge proposals, “there are instances where a site may be so sensitive and valuable that it is possible to say that any filling of more than X acres will have unacceptable adverse effects” (Denial or Restriction of Disposal Sites, Section 404(c) Procedures, 44 Fed. Reg. at 58,076). Based on the significance of the Bristol Bay watershed for wild salmon populations, as detailed in chapter 4, and the serious and potentially catastrophic impacts that the large-scale mining activities proposed by PLP would have on Bristol Bay’s salmon ecosystems, as described in chapter 5, the use of the Bristol Bay watershed as a disposal site for dredge and fill activities will likely result in unacceptable adverse effects.
While the EPA may need more information to come to its own conclusion, it is important to note that a
if it is available to the applicant and capable of being implemented “after taking into consideration cost, existing technology, and logistics in light of overall project purposes.” This includes areas not currently owned by the project applicant that “could be reason-ably obtained, utilized, expanded or managed in order to fulfill the basic purpose of the proposed activity” (40 C.F.R. § 230.10(a)(2)).
The “basic project purpose” is the primary reason for the proposed project and is used to determine whether the applicant’s project is water dependent. “Water dependency” means that the proposed project requires access, proximity to, or siting within a special aquatic site (sanctuaries and refuges, wetlands, mud-flats, vegetated shallows, coral reefs, and riffle and pool complexes) to fulfill the basic purpose of the project (40 C.F.R. § 230.40–45, 40 C.F.R. § 230.10(a)(3)). If a project is not water dependent, the regulations presume that less damaging practicable alternatives outside of special aquatic sites are available, unless the permit applicant can demonstrate otherwise (40 C.F.R. § 230.10(a)(3)).
Though gold, molybdenum, and other precious metals would be recovered, copper extraction is the basic purpose of the Pebble Mine project, based on the above definition. Mining the Pebble deposit is not a water-dependent activity. As such, the analy-sis of alternatives should include locations outside of special aquatic sites where copper (and/or gold) could be extracted with less potential environmental harm. Further, if it is practicable for the project applicants to “obtain, utilize, expand or manage” other deposits, then those deposits should be considered in identifying the LEDPA (40 C.F.R. § 230.10(a)(2)).
If there is no practicable alternative that meets these requirements, the applicant must take steps to “mini-mize potential adverse impacts of the discharge on the aquatic ecosystem” (40 C.F.R. § 230.10(d)). Minimizing adverse impacts can be achieved through avoidance of certain habitats or spawning seasons, habitat devel-opment and restoration techniques, or compensatory mitigation on- or off-site (40 C.F.R. § 230.75).
Although Congress gave the Corps authority to issue CWA Section 404 permits, it gave the EPA the authority to review and veto Corps decisions. As articu-lated in CWA Section 404(c), if the EPA Administrator determines that the discharge of mine tailings and other dredge and fill activities will have an “unacceptable adverse effect on municipal water supplies, shellfish beds and fishery areas (including spawning and breed-ing areas), wildlife, or recreational areas,” the admin-istrator may either preemptively prohibit the specifi-cation of a site before a Section 404(b)(1) permit has
Steller’s eider, listed as threatened under the Endangered Species Act (photo by U.S. Fish & Wildlife Service).

76
proposed determination by the EPA does not represent a judgment that any particular dredge and fill activ-ity will result in unacceptable adverse effects. Instead, a proposed determination simply indicates that the administrator believes the issue should be explored. Further, proof of adverse impacts is not required at the time of initiating the 404(c) process; a concern that unacceptable adverse effects may result is sufficient.
In May 2010, six federally recognized Southwest Alaska Tribes requested that the EPA exercise its pre-emptive veto authority under CWA Section 404(c) to protect the Kvichak and Nushagak watersheds in Bristol Bay from metallic sulfide mining, including the Pebble Mine (Murphy 2010). The EPA Administrator has not yet initiated the 404(c) process by notifying the Corps or PLP of the agency’s intention to issue a public notice of a Proposed Determination to withdraw the Kvichak and Nushagak drainages from discharge of dredged or fill material (USEPA 2009c). However, in February 2011, the EPA announced that it will “conduct a scien-tific assessment of the Bristol Bay watershed to better understand how future large-scale development proj-ects may affect water quality and Bristol Bay’s salmon fishery” (USEPA 2011c).
Endangered Species Act Consultation
Section 7 of the Endangered Species Act (ESA) requires that any federal agency proposing to issue a permit for a project that may affect a threatened or endangered species must first consult with the National Marine Fisheries Service (NMFS) and/or the U.S. Fish and Wildlife Service (USFWS) and prepare a biological assessment (ESA § 1536 (a)(3), NOAA 2010). If the biological assessment concludes that there will likely be an adverse effect on the ESA-listed species, the agencies must formally consult and develop a biological opinion to assess the likelihood that the proposed action would “jeopardize the continued existence of” the species or destroy or adversely modify its critical habitat (ESA § 1536 (a)(2), USFWS and NMFS 1998, NOAA 2010).
While no salmon populations are listed as threat-ened or endangered in Alaska, there are two known ESA-listed species in Bristol Bay: the short-tailed alba-tross (endangered), and the Steller’s eider (threatened) (USFWS 2010a, 2010b). If the biological opinion results in a “jeopardy” finding for either of these two species, the project cannot move forward unless “rea-sonable and prudent alternatives” can be identified to avoid jeopardy (ESA § 1536 (b)(3)(A)).
6.3 Additional Requirements for Pebble Mine Infrastructure
Deep Water Port
Shipment of the ore concentrate to market via ocean freighters will require the construction of a deep-water port in Cook Inlet, which will trigger federal marine and species protection statutes. Since this deep-water port would be located in marine waters, it would require statutory investigations by the NMFS to ensure that the port site would be in compliance with Section 7 of the Endangered Species Act, the Marine Mammal Protection Act (MMPA), and the Fish and Wildlife Coordination Act (FWCA), and that no essential fish habitat would be affected (MMPA §§ 2–207, FWCA §§ 661–667e). These activities may also require a coastal zone consistency review by the ADNR’s Division of Coastal and Ocean Management, as discussed in section 6.1 of this report. In addition, under Section 103(a) of the Marine Protection, Research, and Sanctuaries Act (MPRSA), the Corps must determine that this process will not “unreasonably degrade or endanger . . . the marine environment, ecological systems, or economic potentialities” (MPRSA § 2).
Power Source and Transportation
As described previously in this report, the Pebble Mine will require considerable power (Figure 22), which will likely drive construction of new power plants at the mine and port sites (Ghaffari et al. 2011). Because there is not enough natural gas in the region to supply the plants, a new terminal may have to be constructed to import liquefied natural gas (LNG) (AA 2009a). This would require siting and construction permits for the facility and the LNG terminal.
In addition to the transmission of power, the trans-portation of products, supplies, waste, and people creates regulatory challenges because of the signifi-cant distance these resources must travel and the varied ownership of lands over which these activities will occur. Because the mine site is over 100 miles from the projected port site, the ADNR will need to approve the necessary permits, rights-of-way, and ease-ments on state lands for the 86-mile road, roughly 200
Bristol Bay salmonid (photo by Wild Salmon Center).

77Chapter 6: Pebble Mine Permitting Process
miles of transmission lines (including undersea cables from the power plant that would require tideland leases), and accompanying slurry and waste transmis-sion pipes (Parker et al. 2008). As for the 50 miles of this proposed route that are within Bristol Bay Native Corporation (BBNC) boundaries, the PLP would need to persuade the BBNC to revoke its June 2009 reso-lution that denied development of the transportation route through their lands. Additionally, for any points at which the road might cross navigable waters, a con-struction permit would be required from the U.S. Coast Guard (PLP 2009b).
6.4 Other ConsiderationsWhen PLP initiates the permitting process, it may
submit an initial design for a small mine (relative to the size of the mineral deposit) to ensure permits are secured, and then apply for expansion permits at a later date. The process of acquiring permits for a smaller mine and subsequently requesting expansion permits once the mine is operating, supported by a workforce, and paying taxes is fairly common in the mining indus-try (Ecology and Environment, Inc. 2010). This prac-tice was demonstrated in 2009 at several mines world-wide, such as the Red Dog Mine in Alaska (doubled the life of the mine from 20 to 40 years), the Keetac Mine in Minnesota (added over 2,000 acres and increased output by 33%), and the Smoky Canyon Mine in Idaho (added 1,100 acres and increased capacity by 38%) (Ecology and Environment, Inc. 2010). In addition, as described in section 2.4, approval of the initial PLP pro-posal could fuel development of other mining claims in the region. These considerations should be evaluated when assessing the permitting procedures and require-ments described in this chapter.
Thirty-six rivers, streams, and small tributaries enter the north shore of Iliamna Lake (pictured above), providing habitat to salmon and resident fish (photo by Erin McKittrick).
Figure 22. Estimated Power Usage of Pebble Mine in megawatts per year compared to cities of Anchorage and Fairbanks (Chugach Electrical Association 2009, Richardson 2011, Ghaffari et al. 2011).
432 MW/yranchorage
350 MW/yrPebble mine
296 MW/yrFairbanks and
surrounding area
0
200
400
600

78
CaSe StuDy: FailureS at alaSKa’S largeSt miNe
red dog Mine (Alaska)
Red Dog is the second largest zinc mine in the western world. It is owned by the NANA Regional Corporation, an Alaskan Native for-profit corporation, and leased to Teck Cominco Alaska Inc., a subsidiary of Teck Resources Ltd. of Vancouver, British Columbia. Red Dog’s sulfide zinc-lead-silver deposits lie in the foothills of the DeLong Mountains (part of the Brooks Range) about 90 miles north of Kotzebue, Alaska, and 52 miles from the Chukchi Sea.
The mine covers the headwaters of Red Dog Creek. The South Fork of Red Dog Creek has been converted into a 585-acre tailings impoundment held by an earth-filled dam. The North Fork enters the main stem below the mine and is still in relatively good condition. Red Dog Creek contains no fish in part due to the area's pre-existing metal concentrations. It flows 5 miles to Ikalukrok Creek, a wintering ground for arctic char. Ikalukrok then meanders for about 27 miles before emptying into the Wulik River, a major spawning stream for char and salmon.
The initial environmental impact statement stated that the mine would create no significant impacts to fishery resources (USEPA 1984). The mine started producing ore in 1989, and reports of concern about water quality and fish populations were issued before the close of the year.
Failures: • HeavymetalsreleasedintoRedDogCreek
• Airqualityviolationsandsoilcontaminationfromheavymetalsalongthehaul road to the Chukchi Sea port
• Oreconcentratespillsfromhaultrucksattheportsite
impact: • Intheearly1990s,zinc levels instreamsdrainingtheminesiteroseto
between 10 and 200 times the standard, at one point killing fish in the Wulik River 25 miles downstream (Ott 2004).
• According to the U.S. Environmental Protection Agency’s 2004 ToxicRelease Inventory, 487 million pounds of toxic compounds were released from red Dog mine, including copper and zinc, making it the highest level of toxic releases anywhere in the nation (Teck Cominco Alaska Inc. 2004, Rothe 2006).
• Intheearly1990’s,therewerealsoairqualityviolationsandsoilcontami-nation at the Red Dog Mine and along the haul road to the port on the Chukchi Sea from various sources of contaminated fugitive dust. Ford and Hasselbach (2001) found that heavy metals from dust along the haul road had contaminated mosses and soil near the road. Brumbaugh and May (2008) reported that particulates dispersed near the road in snow samples during winter in 2005 and 2006 were enriched in metals, and these par-ticulates still contributed considerable metal loadings to the nearby terrain (Teck Cominco Alaska Inc. 2008).
mitigation: In 1991, Teck Cominco Alaska rerouted Red Dog Creek into a plas-tic-lined bypass channel to isolate it from zinc contamination. The company also built a separate system to collect the underground seeps of water that travel through the mine’s rich mineral deposit as well as the rain water that flows over it. That water is collected behind a dam and run through the mine’s water-treatment system. In the years following a 1992 Compliance Order with the Alaska Department of Environmental Conservation, Teck Cominco Alaska covered its ore stockpiles, conveyor system, and haul truck beds to reduce dust contamination.
Approximately 1.4 billion gallons a year of treated water are released into Red Dog Creek. From May to October, water from the tailings impoundment
Discharge water (photo by Northern Alaska Environmental Center).
Before
ikalukrok Creek red Dog Creek
Before mining beganZinc (ppm) of samples collected:
rising Zinc levels
after
after
0 010 10020 200
acute toxicity
response of mine owners to contamination claims (from Anchorage Daily News excerpts)
october 7, 1989 (Spokeswoman) Parker said the company had nothing to do with the water.
August 16, 1990 DEC and the Department of Fish and Game have been pressur-ing Cominco Alaska Inc, the mines owner, to stop the seepage . . . Cominco has refused, contending there is no clear connection between the mine and seepage into Red Dog Creek. The previous fall, Cominco officials maintained that similar leeching was caused by unusually rainy weather. This week, a company official said this summer’s seepage was due in large part to recent dry weather, which has lowered creek levels and made mineral seepage more obvious.
August 30, 1990 The amount of zinc and other potentially harmful metals flowing into a creek near the Red Dog Mine dropped drastically after the mine’s operator moved the stream and made the other changes demanded by state agencies.
(Hulen 1990)

79Chapter 6: Pebble Mine Permitting Process
CaSe StuDy: reD DOg miNe
is treated with lime to precipitate zinc, lead, and iron and sodium sulfide to precipitate cadmium. This treatment process has the side effect of raising the concentration level of total dissolved solids (TDSs) in the water, primar-ily through calcium and sulfate ions released by the precipitating agents. The residents of the town of Kivalina, whose drinking water comes from the Wulik River, appealed a permit modification in 2004 that established new, less strin-gent limits for the mine’s discharges of TDSs (USEPA 2004). A subsequent settlement between Tech and Kivalina proposes a pipeline to carry Red Dog’s treated wastewater from the mine to the Chukchi Sea.
Cost: Toxic discharges will continue after the mine is closed (estimated in the 2030s), requiring perpetual containment, treatment, and monitoring. The State of Alaska currently holds a $154.6 million financial assurance to ensure reclamation and post-closure activities, including water treatment. The state is proposing to increase the financial assurance amount to $304.5 million (Tetra Tech 2009).
How does this compare to Pebble? Unlike the Pebble mine site, there is 100 to 600 feet of permafrost beneath the Red Dog Mine site. Because of the permafrost, there is little shallow groundwater flow compared to surface water flow at Red Dog (USEPA 2009d), and the ground water linkages to mine waste and discharge are limited. On the other hand, near the proposed Pebble
• 487millionpoundsoftoxiccompoundsreleased(highestintheU.S.)
• 143,000acresofnationalmonumentcontaminatedwithleadandcadium
• Streamzinclevelsat10to200timesthestandard
• Airqualityviolationsandsoilcontaminationatthemineandalongthehaulroad,withdustat27timestheacceptablelevels
• Very fewfish remaining in IkalukrokCreek, andfishkilledas far as25miles downstream in the Wulik river
Red Dog Mine (photo by Northern Alaska Environmental Center).
Mine area, porous glacial till and little to no permafrost allow a direct connec-tion between ground and surface waters. Therefore,atthePebbleMinesite,there is a high risk of contaminated ground water from the mine carrying contamination to faraway ground and surface waters. The same contamina-tion that is occurring at Red Dog is likely to happen at the Pebble Mine site, but on an even larger scale.
Compare Red Dog Mine’s record 487 million pounds of toxic compounds with Pebble’s estimated 10.8 billion tons of tailing waste. Currently, the next highest mining discharges in Alaska after Red Dog are 44 million pounds and 6 million pounds at mines near Juneau and Fairbanks. Teck Cominco officials counter that the toxic releases are merely the tons of waste rock collected from the mine and that all discharges are permitted discharges, contained and regulated by state and federal agencies (Dobbyn 2005).
red Dog Pebble
mine area 0.5 sq mi 28 sq mi
Pit depth 986 ft 1,700ft
Water used 1.4 billion gal./yr 35 billion gal./yr
Power used 350 mW/yr
Waste produced 243 million tons 10.8 billion tons

80
Alaskan fishermen in Bristol Bay (photo by Ben Knight).

81Chapter 7: Economic Valuations of a Wild Salmon Ecosystem
ounces of gold (NDM Ltd. 2010b, PLP 2011b). Using the U.S. Geological Survey’s 2010 American market prices indexed to 2011 dollars (all mineral values herein are indexed to the PPI/Commodity Data/Metals and Metal Products through September of 2011), the deposit is worth $476.84 billion (USDL 2011a, USGS 2011a, 2011b, 2011c). However, considering the his-toric volatility of mineral prices, a more apt measure may be the value of the deposit based on indexed median mineral prices from 1975 to 2010 for gold and copper, and from 1991 to 2010 (the longest data set available) for molybdenum, converted to 2011 dollars (to adjust for inflation). Under this median measure, the deposit is worth $276.6 billion (USDL 2011a, USGS 2011a, 2011b, 2011c). This value is not “profit,” however, because it does not account for the costs necessary to obtain it (i.e., costs to build the roads, transmission network, power plant, mine sites, milling and refining operations, wages etc.). These costs are reflected in net income estimates for the mine, which are discussed below.
It should be noted that the following discussion also does not adjust net income to account for the inevita-ble—and potentially substantial—costs associated with remediation and clean-up. Section 7.7 provides some historical information on these costs at other mine sites.
7.2 Regional Economic Expenditures in Wild Salmon
Local expenditures related to the use or harvest of the wild salmon ecosystem drive the local economy in terms of job and wage creation (Duffield et al. 2007). The expenditures related to the wild salmon ecosystem that drive Bristol Bay’s economy are comprised of trad-able items (commercial and guided sport fishing) and items connected to the ecosystem that are not currently traded in any market (e.g., subsistence fishing, big game sport hunting, and wildlife tourism). Table 7 summa-rizes regional economic expenditures on services gener-ated by Bristol Bay’s wild salmon ecosystem as described by Duffield (2009). In 2008, these expenditures fell
Chapter 7
Economic Valuations of a Wild Salmon Ecosystem
At first glance, the Pebble deposit appears vastly more valuable than the wild salmon ecosystem of Bristol Bay. Yet a deeper analysis reveals that as a renewable resource, the value of a wild salmon ecosys-tem in supporting recreational, commercial, and sub-sistence fisheries may, in fact, be greater over time than the extraction of non-renewable minerals. Recent sci-entific research underscores the economic importance of the Bristol Bay wild salmon ecosystem by concluding that high population diversity, which is driven by abun-dant complex habitats, buffers against population fluc-tuations, providing a reliable source of income to local communities (Schindler et al. 2010). This stands in stark contrast to the boom and bust cycles common to extractive activities such as hard-rock mining (Doukas et al. 2008).
Due to the complex interactions among salmon, people, and habitat, no one economic metric can express the wide-ranging value of the wild salmon eco-system. Thus, a proper illustration of the wild salmon ecosystem value requires multiple frameworks (Loomis 1999, Peck 1999, Duffield et al. 2007, Helvoigt and Charlton 2009).
Following a brief summary of the Pebble Mine’s value in section 7.1, this analysis presents four different frameworks for considering the value of the Bristol Bay wild salmon fishery. The first framework values the use of the ecosystem, which is measured by quantifying the annual regional expenditures and economic significance of the wild salmon ecosystem on the local economy (section 7.2). The second framework estimates the per-petual net present value (NPV) of using the ecosystem based on willingness-to-pay surveys (section 7.3), while the third framework attempts to quantify the passive use—or intrinsic—value of conserving an area, inde-pendent of human use value (section 7.4). Finally, the fourth framework compares tax revenues that will stay in Alaska to demonstrate the economic impacts derived from the respective wild salmon and mining-based industries (section 7.5).
7.1 Comparing the Economic Values of a Wild Salmon Ecosystem and the Pebble Mine
Based on the most recently available estimates, the Pebble deposit holds 80.6 billion pounds of copper, 5.6 billion pounds of molybdenum, and 107.4 million
During the 2010 [salmon] season, six compa-nies canned, 23 companies exported fresh product, 27 companies froze, and three companies cured salmon in Bristol Bay . In addition, 27 companies exported fish by air, and a total of 36 processors/buyers reported that they processed fish .
– 2010 Bristol Bay Area Annual Management Report (ADFG 2011a).

82
Regional Expenditures of Sport Fishing
Sport fishing in Bristol Bay accounts for between $78.84 and $175.55 million (adjusted) in annual local expenditures (Duffield 2009, USDL 2011b). Based on survey data, each year, nonresident sport fishermen make an estimated 12,966 trips and spend an average of $4,344 per trip, while resident sport fishermen make an estimated 19,488 trips and spend an average of $395 per trip (Duffield et al. 2007, USDL 2011b). Among those surveyed (especially nonresident anglers, who spend much more than resident anglers), the wild, natural, isolated nature of the region was key to their decision to fish in the Bristol Bay region. Of these anglers, 76.8% disapprove of developing road access. Initiating development that affects the sport fishermen’s experience risks compromising the viability of related suppliers, the service industry, and accompanying jobs (Duffield et al. 2007, Helvoigt and Charlton 2009).
Regional Expenditures of Subsistence Harvest, Big Game Sport Hunting, and Wildlife Tourism
Each year, Bristol Bay supports a large subsistence harvest (averaging 142,320 fish from 1989 to 2008) that results in $8.35 million (adjusted) in local expendi-tures (Duffield et al. 2007, Duffield 2009, Morstad et al. 2010, USDL 2011b). Goldsmith et al. (1998) estimated that Native family units spend an average of $3,135 per year on subsistence harvest equipment, while non-Native family units spend an average of $818 per year (adjusted) (USDL 2011b). Similar to subsistence har-vesters, the Bristol Bay area big game sport hunting and wildlife tourism industries are closely tied to the health of the wild salmon ecosystem. Based on estimates, big game sport hunting annually results in $11.73 million in local expenditures, while wildlife viewing and tourism results in $19.96 million in expenditures (adjusted) (Duffield 2009, USDL 2011b).
7.3 Willingness to PayInstead of documenting traditional economic indi-
cators like expenditures and related jobs and wages, the net economic value (NEV) framework monetizes the willingness to participate in the wild salmon eco-system economy. Discounting this annual NEV “cash flow” over time yields the NPV, or “perpetual” eco-nomic value, of the wild salmon ecosystem.
Net Economic Value of the Commercial Fishery
The NEV of the commercial fishery is computed by evaluating the average adjusted prices paid for com-mercial fishing permits on the open market; this value represents the best metric for understanding how much commercial fishermen think it is worth to fish in Bristol Bay each year (Duffield et al. 2007). From 1999 to
between $317.9 and $572.5 million (Duffield 2009), with an estimated direct expenditure of $392.4 million. Adjusted to the CPI-U/Anchorage/Average/All Price through September 2011 (to determine 2011 constant dollars), the Bristol Bay wild salmon ecosystem pro-duces estimated annual regional economic expendi-tures of $414.7 million, which results in 4,838 annual average jobs and $206.83 million in annual gross income (Duffield 2009, USDL 2011b). Representing 73.7% of all jobs in the economy—28% of which are filled by local Bristol Bay residents—the private job sector in Bristol Bay is almost entirely dependent on the wild salmon ecosystem (Duffield 2009). Largely due to this predictable and sustainable job market, the Bristol Bay Borough has enjoyed an average annual unemploy-ment rate that is 1.1% lower than the annual Alaska average from 1990 to 2010 (ADLWD 2010).
Table 7. Summary of regional economic expenditures based on wild salmon ecosystem services (in millions) (Duffield 2009). Note that the data presented in this table were collected in 2008. These data have been adjusted for inflation (to 2011) in the accompanying narrative.
ecosystem service
regional economic expenditures
estimated direct expenditures/ sales per year low estimate High estimate
Commercial fish wholesale value
$ 280.0 $ 280.0 $ 368.5
Sport fisheries 74.6 0 166.1
Sport hunting 11.1 11.1 11.1
Wildlife viewing/ tourism
18.9 18.9 18.9
Subsistence harvest expenditures
7.9 7.9 7.9
Total direct annual economic impact
392.4 317.9 572.5
Regional Expenditures of Commercial Salmon Fishery
The Bristol Bay commercial salmon fishery is the largest sockeye salmon fishery in the world and the most valuable in Alaska (Duffield et al. 2007). From 2000 to 2008, the total salmon run averaged 36 million fish, and the catch averaged 23.11 million fish (ADFG 2011a). In 2008, the commercial fishery’s wholesale value (ex vessel value plus added value of processing fish in Bristol Bay) was between $295.93 and $389.46 million (Duffield 2009), adjusted to 2011 values. In addition to this economic value, the commercial fishery mimics the natural harvest cycle while employing many of the Alaska Native residents who comprise almost 70% of Bristol Bay area communities (USBOC 2008, Duffield 2009).

83Chapter 7: Economic Valuations of a Wild Salmon Ecosystem
2007, USDL 2011b). This results in an annual NEV for subsistence fishing of $77.8 to 160 million. For sport fishing, Duffield et al. (2007) estimated a net willingness to pay for residents at $373 per trip and non-residents at $530 per trip (adjusted). Multiplying these amounts by the estimated number of annual trips yields a net willingness to pay for sport fishing of $15.82 million. The final components in this framework are sport hunting and wildlife tourism. The annual net willing-ness to pay for sport hunting and tourism is $2.06 million and $2.11 million, respectively (McCollum and Miller 1994, Duffield et al. 2007, USDL 2011b).
Total Net Economic Value of the Bristol Bay Wild Salmon Ecosystem
The combined annual NEV of the wild salmon ecosystem is $108.9 to $202.2 million. This estimated annual net cash flow can then be used to compute the NPV of the salmon ecosystem economy. Because this valuation spans generations, unlike typical NPV anal-ysis, the Environmental Protection Agency (USEPA 2000) recommends using a discount rate as low as 0.5%, while Weitzman (2001) recommends a 1.75% constant rate. Based on the estimated NEV ranges, the NPV of the wild salmon ecosystem is between $6.22 and $11.56 billion (using the annual NEV range esti-mates, at a 1.75% constant rate over perpetuity [per-petual NPV = annual NEV/rate]). Using the annual NEV range estimates at the lower discount rate (0.5% constant rate over perpetuity), the NPV of the wild salmon ecosystem is $21.76 to $40.45 billion (Table 8).
Table 8. Net economic value and net present value of wild salmon ecosystem with NPV calculated for two discount rates.
net economic Value (neV) and net Present Value (nPV)
low-end (2009 $) High-end (2009 $)
Annual NEV of wild salmon ecosystem
$109 million $202 million
Net present value (1.75%, Perpetual)
$6.2 billion $11.6 billion
Net present value (0.5%, Perpetual)
$21.8 billion $40.5 billion
7.4 Non-market Passive Use ValueOften, nonmarket passive use values of an environ-
mental resource—the value of saving a place for future generations (bequest value) or for the sake of its exis-tence (existence value)—are far higher than the use values described earlier (Helvoigt and Charlton 2009). Although these valuations are controversial because of their variance from traditional legal concepts of stand-ing and damages, Congress has legitimized passive
2008 in Bristol Bay, the Alaska Commercial Fisheries Entry Commission (ACFEC) issued an average of 1,874 drift-net permits (worth an adjusted average of $70,524 per permit) and 997 set-net permits (worth an adjusted average of $26,453 per permit), yielding an aggregate adjusted commercial fishery participa-tion value of $158.52 million (ACFEC 2010, USDL 2011b). Because these permit rights are perpetual, the aggregate value must be amortized to derive an annual value. As suggested by Duffield et al. (2007), with the two types of permits fully amortized in perpetuity at 7% and 14%, the NEV for the commercial fishery is $11.1 and $22.2 million, respectively (ACFEC 2010, USDL 2011b). In assessing this valuation, it is essential to note that the current willingness to pay is depressed by a host of macroeconomic conditions, including a significant drop in demand for wild salmon in Japan, the emergence of global farmed salmon as a cheaper alternative, and the global recession’s impact on con-sumer price points (Asche et al. 2005, Duffield et al. 2007, Duffield 2009). Yet if decreasing global fish supply and increased demand for sustainable wild products conspire to create a consumer surplus for wild Alaska salmon (meaning consumers are willing to pay more for the wild salmon than “market price”), the annual NEV of participating in the commercial fishery could rise (as open market permit values increase) and increase aggregate NPV favorably.
Net Economic Value of the Subsistence Fish Harvest, Sport Fishing and Hunting, and Wildlife Tourism
This NEV estimate is based on the willingness of subsistence fishermen to pay for the fish they harvest. It is estimated that roughly 2.1 million pounds of salmon are harvested each year in Bristol Bay for subsistence (Duffield 2009), and that each harvester would be willing to pay between $32.46/lb and $66.75/lb (note, the lower bound is set at an original estimate in Duffield et al (1997), and the upper bound is adjusted to reflect inflation adjusted estimate from 2005) (Duffield et al.
Photo by Ben Knight.

84
from the FBT and SMA taxes. In addition, using 1975-2009 data, adjusted to 2011, Bristol Bay's wild salmon economy generates an average of $158.6 million in gross income from drift gillnet usage (ACFEC 2011, USDL 2011b). Based on this average, the SDT generates up to $1.6 million per year in additional tax revenue for Alaska. In total, the Bristol Bay fishery economy may raise up to $13.37 to 18.37 million per year in state tax revenue. To put the value of Bristol Bay in context, in 2010 Alaska as a whole raised $22.4 million in fisheries related taxes (ADR 2010a).
In comparison, based on 2000 to 2009 industry financials for Anglo-American (50% share in the Pebble Mine) and Rio Tinto (9.9% share, at the time), the estimated aggregate net income from the mine’s 2011 median value—(2000–2009 net income/gross revenues %) x (estimated median gross value of mine)—would be $43.81 billion (AA 2009b, Rio Tinto 2009, NDM Ltd. 2010a, USDL 2011b). Yet most of this value will be realized by shareholders and the international market. In terms of revenues that will stay in Alaska, the primary source will be the Mining License Tax, levied on the net income of mining operations (annual revenues = $4,000 + 7% over $100,000 in net income [$43.81 billion]), which will total $3.07 billion overall or $39.36 million per year over 78 years (Table 10) Stickel 2007, ADR 2009, ADR 2010b).
Table 10. Estimated tax revenues for wild salmon ecosystem and the Pebble Mine.
estimated Annual local revenues from taxes
Wild Salmon ecosystem* Pebble mine**
Annual tax revenue $13.4–$18.4 million $39.4 million
*Revenue stream available in perpetuity (assuming sustained health of ecosystem)**Based on 78 years mine life scenario (see chapter 2)
damage valuation as an economic measure within statutes, such as the Comprehensive Environmental Response, Compensation, and Liability Act of 1980 (CERCLA) and the Oil Pollution Act of 1990 (Jones 1999, Peck 1999). Willingness-to-pay passive value studies were endorsed by the National Oceanic and Atmospheric Administration, upheld in Ohio v. United States Department of Interior, and used as the basis of a $1 billion settlement between Alaska and Exxon in the wake of the Valdez spill, (D.C. Circuit 1989) (Duffield 1997, Jones 1999, Duffield et al. 2007).
Based on extrapolations of data from what citizens have been willing to pay to protect regions in other areas, Goldsmith et al. (1998) estimated that the com-bined bequest and existence value of Bristol Bay fish and wildlife is between $3.18 and $6.36 billion (adjusted) (USDL 2011b). When properly constructed to account for the immense size of the Bristol Bay wild salmon run, marginal willingness-to-pay models, like Loomis (1999) for the Lower Snake River on the Oregon-Idaho border and Helvoigt and Charlton (2009) for the Rogue River in southern Oregon, could provide an avenue for future economic analysis and might yield a more substantial and refined valuation of nonmarket value than Goldsmith et al. (1998).
Table 9. Non-market Passive Use Value of the Bristol Bay wild salmon ecosystem in 2011 dollars.
non-market Passive use Value
low-end (20011 $) High-end (20011 $)
Existence + bequest value $3.2 billion $6.4 billion
7.5 Taxation and Local RevenuesAccording to ADR (2010a), a Fisheries Business Tax
(FBT) is levied on persons who process or export fisher-ies resources from Alaska. The tax is based on the price paid to commercial fishers or fair market value (when there is not an arms length transaction). A Seafood Marketing Assessment (SMA) is also levied at a rate of 0.5% of the value of seafood products processed, first landed in, or exported from Alaska. Finally, a one percent Regional Seafood Development Tax (SDT) is levied on salmon harvested by drift gillnet fishers in Bristol Bay (and these and other fishers in Prince William Sound).
Between 1985 and 2005, total production value for processors averaged about $288 million, or $335.74 million in 2011 dollars (Duffield 2009, USDL 2011b). Thus, based on this twenty year average, the Bristol Bay fishing economy may generate up to $11.75 to $16.79 million/year in tax revenue for the state of Alaska
In 2008, sport hunting and wildlife tourism in the Bristol Bay basin ac-counted for an estimated $33 million in local expenditures (Duffield 2009) (photo by Ben Knight).

85Chapter 7: Economic Valuations of a Wild Salmon Ecosystem
observed to have a negative relationship to well-being in some Native Alaskan communities (Martin 2004, Haley et al. 2008). This is likely because typical Anglo-American jobs take time away from participation in the familial, social, and subsistence activities that are vital to the well-being of these communities (Martin 2004, Haley et al. 2008). The threat posed by the Pebble Mine to the region’s Native subsistence culture is substantial. Wolfe and Walker (1987) observed that there was 69% less subsistence activity in communities with road net-works versus those communities without them.
These threats to Native subsistence lifestyles are further reflected in the polling undertaken by Craciun Research (2009), which found that 73% of residents agreed that any local jobs provided by the mine would not be worth the damage that 78% anticipate will occur to commercial and subsistence fishing. Further, 94% of residents considered it very important that there are plenty of subsistence resources such as fish for future generations, while 91% of residents considered it very important to maintain the subsistence lifestyle (Craciun Research 2009).
Despite the fact that Bristol Bay communities will likely derive only modest benefits from the extractive activities, these communities historically bear the brunt of cycles of “boom” (growth during extractive opera-tions) and “bust” (decline in population, income levels, employment, and ecological integrity after the resource has been successfully mined or collected) (Leask et al. 2001, SEACC 2007, Doukas et al. 2008). During the boom, local communities must typically expand their infrastructure and service capacities to provide the nec-essary housing, health, and transportation services for
7.6 Local Employment and Native Communities
The economic frameworks described thus far in this chapter portray the value of the wild salmon ecosystem from four different perspectives. If the mine were to damage the Bristol Bay wild salmon ecosystem, there would be large and enduring economic consequences to the region. The present economic engine of the region (the annual regional economic expenditures of $414.72 million, 4,837 annual jobs, and $206.83 million in annual gross income) would likely be derailed, while the long-term use ($6.2 to $11.5 billion), extrinsic passive use value ($3.2 to $6.4 billion, possibly more using marginal valuation methods), and tax revenue potential of the Bristol Bay wild salmon ecosystem could potentially be lost forever (Goldsmith et al. 1998, Loomis 1999, Duffield et al. 2007, Helvoigt and Charlton 2009). Therefore, the true economic value (market value plus extrinsic passive use value) of the wild salmon ecosystem should be considered before proceeding with mine development.
In addition to considering economic values through the lenses described above, policy makers and the public should also consider the application of a market economy on the subsistence-based cultures that com-prise the majority of the population in the Bristol Bay region. Although worth billions of dollars to sharehold-ers, most extractive activities undertaken in “remote rural Alaska” only result in modest economic benefits for people living in the region (Goldsmith 2007). Most of the long-term jobs are held by nonresident “com-muters” with the education and technical skills required of a major industrial development (Goldsmith 2007, Haley et al. 2008). Similarly, the majority of service contracts are provided to nonresident suppliers because most remote rural communities have not developed a service sector sufficiently advanced to meet highly tech-nical needs (Goldsmith 2007). A cross-sectional survey of Bristol Bay residents conducted by Craciun Research (2009) reinforced these findings among Bristol Bay res-idents, reporting that 71% of residents agree that most of the jobs created by the Pebble Mine would be taken by people from outside the area.
Although better road access, more settlement (and property taxes), and higher median income levels would result from construction of the Pebble Mine, the devel-opment will also impose a market economy model onto a sensitive, subsistence-based culture that has existed for thousands of years (Wolfe and Walker 1987). Huskey (1992) found that certain types of economic develop-ment promoted to stimulate local economies can inad-vertently alter and diminish the subsistence lifestyle. Likewise, increased employment has actually been
Pebble Mine drill rig (photo by Steve Baird).
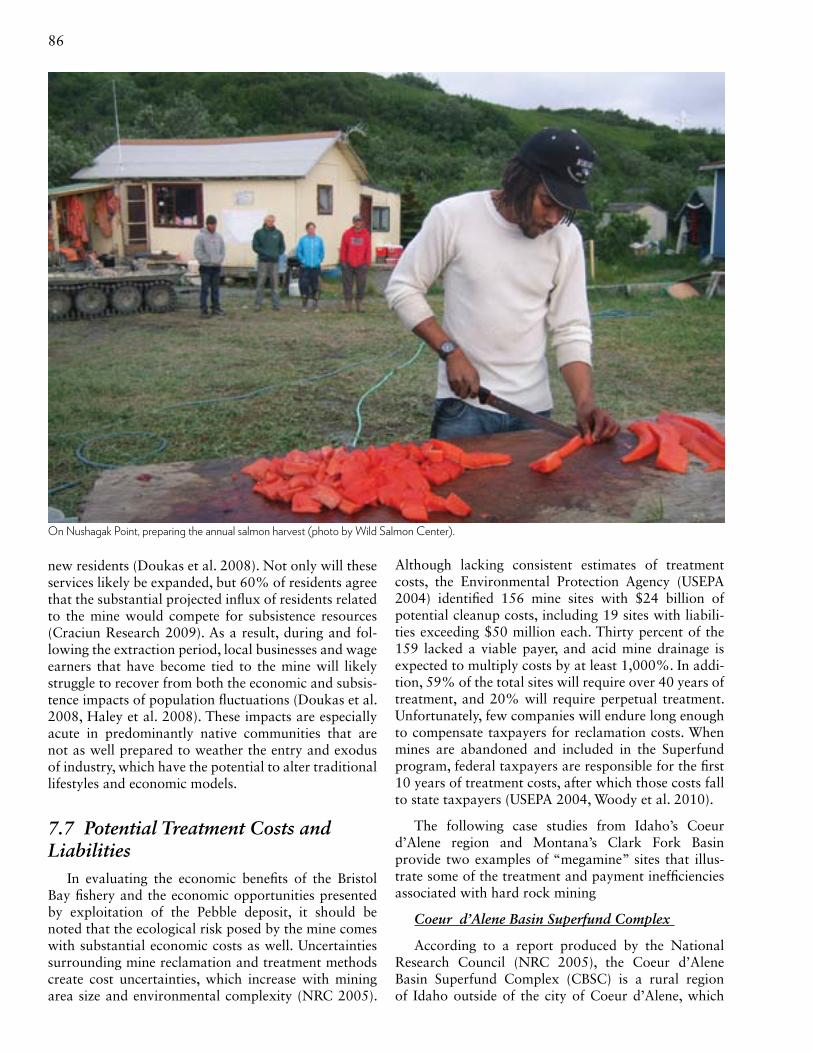
86
new residents (Doukas et al. 2008). Not only will these services likely be expanded, but 60% of residents agree that the substantial projected influx of residents related to the mine would compete for subsistence resources (Craciun Research 2009). As a result, during and fol-lowing the extraction period, local businesses and wage earners that have become tied to the mine will likely struggle to recover from both the economic and subsis-tence impacts of population fluctuations (Doukas et al. 2008, Haley et al. 2008). These impacts are especially acute in predominantly native communities that are not as well prepared to weather the entry and exodus of industry, which have the potential to alter traditional lifestyles and economic models.
7.7 Potential Treatment Costs and Liabilities
In evaluating the economic benefits of the Bristol Bay fishery and the economic opportunities presented by exploitation of the Pebble deposit, it should be noted that the ecological risk posed by the mine comes with substantial economic costs as well. Uncertainties surrounding mine reclamation and treatment methods create cost uncertainties, which increase with mining area size and environmental complexity (NRC 2005).
Although lacking consistent estimates of treatment costs, the Environmental Protection Agency (USEPA 2004) identified 156 mine sites with $24 billion of potential cleanup costs, including 19 sites with liabili-ties exceeding $50 million each. Thirty percent of the 159 lacked a viable payer, and acid mine drainage is expected to multiply costs by at least 1,000%. In addi-tion, 59% of the total sites will require over 40 years of treatment, and 20% will require perpetual treatment. Unfortunately, few companies will endure long enough to compensate taxpayers for reclamation costs. When mines are abandoned and included in the Superfund program, federal taxpayers are responsible for the first 10 years of treatment costs, after which those costs fall to state taxpayers (USEPA 2004, Woody et al. 2010).
The following case studies from Idaho’s Coeur d’Alene region and Montana’s Clark Fork Basin provide two examples of “megamine” sites that illus-trate some of the treatment and payment inefficiencies associated with hard rock mining
Coeur d’Alene Basin Superfund Complex
According to a report produced by the National Research Council (NRC 2005), the Coeur d’Alene Basin Superfund Complex (CBSC) is a rural region of Idaho outside of the city of Coeur d’Alene, which
On Nushagak Point, preparing the annual salmon harvest (photo by Wild Salmon Center).

87Chapter 7: Economic Valuations of a Wild Salmon Ecosystem
was mined for lead, zinc, gold, and silver by com-panies that included the American Smelting and Refining Company (ASARCO), then a subsidiary of ASARCO Incorporated (which was a subsidiary of Americas Mining Corporation, itself a subsidiary of Grupo Mexico). The CBSC covers three units, one of which, the Bunker Hill complex, encompassed 21 square miles. Contamination from the Bunker Hill unit entered a second unit, the 50-square-mile Coeur d’Alene Lake area, which now contains an estimated 75 million tons of sediment contaminated by metals. The CBSC was listed as a Superfund site in 1983 and included the Bunker Hill complex, most of the South Fork Coeur d’Alene River and its tributaries, the Coeur d’Alene River and chain lakes, Coeur d’Alene Lake, and anywhere mining wastes were deposited, including Washington’s Spokane River. Following designation, a series of legal proceedings ensued, with the EPA seeking $2.3 billion for cleanup costs. The suit culminated in a $436 million bankruptcy settlement for the Bunker Hill unit in 2009.
Partly because of the funding shortfall, the NRC (2005) reported that up to that time (2005), the EPA cleanup:
• Failed to adequately address metal contamination of groundwater, despite its being the major source of surface water contamination;
• Failed to rehabilitate physical habitat structure, which also precludes fish and wildlife recovery throughout the basin;
• Failed to locate adequate repositories for contami-nated sediments and soil;
• Developed treatment models based on mean flows despite flood frequencies that periodically contami-nated reclaimed areas with metals, thereby further limiting the long-term effectiveness of reclamation measures; and
• Inadequately assessed rehabilitation effectiveness on fish and macroinvertebrate assemblage structure.
The NRC (2005) concluded that it was unrealistic to a priori develop and assess comprehensive rehabili-tation measures because of environmental and reclama-tion uncertainties. Thus, despite EPA estimates of $440 million and 30 years to reduce ecological and related human health risks, such an amount will fall short of what is needed. This is due in large part to over 100 million cubic yards of contaminated wastes, which are spread across heterogeneous aquatic and terrestrial environments (NRC 2005). This broad dispersal of wastes precludes full removal and capping of contami-nated soil and treatment of contaminated water. Given the lack of ecological engineering solutions for the
CBSC, rehabilitation effectiveness, duration, and costs are only crude estimates. But the preponderance of the costs will be incurred by taxpayers—not the bankrupt ASARCO. As of 2001, costs to taxpayers of the partial cleanup totaled $212 million (Woody et al. 2010).
Clark Fork Basin
Mining and smelting in Montana’s Clark Fork Basin have impaired 119 miles of the Clark Fork River and produced the largest Superfund site in the United States (Woody et al. 2010). The contaminated area includes nearly 5 million cubic yards of contaminated tailings in the Clark Fork floodplain, a tailings pile 800 feet high over a two-square-mile area, and 1.2 million cubic yards of contaminated tailings and smelter dusts (Moran 2001). Silver Bow Creek, draining Butte, is nearly devoid of aquatic life (Hughes 1985). It has been found impossible to treat all of the contami-nated groundwater in the area, and it is contaminat-ing surface water in places. The copper mine pit (542 feet deep, 4,000 feet wide) contains about 250 million gallons of acidic (pH 2.7–3.4) water and metals (alu-minum, arsenic, cadmium, copper, zinc) and continues filling with ground and surface water seepage, requiring perpetual water treatment via an 8-million-gallon-per-day plant that cost $75 million to build and costs $10 million per year to maintain and operate. Treatment of the groundwater at the city of Butte requires a $20 million plant and annual operating and maintenance costs of $500,000. Capping the tailings pile and trans-porting the dusts are additional costs.
The EPA sued the mining company, the Atlantic Richfield Company (ARCO), a subsidiary of British Petroleum, for $680 million for water treatment, cul-minating after five years of litigation in a $187 million settlement for Clark Fork River cleanup. Fixed and per-petual costs are certain to far exceed that amount. Most costs will be incurred by taxpayers (USEPA 2011b).
Sampling a Clark Fork tributary (photo by U.S. Geological Survey).

88
CaSe StuDy: tHe true COSt OF miNiNg
Zortman and landusky Mines (Montana)
In 1979, Zortman Mining Company, a subsidiary of Pegasus Gold Corporation, reopened two historic gold mines named after the original miners’ claims—Zortman and Landusky. The mines are located side by side in the Little Rocky Mountains of north central Montana within one quarter mile of the Fort Belknap Indian Reservation. The mines lie on a divide between the sources of tributaries of the Milk and Missouri Rivers. Between 1979 and 1996, Pegasus mined about 79 tons of gold from the two mines using the cyanide heap leach pad system to dissolve the gold out of low-grade ore.
In the 1970s, Pegasus Gold Corporation was a leader in hard rock mining and the development of the cyanide heap leach process for making low-grade gold deposits profitable. Montanans in job-starved Philips County were attracted to the prospect of 300 well-paid jobs. The jobs were available for the 17-year life of the mines and served to significantly lower the unem-ployment rate in the county during that time (Maehl 2003). The mining company also claimed that it would not mine high-sulfide ore (Abel 1997).
Failures: • Between1979and1990,thestateofMontanaandtheBureauofLand
Management allowed nine expansions of the mines without a supple-mental Environmental Impact Statement. None of the expansions included provisions for mining or treatment of acid-generating (sulfide) ore (Levit and Kuipers 2000).
• It was not until 1993, when acid mine drainage entered the town ofZortman, that Pegasus was cited for violations and ordered to write a rec-lamation plan (Abel 1997). During this time frame, the mine also expe-rienced 12 cyanide spills, including one that released 50,000gallonsofcyanide solution that contaminated a local water supply (Earthworks 2011).
impact: • TheresidentsoftheFortBelknapIndianReservation,livingdownstream
from the two mines, have resorted to litigation multiple times to try to secure safe ground and surface water.
• TheMontanaDepartment of EnvironmentalQuality (DEQ) declaredthat acid mine drainage, cyanide, selenium, and nitrates impactground and surface waters that are hydrologically connected to the mines and that the impacts from acid mine drainage will continue in perpetuity.
• The DEQ also claimed that it is capturing and treating all ground andsurface waters hydrologically connected to the mines (Mitchell 2004). However, after closure, and even with mitigation, the water in the head-waters of Swift Gulch just below the mine has turned a bright orange and become more acidic, with pH declining from a near-neutral 7.5 to a highly acidic 3.7. As of 2004, the groundwater sources of seepage to Swift Gulch had not even been located or diverted to treatment (Mitchell 2004).
mitigation: After a series of lawsuits between 1993 and 1995, a Consent Decree in 1996 required Pegasus to construct water-treatment systems, pay a bond for their operation, and establish a trust for long-term operation and maintenance. In 1998, Pegasus declared bankruptcy, transferring the respon-sibility for mitigation and reclamation to state and federal taxpayers (the initial bond fund available to the state after bankruptcy was not sufficient).
The reclamation of the mine pits, waste rock dumps, and leach pads and the recontouring of the terraced hillsides helped increase the sites’ resistance to erosion, covered acid-producing materials, provided drainage, and reduced random infiltration of toxic substances (Mitchell 2004). The earth-moving portion of the reclamation task was completed in 2005.
Tons of Rock Moved
Tons of Ore Processed
Ounces of Gold
Zortman 33,395,000 19,900,000 517,400
Landusky 186,349,863 118,367,296 2,012,244
total 138,267,296 2,529,644 (79 tons)
Outcome of Zortman and Landusky Mines 1979–1996 (Maehl 2003).
• The state of Montana and the Bureau of Land Managementissued 9 permits for expansion of mine without a supplemental environment impact Statement.
• Adozencyanidespills,includingonethatreleased50,000gallonsof cyanide solution that contaminated a local water supply.
• Over1billiongallonsofacidminedrainagehavebeentreated.
• Toxicseepage,includingcyanide,nitrates,andselenium,willneedto be treated in perpetuity.
• SwiftGulchjustbelowtheminehasturnedabrightorangewithanacidicpHof3.7,deadlytofishandaquaticlife.
• Developerdeclaredbankruptcy.
• Initialbondinsufficienttocovercostofreclamation,$37millioninjustthefirstfiveyears.
Above: Zortman and Landusky Mines (photo by Bureau of Land Management).

89Chapter 7: Economic Valuations of a Wild Salmon Ecosystem
CaSe StuDy: ZOrtmaN aND laNDuSKy miNeS
Since 1999, water-treatment plants at the mine have treated over a billion gallons of acid mine drainage with lime. An additional bioreactor water-treatment plant treats the toxic seepage, including cyanide, nitrates, and selenium, from beneath the 13 dismantled heap leach pads. The treated water is sprayed on a nearby parcel of land. Treatment is also required for 80 million gallons of precipitation collected on the heap leach pads every year; it is hoped that with land reclamation this amount may be reduced to 10 million gallons (Maehl 2003, Mitchell 2004).
Costs: • The company filed for bankruptcy in 1998, transferred its remaining
assets to a new company, and abandoned the Zortman and Landusky Mines (Abel 1997).
• Landreclamationandrecontouringhavecost$9millionsince1999.
• Theyearlycostofprocessedwatermanagementandlandapplicationisabout $1 million per year in perpetuity. The construction of a bioreac-tor treatment plant to pretreat selenium cost another $3 million, bring-ing the cost of construction and the first three years of process water
management and land application to $6 million; this amount far exceeded the predicted $160,000bondingamount (Maehl 2003).
• Operatingcosts,labor,andlabanalysisin2000and2001forthetwowater-treatment plants averaged $395,000peryear. The sureties bond for the water-treatment plants was about $62,000 per year—another short-fall—and the plants must be kept operating forever (Maehl 2003).
• Through2004,MontanaDEQhasspentover$37 million for reclamation, which includes the $33 million in bond settlement funds plus federal and state funds. The trust reserve is $11 million short of what it needs to invest (in 2001) to fund water treatment after 2017 (Mitchell 2004).
How does this compare to Pebble? Comparing the Montana situation with that in the Pebble Mine District in Alaska, reveals that it will be impossible to capture all ground and surface waters hydrologically connected to mines in the Pebble Mine district because the ground near Pebble is per-manently saturated with ground and surface water that is inextricably linked in the frost-free season.
.
Of the 13 hard rock mines in Montana, 10 require water treatment in perpetuity, with closure and reclamation costs up to 100 times their initial estimates (Diamond 2006). Recently, seven large mine operators have filed for bankruptcy, leaving the state of Montana facing tens of millions of dollars of liability for mine reclamation (Levit and Kuipers 2000).
* Cost to taxpayers to date (2011) = Total reclamation cost up to $37 million in 2004 plus six years of additional water treatment costs at $1.5 million/yr = $46 million and counting.
ThE TRUE CosT of MiNiNg
1979–1996: mine OperationCorporate income over life of mine: over $1 billion(adjustedforinflation)
1993: Cited for Violations
true cost:
$47.5 million* + $1.5 million/yr in perpetuity
1999–2009: reclamation Land reclamation and recontouring: $9 million Bioreactor treatment plant: $3 millionProcess water management and land application: $1 million/yrOperating costs, labor, and lab analysis: $395,000/yrSureties bond for the water-treatment plants: $62,000/yr
2017: estimated insufficient funds to continue water treatment
miNe time liNe
1979 2019200919991989 3000
1998: Bankruptcy Declared Assets transferred
1996: Consent Decree Pegasus must construct water-treatment systems, pay bond, establish a trust for long-term operation and maintenanceInitialbond:$160,000Bond settlement: $33 million
$1 billion
$33 m
Original bond: $169,000
remainder after bond + $1.5 m/yr in perpetuity
Corporate Profit
reclamation Costs
Bond Society Pays
Key
life of mine (19 yrs)
Lifeofcontaminants(1,000+yrs)
in perpetuity
1,000+ years
Zortman and landusky Cost analysis

90
Bristol Bay salmon (photo by Ben Knight).
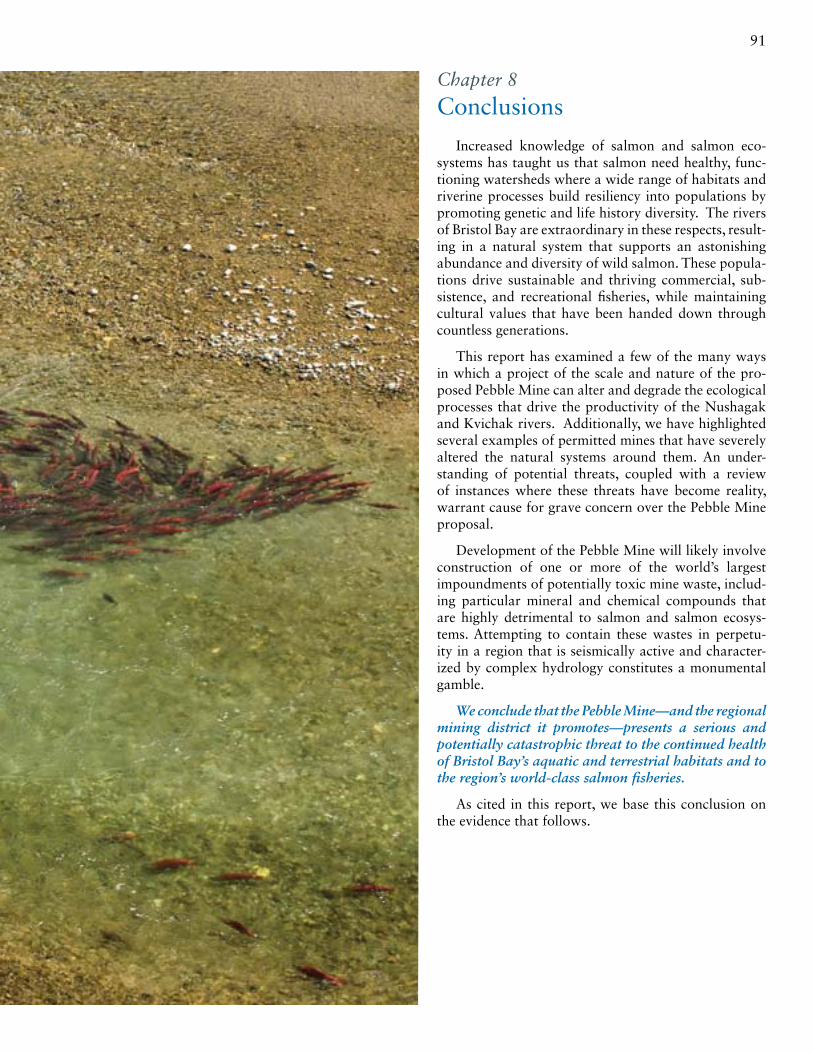
91Chapter 8: Conclusions
Chapter 8
Conclusions
Increased knowledge of salmon and salmon eco-systems has taught us that salmon need healthy, func-tioning watersheds where a wide range of habitats and riverine processes build resiliency into populations by promoting genetic and life history diversity. The rivers of Bristol Bay are extraordinary in these respects, result-ing in a natural system that supports an astonishing abundance and diversity of wild salmon. These popula-tions drive sustainable and thriving commercial, sub-sistence, and recreational fisheries, while maintaining cultural values that have been handed down through countless generations.
This report has examined a few of the many ways in which a project of the scale and nature of the pro-posed Pebble Mine can alter and degrade the ecological processes that drive the productivity of the Nushagak and Kvichak rivers. Additionally, we have highlighted several examples of permitted mines that have severely altered the natural systems around them. An under-standing of potential threats, coupled with a review of instances where these threats have become reality, warrant cause for grave concern over the Pebble Mine proposal.
Development of the Pebble Mine will likely involve construction of one or more of the world’s largest impoundments of potentially toxic mine waste, includ-ing particular mineral and chemical compounds that are highly detrimental to salmon and salmon ecosys-tems. Attempting to contain these wastes in perpetu-ity in a region that is seismically active and character-ized by complex hydrology constitutes a monumental gamble.
We conclude that the Pebble Mine—and the regional mining district it promotes—presents a serious and potentially catastrophic threat to the continued health of Bristol Bay’s aquatic and terrestrial habitats and to the region’s world-class salmon fisheries.
As cited in this report, we base this conclusion on the evidence that follows.

92
report, a vast body of scientific information confirms that very small changes in pH, copper and other metals, turbidity, sediment, temperature, or water quantity can have severe acute or chronic toxic and behavioral effects on salmon and can fundamentally alter their habitats. Copper mines that are a fraction of the size of the proposed Pebble Mine have completely eliminated salmon and other aquatic life from long stretches of formerly productive salmon streams.
2. As initially conceived, the Pebble Mine represents one of the largest mines in the world, and it has the potential to significantly and permanently degrade or destroy Bristol Bay ecosystems and adversely impact wild salmon populations.
Lying at the headwaters and hydrologic divide between the Nushagak and Kvichak River drainages, the Pebble Mine strike represents one of the largest low-grade copper deposits in the world with an ore body of roughly 10.8 billion tons. Assuming a 1% copper equivalency, the mine would generate over 10 billion tons of mine tailings. According to preliminary proposals, waste rock and tailings from the Pebble Mine would be stored behind nine miles of earth-fill dams measuring up to 740 feet high. When mining
1. The Bristol Bay basin boasts wild salmonid popu-lations of extraordinary abundance and diversity. These populations are highly vulnerable to even small changes in habitat and water quality.
The Bristol Bay basin generates hundreds of mil-lions of juvenile salmon annually, and tens of mil-lions of adults return to their natal streams to spawn. The basin’s wild sockeye salmon fishery is the largest in the world and the largest source of private-sector income in the region. The two drainages that would be directly affected by the Pebble Mine, the Nushagak and Kvichak, have historically been the largest produc-ers of sockeye, Chinook, pink, coho, and chum salmon in Bristol Bay. The Kvichak and Nushagak drainages also support economically and socially important sub-sistence fisheries for Bristol Bay residents, while pro-viding some of the most productive salmon, rainbow trout, arctic grayling, arctic char, and Dolly Varden sport fishing waters in the world. In short, these two systems play a major role in the productivity of the entire Bristol Bay terrestrial and freshwater ecosystem.
Salmon are genetically adapted to a relatively narrow and unique range of habitat and water quality parameters within their natal streams. As cited in this
A bald eagle eyes a chum salmon (photo by Amy Gulick).

93Chapter 8: Conclusions
4. Economic evaluations promoting mine develop-ment may not adequately account for the value of healthy ecosystems or the long-term costs associ-ated with clean-up. These and other factors must be fully considered as policy-makers and the public evaluate the trade-offs between short-term, non-renewable mineral resource extraction and long-term, renewable salmon production in Bristol Bay.
The true economic value (including market and non-market values) of the wild salmon ecosystem should be considered in evaluating the final Pebble Mine proposal. If the Pebble Mine—and any of the neighboring mines it fosters—damage or destroy the Bristol Bay wild salmon ecosystem, large and enduring economic consequences to the region will result. The economic engine fueled by Bristol Bay’s wild salmon ecosystems supports annual regional expenditures averaging $354.6 million, generating 5,490 jobs and $179.83 million in annual gross income. In the event of a catastrophic mining accident, the wild salmon eco-system’s long-term use and extrinsic passive use values (of $6.2 to 11.5 billion, and $3.2 to 6.4 billion, respec-tively) could be lost forever. Furthermore, hard rock mining routinely involves transferring human health, mine reclamation, and water treatment costs to state and federal taxpayers. Recouping the financial losses associated with these costs often requires engaging layers of mining companies (often foreign-owned) in years of litigation to recover even partial payments from bonding and bankrupt companies.
In addition to considering economic values through the lenses described in this report, policy makers and the public must consider the adverse impacts caused by the application of a heavy industrial (potential boom-bust) economy on subsistence-based cultures, which comprise the majority of the population in the Bristol Bay region. The values of those whose ancestries extend thousands of years within the Bristol Bay region should be recognized and given the greatest consideration.
is complete, the open-pit and underground workings could cover over three square miles to a depth of up to 5,000 feet, and an 86-mile long access road and slurry pipelines would traverse the shores of Iliamna Lake, the Newhalen River, and 35 other tributaries to the Kvichak River. Construction and operation of the Pebble Mine, mill, tailings storage facilities, access roads, pipelines, port, power plant, electrical transmis-sion lines, and associated facilities would physically destroy, dewater, or otherwise adversely impact a sub-stantial amount of salmon and resident fish habitat in the Nushagak and Kvichak River drainages.
Because the deposit is composed of sulfide ore, the mine presents a high risk of developing acid mine drain-age. This report has highlighted several instances of acid mine drainage in permitted mines after project develop-ers assured regulators that no adverse impacts would occur in surrounding aquatic ecosystems. To date, the authors of this report know of no large-scale cop-per-gold-molybdenum ore body that has been mined without the release of significant concentrations of con-taminants into nearby ground or surface waters, over the long-term. Research has confirmed that most or all recently-permitted sulfide mines have polluted ground or surface waters with acid mine drainage and metals.
3. If permitted, the Pebble Mine will enable develop-ment of a mining district many times larger than the Pebble Mine lease, substantially increasing the likelihood that mining operations will adversely impact the Bristol Bay ecosystem.
The Pebble Project is situated on state-owned land within a 186-square-mile property, which accord-ing to a Northern Dynasty fact sheet, is listed by the US Geological Survey as the world’s most extensive mineralized system. Since the establishment of the Pebble Limited Partnership (PLP) in 2007, seven dif-ferent operators have established claims to this system and initiated leases now covering 793 square miles. The exploitation of these leases will not be economi-cally feasible in this undeveloped region without the Pebble Mine infrastructure, including the roads, pipe-lines, port, energy-generating stations, and other facili-ties. Permitting of the Pebble Mine, therefore, will promote the development of a Bristol Bay mining dis-trict containing multiple mines operated under numer-ous owners and permits. The cumulative impacts of a system of mines in the Bristol Bay watershed—includ-ing Pebble—eclipse the already massive scale of the Pebble concept. Additionally, while PLP has made com-mitments to ensure the Pebble Mine will not adversely impact the Bristol Bay’s wild salmon resources, no assurances exist that other (or future) operators will hold themselves to the same dubiously high standard.
Igiugig residents on the bank of the Kvichak (photo by Erin McKittrick).
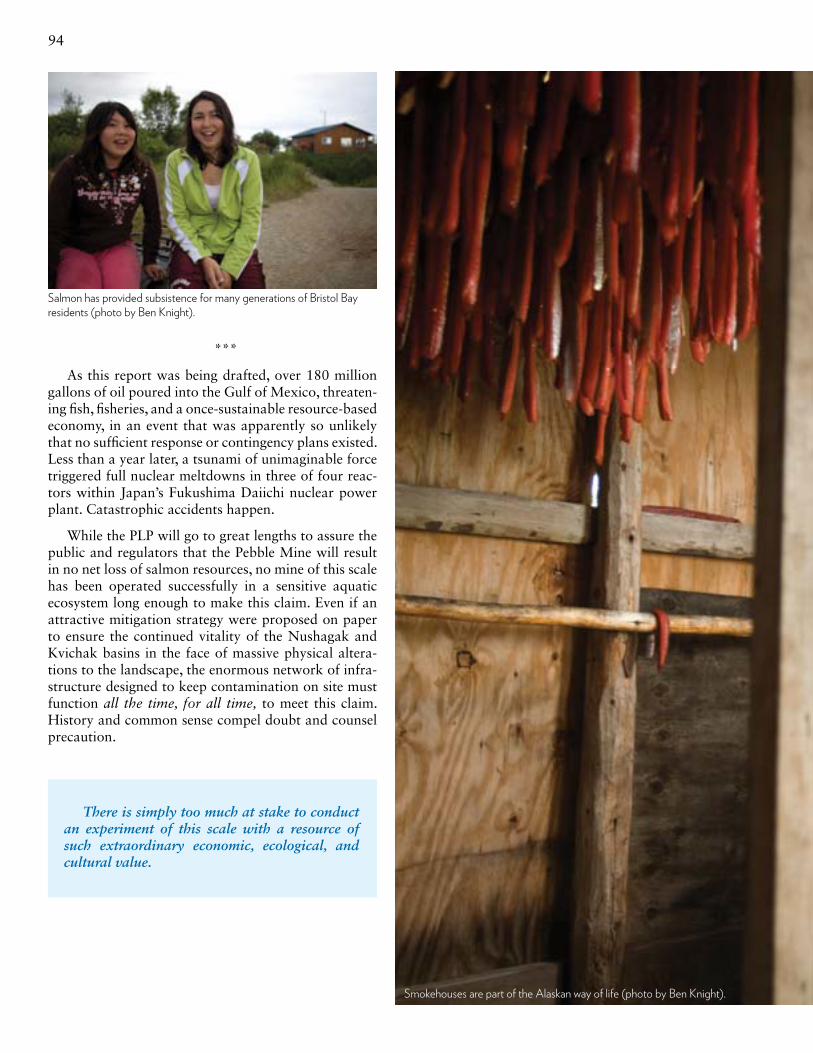
94
***
As this report was being drafted, over 180 million gallons of oil poured into the Gulf of Mexico, threaten-ing fish, fisheries, and a once-sustainable resource-based economy, in an event that was apparently so unlikely that no sufficient response or contingency plans existed. Less than a year later, a tsunami of unimaginable force triggered full nuclear meltdowns in three of four reac-tors within Japan’s Fukushima Daiichi nuclear power plant. Catastrophic accidents happen.
While the PLP will go to great lengths to assure the public and regulators that the Pebble Mine will result in no net loss of salmon resources, no mine of this scale has been operated successfully in a sensitive aquatic ecosystem long enough to make this claim. Even if an attractive mitigation strategy were proposed on paper to ensure the continued vitality of the Nushagak and Kvichak basins in the face of massive physical altera-tions to the landscape, the enormous network of infra-structure designed to keep contamination on site must function all the time, for all time, to meet this claim. History and common sense compel doubt and counsel precaution.
Smokehouses are part of the Alaskan way of life (photo by Ben Knight).
Salmon has provided subsistence for many generations of Bristol Bay residents (photo by Ben Knight).
There is simply too much at stake to conduct an experiment of this scale with a resource of such extraordinary economic, ecological, and cultural value.

95Chapter 8: Conclusions

96
Sockeye among the Alaskan fireweed (photo by Ken Morrish, Fly Water Travel).

97
Bay borough vs. Alaska statewide. Available: http://labor stats.alaska.gov/?PAGEID=67&SUBID=188. (April 2010).
ADNR (Alaska Department of Natural Resources). 2005. Bristol Bay area plan for state lands. Division of Mining, Land, and Water, ADNR. Available: http://dnr.alaska.gov/mlw/planning/areaplans/bristol/pdf/bbap_complete.pdf. (August 2010).
ADNR. 2006. Status of application packet: pebble project/application for water rights. Alaska Coastal Management Program, Office of Project Management and Permitting, ADNR. Available: http://dnr.alaska.gov/mlw/mining/largemine/pebble/2006/acmp.pdf. (October 2010).
ADNR. 2008a. Pebble project. Division of Mining, Land, and Water, ADNR. Available: http://dnr.alaska.gov/mlw/mining/largemine/pebble/waterapp.htm. (October 2010).
ADNR. 2008b. The process and requirements for large mine permit applications in Alaska. ADNR. Available: http://dnr.alaska.gov/mlw/mining/largemine/may5pptcolor6.pdf. (September 2010).
ADNR. 2008c. The process and requirements for large mine permit applications in Alaska. ADNR. Available: http://dnr.alaska.gov/mlw/mining/largemine/may5pptcolor6.pdf. (September 2010).
ADNR. 2010a. Alaska DNR state mining claims. Alaska State Geospatial Data Clearinghouse, ADNR. Available: http://dnr.alaska.gov/SpatialUtility/SUC?cmd=vmd&layerid=137. (December 2010).
ADNR. 2010b. Permitting large mine projects in Alaska. Office of Project Management and Permitting, ADNR. Available: http://dnr.alaska.gov/mlw/mining/largemine/lmpt-process2010.pdf. (July 2011).
ADNR. 2011. Alaska coastal management program (ACMP). Division of Coastal and Ocean Management, ADNR. Available: http://alaskacoast.state.ak.us/Current_News/ACMP_Fact_Sheet_2011.pdf. (June 2011).
ADR (Alaska Department of Revenue). 2009. Alaska tax division 2009 annual report. Division of Taxes, ADR. Avail-able: http://www.tax.alaska.gov/programs/documentviewer/viewer.aspx?1896f. (August 2010).
ADR. 2010a. Tax division: fisheries related taxes. Division of Taxes, ADR, Available: http://www.tax.alaska.gov/programs/programs/forms/index.aspx?60620. (December 2011).
ADR. 2010b. Tax division: mining license tax. Division of Taxes, ADR. Available: http://www.tax.alaska.gov/pro-grams/programs/statutes/index.aspx?60610. (August 2010).
Alaska State Legislature. 2010. Audit of Department of Natural Resources Alaska Coastal Management Program: part 1. Division of Legislative Audit, Legislative Budget and Audit Committee, Alaska State Legislature, Audit Control Number 10-30060A-11. Juneau, AK.
ALASKA STAT. § 16.05.841 (2006). Fishways and Hatcher-ies. Fishway Required.
ALASKA STAT. § 16.05.851 (2006). Fishways and Hatcher-ies. Hatchery Required.
ALASKA STAT. § 16.05.871(c,d) (2006). Protection of Wa-terways for Anadromous Fish. Protection of Fish and Game.
ALASKA STAT. § 27.05.010(b) (2006). Department Re-sponsible for Mineral Resources.
Literature CitedAA (Anglo-American). 2009a. Anglo-American Pebble Mine investor advisory: reputational risk, regulatory challenges and legal uncertainties. Earthworks. Available: http://earth-worksaction.org/pubs/PebbleInvestorRiskReport_FINAL.pdf. (August 2010).
AA. 2009b. Consolidated income statement. Anglo American. Available: http://ar09.angloamerican.solutions.investis.com/financial_statements/principal/index.html. (August 2010).
AAC (ALASKA ADMIN. CODE) tit. 11, § 80.130(a)(3) (2006). Hearing procedures.
AAC tit. 11, § 97 (2006). Mining reclamation.
AAC tit. 11, § 110 (2006). Alaska coastal management program implementation.
AAC tit. 11, § 112.300(b)(3) (2006). Statewide standards of the Alaska coastal management program. Resources and Habitats. Habitats.
Abel, H. 1997. The rise and fall of a gold mining company. High Country News (December 22). Available: http://www.hcn.org/issues/121/3860. (September 2010).
ACFEC (Alaska Commercial Fish Entry Commission). 2010. Permit statistics for Alaska’s limited entry salmon fisheries 1999–2008. Available: http://www.cfec.state.ak.us/research/salmon/salpmt99_08.pdf. (August 2010).
ACFEC. 2011. Basic Information Table (BIT) of S 03T (fishery code): Salmon, drift gillnet, Bristol Bay. ACFEC, November 20, 2011. Available: http://www.cfec.state.ak.us/bit/X_S03T.HTM. (December 2011).
ADEC (Alaska Department of Environmental Conserva-tion). 2003. Alaska water quality criteria manual for toxic and other deleterious organic and inorganic substances. Amended as of May 15, 2003. ADEC, Juneau, AK.
ADEC. 2006. Alaska water quality standards. Amended as of December 28, 2006. ADEC, Juneau, AK.
ADFG (Alaska Department of Fish and Game). 2008a. 2008 Bristol Bay salmon season summary, news release. ADFG. Available: http://www.cf.adfg.state.ak.us/region2/finfish/salmon/bbay/brbpos08.pdf. (September 2010).
ADFG. 2008b. Alaska freshwater fish inventory. Division of Sport Fish, ADFG. Available: http://www.sf.adfg.state.ak.us/SARR/Surveys/index.cfm. (August 2010).
ADFG. 2010a. Bristol Bay historical salmon information. Division of Commercial Fisheries, ADFG. Available: http://www.cf.adfg.state.ak.us/region2/finfish/salmon/bbay/bbay-hist.php. (August 2010).
ADFG. 2010b. Bristol Bay salmon season summary. Divi-sion of Commercial Fisheries, ADFG, Dillingham, AK.
ADFG. 2011a. 2010 Bristol Bay area annual management Report. Division of Sport Fish and Commercial Fisheries, ADFG. Available: http://www.sf.adfg.state.ak.us/FedAidp-dfs/FMR11-23.pdf. (November 2011).
ADFG. 2011b. Anadromous waters catalog: overview. ADFG. Available: http://www.adfg.alaska.gov/sf/SARR/AWC/. (June 2011).
ADLWD (Alaska Department of Labor and Workplace De-velopment). 2010. April 2010 Unemployment rate, Bristol

98
ALASKA STAT. § 38.04.005(a) (2006). Public and Private Land Use.
ALASKA STAT. § 38.05.035(e)(6) (2006). Alaska Land Act. Powers and Duties of the Director.
ALASKA STAT. § 38.05.300 (2006). Alaska Land Act. Clas-sification of Land.
ALASKA STAT. § 38.05.850(a) (2006). Alaska Land Act. Permits.
ALASKA STAT. § 44.66.020(a) (2006). Agency Programs.
ALASKA STAT. §§ 46.39.010–.040 (2006). Coastal Man-agement Administration.
Alexander, R., E. Boyer, R. Smith, G. Schwarz, and R. Moore. 2007. The role of headwater streams in downstream water quality. Journal of the American Water Resources As-sociation 43(1):41–59.
Alfano, P. 2009. NEPA at 40: procedure or substance. Envi-ronmental Law Institute. Available: http://www.eli.org/pdf/seminars/NEPA/Alfano.NEPA.pdf. (June 2011).
Alto, K., S. Broderius, and L. Smith, Jr. 1977. Toxicity of xanthates to freshwater fish and invertebrates. University of Minnesota report submitted to Minnesota Environmental Quality Council, Regional Copper Nickel Study. Avail-able: www.leg.state.mn.us/docs/pre2003/other/CN004.pdf. (December 2011).
Asche, F., A. Guttormsen, T. Sebulonsen, and E. Sissener. 2005. Competition between farmed and wild salmon: the Japanese salmon market. Agricultural Economics 33(3):333–340. Available: http://www.umb.no/statisk/ior/ageconlaks.pdf. (August 2010).
Augerot, X. 2005. Atlas of Pacific salmon: the first map-based status assessment of salmon in the North Pacific. University of California Press, Berkeley, CA.
Australian Government Publishing Service. 1995. Sodium Ethyl Xanthate,Priority Existing Chemical No. 5, Full Pub-lic Report. Canberra. Available: www.nicnas.gov.au/search. (December 2011).
Ayres, R., L. Ayres, and I. Råde. 2002. The life cycle of copper, its co-products and by-products. Commissioned by the MMSK project, Report 24. International Institute for Environment and Development, London, UK.
Baatrup, E. 1991. Structural and functional-effects of heavy metals on the nervous system, including sense organs of fish. Comparative Biochemistry and Physiology Part C: Pharma-cology, Toxicology, and Endocrinology 100(1–2):253–257.
Baker, R., M. Knittel, and J. Fryer. 1983. Susceptibility of Chinook salmon, Oncorhynchus tshawytscha (Walbaum), and rainbow trout, Salmo gairdneri Richardson, to infection with Vibrio anguillarum following sublethal copper expo-sure. Journal of Fish Diseases 6(3):267–275.
Balczon, J., and J. Pratt. 1994. A comparison of the respons-es of two microcosm designs to a toxic input of copper. Hydrobiologia 281(2):101–114.
Baldwin, D., J. Sandahl, J. Labenia, and N. Scholz. 2003. Sublethal effects of copper on coho salmon: impacts on non-overlapping receptor pathways in the peripheral olfac-tory nervous system. Environmental Toxicology and Chem-istry 22(10):2266–2274.
Balm, T., T. Carrick, A. Conen, and T. Pottinger. 1996.
Trychophyra intermedia on the gills of rainbow trout acclimating to low ambient pH. Journal of Fish Biology 48(1):147–150.
Barry, K., J. Grout, C. Levings, B. Nidle, and G. Piercey. 2000. Impacts of acid mine drainage on juvenile salmonids in an estuary near Britannia Beach in Howe Sound, British Columbia. Canadian Journal of Fisheries and Aquatic Sci-ences 57(10):2032–2043.
Bash, J., C. Berman, and S. Bolton. 2001. Effects of turbidity and suspended solids on salmonids. Center for Streamside Studies, University of Washington, Seattle, WA.
Battin, J., M. Wiley, M. Ruckelshaus, R. Palmer, E. Korb, K. Bartz, and H. Imaki. 2007. Projected impacts of cli-mate change on salmon habitat restoration. Proceedings of the National Academy of Sciences of the United States of America 104(16):6720–6725.
Baxter, C., and F. Hauer. 2000. Geomorphology, hyporheic exchange, and selection of spawning habitat by bull trout (Salvelinus confluentus). Canadian Journal of Fisheries and Aquatic Science 57(7):1470–1481.
Baxter, G. 1961. River utilization and the preservation of migratory fish life. Proceedings of the Institution of Civil Engineers 18(3):225–244.
Baxter, J., and J. McPhail. 1999. The influence of redd site selection, groundwater upwelling, and over-winter incuba-tion temperature on survival of bull trout (Salvelinus con-fluentus) from egg to alevin. Canadian Journal of Zoology 77(8):1233–1239.
BBNC (Bristol Bay Native Corporation). 2010. Letter to Dennis McLerran, Regional Administrator, Region 10, U.S. Environmental Protection Agency. 12 August 2010. Bristol Bay Regional Seafood Development Association. Available: http://www.bbrsda.com/layouts/bbrsda/files/documents/bbrsda_pebble/Bristol Bay Native Corporation EPA Letter 081210.pdf. (July 2011).
BCME (British Columbia Ministry of Environment). 2011. Analysis of effects of mine site remediation on total copper concentrations in the Tsolum River and some of its tributar-ies. BWP Consulting Inc. 2011. Available: http://www.env.gov.bc.ca/wat/wq/pdf/minesite-rem-effects-on-tsolum.pdf . (November 2011).
Ben-David, M. 1997. Timing of reproduction in wild mink: the influence of spawning Pacific salmon. Canadian Journal of Zoology 75(3):376–382.
Berry, W., N. Rubenstein, and B. Melzian. 2003. The bio-logical effects of suspended and bedded sediment (SABS) in aquatic systems: a review. U.S. Environmental Protection Agency, Internal Report, Washington, D.C. Available: http://www.epa.gov/waterscience/criteria/sediment. (August 2010).
Bilby, R., J. Heffner, B. Fransen, P. Bisson, and J. Walter. 1998. Response of juvenile coho, USA salmon (Oncorhyn-chus kisutch) and steelhead (Oncorhynchus mykiss) to the addition of salmon carcasses to two streams in southwest Washington. Canadian Journal of Fisheries and Aquatic Sci-ence 55(8):1909–1918.
Bill, D. 1984. 1982 Kvichak River sockeye salmon smolt studies. Pages 2–13 in D.M. Eggers and H.J. Yuen, editors. 1982 Bristol Bay sockeye salmon smolt studies. Division of Commercial Fisheries, Alaska Department of Fish and Game, Technical Report No. 103, Juneau, AK.

99Literature Cited
Birtwell, I. 1999. The effects of sediment on fish and their habitat. Fisheries and Oceans Canada, Pacific Scientific Advice Review Committee, Canadian Stock Assessment Secretariat Research Document 99/139, Ottawa, ON.
Bjornn, T., and D. Reiser. 1991. Habitat requirements of salmonids in streams. Pages 83–138 in W.R. Meehan. Influ-ences of forest and rangeland management on salmonid fishes and their habitats. American Fisheries Society, Special Publication No. 19, Bethesda, MD.
Boehne, P., and R. House. 1983. Stream ordering: a tool for land managers to classify western Oregon streams. U.S. Bu-reau of Land Management, Technical Note: OR-3, Portland, OR.
Boening, D. 1998. Aquatic toxicity and environmental fate of xanthates. Mining Engineering 50(9):65–68.
Bristol Bay Borough. 2010. Bristol Bay Borough. Bristol Bay Area. Available: http://www.theborough.com/area.html. (September 2010).
Brown, L., S. Chase, M. Mesa, R. Beamish, and P. Moyle, editors. 2009. Biology, management, and conservation of lampreys in North America, American Fisheries Society Symposium 72. American Fisheries Society, Bethesda, MD.
Brumbaugh, W., and T. May. 2008. Elements in mud and snow in the vicinity of the DeLong Mountain regional transportation system toad, Red Dog Mine, and Cape Kru-senstern National Monument, Alaska, 2005–06. U.S. Geo-logical Survey, Scientific Investigations Report 2008–5040, Reston, VA.
Bryce, S., G. Lomnicky, P. Kaufmann, L. McAllister, and T. Ernst. 2008. Development of biologically based sedi-ment criteria in mountain streams of the western United States. North American Journal of Fisheries Management 28(6):1714–1724.
Bryce, S., G. Lomnicky, and P. Kaufmann. 2010. Protect-ing sediment-sensitive aquatic species in mountain streams through the application of biologically based streambed sed-iment criteria. Journal of the North American Benthological Society 29(2):657–672.
Buckley, J., M. Roch, J. McCarter, C. Rendell, and A. Mathe-son. 1982. Chronic exposure of coho salmon to sublethal concentrations of copper-1. Effect on growth, on accumula-tion, and distribution of copper, and on copper tolerance. Comparative Biochemistry and Physiology Part C: Pharma-cology, Toxicology, and Endocrinology 72(1):15–19.
Buckwalter, J. 2009. FY 2009 Operational Plan: inventory of fish distribution in the lower Yukon River Drainage. Alaska Department of Fish and Game.
Burgner, R. 1991. Life history of sockeye salmon (On-corhynchus nerka). Pages 1–117 in C. Groot, and L. Margo-lis, editors. Pacific salmon life histories. University of British Columbia Press, Vancouver, B.C.
Cambridge, M. 2005. The importance of failure in the design process. Pages 59–68 in Z. Agioutantis and K. Komnitsas, editors. Proceedings of the geoenvironment and geotechnics (GEOENV2005) international workshop, September 12–14, 2005. Milos Island, Greece,. Heliotopos Conferences Ltd., Athens, Greece.
Cantilli, R., R. Stevens, W. Swietlik, W. Berry, P. Kaufmann, J. Paul, R. Spehar, S. Cormier, and D. Norton. 2006. Frame-work for developing suspended and bedded sediments (SABS)
water quality criteria. Office of Water, U.S. Environmental Protection Agency, EPA 822-R-06-001, Washington, D.C.
Carlisle, D., M. Meador, S. Mouton, and P. Ruhl. 2007. Estimation and application of indicator values for common macroinvertebrate genera and families of the United States. Ecological Indicators 7(1):22–33.
Cederholm, C., D. Johnson, R. Bilby, L. Dominguez, A. Garrett, W. Graeber, E. Greda, M. Kunze, B. Marcot, J. Palmisano, R. Plotnikoff, W. Pearcy, C. Simenstad, and P. Trotter. 2001. Pacific salmon and wildlife: ecological con-texts, relationships, and implications for management. Pages 628–685 in D. Johnson, and T. O’Neil, editors. Wildlife-habitat relationships in Oregon and Washington. Oregon State University Press, Corvallis, OR.
CEQ (Council on Environmental Quality) Regulations for Implementing the Procedural Provisions of the National En-vironmental Policy Act. Timing of Agency Action. 40 C.F.R. § 1506.10(b), (d) (2011).
CEQ Regulations for Implementing the Procedural Provi-sions of the National Environmental Policy Act. Elimination of Duplication with State and Local Procedures. 40 C.F.R. § 1506.2 (2011).
CEQ Regulations for Implementing the Procedural Provi-sions of the National Environmental Policy Act. Major Federal Action. 40 C.F.R. § 1508.18 (2011).
Chakoumakos, C., R. Russo, and R. Thurston. 1979. Toxic-ity of cooper to cutthroat trout (Salmo clarki) under differ-ent conditions of alkalinity, pH, and hardness. Environmen-tal Science and Technology 13(2): 213–219.
Chambers, D., and R. Moran. 2007. Mining/geochemistry/hydrogeology. Submitted to Wild Salmon Center, Portland, OR.
Chambers, D., and B. Higman. 2011. Long term risks of tailings dam failure. Available: http://www.csp2.org/reports.htm. (July 2011).
Chapman, G. 1978. Toxicities of cadmium, copper, and zinc to four juvenile stages of Chinook salmon and steelhead. Transactions of the American Fisheries Society 107(6):841–847.
Chapman, G., and D. Stevens. 1978. Acutely lethal levels of cadmium, copper, and zinc to adult male coho salmon and steelhead. Transactions of the American Fisheries Society 107(6):837–840.
Chugach Electrical Association, Inc. 2009. 2009 annual report. Chugach Electrical Association, Inc. Available: http://www.chugachelectric.com/pdfs/2009_annual_report.pdf. (August 2010).
Clements, W., D. Carlisle, J. Lazorchak, and P. Johnson. 2000. Heavy metals structure benthic communities in Colo-rado mountain streams. Ecological Applications 10(2):626–638.
Collings, M. 1972. A methodology for determining instream flow requirements for fish. Pages 72–86 in Proceedings, instream flow methodology workshop. Washington State Water Program, Olympia, WA.
Collings, M. 1974. Generalization of spawning and rear-ing discharges for several Pacific salmon species in western Washington. U.S. Geological Survey, Open-File Report, Tacoma, WA.

100
Coulter, D. 1976. Location studies for slurry pipelines—the effect of ground surface temperatures. Technical Memo. System Sciences, Inc., Bethesda, MD.
Craciun Research. 2009. Summary report: Bristol Bay residents views on development study. Report of Craciun Research to Nunumta Aulukestai, Dillingham, AK. Avail-able: http://nunamtasurvey.info/NunamtaSurveyReport.pdf. (August 2010).
Crone, A., S. Personius, P. Craw, P. Haeussler, and L. Staft. 2004. The Susitna Glacier thrust fault: characteristics of surface ruptures on the fault that initiated the 2002 Denali fault earthquake. Bulletin of the Seismological Society of America 94(6B):5–22.
Crouse, M., C. Callahan, K. Malueg, and S. Dominguez. 1981. Effects of fine sediments on growth of juvenile coho salmon in laboratory streams. Transactions of the American Fisheries Society 110(2):281–286.
CWA (Federal Water Pollution Control Act of 1972) § 404, 33 U.S.C. § 1344 (2008).
CWA Section 404(b)(1) Guidelines for Specification of Dis-posal Sites for Dredged or Fill Material, Purpose and Policy. 40 C.F.R. § 230.1(c-d) (2011).
CWA Section 404(b)(1) Guidelines for Specification of Disposal Sites for Dredged or Fill Material, Restrictions on Discharge. 40 C.F.R. § 230.10(a-d) (2011).
CWA Section 404(b)(1) Guidelines for Specification of Dis-posal Sites for Dredged or Fill Material, Potential Impacts on Special Aquatic Sites. 40 C.F.R. § 230.40-45 (2011).
CWA Section 404(b)(1) Guidelines for Specification of Dis-posal Sites for Dredged or Fill Material, Actions Affecting Plant and Animal Populations. 40 C.F.R. § 230.75 (2011).
CWA Section 404(c) Procedures. Purpose and Scope. 40 C.F.R. § 231.1 (2011).
CWA Section 404(c) Procedures. Definitions. 40 C.F.R. § 231.2(e) (2011).
Dahl, B., and H. Blanck. 1996. Toxic effects of the anti-fouling agent Irgarol 1051 on periphyton communities in coastal water microcosms. Marine Pollution Bulletin 32(4):342–350.
Davies, M., E. McRoberts, and T. Martin. 2002. Static liquefaction of tailings –fundamentals and case histories. Available: http://www.infomine.com/publications/docs/Davi-es2002c.pdf. (July 2011).
Davis Jr., R., A. Welty, J. Borrego, J. Morales, J. Pendon, and J. Ryan. 2000, Rio Tinto estuary (Spain): 5000 years of pollution. Springer-Verlag, Environmental Geology 39(10):1107–1116.
Day, N. 2010. The Holden Mine: update on site cleanup activities. U.S. Department of Agriculture Forest Service. Available: http://www.fs.fed.us/r6/wenatchee/holden-mine/pdf/Holden-mine-update-Summer-2010.pdf. (September 2010).
Demory, R., R. Orrell, and D. Heinle. 1964. Spawning ground catalog of the Kvichak River system, Bristol Bay, Alaska. U.S. Fish and Wildlife Service, Special Scientific Report, Fisheries No. 488, Washington, D.C.
Denial or Restriction of Disposal Sites, Section 404(c) Pro-cedures, 44 Fed. Reg. 58,076-7 (1979).
DeWalle, D., R. Dinicola, and W. Sharpe. 1987. Predicting base flow alkalinity as an index to episodic stream acidifica-tion and fish presence. Water Resources Bulletin 23(1):29–35.
Diamond, J. 2006. Collapse: how societies choose to fail or succeed. Penguin Books, New York, NY.
Dobb, E. 2010. Alaska’s choice. National Geographic Magazine (December):100–125.
Dobbyn, P. 2005. Mine poisons Alaska EPA listing. Anchor-age Daily News (May 12): F1.
Donaldson, J. 1967. The phosphorus budget of Iliamna Lake, Alaska, as related to the cyclic abundance of sock-eye salmon. Ph.D. dissertation, University of Washington, Seattle, WA.
Douglas, T. 2006. Review of groundwater salmon interac-tions in British Columbia. Watershed Watch. Available: http://www.watershed-watch.org/publications/files/Groundwater+Salmon++hi+res+print.pdf. (August 2010).
Doukas, A., A. Cretney, and J. Vadgama. 2008. Booms to bust: social and cultural impacts of the mining cycle. The Pembina Institute. Available: http://pubs.pembina.org/re-ports/boombust-final.pdf. (August 2010).
Dube, M., D. MacLatchy, J. Kieffer, N. Glozier, J. Culp, and K. Cash. 2005. Effects of metal mining effluent on Atlantic salmon (Salmo salar) and slimy sculpin (Cottus cognatus): using artificial streams to assess existing effects and predict future consequences. The Science of Total Environment 343(1–3):135–154.
Duffield, J. 1997. Non-market valuation and the courts: the case of the Exxon Valdez. Contemporary Economic Policy. 5(15):98–109.
Duffield, J. 2009. Bristol Bay wild salmon ecosystem eco-nomics: 2008 update. Duffield, J., Neher, C., Patterson, D., and O. Goldsmith. 2007. Economics of wild salmon ecosys-tems: Bristol Bay, Alaska. Proceedings of U.S. Department of Agriculture Forest Service, PMRS-P-49.
Duffield, J., C. Neher , and D. Patterson. 2007. Economics of wild salmon watersheds: Bristol Bay Alaska, revised Final Report. Trout Unlimited, Juneau, AK.
Earle, J., and T. Callaghan. 1998. Impacts of mine drain-age on aquatic life, water uses, and man-made structures. Pages 41–43 in Coal mine drainage prediction and pollution prevention in Pennsylvania. Pennsylvania Department of Environmental Protection, Harrisburg, PA.
Earthworks. 2004. False promises: water quality predictions gone wrong. Bristol Bay Alliance. Available: http://www.bris-tolbay alliance. com/mines_and_water.htm. (August 2010).
Earthworks. 2010. Water-related impacts at the Pebble Mine. Earthworks, Our Bristol Bay. Available: http://our-bristolbay.com/water-related-impacts.html. (February 2011).
Earthworks. 2011. Zortman and Landusky gold mines. Earthworks. Available: http://www.earthworksaction.org/zortman_landusky.cfm. (June 2011).
Eash, J., and R. Rickmnan. 2004. Floods on the Kenai Pen-insula, Alaska, October and November 2002. U.S. Geologi-cal Survey, Fact Sheet 2004-3023, Anchorage, AK.
Ecology and Environment, Inc. 2010. An assessment of ecological risk to wild salmon systems from large-scale min-ing in the Nushagak and Kvichak watersheds of the Bristol

101Literature Cited
Bay basin. Report of Ecology and Environment, Inc. to The Nature Conservancy, Arlington, VA.
Edwards, M., and J. Larson. 2003. Estimation of coho salmon escapement in the Ugashik Lake systems, Alaska Peninsula National Wildlife Refuge, 2002. King Salmon Fish and Wildlife Field Office, U.S. Fish and Wildlife Service, Alaska Fisheries Data Series 2003-3, King Salmon, AK.
Eggers, D., and H. Yuen, editors. 1984. 1982 Bristol Bay sockeye salmon smolt studies. Division of Commercial Fish-eries, Alaska Department of Fish and Game, Technical Data Report No. 103, Juneau, AK.
Einan, D., and L. Klasner. 2010. Holden Mine cleanup proj-ect: agencies’ proposed plan. U.S. Environmental Protection Agency and Washington Department of Ecology public meeting slide presentation. U.S. Department of Agriculture Forest Service. Available: http://www.fs.fed.us/r6/wenatchee/holden-mine. (September 2010).
Eisler, R. 2000. Handbook of chemical risk assessment: health hazards to humans, plants, and animals, vol. 1: met-als. Lewis Publishers, New York, NY.
Englund, G., and B. Malmqvist. 1996. Effects of flow regu-lation, habitat area, and isolation on the macroinvertebrate fauna of rapids in north Swedish Rivers. Regulated Rivers: Research and Management 12(4–5):433–445.
Enserink, E., J. Maas-Diepeveen, and C. van Leeuwen. 1991. Combined toxicity of metals: an ecotoxicological evalua-tion. Water Research 25(6):679–687.
Epler, P. 2011a. Compromise in works for management of coastal development. Alaska Dispatch April 5, 2011. Avail-able: http://www.alaskadispatch.com/article/compromise-works-management-coastal-development. (June 2011).
Epler, P. 2011b. Alaska coastal communities push for local control. Alaska Dispatch January 28, 2011. Available: http://www.alaskadispatch.com/article/alaska-coastal-communi-ties-push-local-control. (June 2011).
Epler, P. 2011c. It’s a wrap: Alaska State Legislature ad-journs. Alaska Dispatch May 14, 2011. Available: http://www.alaskadispatch.com/article/its-wrap-alaska-legislature-adjourns. (June 2011).
Eppinger, R., D. Frey, K. Kelley, S. Smith, and S. Giles. 2009. A hydrogeochemical exploration study at the Pebble Deposit, Alaska. Pages 365-368 in D. Lentz, K. Thorne, and K. Beal, editors. Proceedings of 24th International Applied Geochemistry Symposium, New Brunswick, CA. Avail-able: http://www.appliedgeochemists.org/events/iags2009/abstracts/24th_IAGS_Abstracts_Vol1_revised_New and Old Discoveries Case Studies.pdf. (December 2011).
ESA (Endangered Species Act of 1973) § 7, 16 U.S.C. § 1536 (a)(3) (1988).
ESA § 7, 16 U.S.C. § 1536 (a)(2)(1988).
ESA § 7, 16 U.S.C. § 1536 (b)(3)(A)(1988).
Eshleman, K. 1988. Predicting regional episodic acidifi-cation of surface waters using empirical models. Water Resources Research 24(7):1118–1126.
Esselman, P., D. Infante, L. Want, D. Wu, A. Cooper, and W. Taylor. In press. An initial assessment of integrated human disturbances on stream fish habitats in the conterminous United States. Report of Assessment Team to the Science and Data Committee and Board of the National Fish Habi-
tat Action Plan.
Fall, J., M. Chythlook, J. Schichnes, and J. Morris. 1996. An overview of the harvest and use of freshwater fish by the communities of the Bristol Bay region, southwest Alaska. Division of Subsistence, Alaska Department of Fish and Game, Technical Paper No. 166, Juneau, AK.
Fall, J., D. Holen, B. Davis, T. Krieg, and D. Koster. 2006. Subsistence harvests and uses of wild resources in Iliamna, Newhalen, Nondalton, Pedro Bay, and Port Alsworth, Alas-ka, 2004. Alaska Department of Fish and Game, Technical Paper No. 302, Juneau, AK.
Felt Soul Media. 2009. Red gold: considering the future of Bristol Bay. Felt Soul Media. Available: http://www.feltsoul-media.com/redgold_studyguide.pdf. (September 2010).
Fey, D. 2003. Acid base accounting: assessing the toxicity potential of mine-waste piles. Presentation to Billings Sym-posium/ASMR Annual Meeting, June 1, 2003. U.S. Geologi-cal Survey. Available: http://www.swrcb.ca.gov/academy/courses/acid/supporting_material/usgs_acidbaseacct.pdf. (December 2011).
Flebbe, P., L. Roghair, and J. Bruggink. 2006. Spatial model-ing to project southern Appalachian trout distribution in a warmer climate. Transactions of the American Fisheries Society 135(5):1371–1382.
Ford, J., and L. Hasselbach. 2001. Heavy metals in mosses and soils on six transects along the Red Dog Mine haul road, Alaska. Western Arctic National Parklands, U.S. Na-tional Park Service NPS/AR/NRTR-2001/38, Kotzebue, AK. Available: http://www.dec.state.ak.us/spar/csp/docs/reddog/reddogrpt2.pdf. (September 2010).
Franklin, N., J. Stauber, S. Apte, and R. Lim. 2002. Effect of initial cell density on the bioavailability and toxicity of cop-per in microalgal bioassays. Environmental Toxicology and Chemistry 21(4):742–751.
French, M., and L. Evans. 1988. The effects of copper and zinc on the growth of the fouling diatoms Amphora and Amphiprora. Biofouling 1(1):3–18.
Frissell, C. 1993. Topology of extinction and endangerment of native fishes in the Pacific Northwest and California (U.S.A.). Conservation Biology 7(2):342–354.
Fudge, T., K. Wautier, R. Evans, and V. Palace. 2008. Ef-fect of different levels of fine-sediment loading on the escapement success of rainbow trout fry from artificial redds. North American Journal of Fisheries Management 28(3):758–765.
FWCA (Fish and Wildlife Coordination Act of 1934), 16 U.S.C. §§ 661-667(e) (2002).
Gallant, A., E. Binnian, J. Omernik, and M. Shasby. 1995. Ecoregions of Alaska. U.S. Geological Survey, Professional Paper 1567, Washington, D.C.
Garrett, J., D. Bennett, F. Frost, and R. Thurow. 1998. Enhanced incubation success for Kokanee spawning in groundwater upwelling sites in a small Idaho stream. North American Journal of Fisheries Management 18(4):925–930.
Gende, S., R. Edwards, M. Wilson, and M. Wipfli. 2002. Pacific salmon in aquatic and terrestrial ecosystems. BioSci-ence 52(10):917–928.
Ghaffari, H., R. Morrison, M. de Ruijter, A. Zivkovic, T. Hantelmann, D. Ramsey, and S. Cowie. 2011. Preliminary

102
assessment of the Pebble project, Southwest Alaska. Report of Wardrop Engineering Inc., a Tetra Tech Company to Northern Dynasty Minerals Ltd., Vancouver, B.C.
Giattina, J., R. Garton, and D. Stevens. 1982. Avoidance of copper and nickel by rainbow trout as monitored by a computer-based data acquisition system. Transactions of the American Fisheries Society 111(4):491–504.
Gillilan, D., and T. Brown. 1997. Instream flow protection: seeking a balance in western water use. Island Press, Wash-ington, D.C.
Goldsmith, O., A. Hill, T. Hull, M. Markowski, and R. Unsworth. 1998. Economic assessment of Bristol Bay area national wildlife refuges: Alaska peninsula/Becherof, Izem-bek, Togiak. U.S. Fish and Wildlife Service, U.S. Department of the Interior, Washington, D.C.
Goldsmith, S. 2007. The remote rural economy of Alaska. Institute of Social and Economic Research, University of Alaska, Anchorage, AK. Available: http://www.iser.uaa.alaska.edu/Publications/u_ak/uak_remoteruraleconomyak.pdf. (August 2010).
Gray, G. 2005. Major changes to the Alaska coastal man-agement program. In proceedings of the 14th Biennial Coastal Zone Conference, July 17–21, 2005, New Orleans, LA. Ed. Coastal Services Center, National Oceanic and Atmospheric Administration, Charleston, SC.
Gresh, T., J. Lichatowich, and P. Schoonmaker. 2000. An es-timation of historic and current levels of salmon production in the Northeast Pacific ecosystem: evidence of a nutrient deficit in the freshwater systems of the Pacific Northwest. Fisheries 25(1):15–21.
Groot, C., and L. Margolis, editors. 2001. Pacific salmon life histories. University of British Columbia Press, Vancouver, B.C.
Gross, C. 2008. Grouse Creek, Idaho; site reclamation and long-term water management. In Proceedings of the 2008 U.S. Environmental Protection Agency/National Ground-water Association’s Remediation of Abandoned Mine Lands Conference, October 2–3, 2008, Westerville, OH. Available: http://ngwa.confex.com/ngwa/mine08/webprogram/Pa-per5511.html. (August 2010).
Guerriere, A. 2003. PD agrees to pay fine, replace pipeline at New Mexico facility. American Metal Market. Available: http://www.amm.com/SearchResults.aspx?Keywords=Phelps Dodge Corp. paid a $42,150 civil penalty to the New Mexico Environment Department %28&OrderType=1. (June 2011).
Habicht, C., J. Olsen, L. Fair, and J. Seeb. 2004. Smaller effective population sizes evidenced by loss of microsatellite alleles in tributary-spawning populations of sockeye salmon from the Kvichak River, Alaska drainage. Environmental Biology of Fishes 69(1–4):51–62.
Habicht, C., L. Seeb, and J. Seeb. 2007. Genetic and eco-logical divergence defines population structure of sockeye salmon populations returning to Bristol Bay, Alaska, and provides a tool for admixture analysis. Transactions of the American Fisheries Society 136(1):82–94.
Haeussler, P., and G. Plafker. 1995. Earthquakes in Alaska. U.S. Geological Survey, Open-File Report 95-624. Avail-able: http://geopubs.wr.usgs.gov/open-file/of95-624. (August 2010).
Haeussler, P., and R. Saltus. 2005. 26 km of offset on the
Lake Clark fault since late Eocene time. U.S. Geological Survey, Professional Paper 1790-A, Reston, VA.
Haley, S., G. Fay, H. Griego, and B. Saylor. 2008. Appendix G—social conditions: Red Dog Mine extension—Aqqaluk Project. Institute of Social and Economic Research, Univer-sity of Alaska, Anchorage, AK. Available: http://www.iser.uaa.alaska.edu/Publications/8(a)/background info/RedDog-Appendix_G.pdf. (August 2010).
Haley, S., and J. Magdanz. 2008. The impact of resource development on social ties: theory and methods for assess-ment. Chapter 2 in C. O’Faircheallaigh and S. Ali, editors. Earth matters: indigenous peoples, corporate social respon-sibility and resource development. Greenleaf Publishing, Sheffield, UK.
Hall, T. 1986. A laboratory study of the effects of fine sedi-ments on survival of three species of Pacific salmon from eyed-egg to fry emergence. National Council of Paper Indus-try for Air and Stream Improvement, Technical Bulletin 482, New York, NY.
Hamilton, S., K. Buhl, N. Faerber, N. Wiedmeyer, and F. Bullard. 1990. Toxicity of organic selenium in the diet of Chinook salmon. Environmental Toxicology and Chemistry 9(3):347–358.
Hasselbach, L., J. Ver Hoef, J. Ford, P. Neitlich, E. Crecelius, S. Berryman, B. Wolk, and T. Bohle. 2005. Spatial patterns of cadmium and lead deposition on and adjacent to National Park Service lands in the vicinity of Red Dog Mine, Alaska. Science of the Total Environment 348(1–3):211–230.
HDR Alaska and CH2M Hill. 2008. Groundwater and surface water quality: mine area surface water 2004-2007. Report F2. HDR, Anchorage, AK.
Hecht, S., D. Baldwin, C. Mebane, T. Hawkes, S. Gross, and N. Scholz. 2007. An overview of sensory effects on juvenile salmonids exposed to dissolved copper: applying a benchmark concentration approach to evaluate sublethal neurobehavioral toxicity. National Oceanic and Atmo-spheric Administration, Technical Memorandum NMFS-NWFSC-83, Seattle, WA.
Hecla Mining Co., and Great Lakes Minerals Inc. 1994. Business Wire. Available: http://www.allbusiness.com/environment-natural-resources/ecology-environmen-tal/7084102-1.html. (June 2011).
Heggnes, J., S. Saltveit and O. Lingaas. 1996. Predicting fish habitat use to changes in water flow: modeling criti-cal minimum flows for Atlantic salmon, Salmo salar, and brown trout, Salmo trutta. Regulated Rivers: Research and Management 12(2–3):331–344.
Helvoigt, T., and D. Charlton. 2009. The economic value of the Rogue River salmon. Report of ECONorthwest to Save the Wild Rogue Campaign, Ashland, OR. Available: http://www.americanrivers.org/assets/pdfs/wild-and-scenic-rivers/the-economic-value-of-rogue.pdf. (August 2010).
Hem, J. 1985. Study and interpretation of the chemical characteristics of natural waters, 3rd Edition. U.S. Geological Survey Water-Supply Paper 2254.
Hetrick, F., M. Knittel, and J. Fryer. 1979. Increased suscep-tibility of rainbow trout to infectious hematopoietic necrosis virus after exposure to copper. Applied and Environmental Microbiology 37(2):198–201.
Higgins, D., and S. Wiemeyer. 2001. Nevada assessment of

103Literature Cited
wildlife hazards associated with mine pit lakes. Nevada Fish and Wildlife Office, Interim Report, Reno, NV.
Higman, B. 2010. Waste storage ‘in perpetuity.’ Ground Truth Trekking. Available: http://www.groundtruthtrekking.org/Issues/OtherIssues/InPerpetuity.html. (December 2010).
Higman, B., and A. Mattox. 2009. Field studies of active faults in the Lake Iliamna region. Ground Truth Trekking. Available: http://www.groundtruthtrekking.org/Reports/FaultHunt01/index.html. (December 2010).
Hilborn, R., T. Quinn, D. Schindler, and D. Rogers. 2003. Biocomplexity and fisheries sustainability. Proceedings of the National Academy of Sciences 100(11):6564–6568.
Hilderbrand, G., S. Farley, C. Robbins, T. Hanley, K. Titus, and C. Servheen. 1996. Use of stable isotopes to determine diets of living and extinct bears. Canadian Journal of Zool-ogy 74(1):2080–2088.
Hilderbrand, G., T. Hanley, C. Robbins, and C. Schwartz. 1999. Role of brown bears (Ursus arctos) in the flow of marine nitrogen into a terrestrial ecosystem. Oecologia 121(4):546–550.
Hildrew, A., C. Townsend, and J. Francis. 1984. Community structure in some English streams: the influence of species interaction. Freshwater Biology 14(3):297–310.
Hill, R. 1974. Mining impacts on trout habitat. Pages 47–57 in Proceedings of a symposium on trout habitat, research and management. Appalachian Consortium Press, Boone, NC.
Hocking, M., and J. Reynolds. 2011. Impacts of salmon on riparian plant diversity. Science 331(6024):1609–1612.
Hodgson, S., and T. Quinn. 2002. The timing of adult sockeye salmon migration into fresh water: adaptations by populations to prevailing thermal regimes. Canadian Jour-nal of Zoology 80(3):542.
Hoehn, R., and D. Sizemore. 1977. Acid mine drainage and its impact on a small Virginia stream. Journal of the Ameri-can Water Resources Association 13(1):153–160.
Hollibaugh, J., D. Seibert, and W. Thomas. 1980. A compar-ison of the acute toxicity of ten heavy metals to phytoplank-ton from Saanich Inlet, B.C., Canada. Estuarine and Coastal Marine Science 10(1):93–105.
Hughes, R. 1985. Use of watershed characteristics to select control streams for estimating effects of metal mining wastes on extensively disturbed streams. Environmental Management 9(3):253–262.
Hulen, D. 1990. Toxic metals foul stream near mine. An-chorage Daily News (August 18):A1+.
Huntington, C., W. Nehlsen, and J. Bowers. 1996. A survey of healthy native stocks of anadromous salmonids in the Pacific Northwest and California. Fisheries 21(3):6–14.
Huskey, L. 1992. The economy of village Alaska. Institute of Economic Research, University of Alaska, Anchorage, AK. Available: http://www.iser.uaa.alaska.edu/Publications/Economy of Village Alaska.pdf. (August 2010).
Hynes, H. 1970. The ecology of running waters. University of Toronto Press, Toronto, ON.
ICOLD (International Commission of Large Dams). 2001. Tailings dams—risk of dangerous occurrences: lessons learnt from practical experiences. ICOLD, Bulletin 121, Paris, France.
IIED (International Institute for Environment and Develop-ment). 2002. Breaking new ground: mining, minerals and sustainable development. IIED Final Report. Available: http://www.iied.org/sustainable-markets/key-issues/business-and-sus-tainable-development/mmsd-final-report. (December 2011).
Ikuta, K., A. Munakata, K. Aida, M. Amano, and S. Kitamu-ra. 2001. Effects of low pH on upstream migratory behav-ior in land-locked sockeye salmon (Oncorhynchus nerka). Water, Air, and Soil Pollution 130(1–4):99–106.
Ikuta, K., Y. Suzuki, and S. Kitamura. 2003. Effects of low pH on the reproductive behavior of salmonid fishes. Fish Physiology and Biochemistry 28(1–4):407–410.
IPCC (Intergovernmental Panel on Climate Change). 2007. Climate change 2007: Impacts, adaptation and vulnerability. Contribution of Working Group II to the Fourth Assessment Report of the Intergovernmental Panel on Climate Change. M. Parry, O. Canziani, J. Palutikof, P. van der Linden, J. Paul, and C. Hanson, editors. Cambridge University Press, Cambridge, UK.
Jak, R., J. Maas, and M. Scholten. 1996. Evaluation of laboratory derived toxic effect concentrations of a mixture of metals by testing fresh water plankton communities in enclosures. Water Research 30(5):1215–1227.
Jennings, S., D. Neuman, and P. Blicker. 2008. Acid mine drainage and effects on fish health and ecology: a review. Reclamation Research Group Publication, Bozeman, MT.
Johnson, A., J. White, and D. Huntamer. 1997. Effects of Holden Mine on the water, sediments, and benthic inver-tebrates of Railroad Creek (Lake Chelan). Environmental Investigations and Laboratory Services Program, Washing-ton State Department of Ecology, Publication No. 97-330, Water Body No. Wa-47-1020, Olympia, WA.
Jones, C. 1999. Use of non-market valuation methods in the courtroom: recent affirmative precedents in natural resource damage assessments. Universities Council on Water Resources. Available: http://www.ucowr.siu.edu/updates/pdf/V109_A3.pdf. (August 2010).
Julien, P., B. Bledsoe, and C. Watson. 2002. Fate and trans-port of metals and sediment in surface waters. Pages 17–20 in Balkema Publishers, editor, Proceedings of the 9th inter-national conference on tailings and mine waste. January 27–30, 2002. Fort Collins, CO. Swets & Zeitlinger B.V., Lisse, The Netherlands.
Kaller, M., and K. Hartman. 2004. Evidence of a threshold level of fine sediment accumulation for altering benthic mac-roinvertebrate communities. Hydrobiologia 518(1–3):95–104.
Karl, T 1997. The paradox of plenty: oil booms and petro-states. University of California Press, Berkeley, CA.
Kaufmann, P., A. Herlihy, M. Mitch, J. Messer, and W. Over-ton. 1991. Stream chemistry in the eastern United States 1. Synoptic survey design, acid-base status, and regional pat-terns. Water Resources Research 27(4):611–627.
Kelley, K., J. Lang, and R. Eppinger. 2010. Exploration geo-chemistry at the giant Pebble porphyry Cu-Au-Mo deposit, Alaska. Society of Economic Geologists Newsletter (Janu-ary) (80):17–23. Available: http://www.segweb.org/publica-tions/featuredarticles.aspx. (December 2011).
Kilburn, J. 1995. Grouse Creek up and running. The North-ern Miner (February 6).

104
on branchial ionoregulation in the rainbow trout, Salmo gairdneri Richardson. Journal of Comparative Physiology B: Biochemical, Systemic, and Environmental Physiology 155(5):635–644.
Leask, L., M. Killorin, and S. Martin. 2001. Trends in Alas-ka’s people and economy. Institute of Social and Economic Research, University of Alaska, Anchorage, AK. Available: http://www.akhistorycourse.org/docs/trends_in_alaska.pdf. (August 2010).
Ledin, M., and K. Pedersen. 1996. The environmental impact of mine wastes—roles of microorganisms and their significance in treatment of mine wastes. Earth Science Re-views 41(1–2):67–108.
Leman, V. 1993. Spawning sites of chum salmon, On-corhynchus keta: microhydrological regime and viability of progeny in redds (Kamchatka River Basin). Journal of Ichthyology 33(2):104–117.
Lenhardt, J., and J. Lehman. 2006. Measuring total volatile suspended solids in stormwater to understand the influence of organic matter on BPM performance. Stormwater360. Available: http://www.stormwater360.co.nz/images/tvss in stormwater.pdf. (August 2010).
Lenntech B. 2011. Acids and alkalis in freshwater. Lenntech BV, The Netherlands. Available: http://www.lenntech.com/aquatic/acids-alkalis.htm. (December 2011).
Levings C., K. Barry, J. Grout, G. Piercey, A. Marsden, A. Coombs, and B. Mossop. 2004. Effects of acid mine drain-age on the estuarine food web, Britannia Beach, Howe Sound. Hydrobiologia 525(1–3):185–202.
Levit, S., and J. Kuipers. 2000. Reclamation bonding in Montana. Report of the Center for Science in Public Partici-pation to the Montana Environmental Information Center, Helena, MT. Available: http://meic.org/files/mining/recbond-ingreport.pdf. (September 2010).
Lewis, M., and C. Bamforth. 2007. Essays in brewing sci-ence. Springer Science and Business Media, LLC, New York, NY.
Li, M. 2000. Acid rock drainage prediction for low sul-phide, low-neutralisation potential mine wastes. Pages 567–580 in Proceedings of the fifth international conference on acid rock drainage (ICARD 2000). Society for Mining, Metallurgy, and Exploration, Inc.
Loomis, J. 1999. Recreation and passive use values from removing the dams on the Lower Snake River to increase salmon. U.S. Army Corps of Engineers. Available: http://www.nww.usace.army.mil/lsr/reports/misc_reports/passive.htm. (August 2010).
Lottermoser, B. 2007. Mine wastes: characterization, treat-ment and environmental impacts, second edition. Springer, Berlin.
Madej, M., C. Currens, V. Ozaki, J. Yee, and D. Anderson. 2006. Assessing possible thermal rearing restrictions for juvenile coho salmon (Oncorhynchus kisutch) through ther-mal infrared imaging and in-stream monitoring. Canadian Journal of Fisheries and Aquatic Sciences 63(6):1384–1396.
Maehl, W. 2003. Zortman and Landusky with 20/20 hindsight. Utah Division of Oil, Gas, and Mining. Avail-able: https://fs.ogm.utah.gov/pub/mines/AMR_Related/NAAMLP/EnDesign/Maehl.pdf. (September 2010).
Malcolm, I., C. Soulsby, A. Youngson, D. Hannah, I.
Kimmel, W. 1983. The impact of acid mine drainage on the stream ecosystem. Pages 424–437 in S. Majumdar, and E. Miller, editors. Pennsylvania coal: resources, technology, and utilization. Pennsylvania Academy of Science, Easton, PA.
Kleppe v. Sierra Club, 427 U.S. 390, 410 (1976)
Kline, T., J. Goering, O. Mathisen, P. Poe, P. Parker, and R. Scalan. 1993. Recycling of elements transported upstream by runs of Pacific salmon: II.δ15N and δ13C evidence in the Kvichak River watershed, Bristol Bay, southwestern Alaska. Canadian Journal of Fisheries and Aquatic Sciences 50(11):2350–2365.
Knight Piesold Consulting, editor. 2006a. Northern Dynasty Mines Inc., pebble project: tailings impoundment A, initial application report. Ref. No. VA101-176/16-13. Knight Pie-sold Ltd., Vancouver, B.C.
Knight Piesold Consulting, editor. 2006b. Northern Dynasty Mines Inc., pebble project: tailings impoundment G, initial application report. Ref. No. VA101-176/16-12. Knight Pie-sold Ltd., Vancouver, B.C.
Knudsen, E., D. McDonald, C. Stewart, J. Williams, and D. Reiser. 1999. Sustainable fisheries management: Pacific salmon. CRC Press LLC, Boca Raton, FL.
Koenings, J., and R. Burkett. 1987. Population characteris-tics of sockeye salmon (Oncorhynchus nerka) smolts rela-tive to temperature regimes, euphotic volume, fry density, and forage base within Alaskan lakes. Pages 216–234 in H. Smith, L. Margolis, and C. Wood, editors. Proceedings of the international sockeye salmon symposium, November 19–22, 1985, Nanaimo, B.C.: sockeye salmon (Oncorhyn-chus nerka) population biology and future management. Fisheries and Oceans Canada, Canadian Special Publication of Fisheries and Aquatic Sciences No. 96, Ottawa, ON.
Kuipers, J., A. Maest, K. MacHardy, and G. Lawson. 2006. Comparison of predicted and actual water quality at hardrock mines: the reliability of predictions in environ-mental impact statements. Kuipers & Associates and Buka Environmental, Butte, MT.
Kyle, R., and T. Brabets. 2001. Water temperature of streams in the Cook Inlet Basin, Alaska, and implications of climate change. National Water-Quality Assessment Pro-gram, U.S. Geological Survey, Water-Resources Investiga-tions Report 01-4109, Anchorage, AK.
Lang, D., G. Reeves, J. Hall, and M. Wipfli. 2006. The influ-ence of fall-spawning coho salmon (Oncorhynchus kisutch) on growth and production of juvenile coho salmon rearing in beaver ponds on the Copper River Delta, Alaska. Canadi-an Journal of Fisheries and Aquatic Sciences 63(4):917–930.
Lapakko, K., and D. Antonson. 1994. Oxidation of sulfide minerals present in Duluth Complex rock: a laboratory study. Pages 593–607 in C. Alpers, and D. Blowes, editors. Environmental Geochemistry of Sulfide Oxidation. Ameri-can Chemical Society Symposium Series 550.
LaRoche, G., and L. Shelton. 2011. Lake and peninsula bor-ough coastal management program revised public hearing draft—March 2011. Alaska Coastal Management Program, Office of Project Management and Permitting, Alaska Department of Natural Resources. Available: http://alaska-coast.state.ak.us/District/DistrictPlans_Final/LakeandPen/revised_phd/vol1_rphd.pdf. (July 2011).
Lauren, D., and M. McDonald. 1985. Effects of copper

105Literature Cited
microbial analysis and applications. Marcel Dekker, Inc., New York, NY.
Mining Watch. 2005. Wheaton River profits from destruc-tion at Bajo La Alumbrera, Argentina. Mining Watch Canada. Available: http://www.miningwatch.ca/en/whea-ton-river-profits-destruction-bajo-la-alumbrera-argentina. (June 2011).
Mitchell, L. 2004. Zortman and Landusky mines Montana House joint resolution 43 report: water quality impacts. MEQC (Montana Environmental Quality Council), Helena, MT. Available: http://leg.mt.gov/content/publications/envi-ronmental/2004 zortman.pdf. (September 2010).
Molony, B. 2001. Environmental requirements and toler-ances of rainbow trout (Oncorhynchus mykiss) and brown trout (Salmo trutta) with special reference to Western Aus-tralia: a review. Fisheries Research Division, Western Austra-lia Marine Research Laboratories, Department of Fisheries, Government of Western Australia, Report No. 130, South Beach, Western Australia.
Moon, A., and C. Lucostic. 1979. Effects of acid mine drain-age on a southwestern Pennsylvania stream. Water, Air, and Soil Pollution 11(3):377–390.
Moran, R. 1974. Trace element content of a stream affected by metal-mine drainage, Bonanza, Colorado. Ph.D. disserta-tion, University of Texas, Austin.
Moran, R., and D. Wentz. 1974. Effects of metal-mine drainage on water quality in selected areas of Colorado, 1972–1973. Colorado Water Conservation Board. Water Resources Circular No. 25. Available: http://co.water.usgs.gov/publications/pubsnonusgs.html. (December 2011).
Moran, R. 2001. Mining environmental impacts: integrat-ing an economic perspective. Pages 67–77 in N. Borregaard, and C. Gana, editors. Towards the integration of environ-mental, economic, and trade aspects in the mining sector. Centro de Investigacion y Planificacion del Medio Ambi-ente, Santiago, Chile.
Moran, R. 2007. Pebble hydrogeology and geochemistry is-sues. Submitted to Renewable Resource Coalition, Anchor-age, Alaska. Available at: http://www.renewableresourcesco-alition.org/MoranSep07.pdf. (December 2011).
Morris, R., E. Taylor, D. Brown, and J. Brown. 1989. Acid toxicity and aquatic animals. Society of experimental biol-ogy seminar series, No. 34. Cambridge University Press, New York, NY.
Moran, R., and D. Galloway. 2007. Ground water in the Anchorage area, Alaska: meeting the challenges of ground-water sustainability. U.S. Geological Survey, Fact Sheet 2006-3148, Anchorage, AK.
Morrow, J. 1980. The freshwater fishes of Alaska. Alaska Northwest Publishing, Anchorage, AK.
Morstad, S., M. Jones, T. Sands, P. Salomone, T. Baker, G. Buck, and F. West. 2010. 2009 annual Bristol Bay man-agement report. Divisions of Sport Fish and Commercial Fisheries, Alaska Department of Fish and Game, Fisheries Management Report No. 10-25, Anchorage, AK. Available: http://www.sf.adfg.state.ak.us/FedAidpdfs/FMR10-25.pdf. (August 2010).
MPRSA (Marine Protection, Research, and Sanctuaries Act of 1972) § 2, 33 U.S.C. § 1401 (2000).
McLaren, and A. Thorne. 2004. Hydrological influences on hyporheic water quality: implications for salmon egg survival. Hydrological Processes 18(9):1543–1560.
Manley, W., and D. Kaufman. 2002. Alaska PaleoGacier Atlas. Institute of Arctic and Alpine Research, Boulder, CO.
Maret, T., and D. MacCoy. 2002. Fish assemblages and environmental variables associated with hard-rock mining in the Coeur d’Alene River Basin, Idaho. Transactions of the American Fisheries Society 131(5):865–884.
Maret, T., D. Cain, D. MacCoy, and T. Short. 2003. Re-sponse of benthic invertebrate assemblages to metal exposure and bioaccumulation associated with hard-rock mining in northwestern streams, USA. Journal of the North American Benthological Society 22(4):598–620.
Martin, S. 2004. Determinants of well-being in Iñupiat and Yupiit eskimos: do communities matter? Ph.D. dissertation, University of Texas, Dallas, TX. Available: http://www.iser.uaa.alaska.edu/Projects/living_conditions/images/smartin_dissertation_draft10_5.pdf. (August 2010).
Martin, S., and W. Platts. 1981. Influence of forest and rangeland management on anadromous fish habitat in western North America: effects of mining. Pacific Northwest Forest and Range Experiment Station, U.S. Department of Agriculture Forest Service, General Technical Report PNW-119, Portland, OR.
Mazor, E. 1991. Applied chemical and isotopic groundwater hydrology. Halsted Press, New York, NY.
McCollum, D., and S. Miller. 1994. Alaska hunters: their hunting trip characteristics and economics. Information Management Program, Division of Wildlife Conservation, Alaska Department of Fish and Game, Anchorage, AK.
McCullough, D., S. Spalding, D. Sturdevant, and M. Hicks. 2001. Issue paper 5: summary of technical literature exam-ining the effects of temperature on salmonids. Temperature Water Quality Criteria Guidance Development Project, Region 10, U.S. Environmental Protection Agency, EPA-910-D-01-005, Seattle, WA.
McDiarmid, G. Williamson, S. Goldsmith, M. Killorin, S. Sharp, and C. Hild. 1998. Expanding job opportunities for Alaska natives. Institute of Social and Economic Research, University of Alaska Anchorage, AK. Available: http://www.iser.uaa.alaska. edu/publications/client/afnjobs/afnjobs.htm. (August 2010).
McKetta, J. 1992. Petroleum processing handbook. Marcel Dekker, Inc., New York, NY.
McIntryre, J., D. Baldwin, J. Meador, and N. Scholz. 2008. Chemosensory deprivation in juvenile coho salmon exposed to dissolved copper under varying water chemistry condi-tions. Environmental Science and Technology 42:1352–1358.
Mecklenburg, C., T. Mecklenburg, and L. Thorsteinson. 2002. Fishes of Alaska. The American Fisheries Society. Bethesda, MD.
Meehan, W., editor. 1991. Influences of forest and rangeland management on salmonid fishes and their habitats. Ameri-can Fisheries Society Special Publication No. 19. American Fisheries Society Publications, Evans City, PA.
Mills, A. 1985. Acid mine drainage: microbial impact on the recovery of soil and water ecosystems. Pages 41–43 in R. Tate, and D. Klein, editors. Soil reclamation processes:

106
Togiak National Wildlife Refuge, U.S. Fish and Wildlife Service, Dillingham, AK.
Nelson, J. 1982. Physiological observations on developing rainbow trout, Salmo gairdneri (Richardson), exposed to low pH and varied calcium ion concentrations. Journal of Fish Biology 20(3):359–372.
Nelson, M. 1965. A compilation of notes and biological data from the Nushagak and Togiak Districts, Bristol Bay 1956–64. Division of Commercial Fisheries, Alaska Depart-ment of Fish and Game, Bristol Bay Data Report Series No. 1, Dillingham, AK.
NEPA (National Environmental Policy Act of 1969) § 102, 42 U.S.C. § 4332 (C) (1982).
Newcombe, C., and D. MacDonald. 1991. Effects of sus-pended sediments on aquatic ecosystems. North American Journal of Fisheries Management 11(1):72–82.
NOAA (National Oceanic and Atmospheric Administra-tion). 2010. ESA consultations. Northwest Regional Office, NOAA. Available: http://www.nwr.noaa.gov/Salmon-Habi-tat/ESA-Consultations. (December 2010).
Nobmann, E. 1997. Nutritional benefits of native foods. Institute of Social and Economic Research , University of Alaska Anchorage, AK. Available: www.nativeknowledge.org/db/files/ntrindex.htm. (August 2010).
Nondalton Tribal Council et al. v. State of Alaska et al. No. 3DI-09-46 CI, Amended Complaint for Declaratory Judg-ment (Alaska Super. Ct. 3rd Jud. Dist. at Dillingham June 9, 2009).
Nowacki, G., P. Spencer, M. Fleming, T. Brock, and T. Jorgenson. 2001. Ecoregions of Alaska and neighboring territory. U.S. Geological Survey, Survey Open-File Report 02-297, Reston, VA.
NRC (National Research Council). 1996. Upstream: salmon and society in the Pacific Northwest. Committee on Protec-tion and Management of Pacific Northwest Anadromous Salmonids, Board on Environmental Studies and Toxicology, Commission on Life Sciences, editors. National Academy Press, Washington D.C.
NRC. 2005. Superfund and mining megasites—lessons from the Coeur d’Alene River Basin. National Academies Press, Washington, D.C.
Nunamta Aulukestai and Trout Unlimited Alaska Chapter. 2009. Biological, technical questions and answers about Pebble Mine. Alaska Legislature. Available: www.legis.state.ak.us/basis/get_documents.asp?session=26&docid=1400. (August 2010).
ODEQ (Oregon Department of Environmental Quality). 2005. Turbidity criteria for other western states and British Columbia. ODEQ, Environmental Quality Commission. Available: http://www.deq.state.or.us/about/eqc/agendas/at-tachments/aug2005/G-AttB.WQTurbidityStateCompare.pdf. (September 2010).
ODHS (Oregon Department of Human Services). 2010. Public health assessment, Formosa Mine, Riddle, Oregon. ODHS, Salem, OR.
OEC (Ohio Environmental Council). 2011. Will there soon be an end to massive coal slurry ponds in Ohio? Available: http://www.theoec.org/PDFs/FactSheets/CaptinaCreekFact-Sheet.pdf. (November 2011).
Murphy, K. 2010. Battle over Pebble Mine shifts to EPA. Los Angeles Times. Available: http://latimesblogs.latimes.com/greenspace/2010/08/battle-over-pebble-mine-shifts-to-epa.html. (December 2010).
Murray, C., and J. McPhail. 1988. Effect of incubation temperature on the development of five species of Pacific salmon (Oncorhynchus) embryos and alevins. Canadian Journal of Zoology 66(1):266–273.
Myrick, C., and J. Cech. 2004. Temperature effects on ju-venile anadromous salmonids in California’s central valley: what don’t we know? Reviews in Fish Biology and Fisheries 14(1):113–123.
Naiman, R., R. Bilby, D. Schindler, and J. Helfield. 2002. Pacific salmon, nutrients, and the dynamics of freshwater and riparian ecosystems. Ecosystems 5(4):399–417.
Nayar, S., B. Goh, and L. Chou. 2004. Environmental impact of heavy metals from dredged and resuspended sediments on phytoplankton and bacteria assessed in situ mesocosms. Ecotoxicology and Environmental Safety 59(3):349–369.
NDM (Northern Dynasty Mines) Inc. 2005. Draft environ-mental baseline studies: 2004 progress reports. Chapter 8: Geochemical characterization and ML/ARD. Alaska Depart-ment of Natural Resources. Available: http://dnr.alaska.gov/mlw/mining/largemine/pebble/2004_reports/pr_ch08.pdf. (July 2010).
NDM Inc. 2006a. Pebble project: application for water right, unnamed tributary (NK1.190) North Fork Koktuli River. NDM Inc., Anchorage, AK.
NDM Inc. 2006b. Pebble project: application for water right, Upper Talarik Creek. NDM Inc., Anchorage, AK.
NDM Inc. 2006c. Pebble project: application for water right, South Fork Koktuli River. NDM Inc., Anchorage, AK.
NDM Inc. 2006d. Pebble project: application for ground-water right, unnamed tributary (NK1.190) North Fork Koktuli River. NDM Inc., Anchorage, AK.
NDM Inc. 2006e. Pebble project: application for groundwa-ter right, Upper Talarik Creek. NDM Inc., Anchorage, AK.
NDM Inc. 2006f. Pebble project: application for groundwater right, South Fork Koktuli River. NDM Inc., Anchorage, AK.
NDM (Northern Dynasty Minerals) Ltd. 2007. Program and update on metallurgy and resources on the Pebble copper-gold-molybdenum project, Iliamna Lake area, south-western Alaska, U.S.A., NDM Ltd. Technical Report NI 43-101. Vancouver, B.C.
NDM Ltd. 2010a. Northern Dynasty partners and inves-tors. NDM Ltd. Available: http://www.northerndynastymin-erals.com/ndm/NDP.asp. (August 2010).
NDM Ltd. 2010b. Measured and indicated mineral re-sources. Inferred mineral resources. NDM Ltd. Available: http://www.northerndynastyminerals.com/i/pdf/ndm/NDM_MRES.pdf. (August 2010).
Nehlsen, W., J. Williams, and J. Lichatowich. 1991. Pacific salmon at the crossroads: stocks at risk from California, Oregon, Idaho, and Washington. Fisheries. 16(2):4–21.
Nelle, R. 2002. Species occurrence and length frequency dis-tribution of fish in six lakes and five streams of the waters of the Togiak National Wildlife Refuge, Alaska, 2000–2002.

107Literature Cited
and aquatic animals. Society for experimental biology semi-nar series 34. Cambridge University Press, New York, NY.
PSF (Pacific Salmon Foundation). 2008. Mount Washington: acid rock drainage remediation. PSF. Available: http://www.psf.ca/index.php?option=com_content&view=article&id=16&Itemid=44. (December2010).
Quinn, T. 2004. The behavior and ecology of Pacific salmon and trout. University of Washington Press, Seattle, WA.
Quinn, T., C. Wood, L. Margolis, B. Riddell, and K. Hyatt. 1987. Homing in wild sockeye salmon (Oncorhynchus nerka) populations as inferred from differences in parasite prevalence and allozyme allele frequencies. Canadian Jour-nal of Fisheries and Aquatic Sciences 44(11):1963–1971.
Ramstad, K., C. Woody, G. Sage, and F. Allendorf. 2004. Founding events influence genetic population structure of sockeye salmon (Oncorhynchus Nerka) in Lake Clark, Alaska. Molecular Ecology 13(2):277–290.
Ramstad, K., C. Woody, and F. Allendorf. 2009. Recent local adaptation of sockeye salmon to glacial spawning habitats. Evolutionary Ecology 24(2):391–411.
Rebagliati, C., and J. Payne. 2007. 2006 Summary report on the Pebble porphyry gold-copper project, Iliamna lake area, Southwestern Alaska, U.S.A.
Reeves, G., F. Everest, and J. Sedell. 1993. Diversity of juve-nile anadromous salmonid assemblages in coastal Oregon basins with different levels of timber harvest. Transactions of the American Fisheries Society 122(3):309–317.
Reimchen, T. 1994. Further studies of predator and scaven-ger use of chum salmon in stream and estuarine habitats at Bag Harbour, Gwaii Haanas. Report of Islands Ecological Research to Canadian Parks Service, Queen Charlotte City, B.C.
Reiser, D., and R. White. 1998. Effects of two sediment size-classes on survival of steelhead and Chinook salmon eggs. North American Journal of Fisheries Management 8(4):432–437.
Rich, W. 1939. Local populations and migration in relation to the conservation of Pacific salmon in the western states and Alaska. Department of Research, Oregon Fish Commis-sion. State Printing Office, Salem, OR.
Richardson, J. 2011. Pebble CEO said mine’s energy need could make gas line, dam viable. Fairbanks Daily News Miner. Available: http://newsminer.com/view/full_story/11022227/article-Pebble-CEO-said-mine-s#ixzz1BQArjxdq. (February 2011).
Rico, M., G. Benito, A. Salgueiro, A. and A. Diez-Herrero. 2008. Reported tailing dam failures: A review of the Euro-pean incidents in the worldwide context. Journal of Hazard-ous Materials. 152(2):846–852.
Rieman, B., D. Isaak, S. Adams, D. Horan, D. Nagel, C. Luce, and D. Myers. 2007. Anticipated climate warming effects on bull trout habitats and populations across the in-terior Columbia River basin. Transactions of the American Fisheries Society 136(6):1552–1565.
Rio Tinto. 2007. Bingham Canyon Mine visitors center. Rio Tinto. Available: http://www.kennecott.com/visitors-center. (May 2007).
Rio Tinto. 2009. 2009 annual report—strategy, delivery, growth. Rio Tinto. Available: http://www.riotinto.com/
OEPA (Ohio Environmental Protection Agency). 2010. Biological and water quality study of the Captina Creek wa-tershed 2009. Division of Surface Water , OEPA . Available: http://www.epa.ohio.gov/portals/35/documents/Captina-CreekTSD2009.pdf. (November 2011).
Orth, D. 1971. Dictionary of Alaska place names: geologi-cal survey professional paper 567. U.S. Geological Survey, Washington, D.C.
Ott, A. 2004. Aquatic biomonitoring at Red Dog Mine, 2003. Office of Habitat Management and Permitting, Alas-ka Department of Natural Resources, Resources Technical Report 04-02, Juneau, AK.
Ott, A., and P. Scannell. 1993. Fish monitoring study, Red Dog Mine in the Wulik River drainage, emphasis on Dolly Varden (Salvelinus malma), summary report 1990–1993. Habitat and Restoration Division, Alaska Department of Fish and Game, Technical Report No. 94-1, Fairbanks, AK.
Parker, G., R. Raskin, C. Woody, and L. Trasky. 2008. Pebble Mine: fish, minerals, and testing the limits of Alas-ka’s “large mine permitting process.” Alaska Law Review 25(1):1–50.
Parmesan, C., and G. Yohe. 2003. A globally coherent fin-gerprint of climate change impacts across natural systems. Nature 421(6918):37–42.
Parsons, J. 1977. Effects of acid mine wastes on aquatic ecosystems. Water, Air, and Soil Pollution 7(3):333–354.
Paulsen, S., A. Mayio, D. Peck, J. Stoddard, E. Tarquinio, S. Holdsworth, J. Van Sickle, L. Yuan, C. Hawkins, A. Herlihy, P. Kaufmann, M. Barbour, D. Larsen, and A. Olsen. 2008. Condition of stream ecosystems in the US: an overview of the first national assessment. Journal of the North American Benthological Society 27(4):812–821.
Peck, J. 1999. Measuring justice for nature: issues in evalu-ating and litigating natural resource damages. Journal of Land Use & Environmental Law 14(2):275–306. Available: http://www.law.fsu.edu/journals/landuse/Vol142/peck1.htm. (August 2010).
Pedder, S., and E. Maly. 1985. The effect of lethal cop-per solutions on the behavior of rainbow trout (Salmo gairdneri). Environmental Contamination and Toxicology 14(4):501–507.
Perry, M., O. Canziani, J. Palutikof, P. van der Linden, and C. Hanson, editors. 2007. Contribution of working group II to the fourth assessment report of the intergovernmental panel on climate change, 2007. Cambridge University Press, New York, NY.
Poff, L., J. Allan, M. Bain, J. Karr, K. Prestegaard, B. Richter, R. Sparks, and J. Stromberg. 1997. The natural flow regime: a paradigm for river conservation and restoration. Biosci-ence 47(1):769–784.
Poff, N., B. Richter, A. Arthington, S. Bunn, R. Naiman, E. Kendy, M. Acreman, C. Apse, B. Bledsoe, M. Freeman, J. Henriksen, R. Jacobson, J. Kennen, D. Merritt, J. O’Keeffe, J. Olden, K. Rogers, R. Tharme, and A. Warner. 2010. The ecological limits of hydrologic alteration (ELOHA): a new framework for developing regional environmental flow standards. Freshwater Biology 55(1):147–170.
Potts, W., and P. McWilliams. 1989. The effects of hydrogen and aluminum ions on fish gills. Pages 201–220 in R. Mor-ris, E. Taylor, D. Brown, and J. Brown, editors. Acid toxicity

108
Biology 38(5):773–778.
Schindler, D. 1988. The effects of acid rain on freshwater ecosystems. Science 239(4836):149–157.
Schindler, D., M. Scheuerell, J. Moore, S. Gende, T. Fran-cis, and W. Palen. 2003. Pacific salmon and the ecology of coastal ecosystems. Frontiers in Ecology and the Environ-ment 1(1):31–37.
Schindler, D., R. Hilborn, B. Chasco, C. Boatright, T. Quinn, L. Rogers, and M. Webster. 2010. Population diversity and the portfolio effect in an exploited species. Nature 465(7298):609–612.
SEACC (Southeast Alaska Conservation Council). 2007. Help wanted: jobs and a healthy environment in southeast Alaska. SEACC. Available: http://seacc.org/seacc-resources/reports-and-publications-index-1/help-wanted-jobs-and-a-healthy-environment-in-southeast-alaska. (August 2010).
Septoff, A. 2006. Predicting water quality problems at hardrock mines: a failure of science, oversight, and good practice. Earthworks, Washington, D.C.
Shaffer, M. 2002. Company penalized for Arizona sludge spills. Arizona Republic (August 8):B9.
Singer, P., and W. Stumm. 1970. Acid mine drainage: the rate-determining step. Science 167:1121–1123.
SitNews. 2011. No special session to save Alaska’s coastal zone management program. SitNews (May 31). Available: http://www.sitnews.us/0511News/053111/053111_special_session.html. (June 2011).
Soulsby, C., I. Malcolm, and A. Youngson. 2001. Hy-drochemistry of the hyporheic zone in salmon spawning gravels: a preliminary assessment in a degraded agricul-tural stream. Regulated Rivers: Research & Management 17(6):651–665.
Sorensen, E. 1991. Metal poisoning in fish. CRC Press, Inc., Boca Raton, FL.
Sorenson, D., M. McCarthy, E. Middlebrook, and D. Por-cella. 1977. Suspended and dissolved solids effects on fresh-water biota: a review. Office of Research and Development, U.S. Environmental Protection Agency, EPA-600/3-77-042, Corvallis, OR.
Spence, B., G. Lomnicky, R. Hughes, and R. Novitzki. 1996. An ecosystem approach to salmonid conservation. National Marine Fisheries Service, TR-4501-96-6057, Portland, OR.
Stearns, S. 1992. The evolution of life histories. Oxford University Press, Oxford, UK.
Stickel, D. 2007. Alaska Department of Revenue. Alaska’s non-oil tax revenue. Alaska Department of Labor and Workforce Development. Available: http://www.labor.state. ak.us/research/trends/sep07econ.pdf. (August 2010).
Stockner, J., editor. 2003. Nutrients in salmonid ecosystems; sustaining production and biodiversity. American Fisheries Society, Bethesda, MD.
Stoddard, J., D. Peck, S. Paulsen, J. Van Sickle, C. Hawkins, A. Herlihy, R. Hughes, P. Kaufmann, D. Larsen, G. Lom-nicky, A. Olsen, S. Peterson, P. Ringold, and T. Whittier. 2005. An ecological assessment of western streams and rivers. U.S. Environmental Protection Agency, EPA 620/R-05/005, Washington, D.C.
Stratton, B., and B. Cross. 1990. Abundance, age, sex, and
documents/Investors/Rio_Tinto_annual_report_2009.pdf. (August 2010).
Ripley, E., R. Redmann, and A. Crowder. 1996. Environ-mental effects of mining. St. Lucie Press, Delray Beach, FL.
Robertson v. Methow Valley Citizens Council, 490 U.S. 332, 350 (1989).
Rosenberg, D., and A. Wiens. 1978. Effects of sediment ad-dition on macrobenthic invertebrates in a northern Cana-dian river. Water Research 12(10):753–763.
Rosseland, B. 1986. Ecological effects of acidification on tertiary consumers: fish population responses. Water, Air, and Soil Pollution 30(1–2):451–460.
Rothe, A. 2006. A review of industrial hard rock min-ing in Alaska. Report of Halcyon Research to Alaskans for Responsible Mining, Anchorage, AK. Available: http://northern.org/programs/clean-water-mines/alaska-mineral-resource-development-information/a-review-of-industrial-hard-rock-mining-in-alaska. (January 2011).
Rouse, W., M. Douglas, R. Hecky, A. Hershey, G. Kling, L. Lesack, P. Marsh, M. McDonald, B. Nicholson, N. Roulet, and J. Smol. 1998. Effects of climate change on the fresh-waters of arctic and subarctic North America. Hydrological Processes 11(8):873–902.
Ruediger, R., and W. Ruediger. 1999. The effects of high-ways on trout and salmon rivers and streams in the western U.S. In Proceedings from the Third International Confer-ence on Wildlife Ecology and Transportation (ICOWET III), September 13-16, Missoula, MT. Florida Department of Transportation, FL-ER-73-99, Tallahassee, FL.
Russell, R. 1980. A fisheries inventory of waters in the Lake Clark National Monument area. Division of Sport Fish, Alaska Department of Fish and Game, King Salmon, AK.
SAIC (Science Applications International Corporation). 2001. Final reclamation bond review: Grouse Creek Mine project, Salmon Challis National Forest, Idaho. Report of SAIC to U.S. Department of Agriculture Forest Service, Challis National Forest, ID.
Salomone, P., S. Morstad, T. Sands, C. Westing, T. Baker, F. West, and C. Brazil. 2007. 2006 Bristol Bay area annual management report. Division of Commercial Fisheries, Alaska Department of Fish and Game, Fishery Management Report No. 07-22, Anchorage, AK.
Sandahl, J., D. Baldwin, J. Jenkins, and N. Scholz. 2007. A sensory system at the interface between urban storm water runoff and salmon survival. Environmental Science and Technology 41(8):2998–3004.
Sandahl, J., G. Miyasaka, N. Koide, and H. Ueda. 2006. Ol-factory inhibition and recovery in chum salmon (Oncorhyn-chus keta) following copper exposure. Canadian Journal of Fisheries and Aquatic Sciences 63(8):1840–1847.
Sands, T., C. Westing, P. Salomone, S. Morstad, T. Baker, F. West, and C. Brazil. 2008. 2007 Bristol Bay area annual management report. Divisions of Sport Fish and Commerce Fisheries, Alaska Department of Fish and Game, Fishery Management Report No. 08-28, Anchorage, AK. Available: http://www.sf.adfg.state.ak.us/FedAidpdfs/fmr08-28.pdf. (September 2010).
Sayer, M., J. Reader, and R. Morris. 1991. Embryonic and larval development of brown trout, Salmo trutta L.: expo-sure to trace metal mixtures in soft water. Journal of Fish

109Literature Cited
mental impact statement – volume 1, Grouse Creek project. USDA FS, Challis National Forest, ID.
USDA FS and USEPA (U.S. Environmental Protection Agency). 2003. Removal action memorandum. USDA FS. Available: http://www.fs.fed.us/r4/sc/yankeefork/pdf/fs_epa_ removal_action_memorandum_0403.pdf. (August 2010).
USDOI (U.S. Department of the Interior). 1995. Zortman and Landusky Mines draft environmental impact statement. Hard Rock Bureau, Bureau of Land Management, USDOI and the State of Montana Department of Environmental Quality, Washington, D.C.
USEPA (U.S. Environmental Protection Agency). 1984. Final environmental impact statement: Red Dog Mine project, northwest Alaska. Region 10, Office of Water, USEPA, EPA 910/9-84-122a, Seattle, WA.
USEPA. 1991. Administrative complaint, docket no. 1090-02-16-309(g). Region 10, USEPA, Washington, D.C.
USEPA. 1994a. Technical document: acid mine drainage prediction. Special Waste Branch, Office of Solid Waste, USEPA, EPA530-R-94-036, Washington, D.C.
USEPA. 1994b, National priorities list, HRS documenta-tion record, Kennecott (south zone), NPL-016-2-20-R8, and Kennecott (north zone), NPL-016-2-19-R8.
USEPA. 1997. Damage cases and environmental releases from mines and mineral processing sites. Office of Solid Waste, USEPA, EPA A530-R-99-023, Washington D.C.
USEPA. 2000. Guidelines for preparing economic analyses. National Center for Environmental Economics, USEPA, EPA 240-R-00-003, Washington, D.C.
USEPA. 2003. Final environmental impact statement Pogo gold mine project, Delta, Alaska. National Pollutant Dis-charge Elimination System, Office of Water, USEPA, Permit Application No. AK-005334-1, Seattle, WA.
USEPA. 2004. Nationwide identification of hardrock mining sites. Evaluation report. Office of Inspector General, USEPA, Report 2004-P-00005, Washington, D.C.
USEPA. 2005. Record of decision: Brewer Gold Mine. USEPA, EPA/ROD/R2005040001494, Jefferson, SC.
USEPA. 2006. National recommended water quality criteria. Office of Water and the Office of Science and Technology, USEPA, Washington, D.C.
USEPA. 2007a. Fact sheet: Formosa Mine, Douglas County, Oregon. USEPA, Seattle, Washington. Available: http://yosemite.epa. gov/r10/cleanup.nsf/d67b5aa8215 1d9 ae88256da6005fb54e!OpenView. (August 2010).
USEPA. 2007b. Aquatic life ambient freshwater quality cri-teria: copper. USEPA, EPA-822-R-07-001. Washington, D.C.
USEPA. 2008. Letter to Randy Bates, Director, Division of Coastal and Ocean Management, ADNR (Alaska Depart-ment of Natural Resources), August 15, 2008. Division of Coastal and Ocean Management, ADNR. Available: http://alaskacoast.state.ak.us/Enews/Re-eval2008/Official Submit-ted Comments/EPA_submitted_comments.pdf. (July 2011).
USEPA. 2009a. Final data summary report: Formosa Mine superfund site, Douglas County, Oregon. Report of CDM Federal Programs Corporation to the USEPA, Region 10, Seattle, WA.
USEPA. 2009b. Chronology of 404(c) Actions. Wetlands
size statistics for Pacific salmon in Bristol Bay. Division of Commercial Fisheries, Alaska Department of Fish and Game, Technical Fishery Report 90-06, Juneau, AK.
Stratus Consulting Inc. 2009. Memorandum: initial com-ments on Pebble Mine hydrology and hydrogeology. Pre-pared by Dr. Cameron Wobus and Stratus, April 16, 2009.Strycker’s Bay Neighborhood Council, Inc. v. Karlen, 444 U.S. 223, 227-228 (1980).
Teck Cominco Alaska Inc. 2004. In RE Teck Cominco Alaska Inc., Red Dog Mine, NPDES Appeal No. 03-09: order denying review in part and remanding in part. U.S. Environmental Protection Agency. Available: http://www.epa.gov/eab/disk11/teckcominco.pdf. (September 2010).
Teck Cominco Alaska Inc. 2008. Fugitive dust risk manage-ment plan: Red Dog operations, Alaska. Report of Expo-nent to Teck Cominco Alaska Inc., Anchorage, AK. Avail-able: http://dnr.alaska.gov/mlw/mining/largemine/reddog/publicnotice/pdf/msd8.pdf. (September 2010).
Tetra Tech. 2009. Final supplemental environmental impact statement: Red Dog Mine extension, Aqqaluk Project. Re-port of Tetra Tech to U.S. Environmental Protection Agency, Region 10, Seattle, WA.
Thomas, W., J. Hollibaugh, D. Seibert, and G. Wallace Jr. 1980. Toxicity of a mixture of ten metals to phytoplankton. Marine Ecology Progress Series 2:213–220.
Thornton, T., and P. Wheeler. 2005. Subsistence research in Alaska: a thirty year perspective. Alaska Journal of Anthro-pology 3(1): 69–103. Available: http://www.eci.ox.ac.uk/publications/downloads/thornton05-alaska.pdf. (August 2010).
Throop, A. 1994. Silver Butte Mine acid rock drainage: formation and future. Oregon Department of Geology and Mineral Industries, Salem, OR.
Throop, A.1995. Reclamation of Formosa exploration’s Sil-ver Butte Mine as of December 1994. Oregon Department of Geology and Mineral Industries, Salem, OR.
Tierney, K., D. Baldwin, T. Hara, P. Ross, N. Scholz, and C. Kennedy. 2010. Copper toxicity in fishes. Aquatic Toxicol-ogy 96:2–26.
Todd, J. and D. Struhsacker. 1997. Environmentally Respon-sible Mining: Results and Thoughts Regarding a Survey of North American Metallic Mineral Mines: Society for Min-ing, Metallurgy, and Exploration Preprint 97-304, Littleton, Colorado.
Trasky, L. 2008. The potential effects of large scale copper sulfide mining on salmonids and their habitat. Submitted to Wild Salmon Center, Portland, OR.
TU (Trout Unlimited). 2010. Trout Unlimited takes legal ac-tion to protect salmon in Bristol Bay. TU. Available: http://www.tu.org/alaska/coldwater-chronicles/winter-2010/trout-unlimited-takes-legal-action. (December 2010).
USBLM (U.S. Bureau of Land Management).1995. Zortman and Landusky Mines draft environmental impact statement. USBLM, Department of the Interior, Washington, D.C.
USBOC (U.S. Bureau of the Census). 2008. Alaska quick facts. USBOC. Available: http://quickfacts.census.gov/qfd/states/02000.html. (August 2010).
USDA FS (U.S. Department of Agriculture Forest Service). 1992. Record of decision and final supplemental environ-

110
Division, USEPA, Washington, D.C. Available: http://www.epa.gov/owow/wetlands/regs/404c.html. (August 2010).
USEPA. 2009c. Clean Water Act §404(c) EPA Veto Authori-ty. Available: http://www.epa.gov/owow/wetlands/pdf/404c.pdf. (August 2010).
USEPA. 2009d. Supplemental environmental impact state-ment: Red Dog Mine extension, Aqqaluk project. Prepared by Tetra Tech for USEPA, Region 10, Seattle, WA. Available: http://www.reddogseis.com (September 2010).
USEPA. 2011a. Brewer Gold Mine, Jefferson, South Caro-lina. National Priorities List, USEPA. Available: http://www.epa.gov/superfund/sites/npl/nar1725.htm. (June 2011).
USEPA. 2011b. Clark Fork River operable unit. Superfund Program, USEPA. Available: http://www.epa.gov/region8/superfund/mt/milltowncfr/cfr/. (July 2011).
USEPA. 2011c. EPA plans scientific assessment of Bristol Bay watershed. USEPA. Available: http://yosemite.epa.gov/opa/admpress.nsf/0/8c1e5dd5d170ad99852578300067d3b3. (July 2011).
USEPA. 2011d. Overview of EPA authorities for natural resource managers developing aquatic invasive species rapid response and management plans: CWA section 404—per-mits to discharge dredged or fill material. USEPA. Available: http://water.epa.gov/type/oceb/habitat/cwa404.cfm. (June 2011).
USFWS (U.S. Fish and Wildlife Service) and NMFS (National Marine Fisheries Service).1998. Endangered Species Act con-sultation handbook. USFWS. Available: http://www.fws.gov/endangered/esa-library/pdf/TOC-GLOS.PDF. (August 2010).
USGS (U.S. Geological Survey). 1990. Chemical, geologic, and hydrogeologic data from the study of acid contamina-tion in the Miami Wash-Pinal Creek area, Arizona, J. Brown (author): U.S. Geological Survey Open-File Report 90-395.
USGS. 2008a. Effects of Ground-Water Development on Ground-Water Flow to And From Surface-Water Bodies. Available: http://pubs.usgs.gov/circ1186/html/gw-effects.html. (July 2008).
USGS. 2008b. Ground water flow and effects of pumping. Available: http://ga.water.usgs.gov/edu/earthgwdecline.html. (November 2011).
USGS. 2009a. Earthquake density maps for the United States. Earthquakes Hazards Program, USGS. Available: http://earthquake.usgs.gov/earthquakes/states/us_density.php. (August 2010).
USGS. 2009b. Historic United States earthquakes. Earth-quakes Hazards Program, USGS. Available: http://earth-quake.usgs.gov/earth quakes/states/historical_state.php. (August 2010).
USGS. 2009c. Magnitude 7 and greater earthquakes in the United States. Earthquakes Hazards Program, USGS. Available: http://earthquake.usgs.gov/earthquakes/states/large_usa_7.php. (August 2010).
USGS. 2011a. Copper mineral commodity surveys: 1999-2010. USGS. Available: http://minerals.usgs.gov/minerals/pubs/commodity/copper/mcs-2011-coppe.pdf. (October 2011).
USGS. 2011b. Gold mineral commodity surveys: 1996-2010. USGS. Available: http://minerals.usgs.gov/minerals/pubs/commodity/gold/mcs-2011-gold.pdf. (October 2011).
USGS. 2011c. Molybdenum mineral commodity surveys: 1996-2010. USGS. Available: http://minerals.usgs.gov/min-erals/pubs/commodity/molybdenum/mcs-2011-molyb.pdf. (October 2011).
USJD (U.S. Justice Department). 2001. Notice of lodg-ing of consent decree under the Clean Water Act, USJD, Federal Register. Available: http://www.federalregister.gov/articles/2001/05/22/01-12854/notice-of-lodging-of-consent-decree-under-the-clean-water-act. (November 2011).
USNPS (U.S. National Park Service). 2006. Resource man-agement news: summer 2006 projects. Katmai National Park and Preserve, USNPS, King Salmon, AK.
USSD (U.S. Society on Dams). 1994. Tailings dam incidents. USSD, Denver, CO.
Viereck, L., C. Dryness, A. Batten, and K. Wenzlick. 1992. The Alaska vegetation classification. Pacific Northwest Re-search Station, U.S. Department of Agriculture Forest Service, General Technical Report PNW-GTR-286, Portland, OR.
Wagener, S., and J. LaPerriere. 1985. Effects of placer mining on the invertebrate communities of interior Alaska streams. Freshwater Invertebrate Biology 4(4):208–214.
Wahrhaftig, C. 1965. Physiographic divisions of Alaska. U.S. Geological Survey, Professional Paper 482, Reston, VA.
Waiwood, K., and F. Beamish. 1978. The effect of copper, hardness, and pH on the growth of rainbow trout, Salmo gairdneri. Journal of Fish Biology 13(5):591–598.
Walsh, G. 1978. Toxic effects of pollutants on plankton. Pages 257–274 in G. Butler, editor. Principles of Ecotoxicol-ogy. New York, NY.
Waples, R., G. Pess, and T. Beechie. 2008. Evolutionary his-tory of Pacific salmon in dynamic environments. Evolution-ary Applications 1(2):189–206.
Waters, T. 1995. Sediment in streams: sources, biological ef-fects and control. American Fisheries Society, Bethesda, MD.
Weaver, T., and J. Fraley. 1993. A method to measure emer-gence success of west slope cutthroat trout fry from varying substrate compositions in a natural stream channel. North American Journal of Fisheries Management 13(4):817–822.
Weitzman, M. 2001. Gamma discounting. American Eco-nomic Review 91(1):260–271.
Welsh, P., J. Lipton, G. Chapman, and T. Podrabsky. 2000. Relative importance of calcium and magnesium in hard-ness based modifications of copper toxicity. Environmental Toxicology and Chemistry 19(6):1624–1631.
White Tanks Concerned Citizens, Inc. v. Strock, 563 F.3d 1033, 1039 (9th Cir. 2009).
Willson, M., and K. Halupka. 1995. Anadromous fish as keystone species in vertebrate communities. Conservation Biology 9(3):489–497.
Wilson, R., and E. Taylor. 1992. Transbranchial ammonia gradients and acid-base responses to high external ammo-nia in rainbow trout (Oncorhynchus mykiss) acclimated to different salinities. The Journal of Experimental Biology 166(1):95–112.
Wipfli, M., and C. Baxter. 2010. Linking ecosystems, food webs, and fish production: subsidies in salmonid water-sheds. Fisheries 35(8): 373–387.

Literature Cited 111
Wipfli, M., J. Hudson, J. Caouette, and D. Chaloner. 2003. Marine subsidies in freshwater ecosystems: salmon carcasses increase the growth rates of stream-resident salmonids. Trans-actions of the American Fisheries Society 132(2):371–381.
WISE (World Information Service on Energy). 2008. The Inez coal tailings dam failure (Kentucky, USA). WISE Uranium Project. Available: http://www.wise-uranium.org/mdafin.html. (June 2011).
WISE. 2011. Chronology of major tailings dam failures. WISE Uranium Project. Available: http://www.wise-uranium.org/mdaf.html. (April 2011).
Withrow, D., and K. Yano. 2008. Freshwater harbor seals of Lake Iliamna, Alaska: updated counts and research coor-dination for 2010. National Marine Mammal Laboratory, Alaska Fisheries Science Center, National, National Oceanic and Atmospheric Administration and National Marine Fish-eries Service, Seattle, WA. Available: ftp://ftp.afsc.noaa.gov/posters/pWithrow03_freshwater-seals.pdf. (August 2010).
Wolfe, R., and R. Walker. 1987. Subsistence economies in Alas-ka: productivity, geography, and development impacts. Arctic Anthropology 22(4):56–81. Available: http://www.subsistence.adfg.state.ak.us/download/subecon.pdf. (August 2010).
Woodward-Clyde Consultants. 1994. Water quality and geochemistry studies, new tailings impoundment. Report of Woodward-Clyde Consultants to Southern Peru Copper Corp., Lima, Peru.
Woody, C. 2004. Population monitoring of Lake Clark and Tazimina River sockeye salmon, Kvichak River watershed, Bristol Bay, discussion draft. Available: http://fish4thefuture.com/whitefish_discussion.html. (January 2012).
Woody, C. 2009. Fish surveys in the headwater streams of the Nushagak and Kvichak River drainages, Bristol Bay, Alaska, 2008, Final Report. Report of Fisheries Research and Consulting to The Nature Conservancy, Arlington, VA.
Woody, C., and B. Higman. 2011. Groundwater as essential salmon habitat in Nushagak and Kvichak River headwaters: issues relative to mining. Report to Center for Science in Public Participation, Bozeman, MT.
Woody, C., R. Hughes, E. Wagner, T. Quinn, L. Roulson, L. Martin, and K. Griswold. 2010. The mining law of 1872: change is overdue. Fisheries 35(7):321–331.
Woody, C., and S. O’Neal. 2010. Fish surveys in headwater streams of the Nushagak and Kvichak River drainages, Bris-tol Bay, Alaska, 2008–2010. Report of Fisheries Research and Consulting to The Nature Conservancy, Arlington, VA.
Woody, C., K. Ramstad, D. Young, G. Sage, and F. Allendorf. 2003. Population assessment of Lake Clark sockeye salmon, Final Report for Study 01-042. Office of Subsistence Man-agement, Fisheries Resource Monitoring Program, U.S. Fish and Wildlife Service, Anchorage, AK.
WRRC (Water Resources Research Center). 2001. Black Mesa spill nets $128,000 fine. WRRC, Colleges of Agricul-tural and Life Sciences, University of Arizona. Available: http://ag.arizona.edu/AZWATER/awr/mayjune01/news.html. (May 2011).
Wurts, W. 1993. Understanding water hardness. World Aquaculture 24(1):18.
Young, D., and C. Woody. 2007. The spawning distribu-tion of sockeye salmon in a glacially influenced watershed: the importance of glacial habitats. Transactions of the American Fisheries Society 136:452–459.
Yuen, H., D. Bill, M. Nelson, R. Russell, and J. Skrade. 1984. Bristol Bay Salmon (Oncorhynchus sp.) 1980—a compilation of catch, escapement, and biological data. Divi-sion of Commercial Fisheries, Alaska Department of Fish and Game, Anchorage, AK.
Yuen, H., and M. Nelson. 1984. Bristol Bay chum salmon (Oncorhynchus keta) sex, age, weight, and length statistics, 1960 to 1977. Division of Commercial Fisheries, Alaska Department of Fish and Game, Technical Data Report 127, Juneau, AK.
Zamzow, K. 2011. Baseline surface water quality near the proposed Pebble Mine, Alaska, 2009–2010: Nushagak, Kvichak, and Chulitna drainage headwaters. Report for The Nature Conservancy, Arlington, VA.
Zinn, H. 2003. A people’s history of the United States. Harper Collins, New York, NY.
Zweig, L., and C. Rabeni. 2001. Biomonitoring for deposit-ed sediment using benthic invertebrates: a test on four Mis-souri streams. Journal of the North American Benthological Society 20(4):643–657.
Chum are one of five salmon species present in the Bristol Bay region (photo by Amy Gulick).

112
This report was produced in partnership by
Bristol Bay salmon returning from the Pacific (photo by Wild Salmon Center).