Embed Size (px)
Citation preview
8/9/2019 brit proj 1
http://slidepdf.com/reader/full/brit-proj-1 1/24
Spanking Survey -1-
SPANKING RESEARCH PAPER
Project #1
SPANKIN RESEARCH AND RESEARCH PAPER
Brittney V. Smith
SOWK 300-01
Tuskegee University
February 25, 2010

8/9/2019 brit proj 1
http://slidepdf.com/reader/full/brit-proj-1 2/24
Spanking 3
It is shown that throughout the world that females are more likely to discipline with a hair
brush than male would like to discipline with a belt. This can be due to females being more
disciplinary than males would be to their kids. Sometimes the views on individuals can have an
effect on how males grow up and tend to raise their kids by spanking. In the world now we are
going through the experience of disciplining your kids is now being called child abuse and is
used very freely.
Result
Univariate Graph 1
Table 1
Sex of Respondents
__________________________________________
Sex Frequency Percent
___________________________________________
Female 44 51%
Male 31 41%

8/9/2019 brit proj 1
http://slidepdf.com/reader/full/brit-proj-1 3/24
Spanking 4
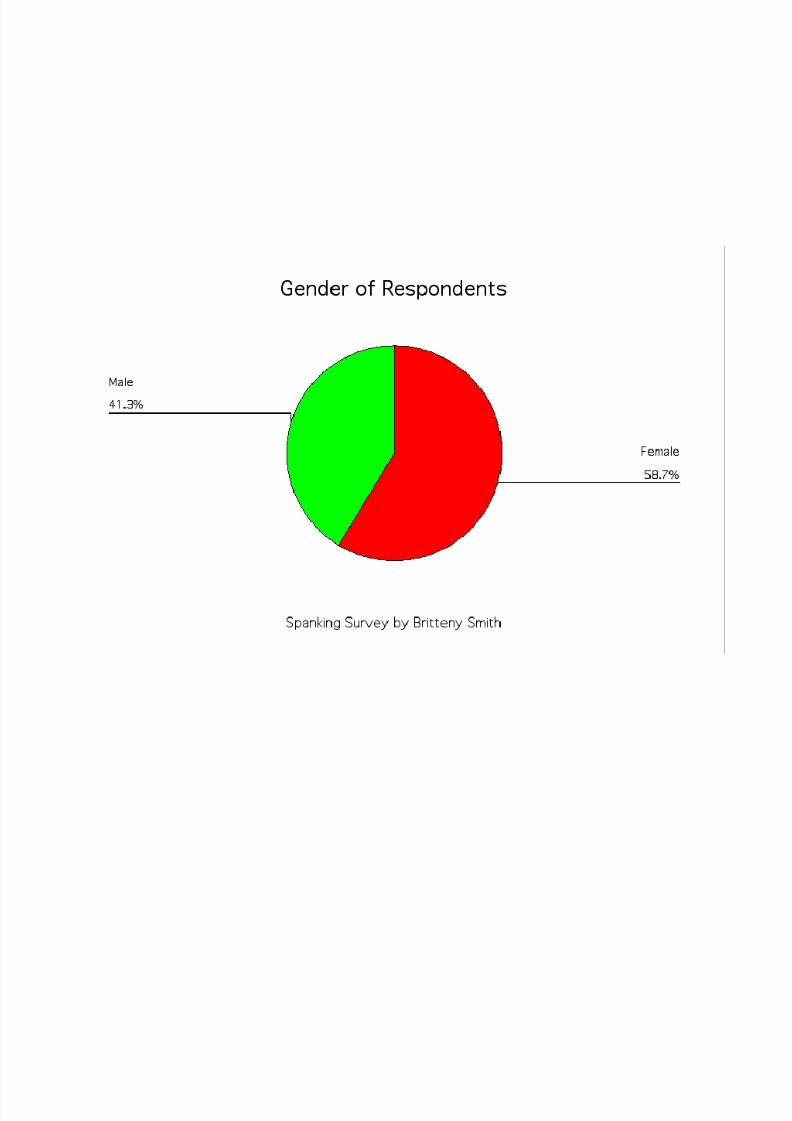
Univariate Graph 5
Table1
Sex of the Respondents
_____________________________________________________________________
Gender Frequency Percent
_____________________________________________________________________
Female 44 59
Male 31 41
Totals 75 100%
_____________________________________________________________________
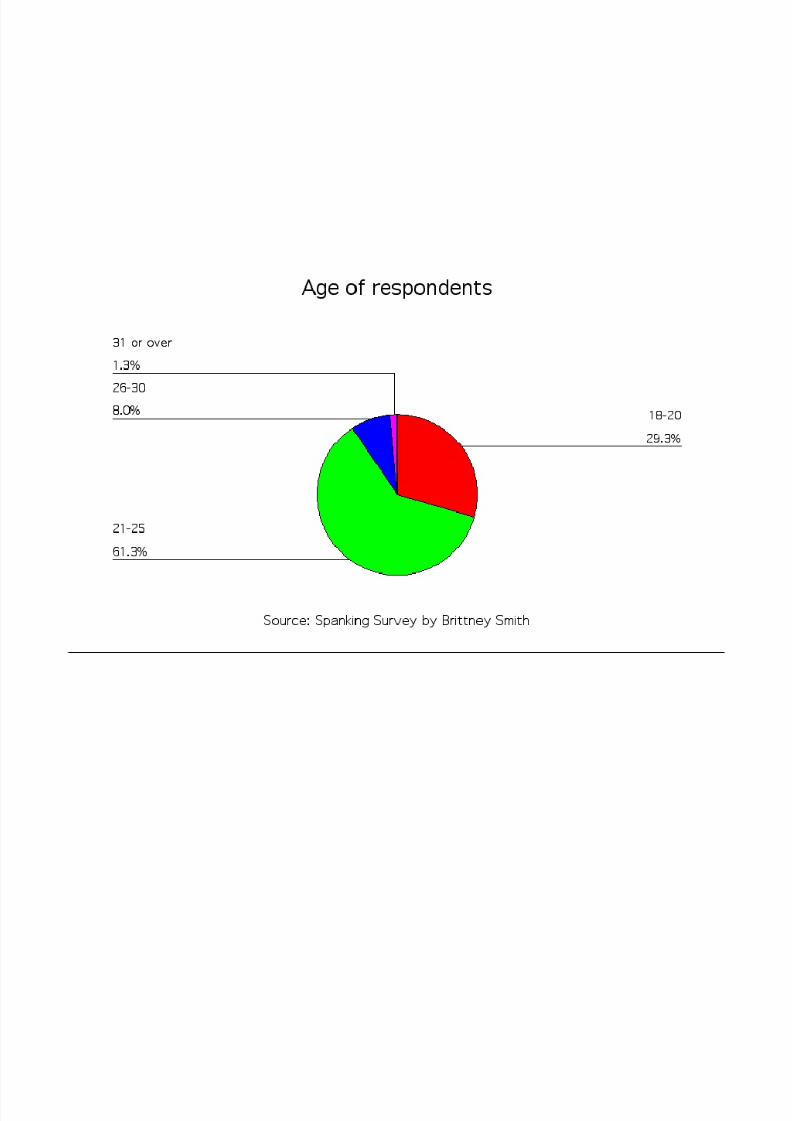
Univariate Graph 2
Table 2
Age of Respondents
___________________________________________________________________
Age Frequency Percent
____________________________________________________________________
18-20 22 29%
21-25 46 61%
26-30 6 8%
30 or over 1 1%
Total 75 100%
_____________________________________________________________________
8/9/2019 brit proj 1
http://slidepdf.com/reader/full/brit-proj-1 4/24
Spanking 6
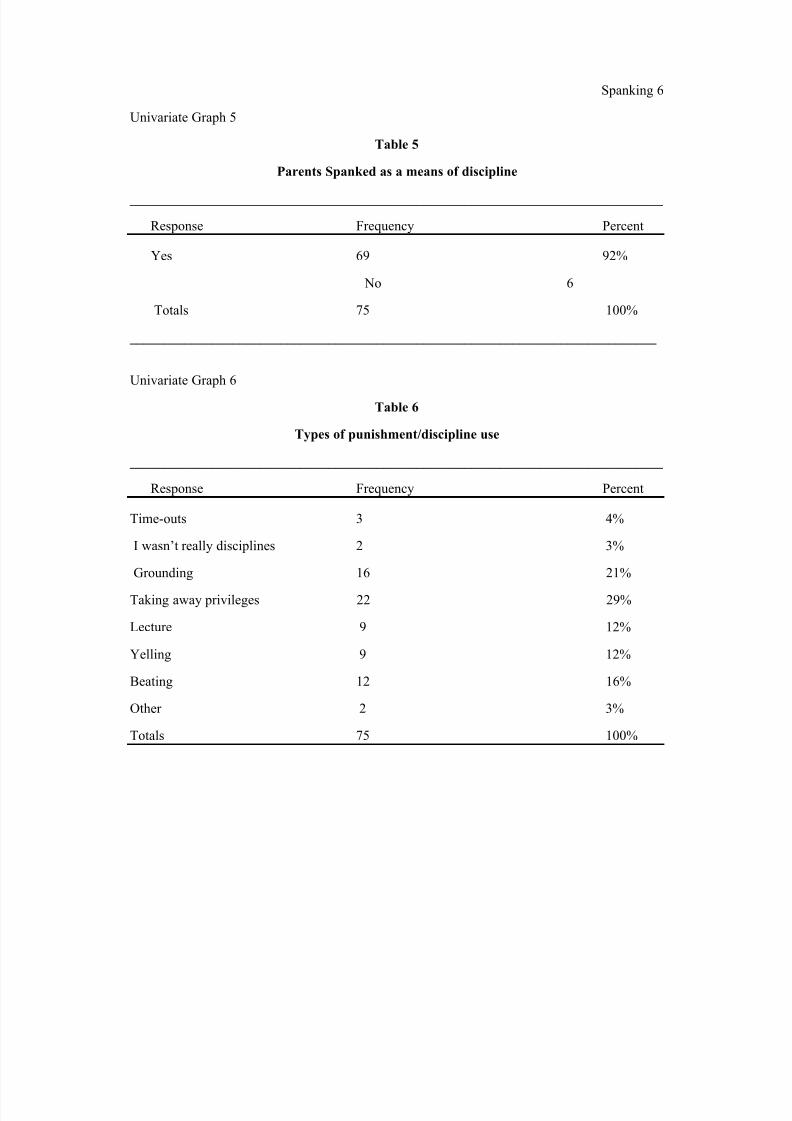
Univariate Graph 5
Table 5
Parents Spanked as a means of discipline
______________________________________________________________________________
Response Frequency Percent
Yes 69 92%
No 6
Totals 75 100%
_____________________________________________________________________________
Univariate Graph 6
Table 6
Types of punishment/discipline use
______________________________________________________________________________
Response Frequency Percent
Time-outs 3 4%
I wasn’t really disciplines 2 3%
Grounding 16 21%
Taking away privileges 22 29%
Lecture 9 12%
Yelling 9 12%
Beating 12 16%
Other 2 3%
Totals 75 100%
8/9/2019 brit proj 1
http://slidepdf.com/reader/full/brit-proj-1 5/24
Spanking 5
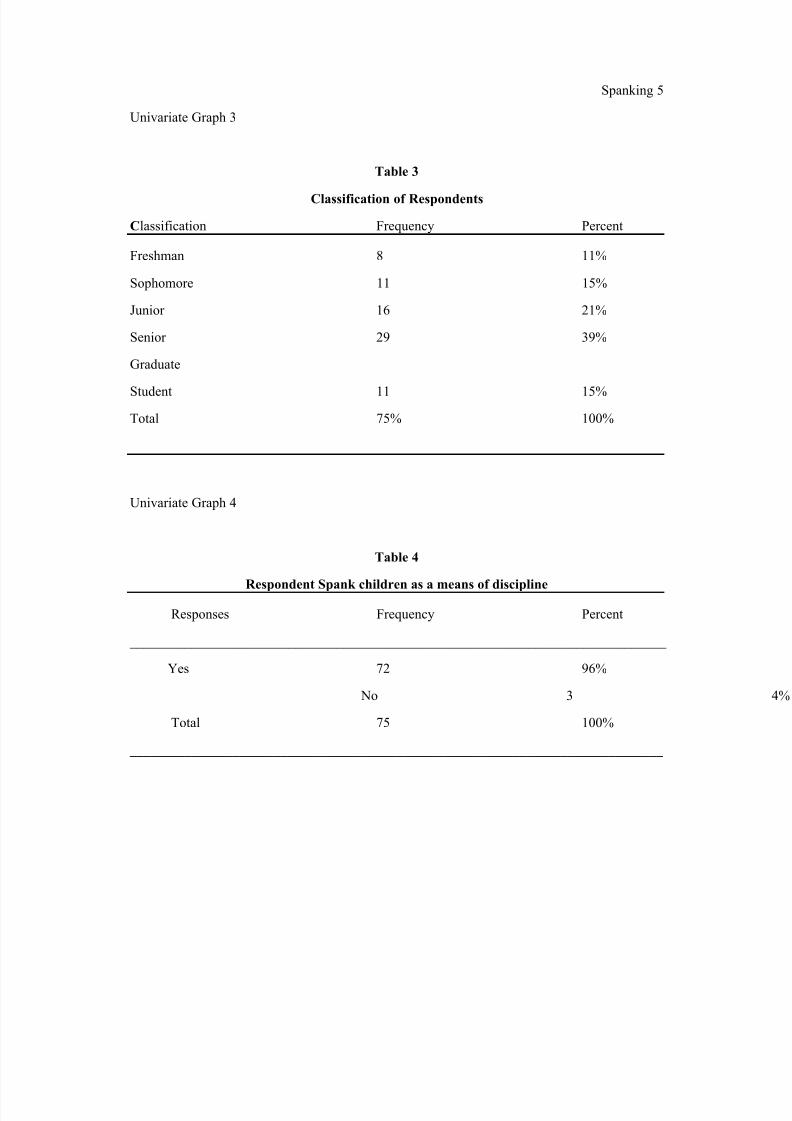
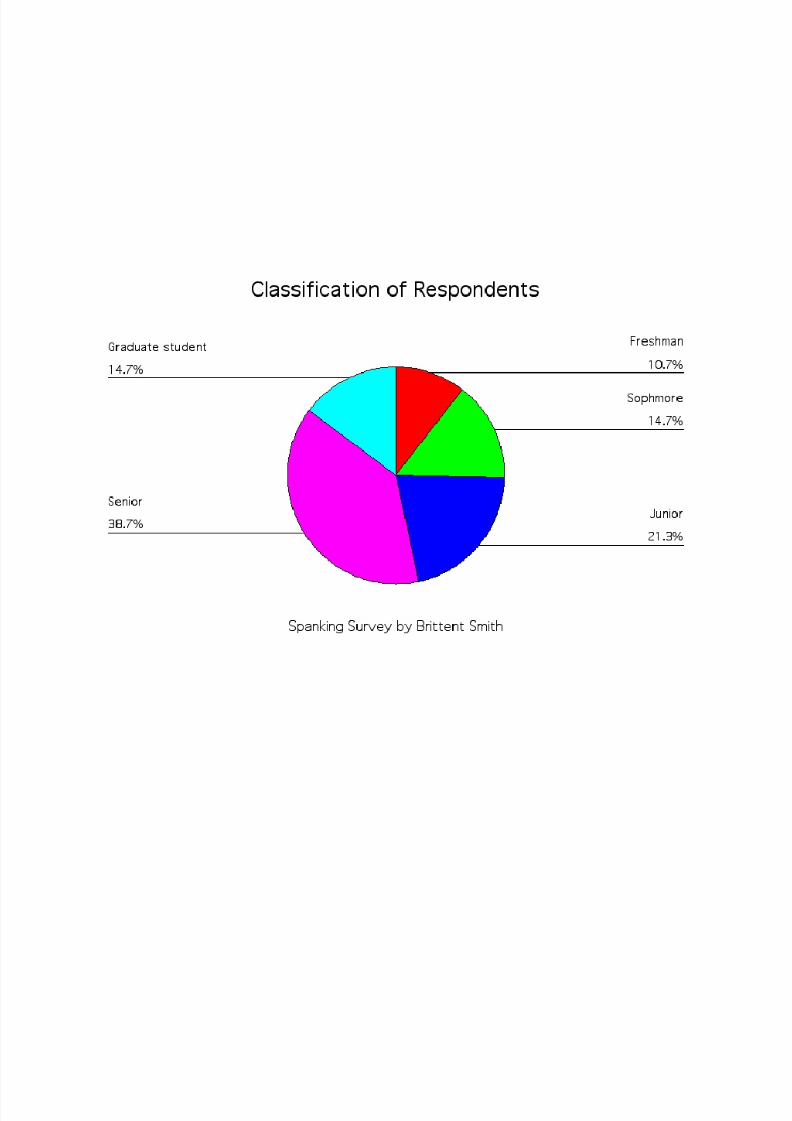
Univariate Graph 3
Table 3
Classification of Respondents
Classification Frequency Percent
Freshman 8 11%
Sophomore 11 15%
Junior 16 21%
Senior 29 39%
Graduate
Student 11 15%
Total 75% 100%
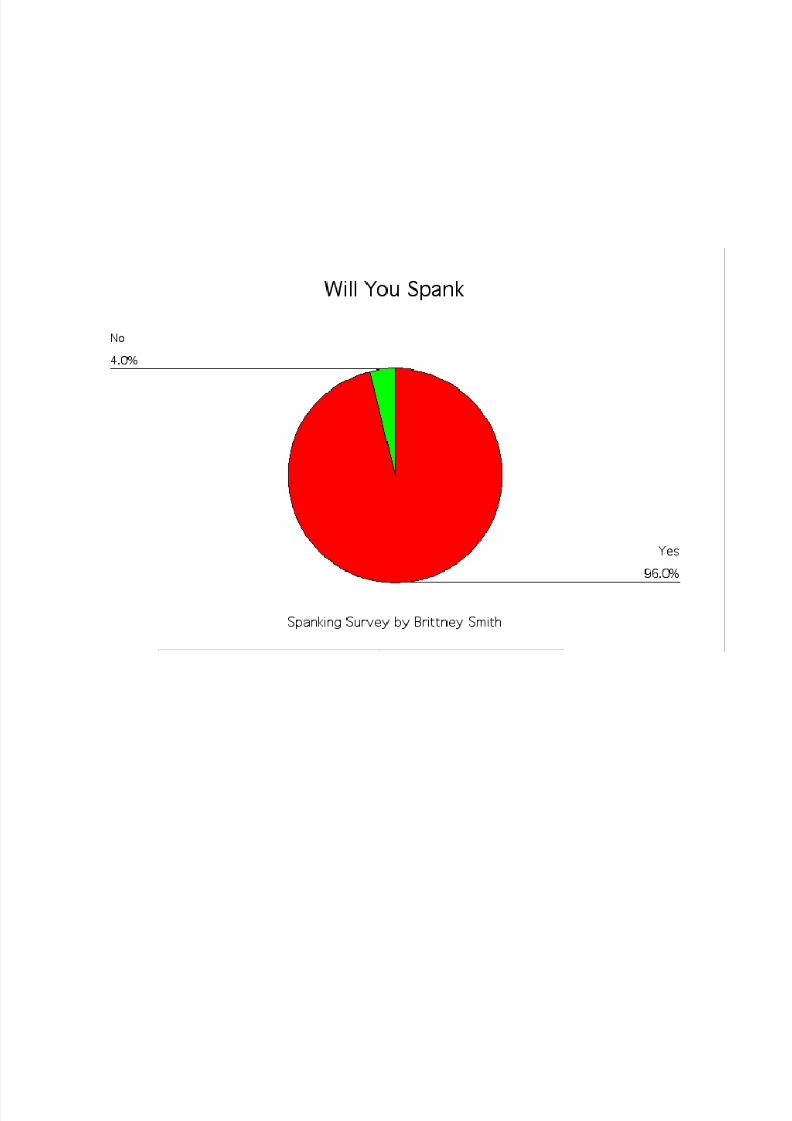
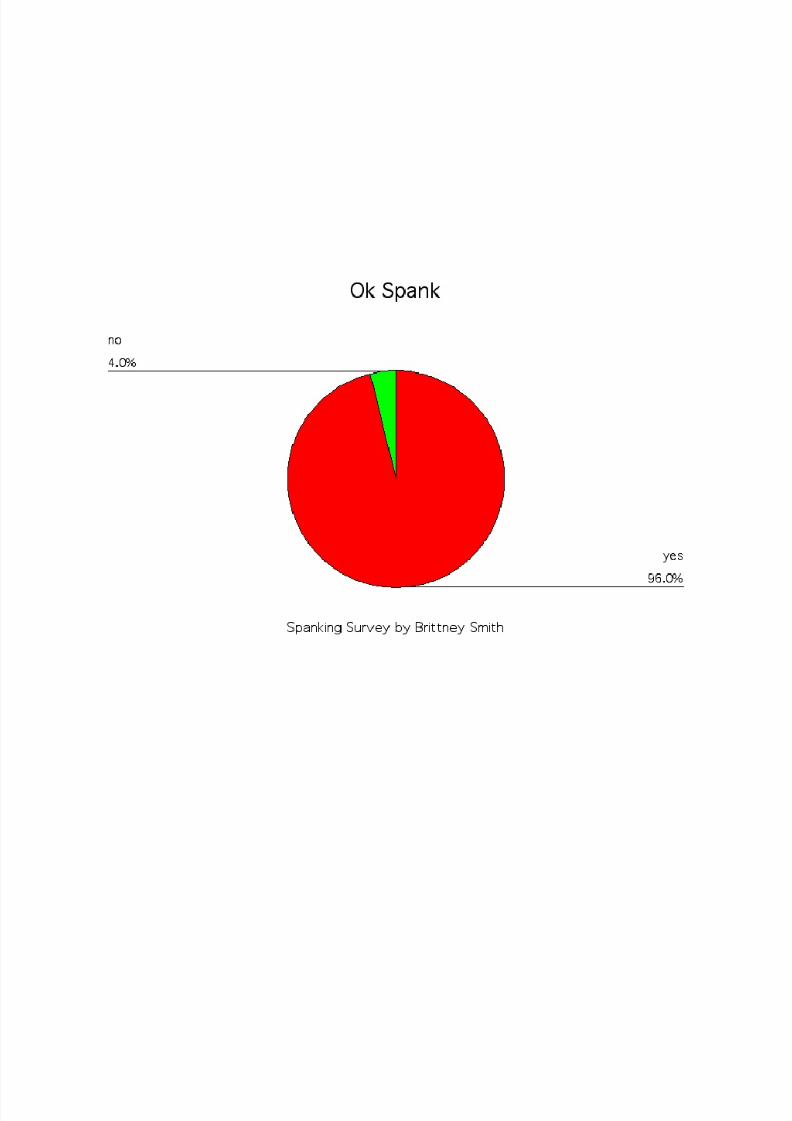
Univariate Graph 4
Table 4
Respondent Spank children as a means of discipline
Responses Frequency Percent
______________________________________________________________________________
Yes 72 96%
No 3
Total 75 100%
______________________________________________________________________________
8/9/2019 brit proj 1
http://slidepdf.com/reader/full/brit-proj-1 6/24
Spanking 7
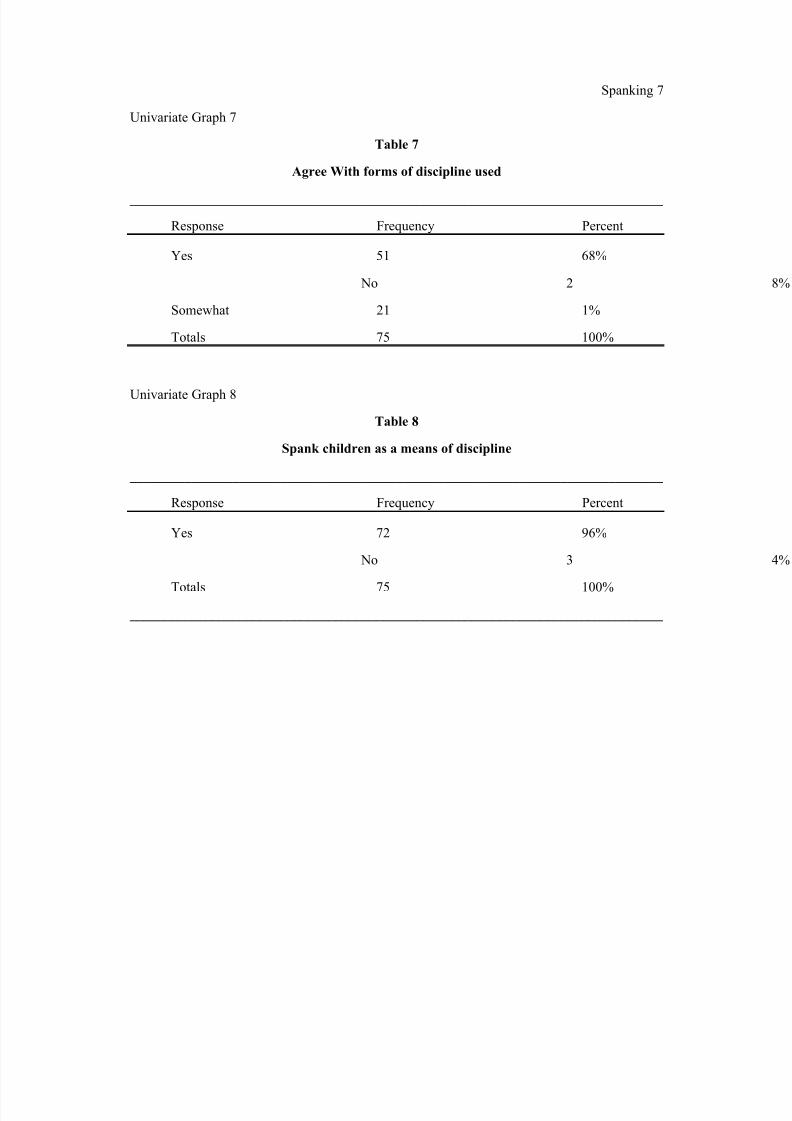
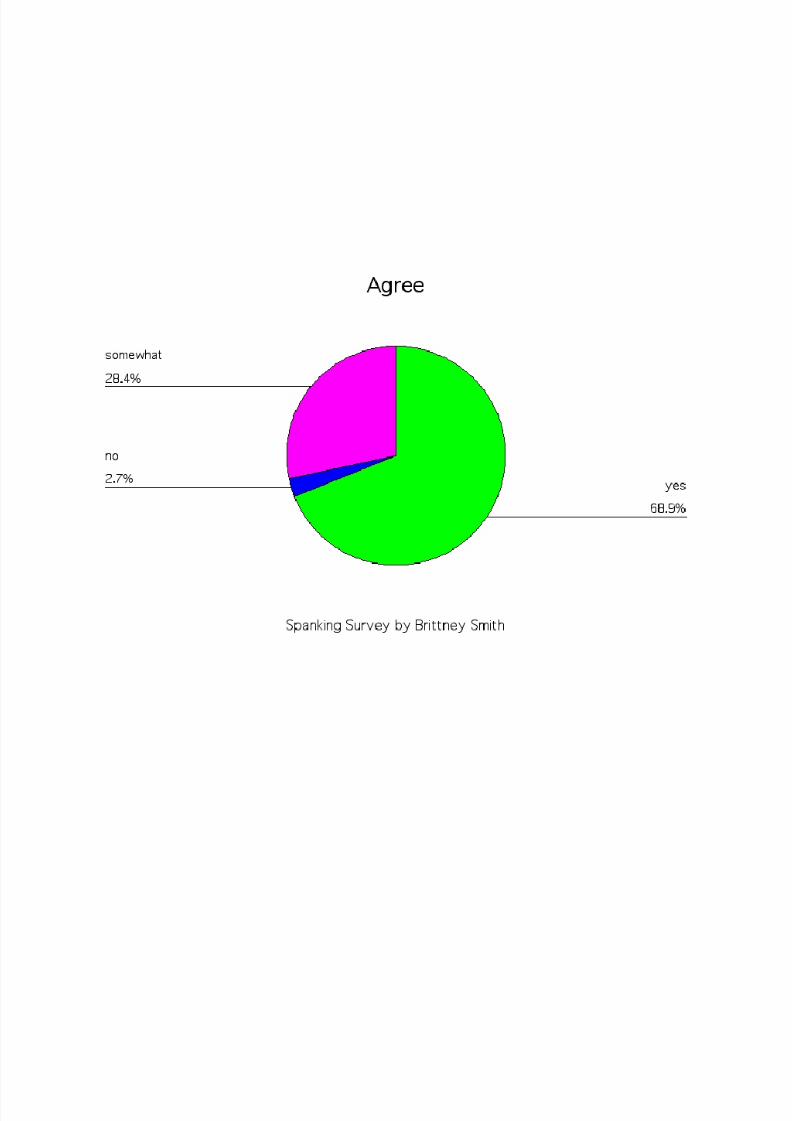
Univariate Graph 7
Table 7
Agree With forms of discipline used
______________________________________________________________________________
Response Frequency Percent
Yes 51 68%
No 2
Somewhat 21 1%
Totals 75 100%
Univariate Graph 8
Table 8
Spank children as a means of discipline
______________________________________________________________________________
Response Frequency Percent
Yes 72 96%
No 3
Totals 75 100%
______________________________________________________________________________
8/9/2019 brit proj 1
http://slidepdf.com/reader/full/brit-proj-1 7/24
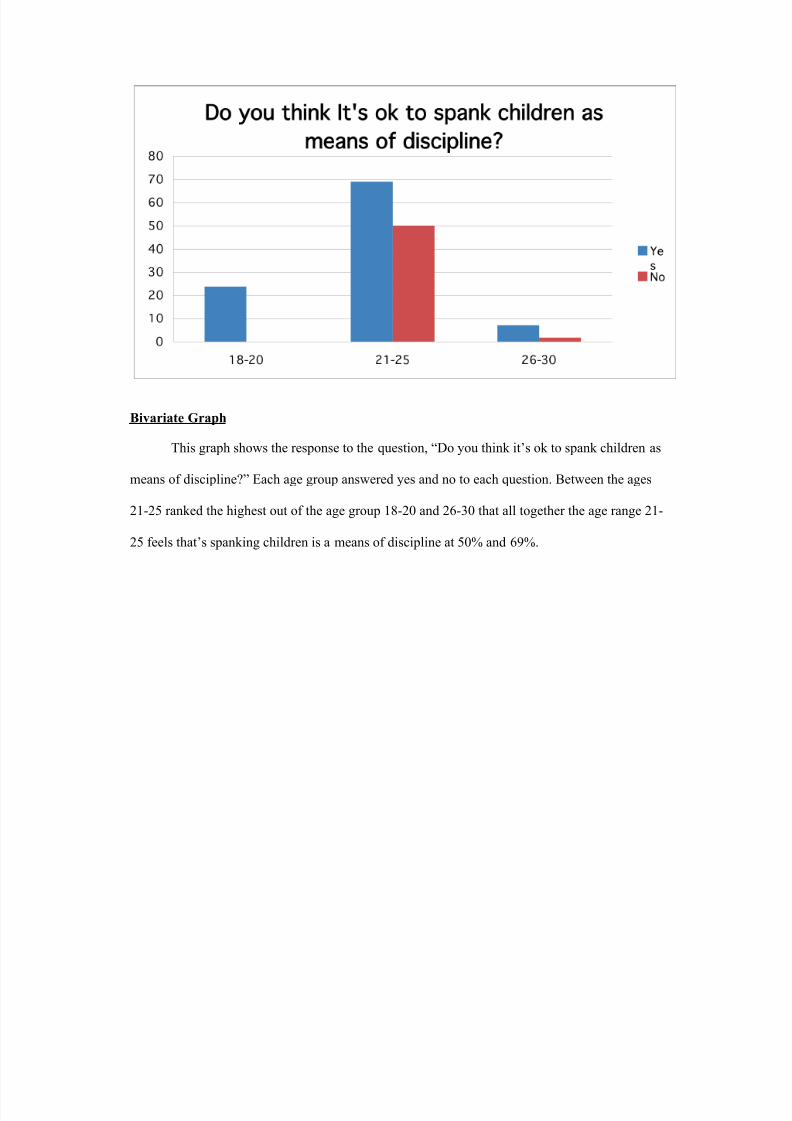
Bivariate Graph
This graph shows the response to the question, “Do you think it’s ok to spank children as
means of discipline?” Each age group answered yes and no to each question. Between the ages
21-25 ranked the highest out of the age group 18-20 and 26-30 that all together the age range 21-
25 feels that’s spanking children is a means of discipline at 50% and 69%.
8/9/2019 brit proj 1
http://slidepdf.com/reader/full/brit-proj-1 8/24
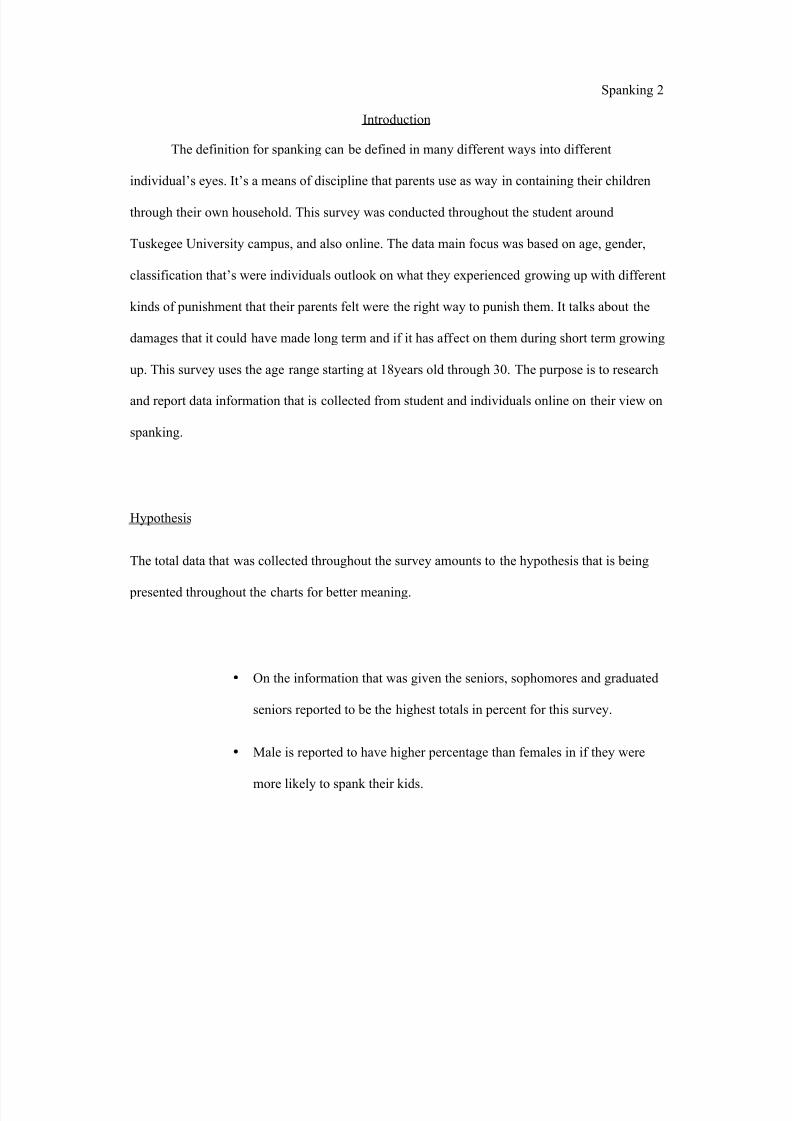
Spanking 2
Introduction
The definition for spanking can be defined in many different ways into different
individual’s eyes. It’s a means of discipline that parents use as way in containing their children
through their own household. This survey was conducted throughout the student around
Tuskegee University campus, and also online. The data main focus was based on age, gender,
classification that’s were individuals outlook on what they experienced growing up with different
kinds of punishment that their parents felt were the right way to punish them. It talks about the
damages that it could have made long term and if it has affect on them during short term growing
up. This survey uses the age range starting at 18years old through 30. The purpose is to research
and report data information that is collected from student and individuals online on their view on
spanking.
Hypothesis
The total data that was collected throughout the survey amounts to the hypothesis that is being
presented throughout the charts for better meaning.
• On the information that was given the seniors, sophomores and graduated
seniors reported to be the highest totals in percent for this survey.
• Male is reported to have higher percentage than females in if they were
more likely to spank their kids.

8/9/2019 brit proj 1
http://slidepdf.com/reader/full/brit-proj-1 9/24
Bivariate Graph 2
This graph indicates that more female than males are better off spanking their children as a
means of discipline. A total of 59.7% females answered yes to the means of discipline were
males only answered 40.3% yes to spanking their kids as a mean of discipline in the blue box. In
the pink box females stilled outscored the males by answering no at a total of 33.3% while males
only 4.4% answered no.
8/9/2019 brit proj 1
http://slidepdf.com/reader/full/brit-proj-1 10/24
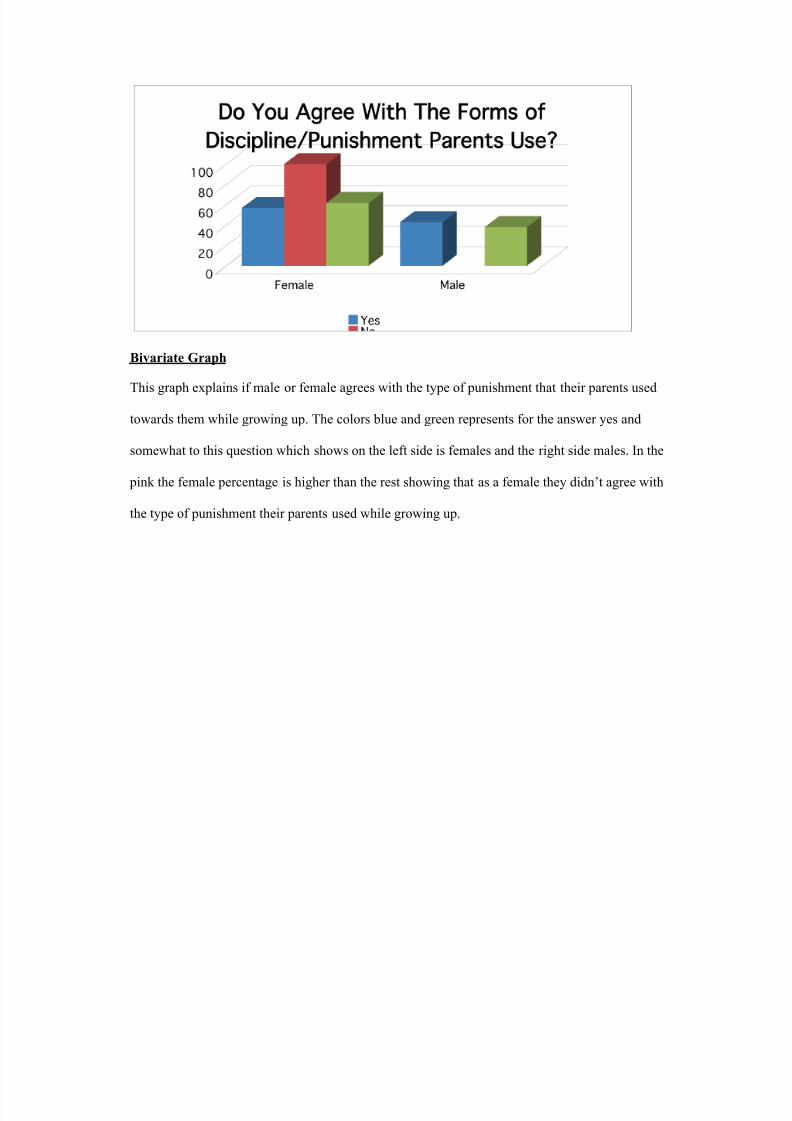
Bivariate Graph
This graph explains if male or female agrees with the type of punishment that their parents used
towards them while growing up. The colors blue and green represents for the answer yes and
somewhat to this question which shows on the left side is females and the right side males. In the
pink the female percentage is higher than the rest showing that as a female they didn’t agree with
the type of punishment their parents used while growing up.

8/9/2019 brit proj 1
http://slidepdf.com/reader/full/brit-proj-1 11/24
Multivariate Graph
• Each graph shows the information on if you felt you were to get punished by your parents
or guardian would you think they didn’t love you? The first graphs shows the females
percent rate and by the ages 21-25 100% females felt somewhat growing up when they
were to get punished they felt someone not loved

8/9/2019 brit proj 1
http://slidepdf.com/reader/full/brit-proj-1 12/24
• On the second graph the data shows that make between the ages 18-20 answer to yes they
didn’t felt love as the age tends to rise the answer no starts to take over the percentage.
8/9/2019 brit proj 1
http://slidepdf.com/reader/full/brit-proj-1 13/24
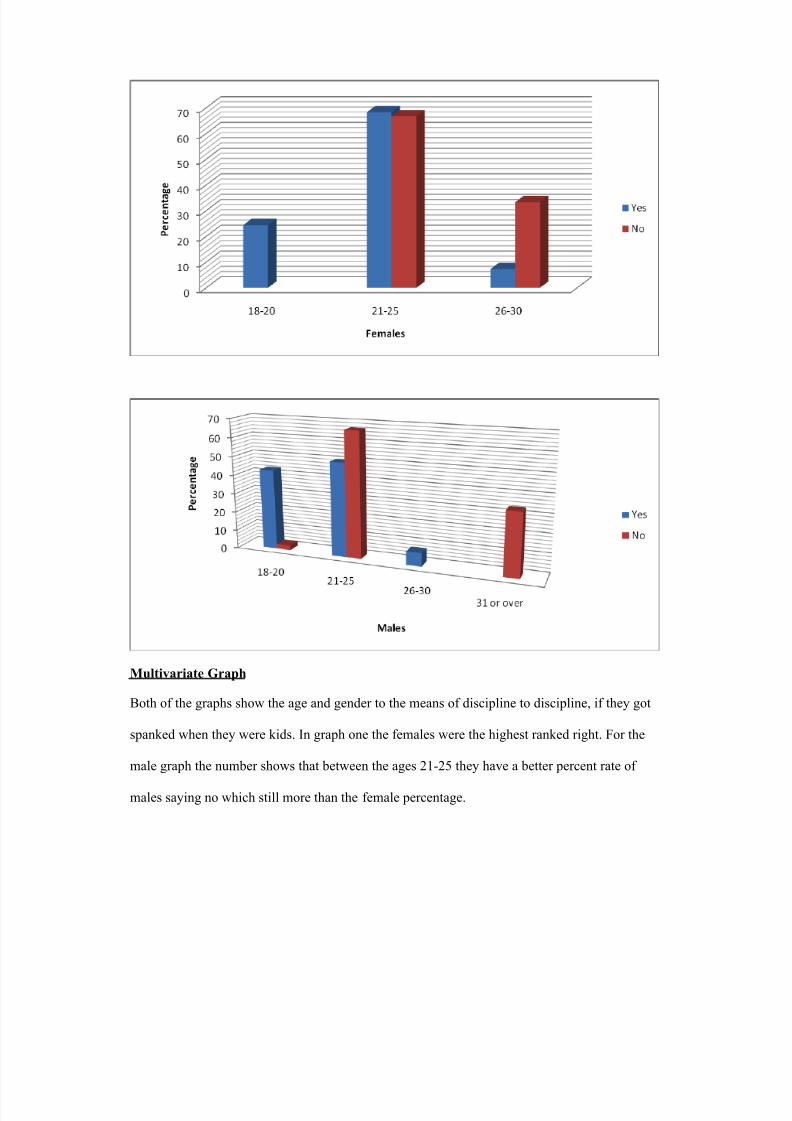
Multivariate Graph
Both of the graphs show the age and gender to the means of discipline to discipline, if they got
spanked when they were kids. In graph one the females were the highest ranked right. For the
male graph the number shows that between the ages 21-25 they have a better percent rate of
males saying no which still more than the female percentage.
8/9/2019 brit proj 1
http://slidepdf.com/reader/full/brit-proj-1 14/24

8/9/2019 brit proj 1
http://slidepdf.com/reader/full/brit-proj-1 15/24
8/9/2019 brit proj 1
http://slidepdf.com/reader/full/brit-proj-1 16/24
8/9/2019 brit proj 1
http://slidepdf.com/reader/full/brit-proj-1 17/24
8/9/2019 brit proj 1
http://slidepdf.com/reader/full/brit-proj-1 18/24
8/9/2019 brit proj 1
http://slidepdf.com/reader/full/brit-proj-1 19/24
8/9/2019 brit proj 1
http://slidepdf.com/reader/full/brit-proj-1 20/24

8/9/2019 brit proj 1
http://slidepdf.com/reader/full/brit-proj-1 21/24
In conclusion, these graphs concluded the spanking survey that reports 18-30 and over.
After analyzing the data on the spanking survey I can say that the highest percent that is
ranked the highest is females at 59.7% answered yes in spanking their kids while males
answered low at 40.3% on the survey. The means of spanking is concluded that females
are more likely to spank their children then men, it shows it is a means of discipline in a
form of spanking

8/9/2019 brit proj 1
http://slidepdf.com/reader/full/brit-proj-1 22/24
8/9/2019 brit proj 1
http://slidepdf.com/reader/full/brit-proj-1 23/24

8/9/2019 brit proj 1
http://slidepdf.com/reader/full/brit-proj-1 24/24


![Feola risky proj[1]](https://img.pdfslide.net/doc/110x75/55535e64b4c905cf188b4bf6/feola-risky-proj1.jpg)