Embed Size (px)
Citation preview

Britain in the Red:
Provisional Report
Damon Gibbons & Lovedeep Vaid
September 2015

2
Acknowledgements
This project has been jointly commissioned by the TUC and Unison, and the authors wish to
put on record their thanks for the support received from Nicola Smith and Geoff Tily in the
TUC’s Economic and Social Affairs Department and from David Arnold at Unison, without
which this report would not have been possible. However, the authors remain responsible for
any errors or omissions.

3
Contents
1. Introduction .................................................................................................................................... 4
2. Analysis of Household Survey Data ................................................................................................. 8
The main household surveys .............................................................................................................. 8
Objective measures of financial vulnerability of over-indebtedness ............................................... 11
Box 1: About the NMG Survey .......................................................................................................... 12
How representative is the NMG survey? .......................................................................................... 13
Levels of unsecured debt .................................................................................................................. 16
The impact of student loans on DTI ratios ........................................................................................ 20
Box 2: Student debt .......................................................................................................................... 20
How many vulnerable households are there? .................................................................................. 23
Debt servicing costs .......................................................................................................................... 25
The impact of student debt on debt servicing costs ..................................................................... 27
How many households are over-indebted? ...................................................................................... 28
3. Demographic characteristics of indebted households ................................................................. 30
Employment status ........................................................................................................................... 30
The distribution of debt within working households .................................................................... 34
Housing status ................................................................................................................................... 40
4. Preliminary Conclusions ................................................................................................................ 44

4
1. Introduction
1.1. It is seven years since the onset of the global financial crisis and the ‘Great
Recession’. Although the credit boom prior to 2007/08 has been identified by the Bank
of England as a contributory factor in causing the crisis1, and the Bank have recently
reported that the legacy of high household indebtedness has held back the recovery2,
very little has been done in that time to directly assist British households to either pay
down or restructure their debts.
1.2. This is now a major concern because a number of factors have combined to increase
the household debt burden in recent years. These include a lengthy fall in real wages3;
a rise in ‘underemployment’ (i.e. people who would like more hours of work but cannot
obtain them)4; record numbers of people in low paying self employment5, and a
continuing programme of severe cuts to state support for working age households6. For
many low paid workers, the increased ‘casualisation’ of employment, typified by the rise
in zero hours contracts, also causes cash flow problems which in turn drives increased,
often high cost, credit use or arrears on household bills7.
1 See, for example, the Bank’s Financial Stability Report, October 2008, pp. 7-9
2 In the Bank’s Quarterly Bulletin, 2014, Q3, Bunn & Rostom report (pg.304) that: “Cuts in spending associated
with debt are estimated to have reduced the level of aggregate private consumption by around 2% after 2007, unwinding the faster growth in spending by highly indebted households, relative to other households, before the financial crisis.” 3 Although there has been a recent improvement in wage growth, the median real wages of full-time
employees fell by over 8 percent between 2010 and 2014. https://www.tuc.org.uk/economic-issues/britain-needs-pay-rise/ 4 Following the onset of the economic crisis the percentage of UK workers who were underemployed rose
from 7.1% to a peak of 10.8% at the end of 2012. By 2014, this percentage had reduced to 9.9%, still 2.8 % higher than its pre-crisis level and a problem for 3 million workers (ONS report, 25
th November 2014, based on
Labour Force Survey). 5 ONS data indicates that there are now approximately 4.5 million self employed workers: one in seven of the
workforce. Despite strong growth in self employment levels, a Resolution Foundation study in May 2014 found that self employed weekly earnings have fallen by 20% since 2007. http://www.resolutionfoundation.org/media/press-releases/self-employed-see-plunge-earnings-even-numbers-surge/ 6 In its July budget the Government set out its proposals to cut £34.9 million from the welfare budget over the
lifetime of the current Parliament. In addition, public sector pay rises are to be constrained to 1% in each of the next four years. 7 Approximately 1.8 million workers are employed using zero hours contracts (ONS survey of businesses,
25/2/2015). Citizens Advice have noted (30/4/2014) that zero hours contracts “are playing havoc with

5
1.3. It is therefore of little surprise that the Office for Budget Responsibility (‘OBR’) is
forecasting8 that household indebtedness will increase further over the lifetime of the
current Parliament. The household debt to gross household disposable income ratio is
expected to rise by 26 percentage points to 170 percent by 20209. This is slightly
higher than the debt to income ratio witnessed just ahead of the crisis in 2007/08. We
are concerned about this prospect both because of the damaging effects of debt
problems on those who are directly affected and also because an increase in the
household debt burden is likely to limit domestic demand, act as a drag on Britain’s
economic growth, and increase the vulnerability of the economy to external shocks.
1.4. It is important to look at the different components of household indebtedness that are
included within the OBR’s forecast. Approximately 80 percent of total household
liabilities is secured on property in the form of mortgages10. The OBR expects rising
house prices to feed through into an overall increase in household indebtedness, and
that this will account for around 12 percentage points of the forecast increase in the
debt to gross income ratio through to 2020. There has already been a great deal
written concerning the possible implications of our high level of mortgage debt,
especially if interest rates are raised by the Bank of England. For example:
In May 2014, the Resolution Foundation modelled the impact of likely interest
rate increases and reported that if rates were to rise to just 2.9 percent by the
end of 2018 then around 2.3 million households could find their mortgages
unaffordable11; and
peoples’ ability to make ends meet” (https://www.citizensadvice.org.uk/about-us/how-citizens-advice-works/media/press-releases/broken-zero-hours-contracts-are-leaving-workers-in-limbo/ ). 8 Economic and Fiscal Outlook, July 2015.
9 The OBR forecasts are based on the National Accounts and derive the debt to income ratio by calculating
household liabilities (including those of the not for profit sector serving households) as a percentage of Gross Household Disposable Income (‘GHDI’). 10
National Accounts, Reference Table 06, series NNRP as % of NNRE 11
‘Mortgaged future: modelling household debt affordability and access to refinancing as interest rates rise’, Resolution Foundation, May 2014. The measure of unaffordability being used is ‘households spending one third or more of their after-tax income on mortgage repayments’.

6
Writing in the Bank of England’s Quarterly Bulletin, Bunn & Rostom (2014)
reported that the potential for household indebtedness to have ‘a large adverse
impact on aggregate demand and on the banking system’ lay behind the
Bank’s Financial Policy Committee decision in July 2014 to introduce tighter
restrictions on mortgage lending. These included the introduction of ‘interest
rate stress testing’ as part of affordability assessment processes for new loans
and limits on the proportion of mortgages being offered at loan to income
multiples of 4.5 or above.
1.5. In contrast, the economic impact of the remaining 20 percent of household
indebtedness, which comprises their unsecured liabilities (both consumer credit debts
and student loans), has been largely overlooked. For example, Bunn and Rostom’s
research, which looked at the negative impact of household indebtedness on domestic
demand, focused exclusively on the role played by mortgage debt12.
1.6. Yet the stock of outstanding unsecured debt is large and the OBR is expecting this to
grow further. In its July 2015 forecast the OBR indicated that it expected increased
unsecured debt to account for 14 percentage points (i.e. more than half) of the
expected rise in the overall debt to gross income ratio through to 2020.
1.7. The ‘Britain in the Red’ project is therefore focused on the growing unsecured debt
burden of British households. It is examining the evidence from recent household
surveys and aggregate datasets to determine the extent to which unsecured debts
make households financially vulnerable; how the debt burden is distributed between
different types of households, and the wider economic consequences of the long-term
accumulation of unsecured debt that has taken place.
12
Bunn & Rostom (2014), as footnote 2, above. The research was based on an analysis of the Living Costs and Food Survey, which the authors report does not provide sufficient detail of unsecured debt and the impact of credit repayments on household spending patterns for this to have been included in the analysis.

7
1.8. This preliminary report sets out the findings from the our analysis of household survey
data concerning recent trends in financial vulnerability and over-indebtedness and a
future final report will consider how these relate to aggregate datasets and the wider
economic impacts of the household debt burden. It will also make recommendations
for change. It should be noted that throughout this report we use the term ‘unsecured
liabilities’ to refer to the combined total of consumer credit and student loan debt, and
‘consumer debt’ to refer to the unsecured liabilities of households excluding student
loans.
1.9. The remainder of this report is structured as follows:
Chapter two presents an analysis of household debt survey evidence and comments
on observed changes in the distribution of unsecured debt in recent years. In this
respect we particularly focus on findings from an analysis of the Bank of England’s
annual household debt survey commissioned from NMG Consulting (‘the NMG
survey’);
Chapter three then provides further detail from the NMG survey to present findings
about the demographic of characteristics of households with the highest unsecured
debt burdens; and
Chapter four provides our preliminary conclusions.

8
2. Analysis of Household Survey Data
2.1. This chapter focuses on the findings from household survey data and reports in detail
on the changing distribution of indebtedness in recent years.
The main household surveys
2.2. Household surveys have played a key role in the monitoring of unsecured debt
problems in the UK for many years. Table 1 below sets out the main surveys
undertaken since 1991 together with a summary of their methodologies and sample
sizes.
Table 1: Main household survey sources of unsecured indebtedness (1991 – present)
Survey Methodology
British Household Panel Survey
Longitudinal household survey which collected information on the wealth, assets and liabilities of households from 1991 onwards. The original sample was just over 5,000 households. The survey is particularly helpful in respect of measuring changes in the prevalence of credit use over the period, and consistent questions concerning debts were used in the 2000 and 2005 waves.
Understanding Society
The UK Longitudinal Household Survey, or 'Understanding Society', replaced the BHPS but maintained integrity with it. It has a larger sample size (42,000 in Wave 4), but the questions concerning wealth, assets and debts are consistent with those used in the BHPS in 2005. Analysis of the 2012/13 data release has recently been conducted by the Social Market Foundation (‘SMF’)
13.
Wealth and Assets Survey
The Wealth and Assets Survey is a biennial longitudinal survey launched in 2006. The findings concerning the burden of financial and property debt for the third wave (2010/12) were released by ONS in July 2015. Approximately 30,000 households were interviewed in wave one, and 20,000 in each of waves two and three.
YouGov DebtTrack The Department for Business, Innovation and Skills ('BIS') reported on the findings from the YouGov DebtTrack survey between 2007 and 2012. The survey increased in size over this period from around 3,000 adults to just under 8,000. The survey is conducted on-line with responses weighted back to national averages, including in respect of household income.
NMG Survey for the Bank of England
The Bank has commissioned an annual household survey concerning indebtedness since 2004. These surveys were initially conducted face to face and had sample sizes of approximately 2,000. In 2012 the main survey moved on-line and the size was increased to 4,000. A smaller face to face survey was also conducted that year. Since 2013, the survey has only been conducted on-line and the sample size was increased to 6,000. The latest release is for 2014, making this the most up to date source of data available.
2.3. Findings from these surveys have been reported in a large number of independent
reports as well as official publications from Government, the last of which was published
13
Broughton et al (2015). ‘Wealth in the Downturn: Winners and Losers’. Social Market Foundation.

9
by the Department for Business, Innovation and Skills (‘BIS’) in June 2013 and which
was based on the findings from the YouGov DebtTrack survey for 201214.
2.4. However, the use of different surveys and their varying methodologies mean that the
findings have not been entirely consistent over time. For example:
In 2004, the NMG survey reported that approximately 45 percent of all households had
some form of unsecured debt. This was consistent with earlier findings from the British
Household Panel Survey (44% in 1995 and 45% in 2000).
In 2006/08 the Wealth and Assets Survey reported that 50 percent of households had
some form of non-mortgage borrowing, and that this remained fairly constant through
to 2010/12.
The YouGov DebtTrack survey of 2008/09 reported that 64 percent of households had
unsecured debts, although the same survey found that this fell back to 58 percent the
following year; to 54 percent in 2011, and to 52 percent in 2012.
The YouGov 2012 finding is consistent with the face to face element of the NMG
survey of that year, which reported that 51 percent of households had unsecured
debts. However, the on-line part of the NMG survey reported a higher percentage
(63%). The survey has only been conducted on-line since 2013, and reported 60
percent of households had unsecured debts that year, and that 58 percent did so in
2014.
2.5. Taking the findings from the different surveys into account, and assuming that the NMG
on-line survey reports the share of households having unsecured debt to be around 11
percentage points higher than the consensus, figure 1, below, provides our best
estimate of the prevalence of unsecured debt over the period 1995 to 2014.
14
Credit, Debt and Financial Difficulty in Britain, 2012: a report using data from the YouGov Debt Track survey, Department for Business, Innovation and Skills, 2013.

10
Figure 1: Estimated percentage of households with unsecured debt (1995 – 2014)
2.6. By way of international comparison, the European Household Finance and
Consumption Survey (‘EHFCS’) reported the proportion of households with unsecured
debts for 15 countries15 in 2010. Across these countries, the average percentage of
households with non mortgage borrowing was 29.3 percent. The highest percentage
was reported for Cyprus (47.9%), followed by Slovenia (38.9%), Netherlands (37.3%),
Luxemburg (36.9%) and Germany (34.6%). The lowest percentages were reported for
Italy (17.8%), Portugal (18.3%) and Slovakia (19.9%).
2.7. The UK surveys show greater consistency when identifying the types of households
with unsecured debts. The surveys note that although nominal levels of unsecured debt
increase with income, the highest debt to income ratios are found amongst lower
income households and these also have higher debt repayment to income burdens.
Unsecured debts are also likely to be more concentrated in younger households, those
with children, and those with low levels of savings.
15
These were Austria, Belgium, Cyprus, Germany, Luxemburg, Malta, Spain, Finland, France, Greece, Italy, Netherlands, Portugal, Slovenia, Slovakia.
0
10
20
30
40
50
60
1995 2000 2005 2010 2012 2013 2014
%

11
Objective measures of financial vulnerability of over-indebtedness
2.8. In line with most previous literature on the subject, the remainder of this chapter focuses
on two objective measures of indebtedness:
The unsecured Debt to Income ratio (‘DTI’); and
The unsecured Debt Servicing (i.e. repayments) to Income ratio (‘DSI’).
2.9. The first of these indicators should be viewed as a measure of household vulnerability to
debt problems in the event of income or expenditure shocks. In this respect, the
YouGov surveys conducted for BIS report those households with a ratio of 60 percent or
more to their annual income as highly vulnerable. We therefore use this as our
definition of vulnerability throughout the remainder of this report.
2.10. The second indicator is a much more current measure of the burden of repayments
on the household. This seems to have crept upwards in recent years, although there
has been no explanation provided for this. In a report for the then Department for Trade
and Industry, Kempson (2002) used a consumer credit repayment to gross income ratio
of 25 percent to identify over-indebted households, and this measure was subsequently
used by the Department in its ‘Tackling Over-indebtedness Action Plan’ published in
2004 and in its subsequent follow-up report of March 2010. However, BIS reports since
2010 have used a 30 percent or larger ratio as an indicator of over-indebtedness.
2.11. In this report we revert to using a debt repayment to gross income ratio of 25 percent
as an indicator of over-indebtedness, but also add in our own measure of ‘extreme over-
indebtedness’, which we define as a repayment to income ratio of 40 percent or greater.
2.12. We also focus our analysis on the Bank of England’s NMG survey, which provides
the most current information concerning the unsecured debt liabilities of households and
their distribution (see box 1, below).

12
Box 1: About the NMG Survey
The NMG household survey commissioned by the Bank of England is an annual
survey which has been conducted since 2004. It is designed and weighted to be
representative of British households in terms of age, social grade, region, working
status, and housing tenure. For the past three years the survey has been conducted
on-line in September and October. It contains questions which allow for the
calculation of debt to income and repayment to income ratios based on annualised
pre-tax income, and which allow for the segmentation of results by housing tenure,
age, employment status, educational qualifications, and, for 2014, by the number of
children present in the household. The sample size was also increased from 4,000 in
2012 to 6,000 in 2013 and 2014. Importantly, the survey gathers information
separately with respect to secured and unsecured debts and, from 2013, separates out
student loans from consumer credit liabilities.
The Bank of England publishes an article summarising the findings of the NMG survey
once per year in its Quarterly Bulletin. However, these have tended to focus on
mortgage borrowing and have not been particularly informative in respect of the data
gathered on other liabilities. Nevertheless, the Bank does make the raw survey data
available, and we have therefore conducted an analysis of this for 2012 through to
2014 in order to identify recent trends in consumer credit and student loans
indebtedness and how these vary amongst different household types.
2.13. The remainder of this chapter reports on the general trends observed from the NMG
survey. We begin by comparing the incomes of the NMG sample to the general
population. We then explore in more detail the breakdown of debt across the income
distribution and provide estimates of the numbers of over-indebted households in each
of the years from 2012 through to 2014.

13
How representative is the NMG survey?
2.14. Although the NMG survey is designed and weighted to be representative of British
households in terms of age, social grade, region, working status, and housing tenure, it
does not claim to be representative of the general population by income. We therefore
begin by comparing the income distribution of NMG survey participants with ONS data
from the Living Costs and Food Survey (‘LCF’). That survey is used by the ONS to
inform its national estimates of household final consumption expenditure, and the
income data is used by HM Treasury to model the impact of possible changes in tax and
benefits on different households.
2.15. Table 2, below, sets out details of the income distributions of participants in the NMG
survey for 2014 and 2013, and for the LCF survey for 2013 (the most recent data
available).
Table 2: Comparison of income quintiles, NMG and ONS Living Costs and Food Survey
Income quintile
NMG survey (Gross household income,
unequivalised)
ONS, Living Costs and Food Survey (Gross household income,
unequivalised)
2014 2013 2013
Average Q1 £9,391 £9,687 £8,840
Average Q2 £19,141 £19,842 £18,980
Average Q3 £27,933 £29,060 £30,004
Average Q4 £39,696 £39,446 £45,136
Average Q5 £71,492 £67,166 £89,180
2.16. The table indicates that the income distribution of participants in the two surveys was
slightly different in 2013. NMG survey participants in the lowest three income quintiles
had slightly higher average incomes (of roughly £1,000 per year) than those in the LCF
survey. This may be due to the fact that the NMG survey is completed online and
therefore could under-represent households without access to the internet. However,
there was also a variance between the two surveys in respect of the income of
households in the 4th and 5th quintiles. These had much higher average incomes in the
LCF survey (£12,000 higher in quintile 5).

14
2.17. As previous surveys have consistently reported that levels of nominal unsecured debt
rise with income, households in the lowest three quintiles within the NMG survey are
likely to report a slightly higher total amount of unsecured debt than is present in the
general population whilst households in the higher quintiles are likely to report much
lower levels of debt.
2.18. It should also be noted that the survey substantially under-estimates the overall level
of debt as a whole. Grossing up the unsecured debts reported in the NMG survey in
2014 to the general population would account for only £104 billion (34%) of the total
unsecured liabilities reported in the National Accounts. Consumer debts reported in the
survey are even lower, grossing up to £64 billion: just 26 percent of the figure contained
in the National Accounts.
2.19. This discrepancy is not explained by sampling issues. The fact that levels of debt
reported in household surveys do not gross up to aggregate data has been noted in the
prior literature. For example, when commenting on the results of the NMG survey in
2004,Tudela & Young reported:
“A common feature of household surveys is that the amount of unsecured debt reported by survey respondents falls well short of that implied by aggregate data... Some of this discrepancy can be accounted for by differences in the basis on which the statistics are calculated. For example, the survey asked respondents to exclude balances which would be paid off in full at the end of the month, whereas the official statistics include all consumer credit balances outstanding at a particular date, including balances that do not bear interest...It is unclear whether the remaining gap is a result of deliberate understatement by respondents, ignorance of debts they or other members of their household (on whose behalf they are responding) owe, or misunderstanding of what constitutes a debt: for example, some may not consider borrowings as a ‘debt’ if they are up to date with repayments.”
2.20. Moving the NMG survey online in 2012 may have been an intended to mitigate some
of these problems, as online surveys have been found to have a higher disclosure rate
in respect of sensitive questions16. However, they may also suffer from a greater degree
16
Dayan et al (2007) cited in Bunn et al (2012)

15
of measurement error17. There were also a high number of respondents (approximately
10 percent of the sample) to the 2014 survey which, although indicating that they had
unsecured debts, did not provide sufficient information to allow for the calculation of the
‘Debt to Income’ (‘DTI’) or Debt Servicing to Income (‘DSI’) ratios.
2.21. Whilst recognising the general nature of these problems with household debt surveys
it would appear that the NMG survey particularly under-reports the level of unsecured
debt. For example, grossing up the reported levels of unsecured debt from the YouGov
DebtTrack survey from 2012 accounts for £126 billion, which is one third higher than the
grossed up amount from the NMG survey of the same year.
2.22. Table 2, above, also indicates that the gross household incomes of NMG survey
participants in the lowest three quintiles fell between 2013 and 2014. This requires
some explanation as this finding contradicts those from other sources. For example, the
Annual Survey of Hours and Earnings (‘ASHE’) reported that Gross Weekly Pay
increased, albeit ever so slightly, by 0.6 percent for the lowest paid 50 percent of full
time employees18, and the latest ONS publication concerning the effects of taxes and
benefits on household incomes19 indicates that the equivalised20 gross incomes of
poorer households increased between 2012/13 and 2013/14. However, wages fell in a
number of industrial sectors and there were also reductions in the value of some cash
benefit transfers (notably in respect of Incapacity Benefit and Employment Support
Allowance, and in tax credit payments to households in the third quintile). The NMG
survey may therefore slightly over-represent households affected in these ways over the
course of the year.
17
See footnote 7, page 10, in Credit, Debt, and Financial Difficulty in Britain, 2012. Department for Business, Innovation and Skills. 18
2014 Provisional Results, Table 5. 19
Table 14A, The Effects of Taxes and Benefits on Household Income, 1977 to Financial Year ending 2014, released on 29
th June 2015.
20 Equivalisation is a standard methodology that adjusts household income to account for different demands
on resources, by considering the household size and composition. Unfortunately the NMG survey does not collect sufficient information on household size and composition to allow for incomes to be equivalised.

16
2.23. Despite these issues, the consistent methodology applied within the NMG survey
over the past three years does make it suitable to study changes in the distribution of
debt over time. This is particularly the case because the survey contains a panel
element, with around 50 percent of respondents having undertaken previous surveys
each year. As Anderson et al put it when reporting on the survey’s findings in respect of
mortgage debt for the Bank of England in 2014:
“The survey is weighted to be representative of the population of Great Britain. It is, however, possible that these survey data do not present a true picture of households’ finances. That may be because certain types of individuals are more likely to respond to online surveys, or that answers given are not accurate. Nevertheless, the survey data do have broadly similar trends to the aggregate data and are a good source of information for assessing distributional issues.”
2.24. In the absence of recent household survey data from other sources, we therefore use
the NMG survey to show how the distribution of debt has changed over the past three
years, but then use this information to update findings from the more representative
YouGov DebtTrack survey for 2012 in order to arrive at estimates for the current
numbers of households who are financially vulnerable and over-indebted.
Levels of unsecured debt
2.25. As indicated in figure 1, above, we consider that there has been a slight reduction in
the propensity of unsecured debt in recent years. In 2012, 53 percent of households
reported consumer debts or student loans, but we estimate that this has since reduced
to approximately 48 percent in 2014. This section now reports on the amounts owed by
these debtor households. In total, there were an estimated 13 million such
households in 2014, containing 30 million people.
2.26. Although the propensity to hold debt reduced, the average (mean) level of unsecured
debt has increased (see table 3, below).

17
Table 3: Mean debt levels, households with unsecured debts, 2012 - 2014
Average unsecured debt, including student loans
Average unsecured debt, excluding student loans
2012 £5,634 N/A
2013 £6,502 £4,206
2014 £8,007 £4,934
2.27. The rate of growth has been particularly apparent in households holding student
loans, with the average unsecured debt increasing by 42 percent over the period.
Unfortunately, the 2012 survey did not record student debts separately and we are only
able to assess the growth in consumer debt across 2013 and 2014. This indicates the
average level of consumer debt increased by 17 percent that year.
2.28. Turning to the distribution of these debts, we find that the average level of debt held
increased across all income quintiles, but that the extent and timing of this, has varied
(see figure 2, below). The growth in the average amount of unsecured debt has been
particularly pronounced in respect of those debtor households in the highest income
quintile. Over the past two years the amount of unsecured debt reported by this group
has increased by nearly 80 percent, with the majority of this occurring between 2013
and 2014.
Figure 2: Average unsecured debt, incl. student loans, by income quintile
£0
£2,000
£4,000
£6,000
£8,000
£10,000
£12,000
£14,000
Average Q1 Average Q2 Average Q3 Average Q4 Average Q5
2012
2013
2014

18
2.29. However, debtor households in the second, third and fourth quintiles have also
reported that the average level of their debt has grown by around £2,000 over the
period. This appears to have happened more gradually for households in the second
income quintile compared to the third, where the growth in debt levels primarily occurred
between 2013 and 2014. In contrast, households in the fourth income quintile reported
a larger increase occurring between 2012 and 2013.
2.30. The combination of reduced incomes and increasing debt has led to a dramatic rise
in the DTI ratio for low to middle income debtor households (see figure 3, below). This
is now at an average of 40 percent for those households in receipt of the very lowest
incomes, and lies between 28 and 33 percent for debtor households with incomes in the
second and third quintiles.
Figure 3: DTI ratios of debtor households, 2012 – 14, by income quintile
2.31. It should be noted that these are the average DTI ratios within each income quintile.
There is, however, a considerable range of DTI ratios outside of these averages. The
following figure illustrates how DTI ratios are distributed, and how these have changed
over time. It is notable that:
0%
5%
10%
15%
20%
25%
30%
35%
40%
45%
Average Q1 Average Q2 Average Q3 Average Q4 Average Q5
2012
2013
2014

19
The proportion of debtor households with a DTI ratio of less than 10 percent has
reduced by 8 percentage points, whilst
The proportion of debtor households with a ratio of more than 30 percent has
increased by 5 percentage points; and
There has been a 2 percentage point increase in the number of households
whose debts exceed 60 percent of their pre-tax income.
Figure 4: Percentages of debtor households within DTI ratio thresholds, 2012 - 2014
2.32. Looking at only those debtor households with incomes of less than £30,000 (figure 5,
below), it is notable that there has been a 17 percentage point reduction in the
proportion of these with DTI ratios of less than 20 percent, and a commensurate
increase in the proportion of debtor households with DTI ratios between 20 and 40
percent.
2.33. However, the percentage of debtor households with DTI ratios in excess of 60
percent has again remained relatively constant. In 2012, nearly one in five (18%) of low
0% 20% 40% 60% 80% 100%
2012
2013
2014
Percentage of households
<10%
10%-20%
20%-30%
30%-40%
40%-50%
50%-60%
60%-70%
70+%
Debt ratios

20
to middle income debtor households in the NMG survey were in this position, and this
reduced very slightly to 16 percent in 2014.
Figure 5: DTI ratios of debtor households with incomes < £30,000, 2012 & 2014
The impact of student loans on DTI ratios
2.34. The NMG survey collected information on student debt levels separately from
consumer debt in 2013 and 2014. This is important because although student loans
have expanded to become a larger component of household unsecured liabilities in
recent years there are reasons to be cautious about the extent to which these currently
pose a risk to households in comparison to consumer debts (see box 2, below)
Box 2: Student debt
Student loans for living expenses were introduced in 1990/91, and were extended to
cover tuition fees in England from 1998/99 onwards. In 2012, the maximum amount of
tuition fees that Universities could charge was increased from £3,290 to £9,000. Over
the period from 1999 through to the end of 2014, the total amount outstanding in
student loans has increased from £5 billion to £67.3 billion. Student debt now
constitutes 28 percent of the total unsecured liabilities of households.
However, this rising level of student debt does not have as great an impact on
households as their consumer debts. This is because the interest rates charged on
0% 20% 40% 60% 80% 100%
2012
2014
Percentage of households
<20%
20-40%
40-60%
60-80%
80+%

21
student debt are much lower than for consumer credit agreements and borrowers do
not need to make repayments if their earnings are below set thresholds. Repayments
made against English student debt totalled £1.6 billion in 2014/15, with £1.4 billion of
this collected through the tax system. This was equivalent to only 0.1 percent of total
household spending21 in that year. The repayments through the tax system were
made by approximately 1.5 million people, at an average amount of £870. Those
making these repayments were roughly half the total number of people who have a
current liability to repay student loans. The remainder did not make any repayments
either because their earnings were below the repayment thresholds; they were out of
work, or their tax return was awaiting assessment.
Because of the specific structure of student loans it is therefore necessary to be
cautious about the extent to which these represent a burden on households. Whilst
the presence of student debt can result in a high household debt to income ratio, it
does not usually feed through into a high burden in terms of debt repayments, unless
combined with other consumer credit debts.
2.35. We are therefore able to strip out student debt for these years and present the
average DTI ratios for debtor households with consumer debts only for each income
quintile (see figure 6, below).
21
ONS, Household Financial Consumption Expenditure, current prices, seasonally adjusted measure.

22
Figure 6: DTI ratios, excluding student loans, by income quintile, 2013 & 2014
2.36. Once student debt is stripped out then the average DTI ratios for all income quintiles
reduces significantly. For the poorest debtor households the average DTI ratio reduces
to 26 percent, and for those households with incomes between £20,000 and £30,000
per year it averages between 19 percent and 23 percent. Nevertheless, these ratios
have worsened over the course of 2013/14, with low to middle income households
experiencing a rise in their average consumer debt burden of 5 percentage points. In
contrast the debt burden for households in the fourth quintile remained flat and it
increased by only 2 percentage points for the highest income group.
2.37. Looking at the distribution of DTI ratios with student loan debt removed, we find that
there was little change over the course of the year, and that roughly 10 percent of
indebted households within the NMG survey can be classed as vulnerable on the basis
that consumer debts exceed 60 percent of their income (figure 7, below).
0%
5%
10%
15%
20%
25%
30%
Average Q1 Average Q2 Average Q3 Average Q4 Average Q5
2013
2014

23
Figure 7: DTI ratios, debtor households, excluding student debt, 2013 & 2014
How many vulnerable households are there?
2.38. As mentioned previously, the NMG survey reports far less debt than the YouGov
Debt Track survey. In 2012, the distribution of DTI ratios reported by the two surveys
were also different (see table 4, below)
Table 4: DTI ratios reported by YouGov DebtTrack and NMG surveys, 2012
DTI ratio YouGov DebtTrack (percentage of debtor
households)
NMG survey (percentage of
debtor households)
<10% 37 54
10% - 20% 17 15
20% - 40% 20 13
40% - 60% 9 6
> 60% 17 12
2.39. Comparing these results, the NMG survey indicated that a significantly higher
proportion of households had DTI ratios of less than 10 percent in 2012, and that there
were 5 percent fewer households with DTI ratios in excess of 60 percent.
2.40. We consider the YouGov survey findings to be more accurate than those from the
NMG survey. This is because the reported level of debt (as a percentage of our
aggregate measure) is greater and because the YouGov survey weights its responses
0% 20% 40% 60% 80% 100%
2013
2014
% of households
<20%
20-40%
40-60%
60 -80%
80+%

24
back to national averages in respect of household income, which the NMG survey does
not.
2.41. Nevertheless, due to the consistent nature of the NMG survey methodology, and its
use of a significant panel element, this provides a good indication of percentage
changes in the distribution of DTI ratios from 2012 to 2014.
2.42. To arrive at our estimate of the number of financially vulnerable households we
therefore take the 2012 YouGov survey results as our starting point and apply the
percentage point changes observed from the NMG survey to these through to 2014 (see
table 5, below).
Table 5: CfRC estimates of DTI ratios, debtor households, 2014
DTI ratios 2012 (YouGov Debt Track), percentages of debtor households
Percentage point change to 2014 (NMG survey)
CfRC 2014 estimates, percentage of debtor households within DTI thresholds, 2014
<10% 37 -8 29
10% - 20% 17 +2 19
20% - 40% 20 +2 22
40% - 60% 9 +2 11
> 60% 17 +2 19
2.43. Extrapolating to national data on household number and sizes, we estimate that
there was a slight increase in the number of financially vulnerable households between
2012 and 2014. In 2012 we estimate that there were 2.4 million households, containing
5.6 million people with DTI ratios in excess of 60 percent. By 2014, we estimate the
number of households in this position to have increased by 80,000. Approximately 9
percent of all households in the UK are financially vulnerable.
2.44. Excluding student debts, we estimate that 1.5 million households, containing
approximately 3.5 million people were financially vulnerable in 2014. This is 5.5 percent
of all households.
25
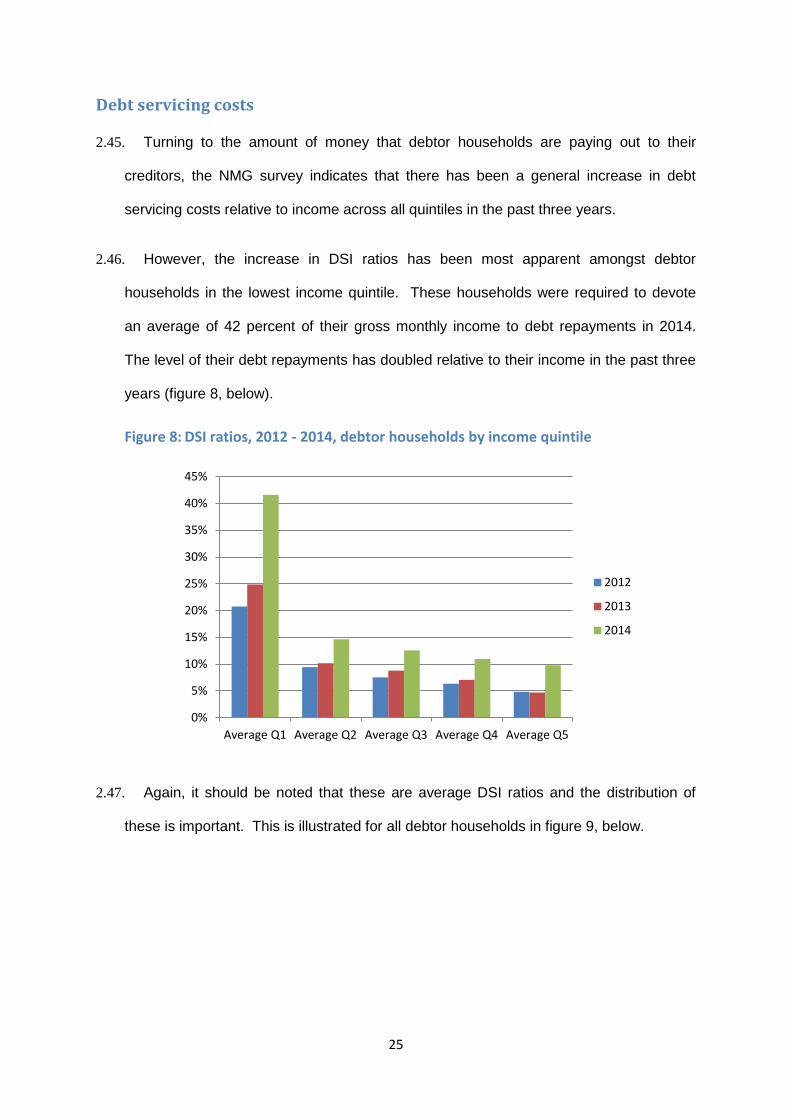
Debt servicing costs
2.45. Turning to the amount of money that debtor households are paying out to their
creditors, the NMG survey indicates that there has been a general increase in debt
servicing costs relative to income across all quintiles in the past three years.
2.46. However, the increase in DSI ratios has been most apparent amongst debtor
households in the lowest income quintile. These households were required to devote
an average of 42 percent of their gross monthly income to debt repayments in 2014.
The level of their debt repayments has doubled relative to their income in the past three
years (figure 8, below).
Figure 8: DSI ratios, 2012 - 2014, debtor households by income quintile
2.47. Again, it should be noted that these are average DSI ratios and the distribution of
these is important. This is illustrated for all debtor households in figure 9, below.
0%
5%
10%
15%
20%
25%
30%
35%
40%
45%
Average Q1 Average Q2 Average Q3 Average Q4 Average Q5
2012
2013
2014

26
Figure 9: Percentages of all debtor households by DSI thresholds, 2012 – 2014
2.48. The percentage of over-indebted households reported by the NMG survey has more
than doubled in recent years. In 2012, only 5 percent of households with unsecured
credit commitments were paying out more than a quarter of their income in repayments.
In 2013, the percentage of households in this position increased to 7 percent, and in
2014 it rose further to 12 percent.
2.49. Further to this, the percentage of debtor households who are extremely over-
indebted (i.e. with DSI ratios of more than 40%) has tripled from 2 percent to 6 percent
over the period.
2.50. This growth in over-indebtedness has been particularly dramatic in low income
households. The number of over-indebted households in the lowest income quintile rose
by 7 percentage points to 24 percent in 2014, and the proportion of extremely over-
indebted households in this quintile has increased from 10 to 14 percent (see figure 10,
below).
0% 20% 40% 60% 80% 100%
2012
2013
2014
Percentage of debtor households
<10%
10% - 25%
25% - 40%
40% - 55%
55%+

27
Figure 10: DSI ratios of low to middle income households, 2012 & 2014
2.51. The problem of over-indebtedness has also increased for debtor households in the
second and third income quintiles. Over-indebtedness in the second income quintile
increased by 4 percentage points, and 3 percent of these were extremely over-indebted
indebted in 2014 compared to none in 2012.
2.52. However, debtor households in the third income quintile saw a greater rise in over-
indebtedness, from just 2 percent in 2012 to 9 percent in 2014, with 3 percent of these
households also now extremely over-indebted.
The impact of student debt on debt servicing costs
2.53. The survey does not collect details of the amounts of student debt owed separately
from consumer debts. However, we are able to provide an assessment of the impact of
the increase in student debt levels on DSI ratios. We do this by comparing the DSI
ratios of households without any student debts with those of households with any form
of unsecured liability. Figure 11, below, provides the results for 2014.
0% 20% 40% 60% 80% 100%
2014
2012
2014
2012
2014
2012
Qu
inti
le 3
Q
uin
tile
2
Qu
inti
le 1
<10%
10% - 25%
25% - 40%
40%+

28
Figure 11: DSI ratios of households with and without student debt, 2014
2.54. This indicates that the presence or otherwise of student debt does not make a
significant difference to the DSI ratios of households. In fact, households without
student debts were marginally more likely to be over-indebted. Although student loan
debt has increased significantly in recent years its lower interest rates, and the earnings
thresholds that are currently in place, are limiting the extent to which this poses a
financial burden at this stage.
How many households are over-indebted?
2.55. To arrive at an estimate of the number of over-indebted households we again use the
YouGov DebtTrack findings as our starting point and apply the percentage point
changes identified from the NMG survey to these (table 6, below)
Table 6: CfRC estimates of DSI ratios, debtor households, 2014
DSI ratios 2012 (YouGov DebtTrack), percentage of debtor households
Percentage point change to 2014 (NMG survey)
CfRC 2014 estimates, percentage of debtor households within DSI thresholds, 2014
<10% 56 -7 49
10% - 25% 26 - 26
25% - 40% 9 +3 12
>40% 9 +4 13
0% 20% 40% 60% 80% 100%
No student debt
Any form of unsecured debt <10%
10% - 25%
25% - 40%
40% - 55%
55%+

29
2.56. Extrapolating to national data concerning household numbers and size, we estimate
that in 2012 there were 2.54 million over-indebted households (DSI>25%), containing
approximately 6 million people. By 2014, this had risen to 3.2 million households,
containing 7.6 million people. On this basis, nearly 12 percent of all UK households are
now over-indebted.
2.57. Further to this, we estimate that roughly half of all over-indebted households are
extremely so, and are paying out more than 40 percent of their pre-tax income to
creditors. 70 percent of these extremely over-indebted households are in receipt of
incomes of less than £30,000 per year.
2.58. These estimates are broadly consistent with the StepChange ‘Life on the Edge’
report, published in 2014, which indicated that 8.8 million people were over-indebted.
That report was based on a YouGov survey of 4,442 adults conducted in December
2013, but used a number of different indicators to determine whether or not people were
struggling financially. These did not measure the level of repayments relative to income
but instead focused on financial behaviours, including whether or not people used credit
to pay for household bills, paid only the minimum amount on credit cards for extended
periods, or were in arrears with payments. The discrepancy between our estimates
between and those reported by StepChange could therefore result from the over-
indebtedness indicator of 25 percent of gross income measure being set at too high a
level.

30
3. Demographic characteristics of indebted households
3.1. The preceding chapter examined NMG survey evidence concerning the general trends
in household indebtedness, reporting that there has been a significant increase in the
number of financially vulnerable and over-indebted households, with this particularly
concentrated in households with incomes of less than £30,000 per year. This chapter
now builds further on this analysis by examining the main demographic characteristics
of those households that have been most affected, reporting the findings from cross
tabulations conducted using the survey’s employment status, age, housing tenure and
income identifiers.
3.2. Unfortunately, we are not generally able to compare these findings to the YouGov
survey of 2012, as that did not report on over-indebtedness to the same level of detail.
As a result, this chapter provides a good indication of the change in over-indebtedness
since 2012, but percentage estimates of over-indebtedness amongst specific groups are
likely to be conservative.
3.3. This is despite the fact that 58 percent of households participating in the 2014 NMG
survey had unsecured debts compared to 52 percent in the YouGov survey of 2012,
because the NMG survey respondents reported much lower levels of debt than holding
unsecured debts than was the case in the YouGov survey, and is due to the much lower
level of debt
Employment status
3.4. Figure 12, below, provides details of the DTI ratios of households in 2012 broken down
by employment status.

31
Figure 12: DTI thresholds 2012, debtor households, by employment status
3.5. The highest levels of financial vulnerability in 2012 were found in retired households.
However, this finding runs contrary to other evidence from the survey which indicates
that debt levels decline with age. In the 2012 survey the sample size of retired
households with unsecured debts was very small (only 117 people) and we consider
this to be unreliable. The sample of retired households with unsecured debts was
considerably larger in 2014 (527) and, as we report later, the observed DTI ratios for
this group were found to be considerably lower that year.
3.6. We therefore locate the highest levels of financial vulnerability (i.e. DTI ratios in excess
of 60%) in households containing full time students (25% of all such households in the
NMG survey), the unemployed (30%), and people with a long term sickness or disability
(20%). This is unsurprising as these are all recognised as low income groups and
unemployment, ill health and disability have long been associated with debt problems.
The expansion of student debt in recent years also explains the high DTI ratio of full
time student households.
3.7. Perhaps more surprising were the findings that nearly one in seven (14%) of self
employed households in the NMG survey were financially vulnerable in 2012, and that
one in ten of all employees also had DTI ratios in excess of 60 percent.
0% 20% 40% 60% 80% 100%
Working households
Retired
Self employed
Long-term sick/ disabled
Unemployed
FT student
Percentage of households
<20%
20-40%
40-60%
60-80%
80+%

32
3.8. Looking at changes in these ratios through to 2014 (figure 13, below) we find that the
percentages of households identified as vulnerable increased significantly amongst full
time students (+10 percentage points). Less significant increases were identified
amongst self employed households (+3 percentage points), and working households (+
2 percentage points). The unemployed and households containing someone with a
long-term illness or disability stayed broadly constant.
Figure 13: DTI thresholds 2014, by employment status
3.9. Despite the fact that the level of debt relative to income did not increase significantly for
most groups between 2012 and 2014, the DSI ratios worsened considerably (figures 14
and 15 below) over this period. This occurred regardless of the economic status of
households, with the exception of the unemployed.
0% 20% 40% 60% 80% 100%
Working households
Retired
Self employed
Long-term sick/ disabled
Unemployed
FT student
<20%
20-40%
40-60%
60-80%
80+%

33
Figure 14: DSI thresholds, 2012, by employment status
3.10. In 2012, the unemployed and households containing people with long term sickness
or disabilities were most likely to be over-indebted within the NMG survey. Around one
in seven (14%) of these households were spending more than a quarter of their income
out to their creditors. This was twice as high as the proportion of full time students,
retired, and self employed households. Less than one percent of working households
were over-indebted in the year.
3.11. Although the proportion of over-indebted unemployed households fell by 2
percentage points through to 2014, over-indebtedness amongst other groups rose by
between 6 percentage points (full time students and households containing someone
with a long term sickness or disability) and 11 percentage points (self employed
households). The proportion of over-indebted working households increased from less
than 1 percent in 2012 to nearly one in ten of all such households (9%) in 2014.
0% 20% 40% 60% 80% 100%
Working households
Self employed
Retired
FT student
Long term sick/ disabled
Unemployed
<10%
10% - 25%
25% - 40%
40% - 55%
55%+

34
Figure 15: DSI thresholds 2014, by employment status
3.12. Because working households comprise the largest group within the NMG sample we
have been able to further analyse the distribution of their debt amongst by cross
referencing to age and to the type of credit products being used. Unfortunately the
sample sizes for other groups do not allow for this to be conducted in a robust manner.
The distribution of debt within working households
3.13. Debts were common amongst households of all ages where someone was in paid
employment. Two thirds of these working households reported that they had some level
of unsecured debt (including student loans) in 2014. This was slightly lower than in
2012, when around 69 percent of working households had unsecured debts.
3.14. This general reduction in the proportion of households with debts was evident across
all age groups with the exception of working households aged over 55, which saw a
slight increase in the propensity to hold debt (from 57 to 60 percent).
3.15. However, younger working households were the most likely to have debts. Slightly
less than 70 percent of households in the 18 to 24 age group had unsecured debts
(including student loans) in 2014 and this rises to three quarters of working households
in the 25 to 34 age bracket.
0% 20% 40% 60% 80% 100%
Working households
Self employed
Retired
FT student
Long term sick/ disabled
Unemployed
<10%
10% - 25%
25% - 40%
40% - 55%
55%+
35
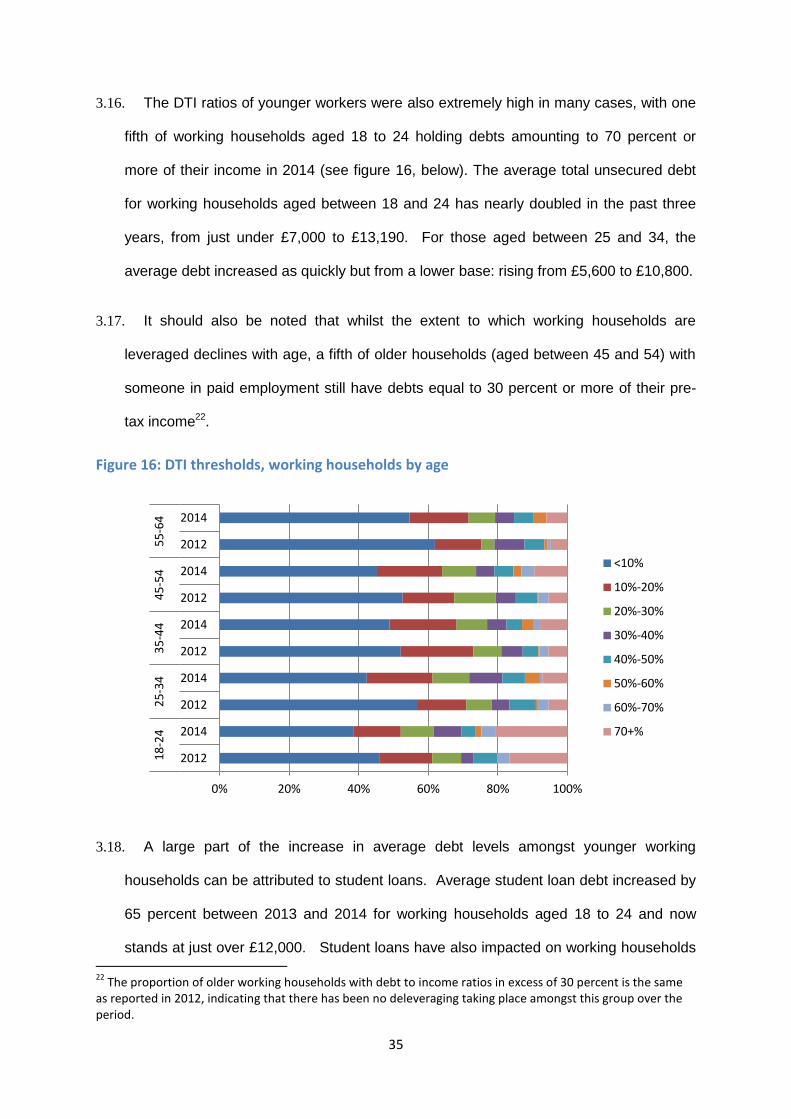
3.16. The DTI ratios of younger workers were also extremely high in many cases, with one
fifth of working households aged 18 to 24 holding debts amounting to 70 percent or
more of their income in 2014 (see figure 16, below). The average total unsecured debt
for working households aged between 18 and 24 has nearly doubled in the past three
years, from just under £7,000 to £13,190. For those aged between 25 and 34, the
average debt increased as quickly but from a lower base: rising from £5,600 to £10,800.
3.17. It should also be noted that whilst the extent to which working households are
leveraged declines with age, a fifth of older households (aged between 45 and 54) with
someone in paid employment still have debts equal to 30 percent or more of their pre-
tax income22.
Figure 16: DTI thresholds, working households by age
3.18. A large part of the increase in average debt levels amongst younger working
households can be attributed to student loans. Average student loan debt increased by
65 percent between 2013 and 2014 for working households aged 18 to 24 and now
stands at just over £12,000. Student loans have also impacted on working households
22
The proportion of older working households with debt to income ratios in excess of 30 percent is the same as reported in 2012, indicating that there has been no deleveraging taking place amongst this group over the period.
0% 20% 40% 60% 80% 100%
2012
2014
2012
2014
2012
2014
2012
2014
2012
2014
18
-24
2
5-3
4
35
-44
4
5-5
4
55
-64
<10%
10%-20%
20%-30%
30%-40%
40%-50%
50%-60%
60%-70%
70+%

36
in the 25 to 34 age bracket. In 2013, the average student loan debt reported by this
group was £4,400, but this rose to £6,800 the following year.
3.19. However, student loans do not account for the totality of debt amongst younger
working households. In 2014, just under half of working households with unsecured
debts in the 18 to 24 group carried no student debt, but did have other forms of
unsecured liabilities (most notably credit cards and overdrafts). Around one fifth of the
age group had student loan debts only, and the remaining third had a combination of
student loans and other forms of debt. The proportion of working households in the age
group who have both student loan debt and other credit commitments increased
marginally (by 2 percentage points) between 2012 and 2014.
3.20. Across working households of all ages the most common form of borrowing was on
credit cards, followed by overdrafts and personal loans (see figure 17, below). In 2014,
around 70 percent of working households with unsecured credit commitments borrowed
using credit cards, compared to around 30 percent which used overdrafts and personal
loans. There was much lower usage of hire purchase (18 percent) and store cards (13
percent). Payday loans were used by only 3 percent of working debtor households in
2014. Over the period there have been some small reductions in the proportion of
households using overdrafts, personal loans, store cards and payday loans.

37
Figure 17: Types of debt held by working households, all ages, 2012 & 2014
3.21. There were also some small shifts in the number of debts held by working
households over the period. In 2014, just under two thirds of working households with
any form of unsecured credit had one or two commitments and one third had three or
more.
Figure 18: Percentage of working households by number of credit commitments
3.22. Turning to DSI ratios it is evident that there has been a significant increase in over-
indebtedness amongst working households over the past three years (see figure 19,
0%
10%
20%
30%
40%
50%
60%
70%
Hire purchase
Personal loans
Credit cards
Overdrafts Student loans
Store cards
Payday loans
2012
2014
0%
5%
10%
15%
20%
25%
30%
35%
40%
45%
1 type 2 types 3+ types
2012
2014

38
below). In 2012, the vast majority of working households with unsecured debt paid less
than 10 percent of their gross incomes to their creditors. However, the proportion of
working households in this position has reduced dramatically since. This has been most
evident in the 35 - 44 age group where the proportion of households with debt
repayment ratios of less than 10 percent has reduced by around one third (31%) over
the period.
Figure 19: DSI thresholds, working households by age
3.23. The flip side to this has been an increase in over-indebtedness. This increased
across all age groups but working households in the 25 – 34 year old group were worst
affected. There has been an eleven-fold increase in over-indebtedness amongst this
group (from just 1% to 11%) over the past three years. In addition, 5 percent of these
households were found to be extremely over-indebted in the 2014 survey compared to
none in 2012.
3.24. It is also of concern that just under one in ten (9%) of older working households
(aged between 55 and 64) were over-indebted in 2014, compared to 6% in 2012.
0% 20% 40% 60% 80% 100%
2014
2012
2014
2012
2014
2012
2014
2012
2014
2012
18
- 2
4
25
- 3
4
35
- 4
4
45
- 5
4
55
- 6
4
<10%
10% - 25%
25% - 40%
40%+

39
Does the type of household debt have an impact on over-indebtedness?
3.25. Figure 20, below, provides details of the DSI ratios observed for working households
by type of unsecured debt. This reveals that the DSI ratios of these households
increased between 2012 and 2014 regardless of the form of debt held, but that this
increase has been particularly high in respect of those using payday loans and store
cards.
Figure 20: Average DSI ratios by credit type, working households
3.26. Although the increase in the average DSI ratio of payday borrowers stands out, the
proportion of working households using of this form of credit was low (just 3%). As
credit card borrowing is the major component of debt amongst this group, changes in
the average repayment requirements of these have a much greater impact on overall
debt repayment ratios. In addition to the fact that interest rates on credit card balances
have stayed stubbornly high (at between 17 and 18 percent), it should be noted that
Government introduced new rules for credit card lenders in January 2011. These
required lenders to raise the minimum monthly repayments on new credit cards. The
rules ensured that minimum monthly repayments covered the interest on the
outstanding balance plus at least one percent. The impact of this change has taken
0%
5%
10%
15%
20%
25%
30%
2012
2013
2014

40
time to be felt as it did not apply to existing cards, but has impacted on people who
transferred their balances from January 2011 onwards as well as borrowers who took
out new cards from that point.
3.27. Similarly, changes to bank overdraft charges may have played a part in driving an
increase in over-indebtedness amongst working households over the period. Effective
interest rates on overdrafts fluctuated over the period but not by much (averaging 10.1
percent in 2012; 9.2 percent in 2013 and 9.6 percent in 2014). More significantly, a
number of banks changed their pricing structures over this period to obtain greater
revenue from authorised, as opposed to unauthorised, overdraft charges. Concerns
about the level of unauthorised charges were raised by the then regulator, the Office of
Fair Trading, in 2008, and a test case concerning their legality was brought the following
year. Although that case was subsequently won by the banks, pressure from the
regulators about the unfairness of the charges, which penalise those in financial
difficulty, have continued. In response, banks appear to have reduced unauthorised
overdraft charges but have offset lost revenue by putting up charges and interest rates
on authorised facilities23. This is likely to have increased the burden on those
households who stay within their overdraft limits but who use these facilities on a
repeated basis.
Housing status
3.28. The NMG survey allows for an analysis of the distribution of unsecured debts by
housing tenure as it records whether respondents own their property outright, are
buying it with a mortgage, are renting privately or are local authority tenants. It should
be noted that the survey does not ask if people are renting from a housing association,
and would capture these tenants in the catch all category of ‘other/ don’t know/ refused’.
23
An impact assessment of the OFT’s intervention, published in January 2013, indicated that revenue from unauthorised overdraft charges and bounced direct debits reduced by £928 million in the four years from 2008 to 2012 but that this was partially offset by a rise in revenue of £432 in authorised fees and increased interest.

41
As a consequence, we are unable to report on changes that may have occurred in
respect of the distribution of debt amongst housing association tenants.
Figure 21: DTI ratio thresholds by housing tenure, 2012 & 2014
3.29. Figure 21, above, provides details of the percentage of households within each DTI
threshold by housing tenure for 2012 and 2014. The proportion of households identified
as financially vulnerable rose across all tenures between these years. However, this
was most marked amongst local authority tenants (+4 percentage points) and private
renters (+5 percentage points), with more than one in five of the latter group having DTI
ratios of more than 60 percent in 2014.
3.30. However, it is low income (<£30,000 per year) local authority and private tenants who
are most likely to be financially vulnerable. In 2012, 16 percent of low income local
authority tenants within the NMG survey had DTI ratios in excess of 60 percent. By
2014, 22 percent of this group was in position. The position of low income private
renters within the survey was worse still, with nearly a third (30%) of these financially
vulnerable in 2014 (figure 22 below)
0% 20% 40% 60% 80% 100%
2014
2012
2014
2012
2014
2012
2014
2012
Ow
ned
o
utr
igh
t M
ort
gago
rs
Loca
l au
tho
rity
te
nan
ts
Pri
vate
re
nte
d
Percentage of households
<20%
20-40%
40-60%
60-80%
80+%

42
Figure 22: DTI ratios of low income (£<30k) tenants, 2012 & 2014
3.31. Turning to over-indebtedness, we find that this increased across all housing tenures
between 2012 and 2014 (figure 23, below). The proportion of over-indebted
households who owned their properties outright increased by 12 percentage points,
whilst the level of over-indebted tenants in the private sector rose by 8 points. Amongst
households living in mortgaged property the increase was 7 percentage points, and
there was a 5 point increase for local authority tenants.
0% 20% 40% 60% 80% 100%
2014
2012
2014
2012 P
riva
te r
ente
d
Loca
l au
tho
rity
te
nan
ts
<20%
20-40%
40-60%
60-80%
80+%
0% 20% 40% 60% 80% 100%
2014
2012
2014
2012
2014
2012
2014
2012
Ow
ned
o
utr
igh
t M
ort
gago
rs
Loca
l au
tho
rity
te
nan
ts
Pri
vate
re
nte
d
Percentage of households
<10%
10% - 25%
25% - 40%
40% - 55%
55%+
Figure 23: DSI ratios by housing tenure, 2012 & 2014

43
3.32. The finding that nearly one in five of all households living in their own properties is
over-indebted is surprising but the sample size for this sub group was reasonably high
(n=509) and this compares to a finding within the YouGov survey of 2012 that 16
percent of this group were paying out more than 30 percent of their income to their
creditors. In view of this, further research into the position of this group would be
beneficial.
3.33. In contrast, higher levels of over-indebtedness have traditionally been found amongst
tenants in both the private and local authority sectors, and the observed increases
between 2012 and 2014 are likely to be explained by the concentration of lower paid
workers amongst this group as well as by benefit changes (for example to Local
Housing Allowance and the introduction of the ‘bedroom tax’) over the period.

44
4. Preliminary Conclusions
4.1. Policy makers have paid insufficient attention to the unsecured debt liabilities of
households in recent years. The last BIS monitoring report was published in 2013 and
utilised only household survey data gathered the year previously. Although the Bank of
England conducts an annual household survey (‘the NMG survey’), this appears to
considerably under-report unsecured debt compared to the prior YouGov surveys used
by BIS and is not representative of the income distribution. In addition, recent reporting
of the findings from the NMG survey are mainly focused on mortgage debt.
4.2. Whilst mortgage debt constitutes by far the greatest part of household debt, and
therefore poses a greater threat to financial stability, just under half of all households
have unsecured liabilities. According to the National Accounts, British households have
£305 billion in unsecured liabilities.
4.3. The household unsecured debt to income ratio has been impacted by a strong rise in
the amount of student debt in recent years. This has been driven by the recent rise in
tuition fees in England. Whilst this is a concern moving forwards, student debt does not
have as much of an impact on levels of over-indebtedness as consumer debt. This is
because student loans are at lower interest rates and there are earnings thresholds
which must be met before households are required to make repayments.
4.4. In contrast, the repayment of consumer debt is causing a considerable problem for an
increasing number of households.
4.5. The consumer debt burden varies according to the demographic characteristics of
households. The table below summarises our main findings from the household survey
data concerning the growth of over-indebtedness over the past three years24.
24
These estimates are arrived at by using the YouGov DebtTrack survey conducted for BIS in 2012 as the baseline and applying the percentage point increases observed within the NMG survey from 2012 through to 2014 to this.

45
.
Table 7: CfRC estimates of over-indebtedness amongst selected household types, 2012 & 2014
2012 2014
All households 9.5% 11.7%
Households with unsecured debts: 18% 25%
Sub groups of households with unsecured debts:25
Working households 3% 10%
Low income households (<£30K) 9% 16%
Young workers (18 - 34) 2% 10%
Older workers (55 - 64) 6% 9%
Self employed 6% 17%
Long-term sick/ disabled 13% 19%
Private renters 4% 12%
Buying with a mortgage 3% 10%
4.6. On this basis, we estimate that there were 3.2 million over-indebted households,
containing 7.6 million people, in 2014. This is 700,000 more over-indebted households
than in 2012: a 28 percent increase. These households are paying out more than 25
percent of their gross income to their creditors.
4.7. Further to this, we estimate that approximately half of these households are ‘extremely
over-indebted’, and are paying over 40 percent of their gross income to their creditors,
before taking account of housing costs. 70 percent of these extremely over-indebted
households are in receipt of incomes of less than £30,000 per year.
4.8. Our estimates concerning the sub-groups of over-indebted households are likely to be
conservative, as the NMG survey has consistently under-reported levels of unsecured
debt, and is not weighted to be representative of the income distribution. However, they
are likely to be an accurate indication of the extent of the increase in over-indebtedness
amongst these groups over the period.
25
These are the percentages found within the NMG survey and are likely to be conservative. However, they are likely to be an accurate indication of the extent of the increase in over-indebtedness amongst these groups over the period.

46
4.9. It is clear that over-indebtedness is a growing problem. This has occurred despite a
lack of significant growth in consumer credit in 2012 and 2013. Consumer credit growth
was stronger in 2014, but this does not account for all of the increase in debt servicing
to income ratios that we have observed. Once student loan growth has been
discounted, we find that the proportion of income going towards the servicing of debts
has risen more quickly than the total debt to income ratio. This would indicate that there
has been an increase in the cost of consumer debt relative to income over the period.
4.10. Income growth has certainly been low, and Government has directly contributed to
this by restraining public sector pay. However, there have also been changes in the
cost of credit. These include the raising of the minimum payment required on
outstanding credit card balances, and changes to bank charging policies in respect of
overdrafts, which appear to have increased the cost of authorised overdrafts. Interest
rates on credit card balances have also remained stubbornly high despite bank base
rates being at their historic low for an extended period. Refinancing of consumer debt
(especially credit card debt) may also have played a part in raising the level of interest
being sought from some households to unsustainable levels although further research is
required in this area.
4.11. What is clear is that any further increase in the cost of credit, as is likely if base rates
rise, will undoubtedly result in an increase in over-indebtedness unless this is offset by
an increase in real incomes.