Embed Size (px)
Citation preview
BCCDC COVID-19 Situational Report Week 10 Page 1 of 9
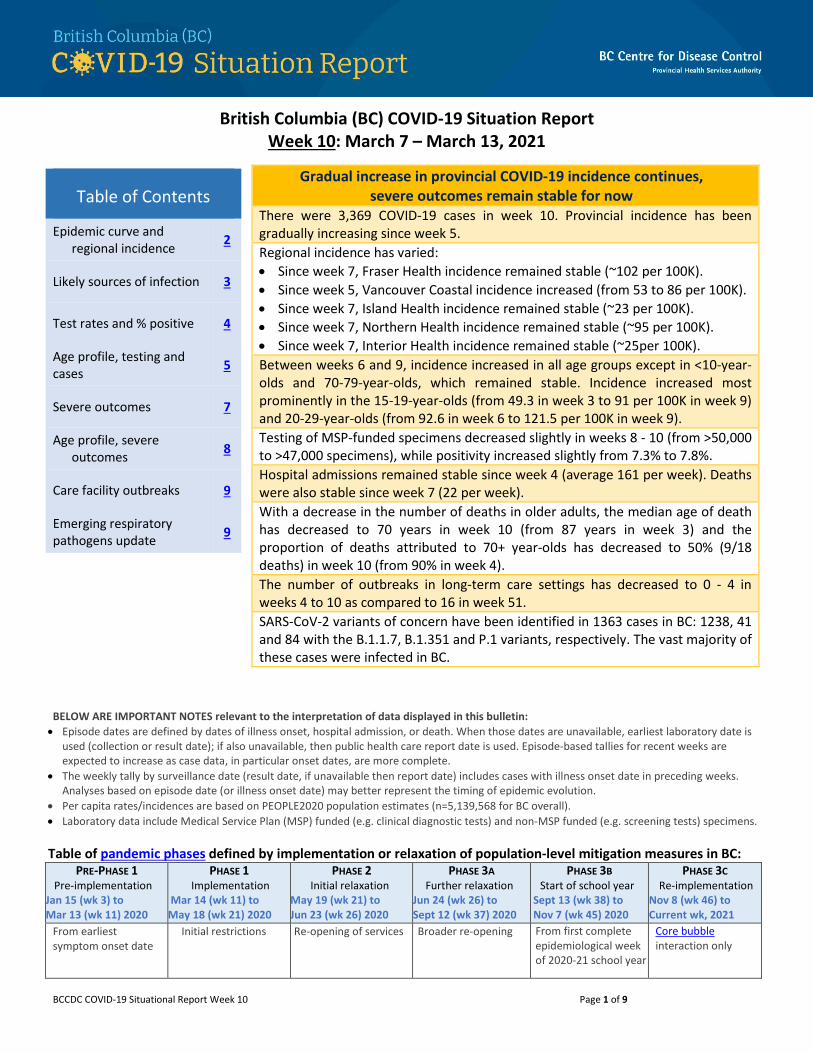
British Columbia (BC) COVID-19 Situation Report Week 10: March 7 – March 13, 2021
BELOW ARE IMPORTANT NOTES relevant to the interpretation of data displayed in this bulletin: • Episode dates are defined by dates of illness onset, hospital admission, or death. When those dates are unavailable, earliest laboratory date is
used (collection or result date); if also unavailable, then public health care report date is used. Episode-based tallies for recent weeks are expected to increase as case data, in particular onset dates, are more complete.
• The weekly tally by surveillance date (result date, if unavailable then report date) includes cases with illness onset date in preceding weeks. Analyses based on episode date (or illness onset date) may better represent the timing of epidemic evolution.
• Per capita rates/incidences are based on PEOPLE2020 population estimates (n=5,139,568 for BC overall). • Laboratory data include Medical Service Plan (MSP) funded (e.g. clinical diagnostic tests) and non-MSP funded (e.g. screening tests) specimens.
Table of pandemic phases defined by implementation or relaxation of population-level mitigation measures in BC:
PRE-PHASE 1 Pre-implementation
Jan 15 (wk 3) to Mar 13 (wk 11) 2020
PHASE 1 Implementation
Mar 14 (wk 11) to May 18 (wk 21) 2020
PHASE 2 Initial relaxation
May 19 (wk 21) to Jun 23 (wk 26) 2020
PHASE 3A Further relaxation
Jun 24 (wk 26) to Sept 12 (wk 37) 2020
PHASE 3B Start of school year
Sept 13 (wk 38) to Nov 7 (wk 45) 2020
PHASE 3C Re-implementation
Nov 8 (wk 46) to Current wk, 2021
From earliest symptom onset date
Initial restrictions
Re-opening of services
Broader re-opening
From first complete epidemiological week of 2020-21 school year
Core bubble interaction only
Table of Contents
Epidemic curve and regional incidence 2
Likely sources of infection 3
Test rates and % positive 4
Age profile, testing and cases 5
Severe outcomes 7
Age profile, severe outcomes 8
Care facility outbreaks 9
Emerging respiratory pathogens update 9
Gradual increase in provincial COVID-19 incidence continues, severe outcomes remain stable for now
There were 3,369 COVID-19 cases in week 10. Provincial incidence has been gradually increasing since week 5. Regional incidence has varied: • Since week 7, Fraser Health incidence remained stable (~102 per 100K). • Since week 5, Vancouver Coastal incidence increased (from 53 to 86 per 100K). • Since week 7, Island Health incidence remained stable (~23 per 100K). • Since week 7, Northern Health incidence remained stable (~95 per 100K). • Since week 7, Interior Health incidence remained stable (~25per 100K). Between weeks 6 and 9, incidence increased in all age groups except in <10-year-olds and 70-79-year-olds, which remained stable. Incidence increased most prominently in the 15-19-year-olds (from 49.3 in week 3 to 91 per 100K in week 9) and 20-29-year-olds (from 92.6 in week 6 to 121.5 per 100K in week 9). Testing of MSP-funded specimens decreased slightly in weeks 8 - 10 (from >50,000 to >47,000 specimens), while positivity increased slightly from 7.3% to 7.8%. Hospital admissions remained stable since week 4 (average 161 per week). Deaths were also stable since week 7 (22 per week). With a decrease in the number of deaths in older adults, the median age of death has decreased to 70 years in week 10 (from 87 years in week 3) and the proportion of deaths attributed to 70+ year-olds has decreased to 50% (9/18 deaths) in week 10 (from 90% in week 4). The number of outbreaks in long-term care settings has decreased to 0 - 4 in weeks 4 to 10 as compared to 16 in week 51. SARS-CoV-2 variants of concern have been identified in 1363 cases in BC: 1238, 41 and 84 with the B.1.1.7, B.1.351 and P.1 variants, respectively. The vast majority of these cases were infected in BC.
BCCDC COVID-19 Situational Report Week 10 Page 2 of 9
A. COVID-19 case counts and epidemic curve
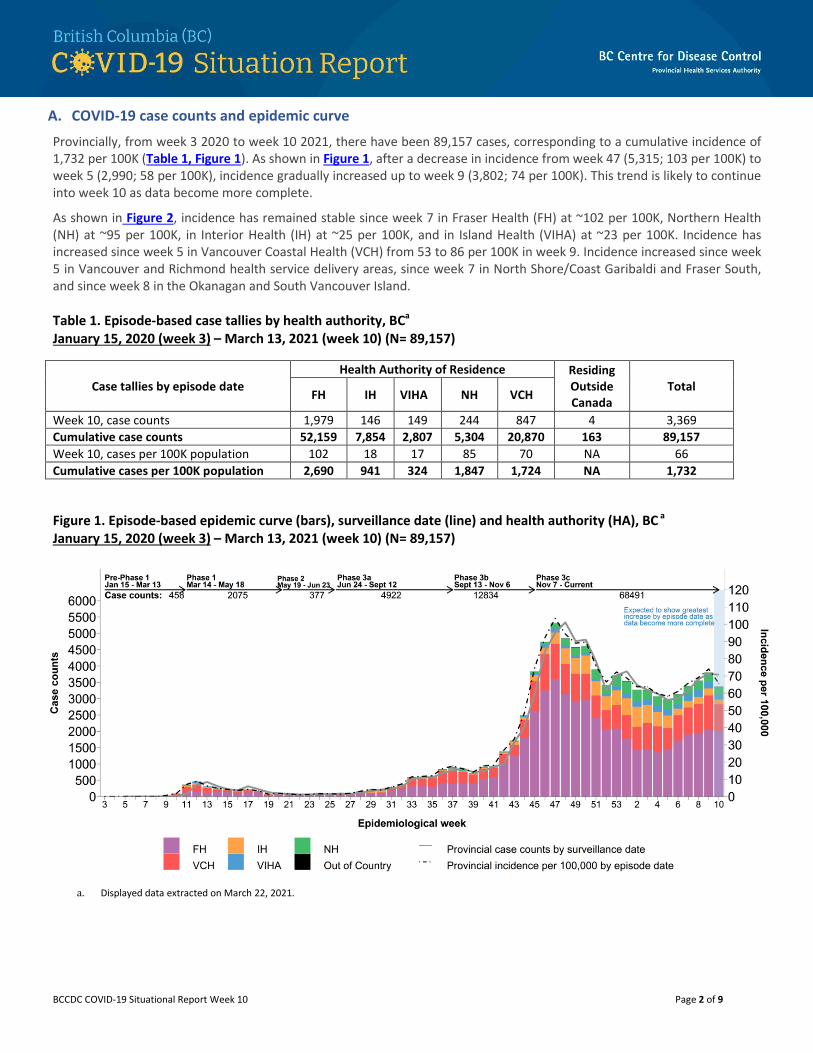
Provincially, from week 3 2020 to week 10 2021, there have been 89,157 cases, corresponding to a cumulative incidence of 1,732 per 100K (Table 1, Figure 1). As shown in Figure 1, after a decrease in incidence from week 47 (5,315; 103 per 100K) to week 5 (2,990; 58 per 100K), incidence gradually increased up to week 9 (3,802; 74 per 100K). This trend is likely to continue into week 10 as data become more complete.
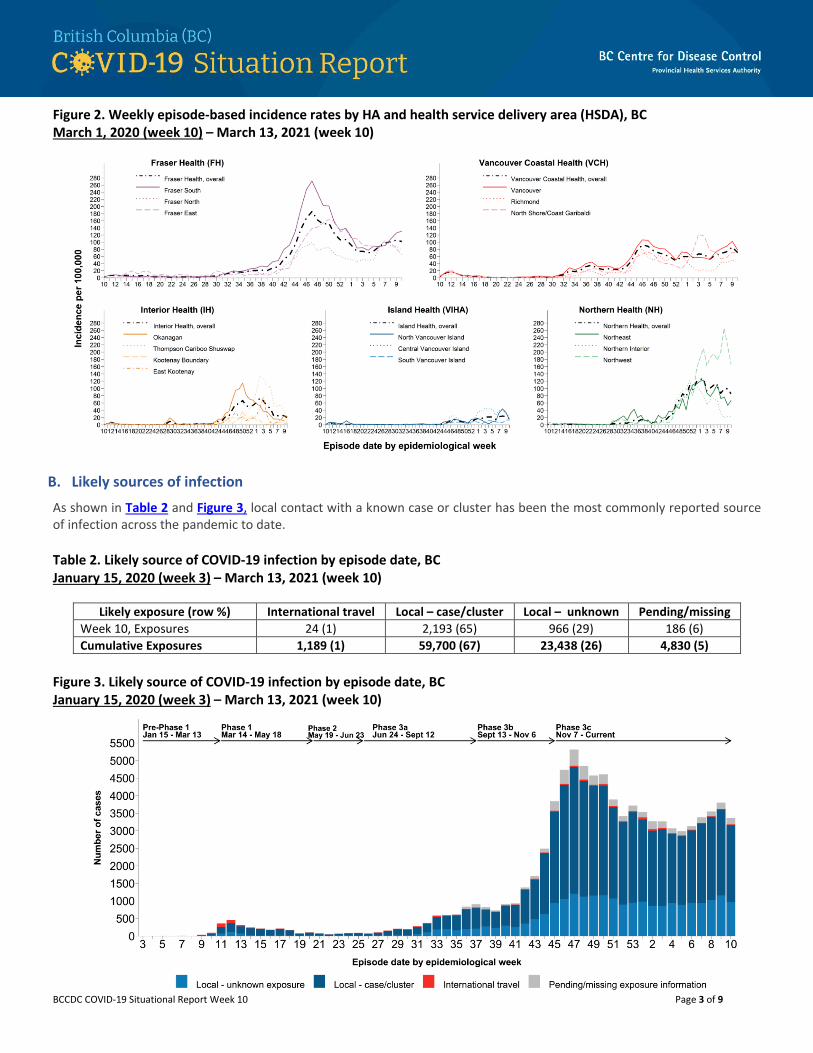
As shown in Figure 2, incidence has remained stable since week 7 in Fraser Health (FH) at ~102 per 100K, Northern Health (NH) at ~95 per 100K, in Interior Health (IH) at ~25 per 100K, and in Island Health (VIHA) at ~23 per 100K. Incidence has increased since week 5 in Vancouver Coastal Health (VCH) from 53 to 86 per 100K in week 9. Incidence increased since week 5 in Vancouver and Richmond health service delivery areas, since week 7 in North Shore/Coast Garibaldi and Fraser South, and since week 8 in the Okanagan and South Vancouver Island. Table 1. Episode-based case tallies by health authority, BCa
January 15, 2020 (week 3) – March 13, 2021 (week 10) (N= 89,157)
Case tallies by episode date Health Authority of Residence Residing
Outside Canada
Total FH IH VIHA NH VCH
Week 10, case counts 1,979 146 149 244 847 4 3,369 Cumulative case counts 52,159 7,854 2,807 5,304 20,870 163 89,157 Week 10, cases per 100K population 102 18 17 85 70 NA 66 Cumulative cases per 100K population 2,690 941 324 1,847 1,724 NA 1,732
Figure 1. Episode-based epidemic curve (bars), surveillance date (line) and health authority (HA), BC a January 15, 2020 (week 3) – March 13, 2021 (week 10) (N= 89,157)
a. Displayed data extracted on March 22, 2021.
BCCDC COVID-19 Situational Report Week 10 Page 3 of 9
Figure 2. Weekly episode-based incidence rates by HA and health service delivery area (HSDA), BC March 1, 2020 (week 10) – March 13, 2021 (week 10)
B. Likely sources of infection
As shown in Table 2 and Figure 3, local contact with a known case or cluster has been the most commonly reported source of infection across the pandemic to date. Table 2. Likely source of COVID-19 infection by episode date, BC January 15, 2020 (week 3) – March 13, 2021 (week 10)
Likely exposure (row %) International travel Local – case/cluster Local – unknown Pending/missing Week 10, Exposures 24 (1) 2,193 (65) 966 (29) 186 (6) Cumulative Exposures 1,189 (1) 59,700 (67) 23,438 (26) 4,830 (5)
Figure 3. Likely source of COVID-19 infection by episode date, BC January 15, 2020 (week 3) – March 13, 2021 (week 10)
BCCDC COVID-19 Situational Report Week 10 Page 4 of 9
C. Test rates and percent positive
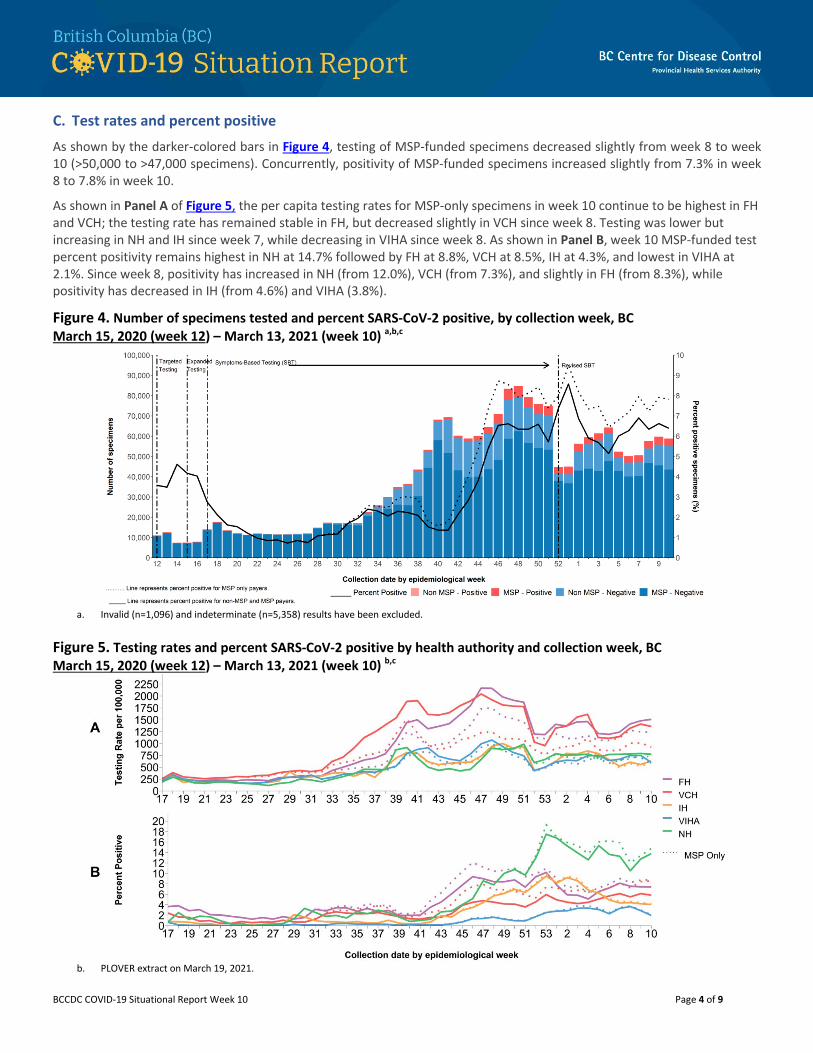
As shown by the darker-colored bars in Figure 4, testing of MSP-funded specimens decreased slightly from week 8 to week 10 (>50,000 to >47,000 specimens). Concurrently, positivity of MSP-funded specimens increased slightly from 7.3% in week 8 to 7.8% in week 10.
As shown in Panel A of Figure 5, the per capita testing rates for MSP-only specimens in week 10 continue to be highest in FH and VCH; the testing rate has remained stable in FH, but decreased slightly in VCH since week 8. Testing was lower but increasing in NH and IH since week 7, while decreasing in VIHA since week 8. As shown in Panel B, week 10 MSP-funded test percent positivity remains highest in NH at 14.7% followed by FH at 8.8%, VCH at 8.5%, IH at 4.3%, and lowest in VIHA at 2.1%. Since week 8, positivity has increased in NH (from 12.0%), VCH (from 7.3%), and slightly in FH (from 8.3%), while positivity has decreased in IH (from 4.6%) and VIHA (3.8%).
Figure 4. Number of specimens tested and percent SARS-CoV-2 positive, by collection week, BC March 15, 2020 (week 12) – March 13, 2021 (week 10) a,b,c
a. Invalid (n=1,096) and indeterminate (n=5,358) results have been excluded.
Figure 5. Testing rates and percent SARS-CoV-2 positive by health authority and collection week, BC March 15, 2020 (week 12) – March 13, 2021 (week 10) b,c
b. PLOVER extract on March 19, 2021.
BCCDC COVID-19 Situational Report Week 10 Page 5 of 9
D. Age profile – Testing and cases
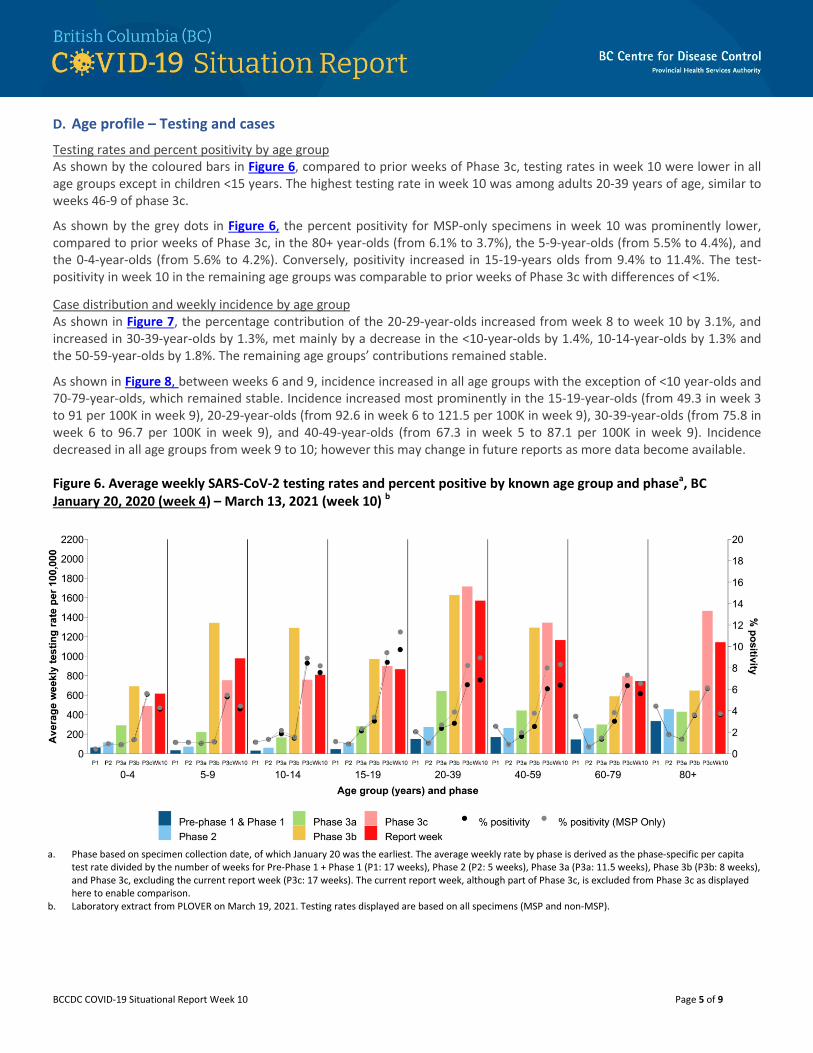
Testing rates and percent positivity by age group As shown by the coloured bars in Figure 6, compared to prior weeks of Phase 3c, testing rates in week 10 were lower in all age groups except in children <15 years. The highest testing rate in week 10 was among adults 20-39 years of age, similar to weeks 46-9 of phase 3c.
As shown by the grey dots in Figure 6, the percent positivity for MSP-only specimens in week 10 was prominently lower, compared to prior weeks of Phase 3c, in the 80+ year-olds (from 6.1% to 3.7%), the 5-9-year-olds (from 5.5% to 4.4%), and the 0-4-year-olds (from 5.6% to 4.2%). Conversely, positivity increased in 15-19-years olds from 9.4% to 11.4%. The test-positivity in week 10 in the remaining age groups was comparable to prior weeks of Phase 3c with differences of <1%.
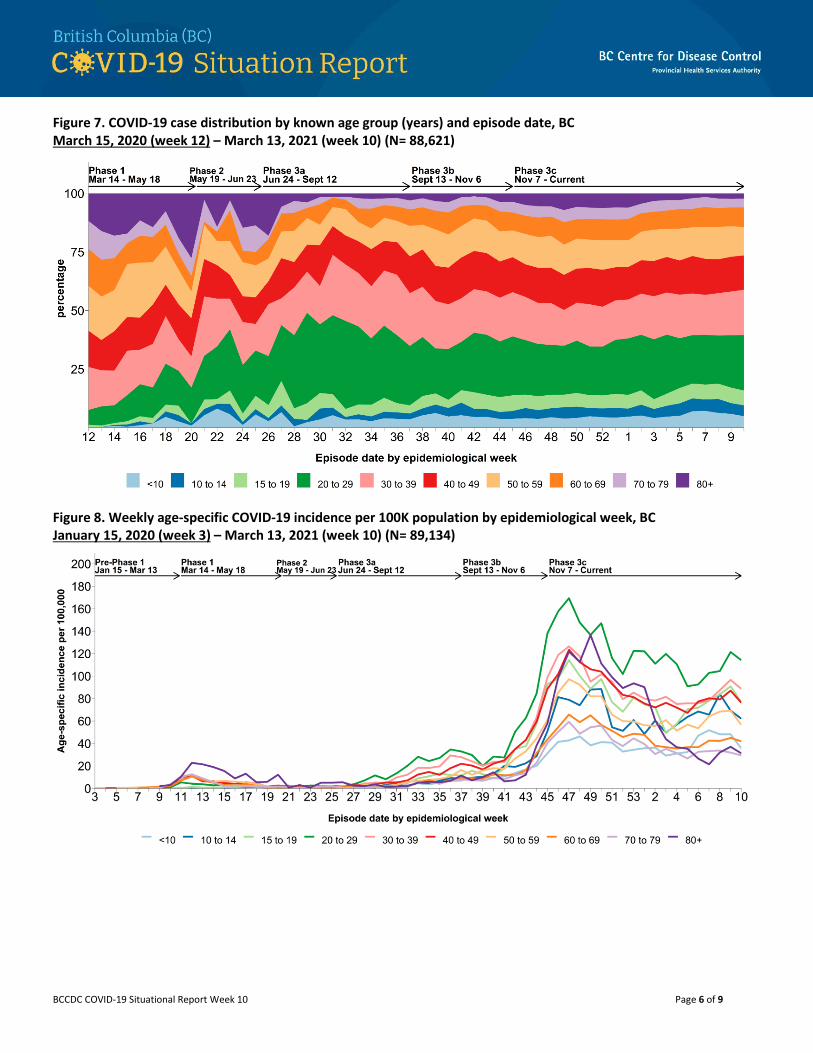
Case distribution and weekly incidence by age group As shown in Figure 7, the percentage contribution of the 20-29-year-olds increased from week 8 to week 10 by 3.1%, and increased in 30-39-year-olds by 1.3%, met mainly by a decrease in the <10-year-olds by 1.4%, 10-14-year-olds by 1.3% and the 50-59-year-olds by 1.8%. The remaining age groups’ contributions remained stable.
As shown in Figure 8, between weeks 6 and 9, incidence increased in all age groups with the exception of <10 year-olds and 70-79-year-olds, which remained stable. Incidence increased most prominently in the 15-19-year-olds (from 49.3 in week 3 to 91 per 100K in week 9), 20-29-year-olds (from 92.6 in week 6 to 121.5 per 100K in week 9), 30-39-year-olds (from 75.8 in week 6 to 96.7 per 100K in week 9), and 40-49-year-olds (from 67.3 in week 5 to 87.1 per 100K in week 9). Incidence decreased in all age groups from week 9 to 10; however this may change in future reports as more data become available. Figure 6. Average weekly SARS-CoV-2 testing rates and percent positive by known age group and phasea, BC January 20, 2020 (week 4) – March 13, 2021 (week 10) b
a. Phase based on specimen collection date, of which January 20 was the earliest. The average weekly rate by phase is derived as the phase-specific per capita test rate divided by the number of weeks for Pre-Phase 1 + Phase 1 (P1: 17 weeks), Phase 2 (P2: 5 weeks), Phase 3a (P3a: 11.5 weeks), Phase 3b (P3b: 8 weeks), and Phase 3c, excluding the current report week (P3c: 17 weeks). The current report week, although part of Phase 3c, is excluded from Phase 3c as displayed here to enable comparison.
b. Laboratory extract from PLOVER on March 19, 2021. Testing rates displayed are based on all specimens (MSP and non-MSP).
BCCDC COVID-19 Situational Report Week 10 Page 6 of 9
Figure 7. COVID-19 case distribution by known age group (years) and episode date, BC March 15, 2020 (week 12) – March 13, 2021 (week 10) (N= 88,621)
Figure 8. Weekly age-specific COVID-19 incidence per 100K population by epidemiological week, BC January 15, 2020 (week 3) – March 13, 2021 (week 10) (N= 89,134)
BCCDC COVID-19 Situational Report Week 10 Page 7 of 9
E. Severe outcome counts and epi-curve
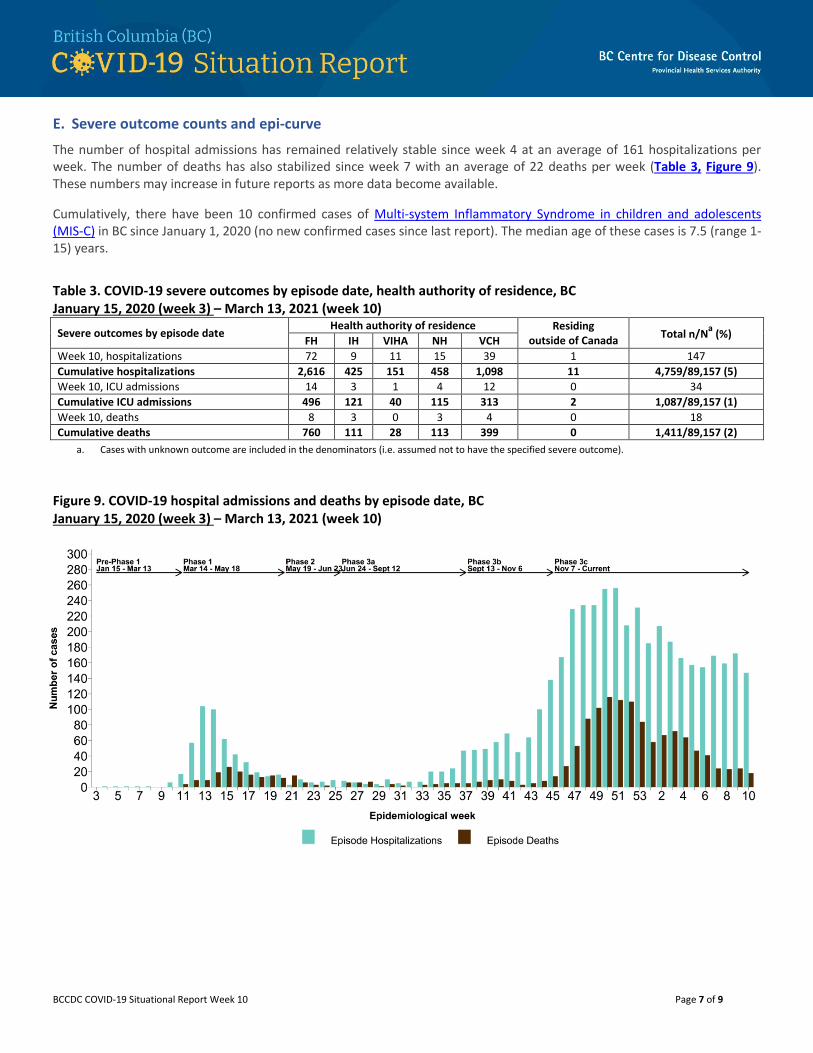
The number of hospital admissions has remained relatively stable since week 4 at an average of 161 hospitalizations per week. The number of deaths has also stabilized since week 7 with an average of 22 deaths per week (Table 3, Figure 9). These numbers may increase in future reports as more data become available.
Cumulatively, there have been 10 confirmed cases of Multi-system Inflammatory Syndrome in children and adolescents (MIS-C) in BC since January 1, 2020 (no new confirmed cases since last report). The median age of these cases is 7.5 (range 1-15) years.
Table 3. COVID-19 severe outcomes by episode date, health authority of residence, BC January 15, 2020 (week 3) – March 13, 2021 (week 10) Severe outcomes by episode date
Health authority of residence Residing outside of Canada Total n/Na (%) FH IH VIHA NH VCH
Week 10, hospitalizations 72 9 11 15 39 1 147 Cumulative hospitalizations 2,616 425 151 458 1,098 11 4,759/89,157 (5) Week 10, ICU admissions 14 3 1 4 12 0 34 Cumulative ICU admissions 496 121 40 115 313 2 1,087/89,157 (1) Week 10, deaths 8 3 0 3 4 0 18 Cumulative deaths 760 111 28 113 399 0 1,411/89,157 (2)
a. Cases with unknown outcome are included in the denominators (i.e. assumed not to have the specified severe outcome). Figure 9. COVID-19 hospital admissions and deaths by episode date, BC January 15, 2020 (week 3) – March 13, 2021 (week 10)
BCCDC COVID-19 Situational Report Week 10 Page 8 of 9
F. Age profile, severe outcomes
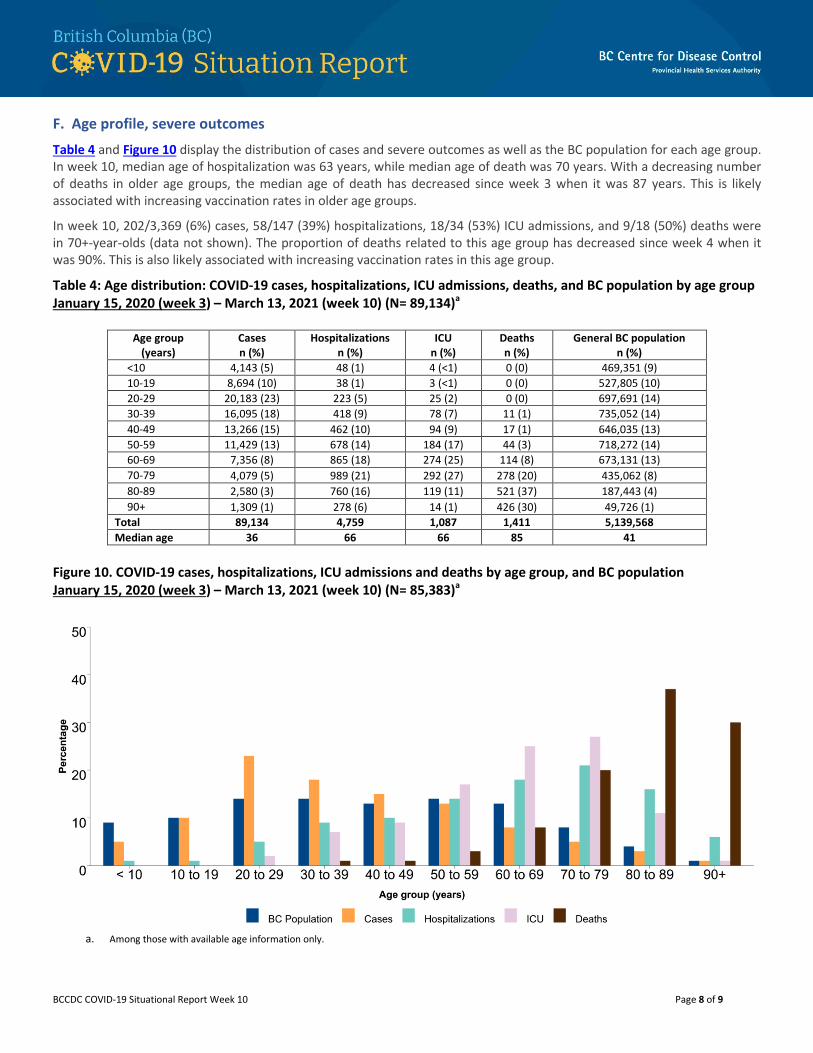
Table 4 and Figure 10 display the distribution of cases and severe outcomes as well as the BC population for each age group. In week 10, median age of hospitalization was 63 years, while median age of death was 70 years. With a decreasing number of deaths in older age groups, the median age of death has decreased since week 3 when it was 87 years. This is likely associated with increasing vaccination rates in older age groups.
In week 10, 202/3,369 (6%) cases, 58/147 (39%) hospitalizations, 18/34 (53%) ICU admissions, and 9/18 (50%) deaths were in 70+-year-olds (data not shown). The proportion of deaths related to this age group has decreased since week 4 when it was 90%. This is also likely associated with increasing vaccination rates in this age group.
Table 4: Age distribution: COVID-19 cases, hospitalizations, ICU admissions, deaths, and BC population by age group January 15, 2020 (week 3) – March 13, 2021 (week 10) (N= 89,134)a
Age group
(years) Cases n (%)
Hospitalizations n (%)
ICU n (%)
Deaths n (%)
General BC population n (%)
<10 4,143 (5) 48 (1) 4 (<1) 0 (0) 469,351 (9) 10-19 8,694 (10) 38 (1) 3 (<1) 0 (0) 527,805 (10) 20-29 20,183 (23) 223 (5) 25 (2) 0 (0) 697,691 (14) 30-39 16,095 (18) 418 (9) 78 (7) 11 (1) 735,052 (14) 40-49 13,266 (15) 462 (10) 94 (9) 17 (1) 646,035 (13) 50-59 11,429 (13) 678 (14) 184 (17) 44 (3) 718,272 (14) 60-69 7,356 (8) 865 (18) 274 (25) 114 (8) 673,131 (13) 70-79 4,079 (5) 989 (21) 292 (27) 278 (20) 435,062 (8) 80-89 2,580 (3) 760 (16) 119 (11) 521 (37) 187,443 (4) 90+ 1,309 (1) 278 (6) 14 (1) 426 (30) 49,726 (1)
Total 89,134 4,759 1,087 1,411 5,139,568 Median age 36 66 66 85 41
Figure 10. COVID-19 cases, hospitalizations, ICU admissions and deaths by age group, and BC population January 15, 2020 (week 3) – March 13, 2021 (week 10) (N= 85,383)a
a. Among those with available age information only.
BCCDC COVID-19 Situational Report Week 10 Page 9 of 9
Care facility outbreaks G.
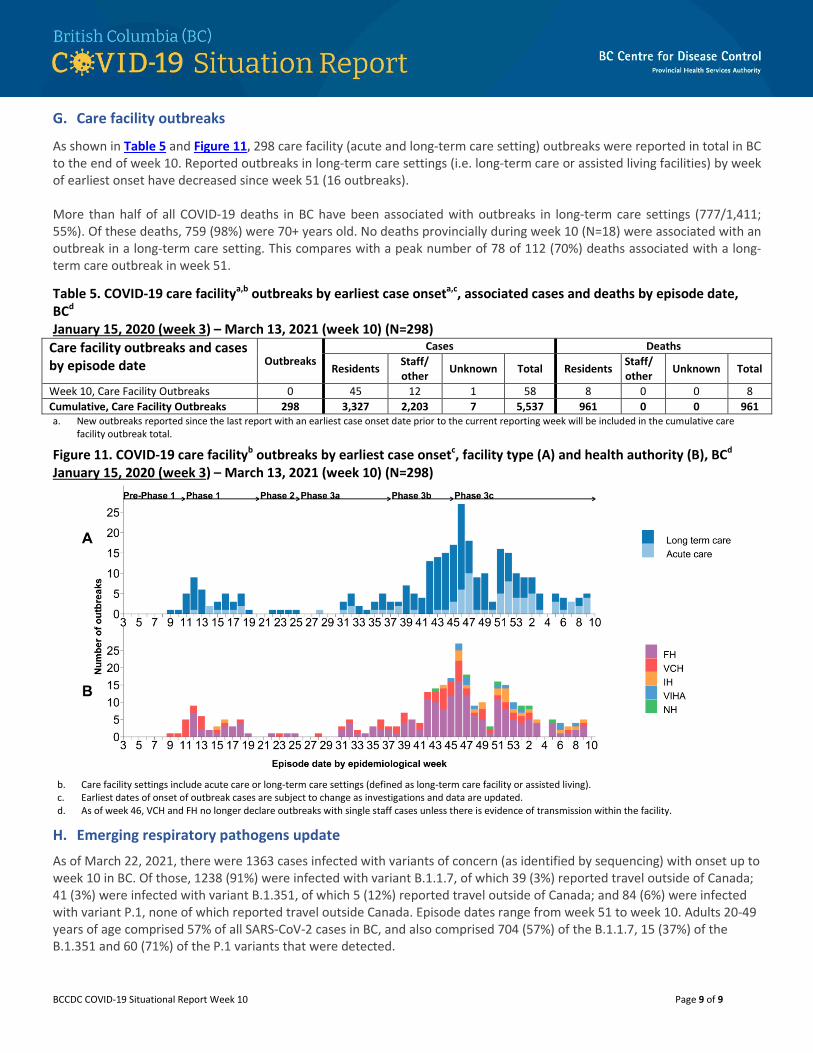
As shown in Table 5 and Figure 11, 298 care facility (acute and long-term care setting) outbreaks were reported in total in BC to the end of week 10. Reported outbreaks in long-term care settings (i.e. long-term care or assisted living facilities) by week of earliest onset have decreased since week 51 (16 outbreaks). More than half of all COVID-19 deaths in BC have been associated with outbreaks in long-term care settings (777/1,411; 55%). Of these deaths, 759 (98%) were 70+ years old. No deaths provincially during week 10 (N=18) were associated with an outbreak in a long-term care setting. This compares with a peak number of 78 of 112 (70%) deaths associated with a long-term care outbreak in week 51.
Table 5. COVID-19 care facilitya,b outbreaks by earliest case onseta,c, associated cases and deaths by episode date, BCd January 15, 2020 (week 3) – March 13, 2021 (week 10) (N=298)
Care facility outbreaks and cases by episode date Outbreaks
Cases Deaths
Residents Staff/ other Unknown Total Residents Staff/
other Unknown Total
Week 10, Care Facility Outbreaks 0 45 12 1 58 8 0 0 8 Cumulative, Care Facility Outbreaks 298 3,327 2,203 7 5,537 961 0 0 961 a. New outbreaks reported since the last report with an earliest case onset date prior to the current reporting week will be included in the cumulative care
facility outbreak total.
Figure 11. COVID-19 care facilityb outbreaks by earliest case onsetc, facility type (A) and health authority (B), BCd January 15, 2020 (week 3) – March 13, 2021 (week 10) (N=298)
b. Care facility settings include acute care or long-term care settings (defined as long-term care facility or assisted living). c. Earliest dates of onset of outbreak cases are subject to change as investigations and data are updated. d. As of week 46, VCH and FH no longer declare outbreaks with single staff cases unless there is evidence of transmission within the facility.
Emerging respiratory pathogens update H.
As of March 22, 2021, there were 1363 cases infected with variants of concern (as identified by sequencing) with onset up to week 10 in BC. Of those, 1238 (91%) were infected with variant B.1.1.7, of which 39 (3%) reported travel outside of Canada; 41 (3%) were infected with variant B.1.351, of which 5 (12%) reported travel outside of Canada; and 84 (6%) were infected with variant P.1, none of which reported travel outside Canada. Episode dates range from week 51 to week 10. Adults 20-49 years of age comprised 57% of all SARS-CoV-2 cases in BC, and also comprised 704 (57%) of the B.1.1.7, 15 (37%) of the B.1.351 and 60 (71%) of the P.1 variants that were detected.