Embed Size (px)
Citation preview

British Columbia Ferry Services Inc.
Annual Report to the
British Columbia Ferries Commissioner
Year Ended March 31, 2013

July 31, 2013 2012/13 Annual Report to the British Columbia Ferries Commissioner Page 1
Table of Contents
Introduction ................................................................................. 2
Part 1: Services on Designated Routes
Overview ..............................................................................7
Reports for the Year Ended March 31, 2013
Operations Report .............................................................. 10
Temporary Service Disruptions Report................................... 13
Route Financial Report ........................................................ 20
Part 2: Service Quality
Customer Satisfaction Tracking Annual Report - 2012 ......... 39
Complaints Resolution Report.............................................. 79
Part 3: Additional or Alternative Service Providers
Overview ........................................................................... 96

July 31, 2013 2012/13 Annual Report to the British Columbia Ferries Commissioner Page 2
Introduction
In accordance with Section 66 of the Coastal Ferry Act (“Act”), British Columbia Ferry Services Inc. (“BC Ferries” or the “Company”) is pleased to submit its annual report for the year ended March 31, 2013 (the “fiscal year” or “2012/13”), to the British Columbia Ferries Commissioner (the “Commissioner”).
This report is a compilation of information on the services BC Ferries has provided during the fiscal year on designated ferry routes and includes information on the costs and quality of services provided and the actions taken by the Company to investigate additional or alternative service providers (“ASPs”) to deliver services on these designated routes. This report responds to the specific information requirements conveyed to BC Ferries by the Commissioner and as identified in the Act.
Part 1: Services on Designated Routes
BC Ferries delivers coastal ferry services on 25 designated ferry routes under the Coastal Ferry Services Contract (the “Contract”) between BC Ferries and the Province of British Columbia (the “Province”) as represented by the Ministry of Transportation and Infrastructure. These ferry routes are regulated under the Act. In accordance with the Contract, BC Ferries also manages ferry transportation service on other unregulated routes through contracts with ASPs.
Part 1 of this report contains financial statistics, as well as information on traffic levels and operating and performance statistics for the fiscal year for each of the 25 designated ferry routes.
In 2012/13, BC Ferries carried 7.7 million vehicles1 and 19.9 million passengers and delivered 84,113.5 round trips on the designated ferry routes. During the fiscal year, the Company continued to maintain a high standard of service reliability, delivering 99.8% of the scheduled round trip sailings2. On a system-wide basis, BC Ferries’ on-time performance was 92.3% in the fiscal year.
Traffic levels in the fiscal year were lower than anticipated. BC Ferries experienced a 1.1% decline in vehicle traffic and a 1.2% decline in passenger traffic in 2012/13 compared to the prior fiscal year. A significant factor in the decline was a period of stormy weather with high winds that resulted in numerous sailing cancellations during the December holiday season. In three of the last five months of 2012/13, however, total traffic was higher than the same periods in the prior year.
In April 2012, BC Ferries’ SailSafe program, a joint initiative with the BC Ferry & Marine Workers’ Union entered the sustainment phase. This phase marked the transition from the implementation of a safety program to a regular part of the Company’s business, fully integrated into all aspects of daily operations. Since
1 Equivalent to 8.8 million automobile equivalents (see the Operations Report for more information). 2 Excludes weather, medical or rescue related cancellations.

July 31, 2013 2012/13 Annual Report to the British Columbia Ferries Commissioner Page 3
the inception of SailSafe in 2007, employee time loss injuries have decreased by over 50% and passenger injuries have decreased even more. These are but two of many significant improvements in safety-related performance arising from the SailSafe program.
While ensuring safety remains the first priority, BC Ferries has maintained a strong focus on containing costs and operating as efficiently as possible. The results have been positive. Operating expenses in the fiscal year, excluding fuel costs, were $27.2 million below previously planned levels as published in the Company’s annual Business Plan for 2012/13. Overall, through prudent stewardship, the Company returned to a position of profitability in the fiscal year, despite lower than anticipated traffic levels.
Contributing to this result were savings arising from a reduction in sailings on the major routes as agreed to by the Province as part of the amendments to the Contract for performance term three (“PT3”). The Contract amendments provide for a reduction of up to 400 round trips on the major routes which is expected to yield savings totalling $4 million over PT3.
The Contract for PT3 contains principles and targets for further service level reductions system wide. These initiatives were expected to achieve efficiencies totalling $30 million over PT3. On April 3, 2013, the Contract was subsequently amended to extend the deadline for identifying these service level adjustments to March 31, 2014, in order to provide sufficient time to the Province to further consult with stakeholders regarding future service changes. As part of this amendment, the Province agreed to pay the Company $7.1 million in ferry transportation fees to compensate for the change in deadline and to reduce savings from service adjustments from $30 million to $22.9 million. In recognition of this amendment, the Commissioner issued an order updating his original PT3 price cap Order 12-02, and acknowledged the $4 million in savings from service reductions already implemented with $18.9 million yet to be identified.
Ferry service levels are a public policy decision of the Province, and the Company will await direction from the government regarding any future adjustments to service levels and the resulting impact on fares.
Through continued focus on containing costs and operating as efficiently as possible, the Company has exceeded the productivity targets set by the Commissioner in Order 12-02. In his Order, the Commissioner required the Company to achieve efficiencies totalling $54.2 million over the four years of PT3. In 2012/13, the first year of PT3, the Company made significant progress towards realizing this target, achieving operating cost efficiencies in excess of $31 million. These efficiencies were achieved by reducing fuel consumption by $6.3 million; travel, advertising, mail, telecommunication, property tax and credit card fees by $3.1 million; and wages and benefits by $10.6 million (including $1.4 million in executive compensation); as well as by achieving vessel and terminal maintenance cost reductions and efficiencies of $3.9 million and savings of $7.5 million in operating cost contingencies to mitigate revenue risk and incidences.

July 31, 2013 2012/13 Annual Report to the British Columbia Ferries Commissioner Page 4
During the fiscal year, planning continued with respect to the refurbishment of the Company’s minor and intermediate size vessels. In May 2013, the Company submitted an application to the Commissioner to acquire three intermediate class vessels to replace the Queen of Nanaimo and Queen of Burnaby. This marks the first step in the Company’s plan to build standardized intermediate size vessels to achieve interoperability and design optimization. It also provides an opportunity for BC Ferries to explore further the use of liquefied natural gas (“LNG”) as a potential fuel source for its vessels. LNG is not only currently cheaper than marine diesel, it is also better for the environment.
After extensive review, the Company announced in November 2012 its decision to proceed with plans to design and build a cable ferry to operate between Buckley Bay on Vancouver Island and Denman Island. The cable ferry is expected to enter service in the fall of 2014, and to provide a substantial cost savings over the 40-year project life compared to the current service.
This past fiscal year, BC Ferries continued to pursue innovative approaches for generating revenue from non-traditional sources. Two examples are BC Ferries’ drop-trailer service and BC Ferries Vacations. Generating revenue from areas other than the farebox helps to reduce upward pressure on ferry fares. These two lines of business generated revenues of over $10 million this year.
BC Ferries also progressed during the year on its extensive, multi-year integrated business solution project to improve the end-to-end customer experience. The program called Automated Customer Experience (“ACE”) will replace two of the Company’s primary business systems, point-of-sale and reservations, and will introduce new services to enhance the overall level of customer service, especially in the areas of mobility and social media. The program is fundamental to the future evolution of ferry services and the Commissioner has initiated a performance review, in order to ensure that the interests of ferry users and taxpayers are fully considered.
Part 2: Service Quality
As in past years, BC Ferries commissioned an independent professional consulting organization to conduct and document a comprehensive customer satisfaction survey. In addition to meeting BC Ferries’ obligations under the Contract, the survey is an important part of the Company’s ongoing market research program that supports various operational and marketing initiatives. For comparative purposes, each year’s survey since 2003 has included an identical set of questions, with minor modifications in 2004, 2009 and 2010. In 2012, 88% of customers surveyed reported being satisfied with their overall experience travelling on BC Ferries. Part 2 of this report contains a copy of the 2012 customer satisfaction tracking annual report.
Part 2 of this report also includes BC Ferries’ complaints resolution report for the fiscal year. BC Ferries’ current customer complaints process has been in place since 2005. Hearing from customers helps BC Ferries to understand if it is meeting or exceeding their expectations, or conversely, what areas need to be focussed on to improve service quality and support the Company in continuing to realize its vision and mission. The complaints resolution report contains a

July 31, 2013 2012/13 Annual Report to the British Columbia Ferries Commissioner Page 5
summary of the feedback BC Ferries has received during the fiscal year, the lessons learned and the actions taken in response.
Part 3: Additional or Alternative Service Providers (ASPs)
BC Ferries is required by Section 69 of the Act to seek ASPs where so ordered by the Commissioner. When BC Ferries receives such an Order, it must prepare a plan for the Commissioner’s approval, and then report to the Commissioner on the activities it undertook to comply with the Order. During the fiscal year, no Orders were issued by the Commissioner for BC Ferries to seek ASPs. However, consistent with its ongoing efforts to enhance efficiency and productivity in the delivery of coastal ferry services, BC Ferries from time to time proactively tests the market to determine if another operator, under sub-contract could provide safe, reliable and high quality service that is more cost-effective. Part 3 of this report provides information on the actions taken by BC Ferries in 2012/13 to seek ASPs.

July 31, 2013 2012/13 Annual Report to the British Columbia Ferries Commissioner Page 6
Part 1
Services on Designated Routes

July 31, 2013 2012/13 Annual Report to the British Columbia Ferries Commissioner Page 7
Part 1: Services on Designated Routes
Overview
This section contains financial statistics, as well as information on traffic levels, and operating and performance statistics for 2012/13 for each of the designated ferry routes.3
The following three reports are included:
Operations Report
This report provides the following information for the designated ferry routes, presented in numeric format for each route and route group:
Round Trips
The total number of round trips BC Ferries delivered on each of the designated ferry routes is provided.
Overall, BC Ferries delivered a total of 84,113.5 round trips during the fiscal year, which exceeded by 822 the core service level requirements specified in the Contract, as amended for performance term three.
Vessel Capacity
For each designated ferry route, the vessel capacity BC Ferries provided in the fiscal year is presented along with the calculation of capacity utilization. Capacity is calculated on the basis of automobile equivalents (“AEQ”). An AEQ represents the amount of vessel capacity occupied by a particular vehicle type expressed as the number of under height vehicles it displaces (e.g. a bus which displaces three under height vehicles (or cars) would have an AEQ of 3). In 2012/13, BC Ferries provided capacity sufficient to carry the traffic, with capacity utilization on the designated ferry routes ranging from 20.2% to 72.2%.
Traffic and Revenue
Vehicle traffic (AEQs) and passenger traffic carried on each of the designated ferry routes during 2012/13 is presented and compared to the traffic carried in the previous fiscal year. The associated tariff revenue generated from each route is also shown.
In 2012/13, vehicle and passenger traffic levels declined by 1.1% and 1.2%, respectively. As noted above, a contributing factor to this decline was a period of stormy weather resulting in numerous sailing cancellations during the December holiday season. For three of the last five months of 2012/13 traffic levels were
3 On March 31, 2013, BC Ferries reached agreement with the Province, amending the Contract, to consolidate all
designated routes into a single route group effective April 1, 2013. This revised grouping will be in effect until March 31, 2016. In the absence of any further amendments, on April 1, 2016, the route group structure in the Contract will revert back to the structure at March 31, 2013.

July 31, 2013 2012/13 Annual Report to the British Columbia Ferries Commissioner Page 8
higher than in the same periods in the prior year.
Revenue from vehicle and passenger traffic on the designated ferry routes in 2012/13 totalled $468.8 million, an increase of $11.8 million from the prior fiscal year.
PT3 commenced April 1, 2012. In March 2011, the Commissioner set preliminary price cap increases for each of the four years of PT3 of 4.15% for the three Major Routes and 8.23% for all other routes. On June 2, 2011, the Coastal Ferry Amendment Act, 2011 (Bill 14) was enacted. Among other things, Bill 14 established a price cap increase for each route group for the first year of PT3 of 4.15% from the weighted average of the tariffs payable as at March 31, 2012. BC Ferries implemented tariff increases April 1, 2012 to the new levels authorized. The April 1, 2012 price cap and tariff increases were moderated by incremental funding provided from the Province (see below).
Bill 14 gave the Commissioner the mandate to conduct a review of the Act before issuance of his final decision on price caps for the balance of PT3. On January 24, 2012, the Commissioner issued his report to the Province and in May 2012, in response to the Commissioner’s report, the Province enacted Bill 47. Together with the introduction of amendments to the Act, the Province announced additional payments totalling $79.5 million in order to reduce the pressure for future fare and price cap increases.
On September 30, 2012, the Commissioner established the price cap increases for the remainder of PT3: 4.1% at April 1, 2013; 4.0% at April 1, 2014; and 3.9% at April 1, 2015. BC Ferries implemented tariff increases April 1, 2013 to the new levels authorized.
On June 1, 2011, due to the rising costs of fuel, fuel surcharges on the major routes of 2.5% of tariffs on average were implemented and subsequently increased to 5.0% on average effective December 12, 2011. On December 12, 2011, a fuel surcharge of 2.5% of tariffs on average was implemented on route 3 (Horseshoe Bay to Langdale) while the majority of the other (non-northern) routes maintained the 5% surcharge which had also been put in place on June 1, 2011. Effective July 20, 2012, all fuel surcharges were reduced to 2.0% and effective November 20, 2012, were eliminated altogether. The Company continues to monitor its deferred fuel cost accounts. Due to the volatility of fuel pricing, fuel surcharges are likely to be re-introduced if current market conditions persist.
On-Time Performance
The percentage of sailings departing within 10 minutes of the scheduled time is provided for each of the designated ferry routes.
Meeting customer service expectations is an important factor in BC Ferries’ focus on on-time performance.
In 2012/13, over 92% of BC Ferries’ sailings, system-wide, departed within 10 minutes of schedule.

July 31, 2013 2012/13 Annual Report to the British Columbia Ferries Commissioner Page 9
Temporary Service Disruptions Report
This report describes how the services provided by BC Ferries during the fiscal year compared to the core service levels set out in the Contract, as amended for performance term two. There are four sections of this report:
1. Cancelled Round Trips by Route and Route Group,
2. Cancelled and Extra Round Trips by Route and Route Group,
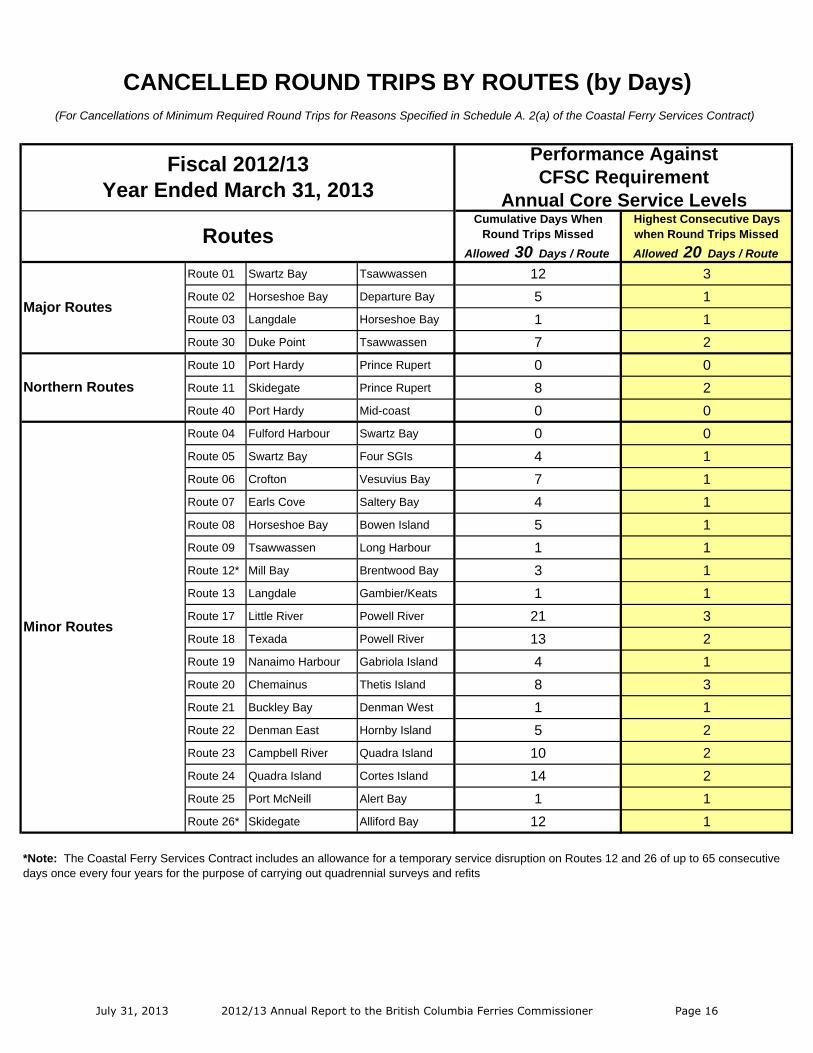
3. Cancelled Round Trips by Days For Route and Route Group, and
4. Round Trip Service Delivery and On-Time Performance.
For each designated ferry route, the cumulative and consecutive number of days for which round trips were missed and the causes of the missed round trips are noted. In 2012/13, BC Ferries exceeded its annual core service level commitments under the Contract by 822 net round trips. Most of these additional round trips were delivered in the summer on route 21 (Buckley Bay to Denman Island) and route 22 (Denman Island to Hornby Island) to accommodate peak period traffic demand.
In the “Round Trip Service Delivery and On-Time Performance” section of the report, certain elements of reporting are graphically presented including the scheduled and actual round trips and on-time performance. The percentage of sailings departing within 10 minutes of the scheduled time is provided for each of the designated ferry routes, as well as the reasons for the delays.
This report also provides information on “overload sailings” which is defined as a sailing for which one or more vehicles waiting to travel could not be accommodated. Overall, 7.5% of the sailings on the designated ferry routes were overloaded in 2012/13, the same as in 2011/12.
Route Financial Report
This report provides financial information for the fiscal year with comparative figures for the previous fiscal year for each of the designated ferry routes.
The information is provided by individual route and is also summarized by the route groups specified in the Contract. Revenues and expenses are assigned directly to a route where possible or allocated to routes where direct assignment is not possible. Allocation to routes is based on various factors which reflect the activity that gave rise to the revenue or expense.
Commencing 2012/13, all of BC Ferries financial reporting is prepared in accordance with International Financial Reporting Standards (IFRS). The route financial report reflects this changeover to IFRS from Canadian generally accepted accounting principles (previous GAAP). The report includes a detailed explanation as well as a reconciliation between the 2011/12 route statements previously reported (prepared using previous GAAP) and those reflecting IFRS.

Operations Report
Year Ended March 31, 2013

Operations Summary Report for the Year Ended March 31, 2013
A B C D E F G H I
Route Group RouteActual Round
Trips
Capacity Provided (AEQ's)
AEQ's Carried Fiscal 2013
Capacity Utilization (C / B)
AEQ's Carried Fiscal 2012
AEQ Growth (C - E)
AEQ Tariff Revenue
Fiscal 2013 Note 3
AEQ Tariff Revenue
Fiscal 2012
AEQ Tariff Revenue Growth (G - H)
1 1 3,829.0 2,894,340 2,090,878 72.2% 2,101,692 (10,814) 106,069,958$ 101,688,375$ 4,381,583$ 1 2 3,052.0 2,215,968 1,289,221 58.2% 1,289,690 (469) 62,385,432 59,859,220 2,526,212 1 3 3,059.0 2,213,992 1,205,738 54.5% 1,225,018 (19,280) 24,187,908 23,848,165 339,743 1 30 2,681.0 1,729,530 825,623 47.7% 828,180 (2,557) 50,786,226 48,222,837 2,563,389
Major Routes 12,621.0 9,053,830 5,411,460 59.8% 5,444,580 (33,120) 243,429,524 233,618,597 9,810,927 Note 2
2 10 124.0 34,638 13,516 39.0% 14,003 (487) 4,054,804 4,219,991 (165,187)2 11 183.5 41,069 17,464 42.5% 17,184 280 2,974,177 2,967,157 7,020 2 40 39.0 8,970 2,643 29.5% 2,490 153 755,794 690,517 65,277
Northern Routes 346.5 84,677 33,623 39.7% 33,677 (54) 7,784,775 7,877,665 (92,890)
3 4 2,881.0 574,530 307,636 53.5% 313,815 (6,179) 3,187,926 3,142,836 45,090 3 5 3,494.0 687,383 255,146 37.1% 260,685 (5,539) 2,995,893 3,054,736 (58,843)3 6 5,036.0 705,040 250,470 35.5% 255,439 (4,969) 2,789,438 2,804,940 (15,502)3 7 2,871.0 712,470 187,465 26.3% 190,795 (3,330) 3,890,432 3,896,043 (5,611)3 8 5,575.0 954,850 484,240 50.7% 503,601 (19,361) 5,044,033 5,066,107 (22,074)3 9 829.0 361,520 152,514 42.2% 154,673 (2,159) 6,270,088 6,103,822 166,266 3 12 3,210.0 141,240 78,279 55.4% 70,275 8,004 853,476 748,185 105,291 3 13 4,117.0 Pass. Only Pass. Only Pass. Only Pass. Only Pass. Only 287 379 (92) Note 1
3 17 1,424.0 546,816 161,845 29.6% 169,262 (7,417) 5,439,448 5,649,039 (209,591)3 18 3,649.0 355,250 90,815 25.6% 88,381 2,434 630,283 593,910 36,373 3 19 5,728.0 801,360 364,313 45.5% 366,511 (2,198) 2,874,201 2,826,576 47,625 3 20 4,365.0 279,360 81,281 29.1% 82,957 (1,676) 616,033 608,485 7,548 3 21 6,458.0 594,240 244,560 41.2% 249,636 (5,076) 1,644,513 1,658,483 (13,970)3 22 4,753.0 285,000 108,608 38.1% 109,594 (986) 700,040 686,570 13,470 3 23 6,245.0 874,370 366,607 41.9% 376,113 (9,506) 2,796,109 2,839,807 (43,698)3 24 2,107.0 126,420 55,628 44.0% 56,036 (408) 483,857 476,567 7,290 3 25 3,956.0 237,360 88,085 37.1% 88,994 (909) 820,120 798,784 21,336 3 26 4,448.0 231,296 46,642 20.2% 46,771 (129) 382,309 367,652 14,657
Minor Routes 71,146.0 8,468,505 3,324,134 39.3% 3,383,538 (59,404) 41,418,486 41,322,921 95,565
Total 84,113.5 17,607,012 8,769,217 49.8% 8,861,795 (92,578) 292,632,785 282,819,183 9,813,602
Obligation settled (1,536,710)Note 1) Revenue arises from bike traffic and freight.Note 2) For the Major Routes group, prior year totals have been updated to reflect the inclusion of Route 3. Total vehicle fare revenue 291,096,075Note 3) At March 31, 2012 the Major Routes were over price cap by $2.4 million (Vehicles $1.5 million and Passenger $0.9 million). This obligation to customers was settled in the quarter ended June 30, 2012.Note 4) Indicates percentage of sailings departing within 10 minutes of scheduled departure for Route Groups 1 and 3, and arriving within 10 minutes of scheduled arrival for Route Group 2. Prior year on-time performance results for Route Group 2 have been restated to reflect the change from departure to arrival based on time performance reporting.
July 31, 2013 2012/13 Annual Report to the British Columbia Ferries Commissioner Page 11

Operations Summary Report for the Year Ended March 31, 2013
J K L M N O
Fiscal 2011 Fiscal 2012 Fiscal 2013
1 1 5,589,971 5,645,013 (55,042) 71,285,026$ 69,016,885$ 2,268,141$ 85.2% 84.1% 87.2%1 2 3,310,473 3,340,199 (29,726) 41,754,677 40,488,854 1,265,823 79.3% 85.5% 76.2%1 3 2,501,900 2,539,363 (37,463) 13,193,508 12,985,575 207,933 78.4% 87.5% 81.9%1 30 1,374,878 1,396,232 (21,354) 17,053,913 16,650,200 403,713 92.1% 90.1% 92.8%
Major Routes 12,777,222 12,920,807 (143,585) 143,287,124 139,141,514 4,145,610 Note 2 83.6% 86.5% 84.5%
2 10 38,108 39,622 (1,514) 4,927,807 5,198,250 (270,443) 91.2% 89.1% 89.8%2 11 35,791 34,487 1,304 1,221,945 1,140,198 81,747 95.1% 95.9% 97.0%2 40 6,949 6,533 416 767,658 737,045 30,613 93.7% 86.2% 90.1%
Northern Routes 80,848 80,642 206 6,917,410 7,075,493 (158,083) 92.7% 90.6% 91.9%
3 4 619,939 627,080 (7,141) 2,639,135 2,596,293 42,842 94.9% 93.8% 95.9%3 5 459,393 467,576 (8,183) 1,855,653 1,755,098 100,555 76.1% 82.2% 88.9%3 6 478,733 490,030 (11,297) 1,669,174 1,650,270 18,904 88.1% 88.9% 91.1%3 7 331,679 339,021 (7,342) 1,754,524 1,769,094 (14,570) 91.7% 94.7% 95.6%3 8 1,132,383 1,145,637 (13,254) 3,328,933 3,272,044 56,889 84.9% 91.5% 90.3%3 9 434,839 434,582 257 4,619,207 4,471,706 147,501 77.8% 87.5% 89.2%3 12 154,384 137,591 16,793 682,081 601,251 80,830 87.8% 89.5% 91.9%3 13 46,964 47,892 (928) 170,519 166,281 4,238 99.2% 99.7% 99.4%3 17 352,820 365,822 (13,002) 3,765,608 3,820,026 (54,418) 86.8% 83.0% 94.4%3 18 170,604 171,706 (1,102) 477,477 458,035 19,442 88.5% 82.9% 90.2%3 19 771,783 777,495 (5,712) 1,995,172 1,958,650 36,522 89.6% 93.5% 96.1%3 20 247,556 255,031 (7,475) 556,810 551,098 5,712 80.8% 86.0% 83.8%3 21 463,752 474,679 (10,927) 1,153,854 1,180,542 (26,688) 99.3% 99.2% 99.1%3 22 208,253 218,573 (10,320) 493,914 508,545 (14,631) 98.3% 96.8% 97.1%3 23 785,170 804,149 (18,979) 1,948,245 1,935,971 12,274 98.0% 98.1% 98.6%3 24 96,918 96,925 (7) 321,658 311,811 9,847 92.4% 92.0% 94.5%3 25 218,417 225,273 (6,856) 717,970 712,905 5,065 93.5% 93.8% 88.0%3 26 87,441 89,466 (2,025) 254,151 247,304 6,847 99.5% 99.5% 99.4%
Minor Routes 7,061,028 7,168,528 (107,500) 28,404,085 27,966,924 437,161 90.6% 92.4% 93.6%
Total 19,919,098 20,169,977 (250,879) 178,608,619 174,183,931 4,424,688 89.6% 91.6% 92.3%
Obligation settled (924,282)
Total passenger fare revenue 177,684,337
Total vehicle and passenger fare revenue per financial statements 468,780,412
Passenger Growth (J - K)
Passenger Tariff Revenue
Fiscal 2013 Note 3
% Sailings Within 10 Min. (Note 4)Route Group RoutePassengers Fiscal 2013
Passengers Fiscal 2012
Passenger Tariff Revenue Fiscal 2012
Passenger Tariff Revenue Growth
(M - N)
July 31, 2013 2012/13 Annual Report to the British Columbia Ferries Commissioner Page 12

Temporary Service Disruptions Report
Year Ended March 31, 2013

Terminal 1 Terminal 2 Major Incident Weather Emerg.
ResponseMedical Emerg.
Regulatory Issue
Terminal / Dock Maint.
Terminal / Dock Mech.
Failure
Vessel Maint.
Vessel Mech. Failure
Vessel Sink /
GroundFire Labour
DisputeAllowed Cancels
Community Event Traffic Other Cancels Total Cancels
% of Required Round Trips
CancelledRoute 01 Swartz Bay Tsawwassen 1 7 12 20.0 0.0 20.0Route 02 Horseshoe Bay Departure Bay 2 7 1 10.0 0.0 10.0Route 03 Langdale Horseshoe Bay 1 1.0 0.0 1.0Route 30 Duke Point Tsawwassen 5 5 3 13.0 0.0 13.0
Major Routes 3 19 0 0 0 0 0 0 19 0 3 0 44.0 0 0 0.0 44.0 0.36%Route 10 Port Hardy Prince Rupert 0.0 0.0 0.0 0.00%Route 11 Skidegate Prince Rupert 5 5.0 0.0 5.0 2.64%Route 40 Port Hardy Mid-coast 0.0 0.0 0.0 0.00%
Northern Routes 0 5 0 0 0 0 0 0 0 0 0 0 5.0 0 0 0.0 5.0 1.42%Route 04 Fulford Harbour Swartz Bay 0.0 0.0 0.0 0.00%Route 05 Swartz Bay Four SGIs 2 2 4.0 0.0 4.0 0.11%Route 06 Crofton Vesuvius Bay 3 2 3 1 9.0 0.0 9.0 0.18%Route 07 Earls Cove Saltery Bay 1 3 4.0 0.0 4.0 0.14%Route 08 Horseshoe Bay Bowen Island 1 1 2.5 4.5 0.0 4.5 0.08%Route 09 Tsawwassen Long Harbour 1 1.0 0.0 1.0 0.12%Route 12 Mill Bay Brentwood Bay 4 4.0 0.0 4.0 0.12%Route 13* Langdale Gambier/Keats 3 3.0 0.0 3.0 0.07%Route 17 Little River Powell River 27 3 4 34.0 0.0 34.0 2.33%Route 18 Texada Powell River 23 1 7 31.0 0.0 31.0 0.85%Route 19 Nanaimo Harbour Gabriola Island 1 2 1 4.0 0.0 4.0 0.07%Route 20 Chemainus Thetis Island 2 1 8 11.0 0.0 11.0 0.25%Route 21 Buckley Bay Denman West 1 1.0 0.0 1.0 0.02%Route 22 Denman East Hornby Island 11 1 12.0 0.0 12.0 0.27%Route 23 Campbell River Quadra Island 36 2 38.0 0.0 38.0 0.61%Route 24 Quadra Island Cortes Island 26 3 2 31.0 0.0 31.0 1.45%Route 25 Port McNeill Alert Bay 4 4.0 0.0 4.0 0.10%Route 26 Skidegate Alliford Bay 2 27 1 30.0 4 4.0 34.0 0.76%
Minor Routes 4 164 1 4 21 0 1 4 26.5 0 0 0 225.5 0 4 4.0 229.5 0.32%TOTAL 7.0 188.0 1.0 4.0 21.0 0.0 1.0 4.0 45.5 0.0 3.0 0.0 274.5 0.0 4.0 4.0 278.5 0.33%
% of Required Round Trips Cancelled 0.01% 0.23% 0.00% 0.00% 0.03% 0.00% 0.00% 0.00% 0.05% 0.00% 0.00% 0.00% 0.33% 0.00% 0.00% 0.00% 0.33%
Note: Route 13 core service levels include some round trips that are deliverable only 'on demand.'
Routes
Cancellations of Round Trips for Other Reasons
Cancellations of Minimum Required Round Trips for Reasons Specified in Schedule A, 2(a) of the Coastal Ferry Services Contract
CANCELLED ROUND TRIPS BY ROUTE AND ROUTE GROUP
Fiscal 2012/13Year Ended March 31, 2013
PERFORMANCE AGAINST MINIMUM (DAILY) CORE SERVICE LEVELS
0.36%
July 31, 2013 2012/13 Annual Report to the British Columbia Ferries Commissioner Page 14

Terminal 1 Terminal 2Route 01 Swartz Bay Tsawwassen 3,829.0
Route 02 Horseshoe Bay Departure Bay 3,052.0
Route 03 Langdale Horseshoe Bay 3,059.0
Route 30 Duke Point Tsawwassen 2,681.0
Major Routes 12,621.0 12,294.0 327.0 44.0 371.0 (3)
Route 10 Port Hardy Prince Rupert 124.0 123.0 1.0 0.0 1.0
Route 11 Skidegate Prince Rupert 183.5 189.5 -6.0 5.0 -1.0 (2)
Route 40 Port Hardy Mid-coast 39.0 39.0 0.0 0.0 0.0
Northern Routes 346.5 351.5 -5.0 5.0 0.0Route 04 Fulford Harbour Swartz Bay 2,881.0 2,880.0 1.0 0.0 1.0
Route 05 Swartz Bay Four SGIs 3,494.0 3,492.0 2.0 4.0 6.0
Route 06 Crofton Vesuvius Bay 5,036.0 5,047.0 -11.0 9.0 -2.0 (2)
Route 07 Earls Cove Saltery Bay 2,871.0 2,877.0 -6.0 4.0 -2.0 (2)
Route 08 Horseshoe Bay Bowen Island 5,575.0 5,570.0 5.0 4.5 9.5
Route 09 Tsawwassen Long Harbour 829.0 830.0 -1.0 1.0 0.0
Route 12 Mill Bay Brentwood Bay 3,210.0 3,216.0 -6.0 4.0 -2.0 (2)
Route 13 Langdale Gambier/Keats 4,117.0 4,062.0 55.0 3.0 58.0
Route 17 Little River Powell River 1,424.0 1,458.0 -34.0 34.0 0.0
Route 18 Texada Powell River 3,649.0 3,648.0 1.0 31.0 32.0
Route 19 Nanaimo Harbour Gabriola Island 5,728.0 5,731.0 -3.0 4.0 1.0
Route 20 Chemainus Thetis Island 4,365.0 4,377.0 -12.0 11.0 -1.0 (2)
Route 21 Buckley Bay Denman West 6,458.0 6,148.0 310.0 1.0 311.0
Route 22 Denman East Hornby Island 4,753.0 4,481.0 272.0 12.0 284.0
Route 23 Campbell River Quadra Island 6,245.0 6,252.0 -7.0 38.0 31.0
Route 24 Quadra Island Cortes Island 2,107.0 2,135.0 -28.0 31.0 3.0
Route 25 Port McNeill Alert Bay 3,956.0 3,960.0 -4.0 4.0 0.0
Route 26 Skidegate Alliford Bay 4,448.0 4,482.0 -34.0 34.0 0.0
Minor Routes 71,146.0 70,646.0 500.0 229.5 729.5TOTAL 84,113.5 83,291.5 822.0 278.5 1,100.5
Variance - Net Extra /
Short Round Trips
Fiscal 2012/13Year Ended March 31, 2013
Routes
Note: (1) In certain circumstances (e.g. vessel or dock breakdown, mechanical failure or maintenance) round trips may be provided by contracted service providers (e.g. water taxi, tug & barge, flights).
327.0 44.0 371.0
(3) For the Major Routes, the annual number of round trips required under the Contract is an aggregate total for the four routes (Routes 1, 2, 3 and 30).
(2) Core Service Levels do not apply on Christmas Day for Designated Ferry Routes 6, 7, 11, 12 and 20.
CANCELLED & EXTRA ROUND TRIPS BY ROUTE AND ROUTE GROUPPerformance Against CFSC Requirement
Annual Core Service LevelsYear Ended March 31, 2013
Actual Round Trips
(1)
Round Trips Required(2)
Required Round Trips
Cancelled
Total Extra / Short Round
Trips
12,294.0
July 31, 2013 2012/13 Annual Report to the British Columbia Ferries Commissioner Page 15
Cumulative Days When Round Trips Missed
Allowed 30 Days / Route
Highest Consecutive Days when Round Trips MissedAllowed 20 Days / Route
Route 01 Swartz Bay Tsawwassen 12 3
Route 02 Horseshoe Bay Departure Bay 5 1
Route 03 Langdale Horseshoe Bay 1 1
Route 30 Duke Point Tsawwassen 7 2
Route 10 Port Hardy Prince Rupert 0 0
Route 11 Skidegate Prince Rupert 8 2
Route 40 Port Hardy Mid-coast 0 0
Route 04 Fulford Harbour Swartz Bay 0 0
Route 05 Swartz Bay Four SGIs 4 1
Route 06 Crofton Vesuvius Bay 7 1
Route 07 Earls Cove Saltery Bay 4 1
Route 08 Horseshoe Bay Bowen Island 5 1
Route 09 Tsawwassen Long Harbour 1 1
Route 12* Mill Bay Brentwood Bay 3 1
Route 13 Langdale Gambier/Keats 1 1
Route 17 Little River Powell River 21 3
Route 18 Texada Powell River 13 2
Route 19 Nanaimo Harbour Gabriola Island 4 1
Route 20 Chemainus Thetis Island 8 3
Route 21 Buckley Bay Denman West 1 1
Route 22 Denman East Hornby Island 5 2
Route 23 Campbell River Quadra Island 10 2
Route 24 Quadra Island Cortes Island 14 2
Route 25 Port McNeill Alert Bay 1 1
Route 26* Skidegate Alliford Bay 12 1
*Note: The Coastal Ferry Services Contract includes an allowance for a temporary service disruption on Routes 12 and 26 of up to 65 consecutive days once every four years for the purpose of carrying out quadrennial surveys and refits
Northern Routes
Minor Routes
Fiscal 2012/13Year Ended March 31, 2013
Routes
CANCELLED ROUND TRIPS BY ROUTES (by Days)(For Cancellations of Minimum Required Round Trips for Reasons Specified in Schedule A. 2(a) of the Coastal Ferry Services Contract)
Performance Against CFSC Requirement
Annual Core Service Levels
Major Routes
July 31, 2013 2012/13 Annual Report to the British Columbia Ferries Commissioner Page 16

Round Trip Service Delivery and On Time PerformanceFiscal 2012/13
Year Ended March 31, 2013Major Routes
Routes Major Route Description Actual Round Trips
Round Trips Required
Net Extra RT (Short RT)
% Sailings Overloaded
Route 01 Swartz Bay-Tsawwassen 3,829.0 36.9%Route 02 Horseshoe Bay-Nanaimo 3,052.0 26.6%Route 03 Langdale-Horseshoe Bay 3,059.0 13.8%Route 30 Nanaimo-Tsawwassen 2,681.0 14.3%MAJOR Routes Total* 12,621.0 12,294.0 327.0 24.0%
12,294.0 327.0
*Note: For the Major Routes, the annual number of round trips required under the Contract is an aggregate total for the four routes (Routes 1, 2, 3 and 30).
On Time Performance% That Sailed Within 10 Mins of Scheduled Departure
20.0%
30.0%
40.0%
50.0%
60.0%
70.0%
80.0%
90.0%
100.0%
01 02 03 30Route
% o
f Sai
lings
With
in10
Min
s of
Sch
edul
ed D
epar
ture
YE 10/11
YE 11/12
YE 12/13
On Time Performance2012/13 YE
0-9 mins84.5%
60 mins or >0.4%
10-19 mins10.7%
20-29 mins2.7%
30-59 mins1.6%
Reasons for Delays
Non-Controllable
Delays40%
Controllable Delays
9%
Accumulated Delays51%
Round Trips (RTs)
0.0%
10.0%
20.0%
30.0%
40.0%
50.0%
60.0%
70.0%
80.0%
90.0%
100.0%
110.0%
120.0%
Route 01 Route 02 Route 03 Route 30 MJR Rt Grp
% o
f Rou
nd T
rips
in th
e Fi
scal
Yea
r
Actual RTs
Cancellation of Minimum Required RTs for Reasons Specified in Sch. A 2(a) of CFSC
Cancellation of Minimum Required RTs for Other Reasons
100% = # of RTs Required by CFSC
Controllable = Under the control of the company (loading procedure, fuelling, etc.)Non-Controllable = Out of the control of the company (bad weather, medical, etc.)Accumulated = Delays accumulated over the course of the day as a result of an earlier delay
July 31, 2013 2012/13 Annual Report to the British Columbia Ferries Commissioner Page 17

Round Trip Service Delivery and On Time PerformanceFiscal 2012/13
Year Ended March 31, 2013Northern Routes
Routes Northern Routes Description Actual Round Trips
Round Trips Required
Net Extra RT (Short RT)
% Sailings Overloaded
Route 10 Port Hardy-Prince Rupert 124.0 123.0 1.0 0.3%Route 11* Skidegate-Prince Rupert 183.5 189.5 -6.0 0.0%Route 40 Port Hardy-Mid-coast 39.0 39.0 0.0 0.0%NORTHERN Routes Total 346.5 351.5 -5.0 0.2%
On Time Performance% That Sailed Within 10 Mins of Scheduled Arrival
20.0%
30.0%
40.0%
50.0%
60.0%
70.0%
80.0%
90.0%
100.0%
10 11 40Route
% o
f Sai
lings
With
in 1
0 M
ins
of
Sche
dule
d A
rriv
al
YE 10/11
YE 11/12
YE 12/13
On Time Performance2012/13 YE
60 mins or >
1.6%
0-9 mins91.9%
10-19 mins2.6%
20-29 mins1.8%
30-59 mins2.2%
Reasons for Delays Accumulated Delays28%
Controllable Delays25%
Non-Controllable
Delays47%
Round Trips (RTs)
0.0%
10.0%
20.0%
30.0%
40.0%
50.0%
60.0%
70.0%
80.0%
90.0%
100.0%
110.0%
Route 10 Route 11 Route 40
% o
f Rou
nd T
rips
in th
e Fi
scal
Yea
r
100% = # of RTs Required by CFSC
Actual RTs
Cancellation of Minimum Required RTs for Reasons Specified in Sch. A 2(a) of CFSC
Cancellation of Minimum Required RTs for Other Reasons
Controllable = Under the control of the company (loading procedure, fuelling, etc.)Non-Controllable = Out of the control of the company (bad weather, medical, etc.)Accumulated = Delays accumulated over the course of the day as a result of an earlier delay
July 31, 2013 2012/13 Annual Report to the British Columbia Ferries Commissioner Page 18

Round Trip Service Delivery and On Time PerformanceFiscal 2012/13
Year Ended March 31, 2013
Minor RoutesROUTE GROUP: Minor Routes
Routes Minor Routes Description Actual Round Trips
Round Trips Required
Net Extra RT (Short RT)
% Sailings Overloaded
Route 04 Swartz Bay-Fulford Harbour 2,881.0 2,880.0 1.0 5.4%Route 05 Swartz Bay-Gulf Islands 3,494.0 3,492.0 2.0 2.9%Route 06 Crofton-Vesuvius Bay 5,036.0 5,047.0 -11.0 2.2%Route 07 Earls Cove-Saltery Bay 2,871.0 2,877.0 -6.0 0.7%Route 08 Horseshoe Bay-Bowen Island 5,575.0 5,570.0 5.0 10.2%Route 09 Tsawwassen-Southern Gulf Islands 829.0 830.0 -1.0 3.1%Route 12 Mill Bay-Brentwood Bay 3,210.0 3,216.0 -6.0 5.8%Route 13 Langdale-Keats/Gambier 4,117.0 4,062.0 55.0 Pass onlyRoute 17 Little River-Powell River 1,424.0 1,458.0 -34.0 0.6%Route 18 Powell River-Texada 3,649.0 3,648.0 1.0 0.5%Route 19 Nanaimo Harbour-Gabriola Island 5,728.0 5,731.0 -3.0 5.2%Route 20 Chemainus-Thetis/Penelakut 4,365.0 4,377.0 -12.0 1.0%Route 21 Buckley Bay-Denman West 6,458.0 6,148.0 310.0 7.9%Route 22 Gravelly Bay-Hornby Island 4,753.0 4,481.0 272.0 11.8%Route 23 Campbell River-Quadra Island 6,245.0 6,252.0 -7.0 6.9%Route 24 Quadra Island-Cortes Island 2,107.0 2,135.0 -28.0 4.0%Route 25 Port McNeill-Sointula/Alert Bay 3,956.0 3,960.0 -4.0 2.9%Route 26 Skidegate-Alliford Bay 4,448.0 4,482.0 -34.0 1.1%MINOR Routes Total 71,146.0 70,646.0 500.0 4.7%
*Note: Route 13 core service levels include some round trips that are deliverable only 'on demand.'
On Time Performance% That Sailed Within 10 Mins of Scheduled Departure
20.0%
30.0%
40.0%
50.0%
60.0%
70.0%
80.0%
90.0%
100.0%
04 05 06 07 08 09 12 13 17 18 19 20 21 22 23 24 25 26
Route
% o
f Sai
lings
With
in 1
0 M
ins
of
Sche
dule
d D
epar
ture
YE 10/11
YE 11/12
YE 12/13
On Time Performance2012/13 YE
30-59 mins0.5%
20-29 mins1.1%
10-19 mins4.8%
0-9 mins93.6%
60 mins or >
0.0%
Reasons for DelaysNon-Controllable
Delays7%
Controllable Delays
9%
Accumulated Delays84%
Controllable = Under the control of the company (loading procedure, fuelling, etc.)Non-Controllable = Out of the control of the company (bad weather, medical, etc.)Accumulated = Delays accumulated over the course of the day as a result of an earlier delay
Round Trips (RTs)
0.0%10.0%20.0%30.0%40.0%50.0%60.0%70.0%80.0%90.0%
100.0%110.0%
Rou
te 0
4
Rou
te 0
5
Rou
te 0
6
Rou
te 0
7
Rou
te 0
8
Rou
te 0
9
Rou
te 1
2
Rou
te 1
3
Rou
te 1
7
Rou
te 1
8
Rou
te 1
9
Rou
te 2
0
Rou
te 2
1
Rou
te 2
2
Rou
te 2
3
Rou
te 2
4
Rou
te 2
5
Rou
te 2
6% o
f Rou
nd T
rips
in th
e Fi
scal
Yea
r
100% = # of RTs Required by CFSC
Actual RTs
Cancellation of Minimum Required RTs for Reasons Specified in Sch. A 2(a) of CFSC
Cancellation of Minimum Required RTs for Other Reasons
July 31, 2013 2012/13 Annual Report to the British Columbia Ferries Commissioner Page 19

Route Financial Report
Year Ended March 31, 2013

July 31, 2013 2012/13 Annual Report to the British Columbia Ferries Commissioner Page 21
Explanation Regarding the Route Financial Report: Changeover to International Financial Reporting Standards (“IFRS”)
Commencing 2012/13, all of BC Ferries’ financial reporting is prepared in accordance with IFRS. Accordingly, the following Route Statements reflect this changeover to IFRS.
The change to IFRS from previous Canadian generally accepted accounting principles (“previous GAAP”) has had a significant impact on certain items reflected in our financial statements. To achieve comparability between the 2012/13 and 2011/12 figures, the 2011/12 results have been restated to reflect IFRS. A reconciliation between the 2011/12 Route Statements previously reported (prepared using previous GAAP), and those reflecting IFRS is included as Appendix A to the Route Financial Report.
The following describes the significant differences between IFRS and previous GAAP reflected in the accompanying Route Statements:
Under IFRS, the costs of regular, periodic major overhauls and inspections of the Company’s vessels are included in property, plant & equipment on the statement of financial position and amortized (reflected in amortization expense on our Route Statements) over the period to the next major overhaul and inspection of the vessel. Under previous GAAP, these overhaul and inspection costs were expensed as incurred and reflected in current period operating expenses.
As a rate-regulated entity and following previous GAAP, BC Ferries capitalized some costs such as feasibility, research and training that directly related to a specific asset and these costs were amortized over the expected service life of these assets. Under IFRS these costs are expensed as incurred and reflected in current period operating expenses.
As permitted under IFRS, cumulative actuarial losses on certain of the Company’s defined benefit employee benefit plans were recognized through opening retained earnings at transition (April 1, 2011). Under previous GAAP these actuarial losses were amortized to expense over the expected remaining service life of the Company’s employees. The result of this difference is lower operating expenses under IFRS than under previous GAAP.
IFRS does not permit, as previous GAAP did, the recognition (on the statement of financial position) of regulatory assets and liabilities. As a result, BC Ferries’ operating results under IFRS includes items included in its deferred accounts such as the following:
o fuel surcharges levied and fuel rebates given are included in tariff revenue;
o realized fuel hedge gains or losses, if any;
o fuel expense reflects our total delivered cost of marine diesel fuel

July 31, 2013 2012/13 Annual Report to the British Columbia Ferries Commissioner Page 22
(including all differences between actual fuel prices and those set by the Commissioner);
o interest on deferred fuel cost accounts;
o payments from (or to) the Province made to or from the Company’s deferred fuel cost accounts; and
o tariffs collected in excess of price caps.
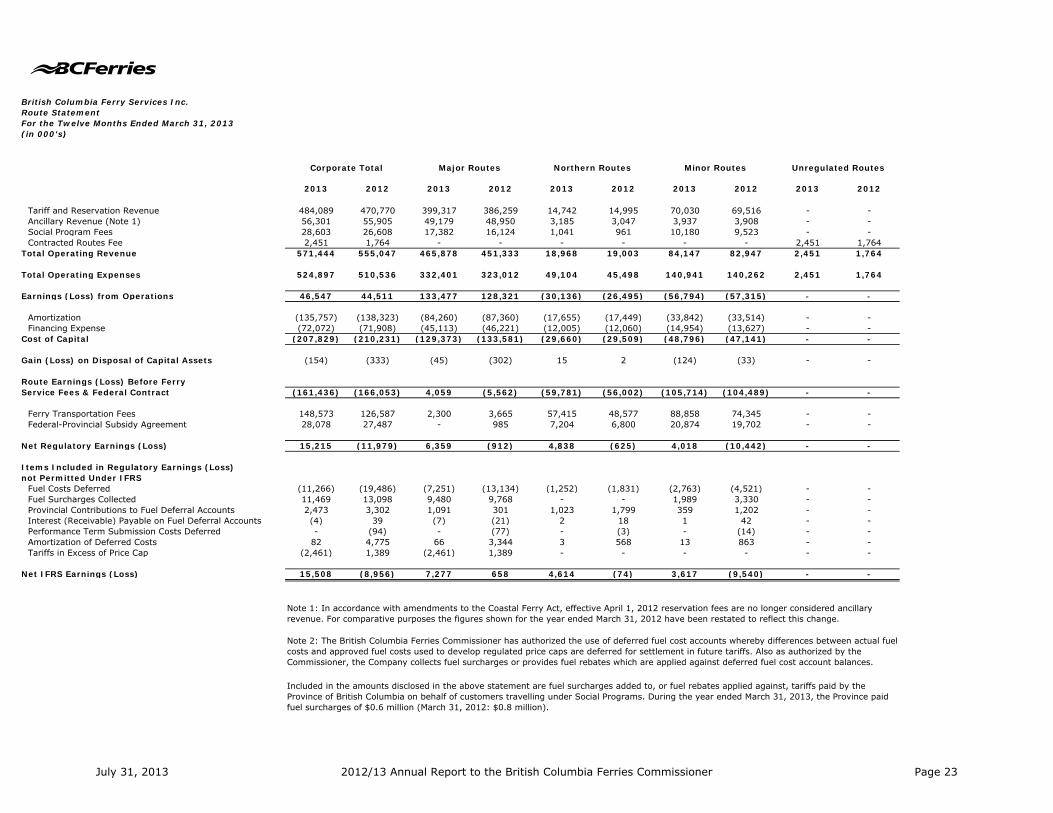
British Columbia Ferry Services Inc.Route StatementFor the Twelve Months Ended March 31, 2013(in 000's)
2013 2012 2013 2012 2013 2012 2013 2012 2013 2012
Tariff and Reservation Revenue 484,089 470,770 399,317 386,259 14,742 14,995 70,030 69,516 - -Ancillary Revenue (Note 1) 56,301 55,905 49,179 48,950 3,185 3,047 3,937 3,908 - -Social Program Fees 28,603 26,608 17,382 16,124 1,041 961 10,180 9,523 - -Contracted Routes Fee 2,451 1,764 - - - - - - 2,451 1,764
Total Operating Revenue 571,444 555,047 465,878 451,333 18,968 19,003 84,147 82,947 2,451 1,764
Total Operating Expenses 524,897 510,536 332,401 323,012 49,104 45,498 140,941 140,262 2,451 1,764
Earnings (Loss) from Operations 46,547 44,511 133,477 128,321 (30,136) (26,495) (56,794) (57,315) - -
Amortization (135,757) (138,323) (84,260) (87,360) (17,655) (17,449) (33,842) (33,514) - -Financing Expense (72,072) (71,908) (45,113) (46,221) (12,005) (12,060) (14,954) (13,627) - -
Cost of Capital (207,829) (210,231) (129,373) (133,581) (29,660) (29,509) (48,796) (47,141) - -
Gain (Loss) on Disposal of Capital Assets (154) (333) (45) (302) 15 2 (124) (33) - -
Route Earnings (Loss) Before Ferry Service Fees & Federal Contract (161,436) (166,053) 4,059 (5,562) (59,781) (56,002) (105,714) (104,489) - -
Ferry Transportation Fees 148,573 126,587 2,300 3,665 57,415 48,577 88,858 74,345 - -Federal-Provincial Subsidy Agreement 28,078 27,487 - 985 7,204 6,800 20,874 19,702 - -
Net Regulatory Earnings (Loss) 15,215 (11,979) 6,359 (912) 4,838 (625) 4,018 (10,442) - -
Items Included in Regulatory Earnings (Loss)not Permitted Under IFRS
Fuel Costs Deferred (11,266) (19,486) (7,251) (13,134) (1,252) (1,831) (2,763) (4,521) - -Fuel Surcharges Collected 11,469 13,098 9,480 9,768 - - 1,989 3,330 - -Provincial Contributions to Fuel Deferral Accounts 2,473 3,302 1,091 301 1,023 1,799 359 1,202 - -Interest (Receivable) Payable on Fuel Deferral Accounts (4) 39 (7) (21) 2 18 1 42 - -Performance Term Submission Costs Deferred - (94) - (77) - (3) - (14) - -Amortization of Deferred Costs 82 4,775 66 3,344 3 568 13 863 - -Tariffs in Excess of Price Cap (2,461) 1,389 (2,461) 1,389 - - - - - -
Net IFRS Earnings (Loss) 15,508 (8,956) 7,277 658 4,614 (74) 3,617 (9,540) - -
Corporate Total
Note 2: The British Columbia Ferries Commissioner has authorized the use of deferred fuel cost accounts whereby differences between actual fuel costs and approved fuel costs used to develop regulated price caps are deferred for settlement in future tariffs. Also as authorized by the Commissioner, the Company collects fuel surcharges or provides fuel rebates which are applied against deferred fuel cost account balances.
Included in the amounts disclosed in the above statement are fuel surcharges added to, or fuel rebates applied against, tariffs paid by the Province of British Columbia on behalf of customers travelling under Social Programs. During the year ended March 31, 2013, the Province paid fuel surcharges of $0.6 million (March 31, 2012: $0.8 million).
Major Routes Minor Routes Unregulated RoutesNorthern Routes
Note 1: In accordance with amendments to the Coastal Ferry Act, effective April 1, 2012 reservation fees are no longer considered ancillary revenue. For comparative purposes the figures shown for the year ended March 31, 2012 have been restated to reflect this change.
July 31, 2013 2012/13 Annual Report to the British Columbia Ferries Commissioner Page 23

British Columbia Ferry Services Inc.Route Statement Major RoutesFor the Twelve Months Ended March 31, 2013(in 000's)
2013 2012 2013 2012 2013 2012 2013 2012 2013 2012
Tariff and Reservation Revenue 183,116 177,095 108,155 104,617 38,432 37,867 69,614 66,680 399,317 386,259Ancillary Revenue (Note 1) 24,335 24,465 12,960 12,838 4,928 4,874 6,956 6,773 49,179 48,950Social Program Fees 5,926 5,482 5,599 5,164 3,552 3,336 2,305 2,142 17,382 16,124Contracted Routes Fee - - - - - - - - - -
Total Operating Revenue 213,377 207,042 126,714 122,619 46,912 46,077 78,875 75,595 465,878 451,333
Total Operating Expenses 137,006 133,376 84,739 81,274 38,086 37,541 72,570 70,821 332,401 323,012
Earnings (Loss) from Operations 76,371 73,666 41,975 41,345 8,826 8,536 6,305 4,774 133,477 128,321
Amortization (34,626) (35,655) (20,668) (20,870) (9,592) (9,225) (19,374) (21,610) (84,260) (87,360)Financing Expense (19,852) (19,915) (9,567) (9,957) (3,726) (3,841) (11,968) (12,508) (45,113) (46,221)
Cost of Capital (54,478) (55,570) (30,235) (30,827) (13,318) (13,066) (31,342) (34,118) (129,373) (133,581)
Gain (Loss) on Disposal of Capital Assets (23) (140) (15) (82) (1) (32) (6) (48) (45) (302)
Route Earnings (Loss) Before Ferry Service Fees & Federal Contract 21,870 17,956 11,725 10,436 (4,493) (4,562) (25,043) (29,392) 4,059 (5,562)
Ferry Transportation Fees - - - - 2,300 3,665 - - 2,300 3,665Federal-Provincial Subsidy Agreement - - - - - 985 - - - 985
Net Regulatory Earnings (Loss) 21,870 17,956 11,725 10,436 (2,193) 88 (25,043) (29,392) 6,359 (912)
Items Included in Regulatory Earnings (Loss)not Permitted Under IFRS
Fuel Costs Deferred (2,769) (5,035) (1,918) (3,375) (695) (1,099) (1,869) (3,625) (7,251) (13,134)Fuel Surcharges Collected 4,480 4,847 2,668 2,855 655 242 1,677 1,824 9,480 9,768Provincial Contributions to Fuel Deferral Accounts 420 - 285 - 101 301 285 - 1,091 301Interest (Receivable) Payable on Fuel Deferral Accounts (6) (4) (2) (10) - 29 1 (36) (7) (21)Performance Term Submission Costs Deferred - (35) - (21) - (8) - (13) - (77)Amortization of Deferred Costs 30 1,696 18 1,015 7 (12) 11 645 66 3,344Tariffs in Excess of Price Cap (1,251) 710 (735) 413 - - (475) 266 (2,461) 1,389
Net IFRS Earnings (Loss) 22,774 20,135 12,041 11,313 (2,125) (459) (25,413) (30,331) 7,277 658
Included in the amounts disclosed in the above statement are fuel surcharges added to, or fuel rebates applied against, tariffs paid by the Province of British Columbia on behalf of customers travelling under Social Programs. During the year ended March 31, 2013, the Province paid fuel surcharges of $0.6 million (March 31, 2012: $0.8 million).
03-Horseshoe Bay - Langdale
Note 1: In accordance with amendments to the Coastal Ferry Act, effective April 1, 2012 reservation fees are no longer considered ancillary revenue. For comparative purposes the figures shown for the year ended March 31, 2012 have been restated to reflect this change.
Note 2: The British Columbia Ferries Commissioner has authorized the use of deferred fuel cost accounts whereby differences between actual fuel costs and approved fuel costs used to develop regulated price caps are deferred for settlement in future tariffs. Also as authorized by the Commissioner, the Company collects fuel surcharges or provides fuel rebates which are applied against deferred fuel cost account balances.
01-Tsawwassen - Swartz Bay 02-Horseshoe Bay - Nanaimo 30-Nanaimo - Tsawwassen Major Routes
July 31, 2013 2012/13 Annual Report to the British Columbia Ferries Commissioner Page 24

British Columbia Ferry Services Inc.Route StatementNorthern RoutesFor the Twelve Months Ended March 31, 2013(in 000's)
2013 2012 2013 2012 2013 2012 2013 2012
Tariff and Reservation Revenue 8,997 9,434 4,220 4,131 1,525 1,430 14,742 14,995Ancillary Revenue (Note 1) 2,030 1,998 973 915 182 134 3,185 3,047Social Program Fees 539 548 482 386 20 27 1,041 961Contracted Routes Fee - - - - - - - -
Total Operating Revenue 11,566 11,980 5,675 5,432 1,727 1,591 18,968 19,003
Total Operating Expenses 26,971 24,728 16,163 16,444 5,970 4,326 49,104 45,498
Earnings (Loss) from Operations (15,405) (12,748) (10,488) (11,012) (4,243) (2,735) (30,136) (26,495)
Amortization (9,101) (9,187) (6,096) (7,457) (2,458) (805) (17,655) (17,449)Financing Expense (7,028) (6,988) (4,312) (4,817) (665) (255) (12,005) (12,060)
Cost of Capital (16,129) (16,175) (10,408) (12,274) (3,123) (1,060) (29,660) (29,509)
Gain (Loss) on Disposal of Capital Assets (1) - - - 16 2 15 2
Route Earnings (Loss) Before Ferry Service Fees & Federal Contract (31,535) (28,923) (20,896) (23,286) (7,350) (3,793) (59,781) (56,002)
Ferry Transportation Fees 28,485 25,039 23,588 20,734 5,342 2,804 57,415 48,577Federal-Provincial Subsidy Agreement 1,114 1,051 5,804 5,479 286 270 7,204 6,800
Net Regulatory Earnings (Loss) (1,936) (2,833) 8,496 2,927 (1,722) (719) 4,838 (625)
Items Included in Regulatory Earnings (Loss)not Permitted Under IFRS
Fuel Costs Deferred (926) (1,235) (282) (485) (44) (111) (1,252) (1,831)Fuel Surcharges Collected - - - - - - - -Provincial Contributions to Fuel Deferral Accounts 766 1,202 196 483 61 114 1,023 1,799Interest (Receivable) Payable on Fuel Deferral Accounts 2 12 - 5 - 1 2 18Performance Term Submission Costs Deferred - (2) - (1) - - - (3)Amortization of Deferred Costs 2 356 1 160 - 52 3 568Tariffs in Excess of Price Cap - - - - - - - -
Net IFRS Earnings (Loss) (2,092) (2,500) 8,411 3,089 (1,705) (663) 4,614 (74)
Note 1: In accordance with amendments to the Coastal Ferry Act, effective April 1, 2012 reservation fees are no longer considered ancillary revenue. For comparative purposes the figures shown for the year ended March 31, 2012 have been restated to reflect this change.
Northern Routes10-Bear Cove - Bella Bella -
Prince Rupert 11-Prince Rupert - Skidegate 40-Bear Cove - Central Coast
Note 2: The British Columbia Ferries Commissioner has authorized the use of deferred fuel cost accounts whereby differences between actual fuel costs and approved fuel costs used to develop regulated price caps are deferred for settlement in future tariffs. Also as authorized by the Commissioner, the Company collects fuel surcharges or provides fuel rebates which are applied against deferred fuel cost account balances.
Included in the amounts disclosed in the above statement are fuel surcharges added to, or fuel rebates applied against, tariffs paid by the Province of British Columbia on behalf of customers travelling under Social Programs. During the year ended March 31, 2013, the Province paid fuel surcharges of $0.6 million (March 31, 2012: $0.8 million).
July 31, 2013 2012/13 Annual Report to the British Columbia Ferries Commissioner Page 25
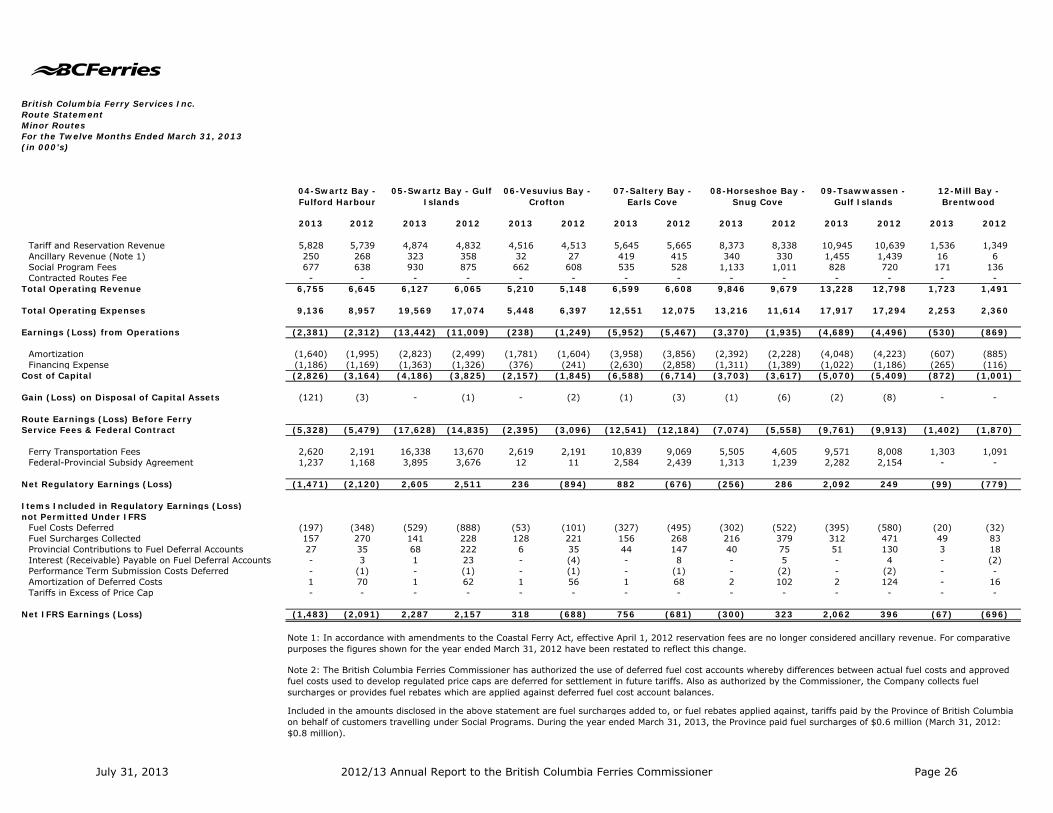
British Columbia Ferry Services Inc.Route Statement Minor RoutesFor the Twelve Months Ended March 31, 2013(in 000's)
2013 2012 2013 2012 2013 2012 2013 2012 2013 2012 2013 2012 2013 2012
Tariff and Reservation Revenue 5,828 5,739 4,874 4,832 4,516 4,513 5,645 5,665 8,373 8,338 10,945 10,639 1,536 1,349Ancillary Revenue (Note 1) 250 268 323 358 32 27 419 415 340 330 1,455 1,439 16 6Social Program Fees 677 638 930 875 662 608 535 528 1,133 1,011 828 720 171 136Contracted Routes Fee - - - - - - - - - - - - - -
Total Operating Revenue 6,755 6,645 6,127 6,065 5,210 5,148 6,599 6,608 9,846 9,679 13,228 12,798 1,723 1,491
Total Operating Expenses 9,136 8,957 19,569 17,074 5,448 6,397 12,551 12,075 13,216 11,614 17,917 17,294 2,253 2,360
Earnings (Loss) from Operations (2,381) (2,312) (13,442) (11,009) (238) (1,249) (5,952) (5,467) (3,370) (1,935) (4,689) (4,496) (530) (869)
Amortization (1,640) (1,995) (2,823) (2,499) (1,781) (1,604) (3,958) (3,856) (2,392) (2,228) (4,048) (4,223) (607) (885)Financing Expense (1,186) (1,169) (1,363) (1,326) (376) (241) (2,630) (2,858) (1,311) (1,389) (1,022) (1,186) (265) (116)
Cost of Capital (2,826) (3,164) (4,186) (3,825) (2,157) (1,845) (6,588) (6,714) (3,703) (3,617) (5,070) (5,409) (872) (1,001)
Gain (Loss) on Disposal of Capital Assets (121) (3) - (1) - (2) (1) (3) (1) (6) (2) (8) - -
Route Earnings (Loss) Before Ferry Service Fees & Federal Contract (5,328) (5,479) (17,628) (14,835) (2,395) (3,096) (12,541) (12,184) (7,074) (5,558) (9,761) (9,913) (1,402) (1,870)
Ferry Transportation Fees 2,620 2,191 16,338 13,670 2,619 2,191 10,839 9,069 5,505 4,605 9,571 8,008 1,303 1,091Federal-Provincial Subsidy Agreement 1,237 1,168 3,895 3,676 12 11 2,584 2,439 1,313 1,239 2,282 2,154 - -
Net Regulatory Earnings (Loss) (1,471) (2,120) 2,605 2,511 236 (894) 882 (676) (256) 286 2,092 249 (99) (779)
Items Included in Regulatory Earnings (Loss)not Permitted Under IFRS
Fuel Costs Deferred (197) (348) (529) (888) (53) (101) (327) (495) (302) (522) (395) (580) (20) (32)Fuel Surcharges Collected 157 270 141 228 128 221 156 268 216 379 312 471 49 83Provincial Contributions to Fuel Deferral Accounts 27 35 68 222 6 35 44 147 40 75 51 130 3 18Interest (Receivable) Payable on Fuel Deferral Accounts - 3 1 23 - (4) - 8 - 5 - 4 - (2)Performance Term Submission Costs Deferred - (1) - (1) - (1) - (1) - (2) - (2) - -Amortization of Deferred Costs 1 70 1 62 1 56 1 68 2 102 2 124 - 16Tariffs in Excess of Price Cap - - - - - - - - - - - - - -
Net IFRS Earnings (Loss) (1,483) (2,091) 2,287 2,157 318 (688) 756 (681) (300) 323 2,062 396 (67) (696)
08-Horseshoe Bay - Snug Cove
09-Tsawwassen - Gulf Islands
12-Mill Bay - Brentwood
04-Swartz Bay - Fulford Harbour
05-Swartz Bay - Gulf Islands
06-Vesuvius Bay - Crofton
07-Saltery Bay - Earls Cove
Note 1: In accordance with amendments to the Coastal Ferry Act, effective April 1, 2012 reservation fees are no longer considered ancillary revenue. For comparative purposes the figures shown for the year ended March 31, 2012 have been restated to reflect this change.
Note 2: The British Columbia Ferries Commissioner has authorized the use of deferred fuel cost accounts whereby differences between actual fuel costs and approved fuel costs used to develop regulated price caps are deferred for settlement in future tariffs. Also as authorized by the Commissioner, the Company collects fuel surcharges or provides fuel rebates which are applied against deferred fuel cost account balances.
Included in the amounts disclosed in the above statement are fuel surcharges added to, or fuel rebates applied against, tariffs paid by the Province of British Columbia on behalf of customers travelling under Social Programs. During the year ended March 31, 2013, the Province paid fuel surcharges of $0.6 million (March 31, 2012: $0.8 million).
July 31, 2013 2012/13 Annual Report to the British Columbia Ferries Commissioner Page 26

British Columbia Ferry Services Inc.Route Statement Minor RoutesFor the Twelve Months Ended March 31, 2013(in 000's)
Tariff and Reservation RevenueAncillary Revenue (Note 1)Social Program FeesContracted Routes Fee
Total Operating Revenue
Total Operating Expenses
Earnings (Loss) from Operations
AmortizationFinancing Expense
Cost of Capital
Gain (Loss) on Disposal of Capital Assets
Route Earnings (Loss) Before Ferry Service Fees & Federal Contract
Ferry Transportation FeesFederal-Provincial Subsidy Agreement
Net Regulatory Earnings (Loss)
Items Included in Regulatory Earnings (Loss)not Permitted Under IFRS
Fuel Costs DeferredFuel Surcharges CollectedProvincial Contributions to Fuel Deferral AccountsInterest (Receivable) Payable on Fuel Deferral AccountsPerformance Term Submission Costs DeferredAmortization of Deferred CostsTariffs in Excess of Price Cap
Net IFRS Earnings (Loss)
2013 2012 2013 2012 2013 2012 2013 2012 2013 2012 2013 2012
171 167 9,276 9,552 1,108 1,052 4,869 4,785 1,173 1,160 2,798 2,83919 19 765 789 19 14 63 52 25 23 42 3675 72 1,567 1,571 337 321 916 835 359 342 522 452- - - - - - - - - - - -
265 258 11,608 11,912 1,464 1,387 5,848 5,672 1,557 1,525 3,362 3,327
578 562 15,206 18,408 5,106 6,002 6,992 7,298 4,150 4,222 5,230 4,992
(313) (304) (3,598) (6,496) (3,642) (4,615) (1,144) (1,626) (2,593) (2,697) (1,868) (1,665)
(7) (10) (3,638) (2,868) (936) (1,011) (2,565) (3,120) (1,001) (1,077) (1,852) (1,921)0 (20) (788) (680) (300) (282) (656) (658) (582) (652) (895) (908)
(7) (30) (4,426) (3,548) (1,236) (1,293) (3,221) (3,778) (1,583) (1,729) (2,747) (2,829)
- - (1) (5) - - - (3) - 1 - (1)
(320) (334) (8,025) (10,049) (4,878) (5,908) (4,365) (5,407) (4,176) (4,425) (4,615) (4,495)
297 249 7,504 6,278 4,186 3,503 2,775 2,322 4,120 3,446 3,957 3,31171 67 1,789 1,688 998 942 662 625 982 927 943 890
48 (18) 1,268 (2,083) 306 (1,463) (928) (2,460) 926 (52) 285 (294)
(23) (27) (336) (563) (72) (110) (100) (181) (56) (94) (35) (60)6 11 270 470 36 60 136 232 38 64 84 144- - 44 102 8 56 14 38 7 56 5 54- - - 3 - 2 - (2) - 1 - (3)- - - (2) - (1) - (1) - - - (1)- 3 2 121 - 15 1 62 - 16 1 36- - - - - - - - - - - -
31 (31) 1,248 (1,952) 278 (1,441) (877) (2,312) 915 (9) 340 (124)
13-Langdale - Gambier Island -
Keats Island17-Comox - Powell
River18-Texada Island -
Powell River19-Gabriola Island -
Nanaimo Harbour
20-Thetis Island - Penelakut Island -
Chemainus21-Denman Island -
Buckley Bay
Note 1: In accordance with amendments to the Coastal Ferry Act, effective April 1, 2012 reservation fees are no longer considered ancillary revenue. For comparative purposes the figures shown for the year ended March 31, 2012 have been restated to reflect this change.
Note 2: The British Columbia Ferries Commissioner has authorized the use of deferred fuel cost accounts whereby differences between actual fuel costs and approved fuel costs used to develop regulated price caps are deferred for settlement in future tariffs. Also as authorized by the Commissioner, the Company collects fuel surcharges or provides fuel rebates which are applied against deferred fuel cost account balances.
Included in the amounts disclosed in the above statement are fuel surcharges added to, or fuel rebates applied against, tariffs paid by the Province of British Columbia on behalf of customers travelling under Social Programs. During the year ended March 31, 2013, the Province paid fuel surcharges of $0.6 million (March 31, 2012: $0.8 million).
July 31, 2013 2012/13 Annual Report to the British Columbia Ferries Commissioner Page 27

British Columbia Ferry Services Inc.Route Statement Minor RoutesFor the Twelve Months Ended March 31, 2013(in 000's)
Tariff and Reservation RevenueAncillary Revenue (Note 1)Social Program FeesContracted Routes Fee
Total Operating Revenue
Total Operating Expenses
Earnings (Loss) from Operations
AmortizationFinancing Expense
Cost of Capital
Gain (Loss) on Disposal of Capital Assets
Route Earnings (Loss) Before Ferry Service Fees & Federal Contract
Ferry Transportation FeesFederal-Provincial Subsidy Agreement
Net Regulatory Earnings (Loss)
Items Included in Regulatory Earnings (Loss)not Permitted Under IFRS
Fuel Costs DeferredFuel Surcharges CollectedProvincial Contributions to Fuel Deferral AccountsInterest (Receivable) Payable on Fuel Deferral AccountsPerformance Term Submission Costs DeferredAmortization of Deferred CostsTariffs in Excess of Price Cap
Net IFRS Earnings (Loss)
2013 2012 2013 2012 2013 2012 2013 2012 2013 2012 2013 2012
1,194 1,195 4,744 4,776 806 788 1,538 1,512 636 615 70,030 69,51640 15 53 48 8 6 42 39 26 24 3,937 3,908108 158 876 819 181 158 246 220 57 59 10,180 9,523- - - - - - - - - - - -
1,342 1,368 5,673 5,643 995 952 1,826 1,771 719 698 84,147 82,947
3,297 2,838 7,774 7,689 3,555 4,115 5,074 4,704 3,889 3,661 140,941 140,262
(1,955) (1,470) (2,101) (2,046) (2,560) (3,163) (3,248) (2,933) (3,170) (2,963) (56,794) (57,315)
(1,172) (724) (2,064) (2,232) (668) (688) (1,716) (1,590) (974) (983) (33,842) (33,514)(998) (423) (863) (898) (155) (140) (894) 57 (670) (738) (14,954) (13,627)
(2,170) (1,147) (2,927) (3,130) (823) (828) (2,610) (1,533) (1,644) (1,721) (48,796) (47,141)
2 - - (3) - - - - - 1 (124) (33)
(4,123) (2,617) (5,028) (5,179) (3,383) (3,991) (5,858) (4,466) (4,814) (4,683) (105,714) (104,489)
3,310 2,769 2,948 2,467 2,608 2,182 4,237 3,545 4,121 3,448 88,858 74,345789 744 703 664 621 587 1,010 954 983 927 20,874 19,702
(24) 896 (1,377) (2,048) (154) (1,222) (611) 33 290 (308) 4,018 (10,442)
(29) (34) (107) (187) (54) (87) (100) (164) (28) (48) (2,763) (4,521)36 58 139 233 24 40 43 70 18 28 1,989 3,3302 45 15 40 8 35 13 58 4 56 359 1,202- (1) - (1) - 2 - 3 - 1 1 42- - - (1) - - - - - - - (14)- 15 1 61 - 10 - 19 - 7 13 863- - - - - - - - - - - -
(15) 979 (1,329) (1,903) (176) (1,222) (655) 19 284 (264) 3,617 (9,540)
Included in the amounts disclosed in the above statement are fuel surcharges added to, or fuel rebates applied against, tariffs paid by the Province of British Columbia on behalf of customers travelling under Social Programs. During the year ended March 31, 2013, the Province paid fuel surcharges of $0.6 million (March 31, 2012: $0.8 million).
Note 1: In accordance with amendments to the Coastal Ferry Act, effective April 1, 2012 reservation fees are no longer considered ancillary revenue. For comparative purposes the figures shown for the year ended March 31, 2012 have been restated to reflect this change.
Note 2: The British Columbia Ferries Commissioner has authorized the use of deferred fuel cost accounts whereby differences between actual fuel costs and approved fuel costs used to develop regulated price caps are deferred for settlement in future tariffs. Also as authorized by the Commissioner, the Company collects fuel surcharges or provides fuel rebates which are applied against deferred fuel cost account balances.
Minor Routes22-Hornby Island -
Denman Island23-Quadra Island -
Campbell River24-Cortes Island -
Quadra Island
25-Alert Bay - Sointula - Port
Mcneill26-Skidegate -
Alliford Bay
July 31, 2013 2012/13 Annual Report to the British Columbia Ferries Commissioner Page 28

Route Financial Report
Year Ended March 31, 2013
Appendix A

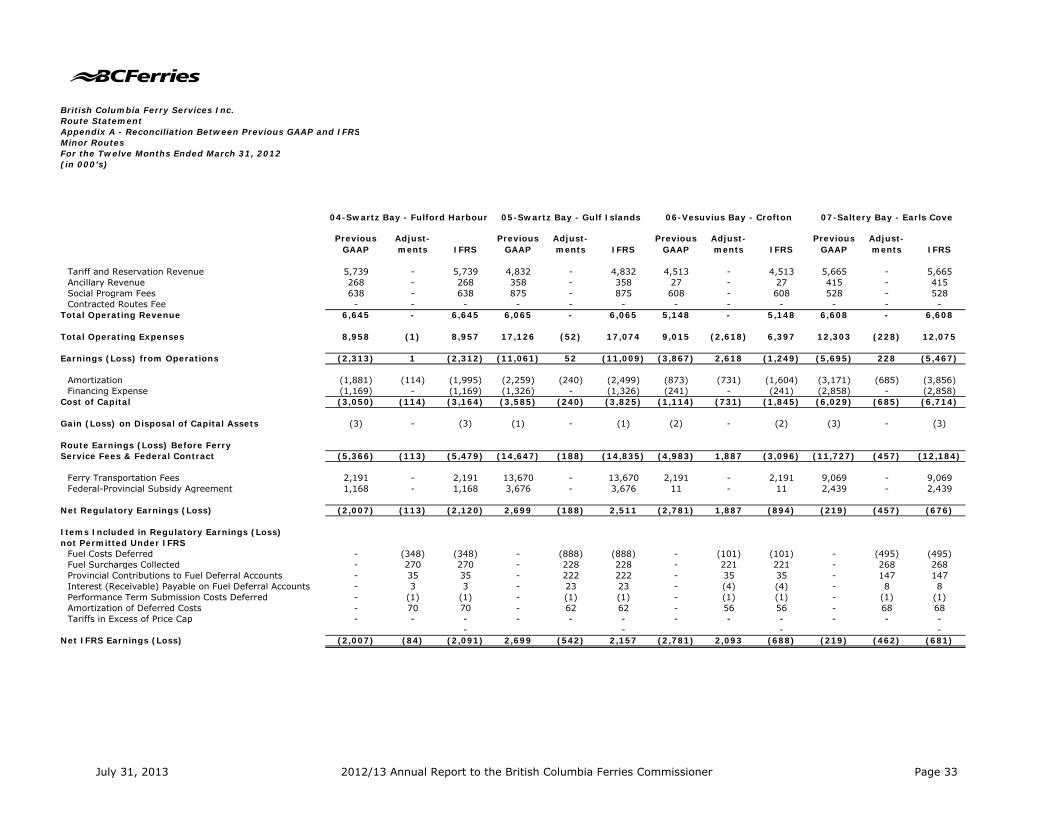
British Columbia Ferry Services Inc.Route StatementAppendix A - Reconciliation Between Previous GAAP and IFRSFor the Twelve Months Ended March 31, 2012(in 000's)
Previous GAAP
Adjust-ments IFRS
Previous GAAP
Adjust-ments IFRS
Previous GAAP
Adjust-ments IFRS
Previous GAAP
Adjust-ments IFRS
Previous GAAP
Adjust-ments IFRS
Tariff and Reservation Revenue 470,770 - 470,770 386,259 - 386,259 14,995 - 14,995 69,516 - 69,516 - - -Ancillary Revenue 55,905 - 55,905 48,950 - 48,950 3,047 - 3,047 3,908 - 3,908 - - -Social Program Fees 26,608 - 26,608 16,124 - 16,124 961 - 961 9,523 - 9,523 - - -Contracted Routes Fee 1,764 - 1,764 - - - - - - - - - 1,764 - 1,764
Total Operating Revenue 555,047 - 555,047 451,333 - 451,333 19,003 - 19,003 82,947 - 82,947 1,764 - 1,764
Total Operating Expenses 530,389 (19,853) 510,536 331,767 (8,755) 323,012 47,438 (1,940) 45,498 149,420 (9,158) 140,262 1,764 - 1,764
Earnings (Loss) from Operations 24,658 19,853 44,511 119,566 8,755 128,321 (28,435) 1,940 (26,495) (66,473) 9,158 (57,315) - - -
Amortization (122,973) (15,350) (138,323) (79,364) (7,996) (87,360) (16,108) (1,341) (17,449) (27,501) (6,013) (33,514) - - -Financing Expense (71,902) (6) (71,908) (46,216) (5) (46,221) (12,059) (1) (12,060) (13,627) - (13,627) - - -
Cost of Capital (194,875) (15,356) (210,231) (125,580) (8,001) (133,581) (28,167) (1,342) (29,509) (41,128) (6,013) (47,141) - - -
Gain (Loss) on Disposal of Capital Assets (331) (2) (333) (302) - (302) 4 (2) 2 (33) - (33) - - -
Route Earnings (Loss) Before Ferry Service Fees & Federal Contract (170,548) 4,495 (166,053) (6,316) 754 (5,562) (56,598) 596 (56,002) (107,634) 3,145 (104,489) - - -
Ferry Transportation Fees 126,587 - 126,587 3,665 - 3,665 48,577 - 48,577 74,345 - 74,345 - - -Federal-Provincial Subsidy Agreement 27,487 - 27,487 985 - 985 6,800 - 6,800 19,702 - 19,702 - - -
Net Regulatory Earnings (Loss) (16,474) 4,495 (11,979) (1,666) 754 (912) (1,221) 596 (625) (13,587) 3,145 (10,442) - - -
Items Included in Regulatory Earnings (Loss)not Permitted Under IFRS
Fuel Costs Deferred - (19,486) (19,486) - (13,134) (13,134) - (1,831) (1,831) - (4,521) (4,521) - - -Fuel Surcharges Collected - 13,098 13,098 - 9,768 9,768 - - - - 3,330 3,330 - - -Provincial Contributions to Fuel Deferral Accounts - 3,302 3,302 - 301 301 - 1,799 1,799 - 1,202 1,202 - - -Interest (Receivable) Payable on Fuel Deferral Accounts - 39 39 - (21) (21) - 18 18 - 42 42 - - -Performance Term Submission Costs Deferred - (94) (94) - (77) (77) - (3) (3) - (14) (14) - - -Amortization of Deferred Costs - 4,775 4,775 - 3,344 3,344 - 568 568 - 863 863 - - -Tariffs in Excess of Price Cap - 1,389 1,389 - 1,389 1,389 - - - - - - - - -
- - - -Net IFRS Earnings (Loss) (16,474) 7,518 (8,956) (1,666) 2,324 658 (1,221) 1,147 (74) (13,587) 4,047 (9,540) - - -
Corporate Total Major Routes Northern Routes Minor Routes Unregulated Routes
July 31, 2013 2012/13 Annual Report to the British Columbia Ferries Commissioner Page 30

British Columbia Ferry Services Inc.Route Statement Appendix A - Reconciliation Between Previous GAAP and IFRSMajor RoutesFor the Twelve Months Ended March 31, 2012(in 000's)
Previous GAAP
Adjust-ments IFRS
Previous GAAP
Adjust-ments IFRS Previous GAAP
Adjust-ments IFRS
Previous GAAP
Adjust-ments IFRS
Previous GAAP
Adjust-ments IFRS
Tariff and Reservation Revenue 177,095 - 177,095 104,617 - 104,617 37,867 - 37,867 66,680 - 66,680 386,259 - 386,259Ancillary Revenue 24,465 - 24,465 12,838 - 12,838 4,874 - 4,874 6,773 - 6,773 48,950 - 48,950Social Program Fees 5,482 - 5,482 5,164 - 5,164 3,336 - 3,336 2,142 - 2,142 16,124 - 16,124Contracted Routes Fee - - - - - - - - - - - - - - -
Total Operating Revenue 207,042 - 207,042 122,619 - 122,619 46,077 - 46,077 75,595 - 75,595 451,333 - 451,333
Total Operating Expenses 135,270 (1,894) 133,376 82,799 (1,525) 81,274 40,691 (3,150) 37,541 73,007 (2,186) 70,821 331,767 (8,755) 323,012
Earnings (Loss) from Operations 71,772 1,894 73,666 39,820 1,525 41,345 5,386 3,150 8,536 2,588 2,186 4,774 119,566 8,755 128,321
Amortization (33,228) (2,427) (35,655) (18,559) (2,311) (20,870) (7,685) (1,540) (9,225) (19,892) (1,718) (21,610) (79,364) (7,996) (87,360)Financing Expense (19,913) (2) (19,915) (9,956) (1) (9,957) (3,840) (1) (3,841) (12,507) (1) (12,508) (46,216) (5) (46,221)
Cost of Capital (53,141) (2,429) (55,570) (28,515) (2,312) (30,827) (11,525) (1,541) (13,066) (32,399) (1,719) (34,118) (125,580) (8,001) (133,581)
Gain (Loss) on Disposal of Capital Assets (140) - (140) (82) - (82) (32) - (32) (48) - (48) (302) - (302)
Route Earnings (Loss) Before Ferry Service Fees & Federal Contract 18,491 (535) 17,956 11,223 (787) 10,436 (6,171) 1,609 (4,562) (29,859) 467 (29,392) (6,316) 754 (5,562)
Ferry Transportation Fees - - - - - - 3,665 - 3,665 - - - 3,665 - 3,665Federal-Provincial Subsidy Agreement - - - - - - 985 - 985 - - - 985 - 985
Net Regulatory Earnings (Loss) 18,491 (535) 17,956 11,223 (787) 10,436 (1,521) 1,609 88 (29,859) 467 (29,392) (1,666) 754 (912)
Items Included in Regulatory Earnings (Loss)not Permitted Under IFRS
Fuel Costs Deferred - (5,035) (5,035) - (3,375) (3,375) - (1,099) (1,099) - (3,625) (3,625) - (13,134) (13,134)Fuel Surcharges Collected - 4,847 4,847 - 2,855 2,855 - 242 242 - 1,824 1,824 - 9,768 9,768Provincial Contributions to Fuel Deferral Accounts - - - - - - - 301 301 - - - - 301 301Interest (Receivable) Payable on Fuel Deferral Accounts - (4) (4) - (10) (10) - 29 29 - (36) (36) - (21) (21)Performance Term Submission Costs Deferred - (35) (35) - (21) (21) - (8) (8) - (13) (13) - (77) (77)Amortization of Deferred Costs - 1,696 1,696 - 1,015 1,015 - (12) (12) - 645 645 - 3,344 3,344Tariffs in Excess of Price Cap - 710 710 - 413 413 - - - - 266 266 - 1,389 1,389
- - - -Net IFRS Earnings (Loss) 18,491 1,644 20,135 11,223 90 11,313 (1,521) 1,062 (459) (29,859) (472) (30,331) (1,666) 2,324 658
Major Routes01-Tsawwassen - Swartz Bay 02-Horseshoe Bay - Nanaimo 03-Horseshoe Bay - Langdale 30-Nanaimo - Tsawwassen
July 31, 2013 2012/13 Annual Report to the British Columbia Ferries Commissioner Page 31

British Columbia Ferry Services Inc.Route StatementAppendix A - Reconciliation Between Previous GAAP and IFRSNorthern RoutesFor the Twelve Months Ended March 31, 2012(in 000's)
Previous GAAP
Adjust-ments IFRS
Previous GAAP
Adjust-ments IFRS
Previous GAAP
Adjust-ments IFRS
Previous GAAP
Adjust-ments IFRS
Tariff and Reservation Revenue 9,434 - 9,434 4,131 - 4,131 1,430 - 1,430 14,995 - 14,995Ancillary Revenue 1,998 - 1,998 915 - 915 134 - 134 3,047 - 3,047Social Program Fees 548 - 548 386 - 386 27 - 27 961 - 961Contracted Routes Fee - - - - - - - - - - - -
Total Operating Revenue 11,980 - 11,980 5,432 - 5,432 1,591 - 1,591 19,003 - 19,003
Total Operating Expenses 25,221 (493) 24,728 17,892 (1,448) 16,444 4,325 1 4,326 47,438 (1,940) 45,498
Earnings (Loss) from Operations (13,241) 493 (12,748) (12,460) 1,448 (11,012) (2,734) (1) (2,735) (28,435) 1,940 (26,495)
Amortization (8,378) (809) (9,187) (6,928) (529) (7,457) (802) (3) (805) (16,108) (1,341) (17,449)Financing Expense (6,988) - (6,988) (4,816) (1) (4,817) (255) - (255) (12,059) (1) (12,060)
Cost of Capital (15,366) (809) (16,175) (11,744) (530) (12,274) (1,057) (3) (1,060) (28,167) (1,342) (29,509)
Gain (Loss) on Disposal of Capital Assets 1 (1) - 1 (1) - 2 - 2 4 (2) 2
Route Earnings (Loss) Before Ferry Service Fees & Federal Contract (28,606) (317) (28,923) (24,203) 917 (23,286) (3,789) (4) (3,793) (56,598) 596 (56,002)
Ferry Transportation Fees 25,039 - 25,039 20,734 - 20,734 2,804 - 2,804 48,577 - 48,577Federal-Provincial Subsidy Agreement 1,051 - 1,051 5,479 - 5,479 270 - 270 6,800 - 6,800
Net Regulatory Earnings (Loss) (2,516) (317) (2,833) 2,010 917 2,927 (715) (4) (719) (1,221) 596 (625)
Items Included in Regulatory Earnings (Loss)not Permitted Under IFRS
Fuel Costs Deferred - (1,235) (1,235) - (485) (485) - (111) (111) - (1,831) (1,831)Fuel Surcharges Collected - - - - - - - - - - - -Provincial Contributions to Fuel Deferral Accounts - 1,202 1,202 - 483 483 - 114 114 - 1,799 1,799Interest (Receivable) Payable on Fuel Deferral Accounts - 12 12 - 5 5 - 1 1 - 18 18Performance Term Submission Costs Deferred - (2) (2) - (1) (1) - - - - (3) (3)Amortization of Deferred Costs - 356 356 - 160 160 - 52 52 - 568 568Tariffs in Excess of Price Cap - - - - - - - - - - - -
- - -Net IFRS Earnings (Loss) (2,516) 16 (2,500) 2,010 1,079 3,089 (715) 52 (663) (1,221) 1,147 (74)
10-Bear Cove - Bella Bella - Prince Rupert
40-Bear Cove - Central Coast11-Prince Rupert - Skidegate Northern Routes
July 31, 2013 2012/13 Annual Report to the British Columbia Ferries Commissioner Page 32
British Columbia Ferry Services Inc.Route Statement Appendix A - Reconciliation Between Previous GAAP and IFRSMinor RoutesFor the Twelve Months Ended March 31, 2012(in 000's)
Previous GAAP
Adjust-ments IFRS
Previous GAAP
Adjust-ments IFRS
Previous GAAP
Adjust-ments IFRS
Previous GAAP
Adjust-ments IFRS
Tariff and Reservation Revenue 5,739 - 5,739 4,832 - 4,832 4,513 - 4,513 5,665 - 5,665Ancillary Revenue 268 - 268 358 - 358 27 - 27 415 - 415Social Program Fees 638 - 638 875 - 875 608 - 608 528 - 528Contracted Routes Fee - - - - - - - - - - - -
Total Operating Revenue 6,645 - 6,645 6,065 - 6,065 5,148 - 5,148 6,608 - 6,608
Total Operating Expenses 8,958 (1) 8,957 17,126 (52) 17,074 9,015 (2,618) 6,397 12,303 (228) 12,075
Earnings (Loss) from Operations (2,313) 1 (2,312) (11,061) 52 (11,009) (3,867) 2,618 (1,249) (5,695) 228 (5,467)
Amortization (1,881) (114) (1,995) (2,259) (240) (2,499) (873) (731) (1,604) (3,171) (685) (3,856)Financing Expense (1,169) - (1,169) (1,326) - (1,326) (241) - (241) (2,858) - (2,858)
Cost of Capital (3,050) (114) (3,164) (3,585) (240) (3,825) (1,114) (731) (1,845) (6,029) (685) (6,714)
Gain (Loss) on Disposal of Capital Assets (3) - (3) (1) - (1) (2) - (2) (3) - (3)
Route Earnings (Loss) Before Ferry Service Fees & Federal Contract (5,366) (113) (5,479) (14,647) (188) (14,835) (4,983) 1,887 (3,096) (11,727) (457) (12,184)
Ferry Transportation Fees 2,191 - 2,191 13,670 - 13,670 2,191 - 2,191 9,069 - 9,069Federal-Provincial Subsidy Agreement 1,168 - 1,168 3,676 - 3,676 11 - 11 2,439 - 2,439
Net Regulatory Earnings (Loss) (2,007) (113) (2,120) 2,699 (188) 2,511 (2,781) 1,887 (894) (219) (457) (676)
Items Included in Regulatory Earnings (Loss)not Permitted Under IFRS
Fuel Costs Deferred - (348) (348) - (888) (888) - (101) (101) - (495) (495)Fuel Surcharges Collected - 270 270 - 228 228 - 221 221 - 268 268Provincial Contributions to Fuel Deferral Accounts - 35 35 - 222 222 - 35 35 - 147 147Interest (Receivable) Payable on Fuel Deferral Accounts - 3 3 - 23 23 - (4) (4) - 8 8Performance Term Submission Costs Deferred - (1) (1) - (1) (1) - (1) (1) - (1) (1)Amortization of Deferred Costs - 70 70 - 62 62 - 56 56 - 68 68Tariffs in Excess of Price Cap - - - - - - - - - - - -
- - - -Net IFRS Earnings (Loss) (2,007) (84) (2,091) 2,699 (542) 2,157 (2,781) 2,093 (688) (219) (462) (681)
04-Swartz Bay - Fulford Harbour 05-Swartz Bay - Gulf Islands 06-Vesuvius Bay - Crofton 07-Saltery Bay - Earls Cove
July 31, 2013 2012/13 Annual Report to the British Columbia Ferries Commissioner Page 33

British Columbia Ferry Services Inc.Route Statement Appendix A - Reconciliation Between Previous GAAP anMinor RoutesFor the Twelve Months Ended March 31, 2012(in 000's)
Tariff and Reservation RevenueAncillary Revenue Social Program FeesContracted Routes Fee
Total Operating Revenue
Total Operating Expenses
Earnings (Loss) from Operations
AmortizationFinancing Expense
Cost of Capital
Gain (Loss) on Disposal of Capital Assets
Route Earnings (Loss) Before Ferry Service Fees & Federal Contract
Ferry Transportation FeesFederal-Provincial Subsidy Agreement
Net Regulatory Earnings (Loss)
Items Included in Regulatory Earnings (Loss)not Permitted Under IFRS
Fuel Costs DeferredFuel Surcharges CollectedProvincial Contributions to Fuel Deferral AccountsInterest (Receivable) Payable on Fuel Deferral AccountsPerformance Term Submission Costs DeferredAmortization of Deferred CostsTariffs in Excess of Price Cap
Net IFRS Earnings (Loss)
Previous GAAP
Adjust-ments IFRS
Previous GAAP
Adjust-ments IFRS
Previous GAAP
Adjust-ments IFRS
Previous GAAP
Adjust-ments IFRS
8,338 - 8,338 10,639 - 10,639 1,349 - 1,349 167 - 167330 - 330 1,439 - 1,439 6 - 6 19 - 19
1,011 - 1,011 720 - 720 136 - 136 72 - 72- - - - - - - - - - - -
9,679 - 9,679 12,798 - 12,798 1,491 - 1,491 258 - 258
11,604 10 11,614 17,407 (113) 17,294 2,797 (437) 2,360 562 - 562
(1,925) (10) (1,935) (4,609) 113 (4,496) (1,306) 437 (869) (304) - (304)
(2,091) (137) (2,228) (3,889) (334) (4,223) (716) (169) (885) (10) - (10)(1,389) - (1,389) (1,186) - (1,186) (116) - (116) (20) - (20)(3,480) (137) (3,617) (5,075) (334) (5,409) (832) (169) (1,001) (30) - (30)
(6) - (6) (8) - (8) - - - - - -
(5,411) (147) (5,558) (9,692) (221) (9,913) (2,138) 268 (1,870) (334) - (334)
4,605 - 4,605 8,008 - 8,008 1,091 - 1,091 249 - 2491,239 - 1,239 2,154 - 2,154 - - - 67 - 67
433 (147) 286 470 (221) 249 (1,047) 268 (779) (18) - (18)
- (522) (522) - (580) (580) - (32) (32) - (27) (27)- 379 379 - 471 471 - 83 83 - 11 11- 75 75 - 130 130 - 18 18 - - -- 5 5 - 4 4 - (2) (2) - - -- (2) (2) - (2) (2) - - - - - -- 102 102 - 124 124 - 16 16 - 3 3- - - - - - - - - - - -
- - - -433 (110) 323 470 (74) 396 (1,047) 351 (696) (18) (13) (31)
12-Mill Bay - Brentwood13-Langdale - Gambier Island -
Keats Island08-Horseshoe Bay - Snug Cove 09-Tsawwassen - Gulf Islands
July 31, 2013 2012/13 Annual Report to the British Columbia Ferries Commissioner Page 34

British Columbia Ferry Services Inc.Route Statement Appendix A - Reconciliation Between Previous GAAP anMinor RoutesFor the Twelve Months Ended March 31, 2012(in 000's)
Tariff and Reservation RevenueAncillary Revenue Social Program FeesContracted Routes Fee
Total Operating Revenue
Total Operating Expenses
Earnings (Loss) from Operations
AmortizationFinancing Expense
Cost of Capital
Gain (Loss) on Disposal of Capital Assets
Route Earnings (Loss) Before Ferry Service Fees & Federal Contract
Ferry Transportation FeesFederal-Provincial Subsidy Agreement
Net Regulatory Earnings (Loss)
Items Included in Regulatory Earnings (Loss)not Permitted Under IFRS
Fuel Costs DeferredFuel Surcharges CollectedProvincial Contributions to Fuel Deferral AccountsInterest (Receivable) Payable on Fuel Deferral AccountsPerformance Term Submission Costs DeferredAmortization of Deferred CostsTariffs in Excess of Price Cap
Net IFRS Earnings (Loss)
Previous GAAP
Adjust-ments IFRS
Previous GAAP
Adjust-ments IFRS
Previous GAAP
Adjust-ments IFRS
Previous GAAP
Adjust-ments IFRS
9,552 - 9,552 1,052 - 1,052 4,785 - 4,785 1,160 - 1,160789 - 789 14 - 14 52 - 52 23 - 23
1,571 - 1,571 321 - 321 835 - 835 342 - 342- - - - - - - - - - - -
11,912 - 11,912 1,387 - 1,387 5,672 - 5,672 1,525 - 1,525
20,523 (2,115) 18,408 7,539 (1,537) 6,002 7,425 (127) 7,298 4,220 2 4,222
(8,611) 2,115 (6,496) (6,152) 1,537 (4,615) (1,753) 127 (1,626) (2,695) (2) (2,697)
(2,422) (446) (2,868) (611) (400) (1,011) (2,174) (946) (3,120) (830) (247) (1,077)(680) - (680) (282) - (282) (658) - (658) (652) - (652)
(3,102) (446) (3,548) (893) (400) (1,293) (2,832) (946) (3,778) (1,482) (247) (1,729)
(5) - (5) - - - (3) - (3) 1 - 1
(11,718) 1,669 (10,049) (7,045) 1,137 (5,908) (4,588) (819) (5,407) (4,176) (249) (4,425)
6,278 - 6,278 3,503 - 3,503 2,322 - 2,322 3,446 - 3,4461,688 - 1,688 942 - 942 625 - 625 927 - 927
(3,752) 1,669 (2,083) (2,600) 1,137 (1,463) (1,641) (819) (2,460) 197 (249) (52)
- (563) (563) - (110) (110) - (181) (181) - (94) (94)- 470 470 - 60 60 - 232 232 - 64 64- 102 102 - 56 56 - 38 38 - 56 56- 3 3 - 2 2 - (2) (2) - 1 1- (2) (2) - (1) (1) - (1) (1) - - -- 121 121 - 15 15 - 62 62 - 16 16- - - - - - - - - - - -
- - - -(3,752) 1,800 (1,952) (2,600) 1,159 (1,441) (1,641) (671) (2,312) 197 (206) (9)
17-Comox - Powell River18-Texada Island - Powell
River19-Gabriola Island - Nanaimo
Harbour20-Thetis Island - Penelakut
Island - Chemainus
July 31, 2013 2012/13 Annual Report to the British Columbia Ferries Commissioner Page 35

British Columbia Ferry Services Inc.Route Statement Appendix A - Reconciliation Between Previous GAAP anMinor RoutesFor the Twelve Months Ended March 31, 2012(in 000's)
Tariff and Reservation RevenueAncillary Revenue Social Program FeesContracted Routes Fee
Total Operating Revenue
Total Operating Expenses
Earnings (Loss) from Operations
AmortizationFinancing Expense
Cost of Capital
Gain (Loss) on Disposal of Capital Assets
Route Earnings (Loss) Before Ferry Service Fees & Federal Contract
Ferry Transportation FeesFederal-Provincial Subsidy Agreement
Net Regulatory Earnings (Loss)
Items Included in Regulatory Earnings (Loss)not Permitted Under IFRS
Fuel Costs DeferredFuel Surcharges CollectedProvincial Contributions to Fuel Deferral AccountsInterest (Receivable) Payable on Fuel Deferral AccountsPerformance Term Submission Costs DeferredAmortization of Deferred CostsTariffs in Excess of Price Cap
Net IFRS Earnings (Loss)
Previous GAAP
Adjust-ments IFRS
Previous GAAP
Adjust-ments IFRS
Previous GAAP
Adjust-ments IFRS
Previous GAAP
Adjust-ments IFRS
2,839 - 2,839 1,195 - 1,195 4,776 - 4,776 788 - 78836 - 36 15 - 15 48 - 48 6 - 6452 - 452 158 - 158 819 - 819 158 - 158- - - - - - - - - - - -
3,327 - 3,327 1,368 - 1,368 5,643 - 5,643 952 - 952
4,989 3 4,992 2,886 (48) 2,838 8,414 (725) 7,689 5,290 (1,175) 4,115
(1,662) (3) (1,665) (1,518) 48 (1,470) (2,771) 725 (2,046) (4,338) 1,175 (3,163)
(1,608) (313) (1,921) (510) (214) (724) (1,943) (289) (2,232) (366) (322) (688)(908) - (908) (423) - (423) (898) - (898) (140) - (140)
(2,516) (313) (2,829) (933) (214) (1,147) (2,841) (289) (3,130) (506) (322) (828)
(1) - (1) - - - (3) - (3) - - -
(4,179) (316) (4,495) (2,451) (166) (2,617) (5,615) 436 (5,179) (4,844) 853 (3,991)
3,311 - 3,311 2,769 - 2,769 2,467 - 2,467 2,182 - 2,182890 - 890 744 - 744 664 - 664 587 - 587
22 (316) (294) 1,062 (166) 896 (2,484) 436 (2,048) (2,075) 853 (1,222)
- (60) (60) - (34) (34) - (187) (187) - (87) (87)- 144 144 - 58 58 - 233 233 - 40 40- 54 54 - 45 45 - 40 40 - 35 35- (3) (3) - (1) (1) - (1) (1) - 2 2- (1) (1) - - - - (1) (1) - - -- 36 36 - 15 15 - 61 61 - 10 10- - - - - - - - - - - -
- - - -22 (146) (124) 1,062 (83) 979 (2,484) 581 (1,903) (2,075) 853 (1,222)
21-Denman Island - Buckley Bay
22-Hornby Island - Denman Island
23-Quadra Island - Campbell River
24-Cortes Island - Quadra Island
July 31, 2013 2012/13 Annual Report to the British Columbia Ferries Commissioner Page 36

British Columbia Ferry Services Inc.Route Statement Appendix A - Reconciliation Between Previous GAAP anMinor RoutesFor the Twelve Months Ended March 31, 2012(in 000's)
Tariff and Reservation RevenueAncillary Revenue Social Program FeesContracted Routes Fee
Total Operating Revenue
Total Operating Expenses
Earnings (Loss) from Operations
AmortizationFinancing Expense
Cost of Capital
Gain (Loss) on Disposal of Capital Assets
Route Earnings (Loss) Before Ferry Service Fees & Federal Contract
Ferry Transportation FeesFederal-Provincial Subsidy Agreement
Net Regulatory Earnings (Loss)
Items Included in Regulatory Earnings (Loss)not Permitted Under IFRS
Fuel Costs DeferredFuel Surcharges CollectedProvincial Contributions to Fuel Deferral AccountsInterest (Receivable) Payable on Fuel Deferral AccountsPerformance Term Submission Costs DeferredAmortization of Deferred CostsTariffs in Excess of Price Cap
Net IFRS Earnings (Loss)
Previous GAAP
Adjust-ments IFRS
Previous GAAP
Adjust-ments IFRS
Previous GAAP
Adjust-ments IFRS
1,512 - 1,512 615 - 615 69,516 - 69,51639 - 39 24 - 24 3,908 - 3,908220 - 220 59 - 59 9,523 - 9,523- - - - - - - - -
1,771 - 1,771 698 - 698 82,947 - 82,947
4,702 2 4,704 3,660 1 3,661 149,420 (9,158) 140,262
(2,931) (2) (2,933) (2,962) (1) (2,963) (66,473) 9,158 (57,315)
(1,304) (286) (1,590) (843) (140) (983) (27,501) (6,013) (33,514)57 - 57 (738) - (738) (13,627) - (13,627)
(1,247) (286) (1,533) (1,581) (140) (1,721) (41,128) (6,013) (47,141)
- - - 1 - 1 (33) - (33)
(4,178) (288) (4,466) (4,542) (141) (4,683) (107,634) 3,145 (104,489)
3,545 - 3,545 3,448 - 3,448 74,345 - 74,345954 - 954 927 - 927 19,702 - 19,702
321 (288) 33 (167) (141) (308) (13,587) 3,145 (10,442)
- (164) (164) - (48) (48) - (4,521) (4,521)- 70 70 - 28 28 - 3,330 3,330- 58 58 - 56 56 - 1,202 1,202- 3 3 - 1 1 - 42 42- - - - - - - (14) (14)- 19 19 - 7 7 - 863 863- - - - - - - - -
- -321 (302) 19 (167) (97) (264) (13,587) 4,047 (9,540)
Minor Routes26-Skidegate - Alliford Bay25-Alert Bay - Sointula - Port
Mcneill
July 31, 2013 2012/13 Annual Report to the British Columbia Ferries Commissioner Page 37

Part 2
Service Quality

Customer Satisfaction Tracking
Annual Report
2012

402 – 1505 West Second Avenue Vancouver BC V6H 3Y4
[email protected] www.mustelgroup.com Tel 604.733.4213 Fax 604.733.5221
Presented to:
British Columbia Ferry Services Inc. Victoria, British Columbia
Customer Satisfaction Tracking Annual Report 2012 British Columbia Ferry Services Inc.
July 31, 2013 2012/13 Annual Report to the British Columbia Ferries Commissioner Page 40

BC Ferries Customer Satisfaction Tracking
Mustel Group ___________________________________________________________________________________________ Table of Contents
Contents
Executive Overview ............................................................................................ 1
Background ................................................................................................................. 1
Methodology ............................................................................................................... 1
Findings ....................................................................................................................... 2
Key Conclusions ........................................................................................................... 4
Detailed Findings ............................................................................................... 5
Overall Satisfaction with BC Ferries ............................................................................. 6
Before Arriving at Terminal .......................................................................................... 9 Web site and Phone Contact .......................................................................................... 9 Highway Signage ........................................................................................................... 10
At the Terminal .......................................................................................................... 11 Overall Experience at the Terminal .............................................................................. 11 Ticket Purchase ............................................................................................................. 12 Food/Beverage Services at Terminal ............................................................................ 13 Retail Services at Terminal ........................................................................................... 14 Foot Passenger Services ............................................................................................... 15 Other Terminal Services ............................................................................................... 16
Onboard Experience .................................................................................................. 17 Overall Onboard Experience ......................................................................................... 17 Onboard Gift Shop/News Stand ................................................................................... 18 Onboard Food Services ................................................................................................. 19 Onboard Washrooms and Onboard Seating ................................................................ 20 Other Onboard Facilities/Services ................................................................................ 21
Sailing Schedules ....................................................................................................... 23 Various Aspects of Sailing Schedules ............................................................................ 23 Departing on Time ........................................................................................................ 24
Safety ........................................................................................................................ 25
Overall Value ............................................................................................................. 26
Appendices ....................................................................................................... 27
Route‐by‐Route Satisfaction Score for Each Attribute ................................................ 27
Research Methodology .............................................................................................. 32
July 31, 2013 2012/13 Annual Report to the British Columbia Ferries Commissioner Page 41

BC Ferries Customer Satisfaction Tracking
Mustel Group ____________________________________________________________________________________________________ Page 1
Executive Overview
Background
British Columbia Ferry Services Inc. (BC Ferries), conducts a Customer Satisfaction Tracking (CST) study each year. The CST study is designed to monitor customer satisfaction with various aspects of service on BC Ferries in order to determine areas that passengers believe are performing well and areas that require improvement. This study is part of a regular program of ongoing research conducted each year by BC Ferries.
The following report provides annual customer satisfaction results for the following:
Overall ferry service
Service prior to arriving at the terminal
Service at the ferry terminal
Service onboard the ferry
Service pertaining to loading/unloading
Overall safety of operations, and
Value for money of fares paid
For each of the more than sixty attributes, the scores for the last four years are shown on the graphs, to allow for easy comparison.
In addition to graphs showing the overall scores, the Appendix in this report includes detailed tables by route showing satisfaction scores for each of the service attributes for 2012. The Appendix also includes detailed satisfaction scores for each of the terminal‐related attributes, shown separately for each of the main terminals.
Methodology
The research involves a two‐phased approach. First a random sample of passengers are intercepted onboard to collect key data including frequency of travel on BC Ferries, purpose of trip, area of residence, origin/destination, and standard demographic questions. Immediately following this screener, passengers are given a longer follow‐up survey to complete after they disembark and leave the terminal area.
Interviews are distributed across nine routes in total, both larger and smaller, during three different time periods: June, August and November. In 2012, a total of 11,219 screeners were completed and 5,018 questionnaires returned. A more detailed explanation of the research design is included in the Research Methodology section, in the Appendix of this report.
July 31, 2013 2012/13 Annual Report to the British Columbia Ferries Commissioner Page 42
Mustel Group - Page 1

BC Ferries Customer Satisfaction Tracking
Mustel Group ____________________________________________________________________________________________________ Page 2
Findings
Customers were asked to rate their satisfaction with over sixty different aspects of the services they received from BC Ferries on a scale from 1 to 5 where 1 means ‘very dissatisfied’ and 5 means ‘very satisfied’.
Satisfaction with BC Ferries Overall
A total of 88% of passengers in 2012 reported to be satisfied overall with their experience travelling on BC Ferries. An overall score of 4.19 has been achieved (on a five‐point scale where ‘1’ means ‘very dissatisfied’ and ‘5’ means ‘very satisfied’). The findings are identical to those obtained in 2011.
Furthermore, the overall satisfaction scores have been stable by route except levels have strengthened on Route 19 (4.11 average score, up from 3.88 in 2011 and 3.79 in 2010).
Satisfaction before Arriving at Terminal
Satisfaction levels have stabilized with BC Ferries web site, the on‐line reservation’s system, and with aspects of the phone service.
Satisfaction at the Terminal
Overall satisfaction with the experience at the terminal before boarding is consistent with a year ago, with 85% satisfied and no significant change in the average score of 4.07. Satisfaction ratings also have not changed by terminal.
Furthermore, ratings in 2012 have remained stable with respect to all attributes and services at the terminal, with no significant changes in satisfaction ratings to report.
Satisfaction Onboard
A total of 90% of passengers in 2012 were satisfied with their overall experience onboard, for an overall rating of 4.14 on the 5‐point scale, consistent with the average score achieved in 2011 (4.12).
Ratings are stable on most routes with the exception of further improvement in satisfaction on Route 19 (4.02 rating versus 3.89 in 2011 and 3.65 in 2010).
Satisfaction levels have been stable on all aspects of onboard services.
Satisfaction with Sailing Schedules
Satisfaction levels with many aspects of the sailing schedules have improved slightly this past year, particularly with respect to sailing frequency and timing of last ferry.
July 31, 2013 2012/13 Annual Report to the British Columbia Ferries Commissioner Page 43
Mustel Group - Page 2
BC Ferries Customer Satisfaction Tracking
Mustel Group ____________________________________________________________________________________________________ Page 3
Satisfaction with Safety
Perceptions of the safety of the ferry operations continue to be strong.
Satisfaction with Overall Value
Satisfaction levels with value for money of fares are identical to last year after declining in 2011.
July 31, 2013 2012/13 Annual Report to the British Columbia Ferries Commissioner Page 44
Mustel Group - Page 3

BC Ferries Customer Satisfaction Tracking
Mustel Group ____________________________________________________________________________________________________ Page 4
Key Conclusions
In summary, customer satisfaction levels have been very stable in 2012 with no significant changes overall, or on specific aspects of service. The key areas of success in 2012 have continued to be in the following areas:
Staff at the terminal and onboard
All aspects of the ticket purchase
Availability and cleanliness of terminal and onboard washrooms
Cleanliness of pre‐boarding and onboard lounge seating
Appearance of terminals
Variety/selection in onboard gift shop/ news stand
Availability and cleanliness of seating area of onboard food/beverage services
Availability of tourist and travel info
Outside decks
Overall appearance of vessels
Procedures for loading and unloading
Safety of ferry operations and loading/unloading
Areas of opportunity to enhance the customer experience continue to include:
Ease of using automated phone system
Value for money of fares, parking, food/beverages, and retail merchandise both at the terminal and onboard
Variety/selection at outdoor market
Ability to connect
Problem resolution
July 31, 2013 2012/13 Annual Report to the British Columbia Ferries Commissioner Page 45
Mustel Group - Page 4

BC Ferries Customer Satisfaction Tracking
Mustel Group ____________________________________________________________________________________________________ Page 5
Detailed Findings The following section shows the detailed findings from the study. It graphically displays the satisfaction scores for each of the 69 service attributes, showing both the average satisfaction score out of 5 as well as the percentage for each level of satisfaction, that is, ‘Very Dissatisfied’, ‘Dissatisfied’, ‘Neither Satisfied/Dissatisfied’, ‘Satisfied’ and ‘Very Satisfied’. The ratings are shown for all surveyed BC Ferry routes combined and, where appropriate, the route‐by‐route scores are shown as well. NOTE: When route numbers are shown in the graphs, please refer to the following table that explains each route number.
Ferry Routes Included in Customer Satisfaction Survey - 2012
Route No. Description of Route
Route 1 Tsawwassen-Swartz Bay
Route 2 Horseshoe Bay-Departure Bay
Route 3 Horseshoe Bay-Langdale
Route 30 Tsawwassen-Duke Point
Route 4 Swartz Bay-Fulford Harbour, Salt Spring Island
Route 19 Departure Bay–Descanso Bay, Gabriola Island
Route 5/9 Southern Gulf Islands (from Swartz Bay/from Tsawwassen)
July 31, 2013 2012/13 Annual Report to the British Columbia Ferries Commissioner Page 46
Mustel Group - Page 5

BC Ferries Customer Satisfaction Tracking
Mustel Group ____________________________________________________________________________________________________ Page 6
Overall Satisfaction with BC Ferries
A total of 88% of passengers in 2012 reported to be satisfied overall with their experience travelling on BC Ferries. An overall score of 4.19 has been achieved (on a five‐point scale where ‘1’ means ‘very dissatisfied’ and ‘5’ means ‘very satisfied’). The findings are identical to those obtained in 2011.
Furthermore, the overall satisfaction scores have been stable by route except levels have strengthened on Route 19 (4.11 average score, up from 3.88 in 2011 and 3.79 in 2010).
[NOTE: Refer to page 5 for route number codes]
July 31, 2013 2012/13 Annual Report to the British Columbia Ferries Commissioner Page 47
Mustel Group - Page 6

BC Ferries Customer Satisfaction Tracking
Mustel Group ____________________________________________________________________________________________________ Page 7
3239383636
364546
4243
33353836
28
2731323032
3743
403437
343537
3335
16192225
34
2432
283031
5452
505253
525046
5150
5655
5452
58
575551
5252
5350
535653
5049
5151
53
51545249
50
5855
555555
107
888
84
455
886
99
128
1011
11
876
77
139
911
9
18171416
11
119
111010
32
333
31
212
3223
3
34654
211
22
26
343
99
87
5
53544
11111
1
1
1
11
2
12231
1
1
121
1
71
43
21121
Total '08Total '09Total '10Total '11Total '12
Total '08Total '09Total '10Total '11Total '12
Total '08Total '09Total '10Total '11Total '12
Total '08Total '09Total '10Total '11Total '12
Total '08Total '09Total '10Total '11Total '12
Total '08Total '09Total '10Total '11Total '12
Total '08Total '09Total '10Total '11Total '12
Total '08Total '09Total '10Total '11Total '12
Overall Satisfaction Level with Recent Experience Travelling with BC Ferries
(%)
Very satisfied (5) Satisfied (4)
Neither satisfied/dissatisfied (3) Dissatisfied (2)
Very dissatisfied (1)
All BC Ferries Routes 4.14.3 4.22 4.19 4.19
Average
Route 1
Route 2 4.24.2 4.26 4.18 4.07
4.24.4 4.35 4.34 4.32
Route 3
Route 30
Route 4
4.14.1 4.05 4.02 4.11
4.24.3 4.32 4.21 4.21
4.14.1 4.20 4.12 4.18
Q.1) How satisfied or dissatisfied were you, overall, with your recent experience travelling with BC Ferries?
Route 5/9
Route 19 3.63.8 3.79 3.88 4.11
4.04.1 4.02 4.07 4.12
July 31, 2013 2012/13 Annual Report to the British Columbia Ferries Commissioner Page 48
Mustel Group - Page 7

BC Ferries Customer Satisfaction Tracking
Mustel Group ____________________________________________________________________________________________________ Page 8
The following chart summarizes the results from overall measures of each main point of contact and specifically with BC Ferries staff. Performance ratings have been stable on these key measures.
23
27
26
27
26
24
27
28
26
26
25
29
31
30
29
27
31
32
31
31
27
30
32
30
32
58
59
58
58
58
64
63
62
62
64
61
60
57
59
59
59
57
56
56
57
62
61
59
59
59
15
12
12
12
13
10
8
8
10
8
13
10
12
11
11
11
11
11
11
11
9
8
9
10
9
3
2
3
2
2
2
1
2
1
1
2
1
2
1
1
1
1
1
1
1
1
1
1
1
1
1
1
1
Total '08
Total '09
Total '10
Total '11
Total '12
Total '08
Total '09
Total '10
Total '11
Total '12
Total '08
Total '09
Total '10
Total '11
Total '12
Total '08
Total '09
Total '10
Total '11
Total '12
Total '08
Total '09
Total '10
Total '11
Total '12
Summary of Main satisfaction Scores(%)
Very satisfied (5) Satisfied (4)
Neither satisfied/dissatisfied (3) Dissatisfied (2)
Very dissatisfied (1)
Q.3) Please rate how satisfied or dissatisfied you were with each of the following.
Overall experience at terminal before boarding
4.0
4.1
4.07
4.07
4.08
Average
Overall experience onboard the ferry
Safety of Ferry operations
4.1
4.2
4.14
4.12
4.14
4.1
4.2
4.19
4.17
4.17
Professionalism of terminal staff
Professionalism of onboard staff
4.1
4.2
4.17
4.16
4.17
4.1
4.2
4.21
4.18
4.21
July 31, 2013 2012/13 Annual Report to the British Columbia Ferries Commissioner Page 49
Mustel Group - Page 8

BC Ferries Customer Satisfaction Tracking
Mustel Group ____________________________________________________________________________________________________ Page 9
Before Arriving at Terminal
Web site and Phone Contact
Satisfaction with the web site and the on‐line reservation system had declined in 2011 and have more or less stayed at the lower levels. Ratings have not changed significantly with respect to the usefulness of BC Ferries phone service, and ease of using the automated system.
39
42
39
30
31
36
38
35
25
27
19
22
20
18
20
14
16
15
13
14
52
48
53
56
57
46
44
45
46
46
43
44
43
40
38
36
39
35
34
33
6
4
5
8
7
11
9
12
16
15
23
19
22
27
26
28
25
29
32
31
2
3
2
4
4
6
6
6
9
8
10
11
9
11
11
15
13
12
14
15
1
2
1
2
1
2
4
2
5
5
4
3
6
5
6
7
7
9
8
7
Total '08
Total '09
Total '10
Total '11
Total '12
Total '08
Total '09
Total '10
Total '11
Total '12
Total '08
Total '09
Total '10
Total '11
Total '12
Total '08
Total '09
Total '10
Total '11
Total '12
Satisfaction with Aspects of Website* andPhone Contact**
(%)
Very satisfied (5) Satisfied (4)
Neither satisfied/dissatisfied (3) Dissatisfied (2)
Very dissatisfied (1)
Q.2) Please rate how satisfied or dissatisfied you were with each of the following. * 64% usage web site, 32% for on-line reservations ** 20% usage phone service, 17% for automated system
Average
Usefulness of BC Ferries Web site
Ease of using on-line reservations
Usefulness of BC Ferries phone service
Ease of using automated phone system
4.3
4.3
4.28
4.09
4.13
3.4
3.5
3.33
3.30
3.33
3.6
3.7
3.63
3.55
3.54
4.1
4.1
4.06
3.78
3.81
July 31, 2013 2012/13 Annual Report to the British Columbia Ferries Commissioner Page 50
Mustel Group - Page 9

BC Ferries Customer Satisfaction Tracking
Mustel Group ___________________________________________________________________________________________________ Page 10
Highway Signage
Satisfaction levels with highway signage have also been stable overall.
232628
2525
26312928
25
3433
423033
1220212120
2120212328
121620
2521
363434
2930
545553
5556
5553
5155
57
5355
465755
4955565555
595355
5851
565854
5159
4755
525252
161314
1313
1411
151111
111010118
2216131416
121712
1315
2015
2118
15
128
101412
555
54
3345
4
1212
4
129
787
579
54
118
453
534
35
211
12
11113
12
11
51
232
32312
13
22
11
12
Total '08Total '09Total '10Total '11Total '12
Total '08Total '09Total '10Total '11Total '12
Total '08Total '09Total '10Total '11Total '12
Total '08Total '09Total '10Total '11Total '12
Total '08Total '09Total '10Total '11Total '12
Total '08Total '09Total '10Total '11Total '12
Total '08Total '09Total '10Total '11Total '12
Satisfaction with Highway Signage*(%)
Very satisfied (5) Satisfied (4)
Neither satisfied/dissatisfied (3) Dissatisfied (2)
Very dissatisfied (1)
Q.2) Please rate how satisfied or dissatisfied you were with each of the following. * Usage: 75%
Average
Total Passengers
Swartz Bay
Horseshoe Bay
Departure Bay
Departure Terminals
Tsawwassen
Langdale
Duke Point
3.9 4.0 4.00 3.98 3.98
3.5 3.8 3.86 3.83 3.86
4.2 4.2 4.26 4.13 4.16
4.0 4.1 4.04 4.05 3.96
3.9 3.8 3.83 3.98 3.99
4.1 4.2 4.15 4.04 4.03
3.7 3.8 3.90 3.94 3.94
July 31, 2013 2012/13 Annual Report to the British Columbia Ferries Commissioner Page 51
Mustel Group - Page 10

BC Ferries Customer Satisfaction Tracking
Mustel Group ___________________________________________________________________________________________________ Page 11
At the Terminal
Overall Experience at the Terminal
Overall satisfaction with the experience at the terminal before boarding is consistent with a year ago, with 84% satisfied and no significant change in the average score (4.08 versus 4.07 in 2011). Satisfaction ratings also have not changed by terminal.
Q.3) Please rate how satisfied or dissatisfied you were with each of the following.
Average
Major Terminals
2327262726
2735
293131
3127
332631
1723
1923
20
1922
3235
32
1613
1928
14
303030
2629
5859
585858
5955
595757
566254
6357
6060
6360
61
5858
5756
54
5665
5948
63
535858
6159
1512
121213
1110
101011
108
108
10
1615
1315
17
1712
95
10
231719
1919
15111099
32
322
21
111
22322
52
322
55
243
543
43
222
33
11111
1
111
2
111
23
2
11
21
11
Total '08Total '09Total '10Total '11Total '12
Total '08Total '09Total '10Total '11Total '12
Total '08Total '09Total '10Total '11Total '12
Total '08Total '09Total '10Total '11Total '12
Total '08Total '09Total '10Total '11Total '12
Total '08Total '09Total '10Total '11Total '12
Total '08Total '09Total '10Total '11Total '12
Overall Satisfaction with Experience at the Terminal Before Boarding
(%)
Very satisfied (5) Satisfied (4)Neither satisfied/dissatisfied (3) Dissatisfied (2)Very dissatisfied (1)
4.0 4.1 4.07 4.07 4.08
3.8 4.0 3.96 4.01 3.96
4.2 4.1 4.14 4.09 4.16
4.1 4.2 4.16 4.15 4.17
3.9 3.9 4.20 4.20 4.12
4.1 4.2 4.14 4.07 4.13
3.8 3.9 3.94 3.95 3.86
Total Passengers
Swartz Bay
Horseshoe Bay
Departure Bay
Tsawwassen
Langdale
Duke Point
July 31, 2013 2012/13 Annual Report to the British Columbia Ferries Commissioner Page 52
Mustel Group - Page 11

BC Ferries Customer Satisfaction Tracking
Mustel Group ___________________________________________________________________________________________________ Page 12
Ticket Purchase
Satisfaction levels continue to be high with all aspects of the ticket purchase process with average ratings similar to a year ago.
48
51
52
51
50
49
52
53
50
53
42
48
48
46
49
46
44
42
43
45
45
41
40
42
41
49
43
44
46
43
4
3
3
4
3
5
5
5
6
5
6
7
6
6
5
2
1
2
2
1
1
2
2
1
1
2
2
2
2
2
0
1
1
1
1
1
1
1
1
1
1
1
1
1
1
Total '08
Total '09
Total '10
Total '11
Total '12
Total '08
Total '09
Total '10
Total '11
Total '12
Total '08
Total '09
Total '10
Total '11
Total '12
Satisfaction with Aspects of Ticket Purchase(%)
Very satisfied (5) Satisfied (4)Neither satisfied/dissatisfied (3) Dissatisfied (2)Very dissatisfied (1)
Q.3) Please rate how satisfied or dissatisfied you were with each of the following.
Average
Efficiency of the transaction
Staff courtesy
Clarity of staff directions
4.4
4.4
4.44
4.41
4.42
4.3
4.4
4.37
4.35
4.38
4.4
4.4
4.44
4.41
4.44
July 31, 2013 2012/13 Annual Report to the British Columbia Ferries Commissioner Page 53
Mustel Group - Page 12

BC Ferries Customer Satisfaction Tracking
Mustel Group ___________________________________________________________________________________________________ Page 13
Food/Beverage Services at Terminal
Satisfaction levels with food and beverage services at terminals also are relatively unchanged.
13
15
14
16
15
8
8
6
8
8
46
45
50
46
48
29
29
31
28
29
23
24
22
21
22
30
28
30
29
28
13
12
10
13
11
23
26
23
24
25
4
4
5
5
4
10
9
10
11
11
Total '08
Total '09
Total '10
Total '11
Total '12
Total '08
Total '09
Total '10
Total '11
Total '12
Satisfaction with Aspects of Food and Beverage Services at Terminal*
(%)
Very satisfied (5) Satisfied (4)Neither satisfied/dissatisfied (3) Dissatisfied (2)Very dissatisfied (1)
Food/beverages offered
Q.3) Please rate how satisfied or dissatisfied you were with each of the following. * 44% usage overall; excluding Route 19.
Average
Value of money 3.0
3.0
2.99
2.98
2.98
3.5
3.6
3.57
3.56
3.59
July 31, 2013 2012/13 Annual Report to the British Columbia Ferries Commissioner Page 54
Mustel Group - Page 13

BC Ferries Customer Satisfaction Tracking
Mustel Group ___________________________________________________________________________________________________ Page 14
Retail Services at Terminal
Similarly, satisfaction ratings are not statistically different from 2011 with respect to the gift shop/news stand services and outdoor market area at the terminals, in terms of both variety/selection and value for money.
20
21
20
21
23
11
13
10
12
13
14
14
11
14
16
11
10
8
9
11
51
48
53
51
50
40
36
40
37
38
43
43
43
42
42
35
33
31
33
34
20
24
21
21
21
31
31
31
32
31
30
31
33
32
29
38
36
43
39
37
7
5
4
5
4
13
15
14
14
13
8
9
9
9
10
12
14
15
12
13
3
2
2
2
2
5
5
5
5
5
5
3
4
3
4
5
7
4
6
6
Total '08
Total '09
Total '10
Total '11
Total '12
Total '08
Total '09
Total '10
Total '11
Total '12
Total '08
Total '09
Total '10
Total '11
Total '12
Total '08
Total '09
Total '10
Total '11
Total '12
Satisfaction with Aspects of Retail Services at Terminal*
(%)
Very satisfied (5) Satisfied (4)
Neither satisfied/dissatisfied (3) Dissatisfied (2)
Very dissatisfied (1)
Average
Value for money
3.8
3.8
3.85
3.83
3.87
Gift Shop/News Stand at the Terminal - variety/selection of merchandise
Value for money
3.5
3.5
3.47
3.54
3.57
Outdoor Market Area at the Terminal - variety/selection of merchandise
3.4
3.4
3.34
3.35
3.40
Q.3) Please rate how satisfied or dissatisfied you were with each of the following. * Usage: 37% gift shop, 22% outdoor market; excluding Route 19.
3.4
3.3
3.23
3.28
3.30
July 31, 2013 2012/13 Annual Report to the British Columbia Ferries Commissioner Page 55
Mustel Group - Page 14

BC Ferries Customer Satisfaction Tracking
Mustel Group ___________________________________________________________________________________________________ Page 15
Foot Passenger Services
Furthermore there are no significant changes in satisfaction levels with foot passenger services from a year ago.
1621212222
1516181819
2027
222624
1922
1725
21
1214151516
121171112
1316171817
6062
595862
5350494952
5251
535054
5353
5449
49
5152
454850
3432
312425
4548494647
1913
161614
151618
1514
1311
121212
1311
1211
14
2321
2522
21
1617
221918
322829
2929
44333
141412
1413
108
8107
910
119
11
119
111110
262523
2828
754
45
11110
34442
53533
64776
33533
1316
171818
322
32
Total '08Total '09Total '10Total '11Total '12
Total '08Total '09Total '10Total '11Total '12
Total '08Total '09Total '10Total '11Total '12
Total '08Total '09Total '10Total '11Total '12
Total '08Total '09Total '10Total '11Total '12
Total '08Total '09Total '10Total '11Total '12
Total '08Total '09Total '10Total '11Total '12
Satisfaction with Foot Passenger Services (%)
Very satisfied (5) Satisfied (4)
Neither satisfied/dissatisfied (3) Dissatisfied (2)
Very dissatisfied (1)
Comfort of seating in pre-boarding lounge at terminal
Q.3) Please rate how satisfied or dissatisfied you were with each of the following. Usage: 36% are foot passengers (including bus).
* Excludes Routes 19, & 5/9.
Average
Cleanliness of pre-boarding lounge
Availability of seating in pre-boarding lounge
Ease of using passenger drop-off/ pick-up area
Availability of parking spaces
Parking value for money
Usefulness of TV info screens*
3.9 4.0 3.96 3.99 4.02
3.7 3.6 3.64 3.63 3.72
3.7 3.9 3.81 3.87 3.88
3.7 3.8 3.65 3.77 3.67
3.6 3.6 3.54 3.60 3.67
3.1 3.0 2.87 2.81 2.86
3.6 3.7 3.74 3.72 3.71
July 31, 2013 2012/13 Annual Report to the British Columbia Ferries Commissioner Page 56
Mustel Group - Page 15

BC Ferries Customer Satisfaction Tracking
Mustel Group ___________________________________________________________________________________________________ Page 16
Other Terminal Services
Satisfaction levels have been stable on all other terminal services as well.
2731323131
2024252523
2325252426
1415161617
1922242424
1112131313
1618192018
2025252525
5957565657
6663636264
6360606060
5453545555
6161605959
4646484950
55585657
56
5757575757
1111111111
1199910
1111101111
1920181818
1312111312
2120
202120
25202120
22
2016151516
212
11
33332
33333
109989
65444
1616151314
43334
32223
1
1
11111
11221
33322
22
111
66544
11111
11
1
Total '08Total '09Total '10Total '11Total '12
Total '08Total '09Total '10Total '11Total '12
Total '08Total '09Total '10Total '11Total '12
Total '08Total '09Total '10Total '11Total '12
Total '08Total '09Total '10Total '11Total '12
Total '08Total '09Total '10Total '11Total '12
Total '08Total '09Total '10Total '11Total '12
Total '08Total '09Total '10Total '11Total '12
Satisfaction with Other Terminal Services(%)
Very satisfied (5) Satisfied (4)
Neither satisfied/dissatisfied (3) Dissatisfied (2)
Very dissatisfied (1)
Professionalism of terminal staff
Availability of washrooms
Procedures for loading
Announcements when you need to be informed
Cleanliness of washrooms
Clarity of public address system
3.7 3.7 3.72 3.76 3.74
Q.3) Please rate how satisfied or dissatisfied you were with each of the following.
Average
4.0 4.1 4.08 4.07 4.07
4.0 4.0 4.04 4.02 4.06
4.1 4.2 4.17 4.16 4.17
3.4 3.4 3.48 3.55 3.55
3.9 4.0 4.01 4.01 4.00
Overall look and décor inside the terminal* * Excludes Route 19
Outside appearance of the terminal you left from
3.8 3.9 3.89 3.91 3.86
3.9 4.0 4.04 4.04 4.03
July 31, 2013 2012/13 Annual Report to the British Columbia Ferries Commissioner Page 57
Mustel Group - Page 16

BC Ferries Customer Satisfaction Tracking
Mustel Group ___________________________________________________________________________________________________ Page 17
Onboard Experience
Overall Onboard Experience
A total of 90% of passengers in 2012 were satisfied with their overall experience onboard, for an overall rating of 4.14 on the 5‐point scale, consistent with the average score achieved in 2011 (4.12).
Ratings are stable on most routes with the exception of further improvement in satisfaction on Route 19 (4.02 rating versus 3.89 in 2011 and 3.65 in 2010).
[NOTE: Refer to page 5 or page 34 for Route number codes]
Q.4) Please rate how satisfied or dissatisfied you were with each of the following.
All BC Ferries Routes
Route 1
Route 2
Route 3
Route 30
Route 4
Route 5/9
Route 19
2427282626
2427282931
25262625
21
1821242523
2831
282828
1719222019
1291215
22
1519202320
646362
6264
6463626262
666466
6467
7069636165
626064
6165
6459
6265
63
5764
5564
62
6767636267
1088
108
108885
897
910
119
111212
887
96
1617
1414
16
2320
221813
1411
12139
21211
21211
21111
2111
12
21
25222
67
833
32523
1
1
1
1
1
11
21
31
1
1
Total '08Total '09Total '10Total '11Total '12
Total '08Total '09Total '10Total '11Total '12
Total '08Total '09Total '10Total '11Total '12
Total '08Total '09Total '10Total '11Total '12
Total '08Total '09Total '10Total '11Total '12
Total '08Total '09Total '10Total '11Total '12
Total '08Total '09Total '10Total '11Total '12
Total '08Total '09Total '10Total '11Total '12
Overall Satisfaction with Onboard Experience(%)
Very satisfied (5) Satisfied (4)Neither satisfied/dissatisfied (3) Dissatisfied (2)Very dissatisfied (1)
4.04.1 4.08 4.07 4.08
4.24.2 4.26 4.19 4.23
4.14.1 4.16 4.13 4.07
4.14.2 4.14 4.12 4.14
4.03.9 4.02 4.01 4.00
4.24.2 4.20 4.14 4.19
3.73.7 3.65 3.89 4.02
3.94.0 3.97 4.04 4.05
Average
July 31, 2013 2012/13 Annual Report to the British Columbia Ferries Commissioner Page 58
Mustel Group - Page 17

BC Ferries Customer Satisfaction Tracking
Mustel Group ___________________________________________________________________________________________________ Page 18
Onboard Gift Shop/News Stand
Satisfaction ratings have not varied from a year ago on different aspects of the onboard gift shop/news stand.
27
31
32
32
32
21
23
24
23
24
8
9
9
10
9
12
13
13
12
13
61
58
58
55
58
60
61
57
59
59
44
39
41
39
43
50
50
49
47
50
10
10
9
11
10
15
14
16
16
14
30
34
33
32
31
24
26
26
27
24
2
1
1
2
1
4
2
2
2
3
15
15
13
15
14
14
11
12
13
11
1
1
1
0
3
4
4
4
4
1
1
1
1
Total '08
Total '09
Total '10
Total '11
Total '12
Total '08
Total '09
Total '10
Total '11
Total '12
Total '08
Total '09
Total '10
Total '11
Total '12
Total '08
Total '09
Total '10
Total '11
Total '12
Satisfaction with Aspects of Gift Shop/News Stand Onboard*
(%)
Very satisfied (5) Satisfied (4)
Neither satisfied/dissatisfied (3) Dissatisfied (2)
Very dissatisfied (1)
Average
Staff courtesy
Variety/selection of merchandise
Value for money
Ease of moving around inside shop
4.1
4.2
4.21
4.17
4.19
3.6
3.6
3.61
3.56
3.62
3.4
3.3
3.37
3.36
3.38
4.0
4.0
4.02
4.02
4.04
Q.4) Please rate how satisfied or dissatisfied you were with each of the following. * Excludes Routes 4 & 19. Usage: 56% gift shop/news stand.
July 31, 2013 2012/13 Annual Report to the British Columbia Ferries Commissioner Page 59
Mustel Group - Page 18

BC Ferries Customer Satisfaction Tracking
Mustel Group ___________________________________________________________________________________________________ Page 19
Onboard Food Services
Satisfaction levels with all aspects of onboard food services also have been stable.
2831323231
2326262523
2325252422
1820192018
1313151413
1114121111
89988
6057585759
6262636365
6261616163
57595957
58
4953515153
5252
535355
3536363636
10109
109
1199
1010
1111111211
1817
161819
2323212222
2121212220
282627
2627
11111
32222
43334
64
445
129
111211
1212
111111
202321
2221
1
1
1
111
11
111
32222
42
343
87898
Total '08Total '09Total '10Total '11Total '12
Total '08Total '09Total '10Total '11Total '12
Total '08Total '09Total '10Total '11Total '12
Total '08Total '09Total '10Total '11Total '12
Total '08Total '09Total '10Total '11Total '12
Total '08Total '09Total '10Total '11Total '12
Total '08Total '09Total '10Total '11Total '12
Satisfaction with Aspects of Food andBeverage Services Onboard*
(%)
Very satisfied (5) Satisfied (4)Neither satisfied/dissatisfied (3) Dissatisfied (2)Very dissatisfied (1)
Length of time in line for food service
Average
Staff courtesy
Cleanliness of seating area
Availability of seating
Comfort of seating
Food/beverage offered
Value for money
4.2 4.2 4.20 4.20 4.19
4.0 4.1 4.12 4.11 4.08
4.0 4.1 4.06 4.06 4.03
3.9 3.9 3.91 3.91 3.86
3.6 3.7 3.66 3.62 3.64
3.6 3.6 3.60 3.57 3.60
3.2 3.2 3.17 3.13 3.14 Q.4) Please rate how satisfied or dissatisfied
you were with each of the following. * Excludes Routes 4 & 19. Usage: 72% food & beverage services.
July 31, 2013 2012/13 Annual Report to the British Columbia Ferries Commissioner Page 60
Mustel Group - Page 19
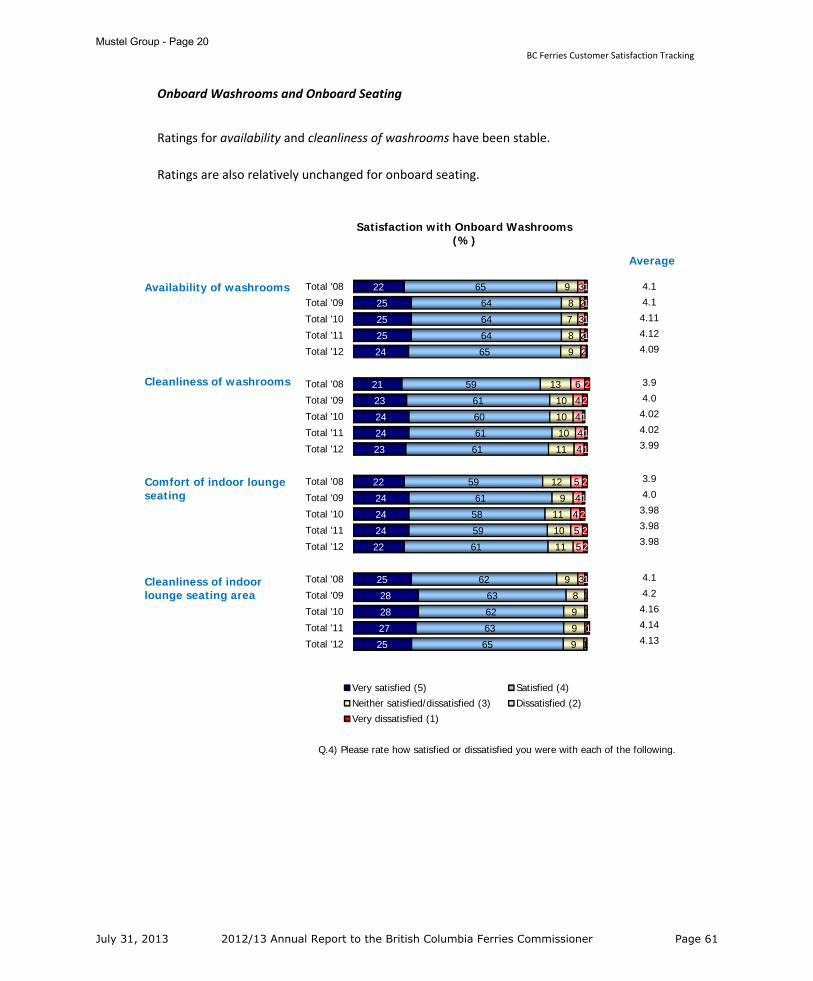
BC Ferries Customer Satisfaction Tracking
Mustel Group ___________________________________________________________________________________________________ Page 20
Onboard Washrooms and Onboard Seating
Ratings for availability and cleanliness of washrooms have been stable. Ratings are also relatively unchanged for onboard seating.
22
25
25
25
24
21
23
24
24
23
22
24
24
24
22
25
28
28
27
25
65
64
64
64
65
59
61
60
61
61
59
61
58
59
61
62
63
62
63
65
9
8
7
8
9
13
10
10
10
11
12
9
11
10
11
9
8
9
9
9
3
2
3
2
2
6
4
4
4
4
5
4
4
5
5
3
1
1
1
1
1
1
1
1
2
2
1
1
1
2
1
2
2
2
1
1
Total '08
Total '09
Total '10
Total '11
Total '12
Total '08
Total '09
Total '10
Total '11
Total '12
Total '08
Total '09
Total '10
Total '11
Total '12
Total '08
Total '09
Total '10
Total '11
Total '12
Satisfaction with Onboard Washrooms(%)
Very satisfied (5) Satisfied (4)
Neither satisfied/dissatisfied (3) Dissatisfied (2)
Very dissatisfied (1)
Q.4) Please rate how satisfied or dissatisfied you were with each of the following.
Average
Availability of washrooms
Cleanliness of washrooms
Comfort of indoor lounge seating
Cleanliness of indoor lounge seating area
4.1
4.1
4.11
4.12
4.09
4.1
4.2
4.16
4.14
4.13
3.9
4.0
3.98
3.98
3.98
3.9
4.0
4.02
4.02
3.99
July 31, 2013 2012/13 Annual Report to the British Columbia Ferries Commissioner Page 61
Mustel Group - Page 20
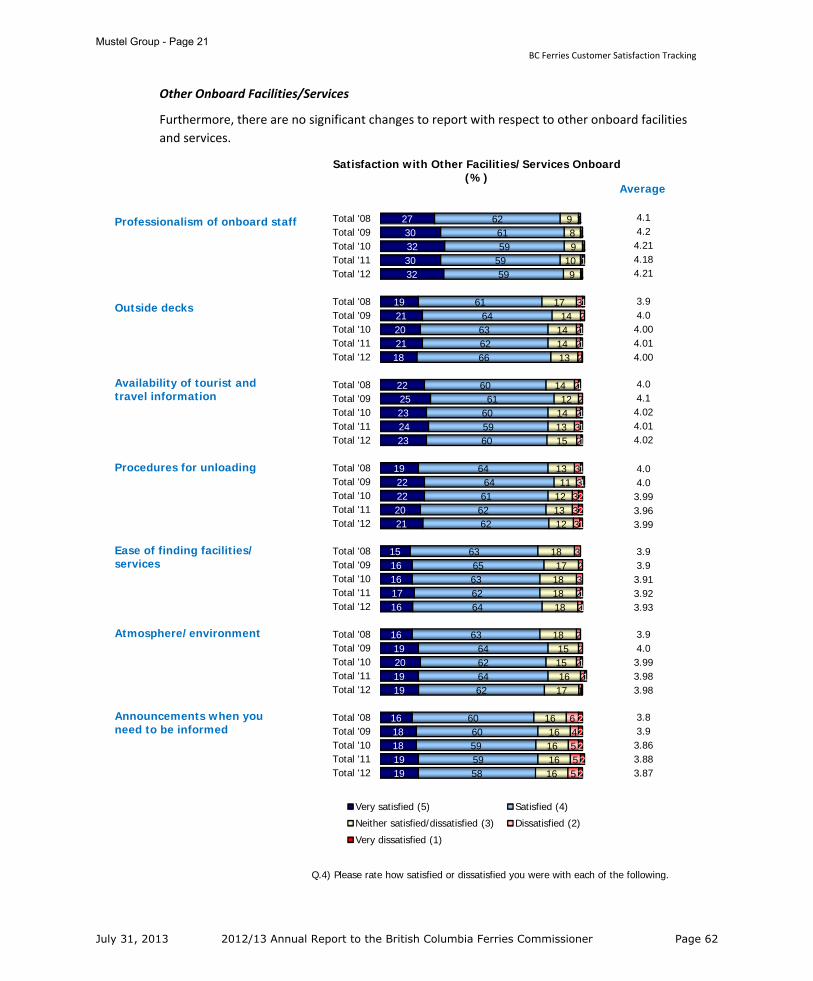
BC Ferries Customer Satisfaction Tracking
Mustel Group ___________________________________________________________________________________________________ Page 21
Other Onboard Facilities/Services
Furthermore, there are no significant changes to report with respect to other onboard facilities and services.
2730323032
1921202118
2225232423
1922222021
1516161716
1619201919
1618181919
626159
5959
6164636266
6061
605960
6464616262
6365636264
6364626462
6060595958
989
109
1714
141413
1412
141315
1311
121312
1817181818
1815151617
1616161616
11111
32
222
22232
33
333
32322
22221
64555
1
1
11
1
111
11221
11
11
22222
Total '08Total '09Total '10Total '11Total '12
Total '08Total '09Total '10Total '11Total '12
Total '08Total '09Total '10Total '11Total '12
Total '08Total '09Total '10Total '11Total '12
Total '08Total '09Total '10Total '11Total '12
Total '08Total '09Total '10Total '11Total '12
Total '08Total '09Total '10Total '11Total '12
Satisfaction with Other Facilities/Services Onboard(%)
Very satisfied (5) Satisfied (4)
Neither satisfied/dissatisfied (3) Dissatisfied (2)
Very dissatisfied (1)
Professionalism of onboard staff
Outside decks
Availability of tourist and travel information
Procedures for unloading
Ease of finding facilities/ services
Atmosphere/environment
Announcements when you need to be informed
Average
4.1 4.2 4.21 4.18 4.21
3.9 4.0 4.00 4.01 4.00
4.0 4.1 4.02 4.01 4.02
4.0 4.0 3.99 3.96 3.99
3.9 3.9 3.91 3.92 3.93
3.9 4.0 3.99 3.98 3.98
3.8 3.9 3.86 3.88 3.87
Q.4) Please rate how satisfied or dissatisfied you were with each of the following.
July 31, 2013 2012/13 Annual Report to the British Columbia Ferries Commissioner Page 62
Mustel Group - Page 21

BC Ferries Customer Satisfaction Tracking
Mustel Group ___________________________________________________________________________________________________ Page 22
20
22
22
22
21
14
12
12
18
18
12
17
16
17
18
14
16
16
16
16
11
9
9
16
15
16
18
17
18
18
59
60
59
61
58
46
49
47
49
47
59
55
58
52
57
56
54
55
54
55
42
44
47
41
35
48
52
52
50
51
19
16
17
15
19
23
26
27
24
22
24
23
20
23
18
17
18
18
18
17
38
35
31
34
38
23
19
20
21
20
2
1
2
2
2
12
8
13
8
10
5
4
6
6
6
10
9
9
9
7
8
10
6
8
10
7
8
8
8
1
1
0
4
4
2
2
3
1
1
1
2
1
4
3
3
3
3
3
4
3
4
4
4
3
3
4
3
Total '08
Total '09
Total '10
Total '11
Total '12
Total '08
Total '09
Total '10
Total '11
Total '12
Total '08
Total '09
Total '10
Total '11
Total '12
Total '08
Total '09
Total '10
Total '11
Total '12
Total '08
Total '09
Total '10
Total '11
Total '12
Total '08
Total '09
Total '10
Total '11
Total '12
Satisfaction with Other Facilities/Services Onboard (cont'd) (%)
Very satisfied (5) Satisfied (4)
Neither satisfied/dissatisfied (3) Dissatisfied (2)
Very dissatisfied (1)
Average
3.9
4.0
4.01
4.03
3.97
3.6
3.6
3.54
3.73
3.68
3.7
3.8
3.82
3.76
3.84
3.7
3.7
3.71
3.72
3.73
3.5
3.5
3.49
3.62
3.49
3.6
3.8
3.71
3.71
3.74
Outside appearance of the vessel overall
Play area for children* * Excludes Routes 4 & 19.
Work stations* * Excludes Routes 4 & 19.
Clarity of public address system
Video arcade* * Excludes Routes 4 & 19.
Ease of access for people with disabilities
Q.4) Please rate how satisfied or dissatisfied you were with each of the following.
July 31, 2013 2012/13 Annual Report to the British Columbia Ferries Commissioner Page 63
Mustel Group - Page 22

BC Ferries Customer Satisfaction Tracking
Mustel Group ___________________________________________________________________________________________________ Page 23
Sailing Schedules
Various Aspects of Sailing Schedules
Satisfaction levels with many aspects of sailing schedules have improved this past year, particularly with respect to sailing frequency and timing of last ferry. Some improvement is also noted in perceptions of on‐time departures, and timing of the earliest ferry.
25
26
27
24
28
21
26
26
23
26
20
22
23
22
24
14
15
16
15
18
16
16
18
15
20
12
10
14
9
14
57
58
58
58
56
50
51
50
51
51
53
55
52
54
55
47
49
47
45
48
43
43
44
43
44
48
51
43
45
38
9
7
9
10
9
15
14
13
15
13
13
13
14
14
11
16
15
17
18
16
11
11
11
14
13
9
19
16
20
18
6
7
4
5
5
10
7
4
8
8
10
8
8
8
6
17
4
15
15
13
19
19
16
16
15
22
15
15
13
17
3
3
3
3
3
4
2
4
4
3
5
3
4
4
3
6
6
6
7
6
11
11
11
12
9
9
6
12
14
13
Total '08
Total '09
Total '10
Total '11
Total '12
Total '08
Total '09
Total '10
Total '11
Total '12
Total '08
Total '09
Total '10
Total '11
Total '12
Total '08
Total '09
Total '10
Total '11
Total '12
Total '08
Total '09
Total '10
Total '11
Total '12
Total '08
Total '09
Total '10
Total '11
Total '12
Satisfaction with Sailing Schedules (%)
Very satisfied (5) Satisfied (4)Neither satisfied/dissatisfied (3) Dissatisfied (2)Very dissatisfied (1)
Ability to get on to desired sailing
Earliest ferry early enough
Ferry departing on time
Ability to connect with other sailings* * Based on total connecting to another ferry (n=426).
Ferry sailing frequent enough
Latest ferry late enough
Q.5) Please rate how satisfied or dissatisfied you were with each of the following.
Average
4.0
4.0
4.01
3.95
4.02
3.7
3.9
3.82
3.82
3.90
3.7
3.9
3.87
3.82
3.89
3.5
3.5
3.51
3.46
3.59
3.3
3.4
3.33
3.22
3.24
3.4
3.3
3.44
3.33
3.52
July 31, 2013 2012/13 Annual Report to the British Columbia Ferries Commissioner Page 64
Mustel Group - Page 23

BC Ferries Customer Satisfaction Tracking
Mustel Group ___________________________________________________________________________________________________ Page 24
Departing on Time
The following graph details the ratings for “departing on time” by route. Perceptions have strengthened on all Routes except Route 2 where ratings have declined from 3.89 in 2011 to 3.54.
[NOTE: Refer to page 5 or page 34 for Route number codes]
212626
2326
263334
2835
20262726
18
1415151317
2732
282528
25232322
27
91114
2021
13161615
20
505150
5151
515452
5553
545253
5245
4649
4545
48
5555
5856
58
5448
5349
49
3844
4348
54
4341
3841
49
1514
131513
111010
138
161513
1115
2119
1619
21
101010
1210
1313
1515
12
182118
1917
1822
2020
15
107
788
93
234
865
814
1313
1715
10
64
353
810
7107
1917
149
7
1614
1618
12
42443
31
21
2123
7
74894
10
122
63
44
167
1142
107
1064
Total '08Total '09Total '10Total '11Total '12
Total '08Total '09Total '10Total '11Total '12
Total '08Total '09Total '10Total '11Total '12
Total '08Total '09Total '10Total '11Total '12
Total '08Total '09Total '10Total '11Total '12
Total '08Total '09Total '10Total '11Total '12
Total '08Total '09Total '10Total '11Total '12
Total '08Total '09Total '10Total '11Total '12
Satisfaction with "Departing on Time"(%)
Very satisfied (5) Satisfied (4)Neither satisfied/dissatisfied (3) Dissatisfied (2)Very dissatisfied (1)
Total Passengers 3.7 3.9 3.87 3.82 3.89
Average
Route 1
Route 2 3.9 4.0 3.98 3.89 3.54
3.9 4.1 4.13 4.07 4.19
Route 3
Route 30
Route 4
3.5 3.6 3.43 3.39 3.64
4.0 4.1 4.09 3.99 4.07
3.9 3.7 3.85 3.75 3.86
Q.5) Please rate how satisfied or dissatisfied you were with each of the following.
Route 5/9
Route 193.1 3.4 3.35 3.71 3.85
3.3 3.5 3.35 3.40 3.69
July 31, 2013 2012/13 Annual Report to the British Columbia Ferries Commissioner Page 65
Mustel Group - Page 24

BC Ferries Customer Satisfaction Tracking
Mustel Group ___________________________________________________________________________________________________ Page 25
Safety
Perceptions of safety continue to be strong.
25
29
31
30
29
26
30
31
30
29
61
60
57
59
59
61
61
58
59
60
13
10
12
11
11
12
9
10
11
10
Total '08
Total '09
Total '10
Total '11
Total '12
Total '08
Total '09
Total '10
Total '11
Total '12
Satisfaction with Aspects of Safety of Ferry Operations
(%)
Very satisfied (5) Satisfied (4)
Neither satisfied/dissatisfied (3) Dissatisfied (2)
Very dissatisfied (1)
Q.5) Please rate how satisfied or dissatisfied you were with each of the following.
Safety of ferry operations
Safety of loading/unloading
4.1
4.2
4.19
4.17
4.17
Average
4.1
4.2
4.19
4.18
4.18
July 31, 2013 2012/13 Annual Report to the British Columbia Ferries Commissioner Page 66
Mustel Group - Page 25

BC Ferries Customer Satisfaction Tracking
Mustel Group ___________________________________________________________________________________________________ Page 26
Overall Value
Satisfaction levels with value for money of fares are identical to last year after declining in 2011.
9
11
10
10
10
27
32
32
27
28
24
26
26
24
23
26
22
22
25
25
14
8
10
14
14
Total '08
Total '09
Total '10
Total '11
Total '12
Satisfaction with Overall Value(%)
Very satisfied (5) Satisfied (4)Neither satisfied/dissatisfied (3) Dissatisfied (2)Very dissatisfied (1)
Average
2.9
3.2
3.12
2.94
2.94
Q.5) Please rate how satisfied or dissatisfied you were with each of the following.
Value of money of fares
July 31, 2013 2012/13 Annual Report to the British Columbia Ferries Commissioner Page 67
Mustel Group - Page 26

BC Ferries Customer Satisfaction Tracking
Mustel Group ___________________________________________________________________________________________________ Page 27
Appendices
Route‐by‐Route Satisfaction Score for Each Attribute
Ferry Routes Included in Customer Satisfaction Survey - 2012
Route No. Description of Route
Route 1 Tsawwassen-Swartz Bay
Route 2 Horseshoe Bay-Departure Bay
Route 3 Horseshoe Bay-Langdale
Route 30 Tsawwassen-Duke Point
Route 4 Swartz Bay-Fulford Harbour, Salt Spring Island
Route 19 Departure Bay–Descanso Bay, Gabriola Island
Route 5/9 Southern Gulf Islands (from Swartz Bay/from Tsawwassen)
NOTE: Combined, these routes represent approximately 80% of the annual passenger traffic volume on BC Ferries.
July 31, 2013 2012/13 Annual Report to the British Columbia Ferries Commissioner Page 68
Mustel Group - Page 27

BC Ferries Customer Satisfaction Tracking
Mustel Group ___________________________________________________________________________________________________ Page 28
Average Satisfaction Ratings by Route – All Waves 2012
(see page 27 for Route Number Codes)
Larger Routes Route
3
Smaller Routes
Total Total 1 2 30 Total 4 19 5/9
OVERALL EXPERIENCE
Trip overall 4.19 4.23 4.32 4.07 4.21 4.11 4.13 4.18 4.11 4.12
BEFORE ARRIVING AT TERMINAL
Usefulness of BC Ferries website 4.13 4.14 4.16 4.13 4.11 4.12 4.09 4.12 4.01 4.11
Ease of using on-line reservations 3.81 3.82 3.85 3.71 3.92 3.73 3.85 3.77 3.72 3.92
Usefulness of BC Ferries phone service 3.54 3.60 3.67 3.57 3.43 3.22 3.64 3.50 3.19 3.84
Ease of using automated phone service 3.33 3.39 3.52 3.32 3.09 3.17 3.26 3.23 2.79 3.46
Highway signage 3.98 4.00 4.06 3.92 3.96 3.91 3.94 4.00 3.86 3.94
TERMINAL EXPERIENCE
Terminal overall 4.08 4.13 4.17 4.05 4.15 3.90 4.04 4.03 3.96 4.09
Outside appearance of the terminal 4.03 4.10 4.09 4.06 4.16 3.80 4.00 4.00 3.88 4.07
Ticket Purchase
Efficiency of the transaction 4.42 4.47 4.52 4.38 4.46 4.25 4.40 4.40 4.38 4.41
Staff courtesy 4.44 4.45 4.48 4.38 4.45 4.38 4.46 4.39 4.53 4.45
Clarity of staff directions 4.38 4.42 4.49 4.33 4.39 4.22 4.36 4.32 4.42 4.36
Food & Beverage Services at the Terminal
Food beverages offered 3.59 3.66 3.74 3.52 3.61 3.43 3.36 3.14 - 3.45
Value for money 2.98 3.02 3.11 2.86 2.98 2.85 2.95 2.82 - 3.01
Gift Shop/ News Stand at the Terminal
Variety/ selection of merchandise 3.87 3.90 3.95 3.87 3.83 3.93 3.50 3.30 - 3.59
Value for money 3.40 3.41 3.48 3.32 3.37 3.46 3.18 3.14 - 3.20
Outdoor Market Area at the Terminal
Variety/ selection of merchandise 3.57 3.67 3.76 3.50 3.67 3.18 3.57 3.56 - 3.57
Value for money 3.30 3.36 3.45 3.19 3.32 3.03 3.35 3.34 - 3.36
Other Terminal Services
Clarity of public address system 3.55 3.60 3.62 3.51 3.70 3.43 3.46 3.55 3.22 3.51
Announcements when you need to be informed 3.74 3.79 3.85 3.65 3.85 3.66 3.66 3.68 3.50 3.71
Overall look & décor inside terminal 3.86 3.91 3.91 3.90 3.94 3.66 3.83 3.79 - 3.86
Availability of washrooms 4.07 4.10 4.13 4.02 4.16 3.97 4.05 4.05 3.95 4.09
Cleanliness of washrooms 4.00 4.02 4.07 3.88 4.13 3.90 4.03 3.93 4.01 4.10
Procedures for loading 4.06 4.10 4.15 3.96 4.14 3.96 4.01 4.03 3.99 4.02
Professionalism of terminal staff 4.17 4.18 4.24 4.06 4.21 4.08 4.21 4.13 4.30 4.20
continued…
July 31, 2013 2012/13 Annual Report to the British Columbia Ferries Commissioner Page 69
Mustel Group - Page 28

BC Ferries Customer Satisfaction Tracking
Mustel Group ___________________________________________________________________________________________________ Page 29
Average Satisfaction Ratings by Route – All Waves 2012
(see page 27 for Route Number Codes)
Larger Routes Route
3
Smaller Routes
Total Total 1 2 30 Total 4 19 5/9
Foot Passenger Services at the Terminal
Usefulness of TV info screens 3.71 3.75 3.75 3.61 3.96 3.56 3.60 3.60 - -
Availability of parking spaces 3.67 3.81 3.87 3.57 4.12 3.86 3.04 3.09 2.39 3.76
Parking value for money 2.86 2.72 2.77 2.56 2.86 3.38 2.91 2.58 3.21 2.70
Ease of using passenger drop-off/ pick-up area 3.88 3.97 3.99 3.83 4.18 3.89 3.57 3.60 3.24 3.89
Availability of seating in pre-boarding lounge at terminal 3.72 3.71 3.65 3.75 3.98 3.65 3.85 3.96 3.72 3.89
Comfort of seating in pre-boarding lounge at terminal 3.67 3.71 3.72 3.68 3.72 3.58 3.58 3.75 3.27 3.76
Cleanliness of pre-boarding lounge 4.02 4.04 4.02 4.00 4.25 3.91 4.03 4.05 4.02 4.03
ONBOARD EXPERIENCE
Onboard overall 4.02 4.04 4.02 4.00 4.25 3.91 4.03 4.05 4.02 4.03
Gift Shop/ News Stand
Variety/ selection of merchandise 4.04 4.04 4.06 4.00 4.03 4.14 3.80 - - 3.80
Staff courtesy 4.19 4.19 4.19 4.16 4.24 4.21 4.21 - - 4.21
Ease of moving around inside shop 3.62 3.64 3.69 3.51 3.68 3.55 3.66 - - 3.66
Value for money 3.38 3.36 3.39 3.30 3.40 3.47 3.30 - - 3.30
Food Services
Length of time in line for food services 3.64 3.60 3.65 3.52 3.62 3.74 3.84 - - 3.84
Food/ beverages offered 3.60 3.63 3.67 3.55 3.65 3.55 3.43 - - 3.43
Staff courtesy 4.19 4.19 4.23 4.09 4.25 4.20 4.21 - - 4.21
Availability of seating 4.03 4.00 4.01 3.94 4.12 4.13 4.09 - - 4.09
Comfort of seating 3.86 3.85 3.86 3.80 3.95 3.92 3.84 - - 3.84
Cleanliness of seating area 4.08 4.08 4.07 4.05 4.17 4.10 4.09 - - 4.09
Value for money 3.14 3.18 3.27 2.99 3.21 3.01 3.05 - - 3.05
Washrooms
Availability of washrooms 4.09 4.12 4.15 4.02 4.21 4.06 4.03 3.96 3.96 4.09
Cleanliness of washrooms 3.99 4.02 4.06 3.86 4.17 3.91 3.98 3.78 3.97 4.07
Lounge Seating
Comfort of indoor lounge seating 3.98 4.03 4.08 3.91 4.06 4.04 3.71 3.37 3.62 3.89
Cleanliness of indoor lounge seating area 4.13 4.15 4.19 4.05 4.21 4.15 4.04 3.84 4.04 4.13
continued...
July 31, 2013 2012/13 Annual Report to the British Columbia Ferries Commissioner Page 70
Mustel Group - Page 29

BC Ferries Customer Satisfaction Tracking
Mustel Group ___________________________________________________________________________________________________ Page 30
Average Satisfaction Ratings by Route – All Waves 2012
(see page 27 for Route Number Codes)
Larger Routes Route
3
Smaller Routes
Total Total 1 2 30 Total 4 19 5/9
Other Onboard Facilities/ Services
Play area for children 3.68 3.75 3.79 3.71 3.64 3.66 3.23 - - 3.23
Video arcade 3.49 3.48 3.49 3.27 3.77 3.60 3.30 - - 3.30
Work stations 3.84 3.86 3.95 3.66 3.74 3.83 3.71 - - 3.71
Outside decks 4.00 4.07 4.14 3.95 4.01 3.91 3.88 3.91 3.75 3.97
Outside appearance of the vessel overall 3.97 4.05 4.14 3.87 4.05 3.83 3.83 3.95 3.80 3.79
Availability of tourist and travel information 4.02 4.05 4.10 3.95 4.03 4.12 3.80 3.76 3.35 3.98
Ease of access, overall, for people with disabilities 3.74 3.84 3.93 3.65 3.86 3.73 3.42 3.57 3.11 3.54
Ease of finding facilities/ services 3.93 3.95 3.98 3.87 4.01 3.97 3.83 3.78 3.75 3.91
Clarity of public address system 3.73 3.76 3.78 3.66 3.88 3.82 3.50 3.55 3.06 3.70
Announcements when you need to be informed 3.87 3.88 3.91 3.78 3.95 3.95 3.73 3.72 3.44 3.85
Atmosphere/ environment 3.98 4.01 4.05 3.92 4.02 3.99 3.87 3.78 3.80 3.95
Procedures for unloading 3.99 4.01 4.09 3.87 4.01 3.94 3.95 3.99 3.85 3.99
Professionalism with onboard staff 4.21 4.22 4.29 4.10 4.20 4.19 4.20 4.15 4.23 4.20
Experience with the Sailing Schedule
Earliest ferry earliest enough 4.02 3.99 4.00 3.97 4.03 4.06 4.05 4.01 4.41 3.90
Latest ferry late enough 3.52 3.58 3.64 3.35 3.78 3.12 3.69 3.27 4.25 3.60
Ferry sailing frequent enough 3.59 3.70 3.89 3.43 3.52 3.23 3.53 3.50 4.14 3.20
Ability to get onto desired ferry 3.90 3.94 4.09 3.69 3.86 3.73 3.94 3.96 3.79 4.02
Ability to connect with other sailings (based on those connecting) 3.24 3.12 3.42 2.93 2.97 3.06 3.64 3.53 3.18 3.94
Ferry departing on time 3.89 3.98 4.19 3.54 4.07 3.64 3.78 3.86 3.85 3.69
Safety
Safety of ferry operations 4.17 4.18 4.24 4.05 4.21 4.10 4.18 4.19 4.16 4.18
Safety of loading/unloading 4.18 4.19 4.26 4.07 4.21 4.12 4.19 4.21 4.19 4.18
OVERALL VALUE
Value for money of fares 2.94 2.96 3.05 2.82 2.91 2.87 2.95 3.04 2.98 2.90
July 31, 2013 2012/13 Annual Report to the British Columbia Ferries Commissioner Page 71
Mustel Group - Page 30

BC Ferries Customer Satisfaction Tracking
Mustel Group ___________________________________________________________________________________________________ Page 31
TERMINAL ATTRIBUTES ONLY - Satisfaction Ratings by Terminal - All Waves 2012 -
Terminals
Total
Tsawwassen
Swartz Bay
Horseshoe Bay
Departure Bay
Langdale
Duke Point
OVERALL EXPERIENCE
Trip overall 4.19 4.29 4.32 4.08 4.07 4.13 4.15
TERMINAL EXPERIENCE
Terminal overall 4.08 4.17 4.16 3.96 4.12 3.86 4.13
Outside appearance of the terminal 4.03 4.12 4.07 3.93 4.20 3.68 4.12
Ticket Purchase
Efficiency of the transaction 4.42 4.50 4.53 4.33 4.38 4.22 4.41
Staff courtesy 4.44 4.48 4.48 4.35 4.45 4.36 4.41
Clarity of staff directions 4.38 4.48 4.47 4.26 4.39 4.20 4.36
Food & Beverage Services at the Terminal
Food beverages offered 3.59 3.78 3.60 3.42 3.60 3.45 3.53
Value for money 2.98 3.11 3.06 2.79 2.97 2.84 2.90
Gift Shop/ News Stand at the Terminal
Variety/ selection of merchandise 3.87 3.97 3.85 3.88 3.88 3.94 3.69
Value for money 3.40 3.51 3.41 3.30 3.38 3.52 3.22
Outdoor Market Area at the Terminal
Variety/ selection of merchandise 3.57 3.85 3.66 3.28 3.57 3.24 3.51
Value for money 3.30 3.56 3.33 3.00 3.27 3.16 3.18
Other Terminal Services
Clarity of Public address system 3.55 3.62 3.61 3.43 3.55 3.47 3.86
Announcements when you need to be informed 3.74 3.82 3.84 3.62 3.66 3.71 3.96
Overall look & décor inside terminal 3.86 3.94 3.89 3.76 4.04 3.53 3.90
Usefulness of TV info screens 3.71 3.76 3.80 3.57 3.73 3.45 3.99
Availability of washrooms 4.07 4.10 4.17 3.98 4.13 3.89 4.19
Cleanliness of washrooms 4.00 4.04 4.10 3.82 3.98 3.92 4.16
Procedures for loading 4.06 4.13 4.16 3.90 4.02 4.01 4.21
Professionalism of terminal staff 4.17 4.21 4.25 4.05 4.11 4.07 4.24
Foot Passenger Services at the Terminal
Availability of parking spaces 3.67 3.98 3.79 3.48 3.65 4.11 4.13
Parking value for money 2.86 2.90 2.63 2.55 2.78 3.72 2.86
Ease of using passenger drop-off/ pick-up area 3.88 4.07 3.89 3.71 3.94 4.04 4.33
Availability of seating in pre-boarding lounge at terminal 3.72 3.68 3.70 3.60 3.98 3.60 4.02
Comfort of seating in pre-boarding lounge at terminal 3.67 3.64 3.77 3.64 3.81 3.45 3.93
Cleanliness of pre-boarding lounge 4.02 4.02 4.03 3.86 4.15 3.94 4.44
OVERALL VALUE
Value for money of fares 2.94 2.98 3.08 2.86 2.83 2.82 2.90
July 31, 2013 2012/13 Annual Report to the British Columbia Ferries Commissioner Page 72
Mustel Group - Page 31

BC Ferries Customer Satisfaction Tracking
Mustel Group ___________________________________________________________________________________________________ Page 32
Research Methodology
Background
British Columbia Ferry Services Inc. (BC Ferries) has commissioned tracking research to gauge customer satisfaction on specific BC Ferries Routes to determine and monitor areas of service that patrons believe are performing favourably and areas requiring improvement. Ultimately, this research will contribute to product and service enhancements for an improved service for BC Ferries travellers.
Project Overview
The 2003 Customer Satisfaction Tracking Study acted as a baseline for the newly formed B.C. Ferry Services Inc. and was designed to track performance on satisfaction levels overall and with specific service attributes. Once a year, the annual satisfaction scores will be published on the BC Ferries web site as required by the Coastal Ferry Services Contract. The study is designed to provide input to the Corporate Strategic Plan and to regular service and marketing plans.
Research Objectives
The specific objectives are as follows:
• Determine BC Ferries’ customers’ satisfaction levels overall with BC Ferries’ service,
• Determine satisfaction with the specific attributes of the service,
• Uncover the relative importance of attributes,
• Measure satisfaction with attributes that span the entire range of points of customer contact with BC Ferries,
• Track changes in satisfaction over time, and across customer segments,
• Identify the critical improvements to the current service offering that will have the greatest impact on customer satisfaction,
• Ensure the tracking research is relevant and credible enough to pass internal and external scrutiny.
July 31, 2013 2012/13 Annual Report to the British Columbia Ferries Commissioner Page 73
Mustel Group - Page 32

BC Ferries Customer Satisfaction Tracking
Mustel Group ___________________________________________________________________________________________________ Page 33
Quantitative Tracking Research
First, a random sample of passengers was intercepted onboard to collect key “screener” data including frequency of travel on BC Ferries, purpose of trip, area of residence, origin/destination, and standard demographic questions. Each questionnaire also included coding of the route, the departure time, location of interview, the vessel name and any other information of value for analysis. This information was collected in the form of a “batch header”, which was attached to all the “screeners” completed on each sailing. Immediately following this “screener”, passengers are given a longer follow‐up survey to complete after they disembark and leave the terminal area. The completed survey is returned in a postage pre‐paid envelope. Respondents are instructed to complete the survey within 48 hours of receiving it to ensure top‐of‐mind experiences are recorded. This self‐administered portion of the survey was designed to capture satisfaction and usage information from all potential points of contact for the last trip—from initial information requests, access to terminal, and ticket sales, to onboard, disembarking and post‐travel experience. It included:
• an overall satisfaction measure • service/facility attribute satisfaction ratings • expenditure data • problems encountered and responsiveness of personnel in resolving problems • suggested changes or additions that would enhance the experience
The survey instrument was designed in full consultation with BC Ferries.
July 31, 2013 2012/13 Annual Report to the British Columbia Ferries Commissioner Page 74
Mustel Group - Page 33
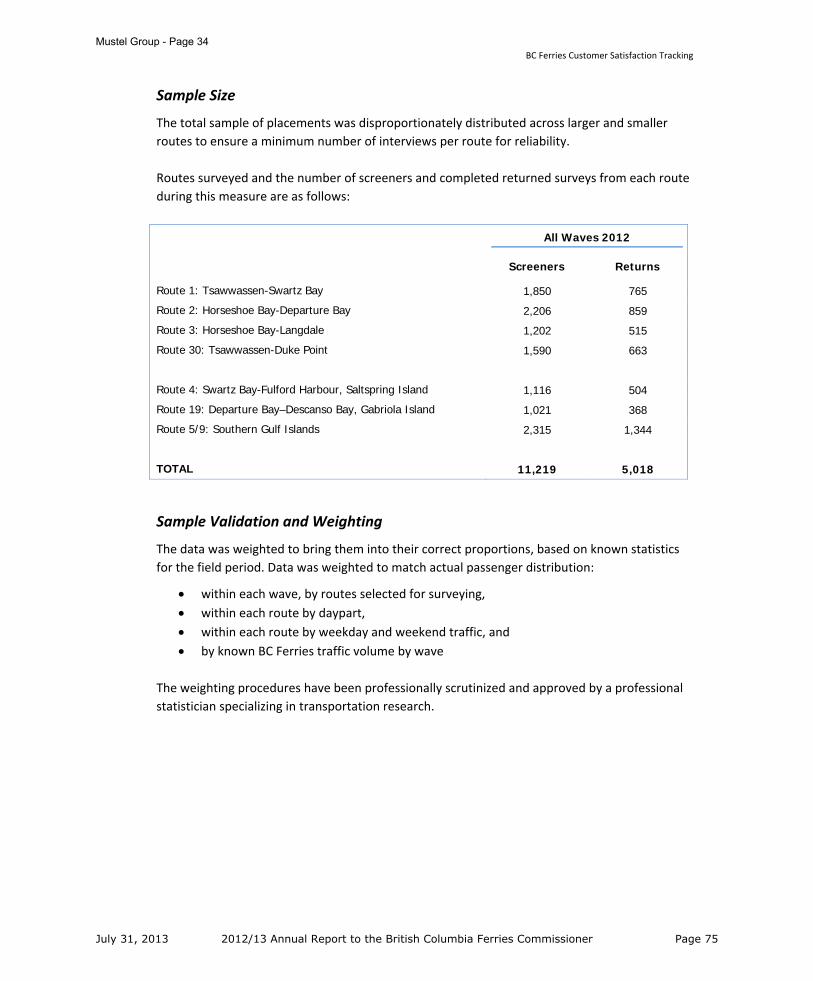
BC Ferries Customer Satisfaction Tracking
Mustel Group ___________________________________________________________________________________________________ Page 34
Sample Size
The total sample of placements was disproportionately distributed across larger and smaller routes to ensure a minimum number of interviews per route for reliability. Routes surveyed and the number of screeners and completed returned surveys from each route during this measure are as follows:
All Waves 2012
Screeners Returns
Route 1: Tsawwassen-Swartz Bay 1,850 765
Route 2: Horseshoe Bay-Departure Bay 2,206 859
Route 3: Horseshoe Bay-Langdale 1,202 515
Route 30: Tsawwassen-Duke Point 1,590 663
Route 4: Swartz Bay-Fulford Harbour, Saltspring Island 1,116 504
Route 19: Departure Bay–Descanso Bay, Gabriola Island 1,021 368
Route 5/9: Southern Gulf Islands 2,315 1,344
TOTAL 11,219 5,018
Sample Validation and Weighting
The data was weighted to bring them into their correct proportions, based on known statistics for the field period. Data was weighted to match actual passenger distribution:
• within each wave, by routes selected for surveying, • within each route by daypart, • within each route by weekday and weekend traffic, and • by known BC Ferries traffic volume by wave
The weighting procedures have been professionally scrutinized and approved by a professional statistician specializing in transportation research.
July 31, 2013 2012/13 Annual Report to the British Columbia Ferries Commissioner Page 75
Mustel Group - Page 34

BC Ferries Customer Satisfaction Tracking
Mustel Group ___________________________________________________________________________________________________ Page 35
The table following outlines the actual and weighted distributions of the sample.
Actual & Weighted Distribution of the Sample
–All Waves 2012 –
Screeners Returns
Actual (11,219)
%
Weighted (11,219)
%
Actual (5,018)
%
Weighted (5,018)
% Weekend Route:
1 6 13 5 13
2 6 8 6 7
3 3 6 3 6
30 4 3 4 3
4 3 1 3 1
19 3 1 2 1
5/9 7 2 9 2
Weekday Route:
1 11 23 10 24
2 14 15 12 13
3 8 11 7 12
30 10 7 9 7
4 7 3 7 3
19 6 4 5 4
5/9 14 4 18 6
July 31, 2013 2012/13 Annual Report to the British Columbia Ferries Commissioner Page 76
Mustel Group - Page 35

BC Ferries Customer Satisfaction Tracking
Mustel Group ___________________________________________________________________________________________________ Page 36
Data Collection
The interviewers for this study were personal intercept staff who have completed rigorous training and are experienced with general public studies as well as business‐to‐business studies. A detailed briefing of interviewing staff was attended by the field director, supervisory staff and the project director. So that a proper representation of ferry travellers was interviewed, interviewers were trained in the following techniques and randomization procedures, which were strictly adhered to:
• Passengers were approached as soon as they were seated and where necessary, minimum age verified (18 years and over).
• An interview with every 5th person was attempted.
• Passengers in small as well as large groups were approached; respondents were instructed to complete the survey individually, not as a group.
• All areas of the vessel were covered ‐ cafeteria, snack bar, all lounge areas, outer decks and vehicle; interviewers moved to each of these areas every 15 minutes on major routes and every 5 minutes on minor routes.
• Both foot and vehicle passengers were approached.
• Where possible, and to correct for inherent bias of foot to vehicle passengers (foot passengers are first on and last off), interviewing was conducted on parking decks with vehicle passengers after the announcement signaling arrival to port
• Interviewers were instructed not to accommodate patrons requesting a survey; however, if individuals were persistent a specially marked copy was provided allowing for its removal from the total.
Data Analysis
Senior coding staff was briefed on relevant information and nuances. Categories for open‐end responses were developed under the guidance of the senior researcher and verification was performed by the coding supervisor. The data entry system used for this study includes an internal edit, which is custom programmed. This immediate verification during the data entry process reduces entry errors and a further more detailed computer edit is performed after entry of the data. For standard cross‐tabulations, software designed expressly for marketing research was employed. Special editing and cleaning features of this database package ensure that the records are data entered and coded with accuracy. Further rigorous checks for inherent logic and consistency were performed prior to data tabulation.
July 31, 2013 2012/13 Annual Report to the British Columbia Ferries Commissioner Page 77
Mustel Group - Page 36

BC Ferries Customer Satisfaction Tracking
Mustel Group ___________________________________________________________________________________________________ Page 37
Response Rate
The following outlines the response rates achieved in the June 2012 measure.
Response Rates
All Waves '12
Route 1 41 Route 2 39 Route 3 43 Route 30 44 Route 4 45 Route 19 36 Route 5/9 58
Overall response 45
Overall, the tolerance limits for this measure at the 95% level of confidence, based on the most conservative case (i.e., a statistic of 50%) are as follows:
Tolerance Limits –All Waves 2012
Actual Sample Size
Approximate Tolerance Limits
% Points
Total Screeners 11,219 +/- .9
Total Returns 5,018 +/- 1.4
Individual Route Returns
Route 1 765 +/- 3.5
Route 2 859 +/- 3.3
Route 3 515 +/- 4.3
Route 30 663 +/- 3.8
Route 4 504 +/- 4.4
Route 19 368 +/- 5.1
Route 5/9 1,344 +/- 2.7
July 31, 2013 2012/13 Annual Report to the British Columbia Ferries Commissioner Page 78
Mustel Group - Page 37

Complaints Resolution Report
Year Ended March 31, 2013

Complaints Resolution ReportFiscal 2012/2013
July 31, 2013 2012/13 Annual Report to the British Columbia Ferries Commissioner Page 80

• During the 2012/13 fiscal year 19.9 million customers travelled with BC Ferries.– BC Ferries received 8,234 comments in 2012/13
• Customer initiated feedback tends to be negative. Thirteen percent (13%) of all customer feedback received in 2012/13 was complimentary.
• “On the Web” was the top issue: 1,141 complaints* were made, representing 13.9%of the total comments received in 2012/13.
– Top 5 complaints combined represent 38% of all complaints received in 2012/13
• “General” comments are excluded from this analysis:– 922 “General” comments were received which were primarily made up of suggestions (351)
and company information (255)
19%44%
22%5% 8%
Bad Poor OK Good Excellent
Distribution of Comments by Rating
Feedback Summary
ComplimentsNeutral
2
Complaints
*Complaints = “bad” or “poor” rating accompanied by a commentNote: 2012/13 = April 1, 2012 to March 31, 2013
July 31, 2013 2012/13 Annual Report to the British Columbia Ferries Commissioner Page 81

13.9%
10.0%
6.1%4.3% 3.7%
18.5%
9.4%
5.8%
3.0% 3.7%
On the Web Value For Fares/Cards Staff Helpfulness Food and Retail Services Reservations
% of Comments
2012/13 2011/12
Top Complaints*: Corporate
3
# Complaint2012/13 2011/12
Complaints* % of Comments (n=8,234) Complaints* % of Comments (n=9,005)
1 On the Web 1,141 13.9% 1,665 18.5%
2 Value For Fares/Cards 827 10.0% 844 9.4%
3 Staff Helpfulness 499 6.1% 524 5.8%
4 Food and Retail Services 356 4.3% 271 3.0%
5 Reservations 303 3.7% 329 3.7%
↓4.6% ↑0.6% ↑0.3% ↑1.3%
*Complaints = “bad” or “poor” rating accompanied by a commentNote: 2012/13 = April 1, 2012 to March 31, 2013
2011/12 = April 1, 2011 to March 31, 2012
0.0%
July 31, 2013 2012/13 Annual Report to the British Columbia Ferries Commissioner Page 82

On The WebOn the Web includes:
0
50
100
150
200
250
300
350
400
Apr May Jun Jul Aug Sep Oct Nov Dec Jan Feb Mar
Compliments
Neutral
Complaints
Group/Attribute Complaints Neutral Compliments
On the Web: Login/Passwords 586 115 12
On the Web: Design and Usability 287 24 4
Reservations: Online Reservations 114 6 3
On the Web: Service Notices 64 25 3
On the Web: Information/General 42 37 26
On the Web: Travel Planning 23 9 3
On the Web: Current Conditions 21 4 15
On the Web: Online Giftshop 4 13 8
% of all comments (8,234) 13.9% 2.8% 0.9%
Sample of Customer Comments:Complaints
– “I tried numerous times today to use the online reservations tab on your web site but every time I selected to show availability the web page locked up and I had to close out and log back in. I finally found a link on your home page that allowed me to book but honestly if there was another option for me I would not have booked with BC Ferries because of the extra 45 minutes it took me to complete this task. I’m sure others are having the same issue.”
– “I am no longer able to access my Experience Card. I get a message that I need to enable cookies but I have a) made www.bcferries.com “save” and to allow cookies at all times, b) temporarily reduced my security settings so that cookies are allowed. Neither of these have worked. Any suggestions? I am using the newest version of Internet Explorer.”
Compliments– “It was a delay for the Lions Gate due to an accident
that put us behind. You had nothing to do with us missing the ferry. Your website and tweets were great.”
– “Kudos to @BCFerries for getting us home last night through some nasty weather! And for such a great twitter feed.”
4*Complaints = “bad” or “poor” rating accompanied by a commentNote: 2012/13 = April 1, 2012 to March 31, 2013
July 31, 2013 2012/13 Annual Report to the British Columbia Ferries Commissioner Page 83

On the Web
Root Cause:
Lessons Learned:
Action Taken:
On May 12, 2011, BC Ferries launched a comprehensive redesign of its website. This included the introduction of a single online reservation channel to replace the two unique channels that had been in place since August 2008. The intention of consolidating the two reservation channels was to remove problems encountered by customers when trying to use a password for one channel to access the other.
Implementing the single access online reservation service proved to be a highly complex undertaking, particularly in terms of aligning customer accounts associated with the ten-year-old Reserved Boarding on the Internet (RBI) service. There were also a number of performance and account validation issues that did not emerge during the testing conducted, nor with external customer focus groups and staff.
Since the May 2011 launch, a number of releases and “spot fixes” were implemented with varying degrees of success. The ultimate answer, arrived at following extensive technical review and heuristic evaluation, was to change the overall design and user workflow of the online reservation system and update the server infrastructure of the website as a whole.
Both initiatives were completed successfully on April 30, 2013, with the launch of a more efficient and intuitive website experience.
5
July 31, 2013 2012/13 Annual Report to the British Columbia Ferries Commissioner Page 84

Value For Fares/CardsValue For Fares/Cards includes:
0
50
100
150
200
250
300
Apr May Jun Jul Aug Sep Oct Nov Dec Jan Feb Mar
Compliments
Neutral
Complaints
Group/Attribute Complaints Neutral Compliments
Fares: Value for Fares Paid 268 24 16
Fares: Experience Card 114 89 11
Fares: Discount Fares 110 71 8
Fares: Other Fares 106 89 21
Fares: Coast Card 74 109 8
Fares: Errors 48 20 0
Fares: Refunds 34 74 4
Fares: Promotions 32 25 20
Fares: Credit/Debit Card 20 4 2
Fares: Frequent Travel 17 11 2
Fares: SailPass/CirclePac 4 3 0
% of all comments (8,234) 10.9% 6.3% 1.1%
Sample of Customer Comments:Complaints
– “Your continued price increases are criminal. The more you raise your prices, the less people can use your service. Congratulations, I will be relocating to the city from the Sunshine Coast as I can no longer afford your services. Better raise your price again.”
– “I don’t understand why you get to decide how much money we load onto our Experience Cards and why there needs to be a minimum? Obviously we are going to load the correct amount needed onto the card. What if we don’t need to load $105 on the card? This is just another lovely reason why my hate for BC Ferries is growing! Sincerely, Stranded because of ferry costs.”
– “How about some Coast Saver savings? Too costly to use the ferry on a whim, lower the cost, raise the ridership, pretty simple.”
Compliments– “I really appreciate that you no longer have over height
prices from Tsawwassen-Swartz Bay. It makes a difference for me because I travel with a motor home occasionally. Thank you!”
– “I am very thankful that your DSI [Disabled Status Identification] program accepts other documentation instead of having to go through my family physician who charges me for each form that requires filling out. As you can understand, when on disability all of the pennies count.”
6*Complaints = “bad” or “poor” rating accompanied by a commentNote: 2012/13 = April 1, 2012 to March 31, 2013
July 31, 2013 2012/13 Annual Report to the British Columbia Ferries Commissioner Page 85

Value For Fares/Cards
Root Cause:
Lessons Learned:
On June 2, 2011, the Coastal Ferry Amendment Act (Bill 14) was enacted. Among other things, Bill 14 established a price cap for the first year of the Performance Term Three (PT3) with an increase for each route group on April 1, 2012 of 4.15% from the weighted average of the tariffs payable as at March 31, 2012. BC Ferries implemented tariff increases April 1, 2012 to the new levels authorized. The April 1, 2012, price cap and tariff increases were moderated by incremental funding provided from the Province. On September 30, 2012, the British Columbia Ferries Commissioner (Commissioner) issued Order 12-02 which established the price cap increases for the remainder of PT3: 4.1% at April 1, 2013; 4.0% at April 1, 2014; and 3.9% at April 1, 2015. BC Ferries implemented tariff increases April 1, 2013 to the new levels authorized.
Overall, the price cap increases reflect the capital investment in ships, terminals, and Information Technology BC Ferries has had to make. It also reflects significant increases in operating costs related to items outside the control of the Company. This includes an approximate 260% increase in fuel costs since 2003, as well as significant increases in insurance premiums, property taxes, utilities, benefits program rates, contractual labor costs, and regulated labor requirements. The rigidity of the current structure of the Coastal Ferry Service Contract (CFSC) with the Province has also contributed to the level of the price caps and tariffs experienced.
Minimum buy-in level for Experience™ Card discount: The option of pre-purchasing fares in order to gain access to discounted fares was established in conjunction with the commuter route designation in place since 1961 for all Gulf Islands and since 1972 for the Sunshine Coast. While the Experience Card™ replaced the pre-paid paper books of 5 or 10 ferry tickets in 2008, the principle of pre-purchasing fares for discounted travel remained intact with the added benefit of the Experience™ Card being applicable to all routes with commuter discounts. In addition, the Experience™ Card provides registered customers with loss protection, which was not available with the pre-paid paper books. The minimum buy-in level generally increases with the annual price cap adjustment, and is established at a minimum to cover two round trips for car and driver on any route which has an Experience™ Card discount. The logic for this is simply that the card is intended for frequent users, and two round trips is the most basic level of 'frequent'.
There is anecdotal evidence that the increase in fares has caused customers to limit discretionary travel. A report provided by InterVISTAS Consulting Inc., acknowledges some minor price elasticity, but notes that there are other causal factors affecting ridership.
7
July 31, 2013 2012/13 Annual Report to the British Columbia Ferries Commissioner Page 86

• A CoastSaver Fares promotion was offered on the Tsawwassen – Swartz Bay, Tsawwassen – Duke Point and Horseshoe Bay – Departure Bay routes, Friday through Monday from May 25 - June 25, 2012.
• Effective July 20, 2012 the fuel surcharge was reduced and as per November 20, 2012 BC Ferries was in a position to eliminate the fuel surcharge altogether.
• For the introduction of British Columbia’s new Family Day long weekend, BC Ferries offered free travel for all children 11 years of age and under from Friday, February 8, 2013 through to Monday, February 11, 2013.
• BC Ferries is continuing to grow the non-tariff revenue through catering, retail, drop trailer business and vacation packages, generating revenue that can be re-invested into the company to help keep fares down.
• BC Ferries has continued its aggressive cost containment program with the result that in 2012/13, operating expenses, excluding fuel costs, were $27.2 million below previously planned levels as outlined in BC Ferries’published business plan for the year.
• On January 24, 2012, the British Columbia Ferries Commissioner issued his report to the British Columbia Minister of Transportation and Infrastructure as to how the Coastal Ferry Act could be amended to balance the interest of ferry users with the financial sustainability of BC Ferries. The report makes 24 substantive recommendations covering a wide range of ferry related issues. In May 2012, the Province responded to the Commissioner’s recommendations, enacting the Coastal Ferry Amendment Act 2012 (Bill 47). On May 9, 2012, the Province announced the introduction of amendments to the Act, as well as payment of $25.0 million relating to 2011/12 and a further $54.5 million over the following four fiscal years to reduce the pressure for higher fares. As well, government announced its intention to make adjustments to service levels, and to do so within the context of discussions with communities about trade-offs among service adjustments, fare increases and potential community contributions. The Province solicited public input to develop strategies to support a vision for connecting coastal communities. BC Ferries provided technical assistance and subject matter support through the process. The process concluded in December 2012 and in March 2013, the Province released its report summarizing the public input it received.
• Amendments to the CFSC, which took effect April 1,2012, included target net savings of $30 million from service level adjustments over PT3. Savings of $4 million will be realized through service level adjustments on three of the major routes. Adjustments in service levels to realize the remaining $26 million in savings were to be identified by June 30, 2013. Through a subsequent amendment to the CFSC the deadline for identifying the additional service level adjustments was extended to March 31, 2014. Funding of $7.1 million was received from the Province to compensate BC Ferries for this deferral. Ferry service levels are a public policy decision of the Province and the Company will await direction from the government regarding future adjustments to service levels to achieve the remaining $18.9 million in net savings, and the resulting impact on fares.
Action Taken:
Value For Fares/Cards
8
July 31, 2013 2012/13 Annual Report to the British Columbia Ferries Commissioner Page 87

Staff HelpfulnessSample of Customer Comments:Complaints
– “I was travelling with my baby and I asked a ferry worker on the ship to help me and they advised me they couldn’t and to give them a minute. Upon waiting for 5 minutes and watching them text I walked away in frustration without any help.”
– “The cashier from Victoria to Salt Spring was very rude and unhelpful. We didn't know that we had to buy a "pass" to get our connecting ferry and she charged us another $54 after already paying $100 for our previous ferry. Very frustrating!!!”
– “Clerk at check in was on phone. Didn't assist me. Told me sailing had closed yet I had made 10 min cut off. I requested I walk on once cars loaded, employee refused again.”
Compliments– “We wish to express our thanks and praise for a recent
trip on BC Ferries. The voyage was on the MV Klitsa and the crew did an excellent job in customer service and made everyone feel welcome aboard!”
– “Today on the Powell River – Comox run I locked keys in van. The great staff made my day with a little help. Great crew! Big thanks!”
Staff Helpfulness includes:
020406080
100120140160180200
Apr May Jun Jul Aug Sep Oct Nov Dec Jan Feb Mar
Compliments
Neutral
Complaints
Group/Attribute Complaints Neutral Compliments
Check-In: Staff Helpfulness 194 8 44
Inside the Terminal: Staff Helpfulness 148 13 103
On the Ship: Staff Helpfulness 106 12 163
Outside the Terminal: Staff Helpfulness
20 1 3
On the Phone: Information Accuracy 19 3 0
On the Phone: Agent Helpfulness 9 3 27
On the Phone: Resolution of Issues 3 2 1
% of all comments (8,234) 6.1% 0.5% 4.1%
9*Complaints = “bad” or “poor” rating accompanied by a commentNote: 2012/13 = April 1, 2012 to March 31, 2013
July 31, 2013 2012/13 Annual Report to the British Columbia Ferries Commissioner Page 88
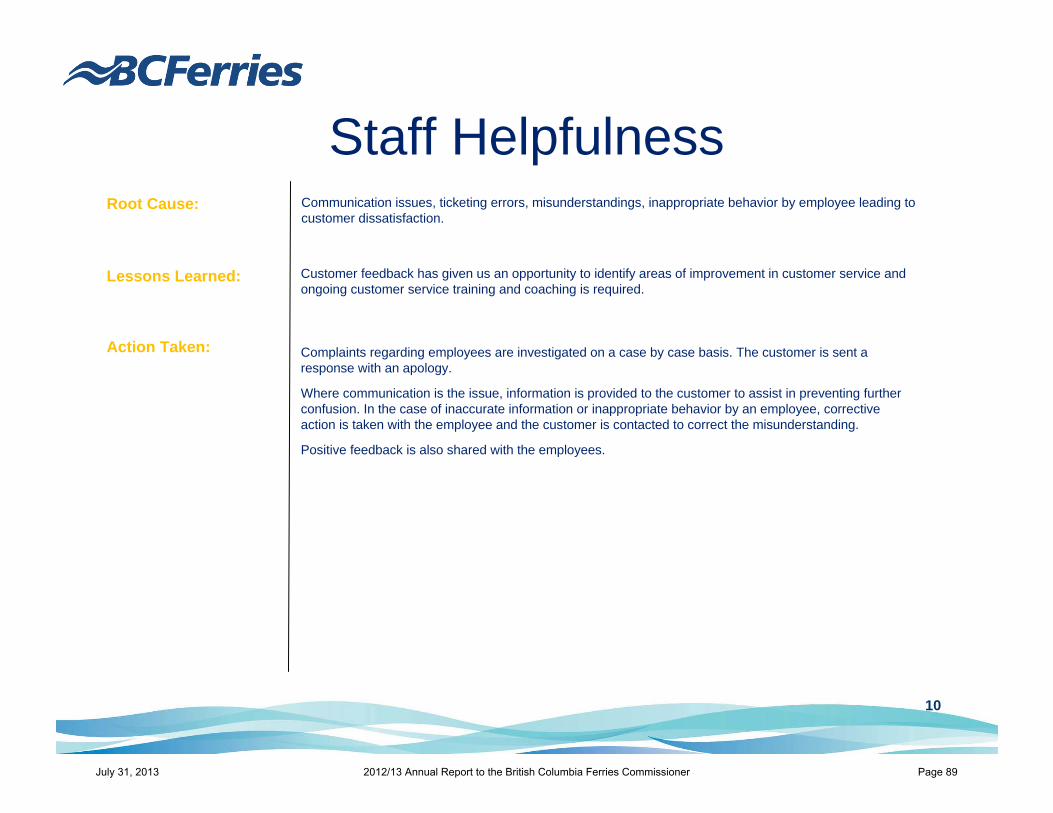
Staff HelpfulnessRoot Cause:
Lessons Learned:
Action Taken:
Communication issues, ticketing errors, misunderstandings, inappropriate behavior by employee leading to customer dissatisfaction.
Customer feedback has given us an opportunity to identify areas of improvement in customer service and ongoing customer service training and coaching is required.
Complaints regarding employees are investigated on a case by case basis. The customer is sent a response with an apology.
Where communication is the issue, information is provided to the customer to assist in preventing further confusion. In the case of inaccurate information or inappropriate behavior by an employee, corrective action is taken with the employee and the customer is contacted to correct the misunderstanding.
Positive feedback is also shared with the employees.
10
July 31, 2013 2012/13 Annual Report to the British Columbia Ferries Commissioner Page 89

Food and Retail ServicesGroup/Attribute Complaints Neutral Compliments
On the Ship: Amenities 163 80 21
Food and Retail Services: Food Selection/Quality
87 34 26
Food and Retail Services: Food Value 30 2 1
Food and Retail Services: Staff Helpfulness
28 2 16
Food and Retail Services: Lounge/Buffet/Coffee Bar
17 11 9
Food and Retail Services: Retail Value 15 20 3
Food and Retail Services: Retail Selection
13 103 57
Food and Retail Services: Online Giftshop
3 34 3
% of all comments (8,234) 4.3% 3.5% 1.7%
Sample of Customer Comments:Complaints
– “Can’t imagine experiencing pirates in coastal waters? Try buying lunch on BC Ferries. $16 for frozen and fried!”
– “We travel to Nanaimo and back to Horseshoe Bay fairly regularly. Often it is during meal time. The menu is very limited and it would be good to see a regular or daily special or variation from the same old same old.”
– “Why are Skype and UTube blocked? There are technical tutorials I would like to watch while sitting for an hour waiting for the ferry. Thank you.”
Compliments– “Your gluten free burrito is delicious! Also today’s coastal
café service onboard this super busy boat was wonderful!”
– “I was on the 5pm sailing from Tsawwassen to Swartz Bay on March 11/2013. It had been about 10 years since I had been to the Pacific Buffet for a dinner meal but one of my friends had said the food had really changed. I was very impressed. The roast beef was perfect. The Padang prawns were spicy and delicious. The salmon bone free and perfect and the best mashed potatoes. The salad bar and dessert bar looked great but after seeing the main course options, I didn't want to bother with anything else. I've been missing out! Will be back to the PB next week!”
Reservations includes:
11
020406080
100120140160180200
Apr May Jun Jul Aug Sep Oct Nov Dec Jan Feb Mar
Compliments
Neutral
Complaints
*Complaints = “bad” or “poor” rating accompanied by a commentNote: 2012/13 = April 1, 2012 to March 31, 2013
July 31, 2013 2012/13 Annual Report to the British Columbia Ferries Commissioner Page 90

Food and Retail Services
Root Cause:
Lessons Learned:
Action Taken:
Amenities / Wi-Fi:
On July 5, 2010 BC Ferries started the pilot project for a complimentary Wi-Fi service to allow customers to browse the web or check e-mail while travelling with BC Ferries. This service is now available at the Swartz Bay, Tsawwassen, Departure Bay, Horseshoe Bay and Langdale terminals as well as onboard select vessels that travel to and from these terminals.
A standard global filtering service is restricting access to websites tagged as displaying inappropriate content. Furthermore, streaming websites are restricted in order to allow all customers shared access to the limited wireless bandwidth available on our networks for basic web browsing and e-mail usage. To allow streaming media would impact other customer’s ability to use the free resource efficiently.
Customers need to be kept informed of the restrictions that do apply to the free Wi-Fi service to avoid disappointment.
The BC Ferries website provides information about the complimentary Wi-Fi service as well as a list of Frequently Asked Questions to assist customers who encounter difficulties with the service.
12
July 31, 2013 2012/13 Annual Report to the British Columbia Ferries Commissioner Page 91

Food and Retail Services
Root Cause:
Lessons Learned:
Action Taken:
Food Selection/Cost:
Food services onboard BC Ferries are offered within a high cost venue including costs not traditionally required for restaurants such as vessel upkeep, life saving equipment, crew training in emergency evacuation, etc. Therefore food services onboard are offered at a slightly higher price when compared to fast food venues on land.
Consumer behavior demonstrated loyalty towards favorite menu items and in the past BC Ferries was hesitant to remove such items in favor of new and unproven menu options.
Through customer feedback BC Ferries has recognized that frequent customers are expecting more frequent changes to the menu options.
In order to determine customers’ interest, BC Ferries offered additional White Spot menu items onboard vessels servicing the Departure Bay – Horseshoe Bay route on a trial basis and conducted a survey after completion of the trial. Customer feedback was positive and BC Ferries gradually expanded the popular White Spot menu options onboard vessels servicing the Swartz Bay – Tsawwassen, Departure Bay – Horseshoe Bay and the Duke Point –Tsawwassen routes starting April 17, 2013.
The renewed partnership with White Spot enables BC Ferries to offer greater flexibility to make periodic changes to the menu options in future.
13
July 31, 2013 2012/13 Annual Report to the British Columbia Ferries Commissioner Page 92

Reservation General
020406080
100120140160180200
Apr May Jun Jul Aug Sep Oct Nov Dec Jan Feb Mar
Compliments
Neutral
Complaints
Sample of Customer Comments:Complaints
– “I made a reservation yesterday, then called today in an attempt to change it to 2 hours earlier. You’d like an extra $9 for the change? Brutal! Not only will I not make this change, I WILL NOT make future reservations outside of expected busy times…”
– “Why do I need to be at the terminal 45-60 minutes before the sailing when I have a reservation? If I can be at the terminal 60 minutes before the sailing I do not need a reservation. I want a reservation because I will arrive 15 minutes before a sailing.”
– “I had reservations for the 6:00 pm ferry leaving from Tsawwassen to Swartz Bay and arrived 15 minutes late and the lady at the booth would not accept my reservation. I missed the ferry. The reason for my e-mail is to express tremendous disappointment with which I felt I have been treated.”
Compliments– “I appreciate the option to be able to speak to an agent.”
– “I made a reservation to travel from Tsawwassen –Village Bay to pick up my father who had had a motorcycle accident. It turned out that he had to come back earlier to go to the hospital… I phoned back a couple of hours after making the reservation to cancel it. I explained the situation and the staff member was very kind and helpful and cancelled my reservation and then extended his hope that everything would work out…”
Reservation General includes:
14
Group/Attribute Complaints Neutral Compliments
Reservations: Policies 106 14 1
Check-In: Reservations 69 7 4
Reservations: General 32 11 1
Reservations: Flexibility/Changes 30 2 0
Reservations: Cost 27 1 1
Reservations: Availability 20 9 0
Reservations: Booking with an Agent 10 1 5
Reservations: Automated Phone Reservations (IVR)
9 1 0
% of all comments (8,234) 3.7% 0.6% 0.1%
*Complaints = “bad” or “poor” rating accompanied by a commentNote: 2012/13 = April 1, 2012 to March 31, 2013
July 31, 2013 2012/13 Annual Report to the British Columbia Ferries Commissioner Page 93

Reservation GeneralRoot Cause:
Lessons Learned:
Action Taken:
To allow sufficient time for safe loading of vessels, BC Ferries implemented a 30 minute cut-off for reservation redemption at the ticket booth. This reservation cut-off is historic and has been in place for many years.
A fee to change reservations was implemented in December 2007 as an enhancement to the previous strict “no refund / no changes” policy.
Infrequent travellers, booking a reservation, will often overlook the importance of the 30 minute cut-off. Customers who miss the reservation cut-off are often surprised their reservation won’t be honored and they must travel on standby. Customers requiring a change to an existing reservation sometimes express disappointment with the additional cost.
It is imperative that customers are made fully aware of reservation policies at the time of booking to avoid disappointment at the time of travel.
Clear communication is in place via the following channels: reservation terms and conditions, reservation confirmation e-mail, FAQ (Frequently Asked Questions) on the website, through our IVR system, and during the booking process with our Customer Service Agents. Communication through these channels is reviewed annually to ensure the messaging is effective and delivered consistently to customers at the time of booking.
Each complaint made will be investigated to determine if an error on behalf of BC Ferries led to the customer’s dissatisfaction. This includes the possibility of employee not following procedures or customer service agents being unclear about policies at time of booking:
• If an error is identified the reservation fee will be refunded to the customer and corrective training action will be taken with the employee.
• If it is determined that the issue is related to unclear written communication, the collateral material will be reviewed and improved. In this case, the customer will also receive a refund of the reservation/change fee.
• If the policy was clearly communicated at the time of booking and no error has been made, a thorough explanation of the reason for the policy will be provided to create an increased awareness of the complexity of loading a vessel and maintaining on time departures.
With the roll out of the new Express Reservation system on April 30, 2013, improvements have been made on how policy information is displayed online.
15
July 31, 2013 2012/13 Annual Report to the British Columbia Ferries Commissioner Page 94

Part 3
Additional or Alternative Service Providers

July 31, 2013 2012/13 Annual Report to the British Columbia Ferry Commissioner Page 96
Part 3: Additional or Alternative Service Providers
BC Ferries is required by Section 69 of the Act to seek ASPs where so ordered by the Commissioner. When BC Ferries receives such an Order, it must prepare a plan for the Commissioner’s approval, and then report to the Commissioner on the activities it undertook to comply with that Order. During the fiscal year, no Orders were issued by the Commissioner for BC Ferries to seek ASPs.
BC Ferries, however, continuously seeks opportunities to enhance efficiency and productivity in the delivery of coastal ferry services. With that as its continued objective, BC Ferries from time to time tests the market to determine if another operator under sub-contract could provide safe, reliable and high quality service that is more cost-effective. The actions undertaken by BC Ferries in 2012/13 in this area focussed on seeking ASPs for a cable ferry service on route 21 (Buckley Bay to Denman Island).
Route 21 - Cable Ferry
In the last four years, BC Ferries has undertaken extensive review of the feasibility of using cable ferry technology on one of its shortest routes – route 21. Based on the results of this review, the Company believes that a cable ferry on this route is both technically and financially feasible. The design and analysis conducted to date by BC Ferries on the route 21 cable ferry system has included: validation of environmental conditions; hydrodynamic testing of the vessel; cable load analysis and dynamic interaction of the ferry and berths; and the determination of operational criteria, cable specification and safety factors. Regulatory approvals for the cable ferry have been obtained, including approval from the Department of Fisheries and Oceans under the Canadian Environmental Assessment Act and Transport Canada approval under the Navigable Waters Protection Act. Cable ferry technology uses small engines in combination with drive and guide cables to move the vessel. Not only do cable ferries have a lower capital cost than conventional ferries, but a reduction in operating costs would also be expected. Safety, reliability and quality of service will continue to be important considerations throughout the project. The cable ferry is an innovative initiative and is part of the Company’s ongoing efforts to identify and pursue opportunities that have the potential to enhance its cost effectiveness. In May 2012, BC Ferries issued a Request for Proposals (“RFP”) to invite selected potential ASPs, who responded to a Request for Expressions of Interest issued by BC Ferries in November 2011, to provide BC Ferries with a proposal to design, build, operate and maintain a cable ferry system for route 21. The RFP closed in August 2012. The responses did not demonstrate the potential for BC Ferries to realize cost savings from having the route 21 cable ferry system designed, built, operated and maintained by an ASP. Accordingly, the RFP process was terminated in November 2012 without issuance of a contract with an ASP. This marked the conclusion of the alternative service delivery initiative for the cable ferry. BC Ferries is now proceeding with the view that it will itself design and build, operate and maintain the route 21 cable ferry system.