Embed Size (px)
Citation preview

Page 1
British Columbia Solar Market Update 2015
- Final Report -
Prepared for:
BC Hydro
Fortis BC
June 24, 2015
Compass Renewable Energy Consulting Inc.
215 Spadina Ave, Suite 300
Toronto, ON
http://compassenergyconsulting.ca

Page 2
Table of Contents
1. Introduction ............................................................................................................. 4
2. Technology Trends for Solar Electrical Energy ................................................ 4
a. Evolution of Solar Technology ............................................................................ 4
b. Current Solar Technology Options ..................................................................... 5
i. Solar: 100 kW to 1 MW ..................................................................................... 9
ii. Solar: 1 MW to 5 MW .................................................................................... 9
iii. Solar: Over 5 MW ........................................................................................ 10
3. Solar Potential in British Columbia .................................................................. 11
a. Methodology ........................................................................................................ 11
b. Technical and Financial Implications ............................................................... 11
c. Environmental Characteristics and Development Timelines ....................... 11
4. Potential Sites Across the IRP Regions ............................................................ 14
5. Current and Future Cost of Solar System Components ................................ 21
a. Fixed and Tracking PV ....................................................................................... 21
i. Solar Costs: 100 kW to 1 MW ......................................................................... 24
ii. Solar Costs: 1 MW to 5 MW and Solar Costs: Over 5 MW .................... 26
b. Solar Thermal....................................................................................................... 30
6. Conclusions and Considerations for British Columbia ................................ 32
a. Utility-Scale Pricing Forecast for British Columbia ....................................... 32

Page 3
Table of Figures
Figure 1 – Global PV Market Share by Cell Technology 2011 - 2015 (GTM
Research) ........................................................................................................................... 6
Figure 2 - Global Cumulative Installed Capacity and Growth Rate of Solar PV
(IEA) ................................................................................................................................... 7
Figure 3 - Primary Solar Thermal Technologies (IEA) ............................................... 8
Figure 4 - Global Cumulative Installed Capacity and Growth Rate of CSP (IEA) . 9
Figure 5 - Stages in Environmental Assessment Process (Province of BC) ........... 12
Figure 6 - Development Timeline for Large-Scale Solar Project in Ontario
(CanSIA) .......................................................................................................................... 13
Figure 7 - BC Solar Potential (NRCan Cartes PV Maps) .......................................... 14
Figure 8 - Sites for Analysis of Solar Potential ........................................................... 18
Figure 9 – BC Hydro Transmission Planning Regions ............................................. 19
Figure 10 - Fortis BC Service Area ............................................................................... 20
Figure 11 - Utility Scale and Rooftop PV System Cost Projections (IEA) .............. 21
Figure 12 - U.S. PV System Prices over Time (Sunshot, USD) ................................ 22
Figure 13 - Regional Price Variation for a Chinese Tier 1 Module in Q4 2014
(GTM Research, USD) ................................................................................................... 23
Figure 14 - Expected Chinese c-Si Module Cost and Key Drivers (GTM Research,
USD) ................................................................................................................................. 24
Figure 15 - Recent Analyst Estimates (2012-2013) and Projections (2014-2016) of
Global Average Distributed System Price (Sunshot based on Various Sources,
USD) ................................................................................................................................. 25
Figure 16 - Reported Price of U.S. Utility-scale PV Projects over Time (Sunshot,
USD) ................................................................................................................................. 27
Figure 17 - Bottom-up Modeled Overnight Capital Cost of U.S. Utility-scale PV
Systems by Size, 2011-2013 (Sunshot, USD) ............................................................... 28
Figure 18 - Recent Analyst Estimates (2012-2013) and Projections (2014-2016) of
Global Average Utility Scale System Price (Sunshot based on Various Sources,
USD) ................................................................................................................................. 28
Figure 19 - Modeled Utility Turnkey Single-Axis Tracking PV System Pricing
With Cost Breakdown (GTM Research, USD) ........................................................... 29
Figure 20 - Solar Thermal Investment Cost Projections (IEA) ................................. 31
Figure 21 - Historical and Projected Component and System Costs (Compass) .. 32
Figure 22 - Projected System and Component Costs in $ CDN (Compass) .......... 33

Page 4
1. Introduction
Compass Renewable Energy Consulting Inc. has prepared this solar market update to
BC Hydro and Fortis BC Inc. to provide a current overview of solar technology and price
and performance expectations in British Columbia.
Compass has been involved in supporting Ontario developers and owners of solar
assets since 2011, and its principals have been involved in the solar industry for over 25
years. Compass has also undertaken US and global market support to clients assessing
conditions in other jurisdictions to guide investment decisions.
Most market pricing information comes from Ontario and US experience, however the
prevalence of solar developers operating globally means that the experience and
commodity costs of solar components is transferable to most Canadian jurisdictions.
Two types of cost data are used in this report. First, reported data is recorded as of the
date it was obtained and second, modeled or bottom-up data is derived from price
quotes or bids. There is far more data available from the U.S., and most research reports
are provided in USD. Some Ontario-specific experience and costing in CDN has been
considered in drawing conclusions and considerations for British Columbia.
2. Technology Trends for Solar Electrical Energy
a. Evolution of Solar Technology
Since 2009, market prices for solar photovoltaic (PV) panels or modules have dropped
five-fold, with system prices dropping three-fold. PV systems are being built on scales of
a few kW to hundreds of MWs. Solar power makes up 5.3% of German electrical
consumption, 7% of Italian consumption, and over 3% in five other European countries
in 2013. Total installed capacity has risen from 23 GW in 2009 to 135 GW at the end of
2013. Annual installed capacity has jumped from 7 GW to 37 GW in the same time.
Crystalline silicon (c-Si) modules have a ~90% share of the total solar PV market. Thin-
film modules comprise 10% of the market, and concentrating PV less than 1%.1 Thin-film
1 International Energy Agency, Technology Roadmap – Solar Photovoltaic Energy 2014 Edition
http://www.iea.org/publications/freepublications/publication/TechnologyRoadmapSolarPhotovol
taicEnergy_2014edition.pdf

Page 5
and non-crystalline technologies (CdTe, CIGS, a-Si etc.) had been expected to gain
market share, but instead their share has shrunk by 5% since 2009.
Compared to photovoltaic solar technologies, Concentrating Solar (thermal) Power
(CSP) uses the sun to heat a working fluid whose heat is then generally used to drive a
steam turbine. As such, it provides all necessary ancillary services and has an ability to
store thermal energy – thus reducing the potential for intermittence. CSP deployment
has been much slower than expected since 2009.2 The focus of this report will be on solar
PV. As will be seen, it is more appropriate than CSP for deployment in British Columbia.
b. Current Solar Technology Options
Solar PV systems use semiconductors to generate direct current electricity. Solar cells –
typically silicon – are sliced from larger wafers or ingots, arranged into modules
surrounded by glass on the front and a frame surrounding the module and giving it
structural support. Systems include inverters and balance of system components, which
consist of transformers, wiring, racking and other structural components used for
mounting, and potentially also tracking components and monitoring devices. Thin-film
technologies use materials other than silicon and are typically not made of cells but
rather are photovoltaic material deposited onto a larger module-sized area. Thin-film
modules are often less efficient than crystalline silicon modules – 15% efficiency for
CdTe thin film versus 19-21% for the best c-Si modules, both in 2013.3
2 International Energy Agency, Technology Roadmap – Solar Thermal Electricity 2014 Edition
http://www.iea.org/publications/freepublications/publication/technologyroadmapsolarthermalele
ctricity_2014edition.pdf 3 International Energy Agency, Technology Roadmap – Solar Photovoltaic Energy 2014 Edition
http://www.iea.org/publications/freepublications/publication/TechnologyRoadmapSolarPhotovol
taicEnergy_2014edition.pdf

Page 6
The market share of thin-film and standard c-Si cell technologies has been and is
expected to continue to drop, as more advanced and efficient c-Si technologies are
adopted (see
Figure 1 below).
Figure 1 – Global PV Market Share by Cell Technology 2011 - 2015 (GTM Research)

Page 7
The annual growth rate of global cumulative solar PV installed capacity has grown by
49% on average since 2003 (
Figure 2).4
Figure 2 - Global Cumulative Installed Capacity and Growth Rate of Solar PV (IEA)
Solar thermal systems with storage provide firm, dispatchable energy that can be better
matched to late-afternoon and evening demand peaks, for example. Considering that PV
generation is most productive in the middle of the day, it can be said that PV and CSP
with storage are complementary technologies from a grid perspective. CSP plants or
alternative storage technologies will become more valuable as PV market share
increases.5
The main CSP technologies are Linear Fresnel Reflector (LFR), towers or Central
Receivers, Parabolic Dish (PD) and Parabolic Trough (PT).
4 International Energy Agency, Technology Roadmap – Solar Photovoltaic Energy 2014 Edition
http://www.iea.org/publications/freepublications/publication/TechnologyRoadmapSolarPhotovol
taicEnergy_2014edition.pdf 5 International Energy Agency, Technology Roadmap – Solar Thermal Electricity 2014 Edition
http://www.iea.org/publications/freepublications/publication/technologyroadmapsolarthermalele
ctricity_2014edition.pdf

Page 8
Figure 3 illustrates the operation and setup of these technologies.
Figure 3 - Primary Solar Thermal Technologies (IEA)
CSP generally requires good irradiation and often clear skies, compared to solar PV.6
Direct Normal Irradiance (DNI) is especially important to CSP facilities because thermal
losses and parasitic consumption are nearly constant, regardless of the amount of
sunshine received by the facility. Below a certain level of daily DNI, the net output of the
plant is negligible. DNI is much more affected by clouds than the geographic
distribution of irradiance.
High DNI regions are hot and dry and usually have clear skies. These are usually within
subtropical latitudes from 15° to 40° north or south. Higher elevations also usually have
higher DNI. More equatorial latitudes are too cloudy, and higher latitudes often have
cloudy conditions.7
6 International Energy Agency, Technology Roadmap – Solar Photovoltaic Energy 2014 Edition
http://www.iea.org/publications/freepublications/publication/TechnologyRoadmapSolarPhotovol
taicEnergy_2014edition.pdf 7 International Energy Agency, Technology Roadmap – Solar Photovoltaic Energy 2014 Edition
http://www.iea.org/publications/freepublications/publication/TechnologyRoadmapSolarPhotovol
taicEnergy_2014edition.pdf

Page 9
Global cumulative installed capacity of CSP facilities, and its rate of growth, has been
increasing in recent years (Figure 4)8, however represents only approximately 3% of the
installed capacity of solar technologies.
Figure 4 - Global Cumulative Installed Capacity and Growth Rate of CSP (IEA)
i. Solar: 100 kW to 1 MW
Solar PV installations in this size category are often distribution connected and often
sited near or at the end-use electricity customer. Solar PV projects of this scale can be
procured under British Columbia’s Standing Offer Program.
Due to regulatory and permitting restrictions, solar PV projects of this size are often
mounted on the roofs of buildings. A common solar application for this project size
range is rooftop solar that is typically designed to reduce the site consumption of
electricity by the end use customer. The common technology deployed is c-Si as the
installed capacity on a rooftop is limited by usable rooftop space. Due to the higher
conversion efficiency of c-Si versus thin film, c-Si is the preferred alternative to minimize
the footprint of the solar facility on the rooftop.
8 International Energy Agency, Technology Roadmap – Solar Thermal Electricity 2014 Edition
http://www.iea.org/publications/freepublications/publication/technologyroadmapsolarthermalele
ctricity_2014edition.pdf

Page 10
CSP is not suited to this size category due to the high fixed costs of the concentrator
technologies and the need to off-set these relatively high costs over a larger project size.
ii. Solar: 1 MW to 5 MW
Solar PV projects of this size are not often designed to offset customer demand, and are
at the small end of utility scale projects. They are more common in jurisdictions that
have less available land area for solar farm installations.
Due to interconnection costs, projects in this size category are often distribution
connected onto a feeder or directly into a distribution sub-station.
Depending on the project site, a solar PV project of this size would likely be limited to a
single property, and a 5 MW project would require approximately 27.5 acres of land9.
Projects of this size and cost typically require a long term PPA with a utility for financial
support.
CSP is not suited to this size category due to the high fixed costs of the concentrator
technologies and the need to off-set these relatively high costs over a larger project size.
iii. Solar: Over 5 MW
Solar PV installations in this size category are utility scale and can be sized as large as
hundreds of MW given suitable available land area and grid connection capability.
Utility scale commonly refers to projects in the 5-20 MW range, or greater.
Projects that are 10 MW or greater in this category are often directly connected onto a
transmission circuit, depending on the requirements for generator connections in the
jurisdiction.
Depending on the project size, a solar PV project of this size may be located on a single
property or spanning multiple properties, and would require approximately 5.5 acres of
land per MW10. Projects of this size and cost typically require a long term PPA with a
utility for financial support.
9 NREL Land Use Requirements for Solar Power Plants in the US, June 2013
10 NREL Land Use Requirements for Solar Power Plants in the US, June 2013

Page 11
CSP is most suited to this size category due to the high fixed costs of the concentrator
technologies and the need to off-set these relatively high costs over a larger project size.
The average size of solar thermal systems operational worldwide is ~60 MW, with
parabolic trough the most common technology used. They are thus most common at this
larger scale. There are currently approximately 60 solar thermal facilities in operation
worldwide11
3. Solar Potential in British Columbia
a. Methodology
Two sources of solar irradiation projections were used in assessing and comparing the
solar resource in different parts of British Columbia, NRCan (Cartes PV Maps) and
PVWatts. NRCan’s maps describe a solar system in kWh/kW/a featuring a fixed axis, tilt
equal to the system’s latitude, and azimuth of due South (180 degrees). System
performance in Ontario correlates closely with projections from NRCan Carte. PVWatts
does the same but can also analyze fixed, single and dual axis trackers. Compass found
other sources of solar resource data, and these forecasts are available and will be
validated by actual system performance from projects in British Columbia.
b. Technical and Financial Implications
Various fixed, dual-axis and single-axis tracking systems are available. Dual-axis
trackers are most efficient from a kWh/kW perspective, but also are the most costly and
require the most ongoing maintenance. Fixed systems also generally are less effective at
more Northern latitudes.
Choosing the correct technology for a given project involves a trade-off between system
efficiency (kWh/kW) and overall project economics and cost (LCOE, or $/kWh).
c. Environmental Characteristics and Development Timelines
British Columbia’s Environmental Assessment (EA) Process measures the impact of
major projects, and ensures that projects meet environmental, economic and social
sustainability, heritage and health goals. The concerns of the public, First Nations,
11
Wikipedia, List of Solar Thermal Power Stations, accessed on February 27 2015,
http://en.wikipedia.org/wiki/List_of_solar_thermal_power_stations

Page 12
interested stakeholders and government agencies are considered. There is a 50 MW
threshold for triggering BC’s EA process. The Environmental Assessment Office
manages this process under the Environmental Assessment Act. The process includes:
• Opportunities for the involvement of all interested parties;
• Consultations with First Nations;
• Technical studies to identify and examine potential significant adverse effects;
• Strategies to prevent, or reduce, adverse effects; and
• Development of comprehensive reports summarizing input and findings.
The process can also be displayed as shown in Figure 5 below.
Figure 5 - Stages in Environmental Assessment Process (Province of BC)
CanSIA created a project development timeline (Figure 6) for consideration to the
Ontario government that included a 26 month timeline for environmental approvals,
within an overall 3 – 3.5 year project development timetable. This timeline is Ontario-
specific, and environmental approval process requirements and local community
consultations will affect this timeline.

Page 13
Figure 6 - Development Timeline for Large-Scale Solar Project in Ontario (CanSIA)

Page 14

Page 15
4. Potential Sites Across the IRP Regions
Solar irradiation maps are publically available using historical local weather station
data. Experience in Ontario has shown close correlation with these projections.
Figure 7 below shows the NRCan Cartes PV Map used to find and generate the solar
potential values for these sites.
Figure 7 - BC Solar Potential (NRCan Cartes PV Maps)
Page 16
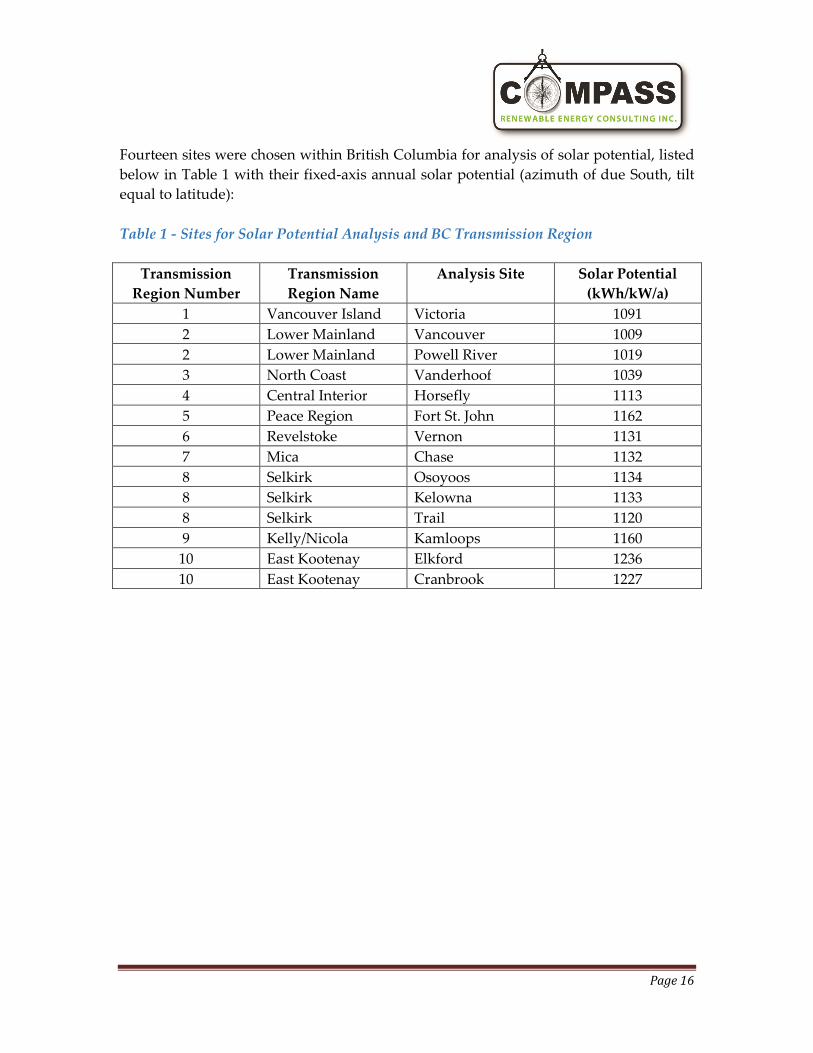
Fourteen sites were chosen within British Columbia for analysis of solar potential, listed
below in Table 1 with their fixed-axis annual solar potential (azimuth of due South, tilt
equal to latitude):
Table 1 - Sites for Solar Potential Analysis and BC Transmission Region
Transmission
Region Number
Transmission
Region Name
Analysis Site Solar Potential
(kWh/kW/a)
1 Vancouver Island Victoria 1091
2 Lower Mainland Vancouver 1009
2 Lower Mainland Powell River 1019
3 North Coast Vanderhoof 1039
4 Central Interior Horsefly 1113
5 Peace Region Fort St. John 1162
6 Revelstoke Vernon 1131
7 Mica Chase 1132
8 Selkirk Osoyoos 1134
8 Selkirk Kelowna 1133
8 Selkirk Trail 1120
9 Kelly/Nicola Kamloops 1160
10 East Kootenay Elkford 1236
10 East Kootenay Cranbrook 1227
Page 17
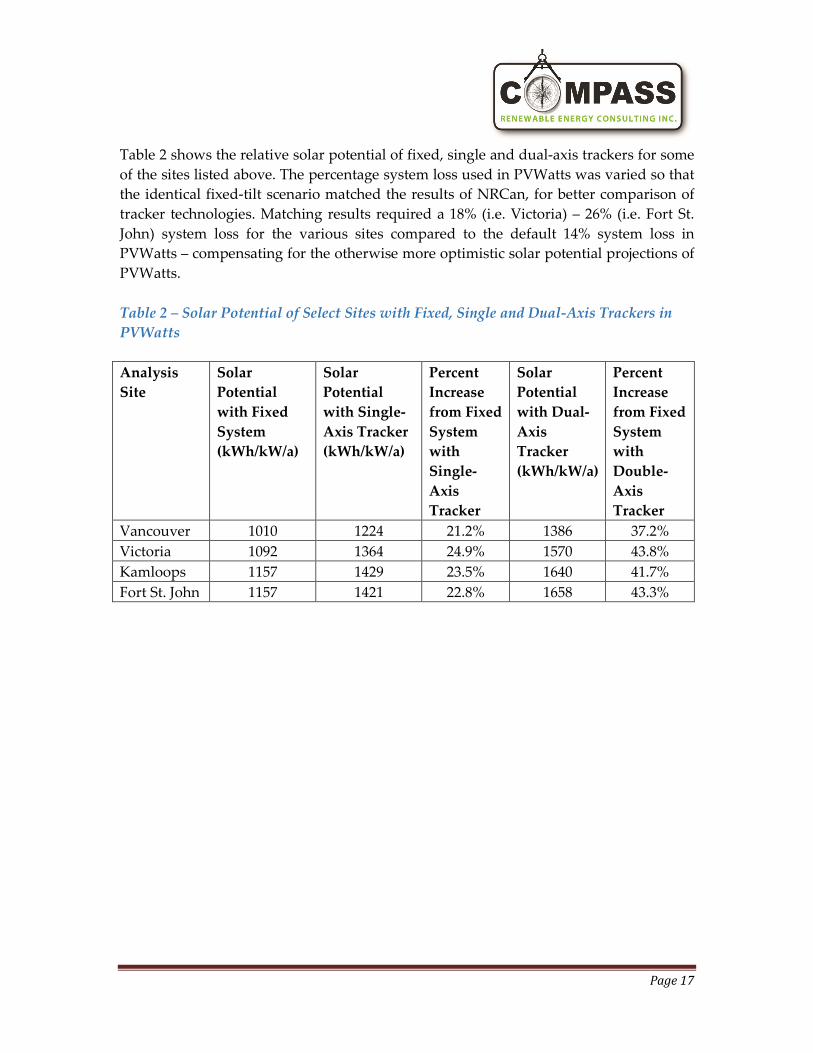
Table 2 shows the relative solar potential of fixed, single and dual-axis trackers for some
of the sites listed above. The percentage system loss used in PVWatts was varied so that
the identical fixed-tilt scenario matched the results of NRCan, for better comparison of
tracker technologies. Matching results required a 18% (i.e. Victoria) – 26% (i.e. Fort St.
John) system loss for the various sites compared to the default 14% system loss in
PVWatts – compensating for the otherwise more optimistic solar potential projections of
PVWatts.
Table 2 – Solar Potential of Select Sites with Fixed, Single and Dual-Axis Trackers in
PVWatts
Analysis
Site
Solar
Potential
with Fixed
System
(kWh/kW/a)
Solar
Potential
with Single-
Axis Tracker
(kWh/kW/a)
Percent
Increase
from Fixed
System
with
Single-
Axis
Tracker
Solar
Potential
with Dual-
Axis
Tracker
(kWh/kW/a)
Percent
Increase
from Fixed
System
with
Double-
Axis
Tracker
Vancouver 1010 1224 21.2% 1386 37.2%
Victoria 1092 1364 24.9% 1570 43.8%
Kamloops 1157 1429 23.5% 1640 41.7%
Fort St. John 1157 1421 22.8% 1658 43.3%

Page 18
Table 3 - Monthly Solar Potential of Select Sites with Fixed Systems inshows the estimated
monthly solar production for the same select four sites with a fixed system.
Table 3 - Monthly Solar Potential of Select Sites with Fixed Systems in NRCan Cartes
(kW/kWh/a)
Month Vancouver Victoria Kamloops Fort St. John
January 41 43 49 59
February 53 57 68 80
March 86 95 111 122
April 99 108 118 128
May 108 118 124 122
June 110 118 122 121
July 123 130 133 121
August 121 128 131 117
September 112 123 119 99
October 75 88 93 84
November 43 47 52 58
December 37 39 40 50

Page 19
The 14 analysis sites are shown in Figure 8 below. These sites were chosen to reflect a
range of different geographies, population size, and solar potential, while at the same
time ensuring a location in each transmission zone.
Figure 8 - Sites for Analysis of Solar Potential

Page 20
Figure 9 below shows a map of BC Hydro’s Transmission Planning Regions, with the 14
sites studied for solar potential marked in red.
Figure 9 – BC Hydro Transmission Planning Regions

Page 21
Figure 10 below shows the Fortis BC service area in more detail, with the 3 sites studied
for solar potential within the service area marked in red.
Figure 10 - Fortis BC Service Area

Page 22
5. Current and Future Cost of Solar System Components
a. Fixed and Tracking PV
Various technologies and processes under development will further lower the cost of
solar PV in the near term. The current path for conventional solar technologies is
improving and continuously reducing in cost. Other new disruptive solar technologies
are unlikely to play a major role in the near term, due to the time lag from innovation to
commercialization. In the long term, the IEA predicts PV systems will be half the cost of
today by 2040 (Figure 11). Utility scale is commonly used to describe systems from 5-20
MW and larger.
Figure 11 - Utility Scale and Rooftop PV System Cost Projections (IEA)
Cost declines have continued in spite of more stabilized module prices; system cost
dropped 10-15% in California in the first half of 2013 with stable module prices. Cells
and modules are an international commodity and vary much less than installed system
costs. This difference can be attributed to soft costs like customer acquisition, permitting,
inspection and interconnection, installation labour and utilization efficiency, and
financing.12 U.S. system costs are expected to continue to drop into the near future (see
Figure 12 below).13
12
International Energy Agency, Technology Roadmap – Solar Photovoltaic Energy 2014 Edition
http://www.iea.org/publications/freepublications/publication/TechnologyRoadmapSolarPhotovol
taicEnergy_2014edition.pdf 13
U.S. Department of Energy, Photovoltaic System Pricing Trends 2014 Edition
http://www.nrel.gov/docs/fy14osti/62558.pdf

Page 23
Figure 12 - U.S. PV System Prices over Time (Sunshot, USD)
Both the system cost and difference in relative production has narrowed between fixed
and single-axis solar PV systems recently.14
14
International Energy Agency, Technology Roadmap – Solar Photovoltaic Energy 2014 Edition
http://www.iea.org/publications/freepublications/publication/TechnologyRoadmapSolarPhotovol
taicEnergy_2014edition.pdf

Page 24
There is a large degree of variability in the regional pricing of modules. For a Tier 1
Chinese c-Si module, prices range from $0.72 in the U.S. to $0.65 in the EU to $0.56 in
Chile (see Figure 13 below). Although modules exhibit commodity pricing in general,
regional and country-specific duties, tariffs, taxes and equipment standards can
contribute to price deviations.
Figure 13 - Regional Price Variation for a Chinese Tier 1 Module in Q4 2014 (GTM
Research, USD)

Page 25
It is expected that the production cost for first-tier Chinese c-Si module manufacturers
will drop from $0.50/W at the end of 2012 to $0.36/W at the end of 2017 (Figure 14).15
Figure 14 - Expected Chinese c-Si Module Cost and Key Drivers (GTM Research, USD)
Solar PV modules are also projected to become more efficient through the adoption of
new high-efficiency c-Si cells, which now have a lower LCOE or $/kWh compared to
simpler c-Si or thin film technologies (see Figure 14).16
i. Solar Costs: 100 kW to 1 MW
The U.S. DOE Sunshot Initiative, looking at work by NREL and LBNL, estimates that
systems quoted in Q4 2013 and installed in 2014 in the U.S. were likely to have been
done at $3.29/W for residential (~5 kW) and $2.54/W for commercial (~200 kW). By
comparison, estimated (partially reported) prices for systems installed in 2013 were
$4.69/W for residential and small commercial (<= 10 kW) and $3.89/W for large
15
Greentech Media, 8 Solar Trends to Follow in 2015, accessed on February 27 2015,
http://www.greentechmedia.com/articles/read/The-Most-Important-Trends-in-Solar-in-8-Charts 16
Greentech Media, Solar PV Module Costs to Fall to 36 Cents per Watt by 2017, accessed on
February 27 2015, http://www.greentechmedia.com/articles/read/solar-pv-module-costs-to-fall-
to-36-cents-per-watt

Page 26
commercial (>100 kW).17 The Sunshot study also found that price reductions for
residential and small commercial systems are increasing, averaging 6-7% per year from
1998-2013, but 12-15% from 2012-2013.
Commercial PV systems vary more significantly than utility scale systems – they can be
more than twice as expensive in the U.S. as in Germany, for example.18
Analysts’ projections for the global average near term price of distributed scale systems
describe a price of $1.50 - $3.00 by 2016 (Figure 15).
Figure 15 - Recent Analyst Estimates (2012-2013) and Projections (2014-2016) of Global
Average Distributed System Price (Sunshot based on Various Sources, USD)
17
U.S. Department of Energy, Photovoltaic System Pricing Trends 2014 Edition
http://www.nrel.gov/docs/fy14osti/62558.pdf 18
International Energy Agency, Technology Roadmap – Solar Photovoltaic Energy 2014 Edition
http://www.iea.org/publications/freepublications/publication/TechnologyRoadmapSolarPhotovol
taicEnergy_2014edition.pdf

Page 27
ii. Solar Costs: 1 MW to 5 MW and Solar Costs: Over 5 MW
In 2013, over 3GW of utility-scale solar was installed in Canada and in the U.S. This
represented 43% of all new capacity additions in Ontario (337 MW) and 30% of that in
the US (2847 MW). Ontario ranked second in North America behind California for new
utility-scale solar.19
A confluence of the decreasing capital costs and low cost of capital makes utility-scale
solar competitive with day-time retail electricity prices in many markets today.20
Large central PV systems cost less than $1.50/W in 2013 in the U.S. , according to the
IEA.21 The U.S. Sunshot Initiative, using reported pricing in part, estimated that utility
scale (equal to or greater than 5 MW) cost $3.00/W on a capacity weighted average in
2013. This discrepancy can likely be explained by a difference in the scale of systems
examined, perhaps due to many smaller systems in the Sunshot data. Sunshot also
projected an installed cost in 2014 (quoted Q4 2013) for utility scale systems (equal to or
greater than 185 MW) of $1.80/W – 5% lower than the previous year.22
The costs of c-Si and thin film PV systems, both tracking and fixed, have been falling as
well as converging over the past 7 years. The prices shown below in Figure 16 are
reported U.S. utility scale installed prices, and so lag behind other cost estimates by how
far in the past the contracting was.23 The lag between contract award and construction
helps explain the difference between reported costs and modeled costs.
19
CanSIA, A Confluence of Low Capital Costs and Cost of Capital for Utility-Scale Solar: Implications for
Developers, Lenders and Political and Regulatory Decision-Makers, presented January 30 2015 at the 6th
Annual Canadian Power Finance Conference. 20
CanSIA, A Confluence of Low Capital Costs and Cost of Capital for Utility-Scale Solar: Implications for
Developers, Lenders and Political and Regulatory Decision-Makers, presented January 30 2015 at the 6th
Annual Canadian Power Finance Conference. 21
International Energy Agency, Technology Roadmap – Solar Photovoltaic Energy 2014 Edition
http://www.iea.org/publications/freepublications/publication/TechnologyRoadmapSolarPhotovol
taicEnergy_2014edition.pdf 22
U.S. Department of Energy, Photovoltaic System Pricing Trends 2014 Edition
http://www.nrel.gov/docs/fy14osti/62558.pdf 23
U.S. Department of Energy, Photovoltaic System Pricing Trends 2014 Edition
http://www.nrel.gov/docs/fy14osti/62558.pdf

Page 28
The capacity weighted average prices at utility scale for systems completed in 2013 in
the U.S. were reported as:
• $2.97/W for c-Si with fixed tilt
• $3.12/W for c-Si with tracking
• $2.72/W for thin film with fixed tilt
Figure 16 - Reported Price of U.S. Utility-scale PV Projects over Time (Sunshot, USD)
Figure 17 shows that most of the recent gains in reduced cost from economies of scale in
utility scale systems (~70%) were found between 5 and 20 MW; as project size grew
beyond 20 MW, there was a diminishing return to scale in reductions.24 Prices were
found to fall between 14-27% as systems grew from 5 to 185 MW, depending on the year
analyzed. Thus in a jurisdiction like British Columbia, there would be no real driver for
projects greater than 5-10 MW.
24
U.S. Department of Energy, Photovoltaic System Pricing Trends 2014 Edition
http://www.nrel.gov/docs/fy14osti/62558.pdf

Page 29
Figure 17 - Bottom-up Modeled Overnight Capital Cost of U.S. Utility-scale PV
Systems by Size, 2011-2013 (Sunshot, USD)
Analysts’ projections for the global average near term price of utility scale systems
describe a price of $1.30 - $1.95 by 2016 (Figure 18).
Figure 18 - Recent Analyst Estimates (2012-2013) and Projections (2014-2016) of Global
Average Utility Scale System Price (Sunshot based on Various Sources, USD)

Page 30
Figure 19 below illustrates the relative values of cost components within a single-axis
tracking PV system at the utility scale.
Table 4 similarly shows the numeric values of these cost components. Soft costs
(including direct labour; engineering; permitting, inspection and interconnection; and
supply chain, overhead and margin) represent 34% of the total turnkey pricing in this
example.
Figure 19 - Modeled Utility Turnkey Single-Axis Tracking PV System Pricing With Cost
Breakdown (GTM Research, USD)

Page 31
Table 4 - Cost Components of Modeled Utility Turnkey Single-Axis Tracking PV System
Pricing (GTM Research)
Component Cost (2014 USD) Percent of System
Cost
Modules $0.73 38.8%
Inverters and AC Subsystem $0.18 9.6%
DC Electrical Balance of System $0.08 4.3%
Structural Balance of System $0.25 13.3%
Direct Labor $0.18 9.6%
Engineering and Permitting,
Inspection and Interconnection $0.07 3.7%
Supply Chain, Overhead, Margin $0.39 20.7%
b. Solar Thermal
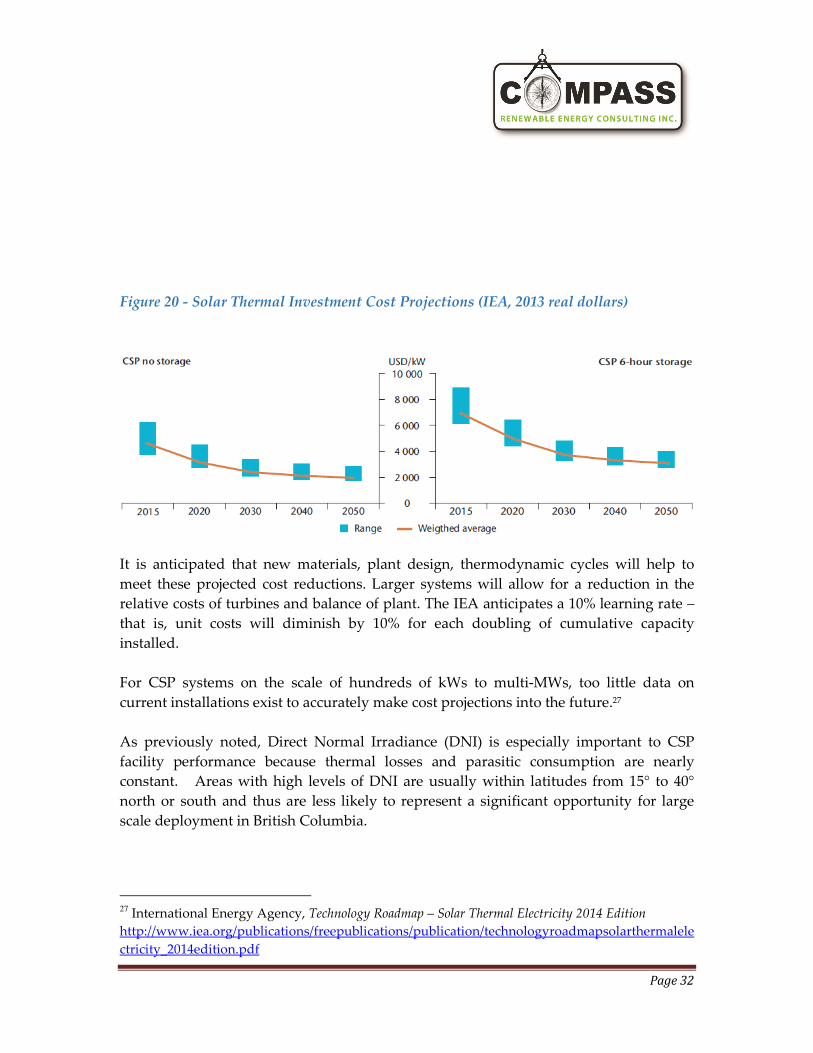
CSP system costs are expected to drop by half by 2030 (Figure 20).25 This long term cost
projection is somewhat difficult to compare to more near-term cost projections for solar
PV, which show in the near term a much lower cost for solar PV. The combination of
CSP and storage may be more competitive when its operational benefits are considered.
The U.S. Department of Energy’s Sunshot program predicts an even more aggressive
reduction in CSP costs than the IEA ($60/MWh (USD) by 2020, as compared to
$130/MWh projected by the IEA).26
25
International Energy Agency, Technology Roadmap – Solar Thermal Electricity 2014 Edition
http://www.iea.org/publications/freepublications/publication/technologyroadmapsolarthermalele
ctricity_2014edition.pdf 26
International Energy Agency, Technology Roadmap – Solar Thermal Electricity 2014 Edition
http://www.iea.org/publications/freepublications/publication/technologyroadmapsolarthermalele
ctricity_2014edition.pdf
Page 32
Figure 20 - Solar Thermal Investment Cost Projections (IEA, 2013 real dollars)
It is anticipated that new materials, plant design, thermodynamic cycles will help to
meet these projected cost reductions. Larger systems will allow for a reduction in the
relative costs of turbines and balance of plant. The IEA anticipates a 10% learning rate –
that is, unit costs will diminish by 10% for each doubling of cumulative capacity
installed.
For CSP systems on the scale of hundreds of kWs to multi-MWs, too little data on
current installations exist to accurately make cost projections into the future.27
As previously noted, Direct Normal Irradiance (DNI) is especially important to CSP
facility performance because thermal losses and parasitic consumption are nearly
constant. Areas with high levels of DNI are usually within latitudes from 15° to 40°
north or south and thus are less likely to represent a significant opportunity for large
scale deployment in British Columbia.
27
International Energy Agency, Technology Roadmap – Solar Thermal Electricity 2014 Edition
http://www.iea.org/publications/freepublications/publication/technologyroadmapsolarthermalele
ctricity_2014edition.pdf

Page 33
6. Conclusions and Considerations for British Columbia
a. Utility-Scale Pricing Forecast for British Columbia
Compass has analyzed a number of studies and amalgamated them into its own
projection of system and component costs through the year 2025. This incorporates
analyst’s projections as collected by NREL, GTM Research and the IEA. Figure 21 below
shows the historical and projected component and system costs in 2013 USD, and Figure
22 shows projected component and system costs using a $1 USD = $1.2 CDN conversion.
These are nominal costs, unadjusted for inflation. Because this analysis is based on many
studies looking at utility scale projects but without deeper specificity into the size or
characteristics the projects analyzed, this analysis is best described as applying generally
to utility scale solar PV projects 5 MW and over.
System prices have fallen between 16% – 19% per year since 2009, with half to two thirds
of this drop related to module price reductions.28
Figure 21 - Historical and Projected Component and System Costs (Compass)
28
U.S. Department of Energy, Photovoltaic System Pricing Trends 2014 Edition
http://www.nrel.gov/docs/fy14osti/62558.pdf

Page 34
Figure 22 - Projected System and Component Costs in $ CDN (Compass)
Table 5 - Breakdown of Projected System and Component Costs in $ CDN (Compass)
Component Cost (2015
CDN)
2015 Percent
of System
Cost
Cost (2025
CDN)
2025 Percent
of System
Cost
Modules $0.70 39.5% $0.54 40.6%
Inverters and AC
Subsystem $0.16 9% $0.09 6.8%
DC Electrical Balance of
System $0.10 5.7% $0.08 6.0%
Structural Balance of
System $0.18 10.2% $0.15 11.3%
Direct Labor $0.15 8.4% $0.11 8.3%
Engineering and
Permitting, Inspection and
Interconnection
$0.08 4.5% $0.06 4.5%
Supply Chain, Overhead,
Margin $0.40 22.6% $0.30 22.5%
Page 35
The pricing and costing analysis also takes into consideration the current market
conditions in Ontario, which provides a reasonable reference point for expected prices
for project developers in British Columbia.
PV modules are available from a number of bankable Tier 1 Ontario manufacturers to
supply the early Feed-in Tariff projects that carry with them obligations to source
equipment locally. These modules are currently available to project developers for
prices ranging from $0.65 - $0.75 CDN per watt DC. The recent decision of the Canadian
Borders Services Agency to establish interim duties on imported Chinese modules in the
range of 10% - 200% is not expected to have any immediate impact on these prices, as
alternative sources for modules, and competitive prices continue to be available, in
including from Canada. Ontario manufacturers are free to import PV cells from any
country duty-free, and perform the robotic final assembly into modules, and can do so at
globally competitive prices.
Inverters are similarly available from a variety of equipment suppliers and with
increasing inverter sizes, unit cost for these products has decreased to a level of
approximately $0.16 - $0.20 CDN today. Many of the inverters come from markets with
lower labour costs and are available in Ontario for projects that no longer have local
content obligations, with some manufacturers offering such equipment for projects for
2015/16 delivery at $0.10 - $0.12/W CDN.
BOS costs and other factors that influence final project costs include:
• Modules
• Inverters
• Balance of System (racking and mounting, electrical hardware, grid
connection etc.)
• Labour, engineering and construction
• Shipping
The question of whether a cost component is a global commodity or locally priced or
sourced informs the derivation of a Canadian or British Columbia system cost
projection. Mounting systems are often locally made, but with materials that are often
global commodities. Electrical equipment and hardware are global commodities and can
be purchased locally or from abroad. Labour is locally sourced and contingent on local
conditions and cost pressures. Some jurisdictions have local inverter or module
manufacturing or assembly, but in British Columbia these would both be sourced from
abroad.
Page 36
Permitting, financing and soft costs are highly local in nature and can represent a sizable
share of the overall cost. Policy and regulatory change and international financial trends
can have a large effect over a multi-year cost projection, however global investor interest
in operating PV assets have contributed to the reduction in end-user costs of solar PV.
The availability of low-cost or subsidized debt can improve the economic viability of
projects. Jurisdictions with this feature can see significant customer savings on a per unit
basis.
Continued improvements in module efficiency and manufacturing scale represent the
leading drivers of future cost reductions for many reasons. Balance of system material
costs are unlikely to fall significantly in the future. Declines in inverter costs have a
smaller percentage effect on the overall cost. Finally, increased module efficiency
reduces the need for all other inputs on a $ per W basis, as the project requires less
labour, hardware and other balance of system components.
Compass projects an average 2.5% annual system cost reduction of from Q4 2014 – 2025.
This compares with the following other projects in similar periods:
• NREL projects 0.4 - 4.7% annual system cost decline 2014-2025
• Black and Veatch projects 0.8% annual system cost decline 2014-2025
• IEA projects 4.2% annual system cost decline 2015-2020
• GTM Research projects 5.6% annual module cost decline 2012-2017
Solar PV is a constantly advancing technology whose application at utility MW scale
will continue to increasingly contribute to least cost power system planning decisions
globally, particularly in markets with solar production profiles that match local
consumption profiles.