Embed Size (px)
Citation preview
N E T W O R K E D N A T I O N :
BROADBAND IN AMERICA
2007
NATIONAL TELECOMMUNICATIONS AND INFORMATION ADMINISTRATION United States Department of Commerce
Washington, D.C.
January 2008

N E T W O R K E D N A T I O N : B R O A D B A N D I N A M E R I C A , 2 0 0 7 NATIONAL TELECOMMUNICATIONS AND INFORMATION ADMINISTRATION
Executive SummaryBroadband technology is changing our lives, our economy, and our culture. By making it possible to access, use, and share information, news, and entertainment with ever increasing speed, broad-band knits geographically-distant individuals and businesses more closely together, increases our productivity, and enriches our quality of life. In so doing, it fuels economic growth and job crea-tion that, in turn, provide unparalleled new opportunities for our nation’s citizens.
Technology Policies
Technology Neutrality: Past experience teaches that when government tries to substitute its judg-ment for that of the market by favoring one product or vendor over another, it can easily divert investment and/or discourage research necessary to bring new and better products or services to market. Given the rapid pace of technological change, such unintended effects can have long-term and far-reaching adverse consequences that extend across multiple sectors of the economy. For this reason, the Administration has consis-tently and strenuously advocated for technology neutrality in order to take the government out of decisions more appropriately left to the market-place.
Recognizing this transformative power, four years ago President Bush articulated a national vision: universal, affordable access to broadband technol-ogy. From its first days, the Administration has implemented a comprehensive and integrated package of technology, regulatory, and fiscal poli-cies designed to lower barriers and create an environment in which broadband innovation and competition can flourish.
Spectrum Policy: To satisfy society’s increasing desire to function “untethered,” new wireless broadband services can only emerge if spectrum resources exist to support them. Pursuant to the President’s June 2003 Spectrum Policy Initiative,
The results have been striking. The last several years have witnessed substantial growth in the broadband marketplace punctuated by increases in capital investment, innovation, and market entry. Relative to other countries, the United States has experienced superior productivity over the past several years. Americans today enjoy an increasing array of broadband services, available from a growing number of service providers, using a va-riety of technologies. Penetration continues to grow, and prices continue to fall.
NTIA has promoted greater access to spectrum by improving the spectrum efficiency of Federal radio systems and operations. NTIA and the FCC, working together and with the Congress, have significantly increased the amount of spec-trum available for advanced wireless services. The Administration has also actively sought ways to accelerate broadband deployment by facilitating unlicensed uses and encouraging the use of prom-ising new spectrum technologies such as ultrawideband, and by implementing new spec-trum management systems that afford non-Federal users faster and easier access to spectrum.
A Broadband Strategy for the Twenty-First Century
Building on the pro-competitive, deregulatory policies Congress articulated in the Telecommuni-cations Act of 1996, the Administration, through the combined efforts of the National Telecom-munications and Information Administration (NTIA) of the U.S. Department of Commerce, the U.S. Department of Agriculture (USDA), and other agencies, and in cooperation with the Fed-eral Communications Commission (FCC or Commission), has executed a combination of ini-tiatives to develop and rapidly deploy new technologies, eliminate regulatory underbrush, and remove economic disincentives for investment in this critical area.
Regulatory Policies
The Administration has worked to clear away regulatory obstacles that could thwart the invest-ment that fuels development – and deployment – of new technologies. It supported the FCC’s ef-forts to modify legacy regulation in order to expand incentives for local telephone companies to invest in network upgrades and to stimulate facilities-based investments by other providers. The Administration has further encouraged ag-gressive broadband deployment by favoring policies to ensure that applications running on the Internet, such as voice over Internet Protocol ser-
i
N E T W O R K E D N A T I O N : B R O A D B A N D I N A M E R I C A , 2 0 0 7 NATIONAL TELECOMMUNICATIONS AND INFORMATION ADMINISTRATION
ii
vice, remain free from unnecessary economic regulation. The Administration has also sup-ported cable franchise reform efforts in order to promote the video services competition that will help to accelerate broadband deployment. In April 2004, the President signed an Executive Memorandum to give broadband providers more timely and cost-effective access to rights-of-way on Federal lands for their networks.
Fiscal Policies and Targeted Funding Efforts
Tax relief has given businesses powerful incen-tives to invest in broadband technology. Recognizing that taxes constrain growth, President Bush on three occasions has signed legislation to extend the Federal moratorium on State and local taxation of Internet access and has consistently urged that the moratorium be made permanent. The President also signed into law legislation al-lowing companies to accelerate depreciation for capital expenditures, including those associated with broadband deployment. The Administration has also forcefully advocated extending and mak-ing permanent the tax credit for research and development spending. Further, the Administra-tion has provided targeted seed-funding to support more rapid deployment of broadband in underserved rural areas, in particular through sev-eral programs administered by the USDA.
Progress in Broadband Access
America’s consumers are now reaping the rewards of the Administration’s pro-investment, deregula-tory policies: a vigorous broadband marketplace in which providers using various platforms compete against one another on price, speed, mobility, con-tent, and other service features. Currently available data suggest that broadband availability and subscribership have increased dramatically, and that consumers – including those in rural and remote areas – have more opportunities than ever to choose the broadband solution (i.e., technology, services, and provider) that best suits their needs and budget.
Overall
Since President Bush took office, the total number of broadband lines in the United States has grown by over 1,100 percent from almost 6.8 million lines in December 2000, to 82.5 million in De-cember 2006 according to the most recent FCC
data. Over 58 million of these lines serve residen-tial customers. FCC data also reveal that the number of broadband service providers more than tripled from December 2003 to December 2006, with the newest wired and wireless services growing at the highest rates. Data from the U.S. Census Bureau’s Internet Use Supplement to the October 2007 Current Population Survey also show that Americans’ use of broadband technolo-gies has soared: home broadband usage has risen substantially over the past six years, from 9.1 per-cent of households in September 2001 to 50.8 percent in October 2007. Rural America has also experienced impressive growth from 5.6 percent of rural households in September 2001 to 38.8 percent in October 2007.
Digital Subscriber Line (DSL)
Used primarily by local telephone companies to provide broadband services, DSL was available as of year end 2006 to 79 percent of households in areas where companies also offered local tele-phone service according to FCC data. Not limited to highly populated areas, DSL was among the broadband services offered to 90 percent of the carriers’ rural customer base according to recent industry surveys. As DSL transmission speeds have accelerated and prices have dropped, the number of DSL subscribers has burgeoned. FCC’s statistics reveal about 22.8 million residen-tial “high-speed” asymmetric DSL (ADSL) lines in service as of year end 2006, growing by more than 300 percent from December 2002.
High-Speed Cable
Research conducted by the cable television indus-try suggests that high-speed cable service is now available to some 92 percent of all U.S. house-holds by the end of 2007. That same research shows that as of year end 2006, there were 29 mil-lion residential high-speed cable subscribers, up more than 109 percent from the 13.8 million cus-tomers in the second quarter of 2003. Accompanying this growth, the industry’s trade association reports that most cable broadband operators now offer transmission speeds exceed-ing five megabits per second (5 Mbps), with some delivering as much as 50 Mbps.
N E T W O R K E D N A T I O N : B R O A D B A N D I N A M E R I C A , 2 0 0 7 NATIONAL TELECOMMUNICATIONS AND INFORMATION ADMINISTRATION
Mobile Wireless Fiber Optic and Broadband Over Power Lines
The wireless industry is currently the fastest grow-ing segment of America’s broadband economy. The FCC’s most recent data reveal that the num-ber of broadband lines provided by wireless operators increased from approximately 380,000 in June 2005 to almost 22 million at year end 2006 – a growth rate that dwarfs that of other broad-band platforms. Moreover, a significant portion of these (4.1 million, or almost 19 percent) pro-vide “advanced” services capable of delivering over 200 kilobits per second (Kbps) in both direc-tions.
FCC data show that the total number of high speed lines delivered over fiber and power line connections grew 789 percent from December 2003 to December 2006, rising from 116,390 to just over a million. Fiber optic lines, however, appear to be almost entirely responsible for this expansion. Industry data also show a steady ex-pansion of fiber deployment (including fiber to the home and interoffice fiber). As charted by the Telecommunications Industry Association (TIA), annual deployment of fiber in the United States grew sharply over the last four years, from the 4.8 million miles deployed in 2003 to 13.1 million miles in 2007. According to another industry es-timate, fiber now passes almost 9.6 million homes in North America (virtually all of these homes are in the United States), up more than 50 percent from
Fixed Wireless
Fixed wireless technologies have emerged both as an important complement to mobile wireless and as a potential “last-mile” broadband solution in areas that other platforms do not reach. Accord-ing to FCC figures, the number of fixed wireless broadband lines in the United States grew 132 percent from 208,695 in June 2005 to 484,073 in December 2006; an industry group estimated the total number of fixed wireless subscribers in 2006 to be 800,000. The proliferation of one fixed wireless technology – wireless fidelity (Wi-Fi) – has increasingly enabled many consumers to cut the tether to a home or office connection; based on one estimate, there are 66,058 pub-lic/commercial Wi-Fi access points, or “hot spots”, currently in the United States, more than double the next closest country. Another tech-nology – worldwide interoperability for microwave access (WiMAX) – can deliver fixed wireless broadband access at distances as great as five miles without line of sight and up to 30 miles under ideal conditions. With potential data speeds up to 70 Mbps, WiMAX has been identified as a possible “last-mile” solution to deliver broadband into currently unserved rural and remote areas.
September 2006.
Industry Investment
The accessibility of broadband technology to an increasing number of Americans stems directly from the substantial and growing capital invest-ments made by service providers across all of the subsectors of the broadband marketplace. TIA estimates that overall spending to support broad-band network infrastructure will rise over the next four years from $15.2 billion in 2007 to $23 billion in 2010. This includes: significant growth in fiber deployment by cable operators to meet customer demand for high-definition television channels and video-on-demand services; continued invest-ment for the deployment of advanced mobile wireless services and fixed wireless technologies such as WiMAX; and spending on fiber-related telecommunications equipment that is estimated to grow almost $13.5 billion annually in the next three years.
Affordability Satellite Escalating competition among broadband plat-
forms and service providers has yielded both a proliferation of new communications and enter-tainment services and affordable broadband pricing for American consumers. The rapid drop in the prices for DSL broadband services in the past five years, along with the deployment of fiber infrastructure equipment, have resulted in lower prices for high-speed cable services. Despite the dramatic increase in usage, the average local
With coverage of virtually the entire continent, satellite has become the default solution for areas not covered by terrestrial sources of broadband. Like those other broadband services, satellite broadband has seen tremendous growth over the past few years. From fewer than 50,000 subscrib-ers in 2004, satellite providers were serving an estimated 700,000 subscribers at year end 2006.
iii

N E T W O R K E D N A T I O N : B R O A D B A N D I N A M E R I C A , 2 0 0 7 NATIONAL TELECOMMUNICATIONS AND INFORMATION ADMINISTRATION
monthly bill for wireless services has remained relatively stable, rising only a dime per year on average over the past four years. Satellite broad-band prices have also dropped as satellite providers introduce alternative pricing models to make their services more affordable.
iv
N E T W O R K E D N A T I O N : B R O A D B A N D I N A M E R I C A , 2 0 0 7 NATIONAL TELECOMMUNICATIONS AND INFORMATION ADMINISTRATION
Introduction A surgeon in Queensland, Australia, using an Internet-based laser technology, RoboLase,
performs microsurgery successfully on cells located in a laboratory in San Diego . . . 1
From over 6,000 miles away, an American soldier stationed in Iraq watches via live web-cast as his 18-year-old daughter in Tennessee, his oldest child, walks across the stage to accept her high school diploma . . . 2
With only a laptop and a wireless card, a farmer sitting in his onion field in Hermiston, Oregon, can check e-mail, monitor the water level of his crops, and even conduct business with his customers, all using the 700 square mile Wi-Fi “cloud” that covers his farm . . . 3
Using a national, interoperable communications service, public safety personnel and first re-sponders in Dallas can communicate with one another with voice, data, and real-time live video feeds to maintain situational awareness and coordinate response activities more effec-tively . . .4
Students in Kotzebue, Alaska (66.53N, 162.39W), on Alaska’s Western shore facing the Bering Strait, join with students in other remote communities on Alaska’s Southwest-ern frontier, in a live “virtual field trip” to the Johnson Space Center in Houston and two weeks later visit with an Alaskan astronaut aboard the space shuttle Discovery, all using a state broadband Distance Learning network. 5
he foregoing examples illustrate only a few of the ways in which broadband technology is changing our lives, our
economy, and our culture. By making it pos-sible to access, use, and share information, news, and entertainment with ever increasing speed, broadband technology knits geo-graphically-distant individuals and businesses more closely together, increases productivity, and enriches the quality of life. In so doing, it catalyzes economic growth and job creation that, in turn, provide unparalleled new oppor-tunities for our nation’s citizens.
Recognizing this transformative power and realizing the benefits that broadband tech-nologies can deliver for all Americans, President Bush four years ago articulated a national vision to carry the United States for-ward: universal, affordable broadband access. Even before advancing that goal, however, the Administration had started to pursue it, im-plementing a comprehensive and integrated package of technology, regulatory, and fiscal policies designed to lower barriers to competi-
tion and investment, and create an environ-ment in which broadband innovation and TT competition could flourish.
The results have been striking. The last sev-eral years have witnessed substantial growth in the broadband marketplace punctuated by demonstrable increases in capital investment, innovation, and entry, as well as superior pro-ductivity relative to other countries. Americans today enjoy an increasing array of broadband services available from a growing number of service providers across multiple platforms – traditional wireline, cable, fiber, wireless, satellite, Wi-Fi and WiMAX. Pene-tration rates continue to grow, and prices continue to fall.
This Report examines the concerted, pro-market policies that the Administration has implemented to remove regulatory obstacles, foster economic incentives, and encourage investment in the development and deploy-ment of broadband technologies. It also outlines steps the Administration has taken to
2
3
N E T W O R K E D N A T I O N : B R O A D B A N D I N A M E R I C A , 2 0 0 7 NATIONAL TELECOMMUNICATIONS AND INFORMATION ADMINISTRATION
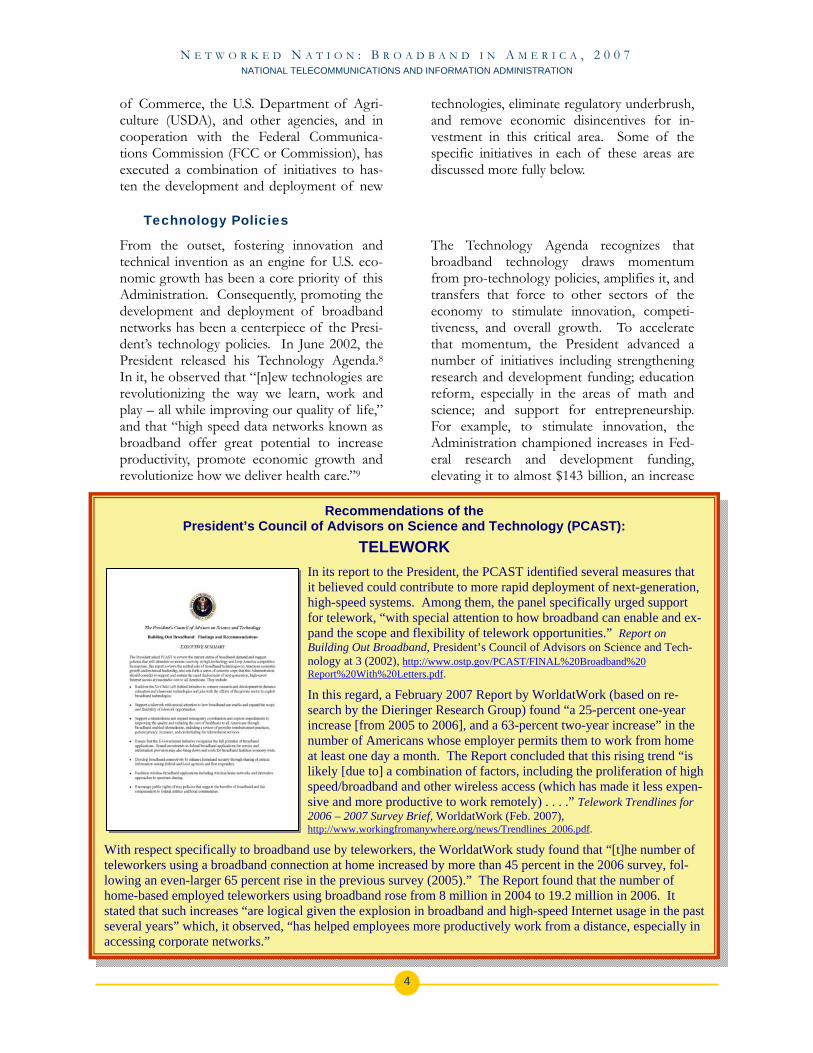
““TThhee rroollee ooff ggoovveerrnnmmeenntt iiss nnoott ttoo ccrreeaattee wweeaalltthh;; tthhee rroollee ooff oouurr ggoovveerrnnmmeenntt iiss ttoo
ccrreeaattee aann eennvviirroonnmmeenntt iinn wwhhiicchh tthhee eennttrree--pprreenneeuurr ccaann fflloouurriisshh,, iinn wwhhiicchh mmiinnddss ccaann eexxppaanndd,, iinn wwhhiicchh tteecchhnnoollooggiieess ccaann rreeaacchh
nneeww ffrroonnttiieerrss..””
ty that American consumers enjoy as a result.
N E T W O R K E D N A T I O N : B R O A D B A N D I N A M E R I C A , 2 0 0 7 NATIONAL TELECOMMUNICATIONS AND INFORMATION ADMINISTRATION
3
“
President George W. Bush, President George W. Bush, Technology Agenda, Technology Agenda,
June, 2002 June, 2002
help jump-start market forces by providing seed-funding to advance broadband deploy-ment in underserved and rural areas. Finally, it documents the statistical evidence that demonstrates the burgeoning competitive
broadband marketplace that has emerged in the United States over the last several years and the commensurate increases in accessibil-ity and affordabili
A Broadband Strategy for the Twenty-First Century A Broadband Strategy for the Twenty-First Century
he Administration’s strategy to advance broadband infrastructure and services in the United States rests on a simple
tenet: A competitive environment – in which the ingenuity of technologists, engineers, and businessmen can fully express itself – pro-vides the most effective and reliable tool to identify the new technologies, products and services that consumers need and want; and to develop and deploy the most cost-effective technical and commercial solutions to fill those needs. This precept is not new: it is the enduring legacy of a strong, bi-partisan con-sensus forged over a decade ago.
he Administration’s strategy to advance broadband infrastructure and services in the United States rests on a simple
tenet: A competitive environment – in which the ingenuity of technologists, engineers, and businessmen can fully express itself – pro-vides the most effective and reliable tool to identify the new technologies, products and services that consumers need and want; and to develop and deploy the most cost-effective technical and commercial solutions to fill those needs. This precept is not new: it is the enduring legacy of a strong, bi-partisan con-sensus forged over a decade ago. In enacting the Telecommunications Act of 1996, overwhelming majorities in both cham-bers of Congress and the Executive Branch enshrined the policy “[t]o promote competi-tion and reduce regulation in order to secure lower prices and higher quality services for American telecommunications consumers and encourage the rapid deployment of new tele-communications technologies.”6 Mindful of the remarkable potential of high-speed, high-capacity, digital communications systems, the Act specifically embraced as “the policy of the United States . . .”
In enacting the Telecommunications Act of 1996, overwhelming majorities in both cham-bers of Congress and the Executive Branch enshrined the policy “[t]o promote competi-tion and reduce regulation in order to secure lower prices and higher quality services for American telecommunications consumers and encourage the rapid deployment of new tele-communications technologies.”
to promote the continued development of the Internet and other interactive computer services and other interactive media; . . . [and] preserve the vibrant and competitive free market that presently exists for the Internet and other interac-tive computer services, unfettered by Federal or State regulation . . . .7
Building on the policies Congress articulated in the Telecommunications Act, the Admini-stration has maintained a principled approach to telecommunications policies, recognizing that:
Building on the policies Congress articulated in the Telecommunications Act, the Admini-stration has maintained a principled approach to telecommunications policies, recognizing that:
New technologies and services, such as those supported by Internet Protocol (IP)-based networks, are creating com-petition in the telecommunications market, allowing for deregulation;
New technologies and services, such as those supported by Internet Protocol (IP)-based networks, are creating com-petition in the telecommunications market, allowing for deregulation;
New technologies are making distance irrelevant – and because the communi-cations services supported by these technologies are inherently interstate in nature, jurisdiction over them should reside at the Federal, rather than the State, level;
New technologies are making distance irrelevant – and because the communi-cations services supported by these technologies are inherently interstate in nature, jurisdiction over them should reside at the Federal, rather than the State, level;
Specific social policy objectives – such as support for 911 services, accessibility for persons with disabilities or those re-siding in rural or remote areas, and the needs of law enforcement – may re-quire regulation even in a competitive environment; and
Specific social policy objectives – such as support for 911 services, accessibility for persons with disabilities or those re-siding in rural or remote areas, and the needs of law enforcement – may re-quire regulation even in a competitive environment; and
Telecommunications subsidies should reflect the economics of new technolo-gies and actual consumer needs.
Telecommunications subsidies should reflect the economics of new technolo-gies and actual consumer needs.
These principles serve as the foundation for three interlocking, mutually reinforcing ele-ments that form the President’s broadband strategy – technology policy, regulatory policy, and fiscal/economic policy. The Administra-tion, through the efforts of the National Telecommunications and Information Ad-ministration (NTIA) of the U.S. Department
These principles serve as the foundation for three interlocking, mutually reinforcing ele-ments that form the President’s broadband strategy – technology policy, regulatory policy, and fiscal/economic policy. The Administra-tion, through the efforts of the National Telecommunications and Information Ad-ministration (NTIA) of the U.S. Department
TT “TThhee rroollee ooff ggoovveerrnnmmeenntt iiss nnoott ttoo ccrreeaattee wweeaalltthh;; tthhee rroollee ooff oouurr ggoovveerrnnmmeenntt iiss ttoo
ccrreeaattee aann eennvviirroonnmmeenntt iinn wwhhiicchh tthhee eennttrree--pprreenneeuurr ccaann fflloouurriisshh,, iinn wwhhiicchh mmiinnddss ccaann eexxppaanndd,, iinn wwhhiicchh tteecchhnnoollooggiieess ccaann rreeaacchh
nneeww ffrroonnttiieerrss..””
ty that American consumers enjoy as a result.
6 Mindful of the remarkable potential of high-speed, high-capacity, digital communications systems, the Act specifically embraced as “the policy of the United States . . .”
to promote the continued development of the Internet and other interactive computer services and other interactive media; . . . [and] preserve the vibrant and competitive free market that presently exists for the Internet and other interac-tive computer services, unfettered by Federal or State regulation . . . .7
TT
N E T W O R K E D N A T I O N : B R O A D B A N D I N A M E R I C A , 2 0 0 7 NATIONAL TELECOMMUNICATIONS AND INFORMATION ADMINISTRATION
4
of Commerce, the U.S. Department of Agri-culture (USDA), and other agencies, and in cooperation with the Federal Communica-tions Commission (FCC or Commission), has executed a combination of initiatives to has-ten the development and deployment of new
technologies, eliminate regulatory underbrush, and remove economic disincentives for in-vestment in this critical area. Some of the specific initiatives in each of these areas are discussed more fully below.
Technology Policies
From the outset, fostering innovation and technical invention as an engine for U.S. eco-nomic growth has been a core priority of this Administration. Consequently, promoting the development and deployment of broadband networks has been a centerpiece of the Presi-dent’s technology policies. In June 2002, the President released his Technology Agenda.8 In it, he observed that “[n]ew technologies are revolutionizing the way we learn, work and play – all while improving our quality of life,” and that “high speed data networks known as broadband offer great potential to increase productivity, promote economic growth and revolutionize how we deliver health care.”9
The Technology Agenda recognizes that broadband technology draws momentum from pro-technology policies, amplifies it, and transfers that force to other sectors of the economy to stimulate innovation, competi-tiveness, and overall growth. To accelerate that momentum, the President advanced a number of initiatives including strengthening research and development funding; education reform, especially in the areas of math and science; and support for entrepreneurship. For example, to stimulate innovation, the Administration championed increases in Fed-eral research and development funding, elevating it to almost $143 billion, an increase
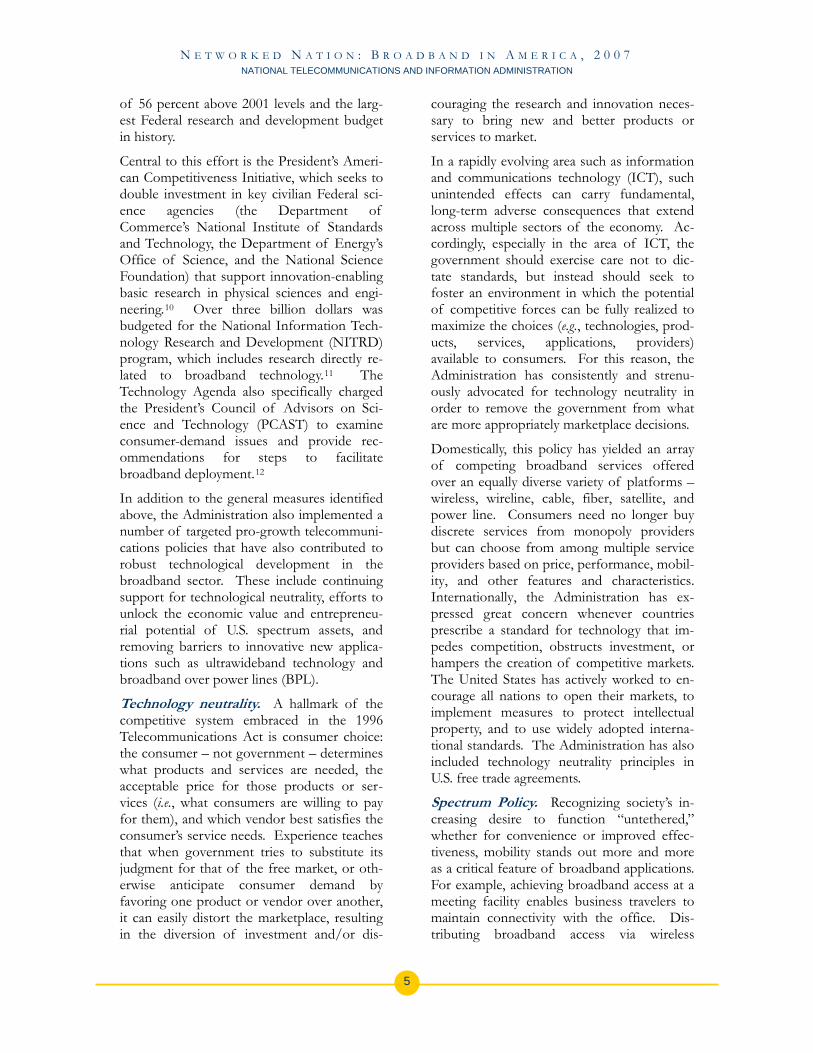
Recommendations of the President’s Council of Advisors on Science and Technology (PCAST):
TELEWORK In its report to the President, the PCAST identified several measures that it believed could contribute to more rapid deployment of next-generation, high-speed systems. Among them, the panel specifically urged support for telework, “with special attention to how broadband can enable and ex-pand the scope and flexibility of telework opportunities.” Report on Building Out Broadband, President’s Council of Advisors on Science and Tech-nology at 3 (2002), http://www.ostp.gov/PCAST/FINAL%20Broadband%20 Report%20With%20Letters.pdf.
In this regard, a February 2007 Report by WorldatWork (based on re-search by the Dieringer Research Group) found “a 25-percent one-year increase [from 2005 to 2006], and a 63-percent two-year increase” in the number of Americans whose employer permits them to work from home at least one day a month. The Report concluded that this rising trend “is likely [due to] a combination of factors, including the proliferation of high speed/broadband and other wireless access (which has made it less expen-sive and more productive to work remotely) . . . .” Telework Trendlines for 2006 – 2007 Survey Brief, WorldatWork (Feb. 2007), http://www.workingfromanywhere.org/news/Trendlines_2006.pdf.
With respect specifically to broadband use by teleworkers, the WorldatWork study found that “[t]he number of teleworkers using a broadband connection at home increased by more than 45 percent in the 2006 survey, fol-lowing an even-larger 65 percent rise in the previous survey (2005).” The Report found that the number of home-based employed teleworkers using broadband rose from 8 million in 2004 to 19.2 million in 2006. It stated that such increases “are logical given the explosion in broadband and high-speed Internet usage in the past several years” which, it observed, “has helped employees more productively work from a distance, especially in accessing corporate networks.”
N E T W O R K E D N A T I O N : B R O A D B A N D I N A M E R I C A , 2 0 0 7 NATIONAL TELECOMMUNICATIONS AND INFORMATION ADMINISTRATION
of 56 percent above 2001 levels and the larg-est Federal research and development budget in history.
Central to this effort is the President’s Ameri-can Competitiveness Initiative, which seeks to
lso implemented a
the 1996
s technology (ICT), such
ion “untethered,”
double investment in key civilian Federal sci-ence agencies (the Department of Commerce’s National Institute of Standards and Technology, the Department of Energy’s Office of Science, and the National Science Foundation) that support innovation-enabling basic research in physical sciences and engi-neering.10 Over three billion dollars was budgeted for the National Information Tech-nology Research and Development (NITRD) program, which includes research directly re-lated to broadband technology.11 The Technology Agenda also specifically charged the President’s Council of Advisors on Sci-ence and Technology (PCAST) to examine consumer-demand issues and provide rec-ommendations for steps to facilitate broadband deployment.12
In addition to the general measures identified above, the Administration anumber of targeted pro-growth telecommuni-cations policies that have also contributed to robust technological development in the broadband sector. These include continuing support for technological neutrality, efforts to unlock the economic value and entrepreneu-rial potential of U.S. spectrum assets, and removing barriers to innovative new applica-tions such as ultrawideband technology and broadband over power lines (BPL).
Technology neutrality. A hallmark of the competitive system embraced in Telecommunications Act is consumer choice: the consumer – not government – determines what products and services are needed, the acceptable price for those products or ser-vices (i.e., what consumers are willing to pay for them), and which vendor best satisfies the consumer’s service needs. Experience teaches that when government tries to substitute its judgment for that of the free market, or oth-erwise anticipate consumer demand by favoring one product or vendor over another, it can easily distort the marketplace, resulting in the diversion of investment and/or dis-
couraging the research and innovation neces-sary to bring new and better products or services to market.
In a rapidly evolving area such as information and communicationunintended effects can carry fundamental, long-term adverse consequences that extend across multiple sectors of the economy. Ac-cordingly, especially in the area of ICT, the government should exercise care not to dic-tate standards, but instead should seek to foster an environment in which the potential of competitive forces can be fully realized to maximize the choices (e.g., technologies, prod-ucts, services, applications, providers) available to consumers. For this reason, the Administration has consistently and strenu-ously advocated for technology neutrality in order to remove the government from what are more appropriately marketplace decisions.
Domestically, this policy has yielded an array of competing broadband services offered over an equally diverse variety of platforms – wireless, wireline, cable, fiber, satellite, and power line. Consumers need no longer buy discrete services from monopoly providers but can choose from among multiple service providers based on price, performance, mobil-ity, and other features and characteristics. Internationally, the Administration has ex-pressed great concern whenever countries prescribe a standard for technology that im-pedes competition, obstructs investment, or hampers the creation of competitive markets. The United States has actively worked to en-courage all nations to open their markets, to implement measures to protect intellectual property, and to use widely adopted interna-tional standards. The Administration has also included technology neutrality principles in U.S. free trade agreements.
Spectrum Policy. Recognizing society’s in-creasing desire to functwhether for convenience or improved effec-tiveness, mobility stands out more and more as a critical feature of broadband applications. For example, achieving broadband access at a meeting facility enables business travelers to maintain connectivity with the office. Dis-tributing broadband access via wireless
5
N E T W O R K E D N A T I O N : B R O A D B A N D I N A M E R I C A , 2 0 0 7 NATIONAL TELECOMMUNICATIONS AND INFORMATION ADMINISTRATION
technology to hundreds of meetings attendees simultaneously multiplies its utility and in-creases the productivity of the work force. Such applications require spectrum access that is fast, reliable and convenient.
While ensuring a level playing field for all technological platforms, the Federal govern-ment – as custodian and manager for a significant amount of our national spectrum assets – can play a major role in technological advancement by making spectrum resources available to engineers and entrepreneurs to support development and implementation of new technologies and services, including broadband communications. The Administra-tion has implemented a number of policies to open up this limited resource by improving spectrum management policies and practices to increase spectrum efficiency, reallocating Federal spectrum so that it can be used for new applications, and maximizing opportuni-ties for the unlicensed use of spectrum wherever possible.
Improving Spectrum Management. In June 2003, the President issued a memorandum to
res to promote greater access to
Spectrum for New Uses
the heads of Executive Departments and Agencies outlining his “Spectrum Policy for the 21st Century.”13 The President’s Spectrum Policy Initiative called for a critical review of current spectrum management policies and practices to establish a new U.S. spectrum policy that will foster economic growth; en-sure U.S. national and homeland security; maintain our global leadership in communica-tions technology and services; and satisfy other vital U.S. needs in areas such as public safety, scientific research, Federal transportation infrastructure, and law enforcement.
Pursuant to this initiative, NTIA has imple-mented measuthe radio spectrum by improving the effi-ciency of radio systems and operations. Specifically, NTIA has (1) modernized Federal spectrum management processes with ad-vanced information technology, aiming toward fully-automated web-based analysis, coordination, and record-keeping capabilities; (2) enhanced spectrum engineering and ana-
lytical tools by developing best practices rec-ognized by government and industry; and (3) promoted the use of market-based economic mechanisms in spectrum management by rec-ognizing the role that spectrum value must play in Federal procurement decision-making. Improved and more efficient spectrum man-agement processes provide a firm foundation for an environment that will continue to ad-vance new broadband networks in the future.14
Reallocating . In the
n only emerge, however,
past decade, wireless technologies have prolif-erated at an astonishing pace across the globe. Although the telecommunications sector con-stitutes only approximately one percent of our nation’s economy, experts estimate that it generates up to 10 percent of U.S. economic growth,15 and wireless services occupy an in-creasingly important place in that sector. High-Speed Downlink Packet Access (HSPDA) is accelerating cellular data speeds to multiple megabits per second.16 Mobile phone content offerings supported by such speeds – including music, gaming and video – are coming to market at a breathtaking pace, with revenues expected to rise from $5.2 bil-lion in 2004 to $43 billion worldwide by 2010.17 Wireless competition in the United States has resulted in a vibrant marketplace. The U.S. wireless communications services revenues are projected to be more than $141 billion in 2007 and are growing approximately 10 percent each year.18
Such new services caif the spectrum resources exist to support them. Consequently, the Administration has worked to ensure that commercial wireless services have spectrum to compete with in-cumbents and provide new services to consumers, while at the same time preserving spectrum access for critical Federal systems and public safety services. NTIA and the FCC, working together and with the Con-gress, have significantly increased the amount of radio spectrum available for advanced wireless services, including wireless broad-band, and other services.
6
N E T W O R K E D N A T I O N : B R O A D B A N D I N A M E R I C A , 2 0 0 7 NATIONAL TELECOMMUNICATIONS AND INFORMATION ADMINISTRATION
For example, the Administration supported enactment of the Commercial Spectrum En-hancement Act19 (CSEA), which facilitated the reallocation of 45 megahertz (MHz) of spectrum at 1710-1755 MHz from Federal use to commercial use. The Commission reallocated an additional 45 MHz at 2110-2155 MHz. The resulting 90 MHz were allo-cated for advanced wireless services including third generation (3G) wireless broadband services and auctioned in the summer of 2006.20 The $13.7 billion in auction revenues reflects a significant investment in U.S. wire-less broadband deployment, which will further contribute to the accessibility and affordability of such services.21
The digital television transition in February 2009 will also free up spectrum in the 700 MHz band. The Administration supported adoption of a firm February 17, 2009, date for completion of the transition from analog to digital television broadcasting in order to recover 108 MHz of analog broadcast spec-trum for broadband services to support critical public safety and commercial needs.22
The Administration has also taken steps in-ternationally to promote the development of advanced wireless services. (See inset box.)
Maximizing Spectrum Sharing. In addition to freeing up spectrum for licensed use, the Administration has also actively sought ways to accelerate broadband deployment by facili-tating unlicensed uses in bands with Federal operations. For example, NTIA led efforts to allow unlicensed users to share spectrum with military radar operations in 255 MHz in the 5 GHz band.23 These efforts supported the development of new technologies that em-ploy innovative spectrum sensing and avoidance techniques capable of preventing radio interference to the radar operations. This has resulted in unlicensed mobile broad-band Wi-Fi devices with higher data speeds.
NTIA h
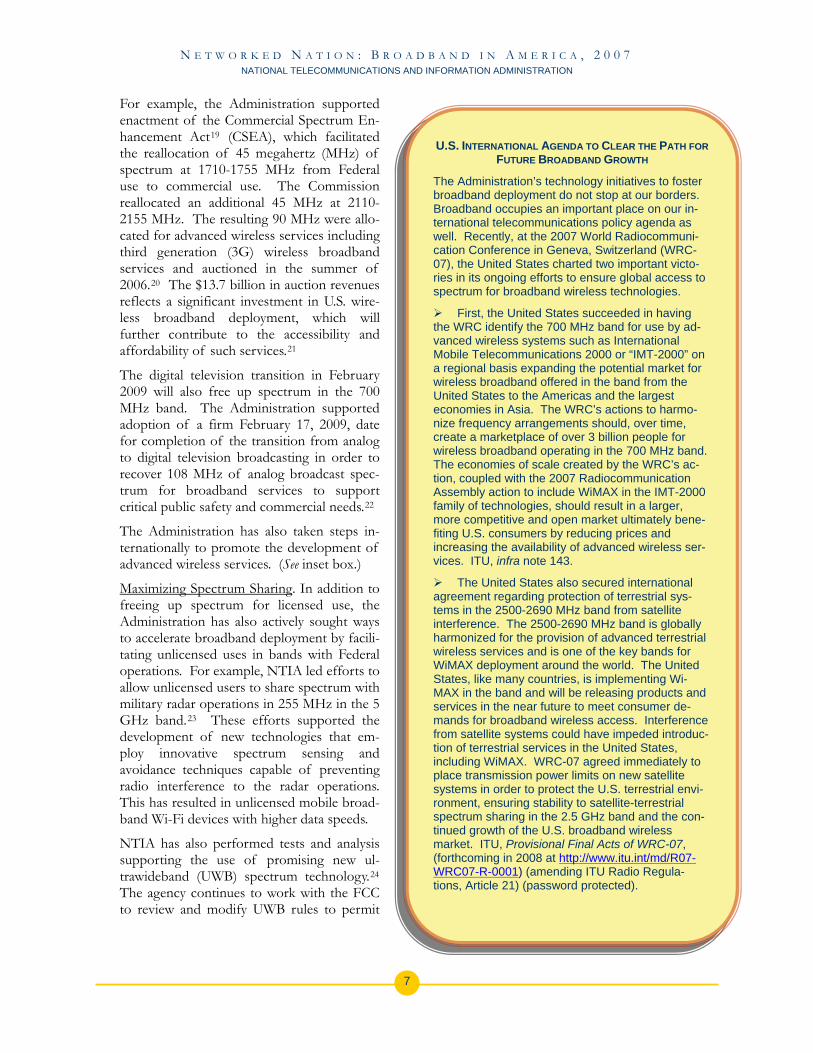
U.S. INTERNATIONAL AGENDA TO CLEAR THE PATH FOR FUTURE BROADBAND GROWTH
The Administration’s technology initiatives to foster broadband deployment do not stop at our borders. Broadband occupies an important place on our in-ternational telecommunications policy agenda as well. Recently, at the 2007 World Radiocommuni-cation Conference in Geneva, Switzerland (WRC-07), the United States charted two important victo-ries in its ongoing efforts to ensure global access to spectrum for broadband wireless technologies.
First, the United States succeeded in having the WRC identify the 700 MHz band for use by ad-vanced wireless systems such as International Mobile Telecommunications 2000 or “IMT-2000” on a regional basis expanding the potential market for wireless broadband offered in the band from the United States to the Americas and the largest economies in Asia. The WRC’s actions to harmo-nize frequency arrangements should, over time, create a marketplace of over 3 billion people for wireless broadband operating in the 700 MHz band. The economies of scale created by the WRC’s ac-tion, coupled with the 2007 Radiocommunication Assembly action to include WiMAX in the IMT-2000 family of technologies, should result in a larger, more competitive and open market ultimately bene-fiting U.S. consumers by reducing prices and increasing the availability of advanced wireless ser-vices. ITU, infra note 143.
The United States also secured international agreement regarding protection of terrestrial sys-tems in the 2500-2690 MHz band from satellite interference. The 2500-2690 MHz band is globally harmonized for the provision of advanced terrestrial wireless services and is one of the key bands for WiMAX deployment around the world. The United States, like many countries, is implementing Wi-MAX in the band and will be releasing products and services in the near future to meet consumer de-mands for broadband wireless access. Interference from satellite systems could have impeded introduc-tion of terrestrial services in the United States, including WiMAX. WRC-07 agreed immediately to place transmission power limits on new satellite systems in order to protect the U.S. terrestrial envi-ronment, ensuring stability to satellite-terrestrial spectrum sharing in the 2.5 GHz band and the con-tinued growth of the U.S. broadband wireless market. ITU, Provisional Final Acts of WRC-07, (forthcoming in 2008 at
as also performed tests and analysis supporting the use of promising new ul-trawideband (UWB) spectrum technology.
http://www.itu.int/md/R07-WRC07-R-000124
The agency continues to work with the FCC to review and modify UWB rules to permit
) (amending ITU Radio Regula-tions, Article 21) (password protected).
7
N E T W O R K E D N A T I O N : B R O A D B A N D I N A M E R I C A , 2 0 0 7 NATIONAL TELECOMMUNICATIONS AND INFORMATION ADMINISTRATION
innovative technologies to operate while also protecting Federal operations.
In February 2005, NTIA and the FCC launched an online registration site for high-speed wireless links sharing spectrum in the 70-80-90 GHz bands.25 Since the website became operational, assignments submitted using the website have increased substantially each year. This automated coordination illus-trates how information technology and engineering analysis capabilities can be lever-aged to afford non-Federal users faster and easier access to spectrum.
Cooperative Testing and Support for New Technologies. The Administration has also studied new technologies and conducted sci-entific testing to facilitate the use of existing technology platforms and spectrum to deliver innovative new broadband applications. For example, the FCC and NTIA have worked cooperatively to promote the development of Broadband over Power Line (BPL) technol-ogy, a potential “third broadband wire into the home,” while safeguarding existing li-censed radio services against harmful interference.26 NTIA conducted a series of measurements and computer simulation that demonstrated that BPL should not pose an interference problem for existing Federal ra-diocommunication systems.27
Regulatory Policies
Encouraging research and development of pioneering new technologies is critical, but the resulting technological advances can only take root and flourish if the landscape is properly prepared. Accordingly, the Administration has worked to clear away regulatory obstacles that could thwart the investment that fuels development – and deployment – of new technologies.
Targeted Deregulation to Promote Facili-ties-Based Investment. The Administration supported the FCC’s efforts to modify legacy regulations in order to expand incentives for local telephone companies (incumbent local exchange carriers, or “ILECs”) to invest in network upgrades and to stimulate new facili-ties-based investment by other providers.28 In a series of orders in its Triennial Review
proceeding, the FCC relieved ILECs of the obligation to make their next generation broadband facilities (e.g., residential fiber-to-the-home (FTTH) and fiber-to-the-curb net-works, and FTTH networks serving residential multiunit buildings) available to competitors at discounted rates, terms, and conditions.29 The Commission determined that these deregulatory measures would make the ILECs more likely to upgrade their exist-ing copper-based facilities “with fiber [that] will permit far greater and more flexible broadband capabilities.”30
Elimination of Artificial Distinctions Among Similar Services. Convergence fu-eled by broadband services has blurred the lines that differentiated companies in various sectors from one another and served as the historical basis for legacy regulatory models. Cable companies now provide voice and data services over the same lines that carry their video programming services. Telephone companies do the same, as do satellite and wireless providers. With the Administration’s backing, the FCC has also moved aggressively to end economic regulation of broadband services. The Commission specifically elimi-nated disparate treatment for competing providers offering the same types of services, ensuring that broadband services are treated similarly whether they are provided by legacy telephone or cable companies. This has helped to stimulate vigorous competition among these providers.
As an initial step, in 2002, the Commission resolved marketplace uncertainties related to the regulatory status of cable modem services offered by cable television systems. The Commission declared that although these ser-vices are interstate in nature, they are “information services” and therefore are nei-ther subject to regulation under Title II of the Communications Act nor to regulation by the states.31 In 2005, in its order on DSL ser-vices, the FCC brought the regulation of DSL services into parity with that of cable modem service by removing legacy regulations from DSL providers that had required them to share their networks with competing Internet service providers (ISPs), tariff their DSL ser-vices, and comply with other traditional
8
N E T W O R K E D N A T I O N : B R O A D B A N D I N A M E R I C A , 2 0 0 7 NATIONAL TELECOMMUNICATIONS AND INFORMATION ADMINISTRATION
telephone regulations.32 In so doing, Chair-man Martin observed that the Commission’s action constituted:
an explicit recognition that the telecom-munications marketplace that exists today is vastly different from the one governed by regulators over 30 years ago. . . . [T]he broadband Internet ac-cess market today is characterized by multiple platforms that are vigorously competing for customers. Such changed market conditions require, as the Su-preme Court in the Brand X decision phrased it, a “fresh analysis.” I am pleased that the Commission so quickly undertook this analysis, and, in so doing, removed legacy regulation that applied to only one of the platform providers - the telephone companies.
Broadband deployment is vitally impor-tant to our nation as new, advanced services hold the promise of unprece-dented business, educational, and health-care opportunities for all Americans. Perpetuating the application of outdated regulations on only one set of Internet access providers inhibits infrastructure investment, innovation, and competition generally.33
Since then, the Commission has established a similar deregulatory framework for broadband Internet access services provided by BPL providers34 and wireless carriers.35 These actions reflect the spirit of the Administra-tion’s technology-neutral approach. Placing competitors offering similar services on a similar footing creates incentives for invest-ment and helps to ensure that resources are allocated according to competitive merit rather than in response to regulatory con-straints.
Voice Over Internet Protocol. The Ad-ministration has further encouraged aggressive broadband network deployment by support-ing policies to ensure that major applications running on the Internet remain free from un-necessary economic regulation. In particular, the Administration has endorsed FCC policies to date not to impose traditional economic regulation (such as rate regulation, tariffing,
and entry and exit regulation) on “voice over Internet protocol” (VoIP) services, and to ensure that states do not impose such regula-tions. In particular, the Administration strongly supported the Commission’s deter-mination that VoIP services that do not utilize the public switched telephone network are unregulated “information services.”36 The Administration also strongly supported the FCC’s declaration that VoIP services are in-terstate services that are not subject to State economic regulation.37
Cable Franchise Reform to Stimulate Competition in Video Programming Ser-vices. The Administration has also strongly supported efforts to promote competition in the video services marketplace as an impor-tant element of broadband policy. The opportunity to deliver competitive advanced programming services creates an incentive for video service providers to deploy broadband infrastructure which, in turn, helps to acceler-ate broadband penetration. Recognizing this fact, the Administration has, in particular, supported video franchising reform in order to promote competition in the multi-channel video programming market. 38
Motivated by these same principles, the FCC in 2006 adopted rules to ensure that local ca-ble franchising processes do not unreasonably interfere with rapid broadband deployment or competitors’ entry into the cable market-place.39 Specifically, the Commission’s reforms removed regulatory barriers to new video entrants by, among other things, requir-ing franchising authorities to act on franchise applications within a reasonable time period and constraining franchise authorities from imposing unreasonable build-out and/or un-related service requirements as a condition for awarding a franchise.40 In so doing, the Commission paved the way for more rapid growth of broadband access by removing im-pediments that had “discourage[d] investment in fiber-based infrastructure necessary for the provision of advanced broadband services.”41
Opening Federal Land Resources. The Administration has also sought to spur greater broadband deployment by improving the management of rights-of-way on Federal
9
N E T W O R K E D N A T I O N : B R O A D B A N D I N A M E R I C A , 2 0 0 7 NATIONAL TELECOMMUNICATIONS AND INFORMATION ADMINISTRATION
lands. In April 2004, the President signed an executive memorandum that recognized the need of broadband providers for “timely and cost-effective access to rights-of-way so that they can build out their networks.”42 The memorandum has facilitated greater access for service providers to rights-of-way on Federal lands by directing Federal departments and agencies to (1) streamline and standardize applications to reduce the administrative burden and costs on broadband providers, (2) expedite their consideration of rights-of-way applications, (3) ensure that the fees they charge for right-of-way access are reasonable and appropriate, and (4) ensure that they have the proper tools to promote compliance with rights-of-way grants or permits.43
Fiscal Policies and Targeted Funding Efforts
As his Technology Agenda reflects, the Presi-dent has long recognized that entrepreneurs and small businesses constitute two of our nation’s most important sources for techno-logical innovation. Accordingly, from the earliest days of his Administration, the Presi-dent has advocated for economic policies to nurture their growth.
In keeping with this view, the Administration endorsed and implemented a number of ini-tiatives specifically designed to stimulate investment in broadband technology. These include both fiscal policies to reduce tax bur-dens and encourage investment, as well as targeted loan and funding programs to accel-erate broadband deployment in rural and remote areas. Coupled with the technology and regulatory policies outlined above, these measures have exerted significant force to advance broadband development and de-ployment.
Reducing Tax Burdens. The implementa-tion of certain tax provisions has given businesses powerful incentives to invest in broadband technology. Three elements com-prise the core of these fiscal initiatives:
Internet Tax Moratorium. From the begin-ning, preserving the tax-free status of Internet access has been the cornerstone of the Presi-dent’s broadband policy. First enacted in
1998, the Internet tax moratorium prohibits, subject to limited grandfathering, state and local governments from imposing taxes on Internet access and multiple or discriminatory taxes on online transactions. Recognizing that such tax burdens reduce consumer demand for new services, the President has signed ex-tensions of this ban into law three times (2001, 2004, and 2007) and has consistently urged that the moratorium be made perma-nent.44 This important legislation provides the marketplace with a predictable environ-ment for investment in new and better technologies while ensuring that the critical communications infrastructure of the Inter-net remains free of unnecessary taxes.
Accelerated Depreciation. In a rapidly chang-ing area such as the development of new technologies, depreciation policies can also impede investment. New technical advances (and the assets that accompany them) often become obsolete before their value can be recaptured under the tax laws, thereby making investment in new technologies more expen-sive and uncertain. To combat this problem, the President signed into law, as part of his economic security package (the Jobs and Growth Tax Reconciliation Act of 2003), re-forms that allow companies to accelerate depreciation for capital expenditures (includ-ing those associated with broadband deployment) and permit the depreciation of as much as 30 percent of the basis in certain property in the first year.45 These changes have helped stimulate business investment in critical networking infrastructure and broad-band equipment.
Tax Credits for Research & Development. Finally, the Administration has promoted tax relief for private research and development. The President signed into law the Tax Relief and Health Care Act of 2006, which extended and enhanced the “Research and Experimen-tation (R&E) Tax Credit,” a long-standing provision of the tax code that provided a 20 percent credit for private research and ex-perimentation expenditures above a certain base amount.46 Unfortunately, this provision of the code expired at the end of 2007. The President has long advocated making this tax credit permanent and urges Congress to rein-
10

N E T W O R K E D N A T I O N : B R O A D B A N D I N A M E R I C A , 2 0 0 7 NATIONAL TELECOMMUNICATIONS AND INFORMATION ADMINISTRATION
state this provision, which has helped to fuel more innovation across the economy. 47
Targeted Direct Support for Remote and Rural Areas. To complement the market-based initiatives outlined above, the Admini-
funding to support more rapid deployment of broadband in unserved or otherwise under-served rural areas. Since Fiscal Year 2001, USDA has provided nearly $5 billion in loans and grants to support telecommunication ex-pansion and improvements which can improve access to broadband technology.stration has also provided targeted seed-
elopment Broadband
, over half
nal Rural Develop-
48 In particular, the USDA supports broadband development in rural America through several programs: the Broadband Loan and Loan Guarantee Program, the “traditional” Tele-communications Infrastructure Loan program, the Community Oriented Connec-tivity Broadband Grant Program (Community Connect), and the Distance Learning and Telemedicine Program.
Through the Rural Dev
Alaska Power & Telephone Takes the High Ground:
Bringing Wireless Broadband to the Rural Alaskan Village of Kasaan
KKEETTCCHHIIKKAANN,, AAllaasskkaa [[NNoovveemmbbeerr 1199,, 22000077]] ---- WWiirreelleessss bbrrooaadd--bbaanndd tteecchhnnoollooggyy tthhaatt wwiillll bbrriinngg tteelleemmeeddiicciinnee,, ddiissttaannccee lleeaarrnniinngg aanndd ootthheerr bbeenneeffiittss ttoo tthhee ppeeooppllee ooff KKaassaaaann iiss nnooww aa rreeaalliittyy wwiitthh tthhee ccoommpplleettiioonn ooff aa ssuucccceessssffuull ccoollllaabboorraattiivvee eeffffoorrtt bbeettwweeeenn AAllaasskkaa PPoowweerr && TTeelleepphhoonnee CCoommppaannyy ((AAPP&&TT)),, aanndd tthhee OOrrggaanniizzeedd VViillllaaggee ooff KKaassaaaann ((OOVVKK))..
CCoommpplleettiioonn ooff tthhee wwoorrkk aanndd ddeelliivveerryy ooff wwiirreelleessss bbrrooaaddbbaanndd sseerrvviicceess ttoo KKaassaaaann,, aann AAllaasskkaann NNaattiivvee ccoommmmuunniittyy llooccaatteedd 2255 mmiilleess wweesstt ooff KKeettcchhiikkaann oonn PPrriinnccee ooff WWaalleess IIssllaanndd,, wwaass aann--nnoouunncceedd ttooddaayy bbyy AAPP&&TT aanndd OOVVKK..
OOVVKK''ss ppeerrssiisstteennccee iinn ppuurrssuuiinngg IInntteerrnneett aacccceessss ffoorr tthheeiirr rruurraall ccoommmmuunniittyy lleedd tthheemm ttoo ttaakkee nnoottee ooff AAPP&&TT''ss ssuucccceessss iinn bbrriiddgg--iinngg tthhee ddiiggiittaall ggaapp iinn ootthheerr rruurraall AAllaasskkaann llooccaattiioonnss.. TThhee pprrooccuurreemmeenntt ooff $$11 mmiilllliioonn iinn ggrraanntt ffuunnddss uunnddeerr tthhee FFeeddeerraall ""CCoommmmuunniittyy CCoonnnneecctt BBrrooaaddbbaanndd GGrraanntt PPrrooggrraamm"" ffuueelleedd bbootthh hhooppee aanndd aa ccooooppeerraattiivvee eeffffoorrtt ttoo bbuuiilldd tthhee iinnffrraassttrruuccttuurree nneecc--eessssaarryy ffoorr tthhee vviillllaaggee ttoo ggaaiinn hhiigghh--ssppeeeedd aacccceessss ttoo tthhee oouuttssiiddee wwoorrlldd..
CCoonnssttrruuccttiioonn oonn tthhee pprroojjeecctt bbeeggaann iinn eeaarrllyy 22000077.. TThhee ssccooppee ooff tthhee pprroojjeecctt aanndd ggrraanntt eennccoommppaasssseedd ccoonnssttrruuccttiioonn ooff aa mmoouunnttaaiinn--ttoopp aanntteennnnaa ssiittee aabboovvee tthhee vviillllaaggee oonn KKaassaaaann MMoouunnttaaiinn,, ffoorrmmaattiioonn ooff aa ccoommmmuunniittyy tteecchhnnoollooggyy cceenntteerr,, aanndd ddeelliivveerryy ooff IInntteerrnneett sseerrvviiccee aass wweellll aass mmoorree tthhaann aa ddoozzeenn ccoommppuutteerrss aanndd tthhee ootthheerr eeqquuiippmmeenntt nneeeeddeedd ttoo mmoovvee KKaassaaaann iinnttoo tthhee ddiiggiittaall eerraa.. RRiicchhaarrdd PPeetteerrssoonn,, PPrreessiiddeenntt ooff OOVVKK,, ssttaatteess,, ""AAPP&&TT hhaass ccoommee aalloonnggssiiddee uuss iinn aa mmaannnneerr tthhaatt hhaass bbeeeenn ssiimmppllyy aassttoouunnddiinngg.. TThheeyy hhaavvee rreessppoonnddeedd ttoo oouurr ccoomm--mmuunniittyy iinn aa wwaayy ffeeww ootthheerrss wwoouulldd..""
CCeerrttaaiinn iimmmmeeddiiaattee kkeeyy bbeenneeffiittss ttoo tthhee ccoommmmuunniittyy wwiillll bbee mmeett bbyy aacccceessss ttoo bbrrooaaddbbaanndd tteecchhnnoollooggyy.. TThheessee iinncclluuddee aacccceessss ttoo tteelleemmeeddiicciinnee,, ddiissttaannccee lleeaarrnniinngg,, ccoonnnneeccttiioonn ttoo ootthheerr ttrriibbaall oorr--ggaanniizzaattiioonnss,, rreedduuccttiioonn ooff ttrraavveell ccoossttss aanndd ppeerrssoonnaall sskkiillll--sseett ttrraaiinniinngg iinn ccoommppuutteerr aanndd ddaattaa tteecchhnnoollooggiieess.. IItt iiss hhooppeedd tthhaatt bbyy eennhhaanncciinngg tthhee llooccaall qquuaalliittyy ooff lliiffee,, bbuussiinneessss aanndd ttrriibbaall mmeemmbbeerrss wwiillll bbee eennccoouurraaggeedd ttoo rreettuurrnn oorr ssttaayy iinn KKaassaaaann..
""CCoommiinngg ttooggeetthheerr wwiitthh tthhee VViillllaaggee ooff KKaassaaaann oonn tthhiiss pprroojjeecctt wwaass aa nnaattuurraall eexxtteennssiioonn ooff wwhhoo wwee aarree aass aann eemmppllooyyeeee--oowwnneedd AAllaasskkaann ccoommppaannyy,, aass wweellll aass aa kkeeyyssttoonnee iinn AAPP&&TT''ss bbrrooaaddeerr ppllaannss ffoorr SSoouutthheeaasstteerrnn AAllaasskkaa,,"" ssttaatteedd MMiicchhaaeell GGaarrrreetttt,, EExxeeccuuttiivvee VViiccee PPrreessiiddeenntt ooff AAPP&&TT aanndd CCOOOO ooff AAPP&&TT''ss TTeelleeccoomm DDiivviissiioonn..
AAPP&&TT pprroovviiddeess aa bbrrooaadd rraannggee ooff sseerrvviicceess ttoo mmoorree tthhaann 3300 ccoommmmuunniittiieess ssttrreettcchhiinngg ffrroomm tthhee AArrccttiicc CCiirrccllee ttoo tthhee ssoouutthh--eerrnnmmoosstt rreeaacchheess ooff SSoouutthheeaasstteerrnn AAllaasskkaa.. TThheessee iinncclluuddee llooccaall aanndd lloonngg ddiissttaannccee vvooiiccee,, IInntteerrnneett,, wwiirreelleessss bbrrooaaddbbaanndd WWii--FFii,, ppaaggiinngg,, ttwwoo--wwaayy mmoobbiillee rraaddiiooss,, ccoommppuutteerr nneettwwoorrkkiinngg aanndd ddeelliivveerryy ooff rreenneewwaabbllee rreessoouurrccee bbaasseedd eenneerrggyy sseerrvviicceess..
## ## ## ## SOURCE: Alaska Power & Telephone Company (reprinted with permission) http://www.aptalaska.com/upload/pdf/
KasaanPressRelease.pdf
FFUUNNDDIINNGG IINNIITTIIAATTIIVVEESS AATT WWOORRKK
Loan and Loan Guarantee Program, USDA provides loans to finance technological solu-tions tailored to the needs of individual communities. Unlike the Community Con-nect Grant Program (discussed below), USDA’s loans can fund an additional provider in an area. In the seven years of the Pro-gram’s existence, USDA has approved 70 loans totaling $1.11 billion. The funds have been used to bring a range of technologies including fiber-to-the-premises, DSL, wireless, BPL, and hybrid fiber/coaxial systems to over 1,200 communities in 40 states representing 582,000 household subscribers.49
At the time the loans were awardedof these communities either received no broadband service (40 percent) or were served by only one provider (15 percent). To date, eight projects have been completed in Kansas, Louisiana, Michigan, Nebraska, North and South Dakota, Texas, and Washington. In addition, another 38 loans remain in progress (and 15 in initial start-up phase) serving an-other 987 communities.
In addition, the traditioment Telecommunications Infrastructure Program provides loans to ILECs that are successfully deploying advanced, high-speed networks capable of providing broadband services for their rural customers.50 Over the past seven years, these borrowers have re-ceived over $3.8 billion in loans from USDA to construct and improve facilities designed to
11
N E T W O R K E D N A T I O N : B R O A D B A N D I N A M E R I C A , 2 0 0 7 NATIONAL TELECOMMUNICATIONS AND INFORMATION ADMINISTRATION
million for broadband projects.offer broadband services.51 Based on a survey of Rural Development's traditional telephone loan program borrowers conducted in Octo-ber 2006, approximately 92 percent of these borrowers are providing high-speed Internet service (broadband) to all of the telephone exchanges in their service territories.
56 Most re-cently, in October of 2007, USDA awarded $10.3 million to support 19 projects in 13 states.57
52 In addition, they have deployed over 107,000 miles of fiber optic cable.53
The Community Connect Grant Program
Community Connect Grants totaling $48.3
ages and
Examples include $834,881 to intro-duce broadband service in Marcus, Washington, and provide firefighters access to training videos and reports; $603,200 to build a community center and computer lab in Darbyville, Ohio, that will offer high-speed Internet access to universities and medical centers state wide; and $205,416 to build a wireless network in Navajo Mountain, Utah, to provide online public safety notices, educa-tional opportunities, and telemedicine services in this community that is over 100 miles away from the nearest hospital.
helps ensure that rural consumers receive the same quality and range of telecommunications service as do residents in urban and suburban communities.54 Under the program, USDA provides financial assistance to furnish broad-band service in rural, economically-challenged communities of up to 20,000 inhabitants as yet unserved by a broadband provider. Community Connect grants are awarded on a competitive basis. Grant recipients may use funds to deploy broadband service to “critical community facilities [e.g., rural schools, librar-ies, education centers, health care providers, law enforcement agencies, and public safety organizations], rural residents, and rural busi-nesses and to construct, acquire, or expand, equip, and operate a community center that provides free access to broadband services to community residents for at least two years.”
58
Through its Distance Learning and Telemedi-cine Program, USDA encourimproves educational and health care services in rural areas through the use of telecommu-nications, computer networks and related advanced technologies. The program pro-vides funding through 100 percent grants; a combination of grants and loans; or 100 per-cent loans. Funding amounts start at $50,000. In 2007, USDA awarded a total of $22.3 mil-lion to 78 grantees in 31 states.59 Additionally, USDA awarded $35.9 million in loans under this program to benefit projects in eleven states.
55
Over the past five years, USDA has awarded
Progress in Broadband Access his comprehensive and integrated package of fiscal, technology, and regulatory polices has had a real and
positive impact in the broadband marketplace. American consumers are now reaping the re-wards of President Bush’s vision to “create an environment in which the entrepreneur can flourish [and] in which technologies can reach new frontiers:” a vigorous broadband market-place in which carriers offering a host of technological platforms compete against one another on price, speed, mobility, content, and other service features.
The lack of a single authoritative data set makes it difficult to establish with certainty
whether broadband penetration has become ubiquitous, and this Report acknowledges the benefits of better data gathering tools. TT 60 Nev-ertheless, a survey of data from the FCC and other sources reveals a very clear pattern: broadband services have become dramatically more available and affordable across the country. Although additional work remains to be done, broadband penetration is increasing sharply, and consumers – including those in rural and remote areas – have more opportu-nities than ever to choose the broadband solution (i.e., technology, services, and pro-vider) that best suits their needs and budget.
12
N E T W O R K E D N A T I O N : B R O A D B A N D I N A M E R I C A , 2 0 0 7 NATIONAL TELECOMMUNICATIONS AND INFORMATION ADMINISTRATION
13
Vigorous U.S. Platform Growth, Multi-Modal Competition, and Broad-band Availability
Perhaps the clearest evidence of the success of the Administration’s pro-competitive, technologically-neutral approach lies in the sheer growth in the number of broadband service providers and the broad array of tech-nological alternatives they represent. Over the past few years, the numbers of providers and broadband platforms have proliferated. As Table 1 illustrates, the most current data from the FCC show that the total number of high-speed service providers more than tripled from December 2003 to December 2006 (and increased tenfold between December 2000 and December 2006).
While the data reflect steady increases in the number of high speed cable service providers, and somewhat stronger growth among asym-metrical digital subscriber line (ADSL) providers, it is noteworthy that the most vig-orous expansion has occurred among “all
other” providers, which include symmetric DSL (SDSL), mobile wireless services, fixed wireless (e.g., Wi-Fi and WiMAX), satellite, fiber optic, and BPL. As Table 1 displays, this category grew by nearly 259 percent, from 246 providers in 2003 to 882 a year ago.
This remarkable growth in the number of broadband service providers has brought with it an even greater increase in the number of broadband lines available to consumers. With this increase in broadband lines, the numbers of subscribers and users have also grown. Chart 1 below reflects that since President Bush took office, the total number of broad-
band lines across all modalities has grown by over 1,100 percent, from almost 6.8 million in December 2000 to 82.5 million in December 2006.61 According to other FCC statistics, over 58 million of these lines serve residential customers.62
Table 1 Nationwide Number of Providers of High-Speed Lines by Technology
(Over 200 kbps in at least one direction)
ADSL Cable Modem All Other 1 Total Dec 1999 28 43 65 105 Jun 2000 47 36 75 116 Dec 2000 68 39 87 136
Jun 2001 86 47 98 160 Dec 2001 117 59 122 203
Jun 2002 142 68 138 237 Dec 2002 178 87 169 299
Jun 2003 235 98 217 378 Dec 2003 274 110 246 432
Jun 2004 298 129 281 485 Dec 2004 352 147 312 552
Jun 2005 758 227 779 1,270 Dec 2005 820 242 835 1,347
Jun 2006 832 254 814 1,324 Dec 2006 862 278 882 1,397
For data through December 2004, only those providers with at least 250 lines per state were required to file. Some historical data have been revised. 1 All other includes SDSL, traditional wireline, fiber, satellite, fixed and mobile wireless, and power line. Source: High-Speed Services for Internet Access: Status as of December 31, 2006, Federal Communications Commission (October 2007), Table 7 [“FCC Study”]
N E T W O R K E D N A T I O N : B R O A D B A N D I N A M E R I C A , 2 0 0 7 NATIONAL TELECOMMUNICATIONS AND INFORMATION ADMINISTRATION
14
Competition among the various platforms has also increased sharply. In December 2003, over half (54 percent) of zip codes had three or fewer competitors. (See Table 2.) By De-cember 2006, 91.5 percent of zip codes had three or more competing service providers and more than 50 percent of the nation’s zip codes had 6 or more competitors. By con-trast, fewer than 3 percent of the nation’s zip codes now have one provider or less.
Recent survey data collected by the United States Census Bureau on behalf of NTIA provides further evidence that broadband is experiencing strong growth in the United States. In October 2007, the Census Bureau surveyed approximately 54,000 households, with information on 128,395 persons, as a
special Internet use supplement to the Cur-rent Population Survey (CPS).63 Based on its scientific design and size, the survey provides a broad-based and statistically reliable look at Americans’ use of the Internet and, more par-ticularly, their use of high-speed technologies to connect to it.
The data reveal that Americans’ use of broad-band technologies has soared: home broadband usage has risen substantially over the past six
years, from 9.1 percent of households in Sep-tember 200164 to 50.8 percent in October 2007.65 Rural America has also experienced impressive growth. In September 2001, 5.6 percent of rural households had broadband at home;66 six years later, the rate had reached 38.8 percent, more than a six-fold increase.67 Natu-
Table 2: Percentage of Zip Codes with High-Speed Lines in Service 1999 2000 2001 2002 2003 2004 2005 2006 Number of Pro-
viders Dec Jun Dec Jun Dec Jun Dec Jun Dec Jun Dec Jun Dec Jun Dec Zero 40.3 33 26.8 22.2 20.6 16.1 12 9 6.8 5.7 4.6 2 1 0.7 0.4One 26 25.9 22.7 20.3 19.3 18.4 17.3 16.4 14.9 13.8 12.5 9.3 5.6 3.7 2.4Two 15.5 17.8 18.4 16.7 15.7 16.2 16.8 16.9 17.1 16.8 16.3 14.1 11.9 8.2 5.7Three 8.2 9.2 10.9 13.2 13.1 13.3 14.4 14 14.9 14.9 15.1 15 14.8 11.3 8.9Four 4.3 4.9 6.1 8.2 9.1 9.6 10.3 10.6 11.2 11.6 12.2 12.6 13.5 12.9 11.4Five 2.7 3.4 4 4.9 6.1 6.9 7.3 7.7 7.8 8.4 8.9 9.7 10.3 12.2 12.5Six 1.7 2.5 3 3.6 4.2 4.6 5 5.3 5.8 6.1 6.3 6.8 7.8 10.4 11.7Seven 0.8 1.7 2.3 2.8 3.2 3.2 3.9 4 4.2 4.4 4.6 5.3 5.7 8.7 10Eight 0.3 0.8 2 2.2 2.5 2.8 2.7 3.1 3.3 3.6 3.6 4 4.6 7.1 8.3Nine 0.2 0.4 1.6 1.9 2 2.4 2.2 2.5 2.6 2.8 3.1 3.8 4 5.8 6.7Ten or More 0 0.4 2.4 3.9 4 6.4 8 10.5 11.4 11.8 12.8 17.5 20.7 19.1 22For data through December 2004, only those providers with at least 250 lines per state were required to file. Figures may not add up to 100% due to rounding.
Source: FCC Study, Table 15
Chart 1: Total High-Speed Lines
Source: FCC Study, Chart 1
N E T W O R K E D N A T I O N : B R O A D B A N D I N A M E R I C A , 2 0 0 7 NATIONAL TELECOMMUNICATIONS AND INFORMATION ADMINISTRATION
rally, while use of broadband has grown robus-tly, dial-up use has declined as the significant advantages of an increasingly-available and af-fordable broadband connection have gained favor.
Importantly, evidence suggests that this pro-gress is not restricted to the more populated areas of the country. An April 2007 survey by the Organization for the Promotion and Ad-vancement of Small Telecommunications Companies (OPASTCO) revealed that ILECs offer broadband services to more than 90 percent of their rural customer base, chiefly via DSL.
68 Households in many states have en-joyed rising levels of broadband use: adoption rates today equal or surpass the 40th percentile for at least 41 states and the District of Colum-bia.69 New Hampshire and Alaska have usage levels approximating 60 percent of their house-holds.
73 Similarly, based on December 2006 data, the National Exchange Carrier As-sociation (NECA) found that 511 of its member companies (representing 462,000 DSL lines located in 47 states and Guam) av-eraged 91 percent DSL availability.
70
The foregoing data demonstrate that broad-band usage has grown dramatically in the United States. As detailed in the following sections, information from within each of the broadband modal sectors, which shows vi-brant growth in deployment and subscriber uptake, reinforces this conclusion. As usage continues to grow, providers will be driven to make further investments to ensure that broadband networks and services are widely available to meet expanding consumer de-mand.
74 In the study, 352 of the companies offered DSL to between 91 and 100 percent of their custom-ers, while another 80 provided such coverage to between 81 and 90 percent of their cus-tomer base. In all, 84 percent of the companies made DSL available to more than 80 percent of their customers.75 ILECs re-sponding to a 2006 survey by the National Telecommunications Cooperative Association (NTCA) indicated that all offered broadband service to some part of their rural customer base, up from 58 percent of the respondents in 2000. Again, DSL was the primary broad-band service offering.
Digital Subscriber Lines (DSL)
Wireline communications service providers, such as ILECs and competitive local exchange carriers (CLECs), primarily offer broadband services using DSL, a technology that allows them to derive a separate high capacity trans-mission channel from the copper loop used to provide conventional voice service. There are two basic varieties of DSL service – “asym-metric,” for which the transmission speed in one direction (typically the “downstream” path from the network to the customer) is faster than the other, and “symmetric,” for which the transmission speed is equivalent in both directions.
76
As DSL service has been extended to more and more households, service speeds have accelerated and prices have dropped. Accord-ing to Verizon, in the past three years, the major DSL operators have increased their top downstream speeds from under 1 Mbps to 2-3 Mbps.77 AT&T notes that wireline provid-ers currently offer their DSL customers a variety of transmission speeds, typically rang-ing from 768 Kbps up to 6 Mbps.78 Ninety percent of the responding rural ILECs in the OPASTCO survey could deliver data speeds of at least 1 Mbps in one direction.79
Industry data demonstrate significant growth in the availability and affordability of DSL services. According to the FCC, as of year end 2006, broadband DSL was available to 79 percent of the households in areas where ILECs offer local telephone service.
The increasing speed of DSL services has not been accompanied by increased costs for con-sumers. By one estimate, the average monthly revenue per user of DSL service decreased from $40 in 2002 to $31 in 2006.71 More
than 82 percent of the homes served by the largest ILECs – Verizon, AT&T, and Qwest – can obtain DSL service.
80 Between 2004 and 2007, AT&T cut its monthly rate for 1.5 Mbps DSL service nearly 60 percent, from $49.95 to $19.99.81 According to the FTC, between May 2005 and April 2006, the price
72
15
N E T W O R K E D N A T I O N : B R O A D B A N D I N A M E R I C A , 2 0 0 7 NATIONAL TELECOMMUNICATIONS AND INFORMATION ADMINISTRATION
16
Chart 4
Note: Total housing units passed figures have been adjusted to avoid double counting of estimated housing units passed by both incumbent cable operators and overbuilders.
Source: NCTA (SNL Kagan) (used with permission) http://www.ncta.com/Statistic/Statistic/CableBroadbandAvailability.aspx
of AT&T’s 3.0 Mbps DSL offering dropped from $29.95 to $17.99.82
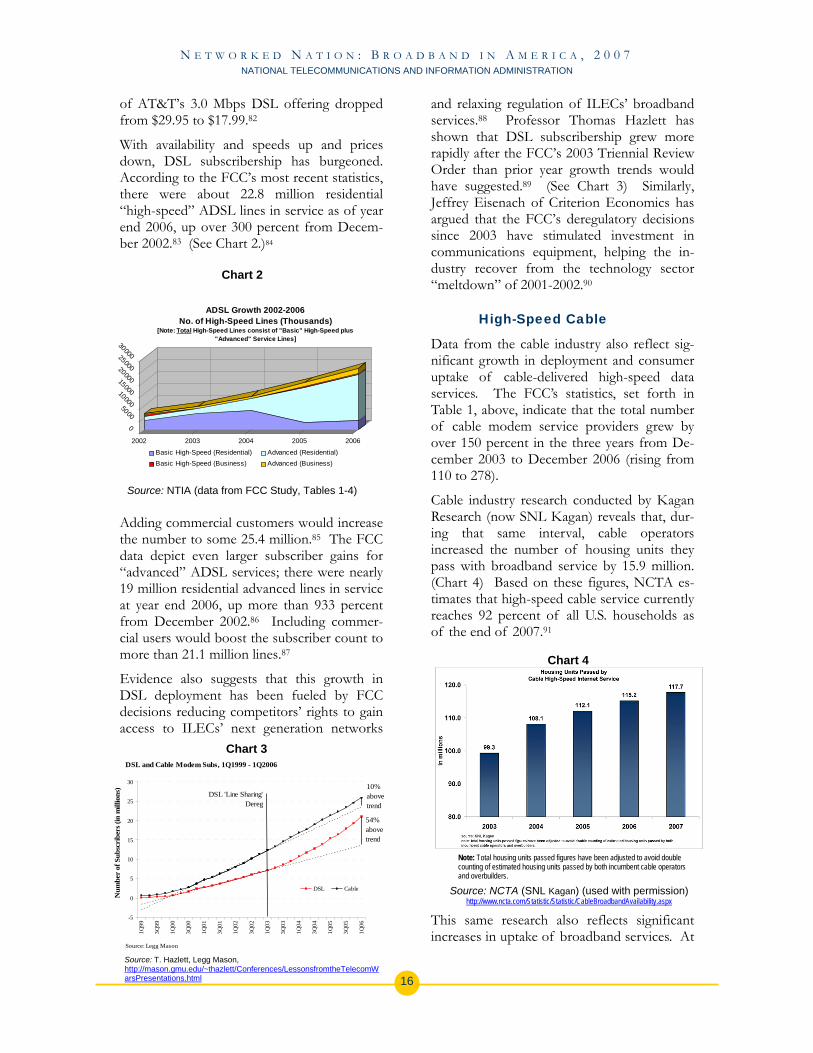
With availability and speeds up and prices down, DSL subscribership has burgeoned. According to the FCC’s most recent statistics, there were about 22.8 million residential “high-speed” ADSL lines in service as of year end 2006, up over 300 percent from Decem-ber 2002.83 (See Chart 2.)84
Adding commercial customers would increase the number to some 25.4 million.85 The FCC data depict even larger subscriber gains for “advanced” ADSL services; there were nearly 19 million residential advanced lines in service at year end 2006, up more than 933 percent from December 2002.86 Including commer-cial users would boost the subscriber count to more than 21.1 million lines.87
Evidence also suggests that this growth in DSL deployment has been fueled by FCC decisions reducing competitors’ rights to gain access to ILECs’ next generation networks
and relaxing regulation of ILECs’ broadband services.88 Professor Thomas Hazlett has shown that DSL subscribership grew more rapidly after the FCC’s 2003 Triennial Review Order than prior year growth trends would have suggested.89 (See Chart 3) Similarly, Jeffrey Eisenach of Criterion Economics has argued that the FCC’s deregulatory decisions since 2003 have stimulated investment in communications equipment, helping the in-dustry recover from the technology sector “meltdown” of 2001-2002.90
High-Speed Cable
Data from the cable industry also reflect sig-nificant growth in deployment and consumer uptake of cable-delivered high-speed data services. The FCC’s statistics, set forth in Table 1, above, indicate that the total number of cable modem service providers grew by over 150 percent in the three years from De-cember 2003 to December 2006 (rising from 110 to 278).
Cable industry research conducted by Kagan Research (now SNL Kagan) reveals that, dur-ing that same interval, cable operators increased the number of housing units they pass with broadband service by 15.9 million. (Chart 4) Based on these figures, NCTA es-timates that high-speed cable service currently reaches 92 percent of all U.S. households as of the end of 2007.91
This same research also reflects significant increases in uptake of broadband services. At
Chart 2
0
5000
10000
15000
20000
25000
30000
2002 2003 2004 2005 2006
ADSL Growth 2002-2006No. of High-Speed Lines (Thousands)
[Note: Total High-Speed Lines consist of "Basic" High-Speed plus "Advanced" Service Lines]
Basic High-Speed (Residential) Advanced (Residential)Basic High-Speed (Business) Advanced (Business)
Source: NTIA (data from FCC Study, Tables 1-4)
Chart 3
-5
0
5
10
15
20
25
30
1Q99
3Q99
1Q00
3Q00
1Q01
3Q01
1Q02
3Q02
1Q03
3Q03
1Q04
3Q04
1Q05
3Q05
1Q06
DSL Cable
DSL 'Line Sharing' Dereg
54% above trend
Num
ber
of S
ubsc
ribe
rs (i
n m
illio
ns)
DSL and Cable Modem Subs, 1Q1999 - 1Q2006
10% above trend
Source: Legg Mason
Source: T. Hazlett, Legg Mason, http://mason.gmu.edu/~thazlett/Conferences/LessonsfromtheTelecomWarsPresentations.html
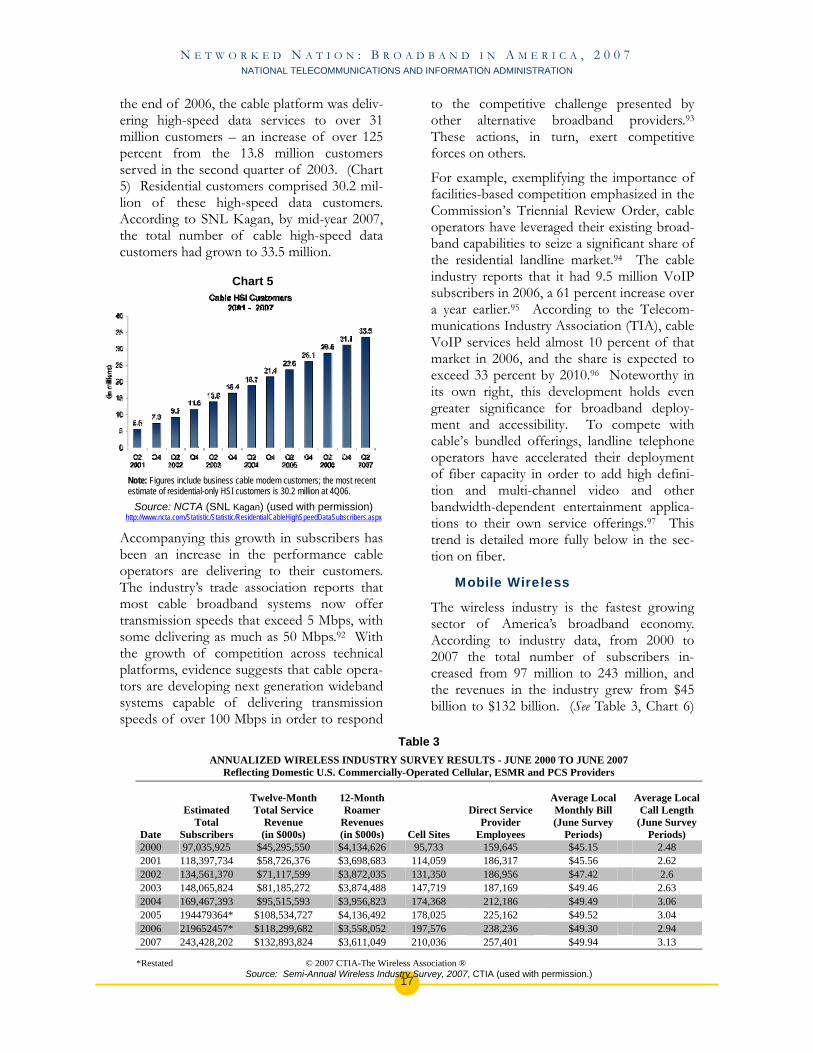
N E T W O R K E D N A T I O N : B R O A D B A N D I N A M E R I C A , 2 0 0 7 NATIONAL TELECOMMUNICATIONS AND INFORMATION ADMINISTRATION
17
the end of 2006, the cable platform was deliv-ering high-speed data services to over 31 million customers – an increase of over 125 percent from the 13.8 million customers served in the second quarter of 2003. (Chart 5) Residential customers comprised 30.2 mil-lion of these high-speed data customers. According to SNL Kagan, by mid-year 2007, the total number of cable high-speed data customers had grown to 33.5 million.
Accompanying this growth in subscribers has been an increase in the performance cable operators are delivering to their customers. The industry’s trade association reports that most cable broadband systems now offer transmission speeds that exceed 5 Mbps, with some delivering as much as 50 Mbps.92 With the growth of competition across technical platforms, evidence suggests that cable opera-tors are developing next generation wideband systems capable of delivering transmission speeds of over 100 Mbps in order to respond
to the competitive challenge presented by other alternative broadband providers.93 These actions, in turn, exert competitive forces on others.
For example, exemplifying the importance of facilities-based competition emphasized in the Commission’s Triennial Review Order, cable operators have leveraged their existing broad-band capabilities to seize a significant share of the residential landline market.94 The cable industry reports that it had 9.5 million VoIP subscribers in 2006, a 61 percent increase over a year earlier.95 According to the Telecom-munications Industry Association (TIA), cable VoIP services held almost 10 percent of that market in 2006, and the share is expected to exceed 33 percent by 2010.96 Noteworthy in its own right, this development holds even greater significance for broadband deploy-ment and accessibility. To compete with cable’s bundled offerings, landline telephone operators have accelerated their deployment of fiber capacity in order to add high defini-tion and multi-channel video and other bandwidth-dependent entertainment applica-tions to their own service offerings.97 This trend is detailed more fully below in the sec-tion on fiber.
Mobile Wireless
The wireless industry is the fastest growing sector of America’s broadband economy. According to industry data, from 2000 to 2007 the total number of subscribers in-creased from 97 million to 243 million, and the revenues in the industry grew from $45 billion to $132 billion. (See Table 3, Chart 6)
Table 3ANNUALIZED WIRELESS INDUSTRY SURVEY RESULTS - JUNE 2000 TO JUNE 2007
Reflecting Domestic U.S. Commercially-Operated Cellular, ESMR and PCS Providers
Date
Estimated Total
Subscribers
Twelve-Month Total Service
Revenue (in $000s)
12-Month Roamer
Revenues (in $000s) Cell Sites
Direct ServiceProvider
Employees
Average Local Monthly Bill (June Survey
Periods)
Average LocalCall Length
(June SurveyPeriods)
2000 97,035,925 $45,295,550 $4,134,626 95,733 159,645 $45.15 2.48 2001 118,397,734 $58,726,376 $3,698,683 114,059 186,317 $45.56 2.62 2002 134,561,370 $71,117,599 $3,872,035 131,350 186,956 $47.42 2.6 2003 148,065,824 $81,185,272 $3,874,488 147,719 187,169 $49.46 2.63 2004 169,467,393 $95,515,593 $3,956,823 174,368 212,186 $49.49 3.06 2005 194479364* $108,534,727 $4,136,492 178,025 225,162 $49.52 3.04 2006 219652457* $118,299,682 $3,558,052 197,576 238,236 $49.30 2.94 2007 243,428,202 $132,893,824 $3,611,049 210,036 257,401 $49.94 3.13
*Restated © 2007 CTIA-The Wireless Association ® Source: Semi-Annual Wireless Industry Survey, 2007, CTIA (used with permission.)
Chart 5
Note: Figures include business cable modem customers; the most recent estimate of residential-only HSI customers is 30.2 million at 4Q06.
Source: NCTA (SNL Kagan) (used with permission) http://www.ncta.com/Statistic/Statistic/ResidentialCableHighSpeedDataSubscribers.aspx
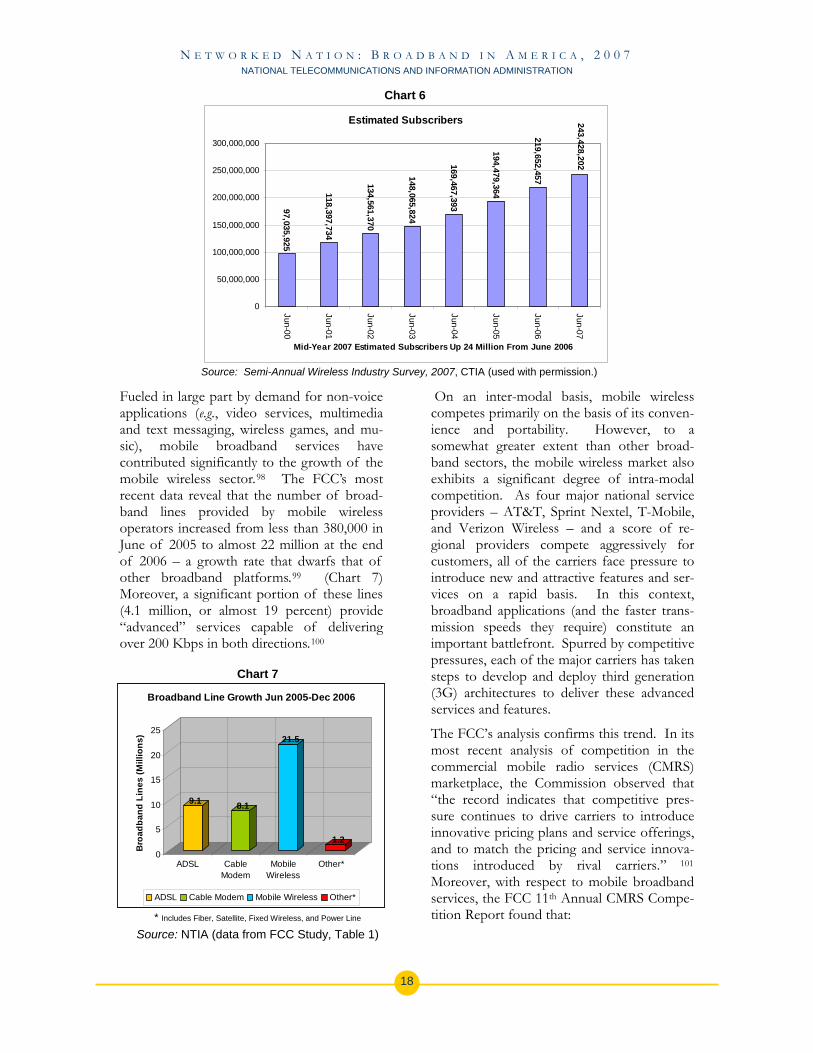
N E T W O R K E D N A T I O N : B R O A D B A N D I N A M E R I C A , 2 0 0 7 NATIONAL TELECOMMUNICATIONS AND INFORMATION ADMINISTRATION
Chart 6
Estimated Subscribers
97,035,925
118,397,734
134,561,370
148,065,824
169,467,393
194,479,364
219,652,457
243,428,202
0
50,000,000
100,000,000
150,000,000
200,000,000
250,000,000
300,000,000
Jun-00
Jun-01
Jun-02
Jun-03
Jun-04
Jun-05
Jun-06
Jun-07
Mid-Year 2007 Estimated Subscribers Up 24 Million From June 2006
Source: Semi-Annual Wireless Industry Survey, 2007, CTIA (used with permission.)
Fueled in large part by demand for non-voice applications (e.g., video services, multimedia and text messaging, wireless games, and mu-sic), mobile broadband services have contributed significantly to the growth of the mobile wireless sector.
On an inter-modal basis, mobile wireless competes primarily on the basis of its conven-ience and portability. However, to a somewhat greater extent than other broad-band sectors, the mobile wireless market also exhibits a significant degree of intra-modal competition. As four major national service providers – AT&T, Sprint Nextel, T-Mobile, and Verizon Wireless – and a score of re-gional providers compete aggressively for customers, all of the carriers face pressure to introduce new and attractive features and ser-vices on a rapid basis. In this context, broadband applications (and the faster trans-mission speeds they require) constitute an important battlefront. Spurred by competitive pressures, each of the major carriers has taken steps to develop and deploy third generation (3G) architectures to deliver these advanced services and features.
98 The FCC’s most recent data reveal that the number of broad-band lines provided by mobile wireless operators increased from less than 380,000 in June of 2005 to almost 22 million at the end of 2006 – a growth rate that dwarfs that of other broadband platforms.99 (Chart 7) Moreover, a significant portion of these lines (4.1 million, or almost 19 percent) provide “advanced” services capable of delivering over 200 Kbps in both directions.100
Chart 7
9.1 8.1
21.5
1.20
5
10
15
20
25
Bro
adba
nd L
ines
(Mill
ions
)
ADSL CableModem
MobileWireless
Other*
Broadband Line Growth Jun 2005-Dec 2006
ADSL Cable Modem Mobile Wireless Other*
The FCC’s analysis confirms this trend. In its most recent analysis of competition in the commercial mobile radio services (CMRS) marketplace, the Commission observed that “the record indicates that competitive pres-sure continues to drive carriers to introduce innovative pricing plans and service offerings, and to match the pricing and service innova-tions introduced by rival carriers.” 101 Moreover, with respect to mobile broadband services, the FCC 11th Annual CMRS Compe-tition Report found that:
* Includes Fiber, Satellite, Fixed Wireless, and Power Line
Source: NTIA (data from FCC Study, Table 1)
18
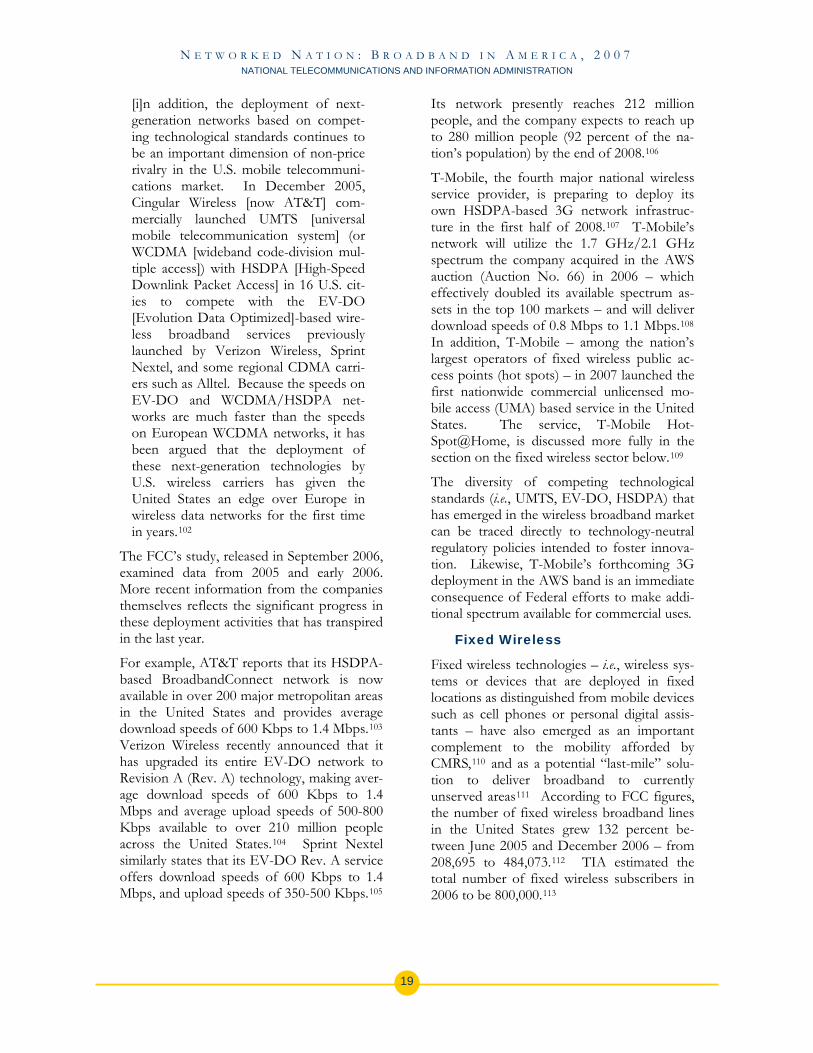
N E T W O R K E D N A T I O N : B R O A D B A N D I N A M E R I C A , 2 0 0 7 NATIONAL TELECOMMUNICATIONS AND INFORMATION ADMINISTRATION
[i]n addition, the deployment of next-generation networks based on compet-ing technological standards continues to be an important dimension of non-price rivalry in the U.S. mobile telecommuni-cations market. In December 2005, Cingular Wireless [now AT&T] com-mercially launched UMTS [universal mobile telecommunication system] (or WCDMA [wideband code-division mul-tiple access]) with HSDPA [High-Speed Downlink Packet Access] in 16 U.S. cit-ies to compete with the EV-DO [Evolution Data Optimized]-based wire-less broadband services previously launched by Verizon Wireless, Sprint Nextel, and some regional CDMA carri-ers such as Alltel. Because the speeds on EV-DO and WCDMA/HSDPA net-works are much faster than the speeds on European WCDMA networks, it has been argued that the deployment of these next-generation technologies by U.S. wireless carriers has given the United States an edge over Europe in wireless data networks for the first time in years.102
The FCC’s study, released in September 2006, examined data from 2005 and early 2006. More recent information from the companies themselves reflects the significant progress in these deployment activities that has transpired in the last year.
For example, AT&T reports that its HSDPA-based BroadbandConnect network is now available in over 200 major metropolitan areas in the United States and provides average download speeds of 600 Kbps to 1.4 Mbps.103 Verizon Wireless recently announced that it has upgraded its entire EV-DO network to Revision A (Rev. A) technology, making aver-age download speeds of 600 Kbps to 1.4 Mbps and average upload speeds of 500-800 Kbps available to over 210 million people across the United States.104 Sprint Nextel similarly states that its EV-DO Rev. A service offers download speeds of 600 Kbps to 1.4 Mbps, and upload speeds of 350-500 Kbps.
Its network presently reaches 212 million people, and the company expects to reach up to 280 million people (92 percent of the na-tion’s population) by the end of 2008.106
T-Mobile, the fourth major national wireless service provider, is preparing to deploy its own HSDPA-based 3G network infrastruc-ture in the first half of 2008.107 T-Mobile’s network will utilize the 1.7 GHz/2.1 GHz spectrum the company acquired in the AWS auction (Auction No. 66) in 2006 – which effectively doubled its available spectrum as-sets in the top 100 markets – and will deliver download speeds of 0.8 Mbps to 1.1 Mbps.108 In addition, T-Mobile – among the nation’s largest operators of fixed wireless public ac-cess points (hot spots) – in 2007 launched the first nationwide commercial unlicensed mo-bile access (UMA) based service in the United States. The service, T-Mobile Hot-Spot@Home, is discussed more fully in the section on the fixed wireless sector below.109
The diversity of competing technological standards (i.e., UMTS, EV-DO, HSDPA) that has emerged in the wireless broadband market can be traced directly to technology-neutral regulatory policies intended to foster innova-tion. Likewise, T-Mobile’s forthcoming 3G deployment in the AWS band is an immediate consequence of Federal efforts to make addi-tional spectrum available for commercial uses.
Fixed Wireless
Fixed wireless technologies – i.e., wireless sys-tems or devices that are deployed in fixed locations as distinguished from mobile devices such as cell phones or personal digital assis-tants – have also emerged as an important complement to the mobility afforded by CMRS,110 and as a potential “last-mile” solu-tion to deliver broadband to currently unserved areas111 According to FCC figures, the number of fixed wireless broadband lines in the United States grew 132 percent be-tween June 2005 and December 2006 – from 208,695 to 484,073.112 TIA estimated the total number of fixed wireless subscribers in 2006 to be 800,000.105 113
19

N E T W O R K E D N A T I O N : B R O A D B A N D I N A M E R I C A , 2 0 0 7 NATIONAL TELECOMMUNICATIONS AND INFORMATION ADMINISTRATION
As outlined below, fixed wireless technologies have contributed significantly to the rapid growth of broadband accessibility and usage in the United States, and recent technological advances position the sector for further growth.114 The two principal technologies in this market segment are Wi-Fi and Wi-MAX.115
Wi-Fi. In its 2006 CMRS Competition Re-port, the FCC noted that
Wireless Local Area Networks (WLANs) and Wireless Metropolitan Area Net-works (WMANs) are playing an increasingly important role as a competi-tor and supplement to the services offered by the CMRS industry. WLANs are already widely deployed and enable consumers to obtain high-speed wireless Internet connections within a range of 150 to 250 feet from a wireless access point (AP). The most prevalent WLAN technology is equipment manufactured in accordance with the IEEE 802.11 family of standards, commonly known as “Wi-Fi,” short for wireless fidelity. Basic WLAN data transfer rates range from speeds of up to 11 Mbps for 802.11b and up to 54 Mbps for 802.11a and 802.11g. New “SpeedBoost” or “Super G” routers, marketed as “pre-802.11n,” employ MIMO (Multiple Input Multiple Output) technology, making them capa-ble of providing speeds from 108 to 240 Mbps.116
The increasing penetration of broadband DSL and cable, discussed above, has stimu-lated a commensurate climb in Wi-Fi adoption as people deploy home WLANs to share broadband connections among several computers.117 Moreover, the proliferation of Wi-Fi access points, or “hot spots,” in public venues such as book stores and coffee shops has increasingly enabled consumers to cut the tether to a home or office connection alto-gether.
And the number of hot spots has grown – considerably. According to JiWire.com, the United States currently ranks first in the world in the number of public/commercial Wi-Fi hot spots, with an estimated 66,058 – more
than double the next closest country. (Table 4) An earlier estimate from TIA placed the figure at 53,000 in 2006.118 TIA noted that
this reflected an almost 36 percent increase from 39,000 in 2005, and TIA projects that the number will grow further to 83,000 in 2010.
Table 4 Top 10 Countries for availability of Wi-Fi Service United States 66,058 United Kingdom 31,055 France 22,959 Germany 21,347 South Korea 15,635 Japan 8,348 Spain 5,792 Italy 5,133 Taiwan 4,391 Switzerland 3,108 Source: JiWire WiFi HotStats™ (as of December 21, 2007)
119
Competition in the wireless hot spot market-place is brisk. According to TIA, AT&T presently operates approximately 11,000 hot spots in the United States;120 T-Mobile oper-ates 8,600, with over 700 more accessible under the company’s roaming agreements;121 and a range of providers including Boingo, Wayport, Fiberlink, and ipass, also provides access through wireless hot spots.
With this rise in penetration and usage, Wi-Fi has also become a fertile ground for technical innovation and entrepreneurship. With tech-nology neutral policies as a catalyst, engineers and service providers seeking to strengthen their competitive position have devised system architectures that employ Wi-Fi technology in new and creative ways to exact maximum value from available spectrum resources and deliver it to consumers. Two examples illus-trate this phenomenon well: the emergence of UMA technology and municipal Wi-Fi de-ployments.
UMA technology, as its name implies, facili-tates access to commercial cellular networks (in particular, those using global systems for mobile communication (GSM) and general packet radio service (GPRS)) using unlicensed
http://www.jiwire.com/search-hotspot-locations.htm
20
N E T W O R K E D N A T I O N : B R O A D B A N D I N A M E R I C A , 2 0 0 7 NATIONAL TELECOMMUNICATIONS AND INFORMATION ADMINISTRATION
spectrum technologies such as Bluetooth and Wi-Fi.122 Using dual-mode mobile handsets, UMA allows subscribers to roam and hand-off calls between public and private unli-censed wireless networks and conventional cellular networks.123
As noted above, T-Mobile has been an early advocate for UMA technology in the United States. Its “Hotspot @Home” service, launched in 2007, supports both voice and multi-media applications124 and enables users to connect calls directly through the Internet from a home wireless network or public hot spot using voice over Internet Protocol (VoIP).125 Outside of a Wi-Fi coverage area, handsets can function as conventional cellular phones using the carrier’s mobile wireless network.126 In the highly competitive wireless sector, technology firms Qualcomm and Nortel recently announced that they are col-laborating on a competing “fixed-wireless convergence” technology, IP Multimedia Sub-system (IMS) Voice Call Continuity.127 These innovative approaches to bridging the gap between traditional CMRS and fixed wireless services have thrived under the current regula-tory scheme.
Municipal Wi-Fi efforts also evince the inno-vative use of Wi-Fi technology to expand broadband access for the American people. In its study of broadband competition re-leased in 2007, the Federal Trade Commission (FTC) took notice of the increasing interest of many municipalities in Wi-Fi fixed wireless technology as a less expensive means to de-liver broadband Internet access to their residents.128 Observing that “[l]ow-cost mu-nicipal broadband services reduce the digital divide separating more affluent consumers from less affluent ones,” TIA estimated that over 250 municipal Wi-Fi networks are being operated or developed throughout the United States.129 A more recent study by ABI Re-search places this number at over 400.130 The projects employ a variety of models including public-private partnerships, contracted ser-vices, and municipally-owned facilities.131
While some early municipal Wi-Fi projects, especially in larger cities, have encountered difficulties, systems are also taking root in
smaller communities, where smaller geo-graphic scale can prove to be an advantage.133 For example, in Alamance County, North Carolina, the town of Graham has budgeted $80,000 in 2007-08 to develop a system that would support local police and provide free Internet access.134 Fueled by a $190,000 grant from USDA, Pinal County, Arizona, also re-cently announced that it will deploy a Wi-Fi mesh network to provide broadband service to the rural outskirts of the county by 2009,135 and in Glendora, Mississippi, a small northwestern Mississippi Delta village of 285 people, a $325,405 USDA grant is being used to develop a fixed wireless technology project that will bring broadband connectivity to the community. The project will connect the public library, health clinic, police department, and volunteer fire department.136 Such small communities’ municipal Wi-Fi efforts have often enjoyed greater success than those in large cities,137 and many analysts believe that the new business model reflected in some of these projects, which provides broadband ac-cess for residents by leveraging a Wi-Fi system built primarily to support municipal govern-ment services, represents the best future for municipal Wi-Fi.138
WiMAX. As the inventive use of Wi-Fi has contributed to expanding broadband penetra-tion and usage in the United States, WiMAX offers yet another emerging technological tool with the potential to deliver even greater gains in broadband accessibility in the future. Wi-MAX can deliver fixed wireless broadband access across much wider geographical areas than Wi-Fi; covering distances as great as five miles without line of sight and up to 30 miles under ideal conditions.139
With potential data speeds up to 70 Mbps, WiMAX has been identified as a possible “last-mile” solution to deliver broadband into rural and remote areas where high-speed cable service and DSL are not available.140 Verizon Communications has been testing fixed Wi-MAX for this purpose.141 AT&T has also been evaluating WiMAX technology with test deployments in Alaska, Georgia, Nevada, New Jersey, and Texas.142 However, WiMAX is also being developed for mobile applica-tions and, in October 2007, the International
132
21
N E T W O R K E D N A T I O N : B R O A D B A N D I N A M E R I C A , 2 0 0 7 NATIONAL TELECOMMUNICATIONS AND INFORMATION ADMINISTRATION
Telecommunication Union approved WiMAX for inclusion in the International Mobile Tele-communications 2000 (IMT-2000) family of standards for next generation mobile wireless communications.
Working with Intel and Motorola, Sprint Nextel has also built its next-generation strat-egy on mobile WiMAX technology.154 In August 2006, it announced its intention to employ mobile WiMAX as the foundation for its fourth generation (4G) wireless broadband network, which will use the company’s con-siderable spectrum resources in the 2.5 GHz band.
143
In the United States, Clearwire Corporation of Kirkland, Washington, has been among the earliest and strongest proponents for WiMAX technology, for both fixed and mobile ser-vices. Clearwire commenced service in its first market in August 2004.
155 Sprint Nextel had indicated that it would invest up to $5 billion to deploy the new network and planned to reach a potential 100 million customers by the end 2008.
144 Clearwire now serves 53 urban and rural markets in 16 states,
156 Although it is reexamining that investment budget and its original deployment schedule, the company has said it remains committed to its WiMAX 4G strategy and plans to move forward with a “soft launch” of WiMAX ser-vice in the Baltimore-Washington and Chicago areas.
145 and served approximately 258,000 subscribers as of the end of the first quarter of 2007 – a 161 percent expansion over a year earlier.146 Its present service uses pre-WiMAX, or “WiMAX-ready,” proprietary non-line-of-sight orthogonal frequency divi-sion multiplex (OFDM) technologies operating in the 2495-2690 MHz band to de-liver wireless broadband access at downstream transmission speeds up to 1.5 Mbps.
157
Satellite 147
Clearwire reports, however, that it intends to deploy full WiMAX networks (i.e., compliant with IEEE standard 802.16e-2005) for fixed, portable, and mobile applications when mo-bile WiMAX equipment becomes commercially available, and the company has established strategic partnerships with Intel and Motorola to develop that equipment.
Satellite technology also represents an im-portant conduit for the delivery of broadband access to the nation. Indeed, the FCC’s most current data show satellite to be the most ubiquitous of the nation’s broadband tech-nologies, delivering service to at least one customer in 91 percent of U.S. zip codes at the end of 2006.158
148At present, satellite broadband is primarily provided utilizing one or two geostationary satellites (satellites with high orbits that re-main in the same virtual point in the sky) to deliver service to subscribers using small re-ceiving “dishes” at fixed locations. Fixed satellite service (FSS) providers such as Wild-Blue Communications, Inc., Hughes, and Gilat (operator of the StarBand service) have been able to blanket virtually the entire United States with near DSL speeds.
Indeed, reports indicate that Intel has built its wireless strategy around the mobile WiMAX standard.149 This past autumn, the company announced that it will launch its next genera-tion Centrino mobile platform, called Montevina, in the middle of 2008.150 Monte-vina will include an integrated Wi-Fi/WiMAX module, and Intel has already secured com-mitments from several laptop makers, including Acer, Lenovo, Panasonic, and To-shiba, to use Montevina.
159 (Table 5). Inmarsat, through its Broadband Global Area Network (BGAN) service, uses its constella-tion of geostationary satellites to deliver integrated voice and satellite broadband access as a mobile service to customers using port-able terrestrial equipment, though at comparatively lower speeds.
151 This penetration is expected to increase the potential market for WiMAX service.152 Reflecting similar confidence in the growth potential for Wi-MAX, Cisco Systems, Inc., recently announced plans to spend $330 million to acquire Navini Networks, a developer of technologies to enhance the range and per-formance of WiMAX-based services.
(Table 5) 160
153
22
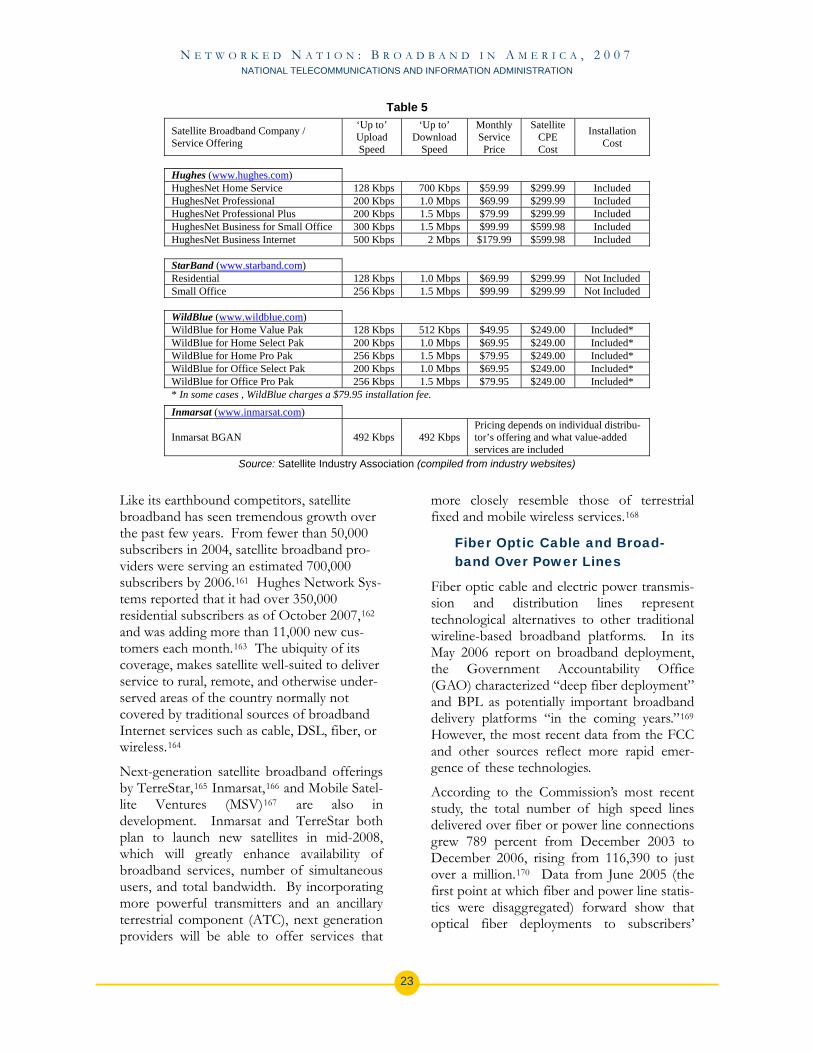
N E T W O R K E D N A T I O N : B R O A D B A N D I N A M E R I C A , 2 0 0 7 NATIONAL TELECOMMUNICATIONS AND INFORMATION ADMINISTRATION
Table 5‘Up to’ Upload Speed
‘Up to’ Download
Speed
Monthly Service Price
Satellite CPE Cost
Satellite Broadband Company / Service Offering
Installation Cost
Hughes (www.hughes.com
Like its earthbound competitors, satellite broadband has seen tremendous growth over the past few years. From fewer than 50,000 subscribers in 2004, satellite broadband pro-viders were serving an estimated 700,000 subscribers by 2006.161 Hughes Network Sys-tems reported that it had over 350,000 residential subscribers as of October 2007,162 and was adding more than 11,000 new cus-tomers each month.163 The ubiquity of its coverage, makes satellite well-suited to deliver service to rural, remote, and otherwise under-served areas of the country normally not covered by traditional sources of broadband Internet services such as cable, DSL, fiber, or wireless.164
Next-generation satellite broadband offerings by TerreStar,165 Inmarsat,166 and Mobile Satel-lite Ventures (MSV)167 are also in development. Inmarsat and TerreStar both plan to launch new satellites in mid-2008, which will greatly enhance availability of broadband services, number of simultaneous users, and total bandwidth. By incorporating more powerful transmitters and an ancillary terrestrial component (ATC), next generation providers will be able to offer services that
more closely resemble those of terrestrial fixed and mobile wireless services.168
Fiber Optic Cable and Broad-band Over Power Lines
Fiber optic cable and electric power transmis-sion and distribution lines represent technological alternatives to other traditional wireline-based broadband platforms. In its May 2006 report on broadband deployment, the Government Accountability Office (GAO) characterized “deep fiber deployment” and BPL as potentially important broadband delivery platforms “in the coming years.”169 However, the most recent data from the FCC and other sources reflect more rapid emer-gence of these technologies.
According to the Commission’s most recent study, the total number of high speed lines delivered over fiber or power line connections grew 789 percent from December 2003 to December 2006, rising from 116,390 to just over a million.170 Data from June 2005 (the first point at which fiber and power line statis-tics were disaggregated) forward show that optical fiber deployments to subscribers’
) HughesNet Home Service 128 Kbps 700 Kbps $59.99 $299.99 Included HughesNet Professional 200 Kbps 1.0 Mbps $69.99 $299.99 Included HughesNet Professional Plus 200 Kbps 1.5 Mbps $79.99 $299.99 Included HughesNet Business for Small Office 300 Kbps 1.5 Mbps $99.99 $599.98 Included HughesNet Business Internet 500 Kbps 2 Mbps $179.99 $599.98 Included
StarBand (www.starband.com) Residential 128 Kbps 1.0 Mbps $69.99 $299.99 Not Included Small Office 256 Kbps 1.5 Mbps $99.99 $299.99 Not Included
WildBlue (www.wildblue.com) WildBlue for Home Value Pak 128 Kbps 512 Kbps $49.95 $249.00 Included* WildBlue for Home Select Pak 200 Kbps 1.0 Mbps $69.95 $249.00 Included* WildBlue for Home Pro Pak 256 Kbps 1.5 Mbps $79.95 $249.00 Included* WildBlue for Office Select Pak 200 Kbps 1.0 Mbps $69.95 $249.00 Included* WildBlue for Office Pro Pak 256 Kbps 1.5 Mbps $79.95 $249.00 Included* * In some cases , WildBlue charges a $79.95 installation fee.
Inmarsat (www.inmarsat.com) Pricing depends on individual distribu-tor’s offering and what value-added services are included
Inmarsat BGAN 492 Kbps 492 Kbps
Source: Satellite Industry Association (compiled from industry websites)
23

N E T W O R K E D N A T I O N : B R O A D B A N D I N A M E R I C A , 2 0 0 7 NATIONAL TELECOMMUNICATIONS AND INFORMATION ADMINISTRATION
premises (i.e., FTTH) comprise the largest portion of this expansion.171
Fiber Optic Cable. Data compiled by indus-try sources also document the steady expansion in fiber growth evident in the Commission’s findings not merely for FTTH deployments, but also elsewhere in the pro-viders’ networks. TIA has charted patterns in fiber deployment dating back more than a decade.172 Its data show that, following a steep decline from 2000 to 2003 to absorb overcapacity from earlier build-outs, annual deployment of fiber in the United States grew sharply over the last four years, from 4.8 mil-lion miles fielded in 2003 to 13.1 million miles in 2007.173 Moreover, TIA expects deploy-ment to continue to rise, with operators laying an estimated 58.4 million miles from 2007 to 2010.174 (See Chart 8)
TIA’s data further reveal that telephone com-panies have led the way in this resurgence, nearly quadrupling their deployment of fiber from 2003 to 2006.175 (See Table 6)
As noted in the cable discussion above, tele-phone companies’ aggressive deployment of fiber has been motivated by the competitive need for a platform that will enable them to deliver higher-speed data services and digital, high-definition television in order to compete with cable operators’ bundled packages.176 For this reason, TIA expects fiber deployment and accessibility to continue to grow as these companies build out FTTH (also called fiber-
to-the-premises (FTTP)) and fiber-to-the-node (FTTN) networks.177
Chart 8
Fiber Miles Deployed in the United States (Millions)
15.815.9
15.214.3
13.112
11
7.8
4.8
6
19.6
14.3
9.9
7.65.8
0
5
10
15
20
25
1996 1997 1998 1999 2000 2001 2002 2003 2004 2005 2006 2007 2008 2009 2010
As noted above, FTTH systems consist of fiber optic transmission facilities running from the telephone company’s central office to the customer’s premises.
Source: TIA Market Study, Figure II-4.2 (KMI Research)(used with permission)
178 FTTH gives the service provider significantly more capac-ity than traditional copper infrastructure and supports significantly higher transmission speeds (between 100-500 Mbps).
Table 6 179 Like the
other broadband platforms discussed above, FTTH has experienced remarkable expansion. A recent study prepared by RVA Market Re-search for the Fiber-to-the-Home Council (FTTH Council) and TIA shows that FTTH networks now pass 9.55 million homes in North America (TIA indicates that virtually all of these homes are in the United States),
Annual Fiber Deployment in the United States (Thousands of Miles)
Cable System
Operators
Private Campuses/ Telephone
Companies Utilities/
Municipalities Buildings Year Total 2000 14,435 3,505 839 777 19,556 2001 10,009 4,163 932 652 15,756 2002 3,224 1,926 466 373 5,989 2003 2,464 1,367 516 466 4,813 2004 5,567 1,212 606 435 a
more than 50 percent increase from Septem-ber 2006.
7,820 2005 8,816 994 746 466 11,022 2006 9,737 994 808 482 180 Subscribership – at 2.14 million
homes – also grew by nearly 112 percent over that period.
12,021 2007 10,666 1,056 870 497 13,089 2008 11,741 1,118 932 528 14,319
181 Perhaps most significant, how-ever, is the fact that the “take rate” (the number of households that actually subscribe after being offered the service) has increased to 26.8 percent from 22.3 percent only six months earlier.
2009 12,434 1,181 994 559 15,168 2010 12,972 1,243 1,056 590 15,861
Source: TIA Market Study, Table II-4.1 (used with permission)
182
At present, there are approximately 370 pro-viders delivering FTTH services, including public utilities, municipalities, small and me-dium size telephone companies, and cable operators.183 However, Verizon Communica-tions remains the primary operator.184 Verizon Communications’ fiber-to-the-
24
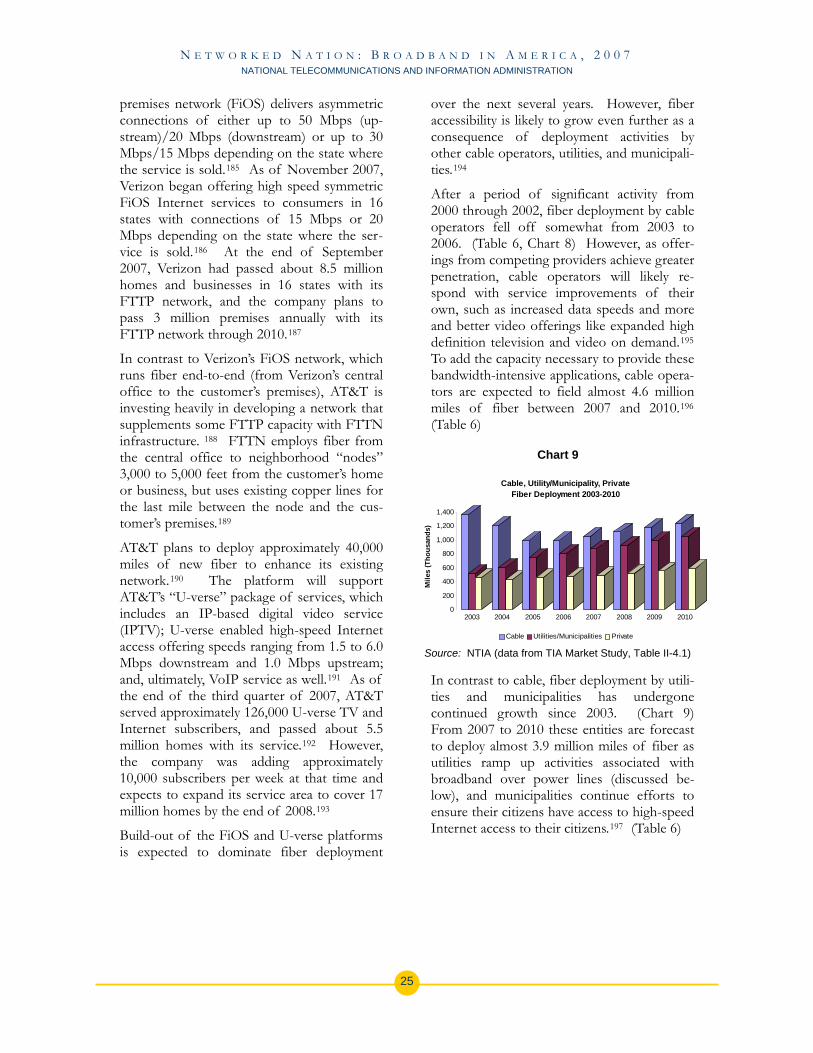
N E T W O R K E D N A T I O N : B R O A D B A N D I N A M E R I C A , 2 0 0 7 NATIONAL TELECOMMUNICATIONS AND INFORMATION ADMINISTRATION
premises network (FiOS) delivers asymmetric connections of either up to 50 Mbps (up-stream)/20 Mbps (downstream) or up to 30 Mbps/15 Mbps depending on the state where the service is sold.185 As of November 2007, Verizon began offering high speed symmetric FiOS Internet services to consumers in 16 states with connections of 15 Mbps or 20 Mbps depending on the state where the ser-vice is sold.186 At the end of September 2007, Verizon had passed about 8.5 million homes and businesses in 16 states with its FTTP network, and the company plans to pass 3 million premises annually with its FTTP network through 2010.187
In contrast to Verizon’s FiOS network, which runs fiber end-to-end (from Verizon’s central office to the customer’s premises), AT&T is investing heavily in developing a network that supplements some FTTP capacity with FTTN infrastructure. 188 FTTN employs fiber from the central office to neighborhood “nodes” 3,000 to 5,000 feet from the customer’s home or business, but uses existing copper lines for the last mile between the node and the cus-tomer’s premises.189
AT&T plans to deploy approximately 40,000 miles of new fiber to enhance its existing network.190 The platform will support AT&T’s “U-verse” package of services, which includes an IP-based digital video service (IPTV); U-verse enabled high-speed Internet access offering speeds ranging from 1.5 to 6.0 Mbps downstream and 1.0 Mbps upstream; and, ultimately, VoIP service as well.191 As of the end of the third quarter of 2007, AT&T served approximately 126,000 U-verse TV and Internet subscribers, and passed about 5.5 million homes with its service.192 However, the company was adding approximately 10,000 subscribers per week at that time and expects to expand its service area to cover 17 million homes by the end of 2008.193
Build-out of the FiOS and U-verse platforms is expected to dominate fiber deployment
over the next several years. However, fiber accessibility is likely to grow even further as a consequence of deployment activities by other cable operators, utilities, and municipali-ties.194
After a period of significant activity from 2000 through 2002, fiber deployment by cable operators fell off somewhat from 2003 to 2006. (Table 6, Chart 8) However, as offer-ings from competing providers achieve greater penetration, cable operators will likely re-spond with service improvements of their own, such as increased data speeds and more and better video offerings like expanded high definition television and video on demand.195 To add the capacity necessary to provide these bandwidth-intensive applications, cable opera-tors are expected to field almost 4.6 million miles of fiber between 2007 and 2010.196 (Table 6)
Chart 9
0
200
400
600
800
1,000
1,200
1,400
Mile
s (T
hous
ands
)
2003 2004 2005 2006 2007 2008 2009 2010
Cable, Utility/Municipality, PrivateFiber Deployment 2003-2010
Cable Utilities/Municipalities Private
Source: NTIA (data from TIA Market Study, Table II-4.1)
In contrast to cable, fiber deployment by utili-ties and municipalities has undergone continued growth since 2003. (Chart 9) From 2007 to 2010 these entities are forecast to deploy almost 3.9 million miles of fiber as utilities ramp up activities associated with broadband over power lines (discussed be-low), and municipalities continue efforts to ensure their citizens have access to high-speed Internet access to their citizens. (Table 6) 197
25
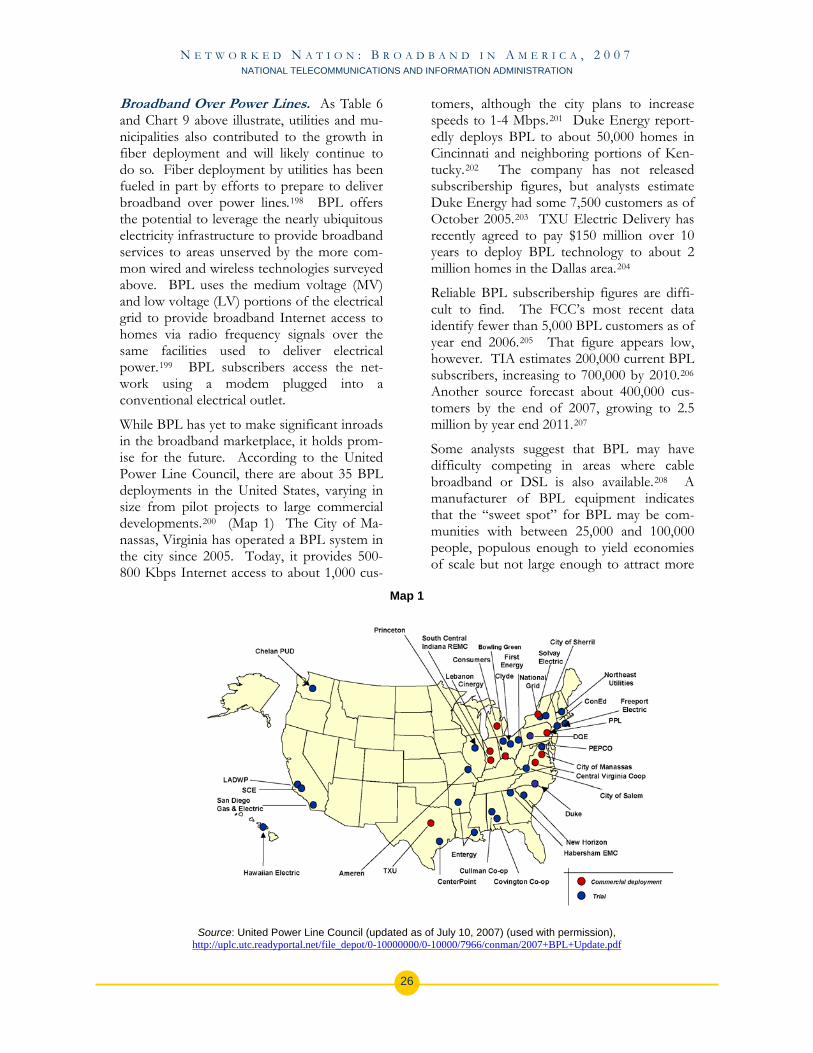
N E T W O R K E D N A T I O N : B R O A D B A N D I N A M E R I C A , 2 0 0 7 NATIONAL TELECOMMUNICATIONS AND INFORMATION ADMINISTRATION
Broadband Over Power Lines. As Table 6 and Chart 9 above illustrate, utilities and mu-nicipalities also contributed to the growth in fiber deployment and will likely continue to do so. Fiber deployment by utilities has been fueled in part by efforts to prepare to deliver broadband over power lines.198 BPL offers the potential to leverage the nearly ubiquitous electricity infrastructure to provide broadband services to areas unserved by the more com-mon wired and wireless technologies surveyed above. BPL uses the medium voltage (MV) and low voltage (LV) portions of the electrical grid to provide broadband Internet access to homes via radio frequency signals over the same facilities used to deliver electrical power.199 BPL subscribers access the net-work using a modem plugged into a conventional electrical outlet.
While BPL has yet to make significant inroads in the broadband marketplace, it holds prom-ise for the future. According to the United Power Line Council, there are about 35 BPL deployments in the United States, varying in size from pilot projects to large commercial developments.200 (Map 1) The City of Ma-nassas, Virginia has operated a BPL system in the city since 2005. Today, it provides 500-800 Kbps Internet access to about 1,000 cus-
tomers, although the city plans to increase speeds to 1-4 Mbps.201 Duke Energy report-edly deploys BPL to about 50,000 homes in Cincinnati and neighboring portions of Ken-tucky.202 The company has not released subscribership figures, but analysts estimate Duke Energy had some 7,500 customers as of October 2005.203 TXU Electric Delivery has recently agreed to pay $150 million over 10 years to deploy BPL technology to about 2 million homes in the Dallas area.204
Reliable BPL subscribership figures are diffi-cult to find. The FCC’s most recent data identify fewer than 5,000 BPL customers as of year end 2006.205 That figure appears low, however. TIA estimates 200,000 current BPL subscribers, increasing to 700,000 by 2010.206 Another source forecast about 400,000 cus-tomers by the end of 2007, growing to 2.5 million by year end 2011.207
Some analysts suggest that BPL may have difficulty competing in areas where cable broadband or DSL is also available.208 A manufacturer of BPL equipment indicates that the “sweet spot” for BPL may be com-munities with between 25,000 and 100,000 people, populous enough to yield economies of scale but not large enough to attract more
Map 1
Source: United Power Line Council (updated as of July 10, 2007) (used with permission), http://uplc.utc.readyportal.net/file_depot/0-10000000/0-10000/7966/conman/2007+BPL+Update.pdf
26
N E T W O R K E D N A T I O N : B R O A D B A N D I N A M E R I C A , 2 0 0 7 NATIONAL TELECOMMUNICATIONS AND INFORMATION ADMINISTRATION
than one or two other broadband provid-ers.209 BPL may also be an attractive option for ISPs seeking alternatives to cable and DSL. Thus, EarthLink, a prominent non-facilities-based ISP, has invested in Current
Communications, a major BPL equipment manufacturer, and has conducted BPL trials in several markets.210 DirecTV recently an-nounced plans to deliver Internet access via BPL in the Dallas-Fort Worth area.211
n summary, the statistical data outlined in the discussion above document the re-markable growth in broadband
deployment that has occurred across all plat-forms over the last several years and the commensurate increase in adoption and usage of broadband technologies. The picture that emerges from those numbers becomes evi-dent in the FCC’s broadband coverage maps that appear on the following pages. A com-parison of the maps from December 2003 (Map 2) and December 2006 (Map 3) graphi-cally illustrates the geographic spread of broadband accessibility across the national landscape.
The December 2006 map – which does not account for growth over the last twelve months – depicts virtually ubiquitous territo-rial coverage of the United States by at least one broadband provider and makes evident the very high percentage of the nation served by at least four, and in many cases seven or more, providers. (Map 3)
Some gaps in territorial coverage continue to appear. However, a comparison of territorial broadband coverage (Map 3) relative to the nation’s population density as reported by the United States Census Bureau (Map 4) and topography (Map 5) helps to place these gaps
into proper context. Considering these fac-tors, it appears clear, at least at the level of analytical granularity that the present data will support, that a vast majority of Americans (well over 90 percent) have access to broad-band communications through one or more modality.
I I212
It is also the case, however, that pockets of America exist where broadband service is not as robust, deployment has not been as rapid, and fewer choices are available. As the maps reflect, this is most likely the case in rural, mountainous, or otherwise remote areas of the country, where the population is most diffuse. Work remains to be done to identify these communities. To this end, improving the quality of our broadband penetration data will provide greater visibility into deployment patterns and specific challenges that need to be overcome.
The trend lines for investment in and build-out of new infrastructure and service capacity, discussed above and in the investment section that follows, provide a foundation for opti-mism. The surging competition that has so quickly brought broadband service to so much of the country can be expected to drive further deployment to presently underserved areas.
27
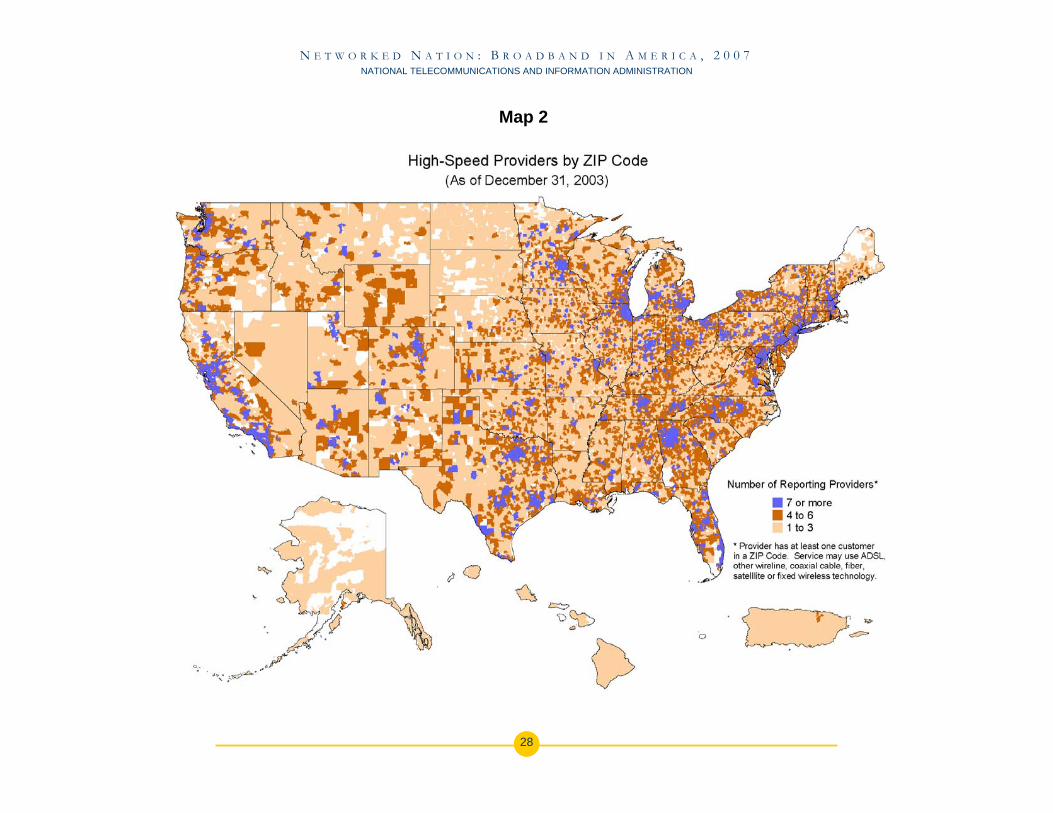
N E T W O R K E D N A T I O N : B R O A D B A N D I N A M E R I C A , 2 0 0 7 NATIONAL TELECOMMUNICATIONS AND INFORMATION ADMINISTRATION
28
Map 2
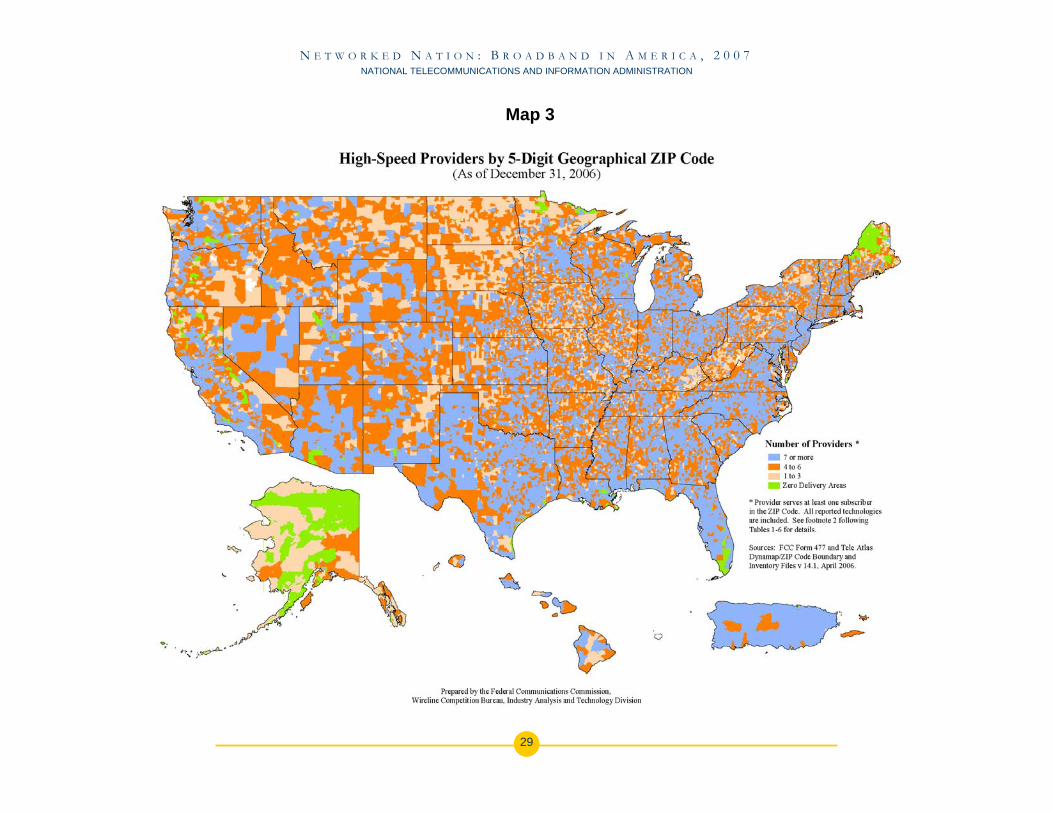
N E T W O R K E D N A T I O N : B R O A D B A N D I N A M E R I C A , 2 0 0 7 NATIONAL TELECOMMUNICATIONS AND INFORMATION ADMINISTRATION
29
Map 3
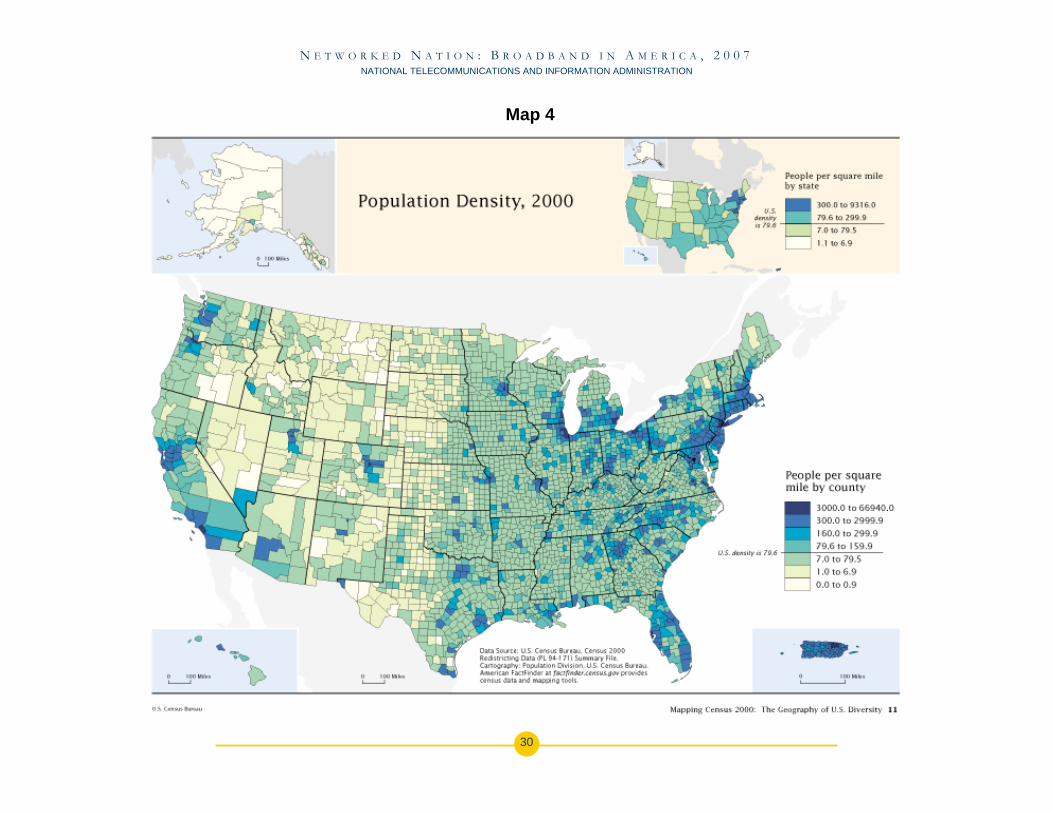
N E T W O R K E D N A T I O N : B R O A D B A N D I N A M E R I C A , 2 0 0 7 NATIONAL TELECOMMUNICATIONS AND INFORMATION ADMINISTRATION
30
Map 4
N E T W O R K E D N A T I O N : B R O A D B A N D I N A M E R I C A , 2 0 0 7 NATIONAL TELECOMMUNICATIONS AND INFORMATION ADMINISTRATION
31
Map 5
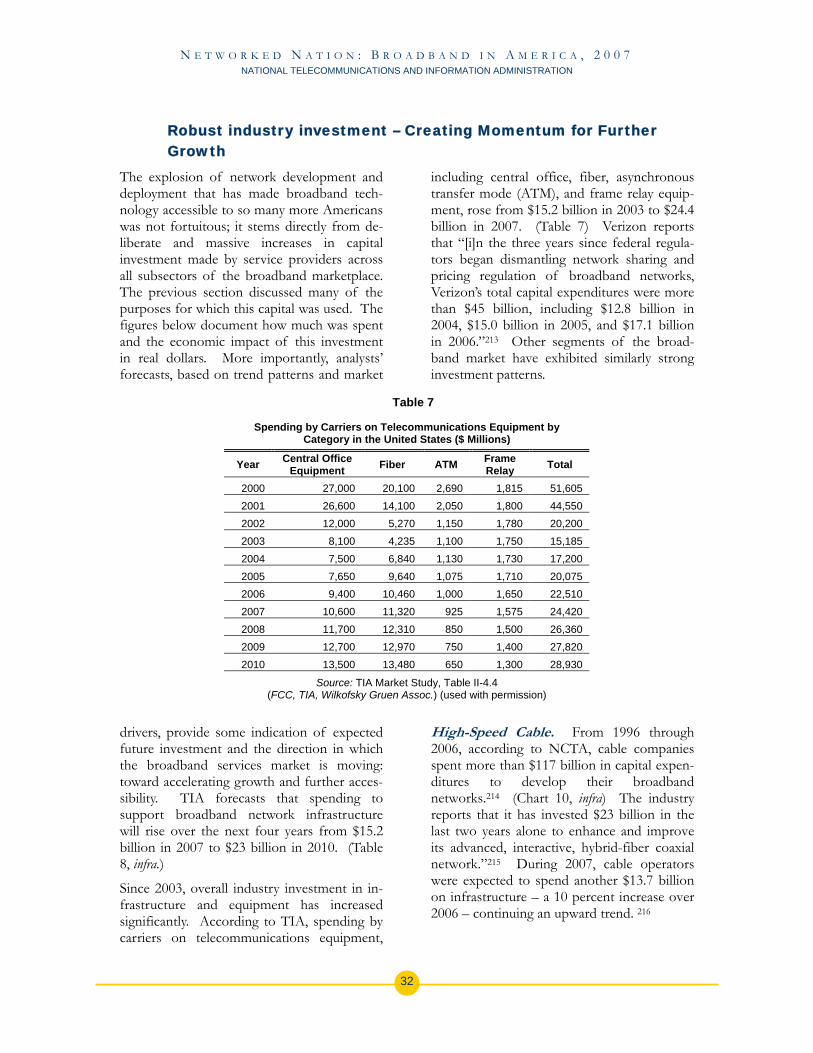
N E T W O R K E D N A T I O N : B R O A D B A N D I N A M E R I C A , 2 0 0 7 NATIONAL TELECOMMUNICATIONS AND INFORMATION ADMINISTRATION
32
Robust industry investment – Creating Momentum for Further Growth
The explosion of network development and deployment that has made broadband tech-nology accessible to so many more Americans was not fortuitous; it stems directly from de-liberate and massive increases in capital investment made by service providers across all subsectors of the broadband marketplace. The previous section discussed many of the purposes for which this capital was used. The figures below document how much was spent and the economic impact of this investment in real dollars. More importantly, analysts’ forecasts, based on trend patterns and market
drivers, provide some indication of expected future investment and the direction in which the broadband services market is moving: toward accelerating growth and further acces-sibility. TIA forecasts that spending to support broadband network infrastructure will rise over the next four years from $15.2 billion in 2007 to $23 billion in 2010. (Table 8, infra.)
Since 2003, overall industry investment in in-frastructure and equipment has increased significantly. According to TIA, spending by carriers on telecommunications equipment,
including central office, fiber, asynchronous transfer mode (ATM), and frame relay equip-ment, rose from $15.2 billion in 2003 to $24.4 billion in 2007. (Table 7) Verizon reports that “[i]n the three years since federal regula-tors began dismantling network sharing and pricing regulation of broadband networks, Verizon’s total capital expenditures were more than $45 billion, including $12.8 billion in 2004, $15.0 billion in 2005, and $17.1 billion in 2006.”213 Other segments of the broad-band market have exhibited similarly strong investment patterns.
High-Speed Cable. From 1996 through 2006, according to NCTA, cable companies spent more than $117 billion in capital expen-ditures to develop their broadband networks.214 (Chart 10, infra) The industry reports that it has invested $23 billion in the last two years alone to enhance and improve its advanced, interactive, hybrid-fiber coaxial network.”215 During 2007, cable operators were expected to spend another $13.7 billion on infrastructure – a 10 percent increase over 2006 – continuing an upward trend. 216
Table 7
Spending by Carriers on Telecommunications Equipment by Category in the United States ($ Millions)
Year Central Office Equipment Fiber ATM Frame
Relay Total
2000 27,000 20,100 2,690 1,815 51,605 2001 26,600 14,100 2,050 1,800 44,550 2002 12,000 5,270 1,150 1,780 20,200 2003 8,100 4,235 1,100 1,750 15,185 2004 7,500 6,840 1,130 1,730 17,200 2005 7,650 9,640 1,075 1,710 20,075 2006 9,400 10,460 1,000 1,650 22,510 2007 10,600 11,320 925 1,575 24,420 2008 11,700 12,310 850 1,500 26,360 2009 12,700 12,970 750 1,400 27,820 2010 13,500 13,480 650 1,300 28,930
Source: TIA Market Study, Table II-4.4 (FCC, TIA, Wilkofsky Gruen Assoc.) (used with permission)
N E T W O R K E D N A T I O N : B R O A D B A N D I N A M E R I C A , 2 0 0 7 NATIONAL TELECOMMUNICATIONS AND INFORMATION ADMINISTRATION
Chart 10
Source: NCTA (SNL Kagan) (used with permission)
http://www.ncta.com/Statistic/Statistic/InfrastructureExpenditures.aspx
There is reason to expect cable investment to increase in the future. TIA’s analysis predicts that spending on services in support of cable network infrastructure equipment will almost double from $7.8 billion in 2003 to $15.2 bil-lion by 2010. (Table 8) TIA notes that, although the present capacity of most cable systems is sufficient, the expected increase in customer demand for high-definition televi-sion channels and video-on-demand (VOD) services will require cable operators to expand their infrastructure to deliver those services.217 Accordingly, TIA projects significant growth in fiber deployment by cable operators from 2007 through 2010 with a cumulative addi-tional deployment during that period of 4.6 million miles.218
Fixed and Mobile Wireless. As noted above, broadband-fueled growth in the fixed and mobile wireless services markets has been especially strong over the past few years, and capital investment in these sectors has been correspondingly vigorous. According to data from TIA and CTIA, factors such as the AWS auction, deployment of 3G networks, and the build-out of additional infrastructure needed to support additional capacity for new, ad-vanced services helped spur U.S. wireless providers to increase capital investment spending from $18.9 billion in 2003 to $30 billion in 2007.219 (See Chart 11, infra)
As these factors persist, and new develop-ments such as WiMAX deployment emerge,
TIA expects this level of investment to con-tinue with carriers expected to spend nearly $100 billion over the next three years.220 Mu-niWireless LLC, predicted 2007 investment in municipal wireless systems in the United States to rise 35 percent, surpassing $329 mil-lion,221 and TIA expects revenues for WiMAX infrastructure to increase from $175 million in 2006 to $4.4 billion in 2008.222
Fiber. Table 7, above, reflects the investment trends with respect to fiber-related telecom-munications equipment. As the table
Table 8
Spending on Services in Support of Network Infrastructure Equipment in the United States ($ Millions)
POTS (Plain Old Telephone Service)
Year Cable Broadband Total
1999 19,200 4,800 1,000 25,000 2000 21,800 5,800 3,200 30,800 2001 24,200 6,900 7,000 38,100 2002 23,900 8,300 9,700 41,900 2003 22,800 7,800 8,700 39,300 2004 24,900 8,800 10,500 44,200 2005 27,400 10,200 12,500 50,100 2006 30,300 11,700 14,700 56,700 2007 32,900 13,000 15,200 61,100 2008 32,200 13,800 18,000 67,000 2009 37,300 14,500 20,700 72,500 2010 39,500 15,200 23,000 77,700
Source: TIA Market Study, Table II-4.6 (D.F. Blumberg & Assoc., TIA, Wilkofsky Gruen Assoc.) (used with permission)
33
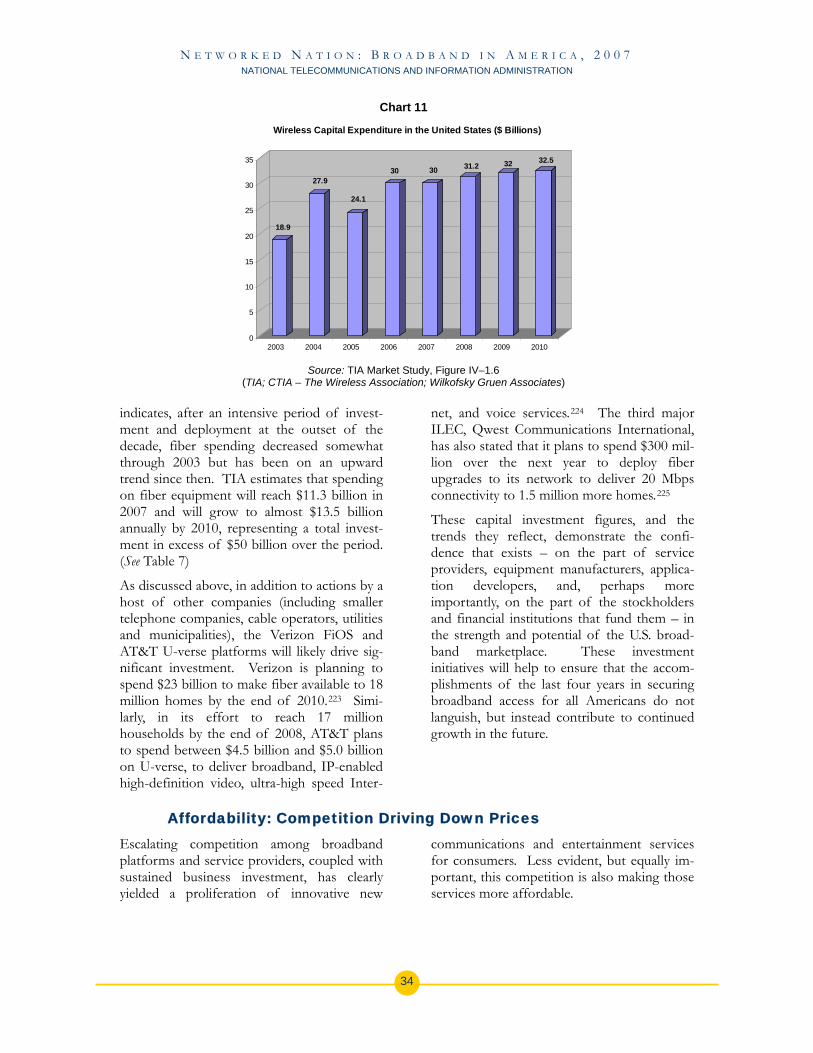
N E T W O R K E D N A T I O N : B R O A D B A N D I N A M E R I C A , 2 0 0 7 NATIONAL TELECOMMUNICATIONS AND INFORMATION ADMINISTRATION
Chart 11
18.9
27.9
24.1
30 30 31.2 32 32.5
0
5
10
15
20
25
30
35
2003 2004 2005 2006 2007 2008 2009 2010
Wireless Capital Expenditure in the United States ($ Billions)
Source: TIA Market Study, Figure IV–1.6
(TIA; CTIA – The Wireless Association; Wilkofsky Gruen Associates)
indicates, after an intensive period of invest-ment and deployment at the outset of the decade, fiber spending decreased somewhat through 2003 but has been on an upward trend since then. TIA estimates that spending on fiber equipment will reach $11.3 billion in 2007 and will grow to almost $13.5 billion annually by 2010, representing a total invest-ment in excess of $50 billion over the period. (See Table 7)
As discussed above, in addition to actions by a host of other companies (including smaller telephone companies, cable operators, utilities and municipalities), the Verizon FiOS and AT&T U-verse platforms will likely drive sig-nificant investment. Verizon is planning to spend $23 billion to make fiber available to 18 million homes by the end of 2010.223 Simi-larly, in its effort to reach 17 million households by the end of 2008, AT&T plans to spend between $4.5 billion and $5.0 billion on U-verse, to deliver broadband, IP-enabled high-definition video, ultra-high speed Inter-
net, and voice services.224 The third major ILEC, Qwest Communications International, has also stated that it plans to spend $300 mil-lion over the next year to deploy fiber upgrades to its network to deliver 20 Mbps connectivity to 1.5 million more homes.225
These capital investment figures, and the trends they reflect, demonstrate the confi-dence that exists – on the part of service providers, equipment manufacturers, applica-tion developers, and, perhaps more importantly, on the part of the stockholders and financial institutions that fund them – in the strength and potential of the U.S. broad-band marketplace. These investment initiatives will help to ensure that the accom-plishments of the last four years in securing broadband access for all Americans do not languish, but instead contribute to continued growth in the future.
Affordability: Competition Driving Down PricesEscalating competition among broadband platforms and service providers, coupled with sustained business investment, has clearly yielded a proliferation of innovative new
communications and entertainment services for consumers. Less evident, but equally im-portant, this competition is also making those services more affordable.
34
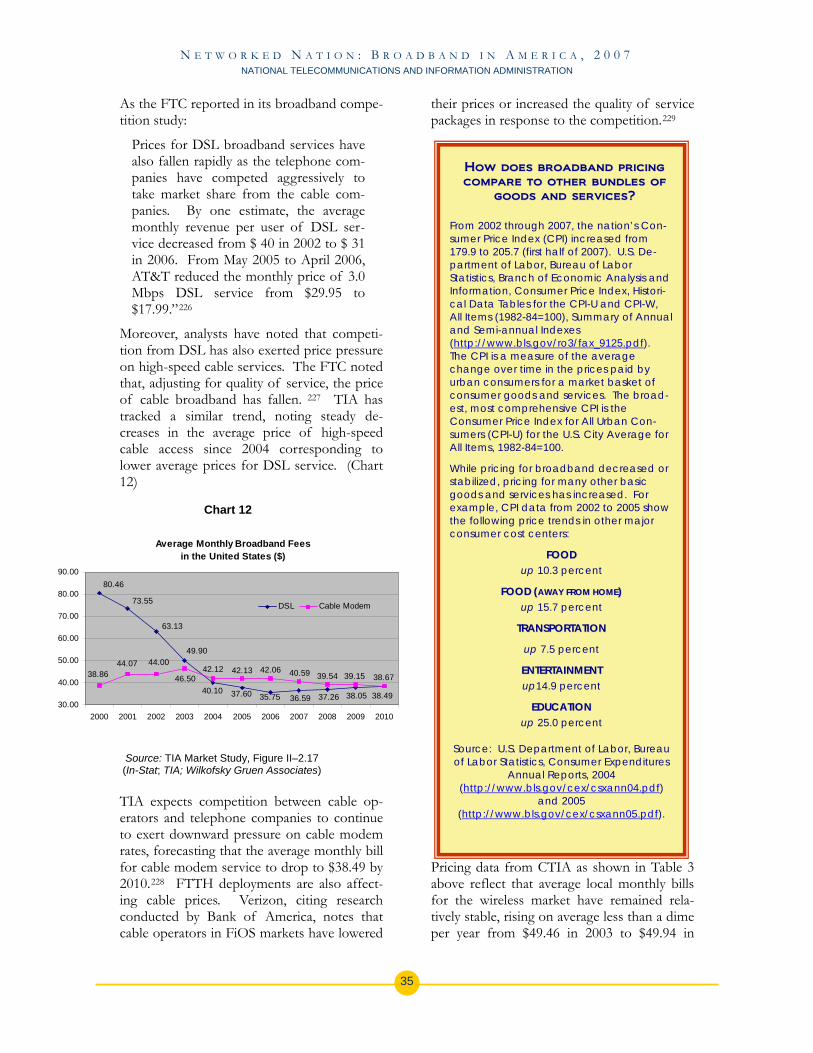
N E T W O R K E D N A T I O N : B R O A D B A N D I N A M E R I C A , 2 0 0 7 NATIONAL TELECOMMUNICATIONS AND INFORMATION ADMINISTRATION
As the FTC reported in its broadband compe-tition study:
Prices for DSL broadband services have also fallen rapidly as the telephone com-panies have competed aggressively to take market share from the cable com-panies. By one estimate, the average monthly revenue per user of DSL ser-vice decreased from $ 40 in 2002 to $ 31 in 2006. From May 2005 to April 2006, AT&T reduced the monthly price of 3.0 Mbps DSL service from $29.95 to $17.99.”226
Moreover, analysts have noted that competi-tion from DSL has also exerted price pressure on high-speed cable services. The FTC noted that, adjusting for quality of service, the price of cable broadband has fallen. 227 TIA has tracked a similar trend, noting steady de-creases in the average price of high-speed cable access since 2004 corresponding to lower average prices for DSL service. (Chart 12)
TIA expects competition between cable op-erators and telephone companies to continue to exert downward pressure on cable modem rates, forecasting that the average monthly bill for cable modem service to drop to $38.49 by 2010.228 FTTH deployments are also affect-ing cable prices. Verizon, citing research conducted by Bank of America, notes that cable operators in FiOS markets have lowered
their prices or increased the quality of service packages in response to the competition.229
Pricing data from CTIA as shown in Table 3 above reflect that average local monthly bills for the wireless market have remained rela-tively stable, rising on average less than a dime per year from $49.46 in 2003 to $49.94 in
Chart 12
Average Monthly Broadband Feesin the United States ($)
38.4938.05
63.13
73.55
80.46
49.90
40.10 37.60 35.75 36.59 37.26
39.5440.5942.0642.1338.6739.1538.86
44.07 44.00
46.5042.12
30.00
40.00
50.00
60.00
70.00
80.00
90.00
2000 2001 2002 2003 2004 2005 2006 2007 2008 2009 2010
DSL Cable Modem
Source: TIA Market Study, Figure II–2.17 (In-Stat; TIA; Wilkofsky Gruen Associates)
HHooww ddooeess bbrrooaaddbbaanndd pprriicciinngg
ccoommppaarree ttoo ootthheerr bbuunnddlleess ooff
ggooooddss aanndd sseerrvviicceess??
From 2002 through 2007, the nation’s Con-sumer Price Index (CPI) increased from 179.9 to 205.7 (first half of 2007). U.S. De-partment of Labor, Bureau of Labor Statistics, Branch of Economic Analysis and Information, Consumer Price Index, Histori-cal Data Tables for the CPI-U and CPI-W, All Items (1982-84=100), Summary of Annual and Semi-annual Indexes (http://www.bls.gov/ro3/fax_9125.pdf). The CPI is a measure of the average change over time in the prices paid by urban consumers for a market basket of consumer goods and services. The broad-est, most comprehensive CPI is the Consumer Price Index for All Urban Con-sumers (CPI-U) for the U.S. City Average for All Items, 1982-84=100.
While pricing for broadband decreased or stabilized, pricing for many other basic goods and services has increased. For example, CPI data from 2002 to 2005 show the following price trends in other major consumer cost centers:
FFOOOODD up 10.3 percent
FFOOOODD ((AAWWAAYY FFRROOMM HHOOMMEE)) up 15.7 percent
TTRRAANNSSPPOORRTTAATTIIOONN
up 7.5 percent
EENNTTEERRTTAAIINNMMEENNTT up14.9 percent
EEDDUUCCAATTIIOONN up 25.0 percent
Source: U.S. Department of Labor, Bureau of Labor Statistics, Consumer Expenditures
Annual Reports, 2004 (http://www.bls.gov/cex/csxann04.pdf)
and 2005 (http://www.bls.gov/cex/csxann05.pdf).
35

N E T W O R K E D N A T I O N : B R O A D B A N D I N A M E R I C A , 2 0 0 7 NATIONAL TELECOMMUNICATIONS AND INFORMATION ADMINISTRATION
2007. However, during the same interval, overall usage grew from just under 400 billion minutes in June 2003 to almost two trillion minutes by June of 2007, with a staggering increase of over 200 billion minutes in the last year alone. (Chart 13) The relative stability of prices juxtaposed against this dramatic in-crease in usage demonstrates a significant decrease in relative costs for consumers.
Table 5 above reflects that satellite broadband, although ubiquitous, remains among the more expensive of the broadband service options available to consumers when compared against the relative costs and transmission speeds offered by competing terrestrial plat-forms. A significant factor contributing to this disparity is the cost associated with the purchase and installation of the customer premises equipment (CPE) required to receive the satellite broadband service.230
However, even in the satellite sector, prices are coming down. For example, WildBlue last year reduced the price for professional instal-lation by over 55 percent, from $179.95 to $79.95.231 The industry expects that prices will begin to fall more quickly when satellite pro-
viders reach a “critical mass” of subscribers and begin to deploy new systems such as the hybrid satellite/ATC networks discussed above.232 Citing the example of direct-to-home satellite television providers, DirecTV and DISH Network, SIA indicates that these developments will enable satellite providers to leverage economies of scale that will enable them fully to subsidize their CPE or, at least,
price it in a range more typical for other con-sumer electronics equipment.
Chart 13
Annualized Minutes of Use (July 1- June 30)
0
400,000,000,000
800,000,000,000
1,200,000,000,000
1,600,000,000,000
2,000,000,000,000
Jun-95
Jun-96
Jun-97
Jun-98
Jun-99
Jun-00
Jun-01
Jun-02
Jun-03
Jun-04
Jun-05
Jun-06
Jun-07
Source: CTIA, Wireless Industry Indices, Midyear 2007 Results (November 30, 2007), Section 6.3 "MOU Trend Analysis," Table 85 (used with permission).
233
Providers are working aggressively to achieve this critical mass. WildBlue has established partnerships with the NRTC, AT&T, DirecTV, and DISH Network to distribute its service.234 Similarly, Hughes recently an-nounced an agreement with Wal-Mart for the low-price retailer to resell HughesNet broad-band services in 800 of its stores.235 Noting that Wal-Mart’s entry into a new market often “tends to push down prices,” some analysts believe that the arrangement with Hughes could similarly affect other broadband service providers.236
Satellite providers are also exploring other pricing models to make their services more
36
N E T W O R K E D N A T I O N : B R O A D B A N D I N A M E R I C A , 2 0 0 7 NATIONAL TELECOMMUNICATIONS AND INFORMATION ADMINISTRATION
affordable to consumers. For example, Hughes offers residential subscribers a pricing option that rolls the up-front charges into the monthly service fee; thus, instead of paying $299.98 for equipment and installation (after rebate) plus the $59.99 monthly charge for basic HughesNet Home Service (or $69.99 or $79.99 for HughesNet Professional or Profes-sional Plus, respectively) (see Table 5), the customer can pay $20.00 more per month (i.e., $79.99/$89.99/$99.99) for 24 months and eliminate the up-front charge.237
This option requires a 24-month service commitment (after which the monthly fee returns to the standard amount), but custom-ers also receive an additional $100 mail-in
rebate.238 While the resulting service fee is still appreciably higher than those for compa-rable terrestrial services, this type of pricing approach helps to mitigate the disincentive to subscribership that presently exists and should help to stimulate consumer uptake.
Accelerating technological evolution and the emergence of innovative and attractive new applications and services are kindling con-sumer interest and stoking demand for broadband services across multiple platforms. That strong demand, coupled with a prolifera-tion of service providers seeking to satisfy it, is generating competition that is producing lower prices and more choices for consumers in all sectors.
Conclusion The swift growth in broadband technologies and services that has occurred over the last several years – and the correspondingly rapid economic and cultural changes that have at-tended it – underscore the importance of broadband communications as a transforma-tive resource for the nation. The capacity to manage large amounts of information (whether voice/audio, data, or video) and to quickly and efficiently exchange it with others down the street or across the globe is no longer a luxury but, like the telephone over a century ago, is quickly becoming an essential tool for life and commerce in the modern world. The same technology that enables governments, banks, corporations and other institutions to manage affairs of state and international finance and trade now makes critical contributions to health care, education, public safety, and the productivity of indi-viduals and small businesses, as well as a host of other activities. For this reason, the Presi-dent has made it a priority to ensure that all Americans have affordable access to this im-portant resource by harnessing the power of the competitive marketplace.
As this report demonstrates, a reasonable as-sessment of the available data indicates that the nation has, to a very great degree, realized this objective. The FCC reports that, as of the end of 2006, over 99 percent of all U.S.
zip codes received broadband service from at least one provider, and those zip codes en-compass over 99 percent of the nation’s population.239 In addition, recent Census Bu-reau data and the individual growth patterns in each of the broadband modal sectors, documented above, make it likely that broad-band accessibility, penetration and usage have grown further since the Commission collected its information and are continuing to do so. Finally, pricing and usage information for the major broadband sectors also indicate that these services are becoming more affordable for consumers as time passes.
Nevertheless, it is also clear that more work remains to be done both by the government and by the private sector to improve broad-band data. The FCC’s most current broadband coverage map continues to show areas of potential service gaps, albeit primarily in sparsely populated remote areas. Anecdotal reports also contain stories of individuals who report being unable to access a broadband connection for one reason or another. In this regard, the general nature of the present data necessarily makes it difficult to identify pre-cisely the specific characteristics of broadband service available in particular areas. The U.S. Government is taking action to im-prove its data collection tools to obtain more
37
N E T W O R K E D N A T I O N : B R O A D B A N D I N A M E R I C A , 2 0 0 7 NATIONAL TELECOMMUNICATIONS AND INFORMATION ADMINISTRATION
granular information that will provide a more detailed view into these issues.
The recent history of broadband deployment in the United States stands as a strong en-dorsement for the principles embodied in the 1996 Telecommunications Act. The remark-able array of broadband access technologies, applications, and services that our nation en-joys today flows from past ingenuity and capital investment, but it is also carries the momentum that will further propagate these technologies and services and stimulate in-vestment in the future. Copper and coaxial cable are yielding to optical fiber, and even as deployment of 3G wireless technologies pro-ceeds, planning is already underway for 4G systems. Each new roll-out of a technology or service increases adoption, which fuels demand among other consumers, and which, in turn, provides the business case for further investment to meet demand and provision for future growth.
This cycle is the natural outgrowth of fervent competition embraced in the Telecommunica-tions Act of 1996 and cultivated through effective technology, regulatory, and fiscal policies. The evidence is clear: The pro-competition telecommunications policies un-derpinning the Administration’s broadband strategy has stabilized the market for planning and investment, provided needed spectrum resources to expand existing services and support new innovations, and spurred the development and deployment of technologies and infrastructure necessary to deliver them. These policies have delivered outstanding re-sults and hold great promise for the future.
38
N E T W O R K E D N A T I O N : B R O A D B A N D I N A M E R I C A , 2 0 0 7 NATIONAL TELECOMMUNICATIONS AND INFORMATION ADMINISTRATION
Endnotes
R. Jaques, Doctors Perform Surgery Over the Web, VNUnet.com (Aug. 9, 2005), 1
http://www.vnunet.com/articles/print/2140922 (last visited Jan. 15, 2008).
Associated Press, Soldiers Abroad to Watch Graduations Online (May 18, 2006), http://www.msnbc.msn.com/id/12861456/2 (last visited Jan. 15, 2008).
R. Callimachi, Biggest Wi-Fi Cloud is in Rural Oregon (Oct. 16, 2005), reprinted in USA Today, 3
http://www.usatoday.com/tech/products/services/2005-10-16-oregon-wi-fi_x.htm (last visited Jan. 15, 2008).
Dallas Launches Citywide Interoperability Network, Government Technology (Nov. 16, 2006), 4
http://www.govtech.com/gt/articles/102406 (last visited Jan. 15, 2008).
B. Ipsen, Last FrontierLlinks with First Frontier, First Alaskans (Jan./Feb. 2007), at 23-24. 5
6 Telecommunications Act of 1996, Pub. L. No. 104-104, 110 Stat. 56 (1996) (amending the Communications Act of 1934, 47 U.S.C. §§ 1-714).
Id. § 509, codified at 47 U.S.C. § 230(b) (1)-(2). 7
Promoting Innovation and Competitiveness: President Bush’s Technology Agenda, the White House (June 2002), 8
http://www.gcrio.org/OnLnDoc/pdf/technology_agenda.pdf.
Id. at 1. 9
10 American Competitiveness Initiative (Feb. 2, 2006), the White House, http://www.whitehouse.gov/stateoftheunion/2006/aci/index.html. 11 Id. at 3. 12 Id. 13 Memorandum for the Heads of Executive Departments and Agencies, Subject: Spectrum Policy for the 21st Century, 39 Weekly Comp. Pres. Doc. 726, 727 (May 23, 2003), http://www.whitehouse.gov/news/releases/2003/06/20030605-4.html (Presi-dent’s Spectrum Policy Memo). See also Presidential Memorandum on Spectrum Policy for the 21st Century, 69 Fed. Reg. 1569 (Jan. 9, 2004). 14 Spectrum Management for the 21st Century: Plan to Implement Recommendations of the President’s Spectrum Policy Initiative, U.S. Depart-ment of Commerce, NTIA (2006), http://www.doc.gov/osmhome/reports/ImplementationPlan2006.htm; Transcript of Hearings, Improving Spectrum Management through Economic and other Incentives (Feb. 28, 2006), http://www.ntia.doc.gov/forums/2006/specman/spectrumworkshop_022806.pdf, and (March 1, 2006), http://www.ntia.doc.gov/forums/2006/specman/spectrumworkshop_022806.pdf. 15 D. Jorgenson, The Telecommunications Challenge: Changing Technologies and Evolving Policies, Concluding Remarks at 158 (Charles W. Wessner, ed., The National Academies Press, 2006). 16 E. J. Rutkowski, 3GSM 2007: Video Review of I-mate Ultimate 5150 (Feb. 13, 2007), http://msmobiles.com/news.php/6059.html (last visited Jan. 15, 2008); tgdaily, Broadcom Announces 7.2 Mb/s Single-chip HSDPA Mobile Phone Processor, (Apr. 6, 2006), http://www.tgdaily.com/content/view/25579/107/ (last visited Jan. 15, 2008). 17 Cellular-News, Mobile-phone Premium Content Market to Reach $40 Billion by 2010, (March 8, 2006), http://www.cellular-news.com/story/16425.php (market projection by iSuppli Corp.) (last visited Jan. 15, 2008). 18 Telecommunications Industry Association (TIA), 2007 Telecommunications Market Review and Forecast, at 167 and Table IV-2.2 (TIA Market Study). 19 Commercial Spectrum Enhancement Act, Pub. L. No. 108-494, 118 Stat. 3991-97 (2004), codified at 47 U.S.C. §§ 309(j), 923(g), 928 (2006). 20 Public Notice, Auction of Advanced Wireless Services Licenses Closes; Winning Bidders Announced for Auction No. 66, FCC DA 06-1882 (Sept. 20, 2006) (noting that a total of $13,700,267,150 in net bids had been raised in the AWS auction). 21 Id. 22 Statement of Administration Policy, H.R. 4241 – the Deficit Reduction Act of 2005 (Nov. 17, 2005) at 3, http://www.whitehouse.gov/omb/legislative/sap/109-1/hr4241sap-h.pdf; Statement of Administration Policy, S.1932 – the Deficit Reduction and Omnibus Reconciliation Act of 2005 (Nov. 1, 2005), http://www.whitehouse.gov/omb/legislative/sap/109-1/s1932sap-s.pdf at 3.
39
N E T W O R K E D N A T I O N : B R O A D B A N D I N A M E R I C A , 2 0 0 7 NATIONAL TELECOMMUNICATIONS AND INFORMATION ADMINISTRATION
23 Comments of the National Telecommunications and Information Administration in ET Doc. No. 03-122, Revision of Parts 2 and 15 of the Commission’s Rules to Permit Unlicensed National Information Infrastructure (U-NII) Devices in the 5 GHz Band, (Oct. 1, 2003), http://www.ntia.doc.gov/ntiahome/fccfilings/2003/et03-122comments_10012003.pdf. 24 Comments of the National Telecommunications and Information Administration in ET Docket No. 98-153, Revision of Part 15 of the Commission's Rules Regarding Ultra-wideband Transmission Systems (Jan. 15, 2004), http://www.ntia.doc.gov/ntiahome/fccfilings/2004/ETDocket98-153comments_01152004.pdf; Comments of the National Tele-communications and Information Administration in ET Docket No. 98-153, Revision of Part 15 of the Commission's Rules Regarding Ultra-wideband Transmission Systems (Sept. 12, 2000), http://www.ntia.doc.gov/ntiahome/fccfilings/2000/et98_153comments.htm. 25 News Release, NTIA and FCC Launch On-line Registration for High-Speed Wireless Links Sharing Spectrum in the 70-80-90 GHz Bands, U.S. Department of Commerce (Feb. 8, 2005), http://www.ntia.doc.gov/ntiahome/press/2005/708090website_02082005.htm. 26 Amendment of Part 15 Regarding New Requirements and Measurement Guidelines for Access Broadband over Power Line Systems, ET Doc. No. 04-37, Report and Order, 19 FCC Rcd 21265 (2004), recon., 21 FCC Rcd 9308 (2006); see also News Release, NTIA Report Lays Groundwork for Responsible Deployment of Broadband Over Power Lines (BPL), NTIA (April 27, 2004), http://www.ntia.doc.gov/ntiahome/press/2004/bplrelease_04272004.pdf. 27 From spring 2003 through summer 2007, NTIA conducted a series of field tests and performed extensive analysis relative to the potential affects of BPL systems on Federal radiocommunications systems operating in the 1.7 to 80 MHz band. The results of this analysis are documented in NTIA’s BPL Phase 1 Study Report, Potential Interference from Broadband Over Power Line (BPL) Systems to Federal Government Radiocommunications at 1.7-80 MHz: Phase 1 Study, NTIA Report 04-413, U.S. Dept. of Commerce, NTIA (2004), http://www.ntia.doc.gov/ntiahome/fccfilings/2004/bpl/index.html, and its Phase 2 Study Report, Potential Interference From Broadband Over Power Line (BPL) Systems To Federal Government Radiocommunication Systems at 1.7 - 80 MHz: Phase 2 Study, NTIA Report No. 08-450, U.S. Dept. of Commerce, NTIA (2004), http://www.ntia.doc.gov/osmhome/reports/2007/bpl2007.html . They were submitted to the FCC along with NTIA’s Comments on the BPL Notice of Proposed Rulemaking. 28 See e.g., News Release, Assistant Secretary of Commerce Nancy J. Victory Commends FCC for Initiating Broadband Proceeding, NTIA (Feb. 14, 2002) (commending the FCC for initiating Appropriate Framework for Broadband Access to the Internet over Wireline Facilities, CC Doc. No. 02-33, Notice of Proposed Rulemaking, 17 FCC Rcd 3019 (2002)), http://www.ntia.doc.gov/ntiahome/press/2002/njv21402.htm. 29 Review of the Section 251 Unbundling Obligations of Incumbent Local Exchange Carriers; Implementation of the Local Competition Provisions of the Telecommunications Act of 1996, CC Doc. No. 01-338, Order on Reconsideration, 19 FCC Rcd 15856 (2004) (fiber loops delivered to residential multiple dwelling units); Review of the Section 251 Unbundling Obligations of Incumbent Local Exchange Carriers, CC Doc. No. 01-338, Order on Reconsideration, 19 FCC Rcd 20293 (2004) (fiber to the curb); FCC Triennial Review Order, 18 FCC Rcd 16978 (fiber to the home loops). See also News Release, NTIA Acts on President's Call to Clear Out 'Underbrush of Regulation' Towards Broadband Deployment: Urges FCC to Clarify Definitions in "Fiber-to-the-Home" Rules for Residential "Multi-Unit Premises," NTIA, (April 29, 2004), http://www.ntia.doc.gov/ntiahome/press/2004/mduletter_04292004.htm; News Release, Statement by Assistant Secretary Michael D. Gallagher on the FCC’s Order on Reconsideration of the Triennial Review Order, NTIA (Aug. 4, 2004) (“The Commission’s action today creates the regulatory certainty necessary to speed the deployment of broadband to millions of Americans living in apartment buildings, and brings us closer to meeting the President’s goal of universal and affordable broadband access by 2007.”), http://www.ntia.doc.gov/ntiahome/press/2004/tro_08042004.html. 30 FCC Triennial Review Order, 18 FCC Rcd 17126, ¶ 243, 17132-17141. 31 Inquiry Concerning High-Speed Access to the Internet Over Cable and Other Facilities; Internet Over Cable, GN Doc. No. 00-185, De-claratory Ruling and Notice of Proposed Rulemaking, 17 FCC Rcd 4798 (2002) (Cable Modem Declaratory Ruling), aff’d sub nom., National Cable & Telecommunications Ass’n v. Brand X Internet Servs., 545 U.S. 967 (2005). In making this determination, the Commission indicated that its primary policy goal was to “encourage the ubiquitous availability of broadband to all Americans” and the belief that “broadband services should exist in a minimal regulatory environment that promotes investment and innovation in a competitive market.” Cable Modem Declaratory Ruling, 17 FCC Rcd at 4801-4802. 32 Appropriate Framework for Broadband Access to the Internet over Wireline Facilities, CC Doc. No. 02-33, Report and Order and No-tice of Proposed Rulemaking, 20 FCC Rcd 14853 (2005) (Broadband Access Order), aff’d sub nom., Time Warner Telecommunications v. FCC, 507 F.3d 205 (3 Cir. 2007). See also News Release, rd Statement by Assistant Secretary Michael D. Gallagher on the FCC's Adoption of Wireline Broadband Internet Access Order, NTIA (Aug. 5, 2005), http://www.ntia.doc.gov/ntiahome/press/2005/gallagher_08052005.htm. 33 Broadband Access Order, 20 FCC Rcd at 14975. 34 United Power Line Council’s Petition for Declaratory Ruling Regarding the Classification of Broadband over Power Line Internet Access Service as an Information Service, WC Doc. No. 06-10, Memorandum Opinion and Order, 21 FCC Rcd 13281 (2006). 35 Appropriate Regulatory Treatment for Broadband Access to the Internet Over Wireless Networks, WT Doc. No. 07-53, Declaratory Rul-ing, 22 FCC Rcd 5901 (2007).
40
N E T W O R K E D N A T I O N : B R O A D B A N D I N A M E R I C A , 2 0 0 7 NATIONAL TELECOMMUNICATIONS AND INFORMATION ADMINISTRATION
41
36 See News Release, Acting Assistant Secretary of Commerce Michael D. Gallagher Commends FCC For Favoring “Innovation, Not Regula-tion,” NTIA (Feb. 12, 2004), http://www.ntia.doc.gov/ntiahome/press/2004/voip_02122004.htm (Gallagher February 12 Statement). Assistant Secretary Gallagher referred to the following FCC decisions: IP-Enabled Services, WC Doc. No. 04-36, Notice of Proposed Rulemaking, 19 FCC Rcd 4863 (2004); and Petition for Declaratory Ruling That Pulver.com’s Free World Dialup is Neither Telecommunications Nor a Telecommunications Service, WC Doc. No. 03-45, Memorandum Opinion and Order, 19 FCC Rcd 3307 (2004). 37 See News Release, Statement by Assistant Secretary Michael D. Gallagher on FCC's VOIP Action, NTIA (Nov. 9, 2004), http://www.ntia.doc.gov/ntiahome/press/2004/voip_11092004.html (referring to Vonage Holdings Corporation Petition for Declaratory Ruling Concerning an Order of the Minnesota Public Utilities Commission, WC Doc. No. 03-211, Memorandum Opinion and Order, 19 FCC Rcd 22404 (2004), aff’d sub nom. Minnesota Pub. Utils Comm’n v. FCC, 483 F.3d 570 (8th Cir. 2007). Consistent with the over-arching principles identified above, however, the Administration has also concurred with the Commission’s requirement that VoIP providers include emergency calling capabilities (E911) for their subscribers and afford law enforcement authorities access to their networks as appropriate to ensure public safety. See Statement of Administration Policy, H.R. 5252 – Communications Opportunity, Promotion, and Enhancement Act of 2006 (June 8, 2006) (E911); Gallagher February 12 Statement, supra note 36 (law enforcement access). 38 Statement of Administration Policy, H.R. 5252 – the Communications Opportunity, Promotion, and Enhancement Act of 2006 (June 8, 2006) at 1, http://www.whitehouse.gov/omb/legislative/sap/109-2/hr5252sap-h.pdf. 39 Implementation of Section 621(a)(1) of the Cable Communications Policy Act of 1984 as amended by the Cable Television Consumer Protection and Competition Act of 1992, MB Docket No. 05-311, Report and Order and Further Notice of Proposed Rulemaking, 22 FCC Rcd 5101, 5133 (2006). 40 Id. at 5103. 41 Id. 42 Memorandum for the Heads of Executive Departments and Agencies, Improving Rights-of-Way Management Across Federal Lands to Spur Greater Broadband Deployment, 40 Weekly Comp. Pres. Doc. 696 (April 26, 2004), http://www.whitehouse.gov/news/releases/2004/04/20040426-2.html (Broadband Rights-of-Way Memorandum). 43 Id. 44 News Release, President Signs Internet Access Taxation Moratorium, http://www.whitehouse.gov/news/releases/2001/11/20011129.html; Statement of Administration Policy, S. 150 - Internet Tax Non-discrimination Act of 2003 (Nov. 6, 2003), http://www.whitehouse.gov/omb/legislative/sap/108-1/s150sap-s.pdf; Statement of Administration Policy, H.R. 49 - Internet Tax Nondiscrimination Act (Sept. 17, 2003), http://www.whitehouse.gov/omb/legislative/sap/108-1/hr49sap-h.pdf; News Release, President George W. Bush Signs S.150, the Internet Tax Nondiscrimination Act, http://www.whitehouse.gov/news/releases/2004/12/images/20041203-6_120304taxthjpg-515h.html; News Release, President George W. Bush Signs H.R. 3678, the Internet Tax Freedom Act Amendments Act of 2007, the White House, http://www.whitehouse.gov/news/releases/2007/10/images/20071031-17_d-0350-2-515h.html. 45 Jobs and Growth Tax Relief Reconciliation Tax Relief Act of 2003, Pub. L. No. 108-27, 117 Stat. 752 (2003), http://frwebgate.access.gpo.gov/cgi-bin/getdoc.cgi?dbname=108_cong_public_laws&docid=f:publ027.108.pdf; and Statement of Administration Policy, S. 1054 – Jobs and Growth Tax Act of 2003 (May 14, 2003), http://www.whitehouse.gov/omb/legislative/sap/108-1/s1054sap-s.pdf. See also Press Release, President Signs Jobs and Growth Tax Relief Reconciliation Act of 2003, the White House (May 28, 2003), http://www.whitehouse.gov/news/releases/2003/05/20030528-9.html. 46 Tax Relief and Health Care Act of 2006, Pub. L. No. 109-432, 120 Stat. 2922, 2934-36 (2006) (extending the R&E tax credit from December 31, 2005 to December 31, 2007), http://frwebgate.access.gpo.gov/cgi-bin/getdoc.cgi?dbname=109_cong_public_laws&docid=f:publ432.109.pdf. See also News Release, Fact Sheet: Tax Relief and Health Care Act of 2006, the White House (Dec. 20, 2006), http://www.whitehouse.gov/news/releases/2006/12/20061220.html. 47 See American Competitiveness Initiative, supra note 10; see also News Release, President Bush Discusses American Competitiveness Initiative During Press Conference (Aug. 9, 2007), the White House, http://www.whitehouse.gov/news/releases/2007/08/20070809-1.html. 48 Broadband Investment Report, USDA (2007), http://www.usda.gov/rus/telecom/broadband/pdf/BroadbandInvestmentReport.pdf. 49 USDA Rural Development: Bringing Broadband to Rural America, USDA (June 2007) at 2, 4, http://www.rurdev.usda.gov/rd/pubs/RDBroadbandRpt.pdf. 50 Broadband Investment Report, supra note 48 (as mandated by the Rural Electrification Loan Restructuring Act of 1993, all facili-ties financed under the RE Act of 1936 must be capable of delivering 1 Mb/s service). 51 Id. 52 USDATelecommunications Program Home Page, http://www.usda.gov/rus/telecom/ (last visited Jan. 15, 2008).
N E T W O R K E D N A T I O N : B R O A D B A N D I N A M E R I C A , 2 0 0 7 NATIONAL TELECOMMUNICATIONS AND INFORMATION ADMINISTRATION
53 Broadband Investment Report, supra note 48. 54 Community Connect Broadband Program, Grant Application Guide, USDA, Rural Development Utilities Programs (2007) at 2, http://www.usda.gov/rus/telecom/commconnect/2007programinformation/2007-application-guide-7-5-07.pdf. (last visited Jan. 15, 2008). 55 Id. 56 News Release, Veneman Announces $11.3 Million in Broadband Technology Grant, USDA, Release No. 0328.03 (Sept. 24, 2003), http://www.usda.gov/documents/NewsReleases/2003/09/0328.doc; News Release, Veneman Announces $8.8 Million in Broadband Grants, USDA, Release No. 0480.04 (Oct. 29, 2004), http://www.usda.gov/wps/portal/!ut/p/_s.7_0_A/7_0_1RD?printable=true&contentidonly=true&contentid=2004/10/0480.xml; News Release, USDA Announces $9 Million in Broadband Grants, USDA, Release No. 0409.05 (Sept. 30, 2005), http://www.usda.gov/wps/portal/!ut/p/_s.7_0_A/7_0_1RD?printable=true&contentidonly=true&contentid=2005/09/0409.xml; News Release, USDA Announces $8.9 Million in Broadband Community Connect Grants, USDA, Release No. 0360.06 (Sept. 15, 2006), http://www.usda.gov/wps/portal/!ut/p/_s.7_0_A/7_0_1RD?printable=true&contentidonly=true&contentid=2006/09/0360.xml; News Release, USDA Announces Recipients of Community Connect Grants, USDA, Release No. 0279.07 (Oct. 4, 2007), http://www.usda.gov/wps/portal/!ut/p/_s.7_0_A/7_0_1RD?printable=true&contentidonly=true&contentid=2007/10/0279.xml. 57 News Release, USDA Announces Recipients of Community Connect Grants, USDA, Release No. 0279.07 (Oct. 4, 2007), http://www.usda.gov/wps/portal/!ut/p/_s.7_0_A/7_0_1RD?printable=true&contentidonly=true&contentid=2007/10/0279.xml. 58 Id. 59 News Release, USDA Awards More Than $22.3 Million for Distance Learning and Telemedicine Grants, USDA, Release No. 0275.07 (Oct. 1, 2007), http://www.usda.gov/wps/portal/!ut/p/_s.7_0_A/7_0_1RD?printable=true&contentidonly=true&contentid=2007/10/0275.xml. 60 On this point, the FCC has recently proposed steps to improve the quality and depth of its data collection concerning broadband deployment. See Development of Nationwide Broadband Data to Evaluate Reasonable and Timely Deployment of Advanced Services to All Americans, Improvement of Wireless Broadband Subscribership Data, and Development of Data on Interconnected Voice over Internet Protocol (VoIP) Subscribership, WC Doc. No. 07-38, Notice of Proposed Rulemaking, 22 FCC Rcd 7760 (2007). The more complete and granular data sought by the Commission should yield a much higher resolution picture of the broadband landscape that will benefit all parties inter-ested in broadband deployment. 61 Specifically, the FCC reports that there were 82,547,651 high-speed lines in the United States in December 2006, up from 6,756,877 in December 2000. See High-Speed Services for Internet Access: Status as of December 31, 2006, Federal Communications Commis-sion (Oct. 2007), Table 1 (FCC Study). 62 Id. at Table 3, Chart 5. 63 Internet Use Supplement to the October 2007 CPS, U.S. Census Bureau (October 2007 CPS). This represents the seventh such study by the Commerce Department involving data collection by the Census Bureau, and analysis by NTIA, and (on three occasions) its sister agency, the Economics and Statistics Administration (ESA). See http://www.ntia.doc.gov/reports/anol/index.html. 64 The broadband data collected by the U.S. Census Bureau in its Internet and Computer Use Supplement to the September 2001 CPS, and relied on herein, is set forth in four tables developed by the Census Bureau, excerpts of which appear at Appendix A of this re-port. Table A-1 provides data for total U.S. households for Internet connection type. Table A-2 provides data for total rural households by Internet connection type. Table A-3 provides data for total U.S. households with Internet. Table A-4 provides data for rural households with Internet. The referenced tables in their entirety are available on NTIA’s website at http://www.ntia.doc.gov/reports/2008/NetworkedNation.html. The figure of 9.1 percent represents the sum of households with DSL (3,335,000) and cable modem services (6,594,000) from Table A-1 expressed as a percentage of the 108,562,000 total Internet house-holds in the United States from Table A-3. Note: Table A-1 also includes a very small “Other” category (representing .85 percent of all U.S. Internet households). The data does not clearly identify whether these “Other” types of Internet connections (i.e., non dial-up, DSL, or cable modem) were broadband in nature. Accordingly, this category was excluded from the 2001 broadband percentage computation. 65 The broadband data collected by the Census Bureau from the October 2007 CPS, and relied on herein, is set forth in three tables developed by the Census Bureau, excerpts of which appear at Appendix B of this report. Table B-1 provides data for total U.S. households using the Internet. Table B-2 provides data for total rural households using the Internet. Table B-3 provides data for U.S. households with Internet broadband access ranked by States. The tables from which the broadband data was excerpted are printed in their entirety on NTIA’s website at http://www.ntia.doc.gov/reports/2008/NetworkedNation.html. The figure of 50.8 percent appears in Table B-1. In the October 2007 CPS, 59,847,000 households (out of a total U.S. figure of 117,840,000 responding to the survey) reported having a “broadband” connection of some kind. Respondents using the Internet at home were asked whether they had (1) a “dial-up” connection; (2) a “broadband” connection; or a (3) “something else” (i.e., “Other”).
42

N E T W O R K E D N A T I O N : B R O A D B A N D I N A M E R I C A , 2 0 0 7 NATIONAL TELECOMMUNICATIONS AND INFORMATION ADMINISTRATION
66 See Appendix A, Table A-2, Table A-4. The figure of 5.6 percent represents the sum of rural households with DSL (339,000) and cable modems (1,151,000) from Table A-2 as a percentage of the 26,832,000 rural households in the United States from Table A-4. Again, as noted supra note 65, data for respondents in the “Other” category (.75 percent of rural Internet households) was excluded due to uncertainties relative to the broadband status of these households. 67 See Appendix B, Table B-2. In the October 2007 CPS, 9,072,000 rural households (out of a total of 23,394,000 rural house-holds covered by the survey) reported having some type of broadband connection at home. 68 For example, the percent of Internet households with dial-up connectivity declined from 81.0 percent nationwide in Sep-tember 2001 to 17.3 percent as of October 2007 (equals 12,575,000 dial-up households out of a total of 72,721,000 Internet households in the United States). See Appendix A, Table A-1; Appendix B, Table B-1. In rural areas, the dial-up proportion declined from 87.8 percent to 33.1 percent (equals 4,514,000 dial-up households out of 13,646,000 total rural Internet households) during the same period. See Appendix A, Table A-2; Appendix B, Table B-2. 69 See Appendix B, Table B-3. This figure is calculated from October 2007 CPS data (based on 90 percent confidence inter-vals used in sampling, i.e., the 90 percent probability that the actual number for a given state in this case lies within a calculated range). 70 Id. Specifically, the percentages derived from the CPS sample are 64.9 percent for New Hampshire and 62.5 percent for Alaska. Statistically, there is a 90 percent confidence that the actual percentage lies in the range 62.1 to 67.7 percent for New Hamp-shire and 59.6 to 65.5 percent for Alaska. 71 FCC Study, supra note 62, Table 3. 72 Comments of Verizon and Verizon Wireless in GN Docket No. 07-45, Inquiry Concerning the Deployment of Advanced Telecommunications Capability to All Americans in a Reasonable and Timely Fashion, and Possible Steps to Accelerate Such De-ployment Pursuant to Section 706 of the Telecommunications Act of 1996 (May 16, 2007) at 11 & n. 32 (Verizon/VZW Comments), http://fjallfoss.fcc.gov/prod/ecfs/retrieve.cgi?native_or_pdf=pdf&id_document=6519411810 (citing J. Hodulik, et al., UBS, Qwest Communications at Table 1 (Oct. 4, 2005) (weighted average). 73 Comments of the Organization for the Promotion and Advancement of Small Telecommunications Companies in GN Docket No. 07-45, Inquiry Concerning the Deployment of Advanced Telecommunications Capability to All Americans in a Reason-able and Timely Fashion, and Possible Steps to Accelerate Such Deployment Pursuant to Section 706 of the Telecommunications Act of 1996 (May 16, 2007) at 3-4 (OPASTCO Comments), http://fjallfoss.fcc.gov/prod/ecfs/retrieve.cgi?native_or_pdf=pdf&id_document=6519411737. OPASTCO surveyed 310 of its member companies of which 72 responded. Id. at 3. 74 National Exchange Carrier Association, DSL Data Collection Summary, http://www.neca.org/source/NECA_Publications_4943.asp (last visited Jan. 15, 2008). 75 Id. 76 NTCA 2006 Broadband/Internet Availability Survey Report, National Telecommunications Cooperative Association (Aug. 2006) at 3, http://fjallfoss.fcc.gov/prod/ecfs/retrieve.cgi?native_or_pdf=pdf&id_document=6519411694 (last visited Jan. 15, 2008). NTCA surveyed about 570 members companies of which 120 responded. Id. 77 Verizon/VZW Comments, supra note 722, at 14. 78 Comments of AT&T in GN Docket No. 07-45, Inquiry Concerning the Deployment of Advanced Telecommunications Capability to All Americans in a Reasonable and Timely Fashion, and Possible Steps to Accelerate Such Deployment Pursuant to Section 706 of the Telecommunications Act of 1996 (May 16, 2007) at 7 (AT&T Comments), http://fjallfoss.fcc.gov/prod/ecfs/retrieve.cgi?native_or_pdf=pdf&id_document=6519411743. 79 OPASTCO Comments, supra note 73, at 3. 80 Broadband Connectivity Competition Policy, Federal Trade Commission at 101 (June 2007) (FTC Report), http://www.ftc.gov/reports/broadband/v070000report.pdf (citing Bernstein Research, Broadband Update: “Value Share” and “Sub-scriber Share” Have Diverged at 4 (2006)). Please note that the sources from which the price data is cited throughout this Report do not indicate that the data has been adjusted for inflation. 81 AT&T Comments, supra note 788, at 7. See also Verizon/VZW Comments, supra note 722, at 13-14 (ILEC’s average DSL prices have fallen approximately 30 percent over the past four years). 82 FTC Report, supra note 81, at 101. 83 FCC Study, supra note 61, Table 3. “High-speed” lines must have transmission speed in excess of 200 Kbps in at least one direction.
43
N E T W O R K E D N A T I O N : B R O A D B A N D I N A M E R I C A , 2 0 0 7 NATIONAL TELECOMMUNICATIONS AND INFORMATION ADMINISTRATION
84 Chart 2 compiles ADSL growth data that appear in tabular form in FCC Study, Tables 1-4. It is important to note that “advanced” services lines represent a subset of total high-speed lines. The data presented in Chart 2 were derived as follows: (1) the total number of “advanced services lines” [FCC Table 2] were subtracted from the total number of all high-speed lines [from FCC Table 1] to yield the total net number of “basic” high-speed lines; (2) “residential advanced services” lines [FCC Table 4] were then subtracted from total “residential high-speed lines” [FCC Table 3] to yield the total net number of residential “basic” high-speed lines; (3) the result of step two (net residential basic) was then subtracted from the result of step one (total net basic) to determine the total net number of non-residential (i.e., business) “basic” high-speed lines. (4) Next, “residential advanced services” lines [FCC Table 4] were sub-tracted from total “advanced service lines” [FCC Table 2] to determine the total net number of non-residential (i.e., business) “advanced services lines.” The 22.8 million residential high-speed lines cited in the text represent the sum of residential “basic” high-speed lines and residential “advanced services lines,” which are depicted in the dark blue and light blue areas of the chart. The layering of the chart reveals not only the significant growth that has occurred in high-speed lines overall, but also the even greater relative increase in the number of “advanced services lines” as proportion of the total. 85 Id., Table 1. 86 Id., Table 4. Again, asymmetric services represent virtually all advanced DSL lines. Advanced services must offer transmis-sion speeds in excess of 200 Kbps in both directions. 87 Id., Table 2. 88 See discussion of targeted deregulation initiatives and elimination of artificial distinctions, supra pp. 7-8. 89 T. Hazlett, Empirical Evidence on the Effect of Broadband Regulation, Powerpoint presentation at George Mason University Law School Information Economy Project Mini Conference: "Lessons from the Telecom Wars" (Sept. 28, 2006) at 15, http://mason.gmu.edu/~thazlett/Conferences/LessonsfromtheTelecomWarsPresentations.html (last visited Jan. 15, 2008). Profes-sor Hazlett attributes the increase in DSL growth to the FCC’s elimination of “line sharing.” See Verizon/VZW Comments, supra note 722, at 6. 90 J. Eisenach, Ph.D., Testimony before the Senate Committee on Commerce, Science, and Transportation at 2 and Figure 1 (April 24, 2007), http://commerce.senate.gov/public/_files/Testimony_JeffreyEisenach_Criterion_EisenachTestimonyWithFigures042407.pdf. 91 See NCTA Website, Broadband Internet Access, http://www.ncta.com/IssueBrief.aspx?contentID=3024 (last visited Jan. 24, 2008). 92 NCTA Comments, supra note 91, at 8. 93 Id.
94 See TIA Market Study, supra note 18, at 56-57. 95 Cable, Communications Daily (May 23, 2007), at 15. 96 TIA Market Study, supra note 18, at 5. 97 Id. at 4, 6. 98 Id. at 12, 13 (“The advent of new applications is driving demand for new devices. Subscribers must upgrade their devices to use new services such as picture messaging, mobile music, 3-D video games, music videos, television, children’s location services, instant messaging, and Internet access.”). 99 FCC Study, supra note 61, Table 1. 100 Id., Table 2. 101 Annual Report and Analysis of Competitive Market Conditions With Respect to Commercial Mobile Services, Implementation of Section 6002(b) of the Omnibus Budget Reconciliation Act of 1993, WT Doc. No. 06-17, 21 FCC Rcd 10947, 10950 ¶ 3 (2006) (FCC 11th Annual CMRS Competition Report). 102 Id. (emphasis added, internal footnote omitted). 103 News Release, AT&T, Pantech Double-Up on Cool with Slim, Dual-Keyboard Pantech Duo, New 3G Windows Mobile 6 Global Smart Device Bridges Mobile Needs of Personal and Professional Lifestyles With Variety of Entertainment and Business Features (Oct. 29, 2007), http://www.att.com/gen/press-room?pid=4800&cdvn=news&newsarticleid=24621 (last visited Jan. 15, 2008). 104 News Release, Verizon Wireless: 100 Percent of Wireless Broadband Network Now Enhanced with Faster Speeds, Verizon Wireless (June 29, 2007), http://news.vzw.com/news/2007/06/pr2007-06-28h.html (last visited Jan. 15, 2008).
44
N E T W O R K E D N A T I O N : B R O A D B A N D I N A M E R I C A , 2 0 0 7 NATIONAL TELECOMMUNICATIONS AND INFORMATION ADMINISTRATION
105 News Release, Central Valley Can Do More with Wireless: Faster Sprint Mobile Broadband Expands in California, Sprint (Oct. 1, 2007), http://newsreleases.sprint.com/phoenix.zhtml?c=127149&p=irol-newsArticle_Print&ID=1057229&highlight (last visited Jan. 15, 2008). 106 Comments of Sprint Nextel Corporation in FCC GN Docket No. 07-45, Inquiry Concerning the Deployment of Advanced Telecommunications Capability to All Americans in a Reasonable and Timely Fashion, and Possible Steps to Accelerate Such De-ployment Pursuant to Section 706 of the Telecommunications Act of 1996 (May 16, 2007), at 7 (Sprint Nextel Comments). 107 T. von Fuchs, T-Mobile Denies 3G Rumor, Wireless Week (Nov. 28, 2007), http://www.wirelessweek.com/T-Mobile-3G-Rumor.aspx (last visited Jan. 15, 2008). 108 News Release, Deutsche Telekom Well Positioned for Further Growth in the United States, 3G Americas (Oct. 6, 2006), http://www.3gamericas.org/English/News_room/DisplayPressRelease.cfm?id=2820&s=ENG (last visited Jan. 15, 2008). 109 See News Release, Unlicensed Mobile Access System Solution from NXP Supports First Nationwide U.S. Commercial Rollout of Fixed-Mobile Convergence, NXP (July 11, 2007), http://www.businesswire.com/portal/site/google/index.jsp?ndmViewId=news_view&newsId=20070711005350&newsLang=en (NXP News Release) (last visited Jan. 15, 2008). 110 FCC 11 Annual CMRS Competition Report, 21 FCC Rcd at 11028-29, ¶ 210. th
111 TIA Market Study, supra note 18, at 69. 112 FCC Study, supra note 61, Table 1. 113 TIA Market Study, supra note 18, at 70. 114 Id. 115 Id. at 69, 186. 116 FCC 11 Annual CMRS Competition Report, 21 FCC Rcd at 11028-29, ¶ 210 (footnotes omitted). th
117 TIA Market Study, supra note 18, at 194. 118 Id. at 195. 119 Id. 120 Id. at 196. 121 T-Mobile USA, Customer Connection Center, US Locations, https://selfcare.hotspot.t-mobile.com/locations/viewLocationMap.do (last visited Dec. 27, 2007). 122 UMA Today, UMA Technology: Extending Mobile Services to Unlicensed Spectrum; UMA Overview, http://www.umatechnology.org/overview/ (last visited Dec. 27, 2007). 123 Id. 124 NXP News Release, supra note 110. 125 T-Mobile HotSpot @Home – General Information, http://support.t-mobile.com/knowbase/root/public/tm23449.htm?&printpage=1 (last visited Jan. 15, 2008). 126 Id.; see also J. Cheng, T-Mobile First in US with Long-awaited UMA cell-to-WiFi Service, Ars Technica (June 27, 2007), http://arstechnica.com/news.ars/post/20070627-t-mobile-intros-long-awaited-cell-to-wifi-service.html (last visited Jan. 15, 2008). 127 E. Malykhina, Qualcomm, Nortel Team on Dual-Mode Phone Service, Information Week (December 3, 2007), http://www.informationweek.com/internet/showArticle.jhtml?articleID=204600791&subSection=Internet (last visited Jan. 15, 2008). 128 FTC Report, supra note 80, at 106. 129 TIA Market Study, supra note 18, at 69, 197. 130 News Release, Municipal Wi-Fi Needs a Paradigm Shift, Says ABI Research, Business Wire (Dec. 4, 2007), http://www.businesswire.com/portal/site/google/index.jsp?ndmViewId=news_view&newsId=20071204005788&newsLang=en (last visited Jan. 15, 2008). 131 FTC Report, supra note 80, at 106. 132 R. Martin, EarthLink’s Cutbacks Cast a Cloud Over Muni Wi-Fi, Information Week (Sept. 1, 2007), http://www.informationweek.com/news/showArticle.jhtml?articleID=201803540 (last visited Jan. 15, 2008).
45
N E T W O R K E D N A T I O N : B R O A D B A N D I N A M E R I C A , 2 0 0 7 NATIONAL TELECOMMUNICATIONS AND INFORMATION ADMINISTRATION
133 Id.; see also TIA Market Study, supra note 18, at 197-98 (noting projects in Anaheim, California; Corpus Christi, Texas; An-napolis, Maryland, St. Cloud, Florida, and Tempe, Arizona). 134 I. Groves, Cities Want to Bring Wireless Internet to Downtowns, Burlington Times-News (Nov. 12, 2007), http://www.thetimesnews.com/articles/city_7521___article.html/wifi_internet.html (last visited Jan. 15, 2008). 135 M. St. Aude, Wi-Fi ‘Cloud’ to Blanket County by 2009, Casa Grande Valley Newspapers (Nov. 28, 2007), http://www.zwire.com/site/news.cfm?newsid=19066431&BRD=1817&PAG=461&dept_id=222089&rfi=6 (last visited Jan. 15, 2008). 136 News Release, Community Connect Awards – Mississippi, USDA Rural Development, http://www.usda.gov/rus/telecom/commconnect/pdfs/ms-commconnectsummaries.pdf. A cotton gin building owned by the city will be used to set up a community center, which will be used to offer a variety of educational and training services to residents. Resi-dents will benefit from better educational and economic opportunities by improved access to information, prescription medicines, job search and GED college correspondence courses. Businesses will benefit from fast and reliable access to information, which can increase their productivity. 137 R. Martin, EarthLink’s Cutbacks Cast a Cloud Over Muni Wi-Fi, supra note 133. 138 J. Merron, Municipal Wi-Fi: A Promise Unfulfilled?, Information Week (Nov. 6, 2007), http://www.informationweek.com/mobility/showArticle.jhtml?articleID=202802427&subSection=Wi-Fi/WiMax (last visited Jan. 15, 2008); see also D. Jones, Moto Muni: So Much for the City, Unstrung (Nov. 28, 2007), http://www.unstrung.com/document.asp?doc_id=139892&print=true (last visited Jan. 15, 2008). 139 TIA Market Study, supra note 18, at 156, 162. 140 Id. at 186, 187. 141 Id. at 187. 142 News Release, AT&T Initiatives Expand Availability of Advanced Communications Technologies, AT&T (May 8, 2006), http://www.att.com/gen/press-room?pid=5097&cdvn=news&newsarticleid=22272 (last visited Jan. 15, 2008); and AT&T WiMAX and Fixed Wireless Deployment Fact Sheet, http://www.att.com/Common/files/pdf/WiMAX_Fact_Sheet.pdf (last visited Jan. 15, 2008). 143 News Release, ITU-R Radiocommunication Assembly Expands IMT-2000 3G Radio Interface Family with OFDMA technology; Estab-lishes IMT-Advanced as the name for 4G, ITU (Oct. 19, 2007), http://www.itu.int/newsroom/wrc/2007/itur_web_flash/20071019.html (last visited Jan. 15, 2008). See also Associated Press, UN Meeting Gives Mobile Service Providers Access to Terrestrial TV Spectrum (Nov. 15, 2007), http://nl.newsbank.com/nl-search/we/Archives?p_action=list&p_topdoc=11 (last visited Jan. 15, 2008) (password pro-tected); Telecommunications Reports, Identification of IMT Spectrum, 2.5 GHz Band Protection Seen As Crucial Decisions Made at WRC-07 in Geneva, vol. 73, no. 23 at 3 (Dec. 1, 2007). 144 News Release, Clearwire Brings High-Speed Wireless Broadband and Phone Service to “The Queen City,” Clearwire Corp. (Dec. 3, 2007), http://newsroom.clearwire.com/phoenix.zhtml?c=214419&p=irol-newsArticle&ID=1083314 (last visited Jan. 15, 2008). 145 Clearwire Corp. Coverage Area and Maps, http://www.clearwire.com/store/service_areas.php (last visited Jan. 15, 2008). 146 See Comments of Clearwire Corp. in FCC GN Docket No. 07-45, Inquiry Concerning the Deployment of Advanced Tele-communications Capability to All Americans in a Reasonable and Timely Fashion, and Possible Steps to Accelerate Such Deployment Pursuant to Section 706 of the Telecommunications Act of 1996 (May 16, 2007) at 6 (Clearwire Comments). 147 Id. at 2, 4. As of May 2007, Clearwire was also offering portable VoIP service over its network in roughly 26 of its markets, with plans to expand to others. Id. at 2, n. 4. 148 Id. at 4, 5. 149 B. Gardiner, Intel Says WiMax Is Coming Next Year – This Time for Sure, Wired (Sept. 21, 2007), http://www.wired.com/techbiz/it/news/2007/09/intel_wimax (last visited Jan. 15, 2008). 150 Id. 151 Id. 152 TIA Market Study, supra note 18, at 187. 153 W. D. Gardner and E. Malykhina, WiMax Gets Two New Friends: Cisco and the United Nations, Information Week (Oct. 27, 2007), http://www.informationweek.com/mobility/showArticle.jhtml?articleID=202602151&subSection=Wi-Fi/WiMax (last visited Jan. 15, 2008). 154 News Release, Sprint Nextel Announces 4G Wireless Broadband Initiative with Intel, Motorola and Samsung, Sprint Nextel (August 8, 2006), available at: http://www2.sprint.com/mr/news_dtl.do?id=12960 (last visited Jan. 15, 2008).
46
N E T W O R K E D N A T I O N : B R O A D B A N D I N A M E R I C A , 2 0 0 7 NATIONAL TELECOMMUNICATIONS AND INFORMATION ADMINISTRATION
155 Id. 156 J. Gertzen, Sprint Seeks Outside Funding for WiMax Plans, Kansas City Star (Dec. 5, 2007), at C1. 157 Id.; see also M. Hamblen, Report: Sprint Exec Says a Wimax Service Could be Spun Off; It's Looking to Save Money Needed for a New Network, Computerworld (Dec. 4, 2007), http://www.computerworld.com/action/article.do?command=viewArticleBasic&articleId=9050961&intsrc=hm_list (last visited Jan. 15, 2008). 158 See FCC Study, supra note 61, Table 16. 159 See generally, Hughes Communications, Inc., 2006 Annual Report 5 (2007) http://www.hughes.com/HUGHES/Doc/0/DAM4EI2JNF14D2TGHII4VU9F7E/HCI2006AnnualReport.pdf (Hughes Annual Report); and WildBlue Communications, Inc., Questions & Answers, http://wildblue.com/aboutWildblue/qaa.jsp#1_1 (last visited Jan. 15, 2008); and WildBlue Communications, Inc., How it Works Demo, http://wildblue.com/aboutWildblue/how_it_works_demo.jsp (last visited Jan. 15, 2008). 160 BGAN Global Voice and Broadband Data, Overview Brochure, Inmarsat, http://www.inmarsat.com/Downloads/English/BGAN/Collateral/bgan_overview_brochure_EN.pdf?language=EN&textonly=False, at 6 (last visited Jan. 15, 2008). 161 TIA Market Study, supra note 18, at 71 and Table II-2.36. Cf. Comments of The Satellite Industry Association (SIA) in WC Docket No. 07-52, Broadband Industry Practices June 15, 2007), at 2 (places the number of satellite broadband consumers at over 500,000) (SIA Comments), http://fjallfoss.fcc.gov/prod/ecfs/retrieve.cgi?native_or_pdf=pdf&id_document=6519532283. 162 W. J. Holstein, Sending Up Satellites and Closing the Digital Divide, New York Times (Oct. 20, 2007) (interview with Pradman P. Kaul, chief executive of Hughes Communications, Inc.), http://www.nytimes.com/2007/10/20/technology/20interview.html (last visited Jan. 15, 2008). 163 Hughes Annual Report, supra note 159, at 5. See also Annual Report and Analysis of Competitive Market Conditions with Respect to Domestic and International Satellite Communications Services, IB Doc. No. 06-67, First Report, 22 FCC Rcd 5954, 6011 ¶ 186 (2006). 164 See SIA Comments, supra note 161, at 2 (“The satellite industry currently provides competitive broadband services through-out the United States in the 48 contiguous states, the District of Columbia, Alaska, Hawaii, Puerto Rico and the US Virgin Islands.”). Hughes reports that “HughesNet service coverage is continent-wide, reaching an estimated 10 million or more households and over 3 million small businesses in the U.S. that are unserved by terrestrial broadband technologies.” Hughes Annual Report, supra note 159, at 5. See also, W. J. Holstein, Sending Up Satellites and Closing the Digital Divide, New York Times (Oct. 20, 2007), http://www.nytimes.com/2007/10/20/technology/20interview.html (last visited Jan. 15, 2008). 165 J. Barthold, TerreStar’s Goal: Define, Create 4G Network, Telecommunications Online (Sept.19, 2007), http://www.telecommagazine.com/article.asp?HH_ID=AR_3484 (last visited Dec. 27, 2007); TerreStar-1 to Launch in Late 2008, Sat-News Daily (May 31, 2007), http://www.satnews.com/stories2007/4529/ (last visited Jan. 15, 2008); TerreStar Granted Spectrum for Hybrid Satellite-Terrestrial Network, SatNews Daily (May 21, 2007), http://www.satnews.com/stories2007/4481/ (last visited Jan. 15, 2008).166 News Release, Launch Dates Agreed with ILS for Third Inmarsat-4 Satellite, Inmarsat (July 8, 2007), http://www.inmarsat.com/About/Newsroom/00023055.aspx?language=EN&textonly=False (last visited Jan. 15, 2008); Our Satel-lites: Most Advanced of Their Kind, Inmarsat, http://www.inmarsat.com/About/Our_satellites/default.aspx?language=EN&textonly=False (last visited Jan. 15, 2008). 167 News Release, MSV, ILS Contract to Launch Next-Generation Satellite, Mobile Satellite Ventures (May 15, 2007), http://www.msvlp.com/media/press-releases-view.cfm?id=126&yr=2007 (last visited Jan. 15, 2008).168 See Next Generation Network, Differentiation from Existing MSS, Mobile Satellite Ventures, http://www.msvlp.com/nextgen/differentiation.cfm (last visited Jan. 15, 2008) (discussing MSV’s objective of achieving transparency in its next-generation integrated satellite/ATC network). 169 Broadband Deployment is Extensive Throughout the United States, But It Is Difficult to Assess the Extent of Deployment Gaps in Rural Areas, Government Accountability Office, GAO-06-426 (May 2006) at 23, http://www.gao.gov/new.items/d06426.pdf (last visited Jan. 15, 2008). 170 FCC Study, supra note 61, Table 1. 171 Id. at Table 1 and accompanying note 2. 172 TIA Market Study, supra note 18, at 84-85. 173 Id. at 84.
47
N E T W O R K E D N A T I O N : B R O A D B A N D I N A M E R I C A , 2 0 0 7 NATIONAL TELECOMMUNICATIONS AND INFORMATION ADMINISTRATION
174 Id. at 85. 175 Id. at 84. 176 Id. at 43, 61, 84. 177 Id. at 84. 178 Availability of Advanced Telecommunications Capability in the United States; Fourth Report to Congress, Federal Communications Commission (Sept. 9, 2004) at 16, http://hraunfoss.fcc.gov/edocs_public/attachmatch/FCC-04-208A1.pdf. 179 Id. 180 News Release, Fiber to the Home Revs Up Expansion, More than Two Million Homes Now Connected to Next-Generation Broadband, Fiber-to-the-Home Council (Oct. 3, 2007), http://www.ftthcouncil.org/?t=277 (last visited Jan. 15, 2008). 181 Id. 182 Id. 183 Id. 184 Id. 185 News Release, Verizon Continues to Dramatically Raise Broadband Upload Speeds in FiOS Internet Service Areas, Verizon (Nov. 20, 2007), http://newscenter.verizon.com/press-releases/verizon/2007/verizon-continues-to.html (last visited Jan. 15, 2008). 186 Id. 187 Id. See also Verizon/VZW Comments, supra note 722, at 1, 7. 188 TIA Market Study, supra note 18, at 61; see also Fact Sheet, How AT&T U-verse TV is Delivered, AT&T, http://www.att.com/Uverse/files/HowUverseIsDelivered_2-22.pdf (last visited Jan. 15, 2008). 189 Fact Sheet, How AT&T U-verse TV is Delivered, AT&T, http://www.att.com/Uverse/files/HowUverseIsDelivered_2-22.pdf (last visited Jan. 15, 2008). 190 Media Kits, AT&T U-verse, Innovative New Entertainment Experience, AT&T, http://www.att.com/gen/press-room?pid=5838 (last visited Jan. 15, 2008). 191 Id. 192 Id. 193 AT&T Raises Spending Outlook for U-verse Expansion, Reuters (Nov. 6, 2007), http://www.reuters.com/article/technology-media-telco-SP/idUSN0640400220071106 (last visited Jan. 15, 2008). 194 TIA Market Study, supra note 18, at 84-85. 195 Id. at 59, 84. 196 Id. at 61, 84. 197 Id. at 84-85. 198 Id. at 84. 199 MV lines carry electricity from a local substation, where power from regional and interstate power lines is reduced to a voltage that can reliably and safely be transmitted to residential and business customers. In the United States, a substation will typi-cally serve about 50 homes and MV power lines run between 9 and 30 miles. The LV lines are roughly equivalent to a telephone companies’ “loop” facilities, and carry power from the last utility pole to a customer’s home or business. At some point, the BPL provider extracts broadband signals from the power lines and, after aggregating traffic from multiple homes, processing the data, and adding routing information, connects them to a communications “backhaul” network (e.g., the Internet or the public telephone net-work) using wired or wireless facilities. For a more complete description of BPL technology, see L. Lushbaugh and S. Safavian, Broadband Over Power Lines (BPL), 5 Bechtel Telecommunications Technical Journal 19, 22-26 (Jan. 2007). 200 Status of Broadband Over Powerline 2007, United Power Line Council, http://uplc.utc.readyportal.net/file_depot/0-10000000/0-10000/7966/conman/2007+BPL+Update.pdf (last visited Jan. 15, 2008). 201 E. Gubbins, Powerline Promises Broken on Broadband, Telephony Online (May 22, 2006), http://telephonyonline.com/mag/telecom_powerline_promises_broken/ (last visited Jan. 15, 2008).
48
N E T W O R K E D N A T I O N : B R O A D B A N D I N A M E R I C A , 2 0 0 7 NATIONAL TELECOMMUNICATIONS AND INFORMATION ADMINISTRATION
202 TXU Electric Delivery Strives to Improve Reliability with BPL, Transmission & Distribution World (April 1, 2007), http://tdworld.com/customer_service/power_txu_electric_delivery-bpl/ (last visited Jan. 15, 2008). Please note that Duke Energy acquired Cinergy in 2006. 203 K. Belson, Power Companies Enter the High-Speed Market, New York Times (Oct. 17, 2005), http://www.intellon.com/pdfs/bpl_NYTimes_20051015.pdf (last visited Jan. 15, 2008). 204 TIA Market Study, supra note 18, at 69; TXU Electric Delivery Strives to Improve Reliability with BPL, supra note 202. 205 FCC Study, supra note 61, Table 6. 206 TIA Market Study, supra note 18, at 69. 207 C. Roden, FTTx and BPL: Analysis and Outlook, First Quarter 2007, Parks Associates, http://www.parksassociates.com/research/reports/tocs/pdfs/parks-FTTXandBPL.pdf (last visited Jan. 15, 2008). 208 E. Gubbins, supra note 201 (quoting Nicole Klein of the Yankee Group). 209 Id. (citing ComTek Chief Executive Officer Joe Fergus). 210 Posting of M. Arden to Analyst Industry Blogs, Earthlink’s Broadband Strategy, ABI Research, http://www.abiresearch.com/Blog/Digital_Home_Blog/127 (Oct. 18, 2006, 3:47 PM) (last visited Jan. 15, 2008). 211 E. Bangeman, DIRECTV Plugs into Broadband Over Power Line, Ars Technica (Aug. 15, 2007), http://arstechnica.com/news.ars/post/20070815-directv-plugs-into-broadband-over-power-line.html (last visited Jan. 15, 2008). 212 FCC Study, supra note 61, at 4 and Table 16. 213 Verizon/VZW Comments, supra note 722, at 6. 214 National Cable & Telecommunications Association (Kagan Research estimate), http://www.ncta.com/ContentView.aspx?contentId=56 (last visited Jan. 15, 2008). 215 NCTA Comments, supra note 91, at 6-7. 216 Cable, Communications Daily at 15 (May 23, 2007). 217 TIA Market Study, supra note 18, at 84. 218 Id. 219 Id. at 162. 220 Id. 221 M. Bruun, Wireless is More, Worcester (MA) Telegram & Gazette (Nov. 6, 2007), http://www.telegram.com/article/20071106/NEWS/711060630/1008/NEWS02 (last visited Jan. 15, 2008). 222 TIA Market Study, supra note 18, at 162. 223 Verizon/VZW Comments, supra note 72, at 7. 224 AT&T Raises Spending Outlook for U-verse Expansion, Reuters (Nov. 6, 2007), http://www.reuters.com/article/technology-media-telco-SP/idUSN0640400220071106 (last visited Jan. 15, 2008); see also Reply Comments of AT&T, Inc. in GN Docket No. 07-45, Inquiry Concerning the Deployment of Advanced Telecommunications Capability to All Americans in a Reasonable and Timely Fashion, and Possible Steps to Accelerate Such Deployment Pursuant to Section 706 of the Telecommunications Act of 1996 (May 31, 2007) at 4 (AT&T Reply Comments). 225 J. Bartash, Qwest’s Earning Soar on Tax Gain, MarketWatch (Oct. 30, 2007), http://www.marketwatch.com/News/Story/qwests-earnings-soar-tax-gain/story.aspx?guid=%7BA0FAD201-E0ED-46FF-AB02-82051EAF65F4%7D (last visited Jan. 15, 2008). 226 FTC Report, supra note 81, at 101. 227 Id. at n. 469 (quoting Robert W. Hahn & Robert E. Litan, The Myth of Network Neutrality and What We Should Do About It 10 (AEI-Brookings Joint Center, Working Paper No. RP-06-33, Nov. 2006)), http://www.aei-brookings.org/admin/authorpdfs/page.php?id=1357 (“While the absolute price of a cable modem has not declined as rapidly, the quality-adjusted price has declined significantly, as cable modem connection speeds have more than doubled while prices held steady.”). 228 TIA Market Study, supra note 18, at 67.
49
N E T W O R K E D N A T I O N : B R O A D B A N D I N A M E R I C A , 2 0 0 7 NATIONAL TELECOMMUNICATIONS AND INFORMATION ADMINISTRATION
229 Verizon/VZW Comments, supra note 722, at 7 & n. 22 (citing D. Barden, et al., Bank of America, Battle for the Bundle: Con-sumer Wireline Services Pricing at 9 (Jan. 23, 2006) (“The rollout of Verizon’s FiOS service in select markets has elicited thinly advertised, yet highly competitive pricing responses for incumbent cable providers. . . . In each of these markets the respective cable provider . . . has responded with competitive pricing, well below their national average.”)) 230 Comments of the National Rural Telecommunications Cooperative in USDA Rural Utilities Service Docket No. RUS-06-Agency-0052 (July 10, 2007) at 5, http://www.nrtc.coop/export/main/news_policy/NRTC_Comments_RUS_broadband_071007.pdf (NRTC RUS Comments). 231 Wildblue Slashes Installation Price, Adds $200 Million to Coffers, Satellite News (Jan. 23, 2006), http://www.accessmylibrary.com/coms2/summary_0286-12484725_ITM (last visited Jan. 15, 2008). 232 SIA Comments, supra note 161, at 3 n. 4. 233 Id. Satellite broadband market analysts have echoed this analysis. See Wildblue Slashes Installation Price, Adds $200 Million to Coffers, supra note 231 (“‘I expect that Wildblue would like to get the installation price down to the point where they could cover it entirely, the way that DirecTV does,’ [Frost & Sullivan analyst, Max] Engel said. To do this, Wildblue will need to sell enough home satellite terminals to drive down their manufacturing costs substantially. ‘It’s a matter of the more people they get, the cheaper they can offer the product, and the cheaper they can offer the product, the more people they can get.’”). 234 See NRTC RUS Comments, supra note 230, at 2 & n. 2. See also Wildblue Slashes Installation Price, Adds $200 Million to Coffers, supra note 231 (also observing that “Wildblue has signed up five more value-added resellers to help move its enterprise VSAT products . . . [which are] aimed at telecommuters, retailers, financial services companies, government, telemedicine, and disaster re-covery providers, among others.”); and While GAO Fiddles, Wildblue, Hughes Burn Ahead on Broadband, Satellite News (May 22, 2006),http://www.accessmylibrary.com/coms2/summary_0286-15329851_ITM (last visited Jan. 15, 2008). 235 O. Kharif, Wal-Mart’s Latest Sale: Broadband, BusinessWeek (Oct. 8, 2007), http://www.businessweek.com/technology/content/oct2007/tc2007108_060026.htm (last visited Jan. 15, 2008); see also Broadband Across America: Through Wal-Mart, Hughes Brings High-Speed Internet to Rural Communities, Hughes Communications, Inc. (Oct. 9, 2007), http://www.hughes.com/HUGHES/Doc/0/PMG7IF1L6RL456TDI3HPA5SK14/100907.htm. (last visited Jan. 15, 2008). 236 O. Kharif, Wal-Mart’s Latest Sale: Broadband, BusinessWeek, supra note 235. 237 See HughesNet, “Pricing,” http://go.gethughesnet.com/HUGHES/Rooms/DisplayPages/LayoutInitial?Container=com.webridge.entity.Entity%5BOID%5B71A9F5B422ABCE4886D9492F66B5B589%5D%5D (last visited Jan. 15, 2008). 238 Id . 239 See FCC Study, supra note 61, at 4 & Table 16.
50

N E T W O R K E D N A T I O N : B R O A D B A N D I N A M E R I C A , 2 0 0 7 NATIONAL TELECOMMUNICATIONS AND INFORMATION ADMINISTRATION
Appendices

N E T W O R K E D N A T I O N : B R O A D B A N D I N A M E R I C A , 2 0 0 7 NATIONAL TELECOMMUNICATIONS AND INFORMATION ADMINISTRATION
Appendix A: Internet Use Supplement to the September 2001
Current Population Survey
U.S. Census Bureau (September 2001)
Excerpted Tables The referenced tables in their entirety are available on NTIA’s website at http://www.ntia.doc.gov/reports/2008/NetworkedNation.html.
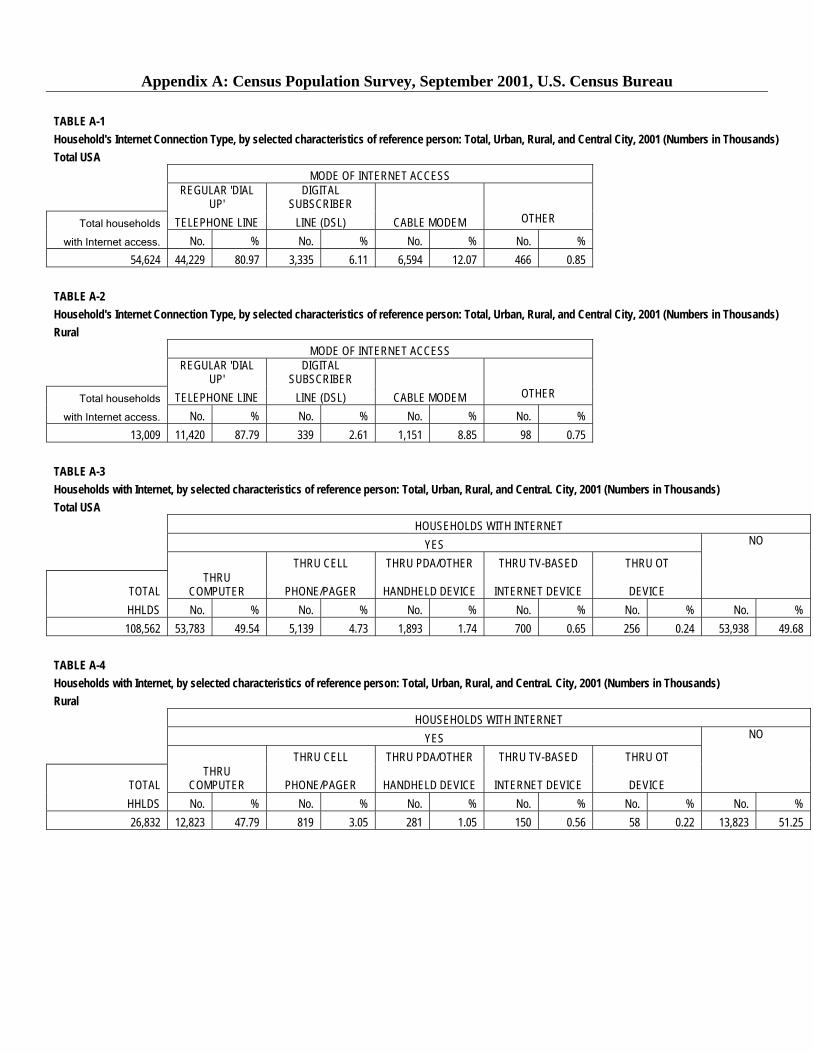
Appendix A: Census Population Survey, September 2001, U.S. Census Bureau
TABLE A-1 Household's Internet Connection Type, by selected characteristics of reference person: Total, Urban, Rural, and Central City, 2001 (Numbers in Thousands) Total USA MODE OF INTERNET ACCESS
REGULAR 'DIAL
UP' DIGITAL
SUBSCRIBER
Total households TELEPHONE LINE LINE (DSL) CABLE MODEM OTHER
with Internet access. No. % No. % No. % No. % 54,624 44,229 80.97 3,335 6.11 6,594 12.07 466 0.85
TABLE A-2 Household's Internet Connection Type, by selected characteristics of reference person: Total, Urban, Rural, and Central City, 2001 (Numbers in Thousands) Rural MODE OF INTERNET ACCESS
REGULAR 'DIAL
UP' DIGITAL
SUBSCRIBER
Total households TELEPHONE LINE LINE (DSL) CABLE MODEM OTHER
with Internet access. No. % No. % No. % No. % 13,009 11,420 87.79 339 2.61 1,151 8.85 98 0.75
TABLE A-3 Households with Internet, by selected characteristics of reference person: Total, Urban, Rural, and CentraL City, 2001 (Numbers in Thousands) Total USA HOUSEHOLDS WITH INTERNET YES THRU CELL THRU PDA/OTHER THRU TV-BASED THRU OT
TOTAL THRU
COMPUTER PHONE/PAGER HANDHELD DEVICE INTERNET DEVICE DEVICE
NO
HHLDS No. % No. % No. % No. % No. % No. % 108,562 53,783 49.54 5,139 4.73 1,893 1.74 700 0.65 256 0.24 53,938 49.68
TABLE A-4 Households with Internet, by selected characteristics of reference person: Total, Urban, Rural, and CentraL City, 2001 (Numbers in Thousands) Rural HOUSEHOLDS WITH INTERNET YES THRU CELL THRU PDA/OTHER THRU TV-BASED THRU OT
TOTAL THRU
COMPUTER PHONE/PAGER HANDHELD DEVICE INTERNET DEVICE DEVICE
NO
HHLDS No. % No. % No. % No. % No. % No. % 26,832 12,823 47.79 819 3.05 281 1.05 150 0.56 58 0.22 13,823 51.25
N E T W O R K E D N A T I O N : B R O A D B A N D I N A M E R I C A , 2 0 0 7 NATIONAL TELECOMMUNICATIONS AND INFORMATION ADMINISTRATION
Appendix B: Internet Use Supplement to the October 2007
Current Population Survey
U.S. Census Bureau (October 2007)
Excerpted Tables The referenced tables in their entirety are available on NTIA’s website at http://www.ntia.doc.gov/reports/2008/NetworkedNation.html.
Appendix B: Current Population Survey (October 2007), U.S. Census Bureau TABLE B-1 Households using the Internet in and outside the home, by selected characteristics: Total, Urban, Rural, Principal City, 2007 (Numbers in Thousands) Total USA Households Using Internet IN THE HOME
TOTAL TOTAL DIAL-UP BROADBAND
ANYWHERE NO INTERNET USE
HHLDS No. % No. % No. % No. % No. % 117,840 72,721 61.71 12,575 10.67 59,847 50.79 83,708 71.04 34,132 28.96
TABLE B-2 Households using the Internet in and outside the home, by selected characteristics: Total, Urban, Rural, Principal City, 2007 (Numbers in Thousands) Rural Households Using Internet IN THE HOME
TOTAL TOTAL DIAL-UP BROADBAND
ANYWHERE NO INTERNET USE
HHLDS No. % No. % No. % No. % No. % 23,394 13,646 58.33 4,514 19.29 9,072 38.78 15,963 68.24 7,431 31.76
Table B-3: Percent of Households with Internet Broadband Access, Ranked by State: 2007 (Numbers in Thousands)
Percent with Internet 90% Total Broadband Confidence State Households Access Interval New Hampshire 532 64.9 2.82 Alaska 244 62.5 2.95 Massachusetts 2,578 61.1 2.27 Connecticut 1,403 59.7 2.80 Utah 897 59.3 2.70 Rhode Island 420 59.2 2.94 Washington 2,656 58.4 2.30 Colorado 1,959 58.0 2.67 Hawaii 423 57.6 3.00 Oregon 1,513 57.5 2.85 New Jersey 3,292 57.1 2.07 California 13,037 56.4 1.04 Maryland 2,173 56.1 2.57 Kansas 1,115 55.2 2.87 Nevada 1,001 54.3 2.85 New York 7,471 54.1 1.39 Nebraska 713 54.1 2.87 Arizona 2,459 53.9 2.40 Georgia 3,663 53.9 1.95 Virginia 3,013 53.3 2.16 Florida 7,599 53.2 1.35 Minnesota 2,113 53.0 2.57 Wisconsin 2,394 52.6 2.43 Washington, DC 276 52.0 2.86 Illinois 4,980 51.6 1.69 Wyoming 215 50.4 2.97 Delaware 324 50.4 2.99 Ohio 4,611 48.8 1.76 North Dakota 274 48.7 2.79 Maine 541 48.4 3.12 Pennsylvania 5,056 47.7 1.68 Texas 8,794 47.6 1.28 South Dakota 324 47.5 2.64 North Carolina 3,548 47.1 2.00 Iowa 1,230 46.8 2.84 Vermont 258 46.8 3.04 Michigan 3,987 45.9 1.88 Idaho 569 45.5 2.77 Missouri 2,394 45.3 2.45 New Mexico 806 43.2 2.80 Louisiana 1,622 42.9 2.88 Indiana 2,579 42.3 2.30 Tennessee 2,492 41.6 2.34 Montana 424 40.2 2.67 Kentucky 1,749 40.0 2.77 South Carolina 1,783 39.1 2.73 Oklahoma 1,436 38.7 2.80 Arkansas 1,142 38.2 2.70 Alabama 1,866 37.4 2.62 Mississippi 1,137 33.2 2.68 West Virginia 752 32.7 2.46