Embed Size (px)
Citation preview
Unlocking broadband for all. Broadband infrastructure sharing policies and
strategies in emerging markets
Appendix - April 2015
Private and confidential – not for publication
Broadband infrastructure sharing policies and strategies in emerging markets April 2015
© 2015 Deloitte LLP. 1
Contents
Executive Summary Error! Bookmark not defined.
1 Introduction....................................... ........................................................................... Error! Bookmark not defined.
2 Analysis of Infrastructure Sharing Opportunities .. ................................................ Error! Bookmark not defined.
3 The Benefits of Infrastructure Sharing ............ ........................................................ Error! Bookmark not defined.
4 Investment in shared infrastructure: competition an d regulation issues........... Error! Bookmark not defined.
5 Best practice policies and strategies to incentivi se sharing ............................... Error! Bookmark not defined.
Appendix A African and South East Asian markets .............. ............................................................................... 2
Important Notice
This report (the “Report”) has been prepared by Del oitte LLP (“Deloitte”) for The Association for Prog ressive Communications (“APC”) in accordance with the contr act with them dated 29/07/2014 (“the Contract”) and on the basis of the scope and limitations set out below.
The Report has been prepared solely for the purpose s of examining the experience of infrastructure-sha ring policies and strategies in emerging markets, as set out in the Contract. It should not be used for an y other purpose or in any other context, and Deloitte accepts no re sponsibility for its use in either regard.
The Report is provided exclusively for the APC’s us e under the terms of the Contract. No party other t han APC is entitled to rely on the Report for any purpose what soever and Deloitte accepts no responsibility or li ability or duty of care to any party other than APC in respect of t he Report or any of its contents.
As set out in the Contract, the scope of our work h as been limited by the time, information and explan ations made available to us. The information contained in the Report has been obtained from APC and third party s ources that are clearly referenced in the appropriate sections of the Report. Deloitte has neither sought to corr oborate this information nor to review its overall reasonablenes s. Further, any results from the analysis containe d in the Report are reliant on the information available at the tim e of writing the Report (September 2014) and should not be relied upon in subsequent periods.
All copyright and other proprietary rights in the R eport remain the property of Deloitte LLP and any r ights not expressly granted in these terms or in the Contract are reserved.
This Report and its contents do not constitute fina ncial or other professional advice, and specific ad vice should be sought about your specific circumstances. In parti cular, the Report does not constitute a recommendat ion or endorsement by Deloitte to invest or participate in , exit, or otherwise use any of the markets or comp anies referred to in it. To the fullest extent possible, both Del oitte and APC disclaim any liability arising out of the use (or non-use) of the Report and its contents, including any action or decision taken as a result of such use (o r non-use).
Broadband infrastructure sharing policies and strategies in emerging markets April 2015
© 2015 Deloitte LLP. 2
Appendix A African and South East Asian markets
This appendix provides more details on the development of the telecom market, on infrastructure sharing progress and regulations in ten countries in Africa and South East Asia. These are: Kenya, Nigeria, South Africa, Uganda, Côte d’Ivoire, Mozambique, India, Indonesia, Thailand and the Philippines. The research presented in this appendix was undertaken in Q3 2014.
A.1 Kenya
A.1.1 Market Summary
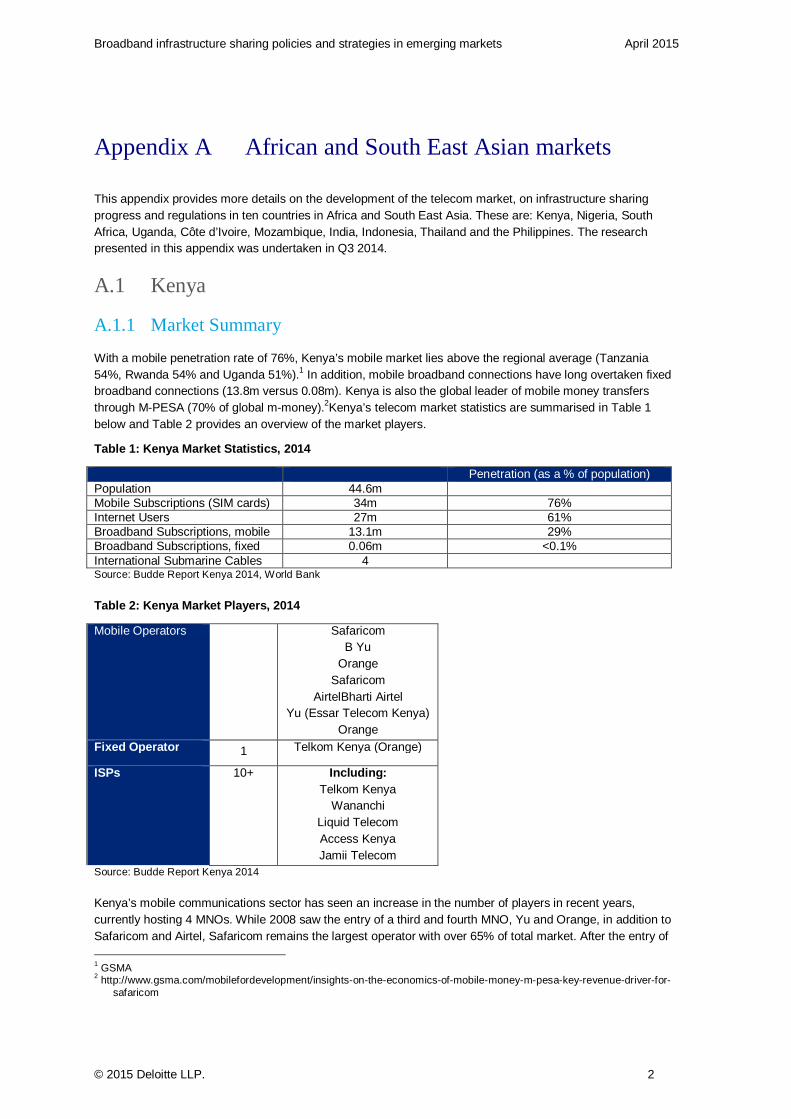
With a mobile penetration rate of 76%, Kenya’s mobile market lies above the regional average (Tanzania 54%, Rwanda 54% and Uganda 51%).1 In addition, mobile broadband connections have long overtaken fixed broadband connections (13.8m versus 0.08m). Kenya is also the global leader of mobile money transfers through M-PESA (70% of global m-money).2Kenya’s telecom market statistics are summarised in Table 1 below and Table 2 provides an overview of the market players.
Table 1: Kenya Market Statistics, 2014
Penetration (as a % of population) Population 44.6m Mobile Subscriptions (SIM cards) 34m 76% Internet Users 27m 61% Broadband Subscriptions, mobile 13.1m 29% Broadband Subscriptions, fixed 0.06m <0.1% International Submarine Cables 4 Source: Budde Report Kenya 2014, World Bank
Table 2: Kenya Market Players, 2014
Mobile Operators 44 Safaricom B Yu
Orange Safaricom
AirtelBharti Airtel Yu (Essar Telecom Kenya)
Orange Fixed Operator 1 Telkom Kenya (Orange)
ISPs 10+ Including: Telkom Kenya
Wananchi Liquid Telecom Access Kenya Jamii Telecom
Source: Budde Report Kenya 2014
Kenya’s mobile communications sector has seen an increase in the number of players in recent years, currently hosting 4 MNOs. While 2008 saw the entry of a third and fourth MNO, Yu and Orange, in addition to Safaricom and Airtel, Safaricom remains the largest operator with over 65% of total market. After the entry of
1 GSMA 2 http://www.gsma.com/mobilefordevelopment/insights-on-the-economics-of-mobile-money-m-pesa-key-revenue-driver-for-
safaricom
Broadband infrastructure sharing policies and strategies in emerging markets April 2015
© 2015 Deloitte LLP. 3
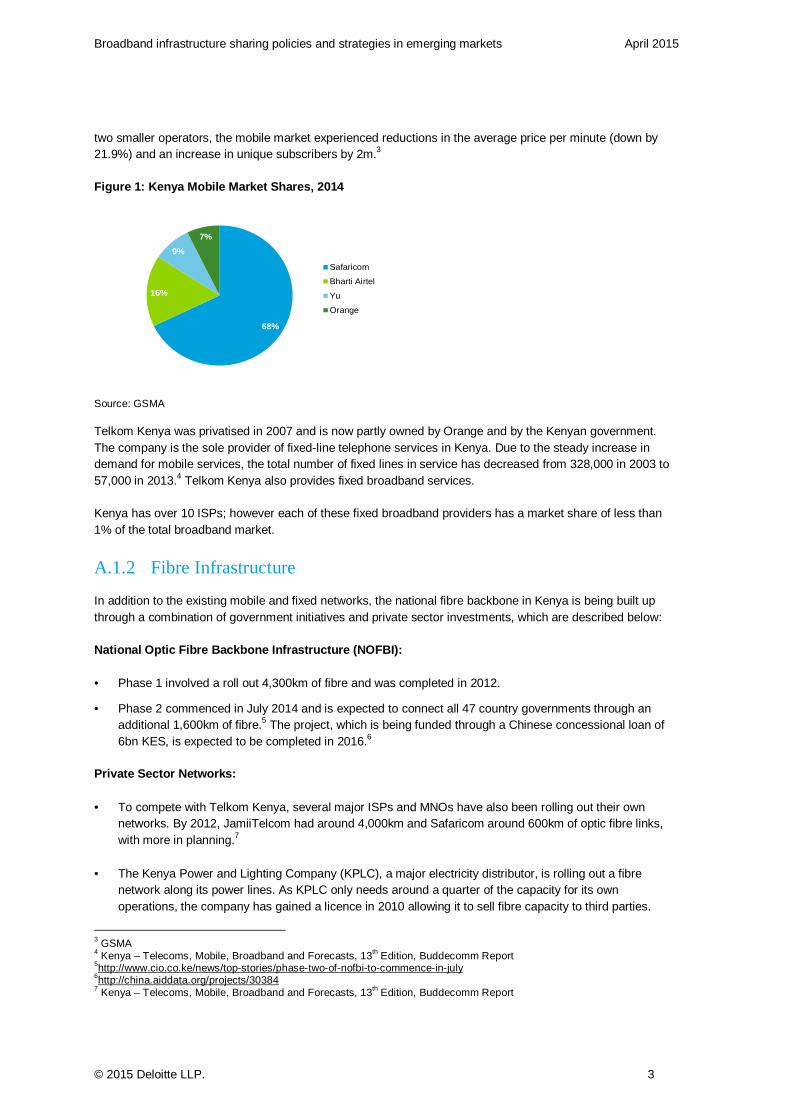
two smaller operators, the mobile market experienced reductions in the average price per minute (down by 21.9%) and an increase in unique subscribers by 2m.3
Figure 1: Kenya Mobile Market Shares, 2014
Source: GSMA Telkom Kenya was privatised in 2007 and is now partly owned by Orange and by the Kenyan government. The company is the sole provider of fixed-line telephone services in Kenya. Due to the steady increase in demand for mobile services, the total number of fixed lines in service has decreased from 328,000 in 2003 to 57,000 in 2013.4 Telkom Kenya also provides fixed broadband services.
Kenya has over 10 ISPs; however each of these fixed broadband providers has a market share of less than 1% of the total broadband market.
A.1.2 Fibre Infrastructure
In addition to the existing mobile and fixed networks, the national fibre backbone in Kenya is being built up through a combination of government initiatives and private sector investments, which are described below:
National Optic Fibre Backbone Infrastructure (NOFBI ):
• Phase 1 involved a roll out 4,300km of fibre and was completed in 2012.
• Phase 2 commenced in July 2014 and is expected to connect all 47 country governments through an additional 1,600km of fibre.5 The project, which is being funded through a Chinese concessional loan of 6bn KES, is expected to be completed in 2016.6
Private Sector Networks:
• To compete with Telkom Kenya, several major ISPs and MNOs have also been rolling out their own networks. By 2012, JamiiTelcom had around 4,000km and Safaricom around 600km of optic fibre links, with more in planning.7
• The Kenya Power and Lighting Company (KPLC), a major electricity distributor, is rolling out a fibre network along its power lines. As KPLC only needs around a quarter of the capacity for its own operations, the company has gained a licence in 2010 allowing it to sell fibre capacity to third parties.
3 GSMA 4 Kenya – Telecoms, Mobile, Broadband and Forecasts, 13th Edition, Buddecomm Report 5http://www.cio.co.ke/news/top-stories/phase-two-of-nofbi-to-commence-in-july 6http://china.aiddata.org/projects/30384 7 Kenya – Telecoms, Mobile, Broadband and Forecasts, 13th Edition, Buddecomm Report
68%
16%
9%
7%
Safaricom
Bharti Airtel
Yu
Orange
Broadband infrastructure sharing policies and strategies in emerging markets April 2015
© 2015 Deloitte LLP. 4
International Terrestrial Fibre Links:
In addition to the national fibre backbone, Kenya is also connected to many of its neighbouring countries through terrestrial international fibre links:
• The Eastern Africa Backhaul System is a Joint Venture among national operators and involves a 4,000km fibre backbone, connecting Kenya, Uganda, Tanzania, Burundi and Rwanda.
• As part of a project, linking the countries’ electricity grids, Kenya has established fibre connections with Tanzania and Zambia.
A.1.3 Infrastructure Sharing Regulations
In 2009 the regulator, the Competition Authority of Kenya (CAK) (formerly known as the Communications Commission of Kenya, CCK) developed the “Code of Practice for the Deployment of Communication Infrastructure”.8
The code applies to all forms of passive communication infrastructure including towers, masts, ducts and overhead, underground and submarine cables.9 Concerning site sharing and co-location the code gives the following provisions:
• Site Sharing is to be pursued as the first option by telecom operators. The commercial terms have to be mutually agreed upon and agreements are to be done on a first come first serve basis (4.5.1).
• An operator who declines a request for site-sharing has to give reasons in writing to the requesting operator and the administrator of the code (4.5.4). A complaint can be filed by the requesting operator (4.5.5).
The code further provides guidance on the sharing of duct and cable infrastructure:
• Operators must share ducts and cables whenever technically possible (4.10.1).
• Sharing of cable infrastructure is contingent on the availability of duct space (4.10.2).
While the code encourages the sharing of passive infrastructure, it is not set in mandatory terms and it is largely left to the discretion of the operators to decide whether or not it is technically feasible to share their infrastructure.10 However, in June 2014, the CAK announced that it intends to enforce infrastructure sharing among mobile operators. The regulator further announced that it plans to penalise those operators who fail to comply.11
The code does not include any provisions for active infrastructure sharing. This suggests that for this case there is no regulatory framework in place.
A.1.4 Infrastructure Sharing Projects
The sharing of passive infrastructure such as ducts, fibre and towers is permitted by the government in Kenya. Consequently, there are several examples of such initiatives:
8 Code of Practice for the Deployment of Communications Infrastructure in Kenya 9 Code of Practice for the Deployment of Communications Infrastructure in Kenya, Chapter 2 10 Nojiyeza and Muthoka, “Barriers to Entry of Kenya’s Telecommunication Industry: Is there a Market Slice for New
Entrants?”, Journal of Management and Administration, 2013 11http://allafrica.com/stories/201406250311.html
Broadband infrastructure sharing policies and strategies in emerging markets April 2015
© 2015 Deloitte LLP. 5
Fibre optic business:
• Through its fibre optic business, KPLC has been selling capacity on its national fibre routes to the majority of Kenya’s telecommunications operators including Safaricom, Airtel, Wananchi, Liquid Telecom, Jamii and Indigo.12
Tower Sharing:
• While towers were mainly seen as competitive assets to fulfil licensing obligations, since 2003 most operators in Kenya share their tower infrastructures on a commercial basis.13
Tower companies:
• In 2013, as part of Kenya’s first tower deal, Telkom Kenya entered a tower management agreement with Eaton Towers. Under a 15 year partnership, Eaton Towers will manage Telkom’s portfolio of over 1,000 towers and invest in new ones in order to expand coverage.14
A.2 Nigeria
A.2.1 Market Summary
With over 125m subscriptions, Nigeria is Africa’s largest mobile market. A summary of the Nigerian telecom market can be found in Table 3 below and an overview of the market players in Table 4.
Table 3: Nigeria Market Statistics, 2014
Penetration (as a % of population) Population 174m Mobile Subscriptions (SIM cards) 125m 72% Internet Users 95m 55% Broadband Subscriptions, mobile 63m 36% Broadband Subscriptions, fixed 0.17m 0.1% International Submarine Cables 5 Source: Budde Report Nigeria 2014 and NCC
Table 4: Nigeria Market Players, 2014
Mobile Operators 7 MTN Bharti Airtel
Etisalat Glo Mobile Visafone
Smile Multi-Links
Fixed Operators 80+ Including: Nitel
Globacom 21st Century Technologies
Multi-Links Telecom ISPs 100+ Including:
CyberSpace 21st Century Technologies Internet Solutions Nigeria
Source: Budde Report Nigeria 2014
12http://kplc.co.ke/content/item/35 13 Industry Interviews 14http://eatontowers.com/telkom_kenya_signs_tower_management_partnership.php
Broadband infrastructure sharing policies and strategies in emerging markets April 2015
© 2015 Deloitte LLP. 6
Since 2006 a unified licencing regime applies in Nigeria whereby operators are allowed to offer fixed and mobile services, which significantly increased competition in the market.15 As a result, there are over 80 fixed operators and 100 ISPs.
Besides the incumbent Nitel, the Nigerian fixed market also features a second national operator, Globacom (whose mobile arm is branded as ‘Glo Mobile’) who received its licence in 2002. After numerous failed privatisation attempts the national telcoNitel is currently under liquidation.
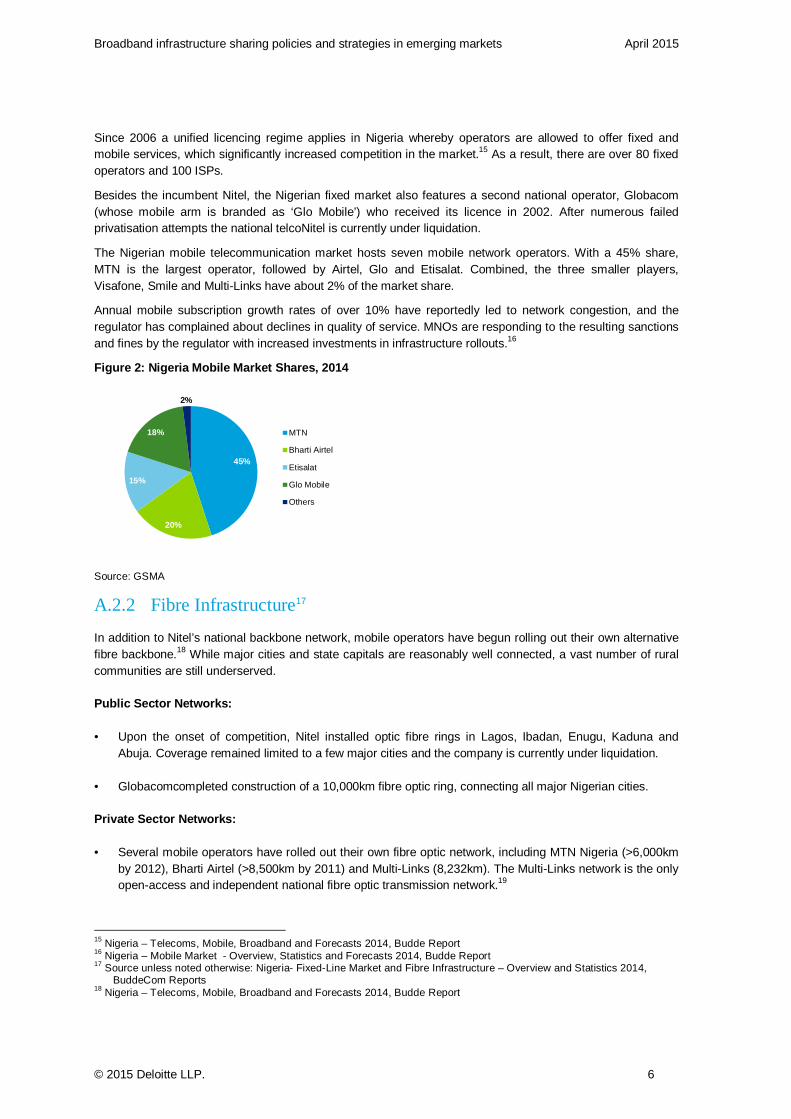
The Nigerian mobile telecommunication market hosts seven mobile network operators. With a 45% share, MTN is the largest operator, followed by Airtel, Glo and Etisalat. Combined, the three smaller players, Visafone, Smile and Multi-Links have about 2% of the market share.
Annual mobile subscription growth rates of over 10% have reportedly led to network congestion, and the regulator has complained about declines in quality of service. MNOs are responding to the resulting sanctions and fines by the regulator with increased investments in infrastructure rollouts.16
Figure 2: Nigeria Mobile Market Shares, 2014
Source: GSMA
A.2.2 Fibre Infrastructure17
In addition to Nitel’s national backbone network, mobile operators have begun rolling out their own alternative fibre backbone.18 While major cities and state capitals are reasonably well connected, a vast number of rural communities are still underserved.
Public Sector Networks:
• Upon the onset of competition, Nitel installed optic fibre rings in Lagos, Ibadan, Enugu, Kaduna and Abuja. Coverage remained limited to a few major cities and the company is currently under liquidation.
• Globacomcompleted construction of a 10,000km fibre optic ring, connecting all major Nigerian cities.
Private Sector Networks:
• Several mobile operators have rolled out their own fibre optic network, including MTN Nigeria (>6,000km by 2012), Bharti Airtel (>8,500km by 2011) and Multi-Links (8,232km). The Multi-Links network is the only open-access and independent national fibre optic transmission network.19
15 Nigeria – Telecoms, Mobile, Broadband and Forecasts 2014, Budde Report 16 Nigeria – Mobile Market - Overview, Statistics and Forecasts 2014, Budde Report 17 Source unless noted otherwise: Nigeria- Fixed-Line Market and Fibre Infrastructure – Overview and Statistics 2014,
BuddeCom Reports 18 Nigeria – Telecoms, Mobile, Broadband and Forecasts 2014, Budde Report
45%
20%
15%
18%
2%
MTN
Bharti Airtel
Etisalat
Glo Mobile
Others
Broadband infrastructure sharing policies and strategies in emerging markets April 2015
© 2015 Deloitte LLP. 7
• There are a number of infrastructure companies selling fibre to operators: Phase3Telecom, Suburban Telecom and Backbone Connectivity Nigeria Limited. In 2013, Phase3Telecom received funding from the Universal Service Provision Fund (USPF) to start extending its backbone network into more rural areas.
International Terrestrial Fibre Links:
There are several existing and proposed terrestrial fibre links to Nigeria’s neighbouring countries:
• Suburban Telecom and Phase3 Telecom have established fibre links to Benin, Togo and Ghana.
• Central African Backbone (CAB) is a PPP initiated by the World Bank, aiming to develop a regional fibre optic backbone. Cameroon, the Central African Republic and Chad are already participating and Nigeria is eligible to participate.
A.2.3 Infrastructure Sharing Regulations20
In 2006 Nigeria’s telecom regulator, the Nigerian Communications Commission (NCC), published ‘Guidelines on Collocation and Infrastructure sharing’ in order to establish a framework for infrastructure sharing agreements between operators.21
The objectives of the guidelines on infrastructure sharing include:
• Minimising or completely avoiding the unnecessary duplication of infrastructure.
• Protecting the environment by reducing the proliferation of installations.
• Encouraging operators to pursue a cost-orientated policy, ultimately reducing the tariffs for consumers.
• Promoting fair competition through equal access.
The guidelines further define the infrastructure suitable for sharing, i.e. which can be shared without reducing competition. This includes rights of way, tower structures, ducts and trenches, space in buildings and electrical power.
The Commission does not promote or encourage the sharing of active infrastructure as it states that this could lead to a “risk of a lessening of competition”. Such infrastructure includes complete network structures, switching centres, radio network controllers and base stations.
The guidelines identify three admissible grounds for refusing access to infrastructure: insufficient capacity; safety, reliability and incompatibility of facilities; and general engineering considerations. Furthermore the guidelines demand that any prices for infrastructure sharing must be non-discriminatory, reasonable and based on actual costs.
Upon refusal to access, the guidelines give the NCC the right to request reconsideration of the decision, or to impose an infrastructure agreement on the parties should the grounds of refusal be found unacceptable.
A.2.4 Infrastructure Sharing Projects
Due to the aforementioned difficulties of operators to keep pace with subscriber growth, infrastructure sharing is encouraged by the National Broadband Plan 2013-2018.22 Initiatives up to date mainly involve the sharing of passive infrastructure and include:
19 http://www.multilinks.com/About.aspx 20 Source unless noted otherwise: Guidelines on Collocation and Infrastructure Sharing, Nigerian Communications
Commission, 2006 21 Nigeria- Fixed-Line Market and Fibre Infrastructure – Overview and Statistics 2014, BuddeCom Reports
Broadband infrastructure sharing policies and strategies in emerging markets April 2015
© 2015 Deloitte LLP. 8
Tower Companies: 23
• In 2007, Helios Towers Nigeria, one of Africa’s first tower companies, received a licence for co-location of infrastructure. Deals with Multi-Links and Gateway Business Nigeria took the company’s portfolio of managed sites to over 1,000 towers.
• In 2011, the MNO Visafone entered into a tower sale-and lease-back agreement with the tower company IHS Nigeria.
• By 2014, an estimated 4,500 towers in Nigeria will be owned by independent tower companies.24 Furthermore, market experts report that Nigeria’s two largest MNOs, Bharti Airtel and MTN, are in the process of selling a large stake of their tower portfolios to independent tower companies. The deals are expected to be completed by the end of 2014.25
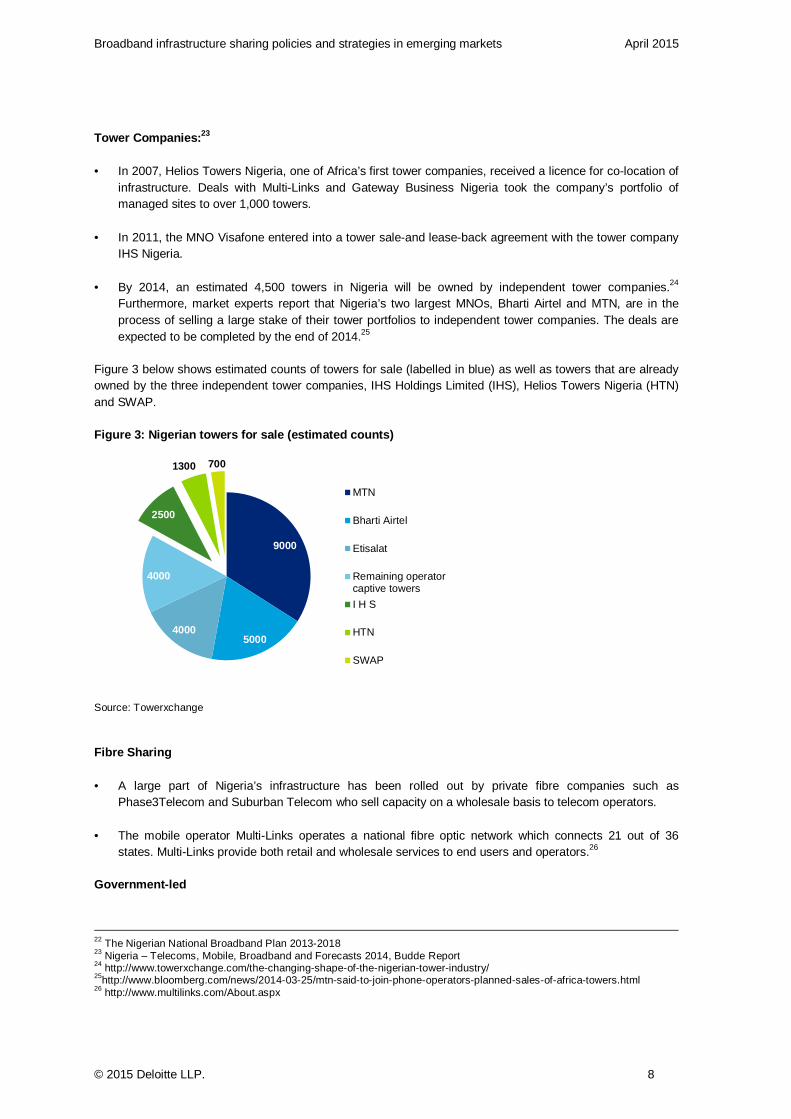
Figure 3 below shows estimated counts of towers for sale (labelled in blue) as well as towers that are already owned by the three independent tower companies, IHS Holdings Limited (IHS), Helios Towers Nigeria (HTN) and SWAP.
Figure 3: Nigerian towers for sale (estimated count s)
Source: Towerxchange
Fibre Sharing
• A large part of Nigeria’s infrastructure has been rolled out by private fibre companies such as Phase3Telecom and Suburban Telecom who sell capacity on a wholesale basis to telecom operators.
• The mobile operator Multi-Links operates a national fibre optic network which connects 21 out of 36 states. Multi-Links provide both retail and wholesale services to end users and operators.26
Government-led
22 The Nigerian National Broadband Plan 2013-2018 23 Nigeria – Telecoms, Mobile, Broadband and Forecasts 2014, Budde Report 24 http://www.towerxchange.com/the-changing-shape-of-the-nigerian-tower-industry/ 25http://www.bloomberg.com/news/2014-03-25/mtn-said-to-join-phone-operators-planned-sales-of-africa-towers.html 26 http://www.multilinks.com/About.aspx
9000
50004000
4000
2500
1300 700
MTN
Bharti Airtel
Etisalat
Remaining operatorcaptive towers
I H S
HTN
SWAP
Broadband infrastructure sharing policies and strategies in emerging markets April 2015
© 2015 Deloitte LLP. 9
• The government plans to provide an open-access and non-discriminatory nation-wide broadband fibre network for all operators. For the construction of the Next Generation Broadband Network (NBN), the NCC planned to licence seven infrastructure companies in December 2014 to roll out the network.27
A.3 South Africa
A.3.1 Market Summary
At 154%, South Africa has one of the highest mobile penetration rates and is the most developed telecom market in the region. Compared to many other African countries, South Africa also has a high penetration rate of internet users and mobile broadband subscriptions. For detailed market statistics, see Table 5 below. Table 6 provides an overview of the market players in the South African telecommunications sector.
Table 5: South Africa Market Statistics, 2014
Penetration (as a % of population) Population 52.4m Mobile Subscriptions (SIM cards) 81m 154% Internet Users 28m 53% Broadband Subscriptions, mobile 25m 48% Broadband Subscriptions, fixed 1.6m 3% International Submarine Cables 5 Source: Budde Report South Africa 2014, GSMA and World Bank
Table 6: South Africa Market Players, 2014
Mobile Operators 4 Vodacom MTN Cell C Telekom Mobile
Fixed Operators 2 Telkom SA Neotel
ISPs 20 major Including: Telkom Internet MWEB Internet Solutions
Source: Budde Report South Africa 2014
There are currently two fixed operators and over 20 ISPs in South Africa. Neotel gained its licence as the second national operator in 2005, ending Telkom’s monopoly on fixed lines. Neotel’s estimated market share in 2013 was around 4%. According to an announcement by Vodacom in September 2013, Neotel is in the process of being acquired by mobile operator Vodacom.28
Additional competition for the existing fixed-line operators comes from national and private infrastructure companies and recently also from MNOs which, under a new service-neutral regulatory framework, can now enter the fixed-line, fibre-backbone and mobile banking markets.29
South Africa’s mobile telecommunications market currently hosts 4 MNOs. The fourth operator, Telekom Mobile, the mobile arm of public Telkom SA, entered in 2008, but has not been able to capture a significant market share (3% in 2014).
27 Nigeria – Telecoms, Mobile, Broadband and Forecasts 2014, Budde Report 28http://www.vodacom.co.za/cs/groups/public/documents/vodacom.co.za_portal_webassets/pocm01-810687.pdf 29 South Africa – Telecoms, Mobile, Broadband and Forecasts 2014, Buddecom Reports
Broadband infrastructure sharing policies and strategies in emerging markets April 2015
© 2015 Deloitte LLP. 10
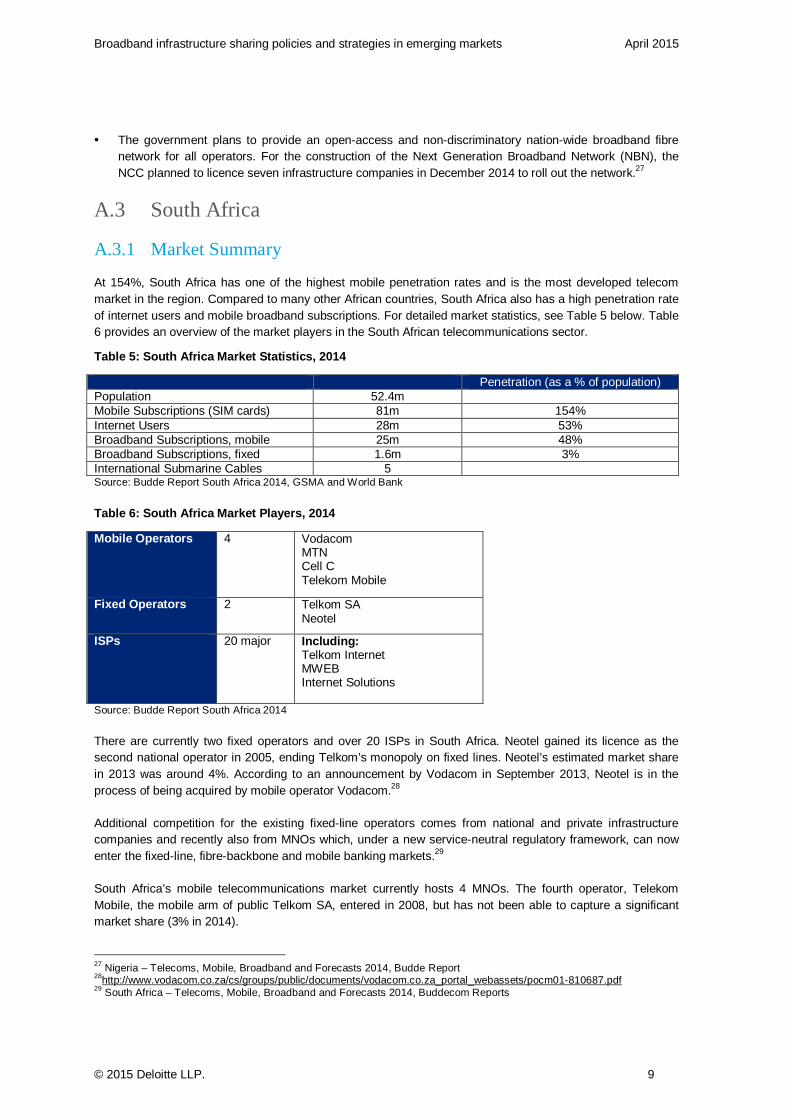
In December 2013 Telkom SA announced it may want to sell Telkom Mobile before it entered talks with MTN about a possible active network sharing deal.30
Figure 4: South Africa Mobile Market Shares 2014
Source: GSMA
A.3.2 Fibre Infrastructure
South Africa’s national fibre backbone network is made up of a combination of fibre routes rolled out by the national telecom operators Telkom SA and Neotel, mobile operators and public and private infrastructure companies.
Public Sector Networks:
• Telkom SA currently has the largest optical fibre network in Africa with over 140,000km of fibre, connecting all major centres. In 2013, Telkom SA announced investment of ZAR 12bn in a next generation broadband network.
• Since 2009, the second national operator Neotel has been spending ZAR 500m a year on infrastructure and by 2013 the Neotel’s fibre optic network was about 15,000km long.
• Broadband InfraCo is an umbrella infrastructure company for all fibre optic backbone networks of state-owned companies Eskom (the national power grid operator) and Transnet (the national rail operator). It operates a national long distance fibre network of about 12,000km. Neotel is the primary user of the network.
Private Sector Networks:
• DarkFibre Africa is a private infrastructure company leasing 8,000km of backbone fibre infrastructure to MNOs and ISPs such as Cell C, Vodacom, MTN, Telkom SA and Internet Solutions.31
• Mobile operators such as MTN and Vodacom entered the fixed-line market and have also been rolling out their own networks. MTN owned 12,000km of fibre in 2014.
• FibreCo, established in 2010, has started to roll out a network in major cities and secondary towns, which is expected to measure 12,000km upon completion.
International Terrestrial Fibre Links:
30 South Africa – Telecoms, Mobile, Broadband and Forecasts 2014, Buddecom Reports 31http://www.dfafrica.co.za/company/
44%
33%
20%
3%
Vodacom
MTN
Cell C
Telekom Mobile
Broadband infrastructure sharing policies and strategies in emerging markets April 2015
© 2015 Deloitte LLP. 11
South Africa hosts landing points to five international submarine fibre optic cables and as such serves as an access point for several of its land-locked neighbours. South Africa has terrestrial fibre links with Botswana, Lesotho, Mozambique, Namibia and Swaziland.
A.3.3 Infrastructure Sharing Regulations
While the sharing of infrastructure in South Africa is allowed, there is no formal coordination of the process by regulatory frameworks. When rolling out fibre, operators have to obtain individual way-leave permissions from the telecom regulator, Road Agency and municipalities.32
A.3.4 Infrastructure Sharing Projects
Tower Companies:
• The first tower sale-and-leaseback deal occurred in 2010 when American Tower Co acquired 1,400 operational towers from Cell C (plus an additional 1,800 under construction).
• MTN also entered talks with American Tower Co in 2012, involving a tower deal for about half of its 6,000 towers. MTN, however, reconsidered its strategy in 2013 and the deal was never completed.33
RAN Sharing:
• In early 2014, MTN and Telkom SA (Telekom Mobile) confirmed talks on a proposed RAN sharing agreement, which would involve MTN taking over the management of the rollout and operation of Telkom’s RAN network. The agreement has not yet been finalised.34
Joint ventures for fibre deployment:
• MTN, Neotel and Vodacom entered a joint venture for the roll-out of a national long-distance fibre network in 2009. The project involved 5,000km of fibre, connecting South Africa’s major centres such as Johannesburg, Cape Town and Durban. The venture was South Africa’s first major co-build agreement and the first time MNOs started rolling out their own infrastructure.35
Fibre Companies:
• A number of private (DarkFibre Africa and FibreCo) and public (Broadband InfraCo) infrastructure companies have been rolling out fibre networks in South Africa, on which they now sell capacity to ISPs and MNOs.
• FibreCo was formed as a joint venture between Cell C, an ISP and an investment firm. The company has operates under an open-access principle and describes itself as a “carrier neutral, national network operator” who is committed to generate economic and environmental benefits through infrastructure sharing.36
32 Understanding What’s Happening in ICT South Africa 33 South Africa – Mobile Market - Overview, Statistics and Forecasts 2014, Buddecom Reports 34http://www.meamonitor.com/industry-trend-analysis-bmi-view-mtn-telkom-network-sharing-agreement-may-2014 35 South Africa – Fixed-line Market and Fibre Infrastructure 2014, Buddecom Reports 36http://fibreco.co.za/About/The-FibreCo-Difference
Broadband infrastructure sharing policies and strategies in emerging markets April 2015
© 2015 Deloitte LLP. 12
A.4 Uganda
A.4.1 Market Summary
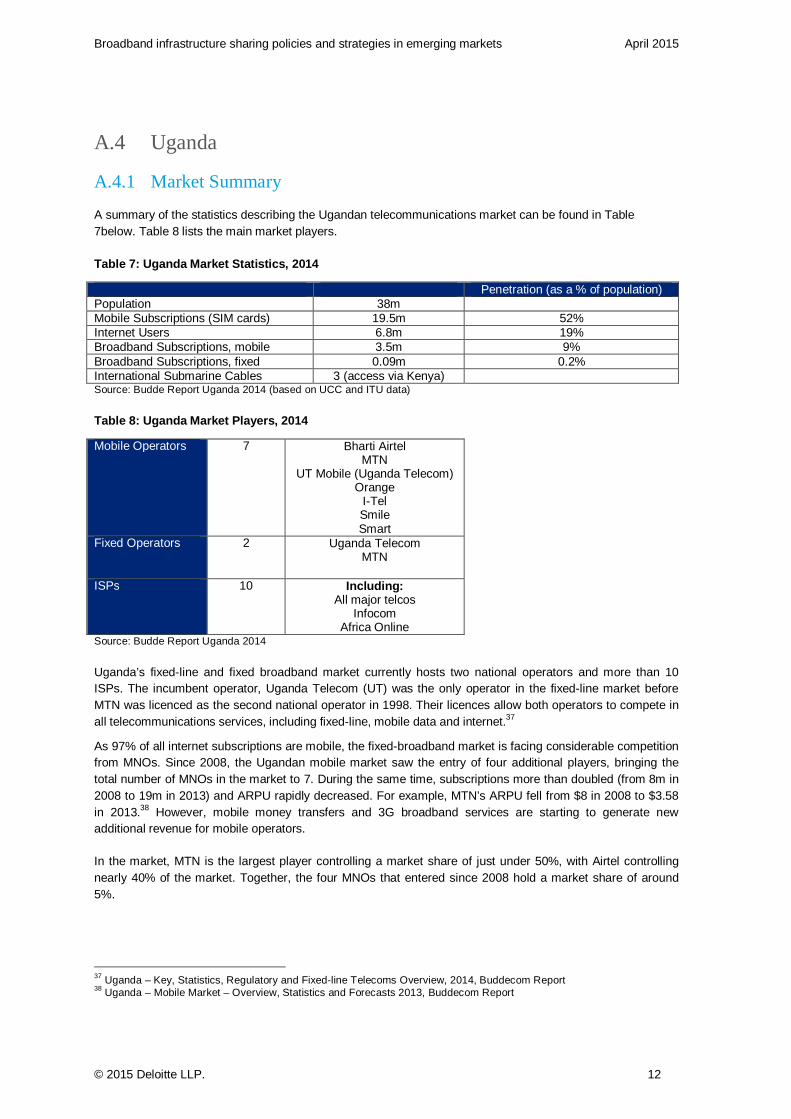
A summary of the statistics describing the Ugandan telecommunications market can be found in Table 7below. Table 8 lists the main market players.
Table 7: Uganda Market Statistics, 2014
Penetration (as a % of population) Population 38m Mobile Subscriptions (SIM cards) 19.5m 52% Internet Users 6.8m 19% Broadband Subscriptions, mobile 3.5m 9% Broadband Subscriptions, fixed 0.09m 0.2% International Submarine Cables 3 (access via Kenya) Source: Budde Report Uganda 2014 (based on UCC and ITU data)
Table 8: Uganda Market Players, 2014
Mobile Operators 7 Bharti Airtel MTN
UT Mobile (Uganda Telecom) Orange
I-Tel Smile Smart
Fixed Operators 2 Uganda Telecom MTN
ISPs 10 Including: All major telcos
Infocom Africa Online
Source: Budde Report Uganda 2014
Uganda’s fixed-line and fixed broadband market currently hosts two national operators and more than 10 ISPs. The incumbent operator, Uganda Telecom (UT) was the only operator in the fixed-line market before MTN was licenced as the second national operator in 1998. Their licences allow both operators to compete in all telecommunications services, including fixed-line, mobile data and internet.37
As 97% of all internet subscriptions are mobile, the fixed-broadband market is facing considerable competition from MNOs. Since 2008, the Ugandan mobile market saw the entry of four additional players, bringing the total number of MNOs in the market to 7. During the same time, subscriptions more than doubled (from 8m in 2008 to 19m in 2013) and ARPU rapidly decreased. For example, MTN’s ARPU fell from $8 in 2008 to $3.58 in 2013.38 However, mobile money transfers and 3G broadband services are starting to generate new additional revenue for mobile operators.
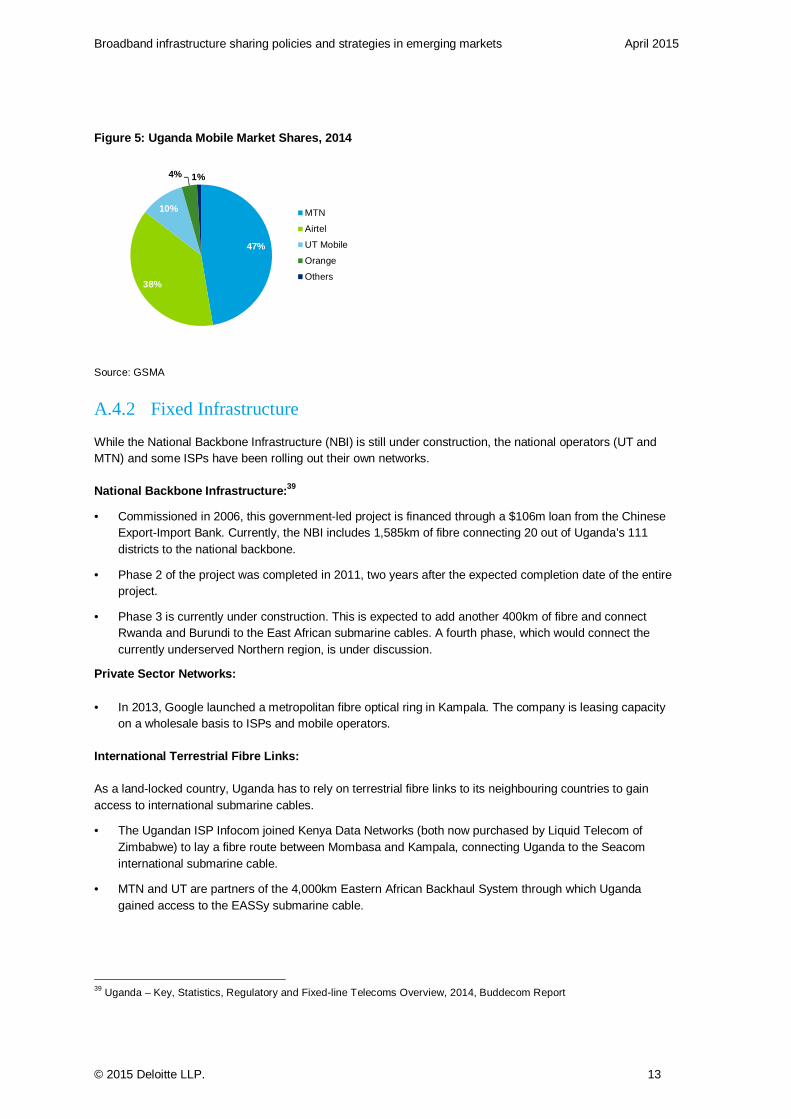
In the market, MTN is the largest player controlling a market share of just under 50%, with Airtel controlling nearly 40% of the market. Together, the four MNOs that entered since 2008 hold a market share of around 5%.
37 Uganda – Key, Statistics, Regulatory and Fixed-line Telecoms Overview, 2014, Buddecom Report 38 Uganda – Mobile Market – Overview, Statistics and Forecasts 2013, Buddecom Report
Broadband infrastructure sharing policies and strategies in emerging markets April 2015
© 2015 Deloitte LLP. 13
Figure 5: Uganda Mobile Market Shares, 2014
Source: GSMA
A.4.2 Fixed Infrastructure
While the National Backbone Infrastructure (NBI) is still under construction, the national operators (UT and MTN) and some ISPs have been rolling out their own networks.
National Backbone Infrastructure: 39
• Commissioned in 2006, this government-led project is financed through a $106m loan from the Chinese Export-Import Bank. Currently, the NBI includes 1,585km of fibre connecting 20 out of Uganda’s 111 districts to the national backbone.
• Phase 2 of the project was completed in 2011, two years after the expected completion date of the entire project.
• Phase 3 is currently under construction. This is expected to add another 400km of fibre and connect Rwanda and Burundi to the East African submarine cables. A fourth phase, which would connect the currently underserved Northern region, is under discussion.
Private Sector Networks:
• In 2013, Google launched a metropolitan fibre optical ring in Kampala. The company is leasing capacity on a wholesale basis to ISPs and mobile operators.
International Terrestrial Fibre Links:
As a land-locked country, Uganda has to rely on terrestrial fibre links to its neighbouring countries to gain access to international submarine cables.
• The Ugandan ISP Infocom joined Kenya Data Networks (both now purchased by Liquid Telecom of Zimbabwe) to lay a fibre route between Mombasa and Kampala, connecting Uganda to the Seacom international submarine cable.
• MTN and UT are partners of the 4,000km Eastern African Backhaul System through which Uganda gained access to the EASSy submarine cable.
39 Uganda – Key, Statistics, Regulatory and Fixed-line Telecoms Overview, 2014, Buddecom Report
47%
38%
10%
4% 1%
MTN
Airtel
UT Mobile
Orange
Others
Broadband infrastructure sharing policies and strategies in emerging markets April 2015
© 2015 Deloitte LLP. 14
A.4.3 Infrastructure Sharing Regulations
Infrastructure sharing is permitted by the telecom regulator, the Uganda Communications Commission (UCC). The Public Infrastructure Provider License (PIP) permits its holder to build, operate and maintain infrastructure for the provision of telecommunications services. It further allows the holder to offer its infrastructure commercially to other operators (Public Service Providers).40
However, there are no explicit guidelines on infrastructure sharing, yet. The UCC announced that in 2014 it will implement guidelines, which will require operators to share passive infrastructure such as ducts and masts. While not mandated, the guidelines will also permit the sharing of active infrastructure.41
A.4.4 Infrastructure Sharing Projects
Consortia:
• In 2009, MTN, Zain, UTL and Warid formed a consortium to share costs in connecting their sites to the electricity grid. One of the main problems for operators rolling out networks in rural Uganda is the lack of access to electricity.
Tower companies: 42
• In 2011, a joint venture between MTN and American Tower established ATC Uganda. American Tower paid $89m to acquire a stake of 51% in the new company, which now manages MTN’s portfolio of 1,000 towers.
• In 2012, there were sale-and-leaseback deals between Eaton Towers and Orange as well as Eaton Towers and Warid (later acquired by Bharti Airtel). The deals involved the outsourcing of management and maintenance of the MNO’s portfolios of 300 and 400 towers, respectively.
A.5 Côte d’Ivoire43
A.5.1 Market Summary
Mobile penetration in Côte d’Ivoire stands at 91%, well above the African average of 74%. Mobile broadband subscriptions, which are still at a relatively low level, have been increasing exponentially since the first 3G licence was awarded in 2012. They have more than tripled in the past year (from 250,000 in Q2 2013 to 800,000 in Q2 2014).44 Table 9 below summarises Côte d’Ivoire’s market statistics, while Table 10lists the main fixed and mobile market players.
40http://www.ucc.co.ug/data/smenu/88/Licensing-Overview.html 41http://www.towerxchange.com/regulations-to-support-infrastructure-sharing/ 42http://www.towerxchange.com/the-current-state-of-the-african-infrastructure-sharing-market/ 43 Source unless noted otherwise: Côte d’Ivoire – Telecoms, Mobile and Broadband – Market Insights, Statistics and
Forecasts 2014, Buddecom Reports 44 GSMA Market Data Côte d’Ivoire
Broadband infrastructure sharing policies and strategies in emerging markets April 2015
© 2015 Deloitte LLP. 15
Table 9: Côte d’Ivoire MarketStatistics, 2014
Penetration (as a % of population) Population 23.4m Mobile Subscriptions (SIM cards) 21.3m 91% Internet Users 1m 4.2% Broadband Subscriptions, mobile 0.8m 3.4% Broadband Subscriptions, fixed 0.07m 0.2% International Submarine Cables 3 Source: Buddecom Report Côte d’Ivoire 2014, GSMA, World Bank
Table 10: Côte d’Ivoire MarketPlayers, 2014
Mobile Operators 6 MTN Orange (CI-Telecom)
Moov koZ
GreenN Café Mobile
Fixed Operators 2 CI –Telecom Arobase Telecom (MTN)
ISPs 23 Including: AfNet (MTN)
Aviso (CI-Telecom) Others
Source: Budde Report Côte d’Ivoire
CI-Telecom is the incumbent national operator of the fixed-line market. The country also has a second national operator, Arobase Telecom (MTN).
France Telecom (now Orange S.A.),which is the parent company of CI-Telecom and the mobile arm Orange, controls all three international submarine cable landing stations in Côte d’Ivoire. CI-Telecom also controls about 96% of the fixed-line voice market.
Arobase obtained its licence for national and international communication services in 2000. In 2006, MTN took over ownership of the company and with its existing GSM licence the group became the country’s second national operator.
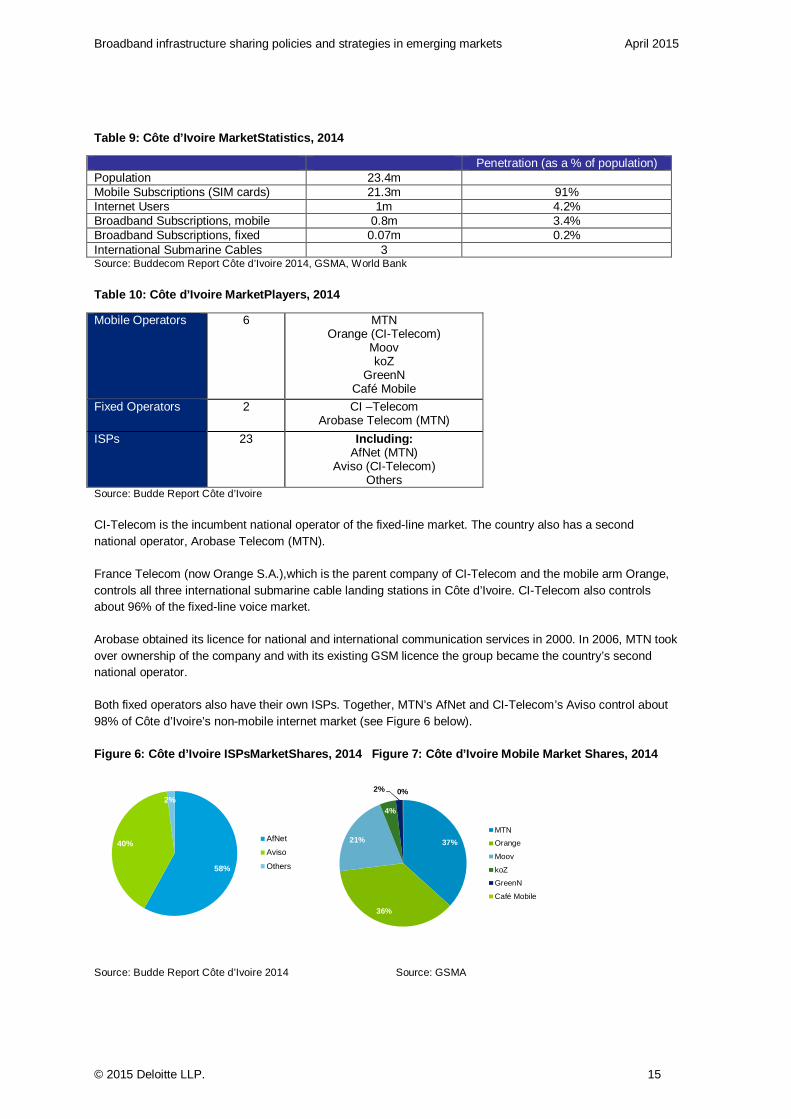
Both fixed operators also have their own ISPs. Together, MTN’s AfNet and CI-Telecom’s Aviso control about 98% of Côte d’Ivoire’s non-mobile internet market (see Figure 6 below).
Figure 6: Côte d’Ivoire ISPsMarketShares, 2014 Fi gure 7: Côte d’Ivoire Mobile Market Shares, 2014
Source: Budde Report Côte d’Ivoire 2014 Source: GSMA
58%
40%
2%
AfNet
Aviso
Others
37%
36%
21%
4%
2% 0%
MTN
Orange
Moov
koZ
GreenN
Café Mobile
Broadband infrastructure sharing policies and strategies in emerging markets April 2015
© 2015 Deloitte LLP. 16
The mobile phone sector in Côte d’Ivoire has undergone much liberalisation in recent years and is now hosting six mobile network operators (MNOs). Combined, the three largest players, MTN, Orange and Moov, have 94% of the market share, as shown in Figure 6 above.
A.5.2 Fibre Infrastructure
Three fibre networks are currently being rolled out in the country:
National Fibre Optical Backbone:
• Construction on a state-owned fibre optical backbone began in 2012. It is financed with the help of the National Telecommunications Fund (the national USF) which is financed through taxes paid by operators in order to expand services to rural areas. A total of 6,700km of fibre are being deployed with the expectation to connect up to 30% of the country’s population to the Internet within the next 5 years.45
Public Sector Networks:
• The national operator CI-Telecom has deployed 20,000km of fibre optic cables and 3,700km of radio relay links.
Private Sector Networks:
• According to local market analysts, mobile network operators such as MTN and Orange have also been rolling out their own terrestrial fibre links.
International Terrestrial Fibre Links:
As a landing point for three international submarine fibre cables, Côte d’Ivoire has several terrestrial fibre links with its neighbouring countries. Togo, Mali and Burkina Faso both have access to the SAT-3/WASC landing station via a terrestrial fibre link with Côte d’Ivoire.
A.5.3 Infrastructure Sharing Regulations
While passive infrastructure sharing is implicitly allowed by the telecommunications regulator in Côte d’Ivoire, there are currently no explicit regulations or guidelines. However, according to a local market expert, the Autorité de Régulation des telecommunications/TIC de Côte d’Ivoire (ARTCI) is currently in the process of developing legislation aimed to encourage infrastructure sharing.
A.5.4 Infrastructure Sharing Projects
Infrastructure sharing is occurring on mobile networks, while limited information was available on sharing in fibre networks.
Tower companies:
• SWAP was the first tower company to start operations in Côte d’Ivoire in 2010. Although some mobile operators are among SWAP’s clients, the company only owns a limited number of towers in the country.46
45http://www.reuters.com/article/2013/07/20/ivorycoast-telecoms-idUSL6N0FP2EQ20130720 46http://www.towerxchange.com/cote-divoire-market-dynamics-good-for-tower-sharing/

Broadband infrastructure sharing policies and strategies in emerging markets April 2015
© 2015 Deloitte LLP. 17
• In 2012, IHS acquired 931 towers from MTN which it will lease back to the operator. IHS will provide full management services for these towers and they will be available to be shared with other operators.47
• Orange also entered a deal with IHS Africa in 2013. The deal involved 2,000 of Orange’s towers in Côte d’Ivoire and Cameroon. However, unlike MTN, Orange did not sell its towers to IHS but merely signed over their operation to the tower company.48
A.6 Mozambique49
A.6.1 Market Summary
Mobile penetration in Mozambique stands at 48%, marginally below African average. Further statistics of the telecom market in Mozambique can be found in Table 11 below. Table 12 summarises the main market players.
Table 11: Mozambique Market Statistics, 2014
Penetration (as a % of population) Population 26.2m Mobile Subscriptions (SIM cards) 12.7m 48% Internet Users 1.7m 6.5% Broadband Subscriptions, mobile 1.4m 5.3% Broadband Subscriptions, fixed 0.02m <0.1% International Submarine Cables 2
Source: Budde Report Mozambique 2013, World Bank, GSMA
Table 12: Mozambique Market Players, 2014
Mobile Operators 3 mCel Vodacom Movitel
Fixed Operators 1 Telecomunições de Moçambique (TDM)
ISPs 18 Including: TDM/Teledata
NetCabo Intra
Source: Budde Report Mozambique 2013
The state-owned company, Telecomunições de Moçambique (TDM), started operations in 1992 and is the only operator in the country’s fixed-line market. The number of fixed lines in service peaked in 2001 and has been declining ever since. While in 2008 the government announced plan to award a second fixed licence, as of today TDM remains the sole player.
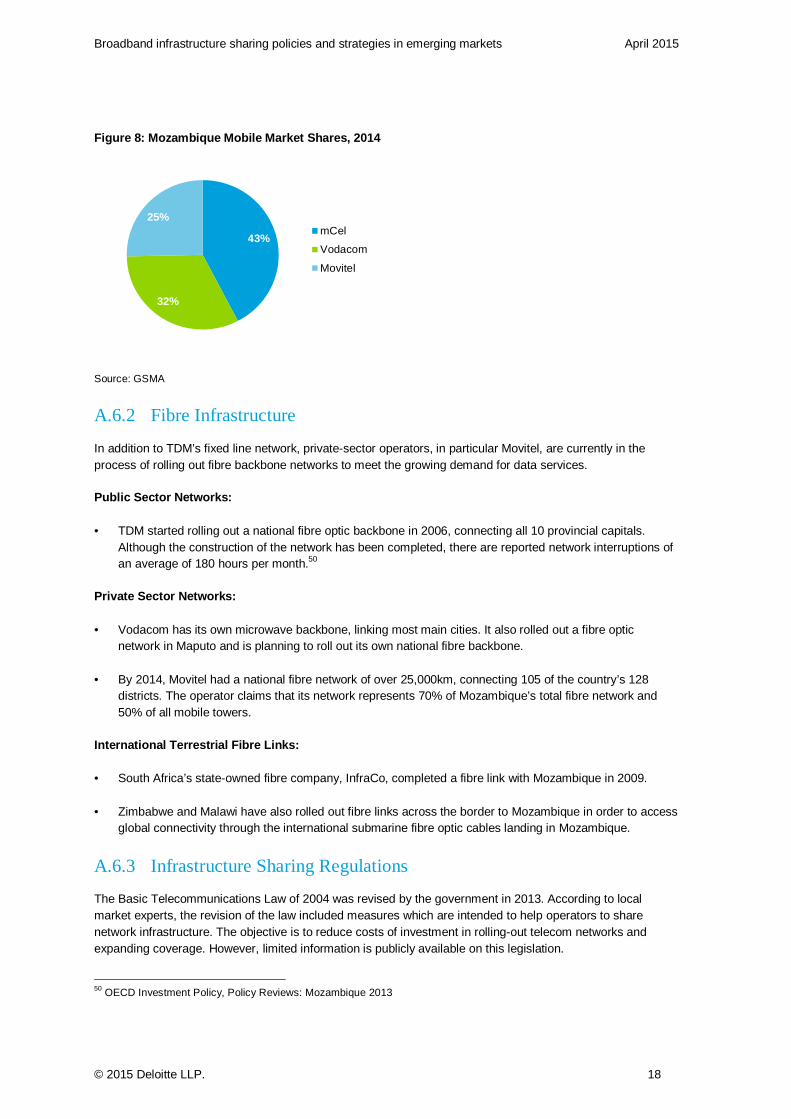
Three mobile operators are active in Mozambique. mCel, the mobile subsidiary of TDM, remains the largest player in the market with a market share of 43%.The entry of Vodacom in 2003 first introduced competition into the market while the third operator Movitel (Viettel) entered the market in 2012 and has since managed to capture a market share of 25%.
47https://www.mtn.com/PressOffice/in-the-media/Pages/FullContent.aspx?pid=176 48http://www.orange.com/en/press/press-releases/press-releases-2013/Orange-and-IHS-sign-tower-leasing-agreement-to-
improve-mobile-networks-in-Cote-d-Ivoire-and-Cameroon 49 Source unless noted otherwise: Mozambique- Telecoms, Mobile and Broadband – Market Insights, Statistics and
Forecasts 2013, BuddeCom Reports
Broadband infrastructure sharing policies and strategies in emerging markets April 2015
© 2015 Deloitte LLP. 18
Figure 8: Mozambique Mobile Market Shares, 2014
Source: GSMA
A.6.2 Fibre Infrastructure
In addition to TDM’s fixed line network, private-sector operators, in particular Movitel, are currently in the process of rolling out fibre backbone networks to meet the growing demand for data services.
Public Sector Networks:
• TDM started rolling out a national fibre optic backbone in 2006, connecting all 10 provincial capitals. Although the construction of the network has been completed, there are reported network interruptions of an average of 180 hours per month.50
Private Sector Networks:
• Vodacom has its own microwave backbone, linking most main cities. It also rolled out a fibre optic network in Maputo and is planning to roll out its own national fibre backbone.
• By 2014, Movitel had a national fibre network of over 25,000km, connecting 105 of the country’s 128 districts. The operator claims that its network represents 70% of Mozambique’s total fibre network and 50% of all mobile towers.
International Terrestrial Fibre Links:
• South Africa’s state-owned fibre company, InfraCo, completed a fibre link with Mozambique in 2009.
• Zimbabwe and Malawi have also rolled out fibre links across the border to Mozambique in order to access global connectivity through the international submarine fibre optic cables landing in Mozambique.
A.6.3 Infrastructure Sharing Regulations
The Basic Telecommunications Law of 2004 was revised by the government in 2013. According to local market experts, the revision of the law included measures which are intended to help operators to share network infrastructure. The objective is to reduce costs of investment in rolling-out telecom networks and expanding coverage. However, limited information is publicly available on this legislation.
50 OECD Investment Policy, Policy Reviews: Mozambique 2013
43%
32%
25%mCel
Vodacom
Movitel
Broadband infrastructure sharing policies and strategies in emerging markets April 2015
© 2015 Deloitte LLP. 19
While this suggests that regulatory agency of Mozambique, the InstitutoNaçional das Comunicações de Moçambique (INCM), encourages network operators to share telecommunication infrastructure, the details of these policies are not clear.
A.7 India
A.7.1 Market Summary51
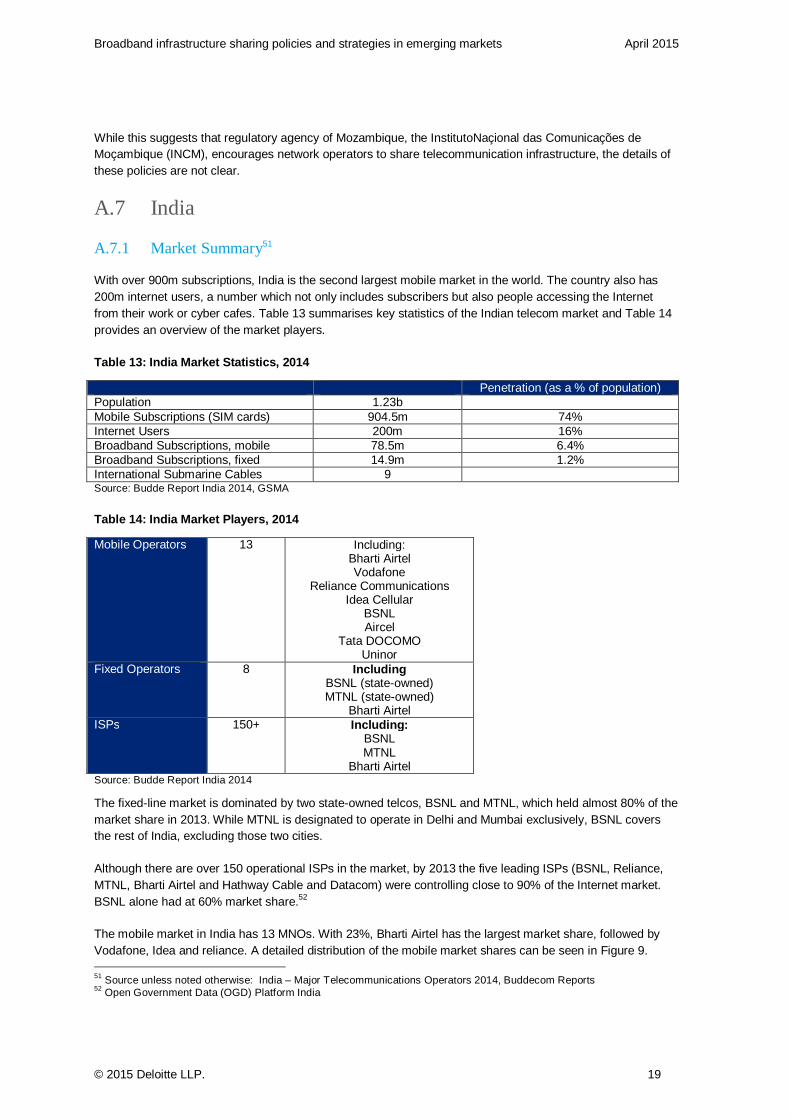
With over 900m subscriptions, India is the second largest mobile market in the world. The country also has 200m internet users, a number which not only includes subscribers but also people accessing the Internet from their work or cyber cafes. Table 13 summarises key statistics of the Indian telecom market and Table 14 provides an overview of the market players.
Table 13: India Market Statistics, 2014
Penetration (as a % of population) Population 1.23b Mobile Subscriptions (SIM cards) 904.5m 74% Internet Users 200m 16% Broadband Subscriptions, mobile 78.5m 6.4% Broadband Subscriptions, fixed 14.9m 1.2% International Submarine Cables 9 Source: Budde Report India 2014, GSMA
Table 14: India Market Players, 2014
Mobile Operators 13 Including: Bharti Airtel Vodafone
Reliance Communications Idea Cellular
BSNL Aircel
Tata DOCOMO Uninor
Fixed Operators 8 Including BSNL (state-owned) MTNL (state-owned)
Bharti Airtel ISPs 150+ Including:
BSNL MTNL
Bharti Airtel Source: Budde Report India 2014
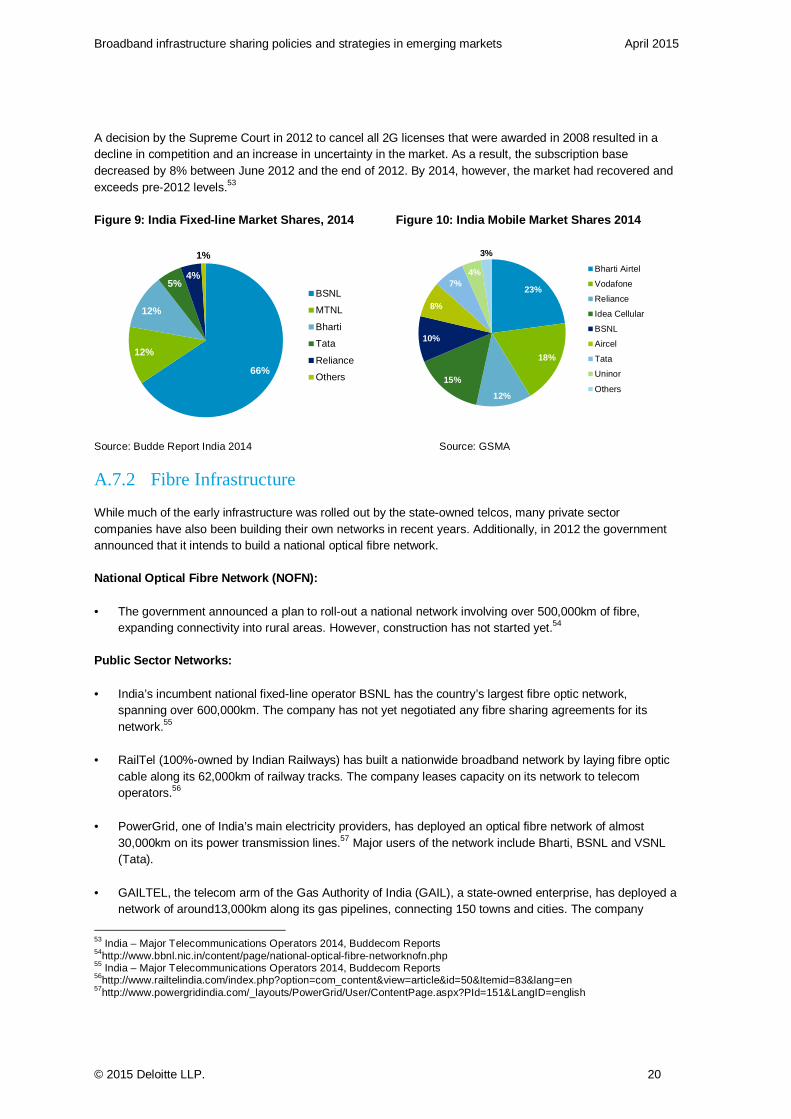
The fixed-line market is dominated by two state-owned telcos, BSNL and MTNL, which held almost 80% of the market share in 2013. While MTNL is designated to operate in Delhi and Mumbai exclusively, BSNL covers the rest of India, excluding those two cities.
Although there are over 150 operational ISPs in the market, by 2013 the five leading ISPs (BSNL, Reliance, MTNL, Bharti Airtel and Hathway Cable and Datacom) were controlling close to 90% of the Internet market. BSNL alone had at 60% market share.52
The mobile market in India has 13 MNOs. With 23%, Bharti Airtel has the largest market share, followed by Vodafone, Idea and reliance. A detailed distribution of the mobile market shares can be seen in Figure 9. 51 Source unless noted otherwise: India – Major Telecommunications Operators 2014, Buddecom Reports 52 Open Government Data (OGD) Platform India
Broadband infrastructure sharing policies and strategies in emerging markets April 2015
© 2015 Deloitte LLP. 20
A decision by the Supreme Court in 2012 to cancel all 2G licenses that were awarded in 2008 resulted in a decline in competition and an increase in uncertainty in the market. As a result, the subscription base decreased by 8% between June 2012 and the end of 2012. By 2014, however, the market had recovered and exceeds pre-2012 levels.53
Figure 9: India Fixed-line Market Shares, 2014 Fig ure 10: India Mobile Market Shares 2014
Source: Budde Report India 2014 Source: GSMA
A.7.2 Fibre Infrastructure
While much of the early infrastructure was rolled out by the state-owned telcos, many private sector companies have also been building their own networks in recent years. Additionally, in 2012 the government announced that it intends to build a national optical fibre network.
National Optical Fibre Network (NOFN):
• The government announced a plan to roll-out a national network involving over 500,000km of fibre, expanding connectivity into rural areas. However, construction has not started yet.54
Public Sector Networks:
• India’s incumbent national fixed-line operator BSNL has the country’s largest fibre optic network, spanning over 600,000km. The company has not yet negotiated any fibre sharing agreements for its network.55
• RailTel (100%-owned by Indian Railways) has built a nationwide broadband network by laying fibre optic cable along its 62,000km of railway tracks. The company leases capacity on its network to telecom operators.56
• PowerGrid, one of India’s main electricity providers, has deployed an optical fibre network of almost 30,000km on its power transmission lines.57 Major users of the network include Bharti, BSNL and VSNL (Tata).
• GAILTEL, the telecom arm of the Gas Authority of India (GAIL), a state-owned enterprise, has deployed a network of around13,000km along its gas pipelines, connecting 150 towns and cities. The company
53 India – Major Telecommunications Operators 2014, Buddecom Reports 54http://www.bbnl.nic.in/content/page/national-optical-fibre-networknofn.php 55 India – Major Telecommunications Operators 2014, Buddecom Reports 56http://www.railtelindia.com/index.php?option=com_content&view=article&id=50&Itemid=83&lang=en 57http://www.powergridindia.com/_layouts/PowerGrid/User/ContentPage.aspx?PId=151&LangID=english
66%
12%
12%
5%4%
1%
BSNL
MTNL
Bharti
Tata
Reliance
Others
23%
18%
12%
15%
10%
8%
7%4%
3%
Bharti Airtel
Vodafone
Reliance
Idea Cellular
BSNL
Aircel
Tata
Uninor
Others
Broadband infrastructure sharing policies and strategies in emerging markets April 2015
© 2015 Deloitte LLP. 21
leases dark fibre and duct space to telecom operators such as Vodafone, VSNL (Tata), Bharti Airtel and Idea Cellular.58
Private Sector Networks:
• Reliance Infocomm rolled out a fibre optic infrastructure, covering more than 110,000km and over 2,500 cities and towns.59
• Other operators such as Bharti Airtel and Tata Teleservices have also been rolling out their own fibre optic networks, which reach most of the country’s major cities.
International Terrestrial Fibre Links:
While India’s main international cable connections are via submarine cables, the country has also established some terrestrial fibre links with its neighbours.
• In July 2013, Bharti Airtel established a terrestrial fibre link with Bangladesh, providing an alternative international connection for Bangladesh, which currently only has access to one international submarine cable.60
• While VSNL has installed a terrestrial cable link with Pakistan as early as 2006, continuous tensions in the region have prevented it from going live so far.61
A.7.3 Infrastructure Sharing Regulations
A.7.3.1 Before 2008
Infrastructure Provider, Category I: Since 2000 private companies could be registered as Infrastructure Provider, Category I (IP-I) and as such could provide passive infrastructure such as dark fibre, rights of way, duct space and towers on agreed commercial terms and conditions. This encouraged a new business model, enabling the operation of tower companies and fibre businesses. Currently, there are close to 450 Infrastructure Providers in India.62
Unified Access Service Licences (UASL): India implemented a unified licencing regime covering both, fixed and mobile operators in 2003. According to clause 33 of the Unified Access Service Licence, all licenced operators are allowed to share passive network infrastructure.63 This includes infrastructures such as buildings, towers and dark fibre.64
A.7.3.2 After 2008
Although permitted through the licences, only about 25% of all sites were shared in 2007.65 As a result of the high growth levels that the telecom sector was experiencing, the Telecom Regulatory Authority of India (TRAI) introduced advanced sharing provisions in 2008, which introduced active sharing and provided financial
58http://www.gailonline.com/ 59 India – Major Telecommunications Operators 2014, Buddecom Reports 60http://www.telegeography.com/products/commsupdate/articles/2013/07/23/bharti-airtels-india-bangladesh-fibre-link-goes-
live/ 61 India – Telecommunications Infrastructure and Forecasts 2014, Buddecom Report 62http://www.dot.gov.in/carrier-services/infrastructure-provider 63http://cis-india.org/telecom/resources/govt-policy-and-guidelines 64 License Agreement for Provision of Unified Access Services 65 Recommendations on Infrastructure Sharing – TRAI India 2007
Broadband infrastructure sharing policies and strategies in emerging markets April 2015
© 2015 Deloitte LLP. 22
incentives for sharing. The overall goals of the guidelines included a reduction of input costs for telecom access providers, facilitating reduced tariffs and increasing teledensity in rural areas. The main provisions made by the guidelines are the following:66
• Service Providers may share passive infrastructure in accordance with the existing provisions in the licenses of UASL.
• Active Infrastructure Sharing is permitted in relation to antennas, feeder cables, node Bs, and RAN and transmission systems.
• Sharing of allocated spectrum is not permitted.
The guidelines also introduce financial incentives for infrastructure sharing: in urban areas, state governments have to charge the same amount for setting up shared towers (irrespective of the number of service providers sharing) as for unshared towers. In rural areas, subsidies are provided for Service Providers or Infrastructure Providers who set up sites (towers) for sharing.
A.7.4 Infrastructure Sharing Projects
Due to a favourable regulatory environment, which allowed private companies to offer passive infrastructure for sharing on commercial terms as early as 2000, India has successfully seen many projects that involved the sharing of passive infrastructure such as towers and fibre networks.
Tower companies:
With 365,000 towers in 2012 and a tenancy ratio of 2.4 (meaning on average each tower hosts the equipment of 2.4 operators) India hosts one the world’s largest tower sharing markets. Since the policy change initiated by the TRAI in 2007, there has been an increased number in sharing agreements:67
• Merging their tower assets in 2007, India’s three leading MNOs, Bharti Airtel, Vodafone and Idea Cellular, formed a joint venture to create an independent tower company. Indus Tower offers its portfolio of over 100,000 shared towers on a non-discriminatory basis to other telecom operators.68
• After the separation of the tower assets owned by Reliance Communications in 2007, Reliance Infratel operates as an independent tower company with a portfolio of over 50,000 towers. The company holds an IP-I license and is the only tower company in India not created through mergers and acquisitions.69
66http://pib.nic.in/newsite/erelease.aspx?relid=37053 67 The Rise of the Tower Business – AT Kearney 68 India – Telecommunications Infrastructure and Forecasts 2014, Buddecom Reports 69http://www.rcom.co.in/Rcom/aboutus/overview/overview_infra.html
Broadband infrastructure sharing policies and strategies in emerging markets April 2015
© 2015 Deloitte LLP. 23
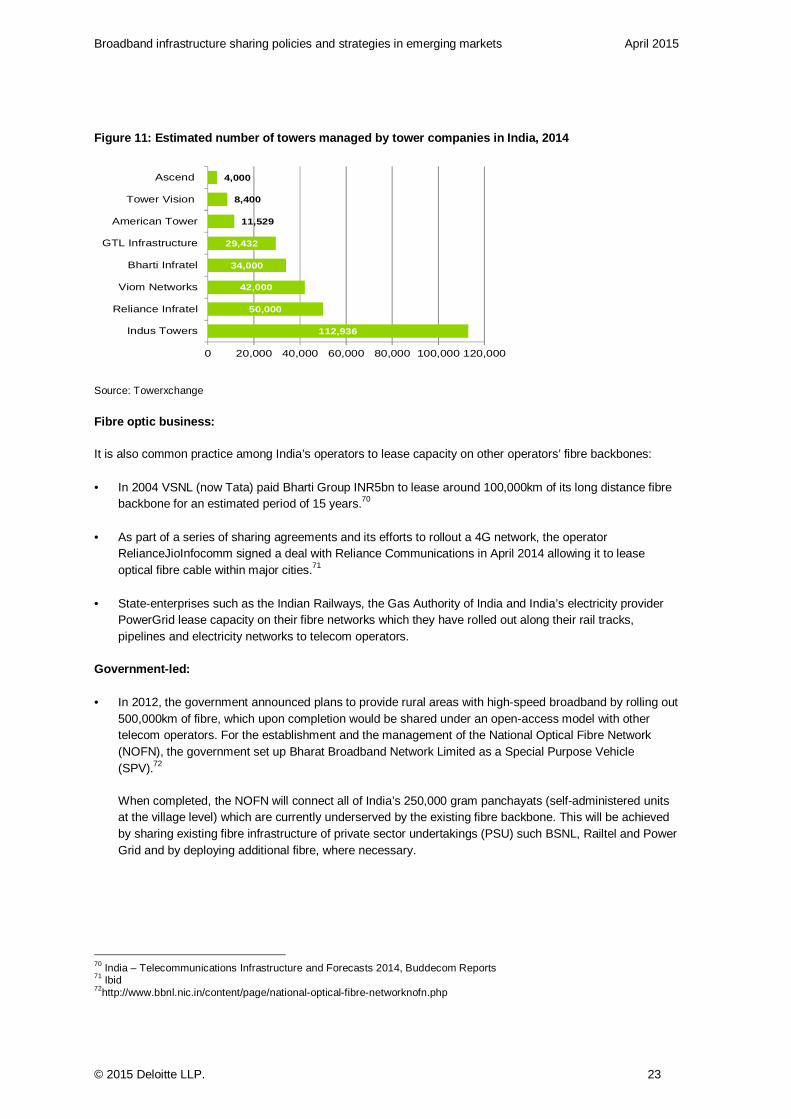
Figure 11: Estimated number of towers managed by to wer companies in India, 2014
Source: Towerxchange
Fibre optic business:
It is also common practice among India’s operators to lease capacity on other operators’ fibre backbones:
• In 2004 VSNL (now Tata) paid Bharti Group INR5bn to lease around 100,000km of its long distance fibre backbone for an estimated period of 15 years.70
• As part of a series of sharing agreements and its efforts to rollout a 4G network, the operator RelianceJioInfocomm signed a deal with Reliance Communications in April 2014 allowing it to lease optical fibre cable within major cities.71
• State-enterprises such as the Indian Railways, the Gas Authority of India and India’s electricity provider PowerGrid lease capacity on their fibre networks which they have rolled out along their rail tracks, pipelines and electricity networks to telecom operators.
Government-led:
• In 2012, the government announced plans to provide rural areas with high-speed broadband by rolling out 500,000km of fibre, which upon completion would be shared under an open-access model with other telecom operators. For the establishment and the management of the National Optical Fibre Network (NOFN), the government set up Bharat Broadband Network Limited as a Special Purpose Vehicle (SPV).72
When completed, the NOFN will connect all of India’s 250,000 gram panchayats (self-administered units at the village level) which are currently underserved by the existing fibre backbone. This will be achieved by sharing existing fibre infrastructure of private sector undertakings (PSU) such BSNL, Railtel and Power Grid and by deploying additional fibre, where necessary.
70 India – Telecommunications Infrastructure and Forecasts 2014, Buddecom Reports 71 Ibid 72http://www.bbnl.nic.in/content/page/national-optical-fibre-networknofn.php
112,936
50,000
42,000
34,000
29,432
11,529
8,400
4,000
0 20,000 40,000 60,000 80,000 100,000 120,000
Indus Towers
Reliance Infratel
Viom Networks
Bharti Infratel
GTL Infrastructure
American Tower
Tower Vision
Ascend
Broadband infrastructure sharing policies and strategies in emerging markets April 2015
© 2015 Deloitte LLP. 24
A.8 Indonesia73
A.8.1 Market Summary
Indonesia is one of the largest telecommunication markets in the world having surpassed the 300m mobile subscription mark in 2014. Additional statistics on the market can be found in Table 15.
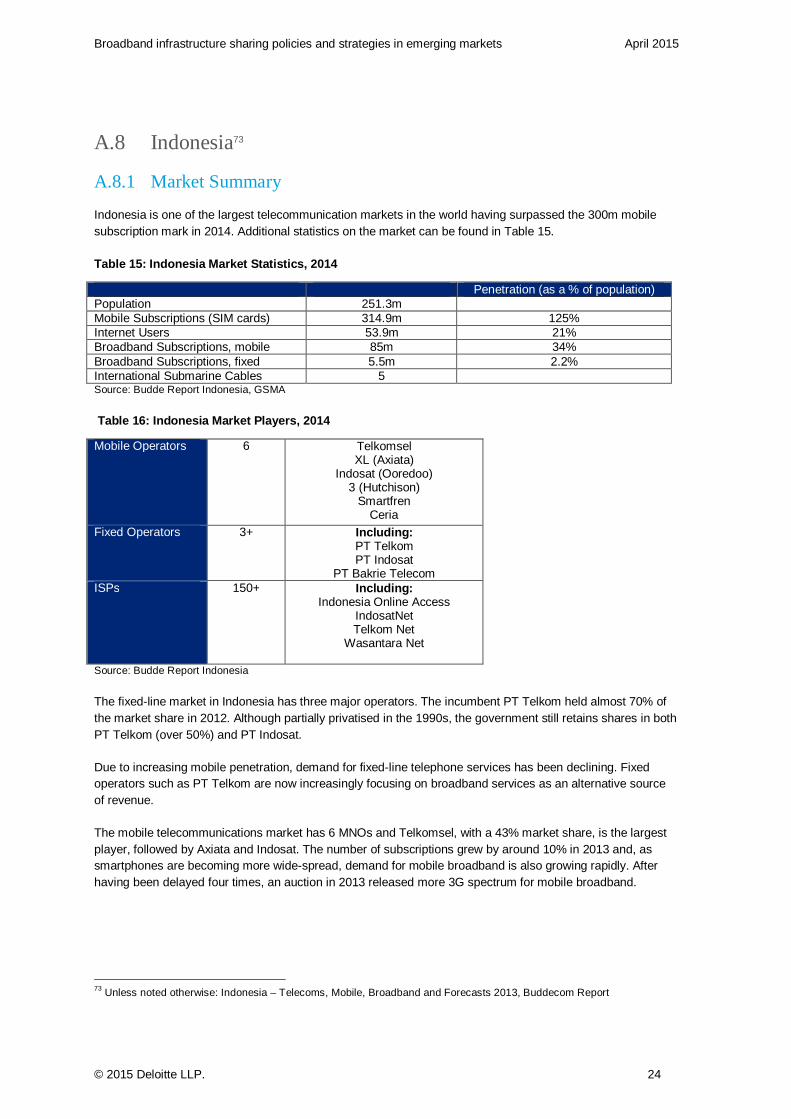
Table 15: Indonesia Market Statistics, 2014
Penetration (as a % of population) Population 251.3m Mobile Subscriptions (SIM cards) 314.9m 125% Internet Users 53.9m 21% Broadband Subscriptions, mobile 85m 34% Broadband Subscriptions, fixed 5.5m 2.2% International Submarine Cables 5 Source: Budde Report Indonesia, GSMA
Table 16: Indonesia Market Players, 2014
Mobile Operators 6 Telkomsel XL (Axiata)
Indosat (Ooredoo) 3 (Hutchison)
Smartfren Ceria
Fixed Operators 3+ Including: PT Telkom PT Indosat
PT Bakrie Telecom ISPs 150+ Including:
Indonesia Online Access IndosatNet Telkom Net
Wasantara Net
Source: Budde Report Indonesia
The fixed-line market in Indonesia has three major operators. The incumbent PT Telkom held almost 70% of the market share in 2012. Although partially privatised in the 1990s, the government still retains shares in both PT Telkom (over 50%) and PT Indosat.
Due to increasing mobile penetration, demand for fixed-line telephone services has been declining. Fixed operators such as PT Telkom are now increasingly focusing on broadband services as an alternative source of revenue.
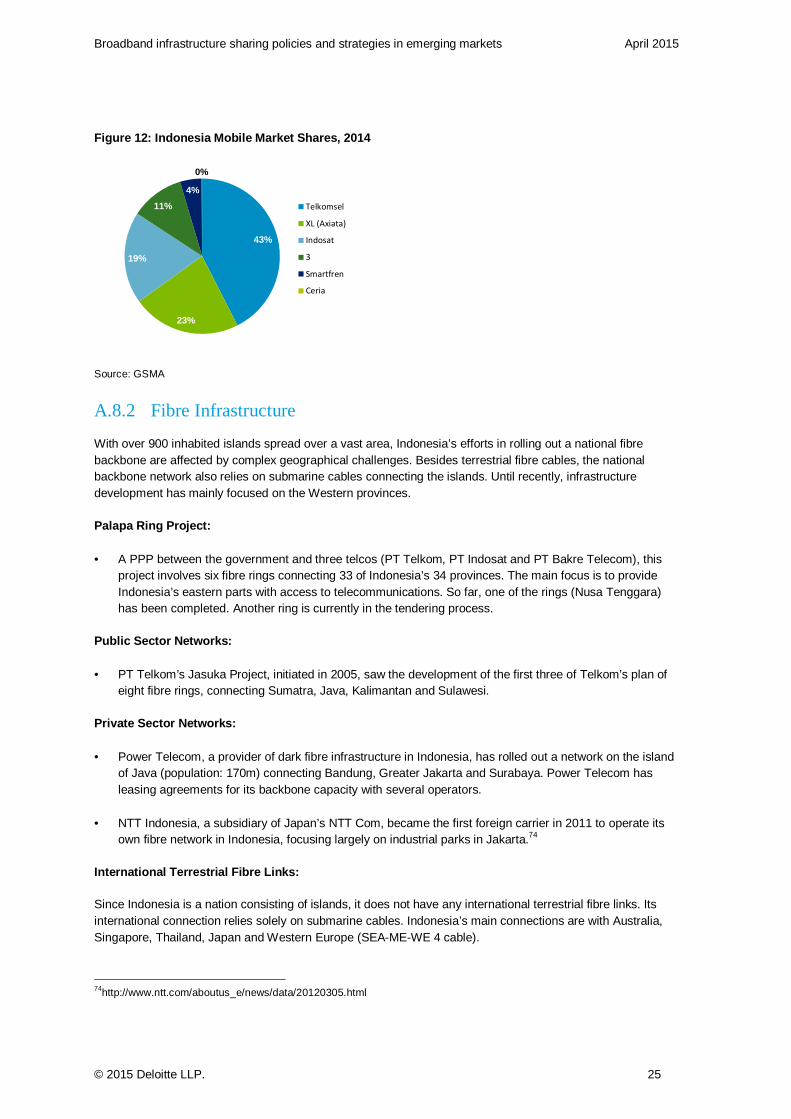
The mobile telecommunications market has 6 MNOs and Telkomsel, with a 43% market share, is the largest player, followed by Axiata and Indosat. The number of subscriptions grew by around 10% in 2013 and, as smartphones are becoming more wide-spread, demand for mobile broadband is also growing rapidly. After having been delayed four times, an auction in 2013 released more 3G spectrum for mobile broadband.
73 Unless noted otherwise: Indonesia – Telecoms, Mobile, Broadband and Forecasts 2013, Buddecom Report
Broadband infrastructure sharing policies and strategies in emerging markets April 2015
© 2015 Deloitte LLP. 25
Figure 12: Indonesia Mobile Market Shares, 2014
Source: GSMA
A.8.2 Fibre Infrastructure
With over 900 inhabited islands spread over a vast area, Indonesia’s efforts in rolling out a national fibre backbone are affected by complex geographical challenges. Besides terrestrial fibre cables, the national backbone network also relies on submarine cables connecting the islands. Until recently, infrastructure development has mainly focused on the Western provinces.
Palapa Ring Project:
• A PPP between the government and three telcos (PT Telkom, PT Indosat and PT Bakre Telecom), this project involves six fibre rings connecting 33 of Indonesia’s 34 provinces. The main focus is to provide Indonesia’s eastern parts with access to telecommunications. So far, one of the rings (Nusa Tenggara) has been completed. Another ring is currently in the tendering process.
Public Sector Networks:
• PT Telkom’s Jasuka Project, initiated in 2005, saw the development of the first three of Telkom’s plan of eight fibre rings, connecting Sumatra, Java, Kalimantan and Sulawesi.
Private Sector Networks:
• Power Telecom, a provider of dark fibre infrastructure in Indonesia, has rolled out a network on the island of Java (population: 170m) connecting Bandung, Greater Jakarta and Surabaya. Power Telecom has leasing agreements for its backbone capacity with several operators.
• NTT Indonesia, a subsidiary of Japan’s NTT Com, became the first foreign carrier in 2011 to operate its own fibre network in Indonesia, focusing largely on industrial parks in Jakarta.74
International Terrestrial Fibre Links:
Since Indonesia is a nation consisting of islands, it does not have any international terrestrial fibre links. Its international connection relies solely on submarine cables. Indonesia’s main connections are with Australia, Singapore, Thailand, Japan and Western Europe (SEA-ME-WE 4 cable).
74http://www.ntt.com/aboutus_e/news/data/20120305.html
43%
23%
19%
11%
4%
0%
Telkomsel
XL (Axiata)
Indosat
3
Smartfren
Ceria
Broadband infrastructure sharing policies and strategies in emerging markets April 2015
© 2015 Deloitte LLP. 26
A.8.3 Infrastructure Sharing Regulations75
In Indonesia, the sharing of passive infrastructure, in particular the joint usage of towers, is permitted and encouraged by the regulator. In 2008, the Minister of Communication and Information Technology issued a “Guide for the Construction and Usage of Joint Tower of Telecommunication”, whereby it suggests an open access principle for shared networks.
Furthermore, the guidelines attempt to protect competition by enforcing a “legal provision regarding the prohibition of monopoly practice and unhealthy business competition. “Hence, tower operators must provide transparent information on the availability of the capacity of their towers to potential tenants and tenancies must be awarded on a first come first serve basis.
The sharing of active network infrastructure and particularly RAN sharing is currently not permitted in Indonesia. As a result there are also no MVNOs operating in the country.76
A.8.4 Infrastructure Sharing Projects
Tower companies:
• One of the major tower companies, Protelindo, acquired some 3,630 towers from MNO Hutchison in 2009. Protelindo currently owns and operates over 10,000 towers in Indonesia.77
• In 2012, Indonesia’s second major tower company, PT Tower Bersama Infrastructure, signed a sale-and-leaseback deal with telecom provider Indosat involving 2,500 towers. Indosat entered a lease agreement for a period of at least 10 years.78
Public Private Partnership (PPP):
Indonesia’s largest infrastructure sharing project up to date, the Palapa Ring Project, started out as a consortium of 9 operators in 2005 and is still under construction:79
• Objectives: The project was part of the government’s plan to increase telecommunication penetration, especially in rural areas and Eastern Indonesia, where infrastructure remained underdeveloped.
• Plan: Once completed, the network is to provide internet services to over 40,000 villages, connecting 33 out of 34 provinces with an estimated 35,280km of submarine and 21,807km of terrestrial fibre optic cable. The project involves the construction of six interconnected fibre optic rings on the main island groups – Sumatra, Java, Kalimantan, Bali and Nusa Tenggara, Sulawesi and Papua. The rings and their distance are listed in Table 17 below.
• Commercial Developments: By 2009, almost all companies except for PT Telkom, PT Indosat and PT Bakrie Telekom had pulled out of the project, forcing the government to fund the project with the use of funds from the USO.
75 Source unless noted otherwise: “Guide for the Construction and Usage of Joint Tower of Telecommunication”, Decree No.
2/2008 76 http://www.towerxchange.com/an-introduction-to-the-thriving-tower-industry-in-indonesia/ 77AT Kearney – The rise of the tower business 78http://www.tower-bersama.com/investor.php?id_cat=5&id_content=18&id_sub=25 79 Indonesia – Key Statistics, Telecommunications Market, infrastructure, Regulatory Overview 2014, Buddecom Reports
Broadband infrastructure sharing policies and strategies in emerging markets April 2015
© 2015 Deloitte LLP. 27
• Construction Developments: Phase I was completed in 2013 (Bali and Nusa Tenggara Ring involving over 1,000km of fibre). Phase II (over 5,600km connecting the Eastern provinces of Manado and Papua) is currently in the tendering process and expected to be completed in two years.
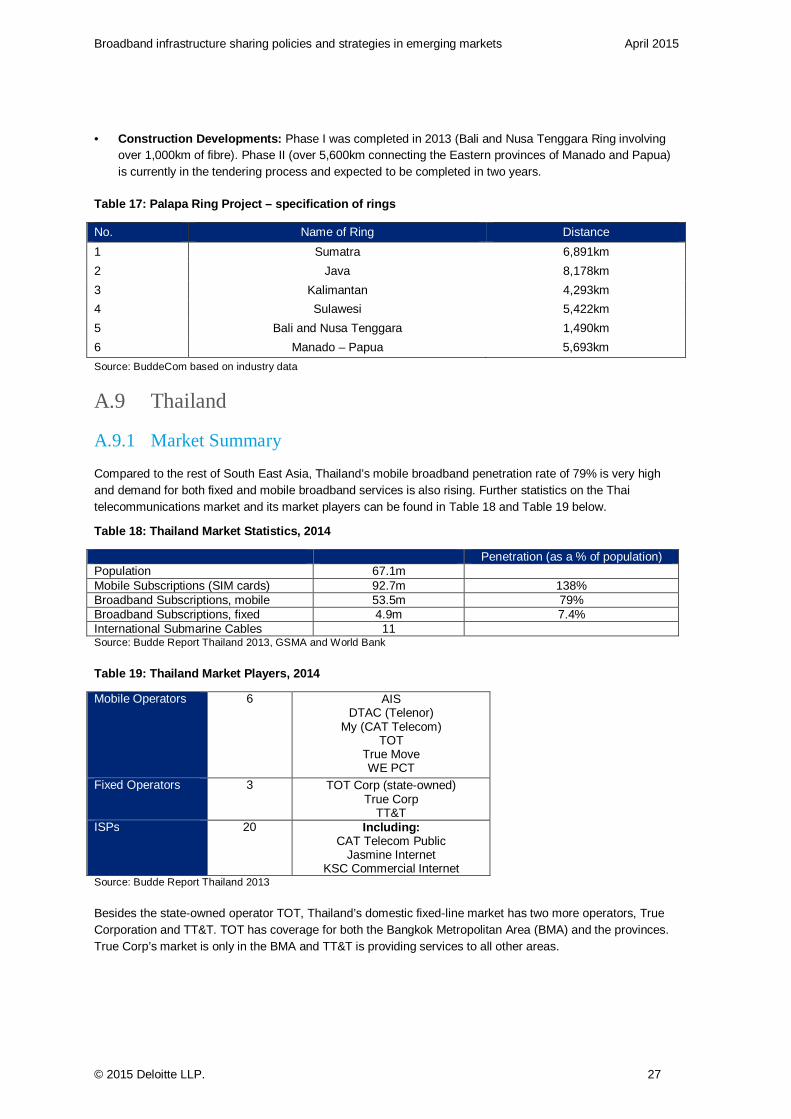
Table 17: Palapa Ring Project – specification of ri ngs
No. Name of Ring Distance
1 Sumatra 6,891km
2 Java 8,178km
3 Kalimantan 4,293km
4 Sulawesi 5,422km
5 Bali and Nusa Tenggara 1,490km
6 Manado – Papua 5,693km
Source: BuddeCom based on industry data
A.9 Thailand
A.9.1 Market Summary
Compared to the rest of South East Asia, Thailand’s mobile broadband penetration rate of 79% is very high and demand for both fixed and mobile broadband services is also rising. Further statistics on the Thai telecommunications market and its market players can be found in Table 18 and Table 19 below.
Table 18: Thailand Market Statistics, 2014
Penetration (as a % of population) Population 67.1m Mobile Subscriptions (SIM cards) 92.7m 138% Broadband Subscriptions, mobile 53.5m 79% Broadband Subscriptions, fixed 4.9m 7.4% International Submarine Cables 11 Source: Budde Report Thailand 2013, GSMA and World Bank
Table 19: Thailand Market Players, 2014
Mobile Operators 6 AIS DTAC (Telenor)
My (CAT Telecom) TOT
True Move WE PCT
Fixed Operators 3 TOT Corp (state-owned) True Corp
TT&T ISPs 20 Including:
CAT Telecom Public Jasmine Internet
KSC Commercial Internet Source: Budde Report Thailand 2013
Besides the state-owned operator TOT, Thailand’s domestic fixed-line market has two more operators, True Corporation and TT&T. TOT has coverage for both the Bangkok Metropolitan Area (BMA) and the provinces. True Corp’s market is only in the BMA and TT&T is providing services to all other areas.
Broadband infrastructure sharing policies and strategies in emerging markets April 2015
© 2015 Deloitte LLP. 28
Traditionally, international telephone services have been divided between two state-owned operators, TOT for all calls to neighbouring countries and CAT for all other international calls.80
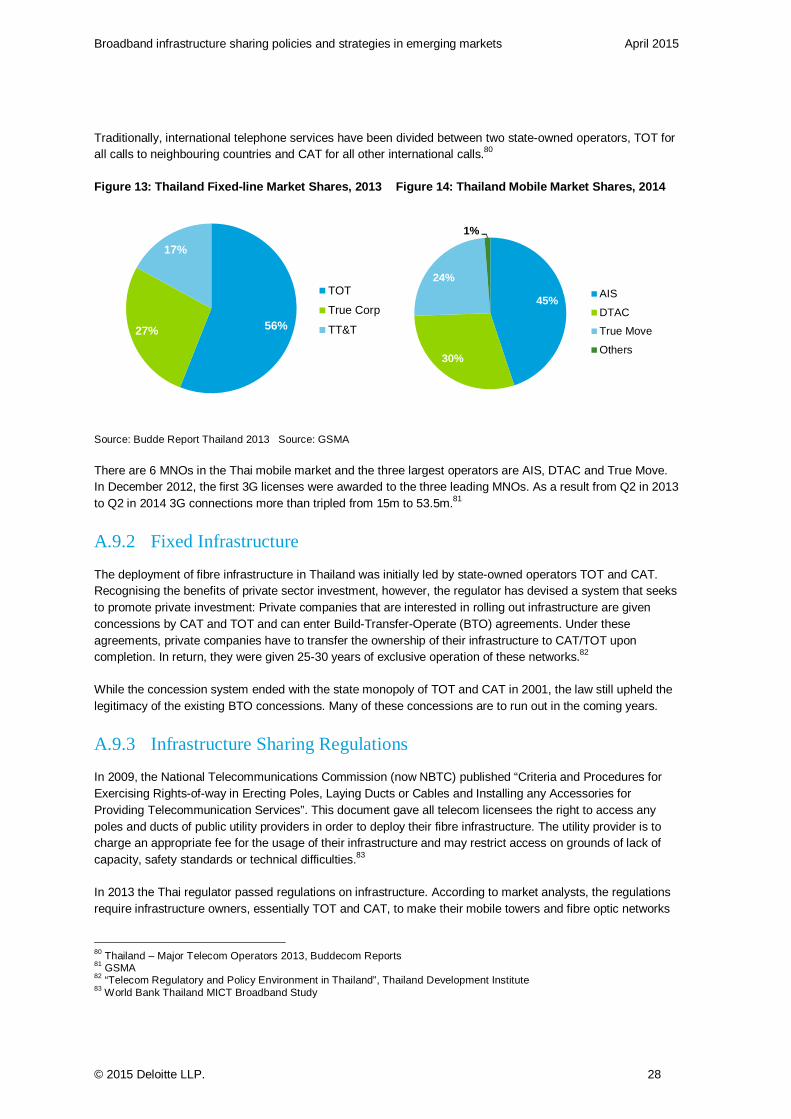
Figure 13: Thailand Fixed-line Market Shares, 2013 Figure 14: Thailand Mobile Market Shares, 2014
Source: Budde Report Thailand 2013 Source: GSMA
There are 6 MNOs in the Thai mobile market and the three largest operators are AIS, DTAC and True Move. In December 2012, the first 3G licenses were awarded to the three leading MNOs. As a result from Q2 in 2013 to Q2 in 2014 3G connections more than tripled from 15m to 53.5m.81
A.9.2 Fixed Infrastructure
The deployment of fibre infrastructure in Thailand was initially led by state-owned operators TOT and CAT. Recognising the benefits of private sector investment, however, the regulator has devised a system that seeks to promote private investment: Private companies that are interested in rolling out infrastructure are given concessions by CAT and TOT and can enter Build-Transfer-Operate (BTO) agreements. Under these agreements, private companies have to transfer the ownership of their infrastructure to CAT/TOT upon completion. In return, they were given 25-30 years of exclusive operation of these networks.82
While the concession system ended with the state monopoly of TOT and CAT in 2001, the law still upheld the legitimacy of the existing BTO concessions. Many of these concessions are to run out in the coming years.
A.9.3 Infrastructure Sharing Regulations
In 2009, the National Telecommunications Commission (now NBTC) published “Criteria and Procedures for Exercising Rights-of-way in Erecting Poles, Laying Ducts or Cables and Installing any Accessories for Providing Telecommunication Services”. This document gave all telecom licensees the right to access any poles and ducts of public utility providers in order to deploy their fibre infrastructure. The utility provider is to charge an appropriate fee for the usage of their infrastructure and may restrict access on grounds of lack of capacity, safety standards or technical difficulties.83
In 2013 the Thai regulator passed regulations on infrastructure. According to market analysts, the regulations require infrastructure owners, essentially TOT and CAT, to make their mobile towers and fibre optic networks
80 Thailand – Major Telecom Operators 2013, Buddecom Reports 81 GSMA 82 “Telecom Regulatory and Policy Environment in Thailand”, Thailand Development Institute 83 World Bank Thailand MICT Broadband Study
56%27%
17%
TOT
True Corp
TT&T
45%
30%
24%
1%
AIS
DTAC
True Move
Others
Broadband infrastructure sharing policies and strategies in emerging markets April 2015
© 2015 Deloitte LLP. 29
available to other operators for sharing.84 If compliance is voluntary, owners of key infrastructure will be given preferential pricing on licence fees.
The regulations allow the sharing of mobile infrastructure in three categories: site sharing, tower/mast sharing and network sharing.85 Owners of infrastructure shall charge reasonable and non-discriminatory fees for providing access to their sites, towers or networks and refusal can only be given in the case of lack of capacity or technical difficulties.
A.9.4 Infrastructure Sharing Projects
Tower companies:
• In 2014, True Corporation has set up Thailand’s first national tower company, the True Growth Infrastructure Fund (TRUEGIF). The operator is planning to transfer its tower assets (around 6,000 existing and planned) to the tower company over the course of the next two years.86
A.10 Philippines
A.10.1 Market Summary87
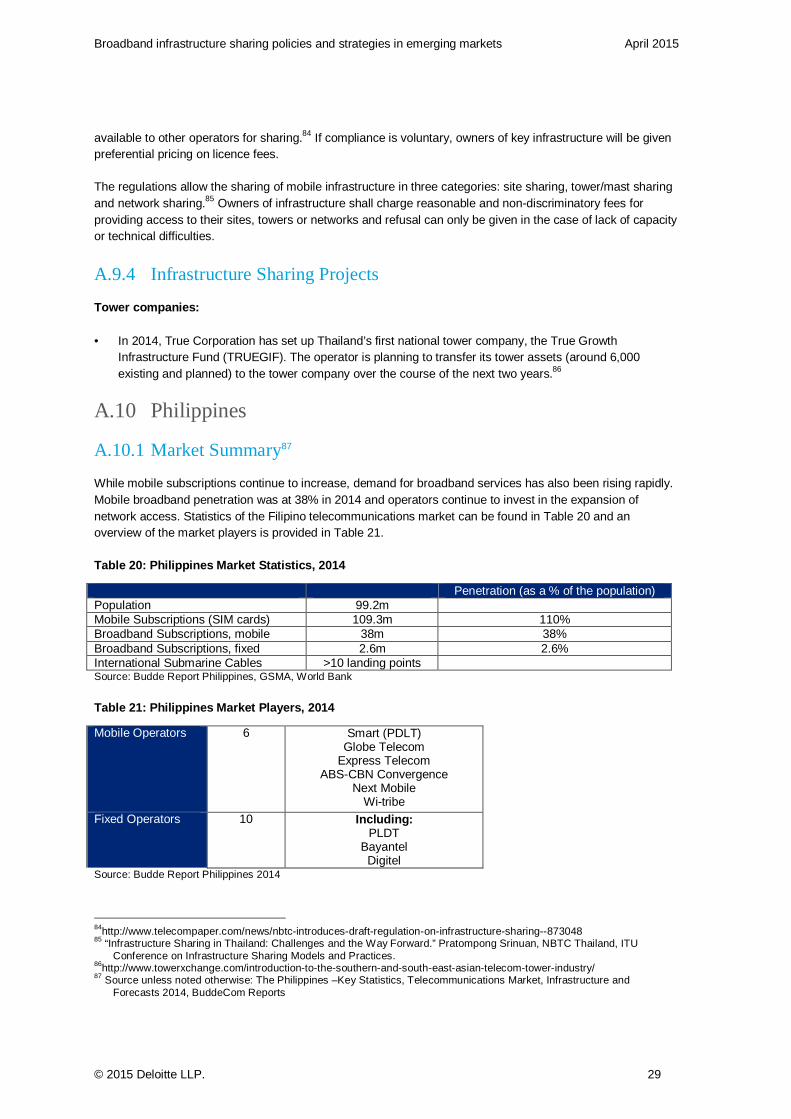
While mobile subscriptions continue to increase, demand for broadband services has also been rising rapidly. Mobile broadband penetration was at 38% in 2014 and operators continue to invest in the expansion of network access. Statistics of the Filipino telecommunications market can be found in Table 20 and an overview of the market players is provided in Table 21.
Table 20: Philippines Market Statistics, 2014
Penetration (as a % of the population) Population 99.2m Mobile Subscriptions (SIM cards) 109.3m 110% Broadband Subscriptions, mobile 38m 38% Broadband Subscriptions, fixed 2.6m 2.6% International Submarine Cables >10 landing points Source: Budde Report Philippines, GSMA, World Bank
Table 21: Philippines Market Players, 2014
Mobile Operators 6 Smart (PDLT) Globe Telecom
Express Telecom ABS-CBN Convergence
Next Mobile Wi-tribe
Fixed Operators 10 Including: PLDT
Bayantel Digitel
Source: Budde Report Philippines 2014
84http://www.telecompaper.com/news/nbtc-introduces-draft-regulation-on-infrastructure-sharing--873048 85 “Infrastructure Sharing in Thailand: Challenges and the Way Forward.” Pratompong Srinuan, NBTC Thailand, ITU
Conference on Infrastructure Sharing Models and Practices. 86http://www.towerxchange.com/introduction-to-the-southern-and-south-east-asian-telecom-tower-industry/ 87 Source unless noted otherwise: The Philippines –Key Statistics, Telecommunications Market, Infrastructure and
Forecasts 2014, BuddeCom Reports
Broadband infrastructure sharing policies and strategies in emerging markets April 2015
© 2015 Deloitte LLP. 30
There are 10 fixed operators in the Philippines fixed-line market, including Globe Telecom as the second national operator. With a market share of 56% in 2012, the national operator PLDT (Philippines Long Distance Telecom) is the largest player in the market.
All operators contributed to an early effort by the government to expand fixed-teledensity. With 7m lines rolled out, the target was exceeded, however, due to lack of the demand by 2011 only about 3m of them were operational.
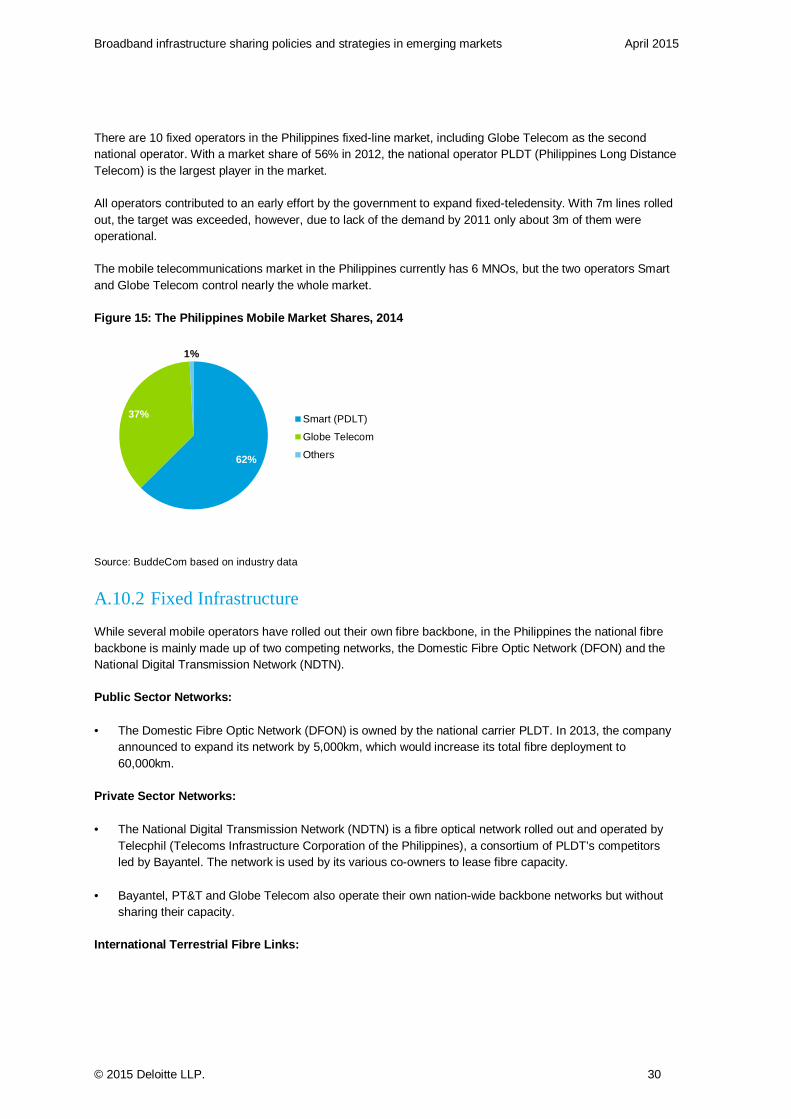
The mobile telecommunications market in the Philippines currently has 6 MNOs, but the two operators Smart and Globe Telecom control nearly the whole market.
Figure 15: The Philippines Mobile Market Shares, 20 14
Source: BuddeCom based on industry data
A.10.2 Fixed Infrastructure
While several mobile operators have rolled out their own fibre backbone, in the Philippines the national fibre backbone is mainly made up of two competing networks, the Domestic Fibre Optic Network (DFON) and the National Digital Transmission Network (NDTN).
Public Sector Networks:
• The Domestic Fibre Optic Network (DFON) is owned by the national carrier PLDT. In 2013, the company announced to expand its network by 5,000km, which would increase its total fibre deployment to 60,000km.
Private Sector Networks:
• The National Digital Transmission Network (NDTN) is a fibre optical network rolled out and operated by Telecphil (Telecoms Infrastructure Corporation of the Philippines), a consortium of PLDT’s competitors led by Bayantel. The network is used by its various co-owners to lease fibre capacity.
• Bayantel, PT&T and Globe Telecom also operate their own nation-wide backbone networks but without sharing their capacity.
International Terrestrial Fibre Links:
62%
37%
1%
Smart (PDLT)
Globe Telecom
Others
Broadband infrastructure sharing policies and strategies in emerging markets April 2015
© 2015 Deloitte LLP. 31
As a nation of islands, the Philippines do not have any international terrestrial fibre links to neighbouring countries, but instead, have landing stations of over ten international submarine cables.
A.10.3 Infrastructure Sharing Projects
Network Sharing
In 2013, the regulator NTC (National Telecommunications Commission) approved a network sharing agreement between ABS-CBN Corp and Globe Telecom, which represented a significant regulatory development:
• ABS-CBN announced that this deal was part of its intended effort to become the country’s third player in the telecom market.
• The deal involved the purchase of capacity from Globe Telecom under a five-year agreement.
• NTC required both companies to comply with levels of quality of service and performance standards.88
Infrastructure Companies
Although confined to the Greater Manila area, there are some examples of infrastructure companies offering fibre for operators to lease:
• A company called Radius has 2,500 km of fibre deployed across 86 municipalities in the Greater Manila area, which it leases to ISPs and telecommunications operators.89
Tower Companies
• With only two possible anchor tenants, there are no independent tower companies in the Philippines yet. Neither Smart (PLDT) nor Globe Telecom have outsourced any of their tower assets.90
88 The Philippines – Telecoms, Mobile, Broadband and Forecasts 2014, Buddecom Reports 89http://www.radius.net.ph/about-radius/ 90http://www.towerxchange.com/an-introduction-to-the-thriving-tower-industry-in-indonesia
Broadband infrastructure sharing policies and strategies in emerging markets April 2015
© 2015 Deloitte LLP. 1
Contacts
Mike Jensen APC Access Specialist
http://www.apc.org
Mark Williams Deloitte, Economic Consulting, London
Davide Strusani Deloitte, Economic Consulting, London