Embed Size (px)
Citation preview
E-LETTER Earth Planets Space, 61, e21–e24, 2009
Broadband P waves transmitting through fracturing Westerly granite beforeand after the peak stress under a triaxial compressive condition
Nana Yoshimitsu1, Hironori Kawakata2, and Naoki Takahashi3
1Graduate School of Science and Engineering, Ritsumeikan University, Kusatsu, Shiga 525-8577, Japan2Faculty of Science and Engineering, Ritsumeikan University, Kusatsu, Shiga 525-8577, Japan
3Sumitomo Mitsui Construction Co., Ltd., Tokyo 160-0023, Japan
(Received March 16, 2009; Revised May 19, 2009; Accepted May 22, 2009; Online published June 26, 2009)
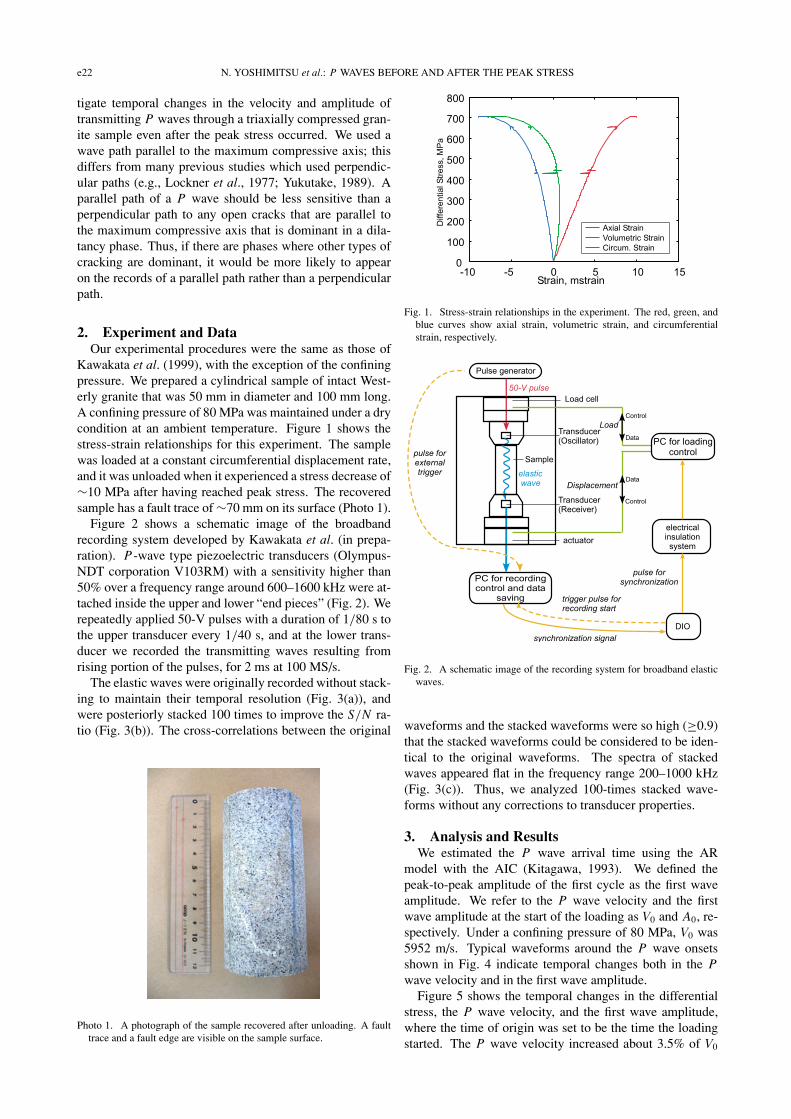
We analyzed temporal changes in the velocity and amplitude of P waves transmitted through a granite sampleduring a triaxial compression test, with the goal of monitoring the fault formation process associated with openand shear cracking. We used newly developed transducer assemblies for the broadband recording, and wecontinued to record transmitting waves even after the peak stress occurred. For transmitting P waves with pathsparallel to the maximum compressive axis, we found that both the first wave amplitude and the velocity decreasedafter dilatancy started, and they kept decreasing even after the peak stress. In addition, the large nonlinear decreasein amplitude was associated with a rapid decrease in differential stress, whereas the rate of decrease in velocityremained almost constant. Thus, before the rapid decrease of differential stress, when both the amplitude andthe velocity gradually decreased, open cracking was indicated to be dominant. Thereafter, shear cracking wasindicated to become dominant in synchronization with the rapid decrease in differential stress. It is suggestedthat a main fault started to grow around the sample surface and then progressed into the sample interior; thiscorresponded to the rapid stress decrease. This fault acts as a strong scatterer for P waves that are parallel to themaximum compressive axis.Key words: Broadband recording, fracturing Westerly granite, triaxial compression test, post-peak stress,transmitting P wave, amplitude change, velocity change, fault formation process.
1. IntroductionWhen a low differential stress is applied to a rock mass,
some of the open cracks that were contained by static pres-sure close, so that the crack density decreases. As the dif-ferential stress increases, new cracks are generated and di-latancy appears. The decrease and increase of open cracksassociated with loading and the elastic deformation of themineral grains result in a volumetric change and a changein the elastic properties of the medium, such as VP (the Pwave velocity) and VS (the S wave velocity). In these cases,we can use a transmitting wave to monitor the fracturingrock interior. For example, Lockner et al. (1977) recordedtransmitting waves with paths that were perpendicular to themaximum compressive axis under a triaxial condition. Theyfound that VP , VS , and the first wave amplitude rapidly de-creased just before the fracture strength was reached. Yuku-take (1989) recorded transmitting waves along 20 separatepaths that were perpendicular or oblique to the maximumcompressive axis and used them to compute a velocity to-mography. They reported that VP started to decrease onlyaround a prospective fault plane just before the compressivestrength value was reached.
To image a fracture growth in more detail, it is essentialto investigate the characteristics of the transmitting wave
Copy right c© The Society of Geomagnetism and Earth, Planetary and Space Sci-ences (SGEPSS); The Seismological Society of Japan; The Volcanological Societyof Japan; The Geodetic Society of Japan; The Japanese Society for Planetary Sci-ences; TERRAPUB.
even after the peak stress level occurs. Lockner et al. (1992)and Kawakata et al. (1999) both developed systems thatcan control the fracture process even after peak stress, andthey imaged the quasi-static fracture growth using acousticemission (AE) activities and X-ray computed tomography(CT) images, respectively. Nevertheless, there have beenfew studies that investigated the temporal changes in wavevelocity and amplitude after peak stress occurs. Using theAE feedback technique by Lockner et al. (1992), Thompsonet al. (2006) measured the velocity of transmitting wavesthrough a rock sample after peak stress, while recordingAE. However, since they were mainly interested in AEcharacteristics, they had a long interval between velocitysamples, making it difficult to discern the detailed velocitychange in their experiments.
Also, only narrowband transducers were used in manyprevious studies to obtain wave data (including those ofLockner et al., 1977, 1992; Thompson et al., 2006). Ifnarrowband transducers are used both to radiate the trans-mitting waves and to record them, then the recorded dataonly include the influence of cracks whose sizes correspondto the resonant frequency of the transducers. Sellers et al.(2003) carried out a broadband AE recording in a uniaxialcompression test and proposed a scaling for the AE. A newtransducer assembly was developed by Kawakata et al. (inpreparation) to apply broadband transducers under triaxialconditions.
In this study, we used broadband transducers to inves-
e21
e22 N. YOSHIMITSU et al.: P WAVES BEFORE AND AFTER THE PEAK STRESS
tigate temporal changes in the velocity and amplitude oftransmitting P waves through a triaxially compressed gran-ite sample even after the peak stress occurred. We used awave path parallel to the maximum compressive axis; thisdiffers from many previous studies which used perpendic-ular paths (e.g., Lockner et al., 1977; Yukutake, 1989). Aparallel path of a P wave should be less sensitive than aperpendicular path to any open cracks that are parallel tothe maximum compressive axis that is dominant in a dila-tancy phase. Thus, if there are phases where other types ofcracking are dominant, it would be more likely to appearon the records of a parallel path rather than a perpendicularpath.
2. Experiment and DataOur experimental procedures were the same as those of
Kawakata et al. (1999), with the exception of the confiningpressure. We prepared a cylindrical sample of intact West-erly granite that was 50 mm in diameter and 100 mm long.A confining pressure of 80 MPa was maintained under a drycondition at an ambient temperature. Figure 1 shows thestress-strain relationships for this experiment. The samplewas loaded at a constant circumferential displacement rate,and it was unloaded when it experienced a stress decrease of∼10 MPa after having reached peak stress. The recoveredsample has a fault trace of ∼70 mm on its surface (Photo 1).
Figure 2 shows a schematic image of the broadbandrecording system developed by Kawakata et al. (in prepa-ration). P-wave type piezoelectric transducers (Olympus-NDT corporation V103RM) with a sensitivity higher than50% over a frequency range around 600–1600 kHz were at-tached inside the upper and lower “end pieces” (Fig. 2). Werepeatedly applied 50-V pulses with a duration of 1/80 s tothe upper transducer every 1/40 s, and at the lower trans-ducer we recorded the transmitting waves resulting fromrising portion of the pulses, for 2 ms at 100 MS/s.
The elastic waves were originally recorded without stack-ing to maintain their temporal resolution (Fig. 3(a)), andwere posteriorly stacked 100 times to improve the S/N ra-tio (Fig. 3(b)). The cross-correlations between the original
Photo 1. A photograph of the sample recovered after unloading. A faulttrace and a fault edge are visible on the sample surface.
Fig. 1. Stress-strain relationships in the experiment. The red, green, andblue curves show axial strain, volumetric strain, and circumferentialstrain, respectively.
Fig. 2. A schematic image of the recording system for broadband elasticwaves.
waveforms and the stacked waveforms were so high (≥0.9)that the stacked waveforms could be considered to be iden-tical to the original waveforms. The spectra of stackedwaves appeared flat in the frequency range 200–1000 kHz(Fig. 3(c)). Thus, we analyzed 100-times stacked wave-forms without any corrections to transducer properties.
3. Analysis and ResultsWe estimated the P wave arrival time using the AR
model with the AIC (Kitagawa, 1993). We defined thepeak-to-peak amplitude of the first cycle as the first waveamplitude. We refer to the P wave velocity and the firstwave amplitude at the start of the loading as V0 and A0, re-spectively. Under a confining pressure of 80 MPa, V0 was5952 m/s. Typical waveforms around the P wave onsetsshown in Fig. 4 indicate temporal changes both in the Pwave velocity and in the first wave amplitude.
Figure 5 shows the temporal changes in the differentialstress, the P wave velocity, and the first wave amplitude,where the time of origin was set to be the time the loadingstarted. The P wave velocity increased about 3.5% of V0
N. YOSHIMITSU et al.: P WAVES BEFORE AND AFTER THE PEAK STRESS e23
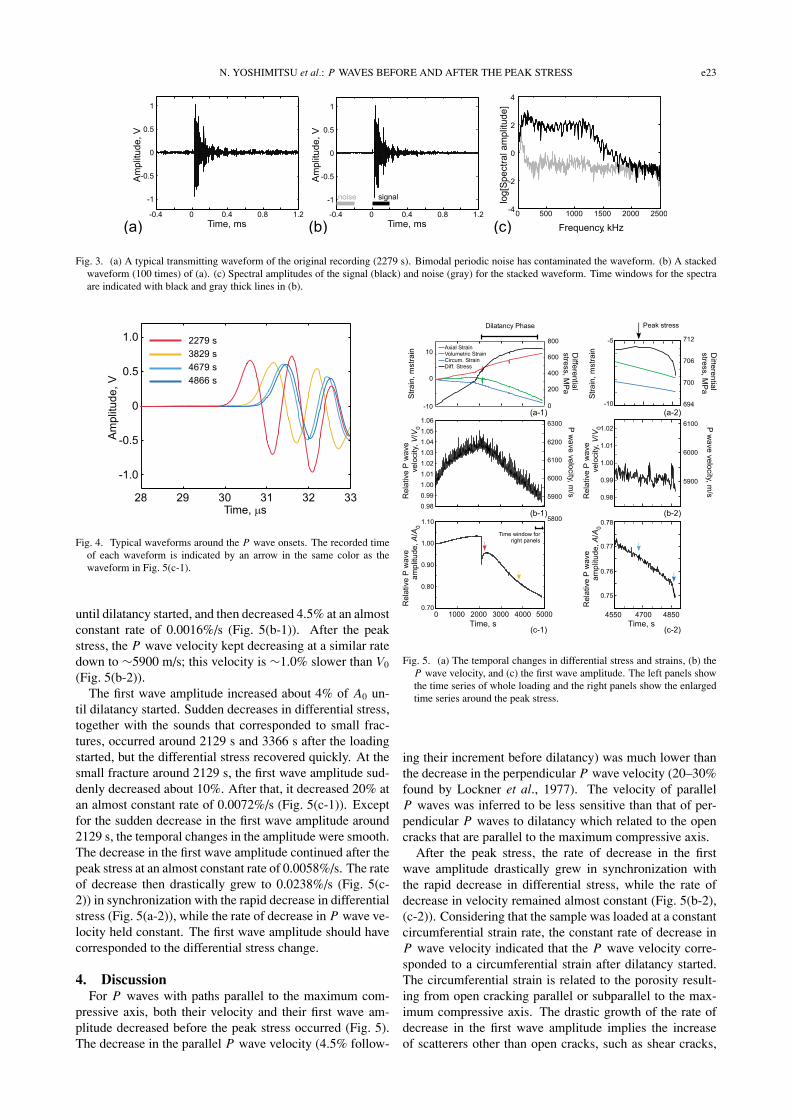
Fig. 3. (a) A typical transmitting waveform of the original recording (2279 s). Bimodal periodic noise has contaminated the waveform. (b) A stackedwaveform (100 times) of (a). (c) Spectral amplitudes of the signal (black) and noise (gray) for the stacked waveform. Time windows for the spectraare indicated with black and gray thick lines in (b).
Fig. 4. Typical waveforms around the P wave onsets. The recorded timeof each waveform is indicated by an arrow in the same color as thewaveform in Fig. 5(c-1).
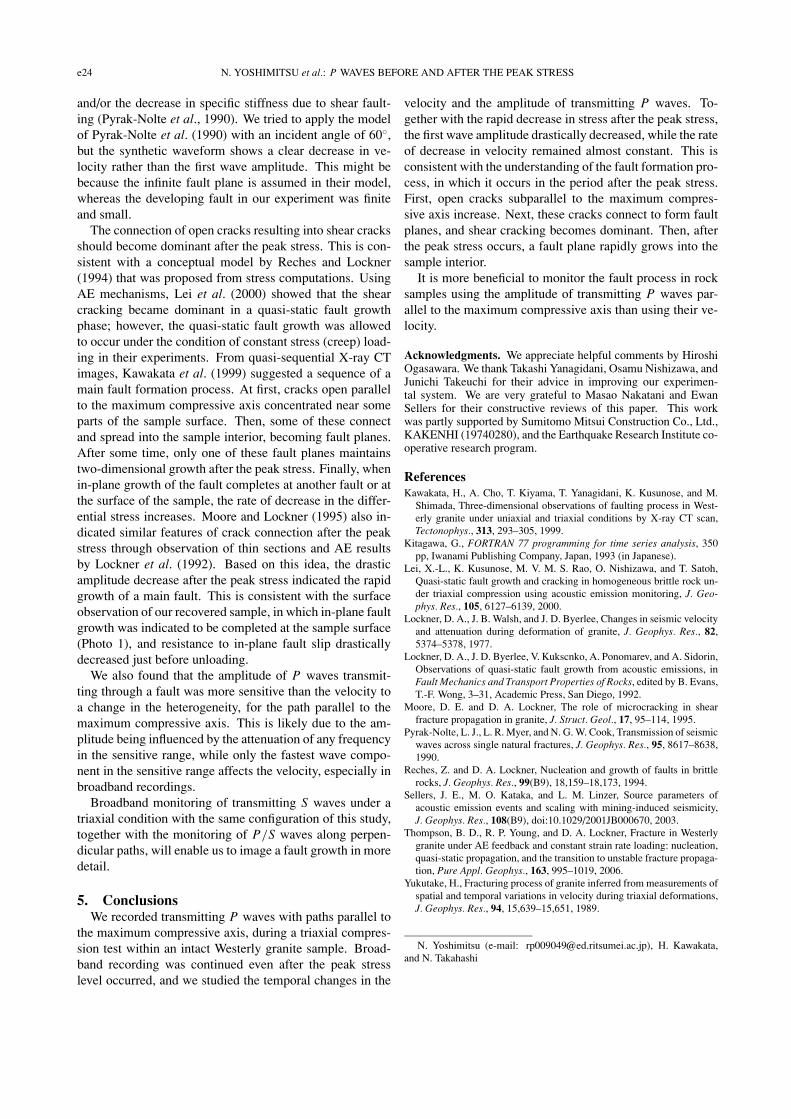
until dilatancy started, and then decreased 4.5% at an almostconstant rate of 0.0016%/s (Fig. 5(b-1)). After the peakstress, the P wave velocity kept decreasing at a similar ratedown to ∼5900 m/s; this velocity is ∼1.0% slower than V0
(Fig. 5(b-2)).The first wave amplitude increased about 4% of A0 un-
til dilatancy started. Sudden decreases in differential stress,together with the sounds that corresponded to small frac-tures, occurred around 2129 s and 3366 s after the loadingstarted, but the differential stress recovered quickly. At thesmall fracture around 2129 s, the first wave amplitude sud-denly decreased about 10%. After that, it decreased 20% atan almost constant rate of 0.0072%/s (Fig. 5(c-1)). Exceptfor the sudden decrease in the first wave amplitude around2129 s, the temporal changes in the amplitude were smooth.The decrease in the first wave amplitude continued after thepeak stress at an almost constant rate of 0.0058%/s. The rateof decrease then drastically grew to 0.0238%/s (Fig. 5(c-2)) in synchronization with the rapid decrease in differentialstress (Fig. 5(a-2)), while the rate of decrease in P wave ve-locity held constant. The first wave amplitude should havecorresponded to the differential stress change.
4. DiscussionFor P waves with paths parallel to the maximum com-
pressive axis, both their velocity and their first wave am-plitude decreased before the peak stress occurred (Fig. 5).The decrease in the parallel P wave velocity (4.5% follow-
Fig. 5. (a) The temporal changes in differential stress and strains, (b) theP wave velocity, and (c) the first wave amplitude. The left panels showthe time series of whole loading and the right panels show the enlargedtime series around the peak stress.
ing their increment before dilatancy) was much lower thanthe decrease in the perpendicular P wave velocity (20–30%found by Lockner et al., 1977). The velocity of parallelP waves was inferred to be less sensitive than that of per-pendicular P waves to dilatancy which related to the opencracks that are parallel to the maximum compressive axis.
After the peak stress, the rate of decrease in the firstwave amplitude drastically grew in synchronization withthe rapid decrease in differential stress, while the rate ofdecrease in velocity remained almost constant (Fig. 5(b-2),(c-2)). Considering that the sample was loaded at a constantcircumferential strain rate, the constant rate of decrease inP wave velocity indicated that the P wave velocity corre-sponded to a circumferential strain after dilatancy started.The circumferential strain is related to the porosity result-ing from open cracking parallel or subparallel to the max-imum compressive axis. The drastic growth of the rate ofdecrease in the first wave amplitude implies the increaseof scatterers other than open cracks, such as shear cracks,
e24 N. YOSHIMITSU et al.: P WAVES BEFORE AND AFTER THE PEAK STRESS
and/or the decrease in specific stiffness due to shear fault-ing (Pyrak-Nolte et al., 1990). We tried to apply the modelof Pyrak-Nolte et al. (1990) with an incident angle of 60◦,but the synthetic waveform shows a clear decrease in ve-locity rather than the first wave amplitude. This might bebecause the infinite fault plane is assumed in their model,whereas the developing fault in our experiment was finiteand small.
The connection of open cracks resulting into shear cracksshould become dominant after the peak stress. This is con-sistent with a conceptual model by Reches and Lockner(1994) that was proposed from stress computations. UsingAE mechanisms, Lei et al. (2000) showed that the shearcracking became dominant in a quasi-static fault growthphase; however, the quasi-static fault growth was allowedto occur under the condition of constant stress (creep) load-ing in their experiments. From quasi-sequential X-ray CTimages, Kawakata et al. (1999) suggested a sequence of amain fault formation process. At first, cracks open parallelto the maximum compressive axis concentrated near someparts of the sample surface. Then, some of these connectand spread into the sample interior, becoming fault planes.After some time, only one of these fault planes maintainstwo-dimensional growth after the peak stress. Finally, whenin-plane growth of the fault completes at another fault or atthe surface of the sample, the rate of decrease in the differ-ential stress increases. Moore and Lockner (1995) also in-dicated similar features of crack connection after the peakstress through observation of thin sections and AE resultsby Lockner et al. (1992). Based on this idea, the drasticamplitude decrease after the peak stress indicated the rapidgrowth of a main fault. This is consistent with the surfaceobservation of our recovered sample, in which in-plane faultgrowth was indicated to be completed at the sample surface(Photo 1), and resistance to in-plane fault slip drasticallydecreased just before unloading.
We also found that the amplitude of P waves transmit-ting through a fault was more sensitive than the velocity toa change in the heterogeneity, for the path parallel to themaximum compressive axis. This is likely due to the am-plitude being influenced by the attenuation of any frequencyin the sensitive range, while only the fastest wave compo-nent in the sensitive range affects the velocity, especially inbroadband recordings.
Broadband monitoring of transmitting S waves under atriaxial condition with the same configuration of this study,together with the monitoring of P/S waves along perpen-dicular paths, will enable us to image a fault growth in moredetail.
5. ConclusionsWe recorded transmitting P waves with paths parallel to
the maximum compressive axis, during a triaxial compres-sion test within an intact Westerly granite sample. Broad-band recording was continued even after the peak stresslevel occurred, and we studied the temporal changes in the
velocity and the amplitude of transmitting P waves. To-gether with the rapid decrease in stress after the peak stress,the first wave amplitude drastically decreased, while the rateof decrease in velocity remained almost constant. This isconsistent with the understanding of the fault formation pro-cess, in which it occurs in the period after the peak stress.First, open cracks subparallel to the maximum compres-sive axis increase. Next, these cracks connect to form faultplanes, and shear cracking becomes dominant. Then, afterthe peak stress occurs, a fault plane rapidly grows into thesample interior.
It is more beneficial to monitor the fault process in rocksamples using the amplitude of transmitting P waves par-allel to the maximum compressive axis than using their ve-locity.
Acknowledgments. We appreciate helpful comments by HiroshiOgasawara. We thank Takashi Yanagidani, Osamu Nishizawa, andJunichi Takeuchi for their advice in improving our experimen-tal system. We are very grateful to Masao Nakatani and EwanSellers for their constructive reviews of this paper. This workwas partly supported by Sumitomo Mitsui Construction Co., Ltd.,KAKENHI (19740280), and the Earthquake Research Institute co-operative research program.
ReferencesKawakata, H., A. Cho, T. Kiyama, T. Yanagidani, K. Kusunose, and M.
Shimada, Three-dimensional observations of faulting process in West-erly granite under uniaxial and triaxial conditions by X-ray CT scan,Tectonophys., 313, 293–305, 1999.
Kitagawa, G., FORTRAN 77 programming for time series analysis, 350pp, Iwanami Publishing Company, Japan, 1993 (in Japanese).
Lei, X.-L., K. Kusunose, M. V. M. S. Rao, O. Nishizawa, and T. Satoh,Quasi-static fault growth and cracking in homogeneous brittle rock un-der triaxial compression using acoustic emission monitoring, J. Geo-phys. Res., 105, 6127–6139, 2000.
Lockner, D. A., J. B. Walsh, and J. D. Byerlee, Changes in seismic velocityand attenuation during deformation of granite, J. Geophys. Res., 82,5374–5378, 1977.
Lockner, D. A., J. D. Byerlee, V. Kukscnko, A. Ponomarev, and A. Sidorin,Observations of quasi-static fault growth from acoustic emissions, inFault Mechanics and Transport Properties of Rocks, edited by B. Evans,T.-F. Wong, 3–31, Academic Press, San Diego, 1992.
Moore, D. E. and D. A. Lockner, The role of microcracking in shearfracture propagation in granite, J. Struct. Geol., 17, 95–114, 1995.
Pyrak-Nolte, L. J., L. R. Myer, and N. G. W. Cook, Transmission of seismicwaves across single natural fractures, J. Geophys. Res., 95, 8617–8638,1990.
Reches, Z. and D. A. Lockner, Nucleation and growth of faults in brittlerocks, J. Geophys. Res., 99(B9), 18,159–18,173, 1994.
Sellers, J. E., M. O. Kataka, and L. M. Linzer, Source parameters ofacoustic emission events and scaling with mining-induced seismicity,J. Geophys. Res., 108(B9), doi:10.1029/2001JB000670, 2003.
Thompson, B. D., R. P. Young, and D. A. Lockner, Fracture in Westerlygranite under AE feedback and constant strain rate loading: nucleation,quasi-static propagation, and the transition to unstable fracture propaga-tion, Pure Appl. Geophys., 163, 995–1019, 2006.
Yukutake, H., Fracturing process of granite inferred from measurements ofspatial and temporal variations in velocity during triaxial deformations,J. Geophys. Res., 94, 15,639–15,651, 1989.
N. Yoshimitsu (e-mail: [email protected]), H. Kawakata,and N. Takahashi