Embed Size (px)
Citation preview

BROADCOM CORP
FORM 10-K(Annual Report)
Filed 01/30/13 for the Period Ending 12/31/12
Address 5300 CALIFORNIA AVENUE
IRVINE, CA 92617-3038Telephone 949 926 5000
CIK 0001054374Symbol BRCM
SIC Code 3674 - Semiconductors and Related DevicesIndustry Semiconductors
Sector TechnologyFiscal Year 12/31
http://www.edgar-online.com© Copyright 2013, EDGAR Online, Inc. All Rights Reserved.
Distribution and use of this document restricted under EDGAR Online, Inc. Terms of Use.

UNITED STATES SECURITIES AND EXCHANGE COMMISSION Washington, D.C. 20549
Form 10-K (Mark One) ANNUAL REPORT PURSUANT TO SECTION 13 OR 15(d) OF THE SECURITIES EXCHANGE ACT OF 1934
For the fiscal year ended December 31, 2012 or
� TRANSITION REPORT PURSUANT TO SECTION 13 OR 15(d) OF THE SECURITIES EXCHANGE ACT OF 1934 For the transition period from to
Commission file number: 000-23993
Broadcom Corporation (Exact Name of Registrant as Specified in Its Charter)
5300 California Avenue Irvine, California 92617-3038
(Address of Principal Executive Offices) (Zip Code) (Registrant’s telephone number, including area code): (949) 926-5000
Securities registered pursuant to Section 12(b) of the Act:
Securities registered pursuant to Section 12(g) of the Act: None Indicate by check mark if the registrant is a well-known seasoned issuer, as defined in Rule 405 of the Securities Act. Yes � No � Indicate by check mark if the registrant is not required to file reports pursuant to Section 13 or Section 15(d) of the Act. Yes � No � Indicate by check mark whether the registrant: (1) has filed all reports required to be filed by Section 13 or 15(d) of the Securities Exchange Act of 1934
during the preceding 12 months (or for such shorter period that the registrant was required to file such reports), and (2) has been subject to such filing requirements for the past 90 days. Yes � No �
Indicate by check mark whether the registrant has submitted electronically and posted on its corporate Web site, if any, every Interactive Data File required to be submitted and posted pursuant to Rule 405 of Regulation S-T (§ 232.405 of this chapter) during the preceding 12 months (or for such shorter period that the registrant was required to submit and post such files). Yes � No �
Indicate by check mark if disclosure of delinquent filers pursuant to Item 405 of Regulation S-K (§ 229.405 of this chapter) is not contained herein, and will not be contained, to the best of registrant’s knowledge, in definitive proxy or information statements incorporated by reference in Part III of this Form 10-K or any amendment to this Form 10-K. �
Indicate by check mark whether the registrant is a large accelerated filer, an accelerated filer, a non-accelerated filer, or a smaller reporting company. See the definitions of “large accelerated filer,” “accelerated filer” and “smaller reporting company” in Rule 12b-2 of the Exchange Act.
Indicate by check mark whether the registrant is a shell company (as defined in Exchange Act Rule 12b-2). Yes � No � The aggregate market value of the registrant’s common stock, $0.0001 par value per share, held by non-affiliates of the registrant on June 30, 2012, the last
business day of the registrant’s most recently completed second fiscal quarter, was $17.08 billion (based on the closing sales price of the registrant’s common stock on that date). Shares of the registrant’s common stock held by each officer and director and each person known to the registrant to own 10% or more of the outstanding voting power of the registrant have been excluded in that such persons may be deemed to be affiliates. This determination of affiliate status is not a determination for other purposes.
The registrant has two classes of common stock authorized, Class A common stock and Class B common stock. The rights, preferences and privileges of each class of common stock are substantially identical except for voting rights. Shares of Class B common stock are not publicly traded but are convertible at any time into shares of Class A common stock on a one-for-one basis. As of December 31, 2012 there were 518 million shares of Class A common stock and 51 million shares of Class B common stock outstanding.
DOCUMENTS INCORPORATED BY REFERENCE Part III incorporates by reference certain information from the registrant’s definitive proxy statement for the 2013 Annual Meeting of Shareholders to be
filed on or before April 30, 2013.
California 33-0480482
(State or Other Jurisdiction of Incorporation or Organization)
(I.R.S. Employer Identification No.)
Title of Class Name of Exchange on Which Registered
Class A Common Stock, $0.0001 par value The Nasdaq Stock Market LLC (Nasdaq Global Select Market)
(Check one): Large accelerated filer � Accelerated filer � Non-accelerated filer � Smaller reporting company �
(Do not check if a smaller reporting company)


Broadcom ® , the pulse logo, BroadR-Reach ®, , VideoCore ® , XLP®, WICED™ and XGS™ are among the trademarks of Broadcom Corporation and/or its affiliates in the United States, certain other countries and/or the EU. Any other trademarks or trade names mentioned are the property of their respective owners.
© 2013 Broadcom Corporation. All rights reserved. This Annual Report on Form 10-K is printed on recycled paper.


Table of Contents
BROADCOM CORPORATION
ANNUAL REPORT ON FORM 10-K
FOR THE FISCAL YEAR ENDED DECEMBER 31, 2012
TABLE OF CONTENTS
Page
PART I Item 1. Business 1
Item 1A. Risk Factors 10
Item 1B. Unresolved Staff Comments 19
Item 2. Properties 19
Item 3. Legal Proceedings 19
Item 4. Mine Safety Disclosure 19
PART II
Item 5. Market for Registrant’s Common Equity, Related Stockholder Matters and Issuer Purchases of Equity Securities 20
Item 6. Selected Financial Data 22
Item 7. Management’s Discussion and Analysis of Financial Condition and Results of Operations 24
Item 7A. Quantitative and Qualitative Disclosures about Market Risk 45
Item 8. Financial Statements and Supplementary Data 46
Item 9. Changes in and Disagreements with Accountants on Accounting and Financial Disclosure 46
Item 9A. Controls and Procedures 46
Item 9B. Other Information 47
PART III
Item 10. Directors, Executive Officers and Corporate Governance 48
Item 11. Executive Compensation 48
Item 12. Security Ownership of Certain Beneficial Owners and Management and Related Stockholder Matters 48
Item 13. Certain Relationships and Related Transactions, and Director Independence 48
Item 14. Principal Accounting Fees and Services 48
PART IV
Item 15. Exhibits, Financial Statement Schedules 49

Table of Contents Cautionary Statement
All statements included or incorporated by reference in this Annual Report on Form 10-K, other than statements or characterizations of historical fact, are forward-looking statements within the meaning of the federal securities laws, including the Private Securities Litigation Reform Act of 1995. Examples of forward-looking statements include, but are not limited to, statements concerning projected total net revenue, costs and expenses and product and total gross margin; our accounting estimates, assumptions and judgments; the demand for our products; our dependence on a few key customers and/or design wins for a substantial portion of our revenue; our ability to consummate acquisitions and integrate their operations successfully; estimates related to the amount and/or timing of the expensing of unearned stock-based compensation expense and stock-based compensation as a percentage of revenue; manufacturing, assembly and test capacity; the effect that economic conditions, seasonality and volume fluctuations in the demand for our customers’ consumer-oriented products will have on our operating results; our ability to adjust operations in response to changes in demand for existing products and services or the demand for new products requested by our customers; the competitive nature of and anticipated growth in our markets; our ability to migrate to smaller process geometries; our success in pending intellectual property litigation matters; our potential needs for additional capital; inventory and accounts receivable levels; our ability to obtain future tax holidays in Singapore; our ability to permanently reinvest our foreign earnings; the effect of potential changes in U.S. or foreign tax laws and regulations or the interpretation thereof; the level of accrued rebates; and income we expect to record in connection with our agreement with Qualcomm or similar arrangements in the future. These forward-looking statements are based on our current expectations, estimates and projections about our industry and business, management’s beliefs, and certain assumptions made by us, all of which are subject to change. Forward-looking statements can often be identified by words such as “anticipates,” “expects,” “intends,” “plans,” “predicts,” “believes,” “seeks,” “estimates,” “may,” “will,” “should,” “would,” “could,” “pot ential,” “continue,” “ongoing,” similar expressions, and variations or negatives of these words. These statements are not guarantees of future performance and are subject to risks, uncertainties and assumptions that are difficult to predict. Therefore, our actual results could differ materially and adversely from those expressed in any forward-looking statements as a result of various factors, some of which are listed under the section entitled “Risk Factors” in Part I, Item 1A of this Report. These forward-looking statements speak only as of the date of this Report. We undertake no obligation to revise or update publicly any forward-looking statement to reflect future events or circumstances.
PART I Item 1. Business Overview
Broadcom Corporation (including our subsidiaries, referred to collectively in this Report as “Broadcom,” “we,” “our” and “us”) is a global
leader and innovator in semiconductor solutions for wired and wireless communications. Broadcom ® products seamlessly deliver voice, video, data and multimedia connectivity in the home, office and mobile environment. We provide the industry's broadest portfolio of state-of-the-art system-on-a-chip, or SoC, and embedded software solutions.
Broadcom was incorporated in California in August 1991. Our Class A common stock trades on the Nasdaq Global Select Market ® under
the symbol BRCM. Our principal executive offices are located at 5300 California Avenue, Irvine, California 92617-3038, and our telephone number at that location is 949.926.5000. Our Internet address is www.broadcom.com . The inclusion of our Internet address in this Report does not include or incorporate by reference into this Report any information on our website. Our annual reports on Form 10-K, quarterly reports on Form 10-Q, current reports on Form 8-K, amendments to those reports and other U.S. Securities and Exchange Commission (SEC) filings are available free of charge through the investor relations section of our website as soon as reasonably practicable after such reports are electronically filed with, or furnished to, the SEC. The SEC also maintains a web site, www.sec.gov , which contains reports, proxy and information statements, and other information regarding issuers that file electronically with the SEC.
Communications technologies continue to evolve rapidly in response to ubiquitous wireless and mobile networks, the emergence of new
data-intensive computing and multimedia applications, and the continuing convergence of personal computing and mobile devices. The broadband transmission of digital information over wired and wireless infrastructures requires very sophisticated semiconductor solutions to perform critical systems functions such as communications signal processing, audio, video and multimedia processing, radio frequency and analog signal processing, and switching and routing packets of information over IP-based networks.
1

Table of Contents
We currently operate our business to serve three markets: Broadband Communications, Mobile and Wireless and Infrastructure and Networking. Our diverse product portfolio includes:
Net Revenue by Reportable Segment
Our semiconductor solutions are used globally by leading manufacturers and are embedded in an array of products for the home, the hand and network infrastructure. Net revenue for our reportable segments, Broadband Communications, Mobile and Wireless, and Infrastructure and Networking is presented below. “All Other” is comprised of (i) income from our April 2009 agreement with Qualcomm Incorporated, or the Qualcomm Agreement (see detailed discussion in “ Overview ” section in Item 7. Management’s Discussion and Analysis of Financial Condition and Results of Operations), and (ii) other licensing revenue.
Percentage of Net Revenue
Broadband Communications Reportable Segment (Solutions for the Home)
Broadcom's broadband communications reportable segment offers a range of broadband communications and consumer electronics SoC
solutions that enable voice, video, data and multimedia services over wired and wireless networks for the home. Our solutions in this reportable segment include: cable modem, PON and xDSL SoCs; small and residential cell SoCs; xDSL, xPON and cable modem central office solutions; MPEG/AVC/VC-1 encoders and transcoders; digital cable, DBS, terrestrial and IP set-top box SoCs; and Powerline and MoCA Networking SoCs. Products incorporating our solutions in this reportable segment include: modems (cable, xPON, small and residential cells and DSL) and residential gateways; cable modem termination systems (CMTS), optical line termination (OLT) and central office DSLAM solutions; digital cable, digital transport adapter, direct broadcast satellite, terrestrial and IP set-top boxes; and wired home networking solutions (i.e. MoCA and Powerline Networking).
2
• Broadband Communications (Solutions for the Home) — Complete solutions for cable, xDSL, fiber, satellite and IP broadband networks to enable the connected home, including set-top-boxes and media servers, residential modems and gateways, small and residential cells and wired home networking solutions.
• Mobile and Wireless (Solutions for the Hand) — Low-power, high-performance and highly integrated solutions powering the mobile and wireless ecosystem, including Wi-Fi and Bluetooth, cellular SoCs, personal navigation and global positioning, near field communications (NFC), Voice over IP (VoIP), and mobile power management solutions.
• Infrastructure and Networking (Solutions for Infrastructure) — Highly integrated solutions for carriers, service providers, enterprises, small-to-medium businesses and data centers for network infrastructure needs, including Ethernet switches, physical layer devices (PHYs), multicore embedded processors, knowledge-based processors (KBP), digital front ends for wireless infrastructure, switch fabric solutions, high-speed Ethernet controllers and microwave backhaul devices.
Net Revenue: $8.01 billion Net Revenue: $7.39 billion Net Revenue: $6.82 billion

Table of Contents
Modems and Residential Gateways
The number of global broadband subscribers continues to grow. According to ABI Research, there were nearly 620 million in 2012. Global service providers continue to deploy next generation broadband access technologies across DSL, Cable and fiber to deliver more bandwidth and faster speeds to consumers across the globe. Broadcom offers complete system solutions across DSL, cable and fiber to enable service providers to provide data, voice and video services to and throughout the home.
Digital Cable, Direct Broadcast Satellite and IP Set-Top Boxes
Global service providers are increasingly introducing new products and services in the connected home, including transcoding, digital video recording services, high definition, wired and wireless networking, and more integrated tuners to enable faster channel change and more simultaneous recordings. According to ABI Research, approximately 250 million set-top boxes (STB) were shipped in 2012. We offer complete platform solutions for cable, satellite and IP STB.
Mobile and Wireless Reportable Segment (Solutions for the Hand)
Broadcom's mobile and wireless reportable segment offers products that enable end-to-end wireless and cellular connectivity at home, at
work and on-the-go. Our solutions in this reportable segment include: Wi-Fi; Bluetooth; wireless connectivity combos; GPS/GMSS; EDGE and 3G baseband SoCs; power management ICs; VoIP SoCs; near field communications; and cellular RFs. Products incorporating our solutions in this reportable segment include: smartphones and mobile phones; tablets, laptops, desktop computers, and peripherals; wireless home routers and gateways; printers; cellular data cards; Wi-Fi mobile hotspots; handheld media devices; personal navigation devices; home gaming systems; VoIP phones; wireless-enabled TVs and STBs; and thermostats and home monitoring.
Wireless Local Area and Personal Area Networking
Wi-Fi/WLAN. Wireless local area networking, also known as Wi-Fi or WLAN, allows devices on a local area network to communicate wirelessly. It adds the convenience of mobility to the powerful utility of high-speed data networks. Wi-Fi has been embedded into a wide range of devices including smartphones, tablets, home gateways and routers, personal computers, digital cameras, printers, gaming devices, STBs, and HDTVs. According to ABI Research, a total of approximately 1.5 billion Wi-Fi capable devices were estimated to have been shipped in 2012. In 2011, we introduced a Wireless Internet Connectivity for Embedded Devices (WICED ™ ) platform to simplify and extend Wi-Fi connectivity to a range of additional connected appliances, smart energy systems, and cloud-based health and home management services devices. We offer a family of high performance, low power Wi-Fi chipsets that support all current standards. Broadcom products address 802.11a/b/g, 802.11n and 802.11ac standards-based products. 802.11ac, the latest generation of Wi-Fi technology, enables gigabit speeds over Wi-Fi and also improves range and battery life. We also support Wi-Fi Direct, WiFi Display and Miracast across our product portfolio, allowing communication between devices without having to interact with an access point, increasing ease of use for Wi-Fi and enabling us to serve increased demand for the transfer of HD content between devices.
Bluetooth. The Bluetooth short-range wireless networking standard is a low power wire replacement technology that enables direct
connectivity among a wide variety of mainstream consumer electronic devices. According to ABI Research, a total of approximately 2 billion Bluetooth-enabled devices were estimated to have been shipped in 2012. We offer a complete family of Bluetooth silicon and software solutions for mobile phones, PCs, wireless headphones and headsets, HDTVs, peripherals, gaming and other applications. Our family of single-chip Bluetooth devices, software applications and protocol stacks provide a complete solution that enables manufacturers to add Bluetooth functionality to almost any electronic device with a minimal amount of development time and resources. We continue to drive the evolution of Bluetooth with support of Bluetooth Low Energy (BLE), an emerging standard for supporting low power applications such as health and fitness, and the number of opportunities for Bluetooth applications, such as the industry standardization of Bluetooth for 3D glasses, continues to expand.
Wireless Connectivity Combination Chips
Consumers increasingly expect their mobile devices to seamlessly communicate wirelessly with a broad range of devices, including TVs, PCs, printers, smartphones, remote speakers, headsets and car stereos. At the same time, our customers seek lower costs, higher performance and longer battery life in their devices. To meet these demands, we have developed a family of combination chip (combo chip) solutions that integrate multiple wireless technologies onto a single chip. For example, we offer combo solutions that integrate a complete Bluetooth system (with BLE and Bluetooth High Speed), a
3
Table of Contents complete Wi-Fi system (including 802.11ac), and a high performance FM stereo radio receiver into a single die. Our latest combo chip integrates four wireless technologies - Wi-Fi, Bluetooth, FM and NFC.
Global Positioning System
Global Positioning System (GPS) has long been a standard feature in navigation devices and has become a common feature in smartphones and tablets. In addition to GPS, other satellite-based navigation systems have been deployed, such as GLONASS. Global Navigation Satellite System (GNSS) technology encompasses a plurality of such satellite-based navigation systems. By making use of additional satellite coverage, significant improvement in location determination, location accuracy and time-to-first-fix can be obtained over a system that relies only on a GPS based solution, particularly in urban areas. According to ABI Research, 860 million GPS enabled devices were estimated to be shipped in 2012. Broadcom offers a family of GPS, assisted GPS (A-GPS) and GNSS semiconductor products, software and data services. Broadcom's location-based services technology delivers assistance data to our GNSS devices further enhancing performance and reliability.
Cellular SoCs
Handheld devices (such as smartphones) and portable computing devices (such as laptops and tablets) are enabling a broad range of connected applications, including email, streaming audio and video content, gaming and social networking. The evolution of the international Global System for Mobile Communication (GSM) standard to 3G and 4G technologies have enabled “always on” Internet applications when combined with WLAN and wireless personal area network (WPAN) connectivity technologies. We are able to combine our cellular, connectivity, and location technologies to deliver complete platform solutions, accelerating time to market for our customers while reducing design complexity, board area and power consumption.
According to the Linley Group, cellular baseband shipments into handsets and other equipment, such as USB dongles, amounted to
approximately 2.2 billion units in 2012. We provide a family of 2.5G and 3G SoC chipsets and platform solutions with associated software. Our cellular SoCs incorporate a high performance multi-core application processing subsystem, 1080p graphics and video, an image processing subsystem, and a cellular modem on a single chip.
As part of our cellular platform, Broadcom provides cellular RF and a family of power management devices that intelligently manage
power consumption in mobile devices to optimize system operation and improve battery life.
Voice over Internet Protocol
Driven by the significant build-out of the Internet, the transmission of voice over an IP packet-based network, or VoIP applications, is continuing to grow. Our VoIP phone silicon and software solutions integrate packet processing, voice processing and switching technologies to provide the quality of service, high fidelity and reliability necessary for enterprise telephony applications and home routers/gateways. These products support residential VoIP services that are now being offered by a variety of broadband service providers.
Near Field Communications
Near field communications (NFC) is an ultra short-range wireless standard to enable simple connectivity and data transfer by the act of
bringing two devices in close proximity. According to ABI Research, approximately 121 million NFC enabled products were estimated to have been shipped in 2012. NFC has been adopted for contactless payment systems and can also be implemented in a variety of consumer devices, including mobile phones, tablets, and digital TVs, remote controls, wireless mice, 3D glasses and Bluetooth headsets, to pair two devices and enable other forms of wireless connectivity data transfer between devices. Broadcom has developed a family of NFC solutions with a combination of advanced power, size and functional requirements for original equipment manufacturers to implement low-cost NFC consumer device applications in their products.
Infrastructure and Networking Reportable Segment (Solutions for Infrastructure)
Through our Infrastructure and Networking reportable segment, we design and develop complete silicon and software infrastructure
solutions for service provider, data center, and enterprise and small-to-medium business networks. Our solutions leverage industry-proven Ethernet technology to promote faster, “greener” and cost-efficient transport and processing of voice, video, data and multimedia across both wired and wireless networks as network data traffic increases. In February 2012 we completed our acquisition of NetLogic Microsystems, Inc., or NetLogic, a publicly traded company that was a provider of high-performance intelligent semiconductor solutions for next generation networks. Upon closing, NetLogic was incorporated
4

Table of Contents into our Infrastructure and Networking reportable segment. For more information about the NetLogic acquisition, see the “ Overview ” section in Item 7. Management's Discussion and Analysis of Financial Condition and Results of Operations.
Our solutions in this reportable segment include: Ethernet switches and fabrics; Ethernet controllers; Ethernet copper transceivers;
backplane and optical front-end physical layer devices; multicore communications processors; microwave modems and RF; remote radio head digital front end; and knowledge-based processors. Products incorporating our solutions in this reportable segment include: service provider metro equipment; 3G/4G wireless infrastructure and wireless access points; switches and routers; servers and workstations; desktop and notebook computers; network interface cards; LAN on motherboard applications; optical networks and dense wave division multiplexing applications; virtual private networks and security appliances; storage controllers; and microwave links for wireless backhaul.
Ethernet Networking
Ethernet is a ubiquitous interconnection technology that enables high performance and cost effective networking infrastructure across the enterprise, service provider, data center and small and medium business (SMB) spaces. Our highly integrated, low power SoC solutions enable users to access data, voice and video from their offices, homes or over wireless networks.
Ethernet Switches. As described below, we offer a broad set of Ethernet switching products ranging from low-cost five port switch chips
to complete solutions enabling in excess of 400 terabits of switching capacity in a multi-chassis configuration.
Ethernet Copper Transceivers. Our high performance Ethernet transceivers are built upon a proprietary digital signal processing (DSP)
communication architecture optimized for high-speed network connections and support the latest standards and advanced features, such as energy efficient Ethernet, data encryption and time synchronization at one or 10 Gbps.
Ethernet Controllers. Our family of Ethernet controllers offers comprehensive solutions for servers, workstations, and desktop and
notebook computers, supporting multiple generations of Ethernet technology. Gigabit and 10 Gigabit Ethernet controllers deliver high performance dual-port and quad-port, single-chip converged network interface controller (C-NIC) at 1 Gbps or 10 Gbps rates, without requiring external packet memory.
Automotive Ethernet. As consumer demand for in-vehicle connectivity continues to grow, automotive manufacturers are under pressure to deliver competitive, innovative features while minimizing cost. Broadcom’s BroadR-Reach ® automotive solutions allow multiple in-vehicle systems (such as infotainment, on-board diagnostics and automated driver assistance) to simultaneously access information over unshielded single twisted pair cable. Our automotive Ethernet product portfolio consists of five devices (including three highly integrated switches with embedded PHYs and two stand-alone PHY solutions) that deliver high-performance bandwidth of 100Mbps and beyond while dramatically reducing connectivity costs and cabling weight, as well as increasing energy efficiency.
Backplane and Optical Front-End Physical Layer Devices . To address increasing volumes of data traffic both in data centers and service
provider networks, we offer a portfolio of 10G and 40G Ethernet transceivers, 100 Gbps gear boxes, forward error correction solutions, and chips for backplanes and optical interconnect. These devices are low-power solutions for very high density 10, 40 and 100 Gbps switching solutions. We also offer 2.5 Gbps and 10 Gbps SONET/SDH/OTN transceivers that enable the development of low-cost, high-density optical transport equipment, enabling telecommunications and service providers to efficiently deliver data and voice traffic over existing fiber networks.
5
• Our service provider switch portfolio enables carrier/service provider networks to support a large number of services in the wireless backhaul, access, aggregation and core of their networks.
• Our data center portfolio provides high capacity, low latency switching silicon that supports advanced protocols around virtualization and multi-pathing. In addition, our DNX Ethernet switching fabric technologies provide the ability to build highly scalable flat networks supporting tens of thousands of servers and supporting 100 gigabits per second (Gbps) Ethernet.
• Our SBX NPU product family provides a full duplex 100 Gbps fully programmable packet processor. • For enterprise applications, our XGS ™ product family combines multi-layer switching capabilities and wire-speed Gigabit, 10, 40 and
100 Gbps Ethernet switching performance for unified wired and wireless enterprise business networks. • Our family of SMB Ethernet switch products are designed to support lower power modes and comply with industry standards around
energy efficient Ethernet.

Table of Contents
Processors and Wireless Infrastructure Multicore Communication Processor . Used in building current and next-generation server, storage, data networking and wireless
equipment, our XLP ® multicore solutions provide leading central processing unit (CPU) performance utilizing quad issue, quad threaded and out-of-order execution. These CPU cores are coupled with high performance on-chip fabric and accelerators, enabling multi-chip cache coherent configurations. Broadcom's high-speed communications processors support complex networking applications, such as deep content switching, routing and load balancing at wireline speed.
Knowledge-Based Processors (KBP). Broadcom's knowledge-based processors enable high-performance decision-making for packet
processing in a variety of advanced devices in the enterprise, metro, access, edge and core networking spaces. This family features the ability to process packets at wire-speed and lowest power consumption.
Digital Front End . Our Digital Front-End (DFE) processor family delivers superior linearization performance for 2G, 3G and 4G
protocols and advances the ability for base station design, deployment and management to meet this Multi-Protocol demand. This enables the creation of flexible platforms that can adapt dynamically to future network requirements.
Microwave Modems and RF. Our family of microwave modems and RF chip sets allows our customers to build the highest performance
wireless backhaul and LAN extension products for service providers. They include features such as dual polarization for increased throughput, integrated networking functionality and full path protection.
Custom Silicon Products
We offer customers a range of custom application-specific integrated circuit, or ASIC, products that integrate customer-specific intellectual property into larger, more highly integrated solutions. This approach enables our customers to leverage their own intellectual property while still benefiting from the cost, power and performance benefits of a more integrated, often single-chip, solution.
Licensing of Intellectual Property
We generate licensing revenue and related income from the licensing of our intellectual property. The vast majority of our licensing
revenue and related income has been derived from the Qualcomm Agreement. See detailed discussion in the “ Overview ” section in Item 7. Management's Discussion and Analysis of Financial Condition and Results of Operations. This licensing revenue and related income represented 2.6%, 3.1% and 3.3% of our total net revenue in 2012 , 2011 and 2010 , respectively. The income from the Qualcomm Agreement is non-recurring and will terminate in April 2013. There can be no assurances that we will be able to enter into similar arrangements of this magnitude in the future.
Reference Platforms
To assist our customers in developing products, we develop reference platforms designed around our integrated circuit products that represent prototypical system-level applications. These reference platforms generally include an extensive suite of software drivers, as well as protocol and application layer software. By providing reference platforms that may ultimately be incorporated into our customers’ end products, we assist our customers in transitioning from initial prototype designs to final production releases. We believe this enables our customers to achieve easier and faster transitions from the initial prototype designs through final production releases. We believe these reference platform designs also significantly enhance customers’ confidence that our products will meet their market requirements and product introduction schedules.
6

Table of Contents Customers and Strategic Relationships
We sell our products to leading wired and wireless communications manufacturers. We have also established strategic relationships with multiservice operators that provide wired and wireless communications services to consumers and businesses. Our leading customers currently shipping wired and/or wireless communications equipment and devices incorporating our products include:
A small number of customers have historically accounted for a substantial portion of our net revenue. Contributions to our net revenue by
these customers have increased in the last several years. Sales to our five largest customers represented 47.2% , 42.6% and 38.6% of our net revenue in 2012 , 2011 and 2010 , respectively. In 2012 , 2011 and 2010 sales to Samsung and Apple represented 17.3% and 14.6% , 10.0% and 13.1% , and 10.0% and 10.9% of our net revenue, respectively. See Note 11 of Notes to Consolidated Financial Statements, included in Part IV, Item 15 of this Report. We expect that our key customers will continue to account for a substantial portion of our net revenue in 2013 and in the foreseeable future. We typically sell products pursuant to purchase orders that customers can generally cancel, change or defer on short notice without incurring a significant penalty.
Research and Development
We have assembled a large team of experienced engineers and technologists, many of whom are leaders in their particular field or discipline. As of December 31, 2012 we had approximately 8,700 research and development employees (or approximately 77% of our total employees), including over 850 employees with Ph.D.s. These key employees are involved in advancing our core technologies, as well as product development. We believe that increased intellectual property integration and the timely introduction of new products are essential to our growth. Because SoC solutions benefit from the same underlying core technologies, we are able to address a wide range of communications markets with a relatively focused investment in research and development. Our research and development expense was $2.32 billion , $1.98 billion and $1.76 billion in 2012 , 2011 and 2010 , respectively. These amounts included stock-based compensation expense for employees engaged in research and development of $368 million , $363 million and $342 million in 2012 , 2011 and 2010 , respectively. We have design centers throughout the United States, including our principal design facilities in Irvine, California and Santa Clara County, California. Internationally, we have design facilities in Asia, Europe, Israel and Canada. We anticipate establishing additional design centers in the United States and in other countries.
The cyclicality and seasonality of our industry growth do not meaningfully affect our R&D costs on an absolute dollar basis, but can affect
our R&D costs as a percentage of revenue. We endeavor to manage our cost structure to attain long-term business objectives, rather than focusing on short-term profit targets. We view the predictability and stability of our engineering base as a source of competitive advantage. Accordingly, when necessary, we endeavor to reduce research and development costs primarily through slowing incremental hiring or through selectively exiting certain markets, and we typically only resort to broader staffing reductions when we believe our cash flow from operations is at risk of dropping below certain thresholds. Manufacturing
Wafer Fabrication
We depend on multiple foundry subcontractors located in Asia to manufacture a majority of our products. Our key silicon foundries are:
7
• Alcatel-Lucent • Motorola Mobility
• Apple • Netgear
• Cisco • Nokia
• Dell • Pace
• EchoStar • Samsung
• Hewlett-Packard • Thomson
• Huawei Technologies • ZTE
• Humax
• Taiwan Semiconductor Manufacturing Corporation in Taiwan; • United Microelectronics Corporation in Singapore and Taiwan; • Semiconductor Manufacturing International Corporation in China; and • GlobalFoundries, Inc. (formerly Chartered Semiconductor Manufacturing) in Singapore.

Table of Contents
By subcontracting manufacturing, we focus resources on design and test applications where we believe we have greater competitive
advantages. This strategy also avoids the high capital cost of owning and operating semiconductor wafer fabrication facilities. See “ Risk Factors ” under Item 1A of this Report for a discussion of the risks associated with our dependence on independent foundry subcontractors.
Most of our products are manufactured using complementary metal oxide semiconductor, or CMOS, process technology. Our products are
currently fabricated on a variety of processes ranging from 500 nanometers to 28 nanometers. We generally evaluate the benefits, on a product-by-product basis, of migrating to smaller geometry process technologies. Approximately 60% of our products are currently manufactured in 65 nanometers (with an increasing number of products being manufactured in 40 nanometers). We are designing most new products in 40 nanometers, 28 nanometers and 20 nanometers, and are beginning to evaluate FinFET technologies. See “ Risk Factors ” under Item 1A of this Report for a discussion of the risks associated with transitioning to smaller geometry process technologies.
Assembly and Test
Our products are tested at either the wafer level and/or the packaged finished products level. Our product testing is conducted by independent foundries, and independent test subcontractors. The die are assembled into finished products by independent assembly and package subcontractors. A majority of our test and assembly is performed by the following independent subcontractors:
See “ Risk Factors ” under Item 1A of this Report for a discussion of the risks associated with our dependence on third party assembly and
test subcontractors.
Quality Assurance
We consider product reliability from the initial stage of the design cycle through each specific design process, from layout through testing. Our operations and quality engineering teams closely manage the interface between manufacturing and design engineering. We evaluate each assembly and foundry subcontractor. We also participate in quality and reliability monitoring by reviewing electrical and parametric data from our wafer foundry and assembly subcontractors. We closely monitor wafer foundry production to ensure consistent overall quality, reliability and yield levels. All of our principal independent foundries and package assembly facilities are currently ISO 9001 certified, a comprehensive International Standards Organization specified quality system acknowledgment. As part of our total quality program, we received ISO 9001 certification for our Singapore distribution facility.
Environmental Management
We assess the environmental impact of our products to international standards. Our manufacturing subcontractors have registered our manufacturing flow to ISO 14000, the international standard related to environmental management. Lead-free solutions in electronic components and systems are receiving increasing attention within the semiconductor industry. Our products are compliant with the Restriction of Hazardous Substances Directive, or RoHS, the European legislation that restricts the use of a number of substances, including lead, and current European REACH (Regulation, Evaluation and Authorization of Chemicals) laws.
Product Distribution
Due largely to the location of our customers and their fabrication facilities, the majority of our products are shipped internationally to customers through our distribution center in Singapore and a smaller portion domestically via an operations and distribution center in Irvine, California. Net product revenue derived from actual shipments to international destinations, primarily in Asia represented 96.8% , 96.9% and 95.6% of our net revenue in 2012 , 2011 and 2010 , respectively.
8
• Advanced Semiconductor Engineering (ASE) in Singapore, China and Taiwan (test, assembly and packaging); • Siliconware Precision in Taiwan (test, assembly and packaging); • United Test and Assembly Center in Singapore, China and Thailand (test, assembly and packaging); • Amkor in Korea, Philippines, Taiwan and China (assembly and packaging only); • STATSChipPAC in Singapore, Korea, Malaysia and China (test, assembly and packaging); and • Signetics in Korea (assembly and packaging only).
Table of Contents Sales and Marketing
Our sales and marketing strategy is to achieve design wins with technology leaders by providing quality, state-of-the-art products, superior engineering execution, and superior sales, field application and engineering support. We market and sell our products in the United States through a direct sales force, distributors and manufacturers’ representatives. The majority of our domestic sales occur through our direct sales force, which is based in offices located in California and throughout the United States. We market and sell our products internationally through regional offices primarily in Asia, Europe and North America, as well as through a network of independent and fulfillment distributors and representatives in Asia, Australia, Europe and North America. We or our customers select these independent entities based on their ability to provide effective field sales, marketing communications and technical support to our customers. All international sales to date have been in U.S. dollars. We present revenue from independent customers by geographic area in Note 11 of Notes to Consolidated Financial Statements, included in Part IV, Item 15 of this Report. Backlog
Our sales are primarily made through standard purchase orders for delivery of products. We follow industry practice that allows customers to cancel, change or defer orders with limited advance notice prior to shipment. Given this practice, we do not believe that backlog is a reliable indicator of future revenue levels. Competition
The semiconductor industry in general, and wired and wireless communications markets in particular, are intensely competitive and are characterized by rapid change, evolving standards, short product life cycles and price erosion. We believe that the principal factors of competition for integrated circuit providers include:
We believe that we currently compete favorably with respect to each of these factors. We compete with a number of major domestic and international suppliers of integrated circuits and related applications. We also compete
with suppliers of system-level and motherboard-level solutions incorporating integrated circuits that are proprietary or sourced from manufacturers other than Broadcom. This competition, along with Moore's law, has resulted and will continue to result in declining average selling prices for our products in certain markets. We also may face competition from newly established competitors, suppliers of products based on new or emerging technologies, and customers that choose to develop their own silicon solutions. We expect to encounter continuing consolidation in the markets in which we compete.
Some of our competitors operate their own fabrication facilities and have longer operating histories and presence in key markets, greater
name recognition, larger customer bases and significantly greater financial, sales and marketing, manufacturing, distribution and other resources than we do. As a result, these competitors may be able to adapt more quickly to new or emerging technologies and changes in customer requirements or devote greater resources to the promotion and sale of their products. Current and potential competitors have established or may establish financial or strategic relationships among themselves or with existing or potential customers, resellers or other third parties, and may refuse to provide us with information necessary to permit the interoperability of our products with theirs. Accordingly, it is possible that new competitors or alliances among competitors could emerge and rapidly acquire significant market share. In addition, competitors may develop technologies that more effectively address our markets with products that offer enhanced features, lower power requirements or lower costs. Increased competition could result in pricing pressures, decreased gross margins and loss of market share and may materially and adversely affect our business, financial condition and results of operations. See “ Risk Factors ” under Item 1A of this Report for further discussion of the risks associated with competition.
9
• product quality and reputation • market presence
• product capabilities • standards compliance
• level of integration • system cost
• engineering execution and scale • intellectual property
• reliability • customer interface and support
• power efficiency • time-to-market
Table of Contents Seasonality
An increasing number of our products are being incorporated into consumer electronic products, which are subject to seasonality and fluctuations in demand, and tend to have stronger sales in the middle of the fiscal year as manufacturers prepare for the major holiday selling seasons.
Intellectual Property
Our success and future product revenue growth depend, in part, on our ability to protect our intellectual property. We rely primarily on patents, copyrights, trademarks and trade secrets, as well as nondisclosure agreements and other methods, to protect our proprietary technologies and processes. However, these may not provide meaningful or adequate protection for our intellectual property.
We currently hold more than 7,800 U.S. and more than 3,100 foreign patents (up from more than 6,000 U.S. and more than 2,550 foreign
patents from the prior year) and have more than 7,700 additional U.S. and foreign pending patent applications. We believe that no single patent is solely responsible for protecting our products and that the duration of our patents is adequate relative to the expected lives of our products.
We generally enter into confidentiality agreements with our employees and strategic partners, and typically control access to and
distribution of product documentation and other proprietary information. Despite these precautions, it is possible that competitors or other unauthorized third parties may obtain, copy, use or disclose our technologies and processes, develop similar technology independently, or design around our patents. As such, any rights granted under our patents may not provide us with meaningful protection. In addition, we may not be able to successfully enforce our patents against infringing products in every jurisdiction. See “ Risk Factors ” under Item 1A of this Report for further discussion of the risks associated with patents and intellectual property.
Some or all of our patents have in the past been licensed and likely will in the future be licensed to certain of our competitors through
cross-license agreements, such as the Qualcomm Agreement. See the detailed discussion in the “ Overview ” section in Item 7. Management’s Discussion and Analysis of Financial Condition and Results of Operations . Moreover, because we have participated and continue to participate in developing various industry standards, we may be required to license some of our patents to others, including competitors, who develop products based on those standards.
Companies in and related to the semiconductor industry and the wired and wireless communications markets often aggressively protect
and pursue their intellectual property rights. We are currently engaged in litigation and may need to engage in additional litigation to enforce our intellectual property rights or the rights of our customers, to protect our trade secrets, or to determine the validity and scope of proprietary rights of others, including our customers. In addition, we are currently engaged in litigation and may engage in future litigation with parties that claim that we infringed their patents or misappropriated or misused their trade secrets. Such litigation will result in substantial costs and diversion of our resources and could materially and adversely affect our business, financial condition and results of operations. For a detailed description of our outstanding intellectual property litigation, see Note 9 of Notes to Consolidated Financial Statements, included in Part IV, Item 15 of this Report.
Employees
As of December 31, 2012 we had approximately 11,300 employees, including 8,700 individuals engaged in research and development, 1,050 engaged in sales and marketing, 700 engaged in manufacturing operations, and 850 engaged in general and administrative activities. Our employees are not represented by any collective bargaining agreement, and we have never experienced a work stoppage. We believe our employee relations are good. Item 1A . Risk Factors
Before deciding to purchase, hold or sell our common stock, you should carefully consider the risks described below in addition to the
other information contained in this Report and in our other filings with the SEC, including subsequent reports on Forms 10-Q and 8-K. The risks and uncertainties described below are not the only ones we face. Additional risks and uncertainties not presently known to us or that we currently deem immaterial may also affect our business. If any of these known or unknown risks or uncertainties actually occurs with material adverse effects on Broadcom, our business, financial condition, results of operations and/or liquidity could be seriously harmed. In that event, the market price for our Class A common stock will likely decline, and you may lose all or part of your investment.
10

Table of Contents Our quarterly operating results may fluctuate significantly.
Our quarterly net revenue and operating results have fluctuated significantly in the past and are likely to continue to vary from quarter to quarter. Variability in the nature of our operating results may be attributed to the factors identified throughout this “Risk Factors” section, many of which may be outside our control, including:
We depend on a few significant customers for a substantial portion of our revenue.
We derive a substantial portion of our revenue from sales to a relatively small number of customers. Contributions to our net revenue by
these customers have increased in the last several years. Sales to our five largest customers represented 47.2% , 42.6% and 38.6% of our total net revenue in 2012 , 2011 and 2010 , respectively. We expect that our largest customers will continue to account for a substantial portion of our total net revenue for the foreseeable future. The loss of any significant customer could materially and adversely affect our financial condition and results of operations. Also, as our significant customers become larger relative to our business and the industry, they may be able to leverage pricing pressure through the supply chain, vertical integration or other avenues, thereby adversely affecting our gross margins.
A significant portion of our revenue in any period may also depend on a single product design win with a large customer. As a result, the
loss of any such key design win or any significant delay in the ramp of volume production of the customer’s products into which our product is designed could materially and adversely affect our financial condition and results of operations. We may not be able to maintain sales to certain of our key customers or continue to secure key design wins for a variety of reasons, including:
In addition, the vast majority of our licensing revenue and related income to date has been derived from our agreement with Qualcomm.
From April 2009 through December 2012 , we recorded $771 million in income derived from this agreement and we expect to record an additional $86 million in 2013. The income from the Qualcomm Agreement is non-recurring and will terminate in April 2013. There can be no assurances that we will be able to enter into additional such arrangements of this magnitude in the future, or that we will be able to successfully collect the remaining payments due to us under the Qualcomm Agreement in the event of a default by Qualcomm.
The loss of a key customer or design win, a reduction in sales to any key customer, decrease in licensing revenue and related income,
significant delay in our customers’ product development plans, or our inability to attract new significant customers or secure new key design wins could seriously impact our revenue and materially and adversely affect our results of operations.
11
• changes in economic conditions in the markets we address, including the continuing volatility in the technology sector and semiconductor industry;
• seasonality in sales of consumer and enterprise products in which our products are incorporated; • our dependence on a few significant customers and/or design wins for a substantial portion of our revenue; • timing, rescheduling or cancellation of significant customer orders and our ability, as well as the ability of our customers, to manage
inventory; • changes in customer product needs and market acceptance of our products; • competitive pressures and other factors such as the qualification, availability and pricing of competing products and technologies and
the resulting effects on sales and pricing of our products; • the impact of a significant natural disaster, such as an earthquake, severe weather, tsunami or other flooding, or a nuclear crisis, as
well as interruptions or shortages in the supply of utilities such as water and electricity, in a key location such as our corporate headquarters or our Northern California facilities, both of which are located near major earthquake fault lines, in our Singapore distribution center or in a key location of one of our suppliers, foundries or customers;
• the impact of enterprise system failures or network disruptions, the lack of system redundancies, and the potential failure of our disaster recovery planning to cover various unanticipated occurrences; and
• the impact of tax examinations.
• agreements with our customers typically do not require them to purchase a minimum quantity of our products; and • our customers can stop incorporating our products into their own products with limited notice to us and suffer little or no penalty.

Table of Contents We face intense competition.
The semiconductor industry and the wired and wireless communications markets are intensely competitive. We expect competition to continue to increase as new markets develop, as industry standards become well known and as other competitors enter our business. We expect to encounter further consolidation in the markets in which we compete.
Some of our competitors have longer operating histories and presences in key markets, greater name recognition, larger customer bases,
and significantly greater financial, sales and marketing, manufacturing, distribution, technical and other resources than we do, and in some cases operate their own fabrication facilities. These competitors may be able to adapt more quickly to new or emerging technologies and changes in customer requirements. They may also be able to devote greater resources to the promotion and sale of their products. We also face competition from newly established competitors, suppliers of products, and customers who choose to develop their own semiconductor solutions.
Existing or new competitors may develop technologies that more effectively address our markets with products that offer enhanced
features and functionality, lower power requirements, greater levels of integration or lower cost. Increased competition also has resulted in and is likely to continue to result in increased expenditures on research and development, declining average selling prices, reduced gross margins and loss of market share in certain markets. These factors in turn create increased pressure to consolidate. We cannot assure you that we will be able to continue to compete successfully against current or new competitors. If we do not compete successfully, we may lose market share in our existing markets and our revenues may fail to increase or may decline.
Our operating results may be adversely impacted by worldwide economic uncertainties and specific conditions in the markets we address.
We operate primarily in the semiconductor industry, which is cyclical and subject to rapid change and evolving industry standards. From time to time, the semiconductor industry has experienced significant downturns characterized by decreases in product demand, excess customer inventories and accelerated erosion of prices. The semiconductor industry also periodically experiences increased demand and production capacity constraints, which may affect our ability to ship products. An increasing number of our products are being incorporated into consumer electronic products, which are subject to significant seasonality and fluctuations in demand. Economic volatility can cause extreme difficulties for our customers and vendors in accurately forecasting and planning future business activities. This unpredictability could cause our customers to reduce spending on our products and services, which would delay and lengthen sales cycles. Furthermore, during challenging economic times our customers and vendors may face challenges in gaining timely access to sufficient credit, which could impact their ability to make timely payments to us. As a result, we may experience growth patterns that are different than the demand for our customers' products, particularly during periods of high volatility.
We cannot predict the timing, strength or duration of any economic slowdown or recovery or the impact of such events on our customers,
our vendors or us. The combination of our lengthy sales cycle coupled with challenging macroeconomic conditions and supply chain cross-dependencies could have a compound impact on our business. The impact of market volatility is not limited to revenue but may also affect our product gross margins and other financial metrics. Any downturn in the semiconductor industry may be severe and prolonged, and any failure of the industry or wired and wireless communications markets to fully recover from downturns could seriously impact our revenue and harm our business, financial condition and results of operations. We may fail to adjust our operations in response to changes in demand.
Through internal growth and acquisitions, we significantly modified the scope of our operations and workforce in recent years. Our operations are characterized by a high percentage of costs that are fixed or difficult to reduce in the short term, such as research and development expenses related to our highly skilled workforce. During some periods, our growth has placed a significant strain on our management personnel, systems and resources. To respond to periods of increased demand, we will be required to expand, train, manage and motivate our workforce, and to upgrade or enhance our existing IT systems. For example, over the next three years, we plan to upgrade our enterprise resource planning system. We may not be successful in implementing new systems, which could involve business disruptions, including impeding the shipment of our products.
If we are unable to effectively manage our expanding operations, we may be unable to adjust our business quickly enough to meet
competitive challenges or exploit potential market opportunities. Conversely, we may scale our business too quickly and the rate of increase in our expenses may exceed the rate of increase in our revenue, causing the need to implement restructuring actions and a number of other cost saving measures. Any of these circumstances could materially and adversely affect our current or future business.
12

Table of Contents
Our stock price is highly volatile.
The market price of our Class A common stock has fluctuated substantially in the past and is likely to continue to be highly volatile and subject to wide fluctuations. From January 1, 2010 through December 31, 2012 our Class A common stock has traded at prices as low as $26.40 and as high as $47.39 per share. Fluctuations have occurred and may continue to occur in response to various factors, many of which we cannot control.
In addition, the market prices of securities of Internet-related, semiconductor and other technology companies have been and remain
volatile. This volatility has significantly affected the market prices of securities of many technology companies for reasons frequently unrelated to the operating performance of the specific companies. If our operating results do not meet the expectations of securities analysts or investors, who may derive their expectations by extrapolating data from recent historical operating results, the market price of our Class A common stock will likely decline. Accordingly, you may not be able to resell your shares of common stock at or above the price you paid. In the past, we, and other companies that have experienced volatility in the market price of their securities, have been the subject of securities class action litigation.
Due to the nature of our compensation programs, most of our executive officers sell shares of our common stock each quarter or otherwise
periodically, often pursuant to trading plans established under Rule 10b5-1 of the Securities Exchange Act of 1934, as amended, or the Exchange Act. As a result, sales of shares by our executive officers may not be indicative of their respective opinions of Broadcom’s performance at the time of sale or of our potential future performance. Nonetheless, the market price of our stock may be affected by sales of shares by our executive officers.
We may be required to defend against alleged infringement of intellectual property rights of others and/or may be unable to adequately protect or enforce our own intellectual property rights.
Companies in the semiconductor industry and the wired and wireless communications markets aggressively protect and pursue their intellectual property rights. From time to time, we receive notices that claim we have infringed upon, misappropriated or misused other parties’ proprietary rights. Additionally, we receive notices that challenge the validity of our patents. Some of these notices involve "non-practicing entities," or NPEs, asserting claims addressing certain of our products. Intellectual property litigation can be expensive, time consuming and distracting to management. An adverse determination in any of these types of disputes could prevent us from manufacturing or selling some of our products or could prevent us from enforcing our intellectual property rights. Further, settlements can involve royalty or other payments that could reduce our profit margins and adversely affect our financial results.
We may also be required to indemnify some customers and strategic partners under our agreements if a third party alleges or if a court
finds that our products or activities have infringed upon, misappropriated or misused another party’s proprietary rights. We have received requests from certain customers and strategic partners to include increasingly broad indemnification provisions in our agreements with them. These indemnification provisions may, in some circumstances, extend our liability beyond the products we provide to include liability for combinations of components or system level designs and for consequential damages and/or lost profits. Even if claims or litigation against us are not valid or successfully asserted, these claims could result in significant costs and diversion of the attention of management and other key employees to defend.
Our products may contain technology provided to us by other parties such as contractors, suppliers or customers. We may have little or no
ability to determine in advance whether such technology infringes the intellectual property rights of a third party. Our contractors, suppliers and licensors may not be required to indemnify us in the event that a claim of infringement is asserted against us, or they may be required to indemnify us only up to a maximum amount, above which we would be responsible for any further costs or damages. Any of these claims or litigation may materially and adversely affect our business, financial condition and results of operations.
Furthermore, our success and future revenue growth will depend, in part, on our ability to protect our intellectual property. It is possible
that competitors or other unauthorized third parties may obtain, copy, use or disclose our technologies and processes, or confidential employee, customer or supplier data. Any of our existing or future patents may be challenged, invalidated or circumvented. We engage in litigation to enforce or defend our intellectual property rights, protect our trade secrets, or determine the validity and scope of the proprietary rights of others, including our customers. We also enter into confidentiality agreements with our employees, consultants and strategic partners and control access to and distribution of our technologies, documentation and other proprietary information. Despite these efforts, internal or external parties may attempt to copy, disclose, obtain or use our products, services or technology without our authorization. If we cannot adequately protect our technology, our competitors may be able to offer products similar to ours.
13
Table of Contents
Our software may be derived from “open source” software, which is generally made available to the public by its authors and/or other third parties. Open source software is often made available under licenses, which impose certain obligations in the event we distribute derivative works of the open source software. These obligations may require us to make source code for the derivative works available to the public, and/or license such derivative works on different terms than those customarily used to protect our intellectual property. With respect to our proprietary software, we generally license such software under terms that prohibit combining it with open source software. Despite these restrictions, parties may combine our proprietary software with open source software without our authorization, in which case we might nonetheless be required to release the source code of our proprietary software.
We cannot assure you that our efforts to prevent the misappropriation or infringement of our intellectual property or the intellectual property of our customers will succeed. Identifying unauthorized use of our products and technologies is difficult and time consuming. The initiation of litigation may adversely affect our relationships and agreements with certain customers that have a stake in the outcome of the litigation proceedings. Litigation is very expensive and may divert the attention of management and other key employees from the operation of the business, which could negatively impact our business and results of operations.
We are subject to order and shipment uncertainties.
It is difficult to accurately predict demand for our semiconductor products. We typically sell products pursuant to purchase orders rather than long-term purchase commitments. Customers can generally cancel, change or defer purchase orders on short notice without incurring a significant penalty. Our ability to accurately forecast customer demand is further impaired by delays inherent in our lengthy sales cycle. We operate in a dynamic industry and use significant resources to develop new products for existing and new markets. After we have developed a product, there is no guarantee that our customers will integrate our product into their equipment or devices and, ultimately, bring those equipment and devices incorporating our product to market. In these situations, we may never produce or deliver a significant number of our products, even after incurring substantial development expenses. From the time a customer elects to integrate our solution into their product, it is typically six to 24 months before high volume production of that product commences. After volume production begins, we cannot be assured that the equipment or devices incorporating our product will gain market acceptance.
Our products are incorporated into complex devices and systems, creating supply chain cross-dependencies. Accordingly, supply chain
disruptions affecting components of our customers’ devices and/or systems could negatively impact the demand for our products, even if the supply of our products is not directly affected.
Our product demand forecasts are based on multiple assumptions, each of which may introduce error into our estimates. In the event we
overestimate customer demand, we may allocate resources to manufacturing products that we may not be able to sell. As a result, we could hold excess or obsolete inventory, which would reduce our profit margins and adversely affect our financial results. Conversely, if we underestimate customer demand or if insufficient manufacturing capacity is available, we could forego revenue opportunities and potentially lose market share and damage our customer relationships. Also, due to our industry’s use of “just-in-time” inventory management, any disruption in the supply chain could lead to more immediate shortages in product or component supply. Additionally, any enterprise system failures, including in connection with implementing new systems, could impact our ability to fulfill orders and interrupt other processes.
A portion of our inventory is maintained under hubbing and distribution arrangements whereby products are delivered to a customer or
third party warehouse based upon the customer’s projected needs. Under these arrangements, we do not recognize product revenue until the customer reports that it has removed our product from the warehouse to incorporate into its end products. Our ability to effectively manage inventory levels may be impaired under such arrangements, which could increase expenses associated with excess and obsolete product inventory and negatively impact our cash flow.
We manufacture and sell complex products and may be unable to successfully develop and introduce new products.
We expect that a high percentage of our future sales will come from sales of new products. We sell products in markets that are characterized by rapid technological change, evolving industry standards, frequent new product introductions and short product life cycles. The markets for some of these products are new to us and may be immature and/or unpredictable. These markets may not develop into profitable opportunities and we have in the past invested substantial resources in emerging technologies that did not achieve the market acceptance that we had expected. As a result, it is difficult to anticipate our future revenue streams from, or the sustainability of, our new products.
Our industry is dynamic and we are required to devote significant resources to research and development to remain competitive. Such
costs increase with the advancement of technologies and manufacturing in smaller geometry processes,
14

Table of Contents which can adversely affect our operating margin. The development of new silicon devices is highly complex, and due to supply chain cross-dependencies and other issues, we may experience delays in completing the development, production and introduction of our new products. We may choose to discontinue one or more products or product development programs to dedicate more resources to other products. The discontinuation of an existing or planned product may adversely affect our relationship with one or more of our customers and/or could cause us to incur an impairment charge.
Our ability to successfully develop and deliver new products will depend on various factors, including our ability to:
If we are not able to develop and introduce new products in a cost effective and timely manner, we will be unable to attract new customers
or to retain our existing customers which would materially and adversely affect our results of operations. We have experienced hardware and software defects and bugs associated with the introduction of our highly complex products. If any of
our products contain defects or bugs, or have reliability, quality, security or compatibility problems, our reputation may be damaged and customers may be reluctant to buy our products. These problems could interrupt or delay sales and shipments of our products to customers. To alleviate these problems, we may have to divert our resources from other development efforts. In addition, these problems could result in claims against us by our customers or others, including possible claims for consequential damages and/or lost profits. As we transition to manufacturing our products in smaller geometry processes, such as 28 nanometers and below, these risks are enhanced.
We depend on third parties to fabricate, assemble and test our products.
As a fabless semiconductor company, we do not own or operate fabrication, assembly or test facilities. We rely on third parties to
manufacture, assemble and test substantially all of our semiconductor devices. Accordingly, we cannot directly control our product delivery schedules and quality assurance. This lack of control could result in product shortages or quality assurance problems. These issues could delay shipments of our products or increase our assembly or testing costs. In addition, the consolidation of foundry subcontractors, as well as the increasing capital intensity and complexity associated with fabrication in smaller process geometries has limited our diversity of suppliers and increased our risk of a "single point of failure." Specifically, as we move to smaller geometries, we have become increasingly reliant on TSMC for the manufacture of product at and below 40 nanometers. The lack of diversity of suppliers could also drive increased wafer prices, adversely affect our results of operations, including our product gross margins.
We do not have long-term agreements with any of our direct or indirect suppliers, including our manufacturing, assembly or test
subcontractors. We typically procure services from these suppliers on a per order basis. In the event our third-party foundry subcontractors experience a disruption or limitation of manufacturing, assembly or testing capacity, we may not be able to obtain alternative manufacturing, assembly and testing services in a timely manner, or at all. Furthermore, our foundries must have new manufacturing processes qualified if there is a disruption in an existing process, which could be time-consuming. We could experience significant delays in product shipments if we are required to find alternative manufacturers, assemblers or testers for our products. We are continuing to develop relationships with additional third-party subcontractors to assemble and test our products.
Because we rely on outside foundries and other third party suppliers, we face several significant risks in addition to those discussed above,
including:
The manufacture of integrated circuits is a highly complex and technologically demanding process. Our foundries have from time to time
experienced lower than anticipated manufacturing yields. This often occurs during the production of new
15
• effectively identify and capitalize upon opportunities in new markets; • timely complete and introduce new integrated products; • transition our semiconductor products to increasingly smaller line width geometries; • obtain sufficient foundry capacity (including at smaller geometry processes) and packaging materials; • license any desired third party technology or intellectual property rights; and • qualify and obtain industry interoperability certification of our products.
• a lack of guaranteed supply of wafers and other components and potential higher wafer and component prices due to supply constraints;
• the limited availability of, or potential delays in obtaining access to, key process technologies; and • the location of foundries and other suppliers in regions that are subject to earthquakes, tsunamis and other natural disasters.

Table of Contents products or the installation and start-up of new process technologies. In addition, we are dependent on our foundry subcontractors to successfully transition to smaller geometry processes. We face risks associated with our acquisition strategy.
A key element of our business strategy involves expansion through the acquisitions of businesses, assets, products or technologies. The expansion of our business through acquisitions allows us to complement our existing product offerings, expand our market coverage, increase our engineering workforce and/or enhance our technological capabilities. We may not be able to identify or consummate future acquisitions or realize the desired benefit from these acquisitions.
We face a number of challenges associated with our acquisition strategy that could disrupt our ongoing business and distract our
management team, including:
Acquisitions can result in increased debt or contingent liabilities. While we believe we will have the ability to service any additional debt
we may potentially issue in connection with acquisitions, our ability to make principal and interest payments when due depends upon our future performance, which will be subject to general economic conditions, industry cycles, and business and other factors affecting our operations, including the other risk factors described in this section, many of which are beyond our control. Acquisitions can also result in adverse tax consequences, warranty or product liability exposure related to acquired assets, additional stock-based compensation expense, write up of acquired inventory to fair value, and the recording and later amortization of amounts related to certain purchased intangible assets, all of which can adversely affect our reported results on a GAAP basis. In addition, we have in the past and may in the future record goodwill and other purchased intangible assets in connection with an acquisition and incur impairment charges in the future. As discussed in the “ Critical Accounting Policies and Estimates ” section in Item 7. Management's Discussion and Analysis of Financial Condition and Results of Operations, we have determined that we currently have goodwill at risk of potential impairment in future periods related to our Infrastructure and Networking reportable segment. We are exposed to risks associated with our international operations.
We currently obtain substantially all of our manufacturing, assembly and testing services from suppliers located outside the United States. Products shipped to international destinations, primarily in Asia, represented 96.8% , 96.9% and 95.6% of our product revenue in 2012 , 2011 and 2010 , respectively. Substantially all of our products are shipped through our logistical facilities in Singapore. In addition, we undertake various sales and marketing activities through regional offices in a number of countries. We intend to continue expanding our international business activities and to open other design and operational centers abroad.
International operations are subject to many inherent risks, including but not limited to:
Our international operations are subject to increasingly complex foreign and U.S. laws and regulations that increase our cost of doing
business in international jurisdictions, including but not limited to anti-corruption laws, such as the Foreign Corrupt Practices Act and the UK Bribery Act and equivalent laws in other jurisdictions, antitrust or competition laws, and data privacy laws, among others. Violations of these laws and regulations could result in fines and penalties, criminal sanctions against us, our officers, or our employees, prohibitions on the conduct of our business and on our ability to offer our products and services in one or more countries, and could also materially affect our reputation, our international expansion efforts, our ability to attract and retain employees, our business, and our operating results. Although we have implemented policies,
16
• lower gross margins, revenue and operating income than originally anticipated at the time of acquisition and other financial challenges;
• delays in the timing and successful integration of an acquired company’s technologies; • the loss of key personnel; and • becoming subject to intellectual property or other litigation.
• political, social and economic instability; • exposure to different business practices and legal and compliance standards; • continuation of overseas conflicts and the risk of terrorist attacks and resulting heightened security; • the imposition of governmental controls and restrictions and unexpected changes in regulatory requirements; • nationalization of business and blocking of cash flows; • logistical delays or disruptions; • changes in taxation and tariffs; and • difficulties in staffing and managing international operations.

Table of Contents procedures and training designed to ensure compliance with these laws and regulations, there can be no complete assurance that any individual employee, contractor, or agent will not violate our policies.
Economic conditions in our primary overseas markets, particularly in Asia, may negatively impact the demand for our products abroad.
Also, all of our international sales to date have been denominated in U.S. dollars. Accordingly, an increase in the value of the U.S. dollar relative to foreign currencies could make our products less competitive in international markets or require us to assume the risk of denominating certain sales in foreign currencies. We anticipate that these factors will impact our business to a greater degree as we further expand our international business activities.
There can be no assurance that we will continue to declare cash dividends.
In January 2010, our Board of Directors adopted a dividend policy pursuant to which Broadcom would pay quarterly dividends on our common stock. In January 2011 and again in January 2012, our Board of Directors increased the quarterly dividend payment. We intend to continue to pay such dividends subject to capital availability and periodic determinations by our Board of Directors that cash dividends are in the best interest of our shareholders and are in compliance with all laws and agreements of Broadcom applicable to the declaration and payment of cash dividends.
Future dividends may be affected by, among other factors:
Our dividend payments may change from time to time, and we cannot provide assurance that we will continue to increase our dividend
payment or declare dividends in any particular amounts or at all. A reduction in our dividend payments could have a negative effect on our stock price.
We may be unable to attract, retain or motivate key personnel.
Our future success depends on our ability to attract, retain and motivate senior management and qualified technical personnel. Competition for these employees is intense. If we are unable to attract, retain and motivate such personnel in sufficient numbers and on a timely basis, we will experience difficulty in implementing our current business and product plans. In that event, we may be unable to successfully meet competitive challenges or to exploit potential market opportunities, which could adversely affect our business and results of operations.
Government regulation may adversely affect our business.
The effects of regulation on our customers or the industries in which they operate may materially and adversely impact our business. For example, the Federal Communications Commission, or FCC, has broad jurisdiction in the United States over many of the devices into which our products are incorporated. FCC regulatory policies that affect the ability of cable or satellite operators or telephone companies to offer certain services to their customers or other aspects of their business may impede sales of our products in the United States. In addition, we may experience delays if a product incorporating our chips fails to comply with FCC emissions specifications.
We and our customers are subject to various import and export laws and regulations. Government export regulations apply to the
encryption or other features contained in some of our products. If we fail to continue to receive licenses or otherwise comply with these regulations, we may be unable to manufacture the affected products at foreign foundries or ship these products to certain customers, or we may incur penalties or fines.
Our business may also be subject to regulation by countries other than the United States. Foreign governments may impose tariffs, duties
and other import restrictions on components that we obtain from non-domestic suppliers and may impose export restrictions on products that we sell internationally. These tariffs, duties or restrictions could materially and adversely affect our business, financial condition and results of operations.
Our product or manufacturing standards could also be impacted by new or revised environmental rules and regulations or other social
initiatives. For instance, the SEC adopted new disclosure requirements in 2012 relating to the sourcing of certain
17
• our views on potential future capital requirements for investments in acquisitions and the funding of our research and development; • use of cash to consummate various acquisition transactions; • stock repurchase programs; • changes in federal and state income tax laws or corporate laws; and • changes to our business model.

Table of Contents minerals from the Democratic Republic of Congo and certain other adjoining countries. Those new rules, which will require reporting in 2014, could adversely affect our costs, the availability of minerals used in our products and our relationships with customers and suppliers.
Our business is subject to potential tax liabilities.
We are subject to income taxes in the United States and various foreign jurisdictions. The amount of income taxes we pay is subject to our interpretation and application of tax laws in jurisdictions in which we file. Changes in current or future laws or regulations, or the imposition of new or changed tax laws or regulations or new related interpretations by taxing authorities in the U.S. or foreign jurisdictions, could adversely affect our results of operations. We are subject to examinations and tax audits. There can be no assurance that the outcomes from these audits will not have an adverse effect on our net operating loss and research and development tax credit carryforwards, our financial position, or our operating results.
In certain foreign jurisdictions, we operate under tax holidays and favorable tax incentives. For instance, in Singapore we operate under tax
holidays, which are effective through March 31, 2014, that reduce taxes on substantially all of our operating income in that jurisdiction. Such tax holidays and incentives often require us to meet specified employment and investment criteria in such jurisdictions. In a period of tight manufacturing capacity, our ability to meet Singaporean content in our products may be more limited, which may have adverse tax consequences. More generally, if any of our tax holidays or incentives are terminated or if we fail to meet the criteria to continue to enjoy such holidays or incentives, our results of operations may be materially and adversely affected. We are in discussions with the Singapore Economic Development Board with respect to tax incentives for periods after March 31, 2014. No assurances can be given that such discussions will be successful. If we are unable to reach an agreement with Singapore (or another jurisdiction that provides similar benefits to those we realize from our current incentives in Singapore), our results of operations and financial position for periods after March 31, 2014 will be adversely affected. Our systems are subject to security breaches and other cybersecurity incidents.
We face attempts by others to penetrate our computer systems and networks to misappropriate our proprietary information and technology or interrupt our business. The reliability and security of our information technology infrastructure and software, and our ability to expand and continually update technologies in response to our changing needs is critical to our business. To the extent that any disruptions or security breaches result in a loss or damage to our data, or in inappropriate disclosure of proprietary information, it could cause significant damage to our reputation and affect our relationships with our customers and ultimately harm our business. Our articles of incorporation and bylaws contain anti-takeover provisions.
Our articles of incorporation and bylaws contain provisions that could make it more difficult for a third party to acquire a majority of our outstanding voting stock. For example, our Board of Directors may also issue shares of Class B common stock in connection with certain acquisitions, which have superior voting rights entitling the holder to ten votes for each share held on matters that we submit to a shareholder vote (as compared to one vote per share in the case of our Class A common stock) as well as the right to vote separately as a class. In addition, our Board of Directors has the authority to fix the rights and preferences of shares of our preferred stock and to issue shares of common or preferred stock without a shareholder vote. These provisions, among others, may discourage certain types of transactions involving an actual or potential change in our control.
Our co-founders and their affiliates may strongly influence the outcome of matters that require the approval of our shareholders.
As of December 31, 2012 our co-founders, directors, executive officers and their respective affiliates beneficially owned 10.0% of our outstanding common stock and held 49.4% of the total voting power held by our shareholders. As a result, the voting power of these shareholders may strongly influence the outcome of matters that require the approval of our shareholders. These matters include the election of our Board of Directors, the issuance of additional shares of Class B common stock, and the approval of most significant corporate transactions, including certain mergers and consolidations and the sale of all or substantially all of our assets. In particular, as of December 31, 2012 our two founders, Dr. Henry T. Nicholas III and Dr. Henry Samueli, beneficially owned a total of 8.9% of our outstanding common stock and held 49.0% of the total voting power held by our shareholders. Because of their significant voting stock ownership, we may not be able to engage in certain transactions, and our shareholders may not be able to effect certain actions or transactions, without the approval of these shareholders. Repurchases of shares of our Class A common stock under our share repurchase program would result in an increase in the total voting power of our co-founders, directors, executive officers and their affiliates, as well as other continuing shareholders.
18

Table of Contents Item 1B. Unresolved Staff Comments
None. Item 2. Properties
We lease facilities in Irvine (our corporate headquarters), Sunnyvale, Santa Clara, San Jose and San Diego, California. These facilities are
our principal design facilities and each includes administration, sales and marketing, research and development and operations functions. We lease additional design facilities throughout the United States.
Internationally, we lease a distribution center that includes engineering design and administrative facilities in Singapore as well as
engineering design and administrative facilities in Asia, Israel, Europe and Canada. In addition, we lease various sales and marketing facilities in the United States and several other countries. We lease our facilities and certain engineering design tools and information systems equipment under operating lease agreements. Our
leased facilities comprise an aggregate of 3.9 million square feet. Our principal facilities in Irvine comprise 0.92 million square feet and have lease terms that expire at various dates through 2017.
We believe that the facilities under lease will be adequate for at least the next 12 months. For additional information regarding our
obligations under property leases, see Note 9 of Notes to Consolidated Financial Statements, included in Part IV, Item 15 of this Report. Item 3. Legal Proceedings
The information set forth under Note 9 of Notes to Consolidated Financial Statements, included in Part IV, Item 15 of this Report, is
incorporated herein by reference. Item 4. Mine Safety Disclosures
Not applicable.
19
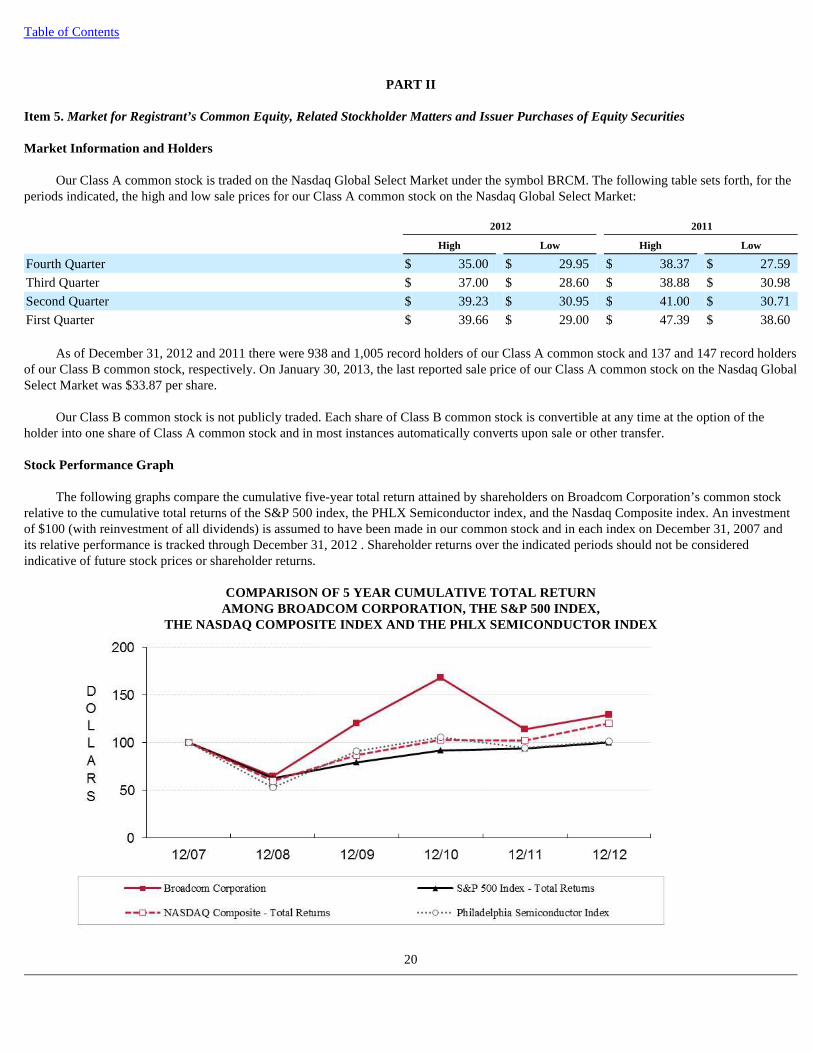
Table of Contents
PART II
Item 5. Market for Registrant’s Common Equity, Related Stockholder Matters and Issuer Purchases of Equity Securities Market Information and Holders
Our Class A common stock is traded on the Nasdaq Global Select Market under the symbol BRCM. The following table sets forth, for the
periods indicated, the high and low sale prices for our Class A common stock on the Nasdaq Global Select Market:
As of December 31, 2012 and 2011 there were 938 and 1,005 record holders of our Class A common stock and 137 and 147 record holders
of our Class B common stock, respectively. On January 30, 2013, the last reported sale price of our Class A common stock on the Nasdaq Global Select Market was $33.87 per share.
Our Class B common stock is not publicly traded. Each share of Class B common stock is convertible at any time at the option of the
holder into one share of Class A common stock and in most instances automatically converts upon sale or other transfer. Stock Performance Graph
The following graphs compare the cumulative five-year total return attained by shareholders on Broadcom Corporation’s common stock
relative to the cumulative total returns of the S&P 500 index, the PHLX Semiconductor index, and the Nasdaq Composite index. An investment of $100 (with reinvestment of all dividends) is assumed to have been made in our common stock and in each index on December 31, 2007 and its relative performance is tracked through December 31, 2012 . Shareholder returns over the indicated periods should not be considered indicative of future stock prices or shareholder returns.
COMPARISON OF 5 YEAR CUMULATIVE TOTAL RETURN
AMONG BROADCOM CORPORATION, THE S&P 500 INDEX, THE NASDAQ COMPOSITE INDEX AND THE PHLX SEMICONDUCT OR INDEX
20
2012 2011
High Low High Low
Fourth Quarter $ 35.00 $ 29.95 $ 38.37 $ 27.59 Third Quarter $ 37.00 $ 28.60 $ 38.88 $ 30.98 Second Quarter $ 39.23 $ 30.95 $ 41.00 $ 30.71 First Quarter $ 39.66 $ 29.00 $ 47.39 $ 38.60

Table of Contents Dividend Policy
In January 2010 our Board of Directors adopted a dividend policy pursuant to which we intend to pay quarterly cash dividends on our
common stock. Our Board of Directors declared quarterly cash dividends of $0.08 per common share payable to holders of our common stock in each quarter of 2010. In January 2011 and 2012 our Board of Directors adopted amendments to the existing dividend policy pursuant to which we increased the quarterly cash dividend to $0.09 and $0.10 per common share, respectively, and declared quarterly cash dividends payable to holders of our common stock in each quarter of 2011 and 2012. In 2012 , 2011 and 2010 we paid $224 million , $194 million and $164 million , respectively, in dividends to holders of our Class A and Class B common stock. These dividends were paid from U.S. domestic sources other than our retained earnings and are accounted for as reductions of shareholders’ equity.
The cash dividend policy and the payment of future cash dividends under that policy are subject to the Board’s continuing determination
that the dividend policy and the declaration of dividends thereunder are in the best interests of our shareholders and are in compliance with all laws and agreements of Broadcom applicable to the declaration and payment of cash dividends. Recent Sales of Unregistered Securities
In 2012 we issued an aggregate of 2 million shares of Class A common stock upon conversion of a like number of shares of Class B
common stock in connection with their disposition. Each share of Class B common stock is convertible at any time into one share of Class A common stock at the option of the holder. The offers and sales of those securities were effected without registration in reliance on the exemption from registration provided by Section 3(a)(9) of the Securities Act of 1933, as amended, or the Securities Act. Issuer Purchases of Equity Securities
In February 2010, we announced that our Board of Directors had authorized an evergreen share repurchase program intended to offset
dilution associated with our stock incentive plans. The maximum number of shares of our Class A common stock that may be repurchased in any one year under this program (including under an accelerated share repurchase or other arrangement) is equal to the total number of shares issued pursuant to our equity awards in the previous year and the current year. This program does not have an expiration date and may be suspended at any time at the discretion of the Board of Directors. It may also be complemented with an additional share repurchase program in the future.
The following table presents details of our various repurchases during the three months ended December 31, 2012 :
Repurchases under our share repurchase programs were and are intended to be made in open market or privately negotiated transactions in
compliance with Rule 10b-18 promulgated under the Exchange Act.
21
Period Total Number of Shares Purchased
Average Price per Share
Total Number of Shares Purchased as
Part of Publicly Announced Plans
Approximate Dollar Value of Shares That May yet be Purchased
under the Plans
(In thousands, except per share data)
October 2012 400 $ 31.75 400
November 2012 601 31.88 601
December 2012 — — —
Total 1,001 $ 31.83 1,001 N/A

Table of Contents Item 6. Selected Consolidated Financial Data
22
Year Ended December 31,
2012 2011 2010 2009 2008
(In millions, except per share data)
Consolidated Statements of Income Data
Net revenue:
Product revenue $ 7,793 $ 7,159 $ 6,589 $ 4,271 $ 4,484 Income from Qualcomm Agreement (1) 186 207 206 171 — Licensing revenue 27 23 23 48 174
Total net revenue 8,006 7,389 6,818 4,490 4,658 Costs and expenses:
Cost of product revenue (2) 4,027 3,626 3,284 2,210 2,213 Research and development (2) 2,318 1,983 1,763 1,535 1,498 Selling, general and administrative (2) 696 682 589 479 543 Amortization of purchased intangible assets 113 30 28 15 3 Impairments of long-lived assets 90 92 19 19 172 Restructuring costs (reversals), net 7 16 — 8 (1 )
Settlement costs (gains), net 79 (18 ) 53 118 16 Charitable contribution — 25 — 50 — In-process research and development — — — — 42
Total operating costs and expenses 7,330 6,436 5,736 4,434 4,486 Income from operations 676 953 1,082 56 172 Interest income (expense), net (30 ) (5 ) 9 14 52 Other income (expense), net 10 8 7 2 (1 )
Income before income taxes 656 956 1,098 72 223 Provision for (benefit of) income taxes (63 ) 29 16 7 8 Net income $ 719 $ 927 $ 1,082 $ 65 $ 215
Net income per share (basic) (3) $ 1.29 $ 1.72 $ 2.13 $ 0.13 $ 0.42
Net income per share (diluted) (3) $ 1.25 $ 1.65 $ 1.99 $ 0.13 $ 0.41
Dividends per share $ 0.40 $ 0.36 $ 0.32 $ — $ —
December 31,
2012 2011 2010 2009 2008
(In millions)
Consolidated Balance Sheet Data
Cash and cash equivalents and short-and long-term marketable securities $ 3,722 $ 5,205 $ 4,058 $ 2,368 $ 1,898 Working capital 2,099 4,653 2,913 1,767 2,034 Goodwill and purchased intangible assets, net 5,512 2,187 2,043 1,481 1,341 Total assets 11,208 9,040 7,944 5,127 4,393 Total debt 1,693 1,196 697 — — Total shareholders’ equity 7,839 6,521 5,826 3,892 3,607
(1) Includes income relating to the Qualcomm Agreement that was entered into with Qualcomm in April 2009. See “Overview” section in Item 7. Management’s Discussion and Analysis of Financial Condition and Results of Operations and Notes 1 and 2 to Notes to Consolidated Financial Statements for a further discussion, included in Part IV, Item 15 of this Report.
(2) Includes stock-based compensation expense resulting from stock options and restricted stock units we issued or assumed in acquisitions. See Note 9 of Notes to Consolidated Financial Statements.
(3) See Notes 1 and 2 of Notes to Consolidated Financial Statements for an explanation of the calculation of net income per share.

Table of Contents
The following table presents details of product and total gross margin as a percentage of product and total revenue, respectively:
The following table presents details of total stock-based compensation expense that is included in each functional line item in the
consolidated statements of income data above:
The tables above set forth our selected consolidated financial data. We prepared this information using the consolidated financial
statements of Broadcom for each of the five years ended December 31, 2012 . In addition, the consolidated financial statements include the results of operations of acquisitions commencing on their respective acquisition dates. See Note 3 of Notes to Consolidated Financial Statements.
You should read this selected consolidated financial data together with the Consolidated Financial Statements and related Notes contained
in this Report and in our prior and subsequent reports filed with the SEC, as well as the section of this Report and our other reports entitled “Management’s Discussion and Analysis of Financial Condition and Results of Operations.”
23
Year Ended December 31,
2012 2011 2010 2009 2008
Supplemental Gross Margin Data
Product gross margin 48.3 % 49.4 % 50.2 % 48.3 % 50.6 %
Total gross margin 49.7 50.9 51.8 50.8 52.5
Year Ended December 31,
2012 2011 2010 2009 2008
(In millions)
Supplemental Data on Stock-Based Compensation Expense
Cost of product revenue $ 27 $ 24 $ 23 $ 25 $ 25 Research and development 368 363 342 352 358 Selling, general and administrative 148 126 119 120 126

Table of Contents Item 7. Management's Discussion and Analysis of Financial Condition and Results of Operations
You should read the following discussion and analysis in conjunction with our Consolidated Financial Statements and related Notes thereto included in Part IV, Item 15 of this Report and the “Risk Factors” included in Part I, Item 1A of this Report, as well as other cautionary statements and risks described elsewhere in this Report, before deciding to purchase, hold or sell our common stock. Overview
Broadcom Corporation (including our subsidiaries, referred to collectively in this Report as “Broadcom,” “we,” “our” and “us”) is a global
leader and innovator in semiconductor solutions for wired and wireless communications. Broadcom products seamlessly deliver voice, video, data and multimedia connectivity in the home, office and mobile environments. We provide the industry’s broadest portfolio of state-of-the-art system-on-a-chip, or SoC, and embedded software solutions.
We sell our products to leading wired and wireless communications manufacturers in each of our reportable segments: Broadband
Communications (Home), Mobile and Wireless (Hand), and Infrastructure and Networking (Infrastructure). Because we leverage our technologies across different markets, certain of our integrated circuits may be incorporated into products used in multiple markets. We utilize independent foundries and third-party subcontractors to manufacture, assemble and test all of our semiconductor products.
Operating Results for the Year Ended December 31, 2012
In 2012 our net income was $719 million as compared to net income of $927 million in 2011 . The decrease in profitability was primarily related to (i) lower gross margins due to the amortization of purchased intangible assets and inventory valuation step-up from our acquisition of NetLogic Microsystems, Inc., or NetLogic, in February 2012, (ii) an increase in research and development expenses associated with the acquisitions of NetLogic and BroadLight Inc., or Broadlight and (iii) organic hiring, principally in research and development. In addition, we recorded varying charges related to settlement costs, impairment of certain purchased intangible assets, charitable contributions and non-recurring income tax benefits.
The consolidated financial statements include the results of operations of NetLogic commencing as of the acquisition date and are included
in our Infrastructure and Networking reportable segment. In connection with this acquisition, our results of operations in 2012 included: (i) stock-based compensation of $89 million , of which $17 million related to the accelerated vesting of equity awards upon the termination of certain employees with change in control agreements, (ii) the amortization of purchased intangibles of $190 million , and (iii) the amortization of acquired inventory valuation step-up of $63 million .
Other highlights during 2012 include the following:
24
• Our cash and cash equivalents and marketable securities were $3.72 billion at December 31, 2012 , compared with $5.21 billion at December 31, 2011 . This significant decrease was primarily the result of our acquisitions of NetLogic and BroadLight. We generated cash flow from operations of $1.93 billion during 2012 as compared to $1.84 billion in 2011 .
• In January 2012 our Board of Directors adopted an amendment to the existing dividend policy pursuant to which we increased our quarterly cash dividend by 11.1% to $0.10 per share ($0.40 per share on an annual basis) payable to holders of our common stock.
• In February 2012 we completed our acquisition of NetLogic, a publicly traded company that was a provider of high-performance intelligent semiconductor solutions for next generation networks. In connection with the acquisition, we paid $3.61 billion , exclusive of cash assumed, to acquire all of the outstanding shares of capital stock and other equity rights of NetLogic. The purchase price was paid in cash, except for a portion attributable to certain equity awards which were paid in the form of Broadcom equity awards. The equity awards had a fair value of $349 million , of which $137 million was considered part of the purchase price, and the remaining $212 million was and will be recognized as stock-based compensation expense primarily over the next two to three years from the acquisition date.
• In February 2012 we recorded a favorable adjustment to the provision for income taxes of $46 million relating to the reversal of our valuation allowance. This was directly related to the establishment of a deferred tax liability associated with the step-up of NetLogic acquired identifiable intangible assets allocated to jurisdictions in which the statutory tax rate is above zero.
• In March 2012 we recorded settlement costs of $86 million related to the settlement of patent infringement claims. • In March 2012 we recorded purchased intangible impairment charges of $28 million primarily related to our acquisitions of Dune
Networks, Inc. and Percello Ltd.

Table of Contents
See Note 12 of Notes to Consolidated Financial Statements for details of our quarterly financial data. Our product revenue consists principally of sales of semiconductor devices and, to a lesser extent, software licenses and royalties,
development, support and maintenance agreements, data services and cancellation fees. The majority of our product sales occur through the efforts of our direct sales force. The remaining balance of our product sales occurs through distributors. Our licensing revenue and income is generated from the licensing of our intellectual property, of which the vast majority to date has been derived from our agreement with Qualcomm. The income from the Qualcomm Agreement is non-recurring and will terminate in April 2013. There can be no assurances that we will be able to enter into similar arrangements of this magnitude in the future.
The following table details the amount of income from the Qualcomm Agreement that was recognized or is scheduled to be recognized
from 2009 to 2013:
Product Cycles. The cycle for test, evaluation and adoption of our products by customers can range from three to more than nine
months, with an additional three to more than twelve months before a customer commences volume production of equipment or devices incorporating our products. Due to this lengthy sales cycle, we may experience significant delays from the time we incur expenses for research and development, selling, general and administrative efforts, and investments in inventory, to the time we generate corresponding revenue, if any. The rate of new orders may vary significantly from month to month and quarter to quarter. If anticipated sales or shipments in any quarter do not occur when expected, expenses and inventory levels could be disproportionately high, and our results of operations for that quarter, and potentially for future quarters, would be materially and adversely affected.
Acquisition Strategy. An element of our business strategy involves the acquisition of businesses, assets, products or technologies that
allow us to reduce the time or costs required to develop new technologies and products and bring them to market, incorporate enhanced functionality into and complement our existing product offerings, augment our engineering workforce, and enhance our technological capabilities. Since our initial public offering in 1998, we have acquired over 50 companies. From 2010 through 2012, we made acquisitions totaling $4.53 billion in net cash consideration, of which $340 million , $391 million and $3.80 billion related to our Broadband Communications, Mobile and Wireless, and Infrastructure and Networking reportable segments, respectively. We plan to continue to evaluate strategic opportunities as they arise, including acquisitions and other business combination transactions, strategic relationships, capital infusions and the purchase or sale of assets.
The accompanying Consolidated Financial Statements include the results of operations of our acquired companies commencing on their
respective acquisition dates. See Note 3 of Notes to Consolidated Financial Statements for additional information related to these acquisitions.
25
• In April 2012 we completed our acquisition of BroadLight, a privately held provider of networking and fiber access passive optical network processors. We paid $200 million , exclusive of cash assumed, to acquire all of the outstanding shares of capital stock and other equity rights of BroadLight. The consideration also included Broadcom restricted stock units issued in exchange for certain unvested employee stock options valued at $3 million . Additional consideration of up to $10 million in cash may be paid to the former holders of BroadLight capital stock and other rights upon satisfaction of certain future performance goals.
• In August 2012 we completed a private offering of $500 million aggregate principal amount of 2.500% Senior Notes due 2022. • In September 2012 we recorded purchased intangible impairment charges of $48 million primarily related to our acquisition of
Provigent, Inc.
Recognized Scheduled to be Recognized
2009 2010 2011 2012 2013 Thereafter Total
(In millions)
Income from Qualcomm Agreement $ 171 $ 206 $ 207 $ 186 $ 86 $ — $ 856

Table of Contents Business Enterprise Segments.
The following tables present details of our reportable segments and the “All Other” category:
For additional information about our business enterprise segments and “All Other” category (including revenue and expense items reported
under the "All Other" category), see further discussion in Note 11 of Notes to Consolidated Financial Statements. Factors That May Impact Net Income
Our net income has been affected in the past, and may continue to be affected in the future, by various factors, including, but not limited
to, the following:
Critical Accounting Policies and Estimates
The preparation of financial statements in accordance with U.S. generally accepted accounting principles, or GAAP, requires us to make
estimates and assumptions that affect the reported amounts of assets and liabilities at the date of the financial statements and the reported amounts of net revenue and expenses in the reporting period. We regularly evaluate our estimates and assumptions related to revenue recognition, rebates, allowances for doubtful accounts, sales returns and allowances, warranty obligations, inventory valuation, stock-based compensation expense, goodwill and purchased intangible asset recoverability, strategic investments, deferred income tax asset valuation allowances, uncertain tax positions, tax contingencies, self-insurance liabilities, restructuring costs, litigation and other loss contingencies. We base our estimates and assumptions on current facts, historical experience and various other factors that we believe to be reasonable under the circumstances, the results of which form the basis for making judgments about the carrying values of assets and liabilities and the recording of revenue, costs and expenses that are not readily apparent from other sources. The actual results experienced by
26
Reportable Segments
Broadband
Communications Mobile and
Wireless Infrastructure and
Networking All
Other Consolidated
(In millions) Year Ended December 31, 2012
Net revenue $ 2,156 $ 3,810 $ 1,853 $ 187 $ 8,006 Operating income (loss) 504 562 483 (873 ) 676 Year Ended December 31, 2011
Net revenue $ 2,039 $ 3,483 $ 1,659 $ 208 $ 7,389 Operating income (loss) 391 572 544 (554 ) 953 Year Ended December 31, 2010
Net revenue $ 2,134 $ 2,889 $ 1,588 $ 207 $ 6,818 Operating income (loss) 446 526 579 (469 ) 1,082
• our product mix and volume of product sales and corresponding gross margin (see further discussion below under “ Factors That May Impact Net Revenue ” and “ Factors That May Impact Product Gross Margin ”);
• levels of research and development and other operating costs (organic or acquired); • stock-based compensation expense; • licensing and income from intellectual property; • impairment of goodwill and other long-lived assets; • deferral of revenue and costs under multiple-element arrangements; • amortization of purchased intangible assets; • settlement costs or gains; • cash-based incentive compensation expense; • litigation costs and insurance recoveries; • changes in tax laws, adjustments to tax reserves and the results of income tax audits; • the loss of interest income resulting from lower average interest rates and investment balance reductions resulting from expenditures
on repurchases of our Class A common stock, dividends and acquisitions of businesses; • restructuring costs; • other-than-temporary impairment of marketable securities; and • charitable contributions.

Table of Contents us may differ materially and adversely from our estimates. To the extent there are material differences between our estimates and the actual results, our future results of operations will be affected.
We believe the following are critical accounting policies that require us to make significant estimates, assumptions or judgments:
In arrangements that include a combination of semiconductor products and other elements, judgment is required to properly identify the accounting units of the multiple deliverable transactions and to determine the manner in which revenue should be allocated among the accounting units. We allocate the arrangement consideration based on each element’s relative fair value using vendor-specific objective evidence, or VSOE, third-party evidence, or estimated selling prices, as the basis of fair value. Revenue is recognized for the accounting units when the basic revenue recognition criteria are met. A portion of our sales is made through distributors under agreements allowing for pricing credits and/or rights of return. These pricing credits and/or rights of return provisions prevent us from being able to reasonably estimate the final price of the inventory to be sold and the amount of inventory that could be returned pursuant to these agreements. As a result, the price to the customer is not fixed or determinable at the time we deliver products to our distributors. Accordingly, product revenue from sales made through these distributors is not recognized until the distributors ship the product to their customers. In addition, distributors provide us with periodic data regarding product, price, quantity, and customers when products are shipped to their customers, as well as the quantities of our products that they still have in stock. For specialized shipping terms we may rely on data provided by our freight forwarding providers. For our licensing revenue we rely on data provided by the licensee. Any error in the data provided to us by customers, distributors or other third parties could lead to inaccurate reporting of our total net revenue and net income. We defer revenue and income when advance payments are received from customers before performance obligations have been completed and/or services have been performed. Deferred revenue does not include amounts from products delivered to distributors that the distributors have not yet sold through to their end customers.
The value associated with the transfer of intellectual property rights and other elements was treated as a single unit of accounting and, based on the predominant nature of these elements, recognized within net revenue over the contractual performance period of four years, beginning in 2009 and extending through April 2013. The elements included: (i) an exchange of intellectual property rights, including in certain circumstances, a series of covenants not to assert claims of patent infringement under future patents issued within one to four years of the execution date of the agreement, (ii) the assignment of certain existing patents by Broadcom to Qualcomm with Broadcom retaining a royalty-free license under these patents, and (iii) the settlement of all outstanding litigation and claims between us and Qualcomm. We consider the Qualcomm Agreement as predominantly related to the transfer of current and future intellectual property rights. This conclusion was based on (a) the amounts specifically awarded by the courts for the patents that were the subject of litigation for which appeals had been substantially exhausted and (b) the extensive nature of the rights transferred to Qualcomm, both for our existing patent portfolio and for the patents we would develop during the
27
• Net Revenue. We recognize product revenue when all of the following criteria are met: (i) persuasive evidence of an arrangement exists, (ii) delivery has occurred, (iii) our price to the customer is fixed or determinable and (iv) collection of the resulting accounts receivable is reasonably assured. These criteria are usually met at the time of product shipment. However, we do not recognize revenue when any future performance obligations remain. Customer purchase orders and/or contracts are generally used to determine the existence of an arrangement. Shipping documents are used to verify product delivery. We assess whether a price is fixed or determinable based upon the payment terms associated with the transaction and whether the sales price is subject to refund or adjustment. We assess the collectibility of our accounts receivable based primarily upon the creditworthiness of the customer as determined by credit checks and analysis, as well as the customer’s payment history.
• Income from the Qualcomm Agreement. On April 26, 2009 we entered into a four-year Settlement and Patent License and Non-Assert Agreement, or the Qualcomm Agreement, with Qualcomm. The Qualcomm Agreement is a multiple element arrangement. We allocated the amount to be received under the Qualcomm Agreement amongst several elements. A gain from the settlement of litigation was immediately recognized and approximated the value of awards determined by the United States District Court for the Central District of California. The remaining consideration was predominantly associated with the transfer of current and future intellectual property rights, as well as the settlement of all other outstanding litigation, and is being recognized over the four year performance period as a single unit of accounting.

Table of Contents
next one to four years. In addition, we obtained a third party valuation of the intellectual property rights. The inputs and assumptions we used in this valuation were from a market participant perspective and included projected revenue, royalty rates, estimated discount rates, useful lives and income tax rates, among others. The development of a number of these inputs and assumptions in our model requires a significant amount of management judgment and is based upon a number of factors including the selection of industry comparables, market growth rates and other relevant factors. Changes in any number of these assumptions would have substantially changed the fair value assigned to the intellectual property rights. These inputs and assumptions represent management’s best estimates at the time of the transaction.
28
• Sales Returns, Pricing Adjustments and Allowance for Doubtful Accounts. We record reductions of revenue for estimated product returns and pricing adjustments, such as competitive pricing programs and rebates, in the same period that the related revenue is recorded. The amount of these reductions is based on historical sales returns, analysis of credit memo data, specific criteria included in rebate agreements, and other factors known at the time. We accrue 100% of potential rebates at the time of sale and do not apply a breakage factor. We reverse the accrual of unclaimed rebate amounts as specific rebate programs contractually end and when we believe unclaimed rebates are no longer subject to payment and will not be paid. Thus the reversal of unclaimed rebates may have a positive impact on our net revenue and net income in subsequent periods. Additional reductions of revenue would result if actual product returns or pricing adjustments exceed our estimates. We also maintain an allowance for doubtful accounts for estimated losses resulting from the inability of customers to make required payments. If the financial condition of any customer were to deteriorate, resulting in an impairment of its ability to make payments, additional allowances could be required.
• Inventory Write-Downs and Warranty Reserves. We write down the carrying value of our inventory to net realizable value for estimated obsolescence or unmarketable inventory in an amount equal to the difference between the cost of inventory and its estimated realizable value based upon assumptions about future demand and market conditions. If actual demand and market conditions are less favorable than those projected by management, additional inventory write-downs could be required. Under the hubbing arrangements that we maintain with certain customers, we own inventory that is physically located in a customer’s or third party’s warehouse. As a result, our ability to effectively manage inventory levels may be impaired, which would cause our total inventory turns to decrease. In that event, our expenses associated with excess and obsolete inventory could increase and our cash flow could be negatively impacted. Our products typically carry a one to three year warranty. We establish reserves for estimated product warranty costs at the time revenue is recognized. Although we engage in extensive product quality programs and processes, our warranty obligation has been and may in the future be affected by product failure rates, product recalls, repair or field replacement costs and additional development costs incurred in correcting any product failure, as well as possible claims for consequential costs. Should actual product failure rates, use of materials or service delivery costs differ from our estimates, additional warranty reserves could be required. In that event, our product gross margins would be reduced.
• Stock-Based Compensation Expense. All share-based payments, including grants of stock options, restricted stock units and employee stock purchase rights, are recognized in our financial statements based upon their respective grant date fair values. The fair value of each employee stock option and employee stock purchase right is estimated on the date of grant using an option pricing model that meets certain requirements. We currently use the Black-Scholes option pricing model to estimate the fair value of our stock options and stock purchase rights. Although we utilize the Black-Scholes model, which meets established requirements, the fair values generated by the model may not be indicative of the actual fair values of our equity awards as it does not consider certain factors important to those awards to employees, such as continued employment and periodic vesting requirements as well as limited transferability. The determination of the fair value of share-based payment awards utilizing the Black-Scholes model is affected by our stock price and a number of assumptions, including expected volatility, expected life, risk-free interest rate and expected dividends. We use the implied volatility for traded options on our stock as the expected volatility assumption required in the Black-Scholes model. Our selection of the implied volatility approach is based on the availability of data regarding actively traded options on our stock as we believe that implied volatility is more representative of fair value than historical volatility. The expected life of the stock options is based on historical and other economic data trended into the future. The risk-free interest rate assumption is based on observed interest rates appropriate for the expected terms of our stock options and stock purchase rights. Prior to 2010, our dividend yield assumption excluded dividend payouts. In 2010 we began to pay quarterly dividends and included that assumption in our fair value calculations. The fair value of our restricted stock units is based on the closing market price of our Class A common stock on the date of grant less our expected dividend yield. We evaluate the assumptions used to value stock awards on a quarterly basis. If factors change and we employ different assumptions, stock-based compensation expense may differ significantly from what we have recorded in the past. If there are any modifications or cancellations of the underlying unvested securities, we may be required to accelerate, increase or cancel any remaining unearned stock-based compensation expense. To the
Table of Contents
extent that we grant additional equity securities to employees or we assume unvested securities in connection with any acquisitions, our stock-based compensation expense will be increased by the additional unearned compensation resulting from those additional grants or acquisitions.
Goodwill is recorded as the difference, if any, between the aggregate consideration paid for an acquisition and the fair value of the acquired net tangible and intangible assets. We evaluate goodwill by reporting unit on an annual basis in the fourth quarter or more frequently if we believe indicators of impairment exist. We have identified three reporting units consistent with our reporting segments identified in Note 11 of Notes to the Consolidated Financial Statements: (i) Broadband Communications, (ii) Mobile and Wireless, and (iii) Infrastructure and Networking. In 2011 we early adopted the new provisions issued by the Financial Accounting Standards Board, or FASB, that intended to simplify goodwill impairment testing. The updated guidance permits us to first assess qualitative factors to determine whether it is more likely than not that the fair value of a reporting unit is less than its carrying amount. If we conclude that it is more likely than not that the fair value of a reporting units is less than its carrying amount, we conduct a two-step quantitative goodwill impairment test. The first step of the impairment test involves comparing the fair values of the applicable reporting units with their carrying values. We estimate the fair values of our reporting units using a combination of the income and market approach. If the carrying amount of a reporting unit exceeds the reporting unit’s fair value, we perform the second step of the goodwill impairment test. The second step of the goodwill impairment test involves comparing the implied fair value of the affected reporting unit’s goodwill with the carrying value of that goodwill. The amount, by which the carrying value of the goodwill exceeds its implied fair value, if any, is recognized as an impairment loss. In 2010 we performed the first step of the quantitative goodwill impairment assessment for each of our reporting units and determined no impairment was indicated as the estimated fair value of each of the reporting units exceeded its respective carrying value. In 2011 we made a qualitative assessment of whether goodwill impairment exists and determined that it was more likely than not that the fair value of our reporting units exceeded their carrying values. Therefore, we did not perform the quantitative two-step goodwill impairment test. In 2012 we performed the first step of the quantitative goodwill impairment assessment for each of our reporting units and determined no impairment was indicated as the estimated fair value of each of the reporting units exceeded its respective carrying value. As a result of our NetLogic acquisition in February 2012, we added $1.81 billion of additional goodwill, resulting in our Infrastructure and Networking reporting unit having an allocated goodwill balance of $2.49 billion at December 31, 2012. Based on our asset impairment testing and the increased balance of goodwill due to our acquisition of NetLogic and a number of other companies over the last several years, at December 31, 2012 we determined there was a risk of our Infrastructure and Networking reporting unit failing the first step of the goodwill impairment test in future periods. The level of excess fair value over carrying value for this reporting unit was approximately 19% as of October 1, 2012. For this reporting unit, declines in our stock price or our peers' stock price, relatively small declines in the future performance and cash flows of the reporting unit or small changes in other key assumptions, such as revenue growth rates and discount rates, may result in the recognition of significant impairment charges. During development, IPR&D is not subject to amortization and is tested for impairment annually or more frequently if events or changes in circumstances indicate that the asset might be impaired. The impairment test consists of a comparison of the fair value to its carrying amount. If the carrying value exceeds its fair value, an impairment loss is recognized in an amount equal to that excess. Once an IPR&D project is complete, it becomes a definite lived intangible asset and is evaluated for impairment in accordance with our policy for long-lived assets. We test long lived assets and purchased intangible assets (other than goodwill and IPR&D in development) for impairment if we believe indicators of impairment exist. We determine whether the carrying value of an asset or asset group is recoverable, based on comparisons to undiscounted expected future cash flows the asset are expected to generate. If an asset is not recoverable, we record an impairment loss equal to the amount by which the carrying value of the asset exceeds its fair value. We primarily use the income valuation approach to determine the fair value of our long lived assets and purchased intangible assets.
29
• Goodwill and Purchased Intangible Assets. The value of our goodwill and purchased intangible assets could be impacted by future adverse changes such as: (i) any future declines in our operating results, (ii) a decline in the valuation of technology company stocks, including the valuation of our common stock, (iii) a significant slowdown in the worldwide economy or the semiconductor industry, (iv) any failure to meet the performance projections included in our forecasts of future operating results or (v) the abandonment of any of our acquired in-process research and development, or IPR&D, projects.

Table of Contents
Significant management judgment is required in the forecasts of future operating results that are used in the discounted cash flow method of valuation. It is possible, however, that the plans may change and estimates used may prove to be inaccurate. If our actual results, or the plans and estimates used in future impairment analyses, are lower than the original estimates used to assess the recoverability of these assets, we could incur additional impairment charges.
We account for settlement agreements as multiple element arrangements and allocate the consideration to the identifiable elements based on relative fair value. Generally the identifiable elements are (i) the licensing of intellectual property for future use and (ii) payments related to alleged prior infringement. We continually evaluate the uncertainties associated with litigation and record a liability when it is probable that a loss has been incurred and the amount is reasonably estimable. There is significant judgment required in both the probability determination and as to whether a liability can be reasonably estimated. Accordingly, the outcomes of legal proceedings and/or our ability to settle disputes on terms acceptable to us are subject to significant uncertainty. Should we choose to pay significant sums in settling a dispute or should material legal matters be resolved against us, the operating results of a particular reporting period could be materially adversely affected. Given the complexity of evaluating the probability and range of potential litigation losses, and with appropriately allocating the consideration in multiple element arrangements relating to settlements of intellectual property litigation, we frequently use third-party valuation and law firms to assist us in this regard.
30
• Deferred Taxes and Uncertain Tax Positions. We utilize the asset and liability method of accounting for income taxes. We record a valuation allowance to reduce our deferred tax assets to the amount that we believe is more likely than not to be realized. In assessing the need for a valuation allowance, we consider all positive and negative evidence, including scheduled reversals of deferred tax liabilities, projected future taxable income, tax planning strategies, and recent financial performance. Forming a conclusion that a valuation allowance is not required is difficult when there is negative evidence such as cumulative losses in recent years. As a result of our cumulative losses in the U.S. and certain foreign jurisdictions, our U.S. tax losses after tax deductions for stock-based compensation, and the full utilization of our loss carryback opportunities, we have concluded that a full valuation allowance against our net deferred tax assets is appropriate in the U.S. and certain foreign jurisdictions. In certain other foreign jurisdictions where we do not have cumulative losses, we record valuation allowances to reduce our net deferred tax assets to the amount we believe is more likely than not to be realized. In the future, if we realize a deferred tax asset that currently carries a valuation allowance, we may record a reduction of income tax expense in the period of such realization. Income tax positions must meet a more-likely-than-not recognition threshold to be recognized. Income tax positions that previously failed to meet the more-likely-than-not threshold are recognized in the first subsequent financial reporting period in which that threshold is met. Previously recognized tax positions that no longer meet the more-likely-than-not threshold are derecognized in the first subsequent financial reporting period in which that threshold is no longer met. As a multinational corporation, we are subject to taxation in many jurisdictions, and the calculation of our tax liabilities involves dealing with uncertainties in the application of complex tax laws and regulations in various taxing jurisdictions. If we ultimately determine that the payment of these liabilities will be unnecessary, we reverse the liability and recognize a tax benefit during the period in which we determine the liability no longer applies. Conversely, we record additional tax charges in a period in which we determine that a recorded tax liability is less than we expect the ultimate assessment to be. The application of tax laws and regulations is subject to legal and factual interpretation, judgment and uncertainty. Tax laws and regulations themselves are subject to change as a result of changes in fiscal policy, changes in legislation, the evolution of regulations and court rulings. Therefore, the actual liability for U.S. or foreign taxes may be materially different from our estimates, which could result in the need to record additional tax liabilities or potentially reverse previously recorded tax liabilities.
• Litigation and Settlement Costs. We are involved in disputes, litigation and other legal proceedings. We prosecute and defend these matters aggressively. However, there are many uncertainties associated with any litigation, and we cannot assure you that these actions or other third party claims against us will be resolved without costly litigation and/or substantial settlement costs. In addition, the resolution of intellectual property litigation may require us to pay damages for past alleged infringement or to obtain a license under the other party’s intellectual property rights that could require one-time license fees or running royalties, which could adversely impact product gross margins in future periods, or could prevent us from manufacturing or selling some of our products or limit or restrict the type of work that employees involved in such litigation may perform for Broadcom. If any of those events were to occur, our business, financial condition and results of operations could be materially and adversely affected.
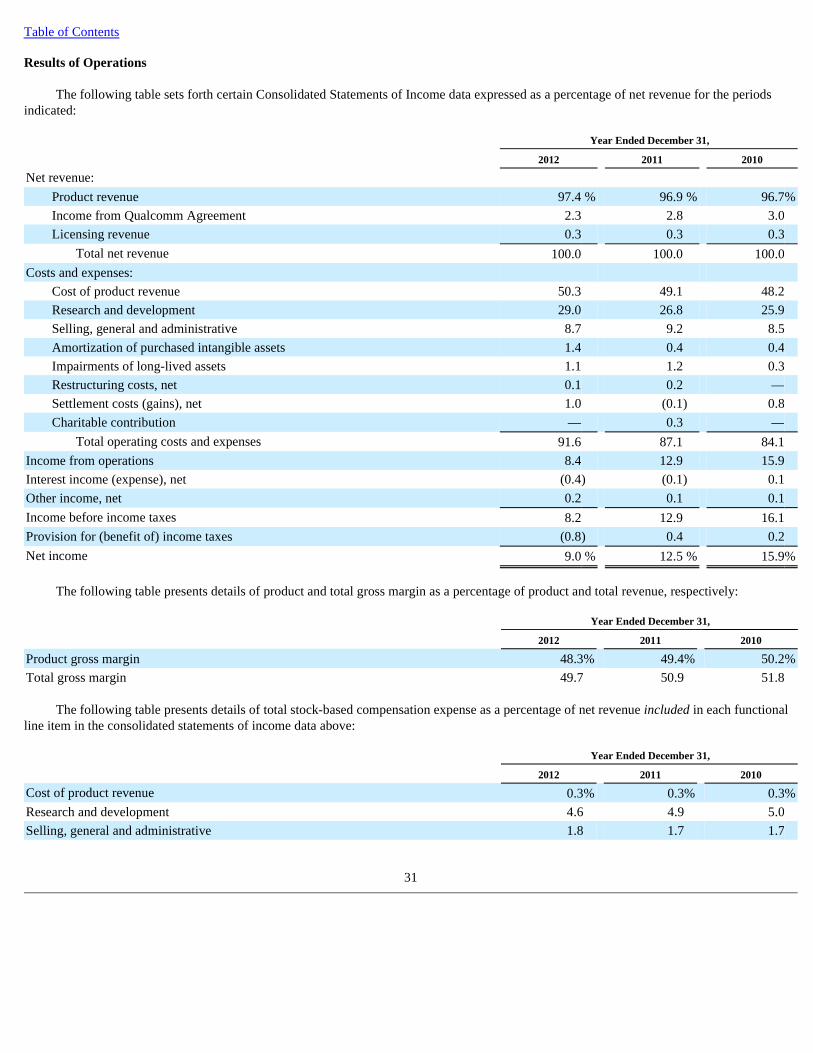
Table of Contents Results of Operations
The following table sets forth certain Consolidated Statements of Income data expressed as a percentage of net revenue for the periods
indicated:
The following table presents details of product and total gross margin as a percentage of product and total revenue, respectively:
The following table presents details of total stock-based compensation expense as a percentage of net revenue included in each functional
line item in the consolidated statements of income data above:
31
Year Ended December 31,
2012 2011 2010
Net revenue:
Product revenue 97.4 % 96.9 % 96.7 %
Income from Qualcomm Agreement 2.3 2.8 3.0 Licensing revenue 0.3 0.3 0.3
Total net revenue 100.0 100.0 100.0 Costs and expenses:
Cost of product revenue 50.3 49.1 48.2 Research and development 29.0 26.8 25.9 Selling, general and administrative 8.7 9.2 8.5 Amortization of purchased intangible assets 1.4 0.4 0.4 Impairments of long-lived assets 1.1 1.2 0.3 Restructuring costs, net 0.1 0.2 — Settlement costs (gains), net 1.0 (0.1 ) 0.8 Charitable contribution — 0.3 —
Total operating costs and expenses 91.6 87.1 84.1 Income from operations 8.4 12.9 15.9 Interest income (expense), net (0.4 ) (0.1 ) 0.1 Other income, net 0.2 0.1 0.1 Income before income taxes 8.2 12.9 16.1 Provision for (benefit of) income taxes (0.8 ) 0.4 0.2 Net income 9.0 % 12.5 % 15.9 %
Year Ended December 31,
2012 2011 2010
Product gross margin 48.3 % 49.4 % 50.2 %
Total gross margin 49.7 50.9 51.8
Year Ended December 31,
2012 2011 2010
Cost of product revenue 0.3 % 0.3 % 0.3 %
Research and development 4.6 4.9 5.0 Selling, general and administrative 1.8 1.7 1.7

Table of Contents
Net Revenue By Reportable Segments The following table presents net revenue from each of our reportable segments and such segments' respective contribution to net revenue:
Broadband Communications. The increase in 2012 net revenue resulted primarily from an increase in sales of our broadband modems and
set-top box, or STB, solutions of $196 million partially offset by a reduction in sales of our digital television and Blu-ray Disc products of $79 million. The decrease in 2011 net revenue resulted primarily from a decrease in sales of our digital television and Blu-ray Disc product lines of $71 million. Broadband modem and STB growth is generally driven by an increase in the number of global subscribers for broadband access and pay-TV services, as well as the adoption of faster modems and the roll-out of more highly integrated STB platforms by global service providers. For example, the STB market will be transitioning to UltraHD over the next several years. UltraHD roughly quadruples the resolution of traditional high definition broadcasts, providing a much richer customer experience, and requiring more highly-integrated SoC solutions in a STB. In broadband access, the market is transitioning to higher speed DOCSIS, PON and DSL. These transitions generally demand more advanced semiconductor content. The decrease in sales of our digital television and Blu-ray Disc products was the result of our decision to exit from those particular consumer electronic markets and reallocate funding to more attractive opportunities.
Mobile and Wireless. The increase in 2012 net revenue resulted primarily from an increase in sales of our cellular SoCs and wireless
connectivity products of $304 million and other wireless technology products of $149 million, partially offset by a decrease in sales of our multimedia co-processors of $126 million. The increase in 2011 net revenue resulted primarily from an increase in sales of our wireless connectivity and cellular SoC solutions of $393 million, multimedia co-processors of $96 million and other wireless technology products of $105 million. Growth in our cellular SoCs and wireless connectivity businesses has been driven by increased demand for our 3G SoC solutions and higher-end end-devices which require Wi-Fi and Bluetooth connectivity. Growth is also driven by the ramp up of faster cellular modems, new connectivity technologies, and richer connectivity features. For example, we have transitioned our cellular SoC business from EDGE to 3G and now HSPA+ modem standards and from single-core integrated application processing to multi-core. In connectivity, we are seeing the transition from single-band to dual-band WiFi and to 802.11n to 802.11ac. We are also ramping new connectivity technologies, including near field communication (NFC). The multimedia co-processor business has declined due to the end of life of certain customer products and the integration of multi-media co-processor into our 3G SoC solutions.
Infrastructure and Networking . The increase in 2012 net revenue resulted primarily from sales of our communication processors of $270
million, partially offset by softness in sales of Ethernet switches, PHYs and controller products of $76 million. The increase in 2012 net revenue for our communication processors was the result of our acquisition of NetLogic in February 2012. The decrease in Ethernet switches, PHYs and controller products was primarily due to softness in service provider spending as compared to the corresponding periods in 2011. The increase in 2011 net revenue resulted primarily from an increase in sales of our Ethernet switches and PHYs of $83 million. Ethernet Switch and PHY growth is driven by increases in network traffic driven by the proliferation of mobile devices and an increase in hosted services and cloud computing. Growth is also driven by the ramp of increased networking speeds and new features, including deep packet inspection. For example, in the data center market, we have benefited from the ramp up of 10G networking in top-of-rack implementations. We have also benefited from meaningfully expanding the addressable market for our infrastructure and networking products. For example, the acquisition of NetLogic expanded the company into multi-core embedded processing and knowledge-based processing. The acquisition of Provigent expanded our infrastructure portfolio into microwave backhaul.
32
2012 vs 2011 2011 vs 2010
2012 2011 2010 $ Change % Change $ Change % Change
(In millions, except percentages)
Broadband Communications $ 2,156 $ 2,039 $ 2,134 $ 117 5.7 % $ (95 ) (4.5 )%
Mobile and Wireless 3,810 3,483 2,889 327 9.4 594 20.6 Infrastructure and Networking 1,853 1,659 1,588 194 11.7 71 4.5 All other (1) 187 208 207 (21 ) (10.1 ) 1 0.5
Total net revenue $ 8,006 $ 7,389 $ 6,818 $ 617 8.4 $ 571 8.4
(1) Includes (i) income relating to the Qualcomm Agreement that was entered into in April 2009 and (ii) other revenue from certain patent license agreements. See Notes 1 and 2 of Notes to the Consolidated Financial Statements.

Table of Contents
Concentration of Net Revenue
Sales to our significant customers, including sales to their manufacturing subcontractors, as a percentage of net revenue were as follows:
No other customer represented more than 10% of our annual net revenue in these years. We expect that our largest customers will continue to account for a substantial portion of our total net revenue for the foreseeable future.
Contributions to our net revenue by these customers have increased over the last several years. For additional information about geographical information of our net revenue, see further discussion in Note 11 of Notes to Consolidated Financial Statements.
Factors That May Impact Net Revenue
The demand for our products and the subsequent recognition of net revenue has been affected in the past, and may continue to be affected
in the future, by various factors, including, but not limited to, the following:
Rebates. We recorded rebates to certain customers of $727 million , or 9.1% of net revenue, $643 million , or 8.7% of net revenue and
$526 million , or 7.7% of net revenue, in 2012 , 2011 and 2010 , respectively. The increase in rebates as a percent of net revenue was attributable to a change in the mix of sales to customers that participate in rebate programs, primarily in the Mobile and Wireless reportable segment. We reverse the accrual of unclaimed rebate amounts as specific rebate programs contractually end or when we believe unclaimed rebates are no longer subject to payment and will not be paid. We reversed accrued rebates of $18 million , $13 million and $4 million , in 2012 , 2011 and 2010 , respectively. We anticipate that accrued rebates will vary in future periods based upon the level of overall sales to customers that participate in our rebate programs.
From time to time, our key customers place large orders causing our quarterly net revenue to fluctuate significantly. We expect that these
fluctuations will continue and that they may be exaggerated by the seasonal variations in consumer products and changes in the overall economic environment. Additionally, since we own inventory that is physically located in a third party’s warehouse, our ability to effectively manage inventory levels may be impaired, causing our total inventory turns to decrease, which could increase expenses associated with excess and obsolete products and negatively impact our cash flow.
For these and other reasons, our total net revenue and results of operations for the year ended December 31, 2012 and prior periods may
not necessarily be indicative of future net revenue and results of operations.
33
Year Ended December 31,
2012 2011 2010
Samsung 17.3 % 10.0 % 10.0 %
Apple 14.6 13.1 10.9 Five largest customers as a group 47.2 42.6 38.6
• general economic and specific conditions in the markets we address, including the continuing volatility in the technology sector and semiconductor industry, and trends in the wired and wireless communications markets in various geographic regions, including seasonality in sales of consumer products into which our products are incorporated;
• the timing, rescheduling or cancellation of significant customer orders and our ability, as well as the ability of our customers and distributors, to manage inventory;
• the timing of our distributors’ shipments to their customers or when products are taken by our customers under hubbing arrangements;
• our ability to specify, develop or acquire, complete, introduce, market and transition to volume production new products and technologies in a cost effective and timely manner;
• the rate at which our present and future customers and end-users adopt and ramp our products and technologies; • the qualification, availability and pricing of competing products and technologies and the resulting effects on sales and pricing of our
products; and • the availability of credit and financing, which may lead certain of our customers to reduce their level of purchases or to seek credit or
other accommodations from us.
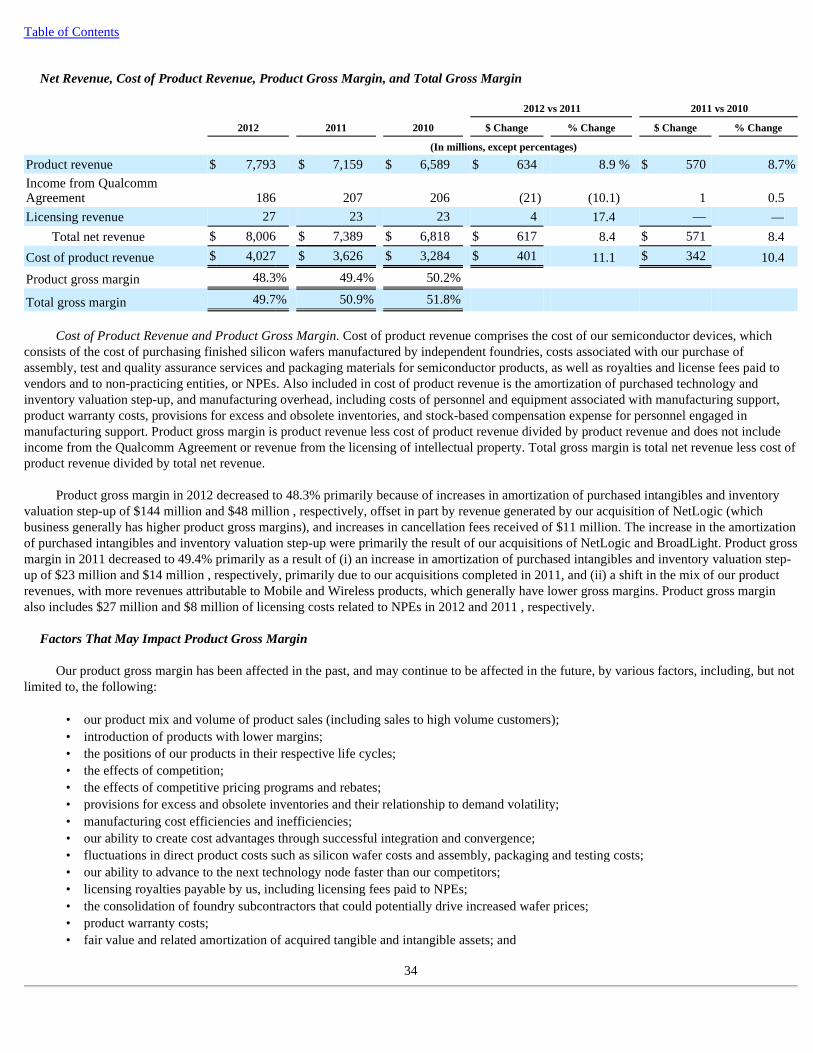
Table of Contents
Net Revenue, Cost of Product Revenue, Product Gross Margin, and Total Gross Margin
Cost of Product Revenue and Product Gross Margin. Cost of product revenue comprises the cost of our semiconductor devices, which
consists of the cost of purchasing finished silicon wafers manufactured by independent foundries, costs associated with our purchase of assembly, test and quality assurance services and packaging materials for semiconductor products, as well as royalties and license fees paid to vendors and to non-practicing entities, or NPEs. Also included in cost of product revenue is the amortization of purchased technology and inventory valuation step-up, and manufacturing overhead, including costs of personnel and equipment associated with manufacturing support, product warranty costs, provisions for excess and obsolete inventories, and stock-based compensation expense for personnel engaged in manufacturing support. Product gross margin is product revenue less cost of product revenue divided by product revenue and does not include income from the Qualcomm Agreement or revenue from the licensing of intellectual property. Total gross margin is total net revenue less cost of product revenue divided by total net revenue.
Product gross margin in 2012 decreased to 48.3% primarily because of increases in amortization of purchased intangibles and inventory
valuation step-up of $144 million and $48 million , respectively, offset in part by revenue generated by our acquisition of NetLogic (which business generally has higher product gross margins), and increases in cancellation fees received of $11 million. The increase in the amortization of purchased intangibles and inventory valuation step-up were primarily the result of our acquisitions of NetLogic and BroadLight. Product gross margin in 2011 decreased to 49.4% primarily as a result of (i) an increase in amortization of purchased intangibles and inventory valuation step-up of $23 million and $14 million , respectively, primarily due to our acquisitions completed in 2011, and (ii) a shift in the mix of our product revenues, with more revenues attributable to Mobile and Wireless products, which generally have lower gross margins. Product gross margin also includes $27 million and $8 million of licensing costs related to NPEs in 2012 and 2011 , respectively.
Factors That May Impact Product Gross Margin
Our product gross margin has been affected in the past, and may continue to be affected in the future, by various factors, including, but not
limited to, the following:
34
2012 vs 2011 2011 vs 2010
2012 2011 2010 $ Change % Change $ Change % Change
(In millions, except percentages)
Product revenue $ 7,793 $ 7,159 $ 6,589 $ 634 8.9 % $ 570 8.7 %
Income from Qualcomm Agreement 186 207 206 (21 ) (10.1 ) 1 0.5 Licensing revenue 27 23 23 4 17.4 — —
Total net revenue $ 8,006 $ 7,389 $ 6,818 $ 617 8.4 $ 571 8.4
Cost of product revenue $ 4,027 $ 3,626 $ 3,284 $ 401 11.1 $ 342 10.4
Product gross margin 48.3 % 49.4 % 50.2 %
Total gross margin 49.7 % 50.9 % 51.8 %
• our product mix and volume of product sales (including sales to high volume customers); • introduction of products with lower margins; • the positions of our products in their respective life cycles; • the effects of competition; • the effects of competitive pricing programs and rebates; • provisions for excess and obsolete inventories and their relationship to demand volatility; • manufacturing cost efficiencies and inefficiencies; • our ability to create cost advantages through successful integration and convergence; • fluctuations in direct product costs such as silicon wafer costs and assembly, packaging and testing costs; • our ability to advance to the next technology node faster than our competitors; • licensing royalties payable by us, including licensing fees paid to NPEs; • the consolidation of foundry subcontractors that could potentially drive increased wafer prices; • product warranty costs; • fair value and related amortization of acquired tangible and intangible assets; and
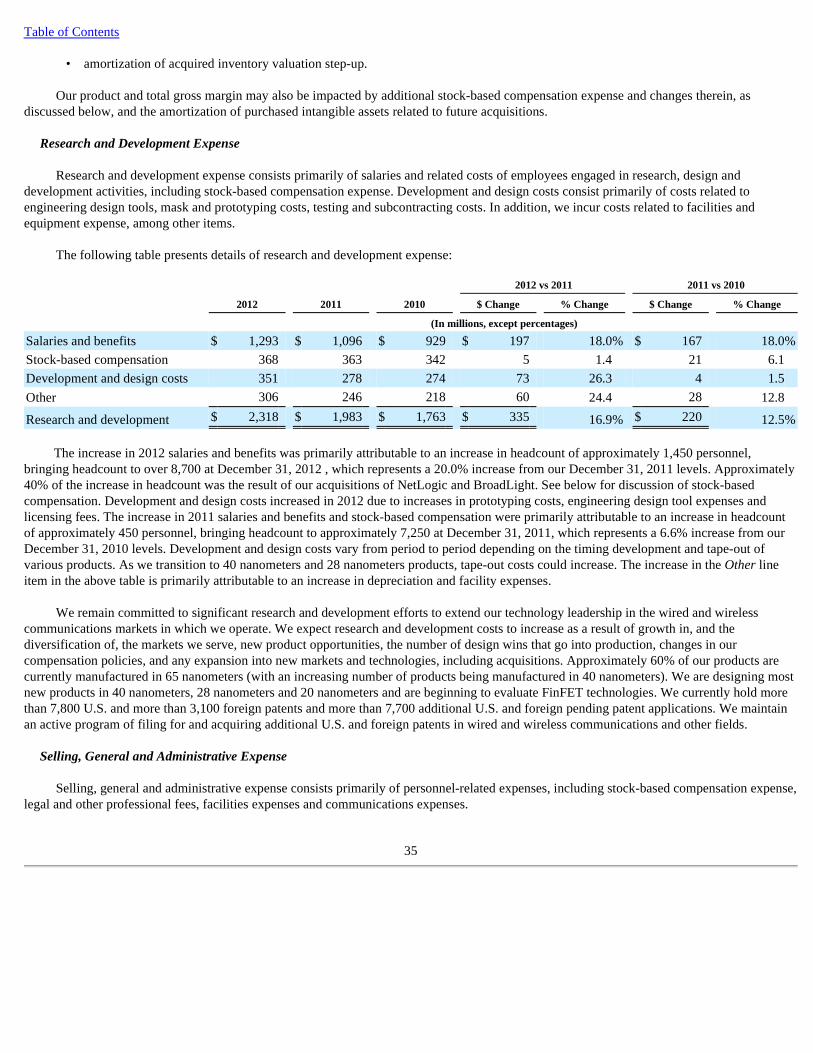
Table of Contents
Our product and total gross margin may also be impacted by additional stock-based compensation expense and changes therein, as
discussed below, and the amortization of purchased intangible assets related to future acquisitions.
Research and Development Expense Research and development expense consists primarily of salaries and related costs of employees engaged in research, design and
development activities, including stock-based compensation expense. Development and design costs consist primarily of costs related to engineering design tools, mask and prototyping costs, testing and subcontracting costs. In addition, we incur costs related to facilities and equipment expense, among other items.
The following table presents details of research and development expense:
The increase in 2012 salaries and benefits was primarily attributable to an increase in headcount of approximately 1,450 personnel,
bringing headcount to over 8,700 at December 31, 2012 , which represents a 20.0% increase from our December 31, 2011 levels. Approximately 40% of the increase in headcount was the result of our acquisitions of NetLogic and BroadLight. See below for discussion of stock-based compensation. Development and design costs increased in 2012 due to increases in prototyping costs, engineering design tool expenses and licensing fees. The increase in 2011 salaries and benefits and stock-based compensation were primarily attributable to an increase in headcount of approximately 450 personnel, bringing headcount to approximately 7,250 at December 31, 2011, which represents a 6.6% increase from our December 31, 2010 levels. Development and design costs vary from period to period depending on the timing development and tape-out of various products. As we transition to 40 nanometers and 28 nanometers products, tape-out costs could increase. The increase in the Other line item in the above table is primarily attributable to an increase in depreciation and facility expenses.
We remain committed to significant research and development efforts to extend our technology leadership in the wired and wireless
communications markets in which we operate. We expect research and development costs to increase as a result of growth in, and the diversification of, the markets we serve, new product opportunities, the number of design wins that go into production, changes in our compensation policies, and any expansion into new markets and technologies, including acquisitions. Approximately 60% of our products are currently manufactured in 65 nanometers (with an increasing number of products being manufactured in 40 nanometers). We are designing most new products in 40 nanometers, 28 nanometers and 20 nanometers and are beginning to evaluate FinFET technologies. We currently hold more than 7,800 U.S. and more than 3,100 foreign patents and more than 7,700 additional U.S. and foreign pending patent applications. We maintain an active program of filing for and acquiring additional U.S. and foreign patents in wired and wireless communications and other fields.
Selling, General and Administrative Expense
Selling, general and administrative expense consists primarily of personnel-related expenses, including stock-based compensation expense,
legal and other professional fees, facilities expenses and communications expenses.
35
• amortization of acquired inventory valuation step-up.
2012 vs 2011 2011 vs 2010
2012 2011 2010 $ Change % Change $ Change % Change
(In millions, except percentages)
Salaries and benefits $ 1,293 $ 1,096 $ 929 $ 197 18.0 % $ 167 18.0 %
Stock-based compensation 368 363 342 5 1.4 21 6.1 Development and design costs 351 278 274 73 26.3 4 1.5 Other 306 246 218 60 24.4 28 12.8
Research and development $ 2,318 $ 1,983 $ 1,763 $ 335 16.9 % $ 220 12.5 %

Table of Contents
The following table presents details of selling, general and administrative expense:
The increase in 2012 salaries and benefits was primarily attributable to an increase in headcount of approximately 150 personnel, bringing
headcount to over 1,900 at December 31, 2012 , which represents a 8.6% increase from our December 31, 2011 levels. Approximately 90% of the increase in headcount was the result of our acquisitions of NetLogic and BroadLight. See below for discussion of stock-based compensation. The decreases in 2012 legal and accounting fees was primarily driven by the conclusion of several outstanding legal matters, including the settlement of a shareholder derivative action in the three months ended June 30, 2011 and certain patent infringement claims. The increase in 2011 salaries and benefits and stock-based compensation were primarily attributable to an increase in headcount of approximately 140 personnel, bringing headcount to approximately 1,750 at December 31, 2011, which represents an 8.9% increase from our December 31, 2010 levels. The increase in 2011 legal and accounting fees primarily related to legal fees associated with the settlement of a federal consolidated shareholder derivative action, which included a final $25 million payment to the plaintiffs’ counsel for attorneys’ fees, expenses and costs. Legal fees consist primarily of attorneys’ fees and expenses related to our outstanding intellectual property and prior years’ securities litigation, patent prosecution and filings and various other transactions. Legal fees fluctuate from period to period due to the nature, scope, timing and costs of the matters in litigation. See Note 9 of Notes to the Consolidated Financial Statements for further information. The increase in the Other line item in the above table is primarily attributable to an increase in travel and facilities expense.
Stock-Based Compensation Expense
The following table presents details of total stock-based compensation expense that is included in each functional line item in our consolidated statements of income:
In 2012 we (i) granted equity awards with a fair value of $453 million , primarily related to our regular annual equity compensation review
program, which will be expensed over the next four years, and (ii) assumed NetLogic and BroadLight equity awards with a fair value of $215 million , which will be expensed primarily over the next two to three years.
The following table presents details of unearned stock-based compensation currently estimated to be expensed in 2013 through 2017
related to unvested share-based payment awards:
If there are any modifications or cancellations of the underlying unvested awards, we may be required to accelerate, increase or cancel any
remaining unearned stock-based compensation expense. Future stock-based compensation expense and
36
2012 vs 2011 2011 vs 2010
2012 2011 2010 $ Change % Change $ Change % Change
(In millions, except percentages)
Salaries and benefits $ 344 $ 293 $ 240 $ 51 17.4 % $ 53 22.1 %
Stock-based compensation 148 126 119 22 17.5 7 5.9 Legal and accounting fees 84 149 140 (65 ) (43.6 ) 9 6.4 Other 120 114 90 6 5.3 24 26.7 Selling, general and administrative $ 696 $ 682 $ 589 $ 14 2.1 % $ 93 15.8 %
2012 vs 2011 2011 vs 2010
2012 2011 2010 $ Change % Change $ Change % Change
(In millions, except percentages)
Cost of product revenue $ 27 $ 24 $ 23 $ 3 12.5 % $ 1 4.3 %
Research and development 368 363 342 5 1.4 21 6.1 Selling, general and administrative 148 126 119 22 17.5 7 5.9
$ 543 $ 513 $ 484 $ 30 5.8 % $ 29 6.0 %
2013 2014 2015 2016 2017 Total
(In millions)
Unearned stock-based compensation $ 434 $ 272 $ 133 $ 24 $ 1 $ 864

Table of Contents unearned stock-based compensation will increase to the extent that we grant additional equity awards to employees or assume unvested equity awards in connection with acquisitions.
It is our long-term objective that total stock-based compensation approximates 5% of total net revenue. See Note 8 of Notes to
Consolidated Financial Statements for a discussion of activity related to share-based awards.
Amortization of Purchased Intangible Assets
The following table presents details of the amortization of purchased intangible assets included in the cost of product revenue and other operating expense categories:
In 2012 we recorded purchased intangible assets of $1.78 billion primarily related to our acquisitions of NetLogic and BroadLight. The
increase in 2012 amortization of purchased intangible assets primarily related to our acquisitions of NetLogic and BroadLight in 2012 and Provigent in 2011. The increase in amortization of purchased intangible assets in 2011 was primarily related to our acquisitions of Beceem Communications, Inc., or Beceem, in late 2010 and Provigent in 2011.
The following table presents details of the amortization of existing purchased intangible assets (including IPR&D), which is currently
estimated to be expensed in 2013 and thereafter:
We amortize our intangible assets with definitive lives over periods ranging from one to fourteen years using a method that reflects the
pattern in which the economic benefits of the intangible asset are consumed or otherwise used. In addition, based on our current assumptions, IPR&D assets will be reclassified to development technology through 2016 and amortized over their estimated useful lives. If we acquire additional purchased intangible assets in the future, our cost of product revenue or operating expenses will be increased by the amortization of those assets.
In-Process Research and Development
In 2012 we capitalized IPR&D of $267 million related to our acquisition of NetLogic. In 2011 and 2010 we capitalized IPR&D of $45 million and $55 million, respectively, for various acquisitions. For a description of our valuation techniques and significant assumptions underlying the valuation of the ongoing development projects that were in process at the date of acquisition and were capitalized as IPR&D, see the discussion in Note 3 of Notes to the Consolidated Financial Statements. In addition, in 2012, 2011 and 2010 we reclassified $1 million, $3 million and $51 million, respectively, of IPR&D costs to developed technology, primarily related to our acquisition of Dune Networks, which will now be amortized to cost of product revenue.
Impairment of Goodwill and Other Long-Lived Assets
We performed annual impairment assessments of the carrying value of goodwill in October 2012, 2011 and 2010. Upon completion of these assessments, we determined no impairment was indicated as the estimated fair value of each of the reporting units exceeded its respective carrying value.
In 2012 we recorded a purchased intangible impairment charge of $49 million related to our 2011 acquisition of Provigent included in our
Infrastructure and Networking reportable segment and other impairment charges of $38 million related to six
37
2012 vs 2011 2011 vs 2010
2012 2011 2010 $ Change % Change $ Change % Change
(In millions, except percentages)
Cost of product revenue $ 198 $ 54 $ 31 $ 144 266.7 % $ 23 74.2 %
Other operating expenses 113 30 28 83 276.7 2 7.1
$ 311 $ 84 $ 59 $ 227 270.2 $ 25 42.4
Purchased Intangible Asset Amortization by Year
2013 2014 2015 2016 2017 Thereafter Total
(In millions) Cost of product revenue $ 174 $ 221 $ 218 $ 200 $ 188 $ 615 $ 1,616 Other operating expenses 57 64 32 9 3 5 170
$ 231 $ 285 $ 250 $ 209 $ 191 $ 620 $ 1,786
Table of Contents other acquisitions. The primary factor contributing to Provigent impairment charge was the reduction of forecasted cash flows related to certain legacy microwave technology products. The primary factor contributing to the other impairment charges was the reduction in the revenue outlook for certain products and the resulting decrease to the estimated cash flows identified with the impaired assets. Additionally, we recorded an impairment charge of $3 million related to certain computer software and equipment in June 2012.
In 2011 we recorded a purchased intangible impairment charge of $74 million related to our 2010 acquisition of Beceem, included in our
Mobile and Wireless reportable segment, and other impairment charges of $18 million . The primary factor contributing to the Beceem impairment charge was the continued reduction in the forecasted cash flows derived from the acquired WiMAX products as wireless service providers have accelerated their adoption of Long Term Evolution, or LTE, products.
In 2010 we recorded an impairment charge of $19 million, primarily related to a technology license that was acquired in 2008 from Sunext
Design, Inc. The primary factor contributing to this impairment charge was the continued reduction in our revenue outlook for our Blu-ray product line, which were ultimately discontinued, and the related decrease to the estimated cash flows identified with the impaired assets.
For the carrying balances of our goodwill by reporting segment and a description of our valuation techniques and significant assumptions
as well as details of our other long-lived assets and related impairment charges taken, see the discussions in Notes 2 and 10 of Notes to the Consolidated Financial Statements.
Settlement Costs (Gains)
In 2012 we recorded net settlement costs of $79 million , which was comprised of $88 million of settlement costs related to patent
infringement claims, offset by settlement gains of $9 million (primarily related to the resolution of certain employment tax matters). In 2011 we recorded net settlement gains of $18 million , which was comprised of $55 million of settlement gains (primarily related to the settlement of a shareholder derivative action), offset by settlement costs of $37 million (related to the settlement of patent infringement claims). Upon the occurrence of certain events, we may be required to record additional settlement costs of up to $20 million related to a patent infringement case that settled in 2011. In 2010 we recorded settlement costs of $53 million primarily related to licensing and settlement agreements and certain employment tax items. For a further discussion of our settlement costs and litigation matters, see Note 9 of Notes to the Consolidated Financial Statements.
Restructuring Costs
As part of our regular portfolio management review process and in light of our decision to significantly reduce our investment in our digital television and Blu-ray Disc product lines within our Broadband Communications operating segment, in September 2011 we implemented a restructuring plan to reduce our worldwide headcount by approximately 300 employees . In connection with this plan, in 2011 we recorded $16 million in net restructuring costs, of which $12 million was related to severance and other charges associated with our reduction in workforce across multiple locations and functions, and $4 million was related to the closure of three of our facilities. We do not expect any net cost savings from this restructuring plan as we plan to reallocate funding to higher return opportunities. In 2012 we incurred $7 million in restructuring costs primarily associated with additional costs for retention bonuses and facilities relating to the restructuring plan noted above, and severance and facility charges associated with synergies identified during the integration of our acquisition of NetLogic. These restructuring plans were completed in 2012.
Charitable Contribution
In April 2009 we established the Broadcom Foundation, or the Foundation, to support science, technology, engineering and mathematics
programs, as well as a broad range of community services. In June 2011 we contributed an additional $25 million to the Foundation. Approximately $2 million of the $25 million contribution came from Dr. Henry Samueli, our Chief Technical Officer and Chairman of the Board of Directors, who made such payment to Broadcom in connection with the settlement of a shareholder derivative action as further described in Note 9 of Notes to the Consolidated Financial Statements. This payment was recorded as an operating expense in consolidated statement of income in 2011.
38

Table of Contents
Interest and Other Income (Expense), Net The following table presents interest and other income, net:
Interest income (expense), net, reflects interest expense on our senior unsecured notes totaling $1.70 billion , offset by interest income
earned on cash, cash equivalents and marketable securities balances. Other income, net, primarily includes gains and losses on foreign currency transactions, asset disposals and strategic investments.
The increases in interest expense from 2010 through 2012 was driven primarily by interest expense related to our senior unsecured notes of
$700 million issued in November 2010, $500 million issued in November 2011, and $500 million issued in August 2012.
Provision for (Benefit of) Income Taxes The federal statutory rate was 35% for 2012 , 2011 and 2010 . Our effective tax rates were (9.6%), 3.0% and 1.4% for 2012 , 2011 and
2010 , respectively. The differences between our effective tax rates and the federal statutory tax rate, primarily relate to foreign earnings taxed at substantially lower rates than the federal statutory rate due principally to our tax holiday in Singapore and domestic tax losses recorded without tax benefits. During 2012, we recorded tax benefits resulting from the reduction of certain foreign deferred tax liabilities of $12 million and tax benefits resulting from reductions in our U.S. valuation allowance on certain deferred tax assets due to recording net deferred tax liabilities for identifiable intangible assets under purchasing accounting of $51 million for our acquisitions of NetLogic and BroadLight. We realized tax benefits resulting from the reversal of certain prior period tax accruals of $13 million and $9 million in 2012 and 2011, respectively. These reversals resulted primarily from the expiration of the statutes of limitation for the assessment of taxes related to certain foreign subsidiaries. We recorded a tax provision of $13 million in 2011 resulting from legislation enacted in Israel on December 5, 2011, which increased tax rates for 2012 and later years applicable to our Israel net deferred tax liabilities, principally related to purchased intangible assets.
We utilize the asset and liability method of accounting for income taxes. We record net deferred tax assets to the extent we believe these
assets will more likely than not be realized. In making such determination, we consider all available positive and negative evidence, including scheduled reversals of deferred tax liabilities, projected future taxable income, tax planning strategies and recent financial performance. Forming a conclusion that a valuation allowance is not required is difficult when there is negative evidence such as cumulative losses in recent years. As a result of our recent cumulative tax losses in the U.S. and certain foreign jurisdictions, and the full utilization of our loss carryback opportunities, we have concluded that a full valuation allowance should be recorded in such jurisdictions. In certain other foreign jurisdictions where we do not have cumulative losses, we had net deferred tax liabilities of $29 million and $62 million at December 31, 2012 and December 31, 2011, respectively.
We operate under tax holidays in Singapore, which are effective through March 2014. The tax holidays are conditional upon our meeting
certain employment and investment thresholds. The impact of the Singapore tax holidays decreased Singapore taxes by $399 million, $368 million and $330 million for 2012, 2011 and 2010, respectively. The benefit of the tax holidays on net income per share (diluted) was $0.69, $0.65 and $0.61 for 2012, 2011 and 2010, respectively. We are in discussions with the Singapore Economic Development Board with respect to tax incentives for periods after March 31, 2014. Subsequent Events
In January 2013 our Board of Directors adopted an amendment to our existing dividend policy pursuant to which we intend to increase the quarterly cash dividend by 10% to $0.11 per share ($0.44 per share on an annual basis) and declared a quarterly cash dividend of $0.11 per share payable to holders of our common stock.
39
2012 vs 2011 2011 vs 2010
2012 2011 2010 $ Change $ Change
(In millions)
Interest income (expense), net $ (30 ) $ (5 ) $ 9 $ (25 ) $ (14 )
Other income, net 10 8 7 2 1
$ (20 ) $ 3 $ 16 $ (23 ) $ (13 )

Table of Contents
Liquidity and Capital Resources Working Capital and Cash and Marketable Securities. The following table presents working capital, cash and cash equivalents, and
marketable securities:
See the summary of cash, cash equivalents, short and long-term marketable securities by major security type and discussion of market risk
that follows in Item 7A. Quantitative and Qualitative Disclosures about Market Risk. Cash Provided and Used in 2012 and 2011
Cash and cash equivalents decreased to $1.62 billion at December 31, 2012 from $4.15 billion at December 31, 2011 as a result of cash
used to fund our acquisitions of NetLogic and BroadLight, our quarterly dividend payments and net purchases of marketable securities and purchases of property and equipment, offset by cash provided by operating activities and proceeds from the issuance of long-term debt.
Operating Activities
In 2012 our operating activities provided $1.93 billion in cash. This was primarily the result of net income of $719 million , net non-cash
operating expenses of $1.06 billion and changes in operating assets and liabilities of $152 million . In 2011 our operating activities provided $1.84 billion in cash. This was primarily the result of net income of $927 million , net non-cash operating expenses of $782 million and changes in operating assets and liabilities of $129 million . In 2010 our operating activities provided $1.37 billion in cash. This was primarily the result of net income of $1.08 billion and net non-cash operating expenses of $638 million , offset in part by changes in operating assets and liabilities of $349 million , which includes our $161 million payment of previously accrued securities litigation settlement costs.
Our days sales outstanding decreased from 34 days at December 31, 2011 to 32 days at December 31, 2012 due to revenue linearity
(meaning a percentage of sales occurring in the final month of the quarter) and the increase in total net revenue as compared to the three months ended December 31, 2011. We typically bill customers on an open account basis subject to our standard net thirty day payment terms. If, in the longer term, our revenue increases, it is likely that our accounts receivable balance will also increase. Our accounts receivable could also increase if customers delay their payments or if we grant extended payment terms to customers, both of which are more likely to occur during challenging economic times when our customers may have difficulty gaining access to sufficient credit on a timely basis.
Our inventory days on hand increased from 43 days at December 31, 2011 to 47 days at December 31, 2012 . In the future, our inventory
levels will continue to be determined by the level of purchase orders we receive and the stage at which our products are in their respective product life cycles, our ability, and the ability of our customers, to manage inventory under
40
December 31,
2012 2011 $ Change
(In millions)
Working capital $ 2,099 $ 4,653 $ (2,554 )
Cash and cash equivalents $ 1,617 $ 4,146 (2,529 )
Short-term marketable securities 757 383 374 Long-term marketable securities 1,348 676 672
Total cash and cash equivalents and marketable securities $ 3,722 $ 5,205 $ (1,483 )
Year Ended December 31,
2012 2011 2010
(In millions)
Net cash provided by operating activities $ 1,931 $ 1,838 $ 1,371 Net cash provided by (used in) investing activities (4,796 ) 863 (2,179 )
Net cash provided by (used in) financing activities 336 (177 ) 1,033 Increase (decrease) in cash and cash equivalents (2,529 ) 2,524 225 Cash and cash equivalents at beginning of period 4,146 1,622 1,397 Cash and cash equivalents at end of period $ 1,617 $ 4,146 $ 1,622
Table of Contents hubbing arrangements, and competitive situations in the marketplace. Such considerations are balanced against the risk of obsolescence or potentially excess inventory levels.
Investing Activities
Investing activities used $4.80 billion in cash in 2012 , which was primarily the result of $3.58 billion in net cash paid for our acquisitions,
primarily NetLogic and BroadLight, $244 million of capital equipment purchases to support our research and development efforts and $997 million in net purchases from sales and maturities of marketable securities, offset in part by $27 million of proceeds from the sale of strategic investments. Investing activities provided $863 million in cash in 2011 , which was primarily the result of $1.38 billion in net proceeds from sales and maturities of marketable securities, offset in part by $347 million in net cash paid for our acquisitions of Provigent and SC Square Ltd. and $163 million of capital equipment purchases to support our research and development efforts.
Investing activities used $2.18 billion in cash in 2010 , which was primarily the result of $1.47 billion in net purchases of marketable
securities, $599 million in net cash paid primarily for the acquisitions of Teknovus, Inc., Innovision Research & Technology PLC, Percello, Beceem and Gigle Networks, Inc., and $109 million of capital equipment purchases, mostly to support our research and development efforts.
Financing Activities
Our financing activities provided $336 million in cash in 2012 , which was primarily the result of the net proceeds from the issuance of
long-term debt of $492 million and $311 million in proceeds received from issuances of common stock upon the exercise of stock options and pursuant to our employee stock purchase plan, offset in part by the payment of contingent consideration and debt assumed from our recent acquisitions of $57 million , dividends paid of $224 million , repurchases of our Class A common stock of $33 million and $153 million in minimum tax withholding paid on behalf of employees for shares issued pursuant to restricted stock units. Our financing activities used $177 million in cash in 2011 , which was primarily the result of $670 million in repurchases of shares of our Class A common stock, dividends paid of $194 million , and $155 million in minimum tax withholding paid on behalf of employees for shares issued pursuant to restricted stock units, offset in part by $494 million in proceeds from the issuance of long-term debt and $348 million in proceeds received from issuances of common stock upon the exercise of stock options and pursuant to our employee stock purchase plan.
Our financing activities provided $1.03 billion in cash in 2010 , which was primarily the result of net proceeds of $936 million in proceeds
received from issuances of common stock upon exercise of stock options and pursuant to our employee stock purchase plan and $691 million in proceeds from the issuance of our long-term debt, offset in part by $280 million in repurchases of shares of our Class A common stock, dividends paid of $164 million , repayment of debt assumed in our Teknovus acquisition of $14 million , and $136 million in minimum tax withholding paid on behalf of employees for shares issued pursuant to restricted stock units.
The timing and number of stock option exercises and employee stock purchases and the amount of cash proceeds we receive from these
equity awards are not within our control. As it is now our general practice to issue restricted stock units, or RSUs, instead of stock options we will likely not generate as much cash from the exercise of stock options as we have in the past. Unlike the exercise of stock options, the issuance of shares upon vesting of RSUs does not result in any cash proceeds to Broadcom and in fact requires the use of cash, as we currently allow employees to have a portion of the shares issued upon vesting of RSUS withheld to satisfy minimum statutory withholding taxes. This withholding procedure requires that we pay cash to the appropriate tax authorities on each participating employee's behalf.
Short and Long-Term Financing Arrangements At December 31, 2012 , we had the following resources available to obtain short-term or long-term financings if we need additional
liquidity: Registration Statements We have a Form S-4 acquisition shelf registration statement on file with the SEC. The registration statement on Form S-4 enables us to
issue up to 30 million shares of our Class A common stock in one or more acquisition transactions. These transactions may include the acquisition of assets, businesses or securities by any form of business combination. To date no securities have been issued pursuant to the S-4 registration statement, which does not have an expiration date mandated by SEC rules. On February 27, 2012 our Form S-3 that permitted Broadcom to sell, in one or more public offerings, shares of our Class A common stock, shares of preferred stock or debt securities, or any combination of such securities, for proceeds in an
41
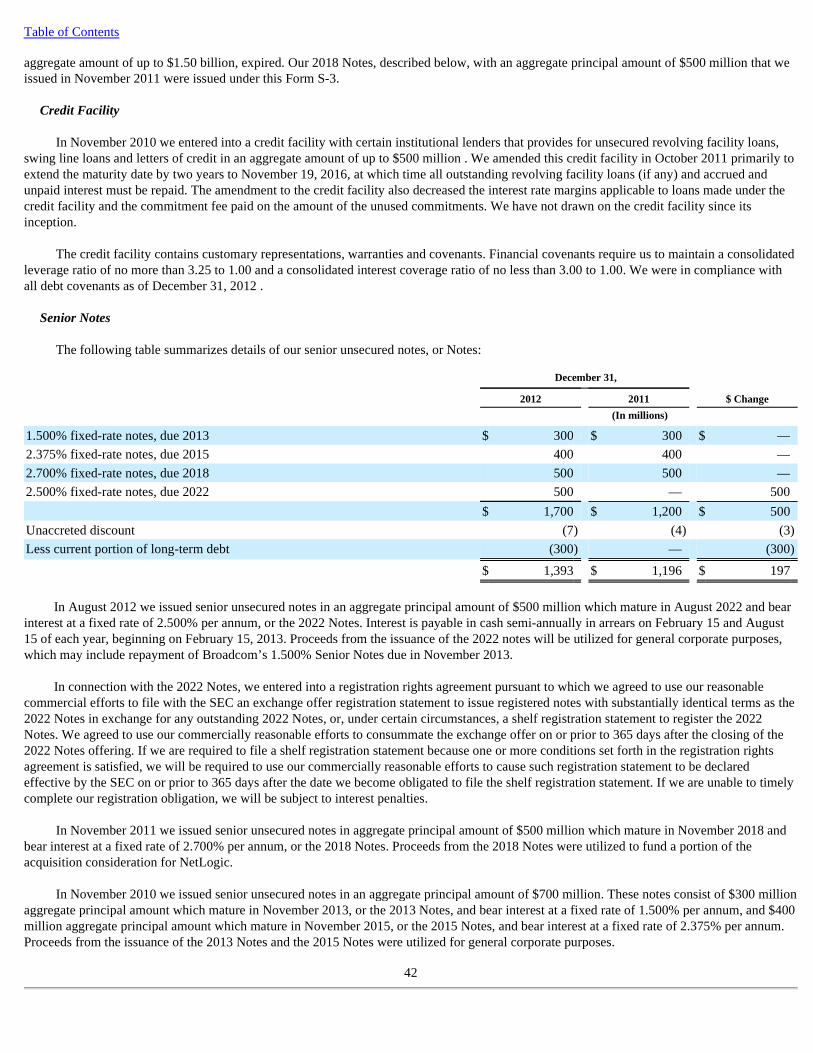
Table of Contents aggregate amount of up to $1.50 billion, expired. Our 2018 Notes, described below, with an aggregate principal amount of $500 million that we issued in November 2011 were issued under this Form S-3.
Credit Facility
In November 2010 we entered into a credit facility with certain institutional lenders that provides for unsecured revolving facility loans,
swing line loans and letters of credit in an aggregate amount of up to $500 million . We amended this credit facility in October 2011 primarily to extend the maturity date by two years to November 19, 2016, at which time all outstanding revolving facility loans (if any) and accrued and unpaid interest must be repaid. The amendment to the credit facility also decreased the interest rate margins applicable to loans made under the credit facility and the commitment fee paid on the amount of the unused commitments. We have not drawn on the credit facility since its inception.
The credit facility contains customary representations, warranties and covenants. Financial covenants require us to maintain a consolidated
leverage ratio of no more than 3.25 to 1.00 and a consolidated interest coverage ratio of no less than 3.00 to 1.00. We were in compliance with all debt covenants as of December 31, 2012 .
Senior Notes
The following table summarizes details of our senior unsecured notes, or Notes:
In August 2012 we issued senior unsecured notes in an aggregate principal amount of $500 million which mature in August 2022 and bear
interest at a fixed rate of 2.500% per annum, or the 2022 Notes. Interest is payable in cash semi-annually in arrears on February 15 and August 15 of each year, beginning on February 15, 2013. Proceeds from the issuance of the 2022 notes will be utilized for general corporate purposes, which may include repayment of Broadcom’s 1.500% Senior Notes due in November 2013.
In connection with the 2022 Notes, we entered into a registration rights agreement pursuant to which we agreed to use our reasonable
commercial efforts to file with the SEC an exchange offer registration statement to issue registered notes with substantially identical terms as the 2022 Notes in exchange for any outstanding 2022 Notes, or, under certain circumstances, a shelf registration statement to register the 2022 Notes. We agreed to use our commercially reasonable efforts to consummate the exchange offer on or prior to 365 days after the closing of the 2022 Notes offering. If we are required to file a shelf registration statement because one or more conditions set forth in the registration rights agreement is satisfied, we will be required to use our commercially reasonable efforts to cause such registration statement to be declared effective by the SEC on or prior to 365 days after the date we become obligated to file the shelf registration statement. If we are unable to timely complete our registration obligation, we will be subject to interest penalties.
In November 2011 we issued senior unsecured notes in aggregate principal amount of $500 million which mature in November 2018 and
bear interest at a fixed rate of 2.700% per annum, or the 2018 Notes. Proceeds from the 2018 Notes were utilized to fund a portion of the acquisition consideration for NetLogic.
In November 2010 we issued senior unsecured notes in an aggregate principal amount of $700 million. These notes consist of $300 million
aggregate principal amount which mature in November 2013, or the 2013 Notes, and bear interest at a fixed rate of 1.500% per annum, and $400 million aggregate principal amount which mature in November 2015, or the 2015 Notes, and bear interest at a fixed rate of 2.375% per annum. Proceeds from the issuance of the 2013 Notes and the 2015 Notes were utilized for general corporate purposes.
42
December 31,
2012 2011 $ Change
(In millions)
1.500% fixed-rate notes, due 2013 $ 300 $ 300 $ — 2.375% fixed-rate notes, due 2015 400 400 — 2.700% fixed-rate notes, due 2018 500 500 — 2.500% fixed-rate notes, due 2022 500 — 500 $ 1,700 $ 1,200 $ 500 Unaccreted discount (7 ) (4 ) (3 )
Less current portion of long-term debt (300 ) — (300 )
$ 1,393 $ 1,196 $ 197

Table of Contents
Our senior unsecured notes described above contain a number of restrictive covenants, including, but not limited to, restrictions on our
ability to grant liens on assets; enter into sale and lease-back transactions; or merge, consolidate or sell assets. Failure to comply with these covenants, or any other event of default, could result in acceleration of the principal amount and accrued and unpaid interest on the Notes. We were in compliance with all debt covenants as of December 31, 2012 .
Other Notes and Borrowings
We had no other significant notes or borrowings as of December 31, 2012 .
Commitments and Other Contractual Obligations
The following table presents details of our commitments and other contractual obligations, which are currently estimated to be paid in 2013 and thereafter:
We lease our facilities and certain engineering design tools and information systems equipment under operating lease agreements. Our
leased facilities comprise an aggregate of 3.9 million square feet. Our principal facilities in Irvine have lease terms that expire at various dates through 2017 with an aggregate rent of $110 million (included in the table above).
Inventory and related purchase obligations represent purchase commitments for silicon wafers and assembly and test services. We depend
upon third party subcontractors to manufacture our silicon wafers and provide assembly and test services. Due to lengthy subcontractor lead times, we must order these materials and services from subcontractors well in advance. We expect to receive and pay for these materials and services within the ensuing six months. Our subcontractor relationships typically allow for the cancellation of outstanding purchase orders, but require payment of all expenses incurred through the date of cancellation.
Other obligations represent purchase commitments for lab test equipment, computer hardware, information systems infrastructure, mask and prototyping costs, intellectual property licensing arrangements and other commitments made in the ordinary course of business.
For purposes of the table above, obligations for the purchase of goods or services are defined as agreements that are enforceable and
legally binding and that specify all significant terms, including: fixed or minimum quantities to be purchased; fixed, minimum or variable price provisions; and the approximate timing of the transaction. Our purchase orders are based on current manufacturing needs and are typically fulfilled by our vendors within a relatively short time horizon. We have additional purchase orders (not included in the table above) that represent authorizations to purchase rather than binding agreements. We do not have significant agreements for the purchase of inventories or other goods specifying minimum quantities or set prices that exceed our expected requirements.
Unrecognized tax benefits were $331 million, of which $49 million would result in potential cash payment of taxes and $282 million
would result in a reduction in net operating loss and tax credit carryforwards. We are not including any amount related to uncertain tax positions in the table presented above because of the difficulty in making reasonably reliable estimates of the timing of settlements with the respective taxing authorities. In addition to the unrecognized tax benefits, we have also recorded a liability for potential tax penalties and interest of $31 million and $5 million, respectively, at December 31, 2012.
43
Payment Obligations by Year
2013 2014 2015 2016 2017 Thereafter Total
(In millions)
Operating leases $ 144 $ 109 $ 85 $ 77 $ 55 $ 81 $ 551 Inventory and related purchase obligations 609 — — — — — 609 Other obligations 196 78 36 23 3 — 336 Long-term debt and related interest 340 35 436 26 26 1,076 1,939
$ 1,289 $ 222 $ 557 $ 126 $ 84 $ 1,157 $ 3,435
Table of Contents
Prospective Capital Needs
We believe that our existing cash, cash equivalents and marketable securities, together with cash generated from operations and from the
issuance of common stock through our employee stock option and purchase plans, will be sufficient to cover our working capital needs, capital expenditures, investment requirements, commitments, repurchases of our Class A common stock and quarterly dividends for at least the next 12 months. However, it is possible that we may choose to raise additional funds or draw on our existing credit facility to finance our activities beyond the next 12 months or to consummate acquisitions of other businesses, assets, products or technologies. If needed, we may be able to raise such funds by selling equity or debt securities to the public or to selected investors or by borrowing money from financial institutions. We could also reduce certain expenditures, such as repurchases of our Class A common stock and payments of our quarterly dividends.
We earn a significant amount of our operating income outside the U.S., which is deemed to be permanently reinvested in foreign
jurisdictions. For at least the next 12 months, we have sufficient cash in the U.S. and expect domestic cash flow to sustain our operating activities and cash commitments for investing and financing activities, such as acquisitions, quarterly dividends, share buy-backs and repayment of debt. In addition, we expect existing foreign cash, cash equivalents, short-term investments, and cash flows from operations to continue to be sufficient to fund our foreign operating activities and cash commitments for investing activities, such as material capital expenditures, for at least the next 12 months. If we were to repatriate our foreign earnings, which are permanently reinvested, it would not result in a significant tax liability because the amounts would be offset by our remaining net operating loss and tax credit carryforwards.
In addition, even though we may not need additional funds, we may still elect to sell additional equity or debt securities or utilize or
increase our existing credit facilities for other reasons. However, we may not be able to obtain additional funds on a timely basis at acceptable terms, if at all. If we raise additional funds by issuing additional equity or convertible debt securities, the ownership percentages of existing shareholders would be reduced. In addition, the equity or debt securities that we issue may have rights, preferences or privileges senior to those of our Class A common stock.
As of December 31, 2012 we have approximately $1.61 billion of cash, cash equivalents, and marketable securities held by our foreign
subsidiaries. Any potential additional income, which could result if we were to repatriate our remaining foreign cash, cash equivalents and marketable securities would be offset by existing net operating loss and research and development tax credit carryforwards and should not have a material effect on our tax liabilities. Our net operating loss and research and development tax credit carryforwards are currently subject to a full valuation allowance.
Although we believe that we have sufficient capital to fund our activities for at least the next 12 months, our future capital requirements
may vary materially from those now planned. We anticipate that the amount of capital we will need in the future will depend on many factors, including:
44
• general economic and specific conditions in the markets we address, including the continuing volatility in the technology sector and semiconductor industry, and trends in the wired and wireless communications markets in various geographic regions, including seasonality in sales of consumer products into which our products are incorporated;
• acquisitions of businesses, assets, products or technologies; • the unavailability of credit and financing, which may lead certain of our customers to reduce their levels of purchases or to seek credit
or other accommodations from us; • litigation expenses, settlements and judgments; • the overall levels of sales of our semiconductor products, licensing revenue, income from the Qualcomm Agreement and product
gross margins; • our business, product, capital expenditure and research and development plans, and product and technology roadmaps; • the market acceptance of our products; • payment of cash dividends; • required levels of research and development and other operating costs; • volume price discounts and customer rebates; • intellectual property disputes, customer indemnification claims and other types of litigation risks; • the levels of inventory and accounts receivable that we maintain; • licensing royalties payable by us, including licensing fees paid to NPEs; • capital improvements for new and existing facilities • changes in our compensation policies;

Table of Contents
In addition, we may require additional capital to accommodate planned future long-term growth, hiring, infrastructure and facility
needs.
Off-Balance Sheet Arrangements
At December 31, 2012 we had no material off-balance sheet arrangements, other than our facility operating leases. Item 7A. Quantitative and Qualitative Disclosures about Market Risk Interest Rate Risk
We manage our total portfolio to encompass a diversified pool of investment-grade securities to preserve principal and maintain liquidity.
The average credit rating of our marketable securities portfolio by major credit rating agencies was Aa3/AA- . Investments in both fixed rate and floating rate instruments carry a degree of interest rate risk. Fixed rate securities may have their market value adversely impacted due to an increase in interest rates, while floating rate securities may produce less income than expected if interest rates fall. Due in part to these factors, our future investment income, net, may fall short of expectations due to changes in interest rates or if the decline in fair value of our publicly traded fixed income investments is judged to be other-than-temporary. We may suffer losses in principal if we are forced to sell securities that have declined in market value due to changes in interest rates. However, because any fixed income securities we hold are classified as available-for-sale, no gains or losses are realized in the income statement due to changes in interest rates unless such securities are sold prior to maturity or unless declines in value are determined to be other-than-temporary. These securities are reported at fair value with the related unrealized gains and losses included in accumulated other comprehensive loss, a component of shareholders’ equity, net of tax.
To assess the interest rate risk associated with our investment portfolio, we performed a sensitivity analysis to determine the impact a
change in interest rates would have on the value of the investment portfolio assuming a 100 basis point parallel shift in the yield curve. Based on investment positions as of December 31, 2012 , a 100 basis point increase in interest rates across all maturities would result in a $23 million incremental decline in the fair market value of the portfolio. As of December 31, 2011 , a similar 100 basis point increase in interest rates across all maturities would also result in a $9 million incremental decline in the fair market value of the portfolio. Such losses would only be realized if we sold the investments prior to maturity.
Actual future gains and losses associated with our investments may differ from the sensitivity analysis performed as of December 31, 2012
due to the inherent limitations associated with predicting the changes in the timing and level of interest rates and our actual exposures and positions.
A hypothetical increase of 100 basis points in short-term interest rates would not have a material impact on our revolving credit facility,
which bears a floating interest rate. This sensitivity analysis assumes all other variables will remain constant in future periods. Our Notes bear fixed interest rates, and therefore, would not be subject to interest rate risk.
45
• the issuance of restricted stock units and the related cash payments we make for withholding taxes due from employees; • repurchases of our Class A common stock; • changes in tax laws; • technological advances; • our competitors’ responses to our products and our anticipation of and responses to their products; • our relationships with suppliers and customers; • the availability and cost of sufficient foundry, assembly and test capacity and packaging materials; and • the level of exercises of stock options and stock purchases under our employee stock purchase plan.

Table of Contents Exchange Rate Risk
We consider our direct exposure to foreign exchange rate fluctuations to be minimal. Currently, sales to customers and arrangements with
third-party manufacturers provide for pricing and payment in United States dollars, and, therefore, are not subject to exchange rate fluctuations. Increases in the value of the United States’ dollar relative to other currencies could make our products more expensive, which could negatively impact our ability to compete. Conversely, decreases in the value of the United States dollar relative to other currencies could result in our suppliers raising their prices to continue doing business with us. Our direct exposure to foreign exchange rate fluctuations is limited primarily to employee costs for employees based outside of the U.S. Fluctuations in currency exchange rates could affect our business in the future. Item 8. Financial Statement and Supplementary Data
The financial statements and supplementary data required by this item are included in Part IV, Item 15 of this Report.
Item 9. Changes in and Disagreements with Accountants on Accounting and Financial Disclosure
None. Item 9A. Controls and Procedures
Evaluation of Disclosure Controls and Procedures
We are committed to maintaining disclosure controls and procedures designed to ensure that information required to be disclosed in our
periodic reports filed under the Exchange Act is recorded, processed, summarized and reported within the time periods specified in the SEC’s rules and forms, and that such information is accumulated and communicated to our management, including our Chief Executive Officer and Chief Financial Officer, as appropriate, to allow for timely decisions regarding required disclosure. In designing and evaluating our disclosure controls and procedures, management recognizes that any controls and procedures, no matter how well designed and operated, can provide only reasonable assurance of achieving the desired control objectives, and management necessarily is required to apply its judgment in evaluating the cost-benefit relationship of possible controls and procedures and implementing controls and procedures based on the application of management’s judgment.
Under the supervision and with the participation of our management, including our Chief Executive Officer and Chief Financial Officer,
we conducted an evaluation of our disclosure controls and procedures, as such term is defined under Rules 13a-15(e) and 15d-15(e) promulgated under the Exchange Act. Based on this evaluation, our Chief Executive Officer and our Chief Financial Officer concluded that our disclosure controls and procedures were effective at a reasonable assurance level as of December 31, 2012 , the end of the period covered by this Report.
Changes in Internal Control Over Financial Reporting
There has been no change in our internal control over financial reporting (as defined in Rules 13a-15(f) and 15d-15(f) of the Exchange
Act) during the three months ended December 31, 2012 that has materially affected, or is reasonably likely to materially affect, our internal control over financial reporting.
Inherent Limitations on Internal Control
A control system, no matter how well conceived and operated, can provide only reasonable, not absolute, assurance that the objectives of
the control system are met. Further, the benefits of controls must be considered relative to their costs. Because of the inherent limitations in all control systems, no evaluation of controls can provide absolute assurance that all control issues and instances of management override or improper acts, if any, have been detected. These inherent limitations include the realities that judgments in decision making can be faulty, and that breakdowns can occur because of simple errors or mistakes. Additionally, controls can be circumvented by the individual acts of some persons, by collusion of two or more people, or by management override of the control. The design of any system of controls is also based in part upon certain assumptions about the likelihood of future events, and there can be no assurance that any design will succeed in achieving its stated goals under all potential future conditions. Because of the inherent limitations in a cost-effective control system, misstatements due to management override, error or improper acts may occur and not be detected. Any resulting misstatement or loss may have an adverse and material effect on our business, financial condition and results of operations.
46

Table of Contents
Management’s Report on Internal Control over Financial Reporting
Our management is responsible for establishing and maintaining adequate internal control over financial reporting, as such term is defined
in Exchange Act Rule 13a-15(f). Under the supervision and with the participation of our management, including our principal executive officer and principal financial officer, we conducted an evaluation of the effectiveness of our internal control over financial reporting based on the framework set forth in Internal Control — Integrated Framework issued by the Committee of Sponsoring Organizations of the Treadway Commission. Based on our evaluation under the framework set forth in Internal Control — Integrated Framework, our management concluded that our internal control over financial reporting was effective as of December 31, 2012 . The effectiveness of our internal control over financial reporting as of December 31, 2012 has been audited by KPMG LLP, an independent registered public accounting firm, as stated in their report which is included in Part IV. Item 9B. Other Information
None.
47

Table of Contents
PART III
Item 10. Directors, Executive Officers and Corporate Governance
(a) Identification and Business Experience of Directors. The information under the caption “Election of Directors,” appearing in our
Definitive Proxy Statement to be filed with the Securities and Exchange Commission in connection with the 2013 Annual Meeting of Shareholders, referred to as the 2013 Proxy Statement, is hereby incorporated by reference.
(b) Identification and Business Experience of Executive Officers . The information under the caption “Executive Compensation and
Other Information — Executive Officers,” appearing in the 2013 Proxy Statement, is hereby incorporated by reference. (c) Compliance with Section 16(a) of the Exchange Act. The information under the caption “Ownership of Securities — Section 16(a)
Beneficial Ownership Reporting Compliance,” appearing in the 2013 Proxy Statement, is hereby incorporated by reference. (d) Code of Ethics. The information under the caption “Corporate Governance and Board Matters,” appearing in the 2013 Proxy
Statement, is hereby incorporated by reference. (e) Audit Committee. The information under the caption “Corporate Governance and Board Matters — Audit Committee,” appearing in
the 2013 Proxy Statement, is hereby incorporated by reference. Item 11. Executive Compensation
The information under the caption “Executive Compensation and Other Information” and “Corporate Governance and Board Matters —
Compensation of Non-Employee Directors,” appearing in the 2013 Proxy Statement, is hereby incorporated by reference. Item 12. Security Ownership of Certain Beneficial Owners and Management and Related Stockholder Matters
The information under the captions “Equity Compensation Plan Information” and “Ownership of Securities,” appearing in the 2013 Proxy
Statement, is hereby incorporated by reference. Item 13. Certain Relationships and Related Transactions, and Director Independence
The information under the captions “Certain Relationships and Related Transactions” and “Corporate Governance and Board Matter —
Director Independence” appearing in the 2013 Proxy Statement, is hereby incorporated by reference.
Item 14. Principal Accounting Fees and Services The information under the caption “Audit Information — Fees Paid to Independent Registered Public Accounting Firm,” appearing in the
2013 Proxy Statement, is hereby incorporated by reference.
48
Table of Contents
PART IV Item 15. Exhibits, Financial Statement Schedule
(a) 1. Financial Statements. The following Broadcom consolidated financial statements, and related notes thereto, and the related Reports of our Independent
Registered Public Accounting Firm are filed as part of this Form 10-K:
2. Financial Statement Schedules.
The following financial statement schedule of Broadcom is filed as part of this Form 10-K:
All other schedules have been omitted because they are not applicable or not required, or the information is included in the Consolidated
Financial Statements or Notes thereto.
3. Exhibits.
The exhibits listed on the accompanying index to exhibits immediately following the financial statements are filed as part of, or hereby incorporated by reference into, this Report.
49
Page
Reports of Independent Registered Public Accounting Firm F-1
Consolidated Balance Sheets as of December 31, 2012 and 2011 F-3
Consolidated Statements of Income for the years ended December 31, 2012, 2011 and 2010 F-4
Consolidated Statements of Comprehensive Income for the years ended December 31, 2012, 2011 and 2010 F-5
Consolidated Statements of Shareholders’ Equity for the years ended December 31, 2012, 2011 and 2010 F-6
Consolidated Statements of Cash Flows for the years ended December 31, 2012, 2011 and 2010 F-7
Notes to Consolidated Financial Statements F-8
Page
Schedule II — Consolidated Valuation and Qualifying Accounts S-1

Table of Contents
Report of Independent Registered Public Accounting Firm The Board of Directors and Shareholders Broadcom Corporation: We have audited the accompanying consolidated balance sheets of Broadcom Corporation and subsidiaries as of December 31, 2012 and 2011, and the related consolidated statements of income, comprehensive income, shareholders' equity, and cash flows for each of the years in the three-year period ended December 31, 2012. In connection with our audits of the consolidated financial statements, we also have audited the consolidated financial statement schedule of valuation and qualifying accounts. These consolidated financial statements and financial statement schedule are the responsibility of the Company's management. Our responsibility is to express an opinion on these consolidated financial statements and financial statement schedule based on our audits. We conducted our audits in accordance with the standards of the Public Company Accounting Oversight Board (United States). Those standards require that we plan and perform the audit to obtain reasonable assurance about whether the financial statements are free of material misstatement. An audit includes examining, on a test basis, evidence supporting the amounts and disclosures in the financial statements. An audit also includes assessing the accounting principles used and significant estimates made by management, as well as evaluating the overall financial statement presentation. We believe that our audits provide a reasonable basis for our opinion. In our opinion, the consolidated financial statements referred to above present fairly, in all material respects, the financial position of Broadcom Corporation and subsidiaries as of December 31, 2012 and 2011, and the results of their operations and their cash flows for each of the years in the three-year period ended December 31, 2012, in conformity with U.S. generally accepted accounting principles. Also in our opinion, the related consolidated financial statement schedule, when considered in relation to the basic consolidated financial statements taken as a whole, presents fairly, in all material respects, the information set forth therein. As discussed in Note 1 to the consolidated financial statements, the Company changed its presentation of other comprehensive income in 2012 due to the adoption of FASB Accounting Standards Codification (ASC) Topic 220, Presentation of Comprehensive Income , and changed its method of testing goodwill for impairment in 2011 due to the adoption of FASB Accounting Standards Codification (ASC) Topic 350, Testing Goodwill for Impairment . We also have audited, in accordance with the standards of the Public Company Accounting Oversight Board (United States), Broadcom's internal control over financial reporting as of December 31, 2012, based on criteria established in Internal Control - Integrated Framework issued by the Committee of Sponsoring Organizations of the Treadway Commission (COSO), and our report dated January 30, 2013 expressed an unqualified opinion on the effectiveness of the Company's internal control over financial reporting. /s/ KPMG LLP Irvine, California January 30, 2013
F-1

Table of Contents
Report of Independent Registered Public Accounting Firm The Board of Directors and Shareholders Broadcom Corporation: We have audited Broadcom Corporation's internal control over financial reporting as of December 31, 2012, based on criteria established in Internal Control - Integrated Framework issued by the Committee of Sponsoring Organizations of the Treadway Commission (COSO). Broadcom Corporation's management is responsible for maintaining effective internal control over financial reporting and for its assessment of the effectiveness of internal control over financial reporting, included in the accompanying Management's Report on Internal Control over Financial Reporting appearing under Item 9A. Our responsibility is to express an opinion on the Company's internal control over financial reporting based on our audit. We conducted our audit in accordance with the standards of the Public Company Accounting Oversight Board (United States). Those standards require that we plan and perform the audit to obtain reasonable assurance about whether effective internal control over financial reporting was maintained in all material respects. Our audit included obtaining an understanding of internal control over financial reporting, assessing the risk that a material weakness exists, and testing and evaluating the design and operating effectiveness of internal control based on the assessed risk. Our audit also included performing such other procedures as we considered necessary in the circumstances. We believe that our audit provides a reasonable basis for our opinion. A company's internal control over financial reporting is a process designed to provide reasonable assurance regarding the reliability of financial reporting and the preparation of financial statements for external purposes in accordance with generally accepted accounting principles. A company's internal control over financial reporting includes those policies and procedures that (1) pertain to the maintenance of records that, in reasonable detail, accurately and fairly reflect the transactions and dispositions of the assets of the company; (2) provide reasonable assurance that transactions are recorded as necessary to permit preparation of financial statements in accordance with generally accepted accounting principles, and that receipts and expenditures of the company are being made only in accordance with authorizations of management and directors of the company; and (3) provide reasonable assurance regarding prevention or timely detection of unauthorized acquisition, use, or disposition of the company's assets that could have a material effect on the financial statements. Because of its inherent limitations, internal control over financial reporting may not prevent or detect misstatements. Also, projections of any evaluation of effectiveness to future periods are subject to the risk that controls may become inadequate because of changes in conditions, or that the degree of compliance with the policies or procedures may deteriorate. In our opinion, Broadcom Corporation maintained, in all material respects, effective internal control over financial reporting as of December 31, 2012, based on criteria established in Internal Control - Integrated Framework issued by the Committee of Sponsoring Organizations of the Treadway Commission (COSO). We also have audited, in accordance with the standards of the Public Company Accounting Oversight Board (United States), the consolidated balance sheets of Broadcom Corporation and subsidiaries as of December 31, 2012 and 2011, and the related consolidated statements of income, comprehensive income, shareholders' equity, and cash flows for each of the years in the three-year period ended December 31, 2012, and our report dated January 30, 2013, expressed an unqualified opinion on those consolidated financial statements. /s/ KPMG LLP Irvine, California January 30, 2013
F-2
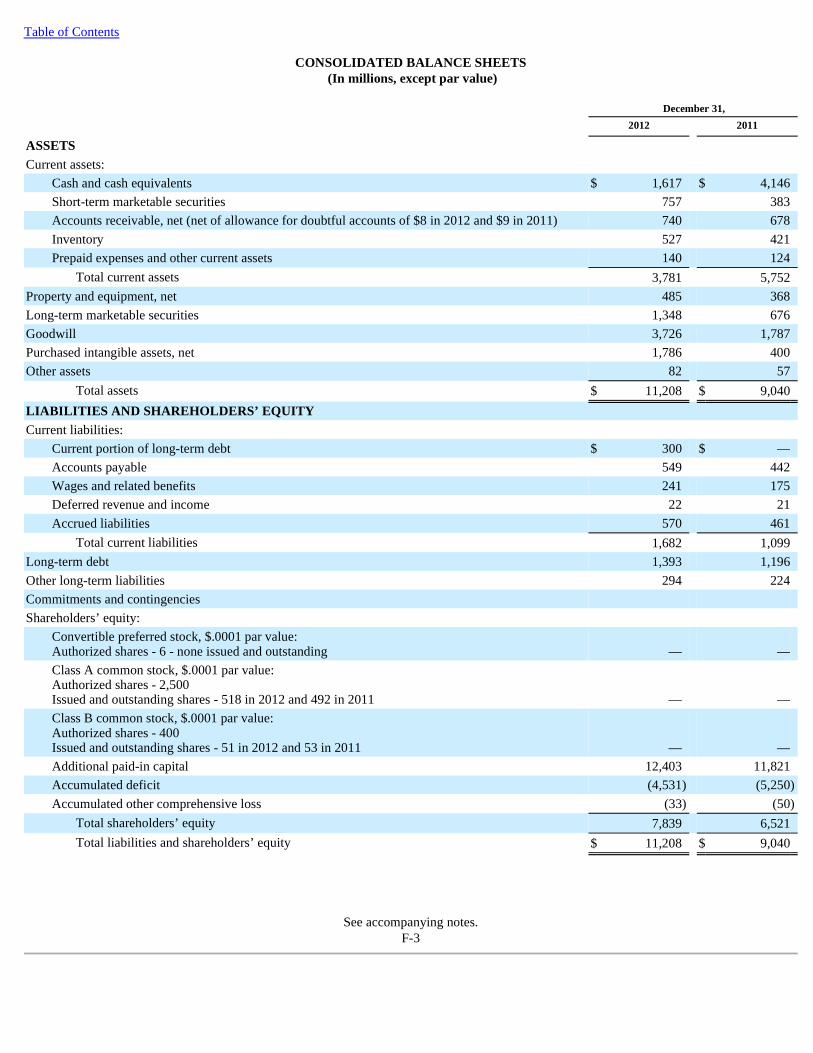
Table of Contents
CONSOLIDATED BALANCE SHEETS (In millions, except par value)
See accompanying notes. F-3
December 31,
2012 2011
ASSETS Current assets:
Cash and cash equivalents $ 1,617 $ 4,146 Short-term marketable securities 757 383 Accounts receivable, net (net of allowance for doubtful accounts of $8 in 2012 and $9 in 2011) 740 678 Inventory 527 421 Prepaid expenses and other current assets 140 124
Total current assets 3,781 5,752 Property and equipment, net 485 368 Long-term marketable securities 1,348 676 Goodwill 3,726 1,787 Purchased intangible assets, net 1,786 400 Other assets 82 57
Total assets $ 11,208 $ 9,040 LIABILITIES AND SHAREHOLDERS’ EQUITY
Current liabilities:
Current portion of long-term debt $ 300 $ — Accounts payable 549 442 Wages and related benefits 241 175 Deferred revenue and income 22 21 Accrued liabilities 570 461
Total current liabilities 1,682 1,099 Long-term debt 1,393 1,196 Other long-term liabilities 294 224 Commitments and contingencies Shareholders’ equity:
Convertible preferred stock, $.0001 par value: Authorized shares - 6 - none issued and outstanding — — Class A common stock, $.0001 par value: Authorized shares - 2,500 Issued and outstanding shares - 518 in 2012 and 492 in 2011 — — Class B common stock, $.0001 par value: Authorized shares - 400 Issued and outstanding shares - 51 in 2012 and 53 in 2011 — — Additional paid-in capital 12,403 11,821 Accumulated deficit (4,531 ) (5,250 )
Accumulated other comprehensive loss (33 ) (50 )
Total shareholders’ equity 7,839 6,521 Total liabilities and shareholders’ equity $ 11,208 $ 9,040

Table of Contents
CONSOLIDATED STATEMENTS OF INCOME (In millions, except per share data)
The following table presents details of total stock-based compensation expense included in each functional line item in the consolidated
statements of income above:
See accompanying notes. F-4
Year Ended December 31,
2012 2011 2010
Net revenue:
Product revenue $ 7,793 $ 7,159 $ 6,589 Income from Qualcomm Agreement 186 207 206 Licensing revenue 27 23 23
Total net revenue 8,006 7,389 6,818 Costs and expenses:
Cost of product revenue 4,027 3,626 3,284 Research and development 2,318 1,983 1,763 Selling, general and administrative 696 682 589 Amortization of purchased intangible assets 113 30 28 Impairments of long-lived assets 90 92 19 Restructuring costs, net 7 16 — Settlement costs (gains), net 79 (18 ) 53 Charitable contribution — 25 —
Total operating costs and expenses 7,330 6,436 5,736 Income from operations 676 953 1,082 Interest income (expense), net (30 ) (5 ) 9 Other income, net 10 8 7 Income before income taxes 656 956 1,098 Provision for (benefit of) income taxes (63 ) 29 16 Net income $ 719 $ 927 $ 1,082 Net income per share (basic) $ 1.29 $ 1.72 $ 2.13 Net income per share (diluted) $ 1.25 $ 1.65 $ 1.99 Weighted average shares (basic) 558 539 508 Weighted average shares (diluted) 576 563 545 Dividends per share $ 0.40 $ 0.36 $ 0.32
Year Ended December 31,
2012 2011 2010
(In millions)
Cost of product revenue $ 27 $ 24 $ 23 Research and development 368 363 342 Selling, general and administrative 148 126 119

Table of Contents
CONSOLIDATED STATEMENTS OF COMPREHENSIVE INCOME (In millions)
See accompanying notes. F-5
Year Ended December 31,
2012 2011 2010
Net income $ 719 $ 927 $ 1,082 Other comprehensive income (loss), net of tax:
Foreign currency translation adjustments, net of $0 tax in 2012, 2011 and 2010 14 (61 ) 15 Unrealized gains (losses) on marketable securities, net of $0 tax in 2012, 2011
and 2010 3 2 (4 )
Other comprehensive income (loss) 17 (59 ) 11 Comprehensive income $ 736 $ 868 $ 1,093
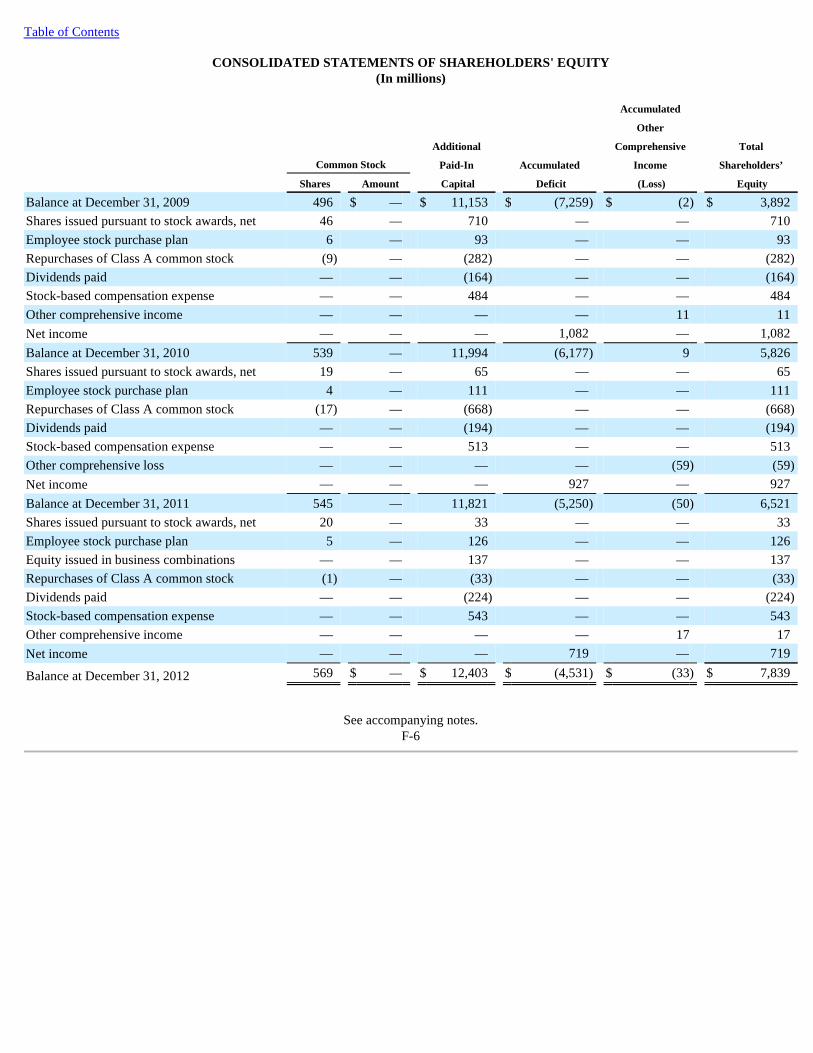
Table of Contents
CONSOLIDATED STATEMENTS OF SHAREHOLDERS' EQUITY (In millions)
See accompanying notes. F-6
Accumulated
Other
Additional Comprehensive Total
Common Stock Paid-In Accumulated Income Shareholders’
Shares Amount Capital Deficit (Loss) Equity
Balance at December 31, 2009 496 $ — $ 11,153 $ (7,259 ) $ (2 ) $ 3,892 Shares issued pursuant to stock awards, net 46 — 710 — — 710 Employee stock purchase plan 6 — 93 — — 93 Repurchases of Class A common stock (9 ) — (282 ) — — (282 )
Dividends paid — — (164 ) — — (164 )
Stock-based compensation expense — — 484 — — 484 Other comprehensive income — — — — 11 11 Net income — — — 1,082 — 1,082 Balance at December 31, 2010 539 — 11,994 (6,177 ) 9 5,826 Shares issued pursuant to stock awards, net 19 — 65 — — 65 Employee stock purchase plan 4 — 111 — — 111 Repurchases of Class A common stock (17 ) — (668 ) — — (668 )
Dividends paid — — (194 ) — — (194 )
Stock-based compensation expense — — 513 — — 513 Other comprehensive loss — — — — (59 ) (59 )
Net income — — — 927 — 927 Balance at December 31, 2011 545 — 11,821 (5,250 ) (50 ) 6,521 Shares issued pursuant to stock awards, net 20 — 33 — — 33 Employee stock purchase plan 5 — 126 — — 126 Equity issued in business combinations — — 137 — — 137 Repurchases of Class A common stock (1 ) — (33 ) — — (33 )
Dividends paid — — (224 ) — — (224 )
Stock-based compensation expense — — 543 — — 543 Other comprehensive income — — — — 17 17 Net income — — — 719 — 719
Balance at December 31, 2012 569 $ — $ 12,403 $ (4,531 ) $ (33 ) $ 7,839

Table of Contents
CONSOLIDATED STATEMENTS OF CASH FLOWS (In millions)
See accompanying notes. F-7
Year Ended December 31,
2012 2011 2010
Operating activities
Net income $ 719 $ 927 $ 1,082 Adjustments to reconcile net income to net cash provided by operating activities:
Depreciation and amortization 134 108 79 Stock-based compensation expense:
Stock options and other awards 80 119 121 Restricted stock units 463 394 363
Acquisition-related items:
Amortization of purchased intangible assets 311 84 59 Impairments of long-lived assets 90 92 19
Non-cash settlement gains (8 ) (14 ) — Gain on strategic investments and other (10 ) (1 ) (3 )
Changes in operating assets and liabilities, net of acquisitions:
Accounts receivable (16 ) 154 (287 )
Inventory (5 ) 207 (208 )
Prepaid expenses and other assets (8 ) (28 ) 27 Accounts payable 72 (201 ) 146 Deferred revenue and income 45 (33 ) (32 )
Accrued settlement costs 54 21 (122 )
Other accrued and long-term liabilities 10 9 127 Net cash provided by operating activities 1,931 1,838 1,371
Investing activities
Net purchases of property and equipment (244 ) (163 ) (109 )
Net cash paid for acquired companies (3,582 ) (347 ) (599 )
Sales (purchases) of strategic investments 27 (2 ) (4 )
Purchases of marketable securities (2,551 ) (2,768 ) (2,934 )
Proceeds from sales and maturities of marketable securities 1,554 4,143 1,467 Net cash provided by (used in) investing activities (4,796 ) 863 (2,179 )
Financing activities
Issuance of long-term debt, net 492 494 691 Repurchases of Class A common stock (33 ) (670 ) (280 )
Dividends paid (224 ) (194 ) (164 )
Payment of assumed contingent consideration and debt (57 ) — (14 )
Proceeds from issuance of common stock 311 348 936 Minimum tax withholding paid on behalf of employees for restricted stock units (153 ) (155 ) (136 )
Net cash provided by (used in) financing activities 336 (177 ) 1,033 Increase (decrease) in cash and cash equivalents (2,529 ) 2,524 225 Cash and cash equivalents at beginning of period 4,146 1,622 1,397 Cash and cash equivalents at end of period $ 1,617 $ 4,146 $ 1,622 Supplemental disclosure of cash flow information
Income taxes paid $ 25 $ 23 $ 15 Interest paid $ 27 $ 14 $ —


Table of Contents
NOTES TO CONSOLIDATED FINANCIAL STATEMENTS December 31, 2012
Our Company
Broadcom Corporation (including our subsidiaries, referred to collectively in this Report as “Broadcom,” “we,” “our” and “us”) is a global leader and innovator in semiconductor solutions for wired and wireless communications. Broadcom ® products seamlessly deliver voice, video, data and multimedia connectivity in the home, office and mobile environments. We provide the industry’s broadest portfolio of state-of-the-art system-on-a-chip, or SoC, and embedded software solutions.
Basis of Presentation
Our consolidated financial statements include the accounts of Broadcom and our subsidiaries. All significant intercompany accounts and transactions have been eliminated in consolidation. Certain amounts previously reported in the consolidated financial statements have been reclassified to conform to current year presentation. Such reclassifications had an impact of $1 million or less and did not affect net income, shareholders' equity or cash flows.
We changed our presentation of other comprehensive income due to the adoption of Financial Accounting Standards Board, or FASB,
Accounting Standards Codification (ASC) Topic 220, Presentation of Comprehensive Income, and changed our method of testing goodwill for impairment in 2011 due to the adoption of FASB, ASC Topic 350, Testing Goodwill for Impairment . The adoption of these accounting standards did not have a material impact on our consolidated financial statements.
In February 2012 we completed our acquisition of NetLogic Microsystems, Inc., or NetLogic, and in April 2012 we completed our
acquisition of BroadLight, Inc., or BroadLight. The consolidated financial statements include the results of operations of NetLogic and BroadLight commencing as of the acquisition dates and are included in our Infrastructure and Networking, and Broadband Communications reportable segments, respectively. See Note 3 for a further discussion.
Foreign Currency
The functional currency for most of our international operations is the U.S. dollar. Assets and liabilities denominated in foreign currencies are translated using the exchange rates on the balance sheet dates. Revenues and expenses are translated using the average exchange rates prevailing during the year. Any translation adjustments resulting from this process are shown separately as a component of accumulated other comprehensive income (loss) within shareholders’ equity in the consolidated balance sheets. Foreign currency transaction gains and losses are reported in other income, net in the consolidated statements of income. Use of Estimates
The preparation of financial statements in accordance with United States generally accepted accounting principles, or GAAP, requires management to make estimates and assumptions that affect the reported amounts of assets and liabilities at the dates of the financial statements and the reported amounts of total net revenue and expenses in the reporting periods. We regularly evaluate estimates and assumptions related to revenue recognition, rebates, allowances for doubtful accounts, sales returns and allowances, warranty obligations, inventory valuation, stock-based compensation expense, goodwill and purchased intangible asset valuations, strategic investments, deferred income tax asset valuation allowances, uncertain tax positions, tax contingencies, self-insurance, restructuring costs or reversals, litigation and other loss contingencies. These estimates and assumptions are based on current facts, historical experience and various other factors that we believe to be reasonable under the circumstances, the results of which form the basis for making judgments about the carrying values of assets and liabilities and the recording of revenue, costs and expenses that are not readily apparent from other sources. The actual results we experience may differ materially and adversely from our estimates. To the extent there are material differences between the estimates and actual results, our future results of operations will be affected.
Revenue Recognition
We derive revenue principally from sales of integrated circuit products, royalties and license fees for our intellectual property and software and related services. The timing of revenue recognition and the amount of revenue actually recognized for each arrangement depends upon a variety of factors, including the specific terms of each arrangement and the nature of our
F-8
1. Summary of Significant Accounting Policies

Table of Contents deliverables and obligations. Determination of the appropriate amount of revenue recognized involves judgments and estimates that we believe are reasonable, but actual results may differ from our estimates. We recognize product revenue when all of the following criteria are met: (i) persuasive evidence of an arrangement exists, (ii) delivery has occurred, (iii) the price to the customer is fixed or determinable, and (iv) collection of the resulting receivable is reasonably assured. These criteria are usually met at the time of product shipment. However, we do not recognize revenue when any future performance obligations remain. We record reductions of revenue for estimated product returns and pricing adjustments, such as competitive pricing programs and rebates, in the same period that the related revenue is recorded. The amount of these reductions is based on historical sales returns, analysis of credit memo data, specific criteria included in rebate agreements, and other factors known at the time. We accrue 100% of potential rebates at the time of sale and do not apply a breakage factor. We reverse the accrual for unclaimed rebate amounts as specific rebate programs contractually end and when we believe unclaimed rebates are no longer subject to payment and will not be paid. See Note 2 for a summary of our rebate activity.
Multiple Element Arrangements Excluding Software
We occasionally enter into revenue arrangements that contain multiple deliverables. Judgment is required to properly identify the accounting units of the multiple deliverable transactions and to determine the manner in which revenue should be allocated among the accounting units. Moreover, judgment is used in interpreting the commercial terms and determining when all criteria of revenue recognition have been met for each deliverable in order for revenue recognition to occur in the appropriate accounting period. While changes in the allocation of the arrangement consideration between the units of accounting will not affect the amount of total revenue recognized for a particular sales arrangement, any material changes in these allocations could impact the timing of revenue recognition, which could affect our results of operations. When we enter into an arrangement that includes multiple elements, the allocation of value to each element is derived based on management’s best estimate of selling price when vendor specific evidence or third party evidence is unavailable.
Distributor Revenue
A portion of our product sales is made through distributors under agreements allowing for pricing credits and/or rights of return. These pricing credits and/or right of return provisions prevent us from being able to reasonably estimate the final price of the inventory to be sold and the amount of inventory that could be returned pursuant to these agreements. As a result, the fixed and determinable revenue recognition criterion has not been met at the time we deliver products to our distributors. Accordingly, product revenue from sales made through these distributors is not recognized until the distributors ship the product to their customers.
Software, Royalties and Cancellation Fee Revenue
Revenue from software licenses is recognized when all of the software revenue recognition criteria are met and, if applicable, when vendor specific objective evidence, or VSOE, exists to allocate the total license fee to each element of multiple-element software arrangements, including post-contract customer support. Post-contract support is recognized ratably over the support period. When a contract contains multiple elements wherein the only undelivered element is post-contract customer support and VSOE of the fair value of post-contract customer support does not exist, revenue from the entire arrangement is recognized ratably over the support period. Software royalty revenue is recognized in arrears on a quarterly basis, based upon reports received from licensees during the period, unless collectability is not reasonably assured, in which case revenue is recognized when payment is received from the licensee. Revenue from cancellation fees is recognized when cash is received from the customer.
Licensing Revenue
We license or otherwise provide rights to use portions of our intellectual property, which includes certain patent rights essential to and/or utilized in the manufacture and sale of certain wireless products. Licensees typically pay a license fee in one or more installments and ongoing royalties based on their sales of products incorporating or using our licensed intellectual property. License fees are recognized over the estimated period of benefit to the licensee or the term specified. We recognize licensing revenue on the sale of patents when all of the following criteria are met: (i) persuasive evidence of an arrangement exist, (ii) delivery has occurred, (iii) the price to be paid by the purchaser is fixed or determinable and (iv) collection of the resulting accounts receivable is reasonably assured. These criteria are usually met at the time of patent transfer. We recognize royalty revenues based on royalties reported by licensees and when other revenue recognition criteria are met, which is generally a quarter in arrears from the period earned.
F-9

Table of Contents
Income from the Qualcomm Agreement
On April 26, 2009 we entered into a four -year Settlement and Patent License and Non-Assert Agreement, or the Qualcomm Agreement, with Qualcomm Incorporated, or Qualcomm. The Qualcomm Agreement is a multiple element arrangement which includes: (i) an exchange of intellectual property rights, including in certain circumstances, by a series of covenants not to assert claims of patent infringement under future patents issued within one to four years of the execution date of the agreement, (ii) the assignment of certain existing patents by Broadcom to Qualcomm with Broadcom retaining a royalty-free license under these patents, and (iii) the settlement of all outstanding litigation and claims between Broadcom and Qualcomm. The proceeds of the Qualcomm Agreement were allocated amongst the principal elements of the transaction. A gain of $65 million from the settlement of litigation was immediately recognized as a reduction in settlement costs that approximates the value of awards determined by the United States District Court for the Central District of California. The remaining consideration was predominantly associated with the transfer of current and future intellectual property rights and is being recognized within net revenue over the performance period of four years as a single unit of accounting. However, this income will be limited to the lesser of the cumulative straight-line amortization over the four year performance period or the cumulative cash proceeds received.
Deferred Revenue and Income
We defer revenue and income when advance payments are received from customers before performance obligations have been completed and/or services have been performed. Deferred revenue does not include amounts from products delivered to distributors that the distributors have not yet sold through to their end customers.
Cost of Product Revenue
Cost of product revenue comprises the cost of our semiconductor devices, which consists of the cost of purchasing finished silicon wafers
manufactured by independent foundries, costs associated with our purchase of assembly, test and quality assurance services and packaging materials for semiconductor products, as well as royalties paid to vendors for use of their technology. Also included in cost of product revenue is the amortization of purchased technology, and manufacturing overhead, including costs of personnel and equipment associated with manufacturing support, product warranty costs, provisions for excess and obsolete inventories, and stock-based compensation expense for personnel engaged in manufacturing support. Concentration of Credit Risk
Sales to our recurring customers are generally made on open account while sales to occasional customers are typically made on a prepaid
or letter of credit basis. We perform periodic credit evaluations of our recurring customers and generally do not require collateral. An allowance for doubtful accounts is maintained for potential credit losses, which losses historically have not been significant.
We invest our cash in U.S. Treasury instruments, in deposits and money market funds with major financial institutions and in commercial
paper, asset-backed securities and corporate and agency bonds. We place our cash investments in instruments that meet high credit quality standards, as specified in our investment policy guidelines. These guidelines also limit the amount of credit exposure to any one issue, issuer or type of instrument. It is generally our policy to invest in instruments that have a final maturity of no longer than three years , with a portfolio weighted average maturity of no longer than 18 months . Fair Value of Financial Instruments
Our financial instruments consist principally of cash and cash equivalents, short- and long-term marketable securities, accounts receivable, accounts payable and long-term debt. The fair value of a financial instrument is the amount that would be received in an asset sale or paid to transfer a liability in an orderly transaction between unaffiliated market participants. Assets and liabilities measured at fair value are categorized based on whether or not the inputs are observable in the market and the degree that the inputs are observable. The categorization of financial instruments within the valuation hierarchy is based upon the lowest level of input that is significant to the fair value measurement. The hierarchy is prioritized into three levels (with Level 3 being the lowest) defined as follows:
Level 1: Inputs are based on quoted market prices for identical assets or liabilities in active markets at the measurement
date.
F-10
Table of Contents
Level 2: Inputs include quoted prices for similar assets or liabilities in active markets and/or quoted prices for identical or similar assets or liabilities in markets that are not active near the measurement date.
Level 3: Inputs include management’s best estimate of what market participants would use in pricing the asset or liability at the measurement date. The inputs are unobservable in the market and significant to the instrument’s valuation.
The fair value of the majority of our cash equivalents and marketable securities was determined based on “Level 1” inputs. The fair value
of certain marketable securities and our long-term debt were determined based on “Level 2” inputs. The valuation techniques used to measure the fair value of our “Level 2” instruments were valued based on quoted market prices or model driven valuations using significant inputs derived from or corroborated by observable market data. We do not have any marketable securities in the “Level 3” category. We believe that the recorded values of all our other financial instruments approximate their current fair values because of their nature and respective relatively short maturity dates or durations.
Cash, Cash Equivalents and Marketable Securities
We consider all highly liquid investments that are readily convertible into cash and have a maturity of three months or less at the time of purchase to be cash equivalents. The cost of these investments approximates their fair value. We maintain an investment portfolio of various security holdings, types and maturities. We define marketable securities as income yielding securities that can be readily converted into cash. Marketable securities’ short-term and long-term classifications are based on remaining maturities at each reporting period. Examples of marketable securities include U.S. Treasury and agency obligations, commercial paper, asset-back securities and corporate bonds. We place our cash investments in instruments that meet various parameters, including credit quality standards as specified in our investment policy. We do not use derivative financial instruments.
We account for our investments in debt instruments as available-for-sale. Management determines the appropriate classification of such
securities at the time of purchase and re-evaluates such classification as of each balance sheet date. Cash equivalents and marketable securities are reported at fair value with the related unrealized gains and losses included in accumulated other comprehensive loss, a component of shareholders’ equity, net of tax. We assess whether our investments with unrealized loss positions are other than temporarily impaired. Unrealized gains and losses and declines in value judged to be other than temporary are determined based on the specific identification method and are reported in other income, net in the consolidated statements of income.
Allowance for Doubtful Accounts
We evaluate the collectibility of accounts receivable based on a combination of factors. In cases where we are aware of circumstances that
may impair a specific customer’s ability to meet its financial obligations subsequent to the original sale, we will record an allowance against amounts due, and thereby reduce the net recognized receivable to the amount we reasonably believe will be collected. For all other customers, we recognize allowances for doubtful accounts based on the length of time the receivables are past due, industry and geographic concentrations, the current business environment and our historical experience. Inventory
Inventory consists of work in process and finished goods and is stated at the lower of cost (first-in, first-out) or market. We write down the
carrying value of our inventory to net realizable value for estimated obsolescence or unmarketable inventory in an amount equal to the difference between the cost of inventory and its estimated realizable value based upon assumptions about future demand and market conditions, among other factors. Shipping and handling costs are classified as a component of cost of product revenue in the consolidated statements of income. Inventory acquired through business combinations is recorded at its acquisition date fair value which is the net realizable value less a normal profit margin depending on the stage of inventory completion. Property and Equipment
Property and equipment are carried at cost. Depreciation and amortization are provided using the straight-line method over the assets’
estimated remaining useful lives, ranging from one to ten years. Depreciation and amortization of leasehold improvements are computed using the shorter of the remaining lease term or ten years.
F-11

Table of Contents Goodwill and Other Long-Lived Assets
Goodwill is recorded as the difference, if any, between the aggregate consideration paid for an acquisition and the fair value of the acquired net tangible and intangible assets. Other long-lived assets primarily represent purchased intangible assets including developed technology, customer relationships and in-process research and development, or IPR&D. We currently amortize our intangible assets with definitive lives over periods ranging from one to fourteen years using a method that reflects the pattern in which the economic benefits of the intangible assets are consumed or otherwise used or, if that pattern cannot be reliably determined, using a straight-line amortization method. We capitalize IPR&D projects acquired as part of a business combination. On completion of each project, IPR&D assets are reclassified to developed technology and amortized over their estimated useful lives.
Impairment of Goodwill and Other Long-Lived Assets
We evaluate goodwill on an annual basis in the fourth quarter or more frequently if we believe indicators of impairment exist. We first assess qualitative factors to determine whether it is more likely than not that the fair value of a reporting unit is less than its carrying amount. If we conclude that it is more likely than not that the fair value of a reporting units is less than its carrying amount, we conduct a two-step quantitative goodwill impairment test. The first step of the impairment test involves comparing the fair values of the applicable reporting units with their carrying values. We estimate the fair values of our reporting units using a combination of the income and market approach. If the carrying amount of a reporting unit exceeds the reporting unit’s fair value, we perform the second step of the goodwill impairment test. The second step of the goodwill impairment test involves comparing the implied fair value of the affected reporting unit’s goodwill with the carrying value of that goodwill. The amount, by which the carrying value of the goodwill exceeds its implied fair value, if any, is recognized as an impairment loss.
During development, IPR&D is not subject to amortization and is tested for impairment annually or more frequently if events or changes
in circumstances indicate that the asset might be impaired. We first assess qualitative factors to determine whether it is more likely than not that the fair value of IPR&D is less than its carrying amount, and if so, we conduct a quantitative impairment test. The impairment test consists of a comparison of the fair value to its carrying amount. If the carrying value exceeds its fair value, an impairment loss is recognized in an amount equal to that excess. Once an IPR&D project is complete, it becomes a definite lived intangible asset and is evaluated for impairment in accordance with our policy for long-lived assets.
We test long-lived assets and purchased intangible assets (other than goodwill and IPR&D) for impairment if we believe indicators of
impairment exist. We determine whether the carrying value of an asset or asset group is recoverable, based on comparisons to undiscounted expected future cash flows that the assets are expected to generate. If an asset is not recoverable, we record an impairment loss equal to the amount by which the carrying value of the asset exceeds its fair value. We primarily use the income valuation approach to determine the fair value of our long lived assets and purchased intangible assets.
Warranty
Our products typically carry a one to three year warranty. We establish reserves for estimated product warranty costs at the time revenue is recognized based upon our historical warranty experience, and additionally for any known product warranty issues. If actual costs differ from our initial estimates, we record the difference in the period they are identified. Actual claims are charged against the warranty reserve. See Note 2 for a summary of our warranty activity. Guarantees and Indemnifications
In some agreements to which we are a party, we have agreed to indemnify the other party for certain matters, including, but not limited to product liability. We include intellectual property indemnification provisions in our standard terms and conditions of sale for our products and have also included such provisions in certain agreements with third parties. We have and will continue to evaluate and provide reasonable assistance for these other parties. This may include certain levels of financial support to minimize the impact of the litigation in which the other parties are involved. In connection with our senior unsecured notes, as described below, we have agreed to customary indemnification provisions with the underwriters. To date, there have been no known events or circumstances that have resulted in any material costs related to these indemnification provisions and no liabilities therefor have been recorded in the accompanying consolidated financial statements. However, the maximum potential amount of the future payments we could be required to make under these indemnification obligations could be significant.
F-12
Table of Contents
We have obligations to indemnify certain of our present and former directors, officers and employees to the maximum extent not prohibited by law. Under these obligations, Broadcom is required (subject to certain exceptions) to indemnify each such director, officer and employee against expenses, including attorneys’ fees, judgments, fines and settlements, paid by such individual. The potential amount of the future payments we could be required to make under these indemnification obligations could be significant. We maintain directors’ and officers’ insurance policies that may generally limit our exposure and enable us to recover a portion of the amounts paid with respect to such obligations.
Income Taxes
We utilize the asset and liability method of accounting for income taxes, under which deferred taxes are determined based on the
temporary differences between the financial statement and tax basis of assets and liabilities using tax rates expected to be in effect during the years in which the basis differences reverse. We record a valuation allowance to reduce our deferred tax assets to the amount that we believe is more likely than not to be realized. In assessing the need for a valuation allowance, we consider all positive and negative evidence, including scheduled reversals of deferred tax liabilities, projected future taxable income, tax planning strategies, and recent financial performance. Forming a conclusion that a valuation allowance is not required is difficult when there is negative evidence such as cumulative losses in recent years. As a result of our cumulative losses in the U.S. and certain foreign jurisdictions, our U.S. tax losses after tax deductions for stock-based compensation, and the full utilization of our loss carryback opportunities, we have concluded that a full valuation allowance against our net deferred tax assets is appropriate in the U.S. and certain foreign jurisdictions. In certain other foreign jurisdictions where we do not have cumulative losses, we record valuation allowances to reduce our net deferred tax assets to the amount we believe is more likely than not to be realized. In certain jurisdictions, we have tax deductions from stock-based compensation that exceed the stock-based compensation recorded for such instruments. To the extent such excess tax benefits are ultimately realized, they will increase shareholders' equity. We utilize the with-and-without approach in determining if and when such excess tax benefits are realized, and under this approach excess tax benefits related to stock-based compensation are the last to be realized.
Income tax positions must meet a more-likely-than-not recognition threshold to be recognized. Income tax positions that previously failed
to meet the more-likely-than-not threshold are recognized in the first subsequent financial reporting period in which that threshold is met. Previously recognized tax positions that no longer meet the more-likely-than-not threshold are derecognized in the first subsequent financial reporting period in which that threshold is no longer met. We recognize potential accrued interest and penalties related to unrecognized tax benefits within the consolidated statements of income as income tax expense. Research and Development Expense
Research and development expenditures are expensed in the period incurred. Stock-Based Compensation
Broadcom has in effect stock incentive plans under which incentive stock options have been granted to employees and restricted stock units and non-qualified stock options have been granted to employees and non-employee members of the Board of Directors. We also have an employee stock purchase plan for all eligible employees. We are required to estimate the fair value of share-based awards on the date of grant. The value of the award is principally recognized as an expense ratably over the requisite service periods. The fair value of our restricted stock units is based on the closing market price of our Class A common stock on the date of grant less our expected dividend yield. We have estimated the fair value of stock options and stock purchase rights as of the date of grant or assumption using the Black-Scholes option pricing model, which was developed for use in estimating the value of traded options that have no vesting restrictions and that are freely transferable. The Black-Scholes model considers, among other factors, the expected life of the award, the expected volatility of our stock price and the expected dividend yield. We evaluate the assumptions used to value stock options and stock purchase rights on a quarterly basis. The fair values generated by the Black-Scholes model may not be indicative of the actual fair values of our equity awards, as it does not consider other factors important to those awards to employees, such as continued employment, periodic vesting requirements and limited transferability.
F-13

Table of Contents Litigation and Settlement Costs
Legal costs are expensed as incurred. We are involved in disputes, litigation and other legal actions in the ordinary course of business. We continually evaluate uncertainties associated with litigation and record a charge equal to at least the minimum estimated liability for a loss contingency when both of the following conditions are met: (i) information available prior to issuance of the financial statements indicates that it is probable that an asset had been impaired or a liability had been incurred at the date of the financial statements and (ii) the loss or range of loss can be reasonably estimated. In the event of settlement discussions, this generally occurs when an agreement in principle has been reached by both parties that includes substantive terms, conditions and amounts. If a settlement has more than one element, we account for the agreement as a multiple element arrangement and allocate the consideration to the identifiable elements based on relative fair value. Past multiple element settlement agreements have included the licensing of intellectual property for future use and payments related to alleged prior infringement.
We use a relief-from-royalty method to value patented technology in settlement agreements related to alleged patent infringement, based
on market royalties for similar fundamental technologies. The relief-from-royalty method estimates the cost savings that accrue to the owner of an intangible asset that would otherwise be payable as royalties or license fees on revenues earned through the use of the asset. The royalty rate used is based on an analysis of empirical, market-derived royalty rates for guideline intangible assets. Revenue is projected over the expected remaining useful life of the patented technology, or the license period if shorter. The market-derived royalty rate is then applied to estimate the royalty stream related to past revenue over the applicable alleged infringement period as well as projected revenue. We then allocate the consideration transferred to the identifiable elements based on relative fair value of the past and future royalties. The portion that is attributed to payments related to alleged prior infringement is recorded as a charge to our consolidated statements of income. The remaining portion is attributed to the licensing of intellectual property for future use and is amortized to cost of revenue using a method that reflects the pattern in which the economic benefits of the intangible asset are consumed or otherwise used or, if that pattern cannot be reliably determined, using a straight-line amortization method.
Self-Insurance
We are self-insured for certain healthcare benefits provided to our U.S. employees. The liability for the self-insured benefits is limited by
the purchase of stop-loss insurance. The stop-loss coverage provides payment for aggregate claims exceeding $0.3 million per covered person for any given year.
Accruals for losses are made based on our claim experience and actuarial estimates based on historical data. Actual losses may differ from
accrued amounts. Should actual losses exceed the amounts expected and if the recorded liabilities are insufficient, an additional expense will be recorded. Accumulated Comprehensive Loss
Accumulated other comprehensive loss on the consolidated balance sheets at December 31, 2012 and 2011 represents accumulated translation adjustments and unrecognized gains and losses on investments classified as available for sale. This information is provided in our statements of comprehensive income. Net Income Per Share
Net income per share (basic) is calculated by dividing net income by the weighted average number of common shares outstanding during
the year. Net income per share (diluted) is calculated by adjusting outstanding shares, assuming any dilutive effects of options and restricted stock units calculated using the treasury stock method. Under the treasury stock method, an increase in the fair market value of our Class A common stock results in a greater dilutive effect from outstanding options, stock purchase rights and restricted stock units. Additionally, the exercise of employee stock options and stock purchase rights and the vesting of restricted stock units results in a further dilutive effect on net income per share.
F-14

Table of Contents 2. Supplemental Financial Information Net Revenue
The following table presents details of our net product revenue:
Inventory
The following table presents details of our inventory:
Property and Equipment
The following table presents details of our property and equipment:
F-15
Year Ended December 31,
2012 2011 2010
Product sales through direct sales force 77.3 % 79.1 % 79.1 %
Product sales maintained under fulfillment distributor arrangements 6.2 6.0 6.3 Product sales through distributors 16.5 14.9 14.6
100.0 % 100.0 % 100.0 %
December 31,
2012 2011
(In millions)
Work in process $ 187 $ 135 Finished goods 340 286
$ 527 $ 421
December 31,
Useful Life 2012 2011
(In years) (In millions)
Leasehold improvements 1 to 10 $ 232 $ 212 Office furniture and equipment 3 to 7 41 38 Machinery and equipment 5 555 396 Computer software and equipment 2 to 10 183 128 Construction in progress N/A 27 26 1,038 800 Less accumulated depreciation and amortization (553 ) (432 )
$ 485 $ 368

Table of Contents Goodwill
The following table summarizes the activity related to the carrying value of our goodwill:
For a description of our valuation techniques and significant assumptions related to our annual impairment assessment of goodwill see
Note 10. Purchased Intangible Assets
The following table presents details of our purchased intangible assets:
For a detailed discussion of our various impairments of purchased intangible assets, see Note 10.
F-16
Reportable Segments
Broadband
Communications Mobile and
Wireless Infrastructure
and Networking Foreign
Currency Consolidated
(In millions)
Goodwill $ 595 $ 990 $ 1,910 $ 11 $ 3,506 Accumulated impairment losses — (543 ) (1,286 ) — (1,829 )
Goodwill at December 31, 2010 595 447 624 11 1,677 Goodwill recorded in connection with acquisitions — 23 111 — 134 Escrow related and other $ 2 $ — $ — $ — $ 2 Effects of foreign currency translation — — — (26 ) (26 )
Goodwill at December 31, 2011 597 470 735 (15 ) 1,787 Goodwill recorded in connection with acquisitions 125 — 1,805 — 1,930 Transfer $ 48 $ — $ (48 ) $ — $ — Effects of foreign currency translation — — — 9 9 Goodwill at December 31, 2012 770 470 2,492 (6 ) 3,726
December 31, 2012 December 31, 2011
Gross Accumulated Amortization Net Gross
Accumulated Amortization Net
(In millions) Developed technology $ 1,760 $ (441 ) $ 1,319 $ 587 $ (282 ) $ 305 In-process research and
development 315 — 315 59 — 59 Customer relationships 385 (224 ) 161 173 (117 ) 56 Other 36 (25 ) 11 23 (20 ) 3
$ 2,496 $ (690 ) $ 1,806 $ 842 $ (419 ) $ 423 Effects of foreign
currency translation (20 ) (23 )
$ 1,786 $ 400

Table of Contents
The following table presents details of the amortization of purchased intangible assets included in the cost of product revenue and other operating expense categories:
The following table presents details of the amortization of existing purchased intangible assets (including IPR&D), which is currently
estimated to be expensed in 2013 and thereafter:
Accrued Liabilities
The following table presents details of our accrued liabilities included in current liabilities:
Other Long-Term Liabilities
The following table presents details of our other long-term liabilities:
F-17
Year Ended December 31,
2012 2011 2010
(In millions)
Cost of product revenue $ 198 $ 54 $ 31 Other operating expenses 113 30 28
$ 311 $ 84 $ 59
Purchased Intangible Asset Amortization by Year
2013 2014 2015 2016 2017 Thereafter Total
(In millions) Cost of product revenue $ 174 $ 221 $ 218 $ 200 $ 188 $ 615 $ 1,616 Other operating expenses 57 64 32 9 3 5 170
$ 231 $ 285 $ 250 $ 209 $ 191 $ 620 $ 1,786
December 31,
2012 2011
(In millions)
Accrued rebates $ 383 $ 317 Accrued royalties 21 18 Accrued settlement charges 68 28 Accrued legal costs 15 16 Accrued taxes 16 16 Warranty reserve 13 14 Restructuring liabilities 1 6 Other 53 46
$ 570 $ 461
December 31,
2012 2011
(In millions)
Deferred rent $ 54 $ 48 Accrued taxes 67 24 Deferred tax liabilities 45 80 Accrued settlement charges 58 48 Restructuring liabilities — 2 Deferred revenue 47 3 Other long-term liabilities 23 19
$ 294 $ 224

Table of Contents Accrued Rebate Activity
The following table summarizes the activity related to accrued rebates:
Warranty Reserve Activity
The following table summarizes activity related to the warranty reserve:
Restructuring Activity
As part of our regular portfolio management review process and in light of our decision to significantly reduce our investment in our
digital television and Blu-ray Disc product lines within our Broadband Communications operating segment, in September 2011 we implemented a restructuring plan to reduce our worldwide headcount by approximately 300 employees . In connection with this plan, in 2011 we recorded $16 million in net restructuring costs, of which $12 million was related to severance and other charges associated with our reduction in workforce across multiple locations and functions, and $4 million was related to the closure of three of our facilities. In 2012 we incurred $7 million in restructuring costs primarily associated with additional costs for retention bonuses and facilities relating to the restructuring plan noted above, and severance and facility charges associated with synergies identified during the integration of our acquisition of NetLogic.
The following table summarizes activity related to our current and long-term restructuring liabilities during the twelve months ended
December 31, 2012 :
Charitable Contribution
In April 2009 we established the Broadcom Foundation, or the Foundation, to support science, technology, engineering and mathematics
programs, as well as a broad range of community services. In June 2011 we contributed an additional $25 million to the Broadcom Foundation. Approximately $2 million of the $25 million contribution came from Dr. Henry Samueli, our Chief Technical Officer and Chairman of the Board of Directors, who made such payment to Broadcom in connection with
F-18
Year Ended December 31,
2012 2011
(In millions)
Beginning balance $ 317 $ 270 Charged as a reduction of revenue 727 643 Reversal of unclaimed rebates (18 ) (13 )
Payments (643 ) (583 )
Ending balance $ 383 $ 317
Year Ended December 31,
2012 2011
(In millions)
Beginning balance $ 14 $ 13 Charged to costs and expenses 5 11 Payments (6 ) (10 )
Ending balance $ 13 $ 14
Year Ended December 31,
2012 2011
(In millions)
Beginning balance $ 8 $ — Charged to expense 7 16 Cash payments (14 ) (8 )
Ending balance $ 1 $ 8

Table of Contents the settlement of a shareholder derivative litigation as further described in Note 9. This payment was recorded as an operating expense in our consolidated statements of income in 2011. Computation of Net Income Per Share
The following table presents the computation of net income per share:
Net income per share (diluted) does not include the effect of anti-dilutive common share equivalents resulting from outstanding equity
awards. There were 23 million , 18 million and 20 million anti-dilutive common share equivalents in 2012, 2011 and 2010, respectively. Income from the Qualcomm Agreement
As part of the Qualcomm Agreement, each party granted certain rights under its patent portfolio to the other party including, in certain
circumstances, under future patents issued within one to four years after April 26, 2009. The term of the Qualcomm Agreement commenced April 26, 2009 and will continue until the expiration of the last to expire of the covered patents. In addition, certain existing patents were assigned by Broadcom to Qualcomm with Broadcom retaining a royalty-free license under these patents. The Qualcomm Agreement also resulted in the parties dismissing with prejudice all outstanding litigation between them, and in Broadcom withdrawing its complaints with foreign competition authorities. Under the terms of the agreement, Qualcomm is expected to make payments to Broadcom totaling $891 million , of which $805 million has been paid through December 31, 2012. The remaining balance of $86 million is expected to be paid in two equal and successive quarterly payments of $43 million each, as presented below.
We allocated the payment due us under the Qualcomm Agreement amongst several elements. In 2009 we recorded a gain from the
settlement of litigation related to intellectual property of $65 million , which was recorded as a reduction in settlement costs and approximated the value of the settlements determined by the United States District Court for the Central District of California.
The fair value associated with the transfer of intellectual property rights, as well as the settlement of other outstanding litigation, of $826
million , has been accounted for as a single unit of accounting and recognized within net revenue over the Qualcomm Agreement’s performance period of four years ; recognition is limited to the lesser of the cumulative straight-line amortization over the four year performance period or the cumulative cash proceeds received. As a result, income from the Qualcomm Agreement will never be recorded ahead of cash payments received. We also recognized income from the Qualcomm Agreement of $31 million in 2009 related to previous payments made to us by Qualcomm for shipments from May 2007 through December 31, 2008, related to a court-ordered permanent injunction. We had deferred the recognition of these amounts, which were received during 2008, due to continuing litigation appeals. These appeals were resolved through the Qualcomm Agreement.
Income from the Qualcomm Agreement in 2013 is expected to be recognized as follows:
F-19
Year Ended December 31,
2012 2011 2010
(In millions, except per share data)
Numerator: Net income $ 719 $ 927 $ 1,082 Denominator for net income per share (basic) 558 539 508 Effect of dilutive securities:
Stock awards 18 24 37 Denominator for net income per share (diluted) 576 563 545 Net income per share (basic) $ 1.29 $ 1.72 $ 2.13 Net income per share (diluted) $ 1.25 $ 1.65 $ 1.99
March 31,
2013 June 30,
2013 Total
(In millions)
Income from Qualcomm Agreement $ 43 $ 43 $ 86

Table of Contents Supplemental Cash Flow Information
In 2011 we paid $2 million related to share repurchases that had not settled by December 31, 2010. In 2011 and 2010, we received $4
million and $1 million related to stock option exercises that had not settled by December 31, 2010 and 2009 respectively. We had $1 million related to stock options exercises that had not settled by December 31, 2012.
At December 31, 2012, 2011 and 2010 we had billings of $29 million , $43 million and $12 million , respectively, for capital equipment
that were accrued. The amounts accrued for capital equipment purchases have been excluded from the consolidated statements of cash flows and were paid in the subsequent period.
On February 17, 2012 we completed our acquisition of NetLogic, a publicly traded company that was a provider of high performance
intelligent semiconductor solutions for next generation networks. Our primary reasons for acquiring NetLogic were to enhance our ability to deliver a complete, end-to-end network infrastructure solution for customers and to reduce both time-to-market and development costs . The addition of NetLogic also extends Broadcom’s infrastructure portfolio with key technologies, including multi-core embedded processor and knowledge-based processor solutions, both critical enablers of the next generation infrastructure build-out. In addition, the NetLogic acquisition and the other acquisitions noted in the table below allowed us to extend our roadmap to support customer requirements for rolling out next-generation fiber networks worldwide, enter into or expand our presence in the relevant wired and wireless communications market segments, reduce the time required to develop new technologies and products and bring them to market, incorporate enhanced functionality into and complement our existing product offerings, augment our engineering workforce, and enhance our technological capabilities.
From January 1, 2010 through December 31, 2012 we completed a number of acquisitions. The consolidated financial statements include
the results of operations of these acquired companies commencing as of their respective acquisition dates. The following table presents details of the purchase consideration related to each acquisition:
F-20
3. Business Combinations
Company Acquired Month
Acquired Business
Cash Consideration
Paid Cash
Assumed
Equity Consideration
Paid
Assumed Contingent
Consideration and Debt
Contingent Consideration
Maximum
Contingent Consideration
Fair Value
(In millions) 2012 Acquisitions
BroadLight, Inc. April 2012 PON processors $ 200 $ 22 $ 3 $ — $ 10 $ — NetLogic Microsystems, Inc. February 2012
Next generation networks 3,612 219 349 53 110 53
Other Various Various 11 — — — — — $ 3,823 $ 241 $ 352 $ 53 $ 120 $ 53
2011 Acquisitions
SC Square Ltd. May 2011 Security software $ 40 $ — $ — $ — $ — $ —
Provigent, Inc. April 2011 Microwave backhaul systems 314 10 4 — — —
Other Various Various 3 — — — — —
$ 357 $ 10 $ 4 $ — $ — $ —
2010 Acquisitions
Gigle Networks, Inc.
December 2010
SoC solutions for home networking over power lines $ 73 $ 1 $ 2 $ — $ 8 $ 1
Percello Ltd. November
2010 SoC solutions for femtocells 85 2 3 — 12 —
Beceem Communications, Inc.
November 2010
SoC solutions for LTE and WiMAX 4G connectivity 301 12 23 — — —
Innovision Research & Technology PLC July 2010
Near field communication 50 2 — — — —
Teknovus, Inc. March 2010
Ethernet passive optical network chipsets 109 9 — 15 — —
Other Various Various 7 — — — — —
$ 625 $ 26 $ 28 $ 15 $ 20 $ 1
Total Acquisitions $ 4,805 $ 277 $ 384 $ 68 $ 140 $ 54


Table of Contents
The purchase price of the NetLogic acquisition was paid in cash, except for certain equity awards with a fair value of $349 million that
were assumed. Approximately $137 million of the equity consideration was recorded as goodwill and $212 million will be recognized as stock-based compensation expense primarily over the two to three years from the closing date. A portion of the cash consideration in the BroadLight acquisition is currently held in escrow pursuant to the terms of the acquisition agreement and is reflected in goodwill as we believe the likelihood of the escrow fund being utilized by us is remote.
In connection with the NetLogic acquisition, our results of operations in 2012 included: (i) stock-based compensation of $89 million , of
which $17 million related to the accelerated vesting of equity awards upon the termination of certain employees with change in control agreements, (ii) the amortization of purchased intangibles of $190 million , and (iii) the amortization of acquired inventory valuation step-up of $63 million . We also incurred certain severance and other benefit costs of $3 million in 2012 that are classified as restructuring costs in our consolidated statements of income. Lastly, we incurred $6 million in transaction costs related to legal, accounting and other related fees, of which $1 million was recorded in 2012 in selling, general and administrative expense and the remaining was previously expensed in 2011.
We have estimated the fair value of the acquired assets and liabilities of the above acquisitions. We allocated the respective purchase
prices to tangible assets, liabilities and identifiable intangible assets acquired based on their estimated respective fair values. The excess of the purchase price over the aggregate fair values was recorded as goodwill, of which $29 million is deductible for tax purposes. The principal factor that resulted in recognition of goodwill was that the purchase price for each acquisition was based on cash flow projections assuming the integration of any acquired technology and products with our products, which is of considerably greater value than utilizing each acquired company’s technology or product on a standalone basis. The fair value assigned to identifiable intangible assets acquired was based on estimates and assumptions made by management at the time of the acquisitions.
Based upon those calculations, the purchase prices for the acquisitions were allocated as follows:
F-21
2012 2011 2010
(In millions)
Fair Market Values
Cash and cash equivalents $ 241 $ 10 $ 26 Short-term marketable securities 48 1 — Accounts receivable, net 46 12 24 Inventory 101 30 27 Prepaid and other current assets 19 4 5 Property and equipment, net 17 3 6 Other assets 29 — 5 Purchased intangible assets 1,782 233 266 Goodwill 1,930 134 336 Total assets acquired 4,213 427 695 Accounts payable 47 7 14 Accrued liabilities 42 6 23 Deferred tax liabilities 67 — — Contingent consideration and debt 53 — 15 Long-term liabilities 44 57 13 Total liabilities assumed 253 70 65
Purchase price allocation $ 3,960 $ 357 $ 630

Table of Contents
Purchased Intangible Assets
Developed technology represents patented technology and completed technology. Patented technology is the fundamental technology that
survives multiple product iterations, while completed technology is specific to certain products acquired. Both of these technologies have passed technological feasibility. We generally use a relief-from-royalty method or market transactions to value patented technology, based on market royalties or prices for similar fundamental technologies. The relief-from-royalty method estimates the cost savings that accrue to the owner of an intangible asset that would otherwise be payable as royalties or license fees on revenues earned through the use of the asset. The royalty rate used is based on an analysis of empirical, market-derived royalty rates for guideline intangible assets. Typically, revenue is projected over the expected remaining useful life of the patented technology. The market-derived royalty rate is then applied to estimate the royalty savings. To value completed technology, we generally use a multi-period excess earnings approach which calculates the value based on the risk-adjusted present value of the cash flows specific to the products, allowing for a reasonable return.
The fair value of the IPR&D from our acquisitions was determined using the income approach. Under the income approach, the expected
future cash flows from each project under development are estimated and discounted to their net present values at an appropriate risk-adjusted rate of return. Significant factors considered in the calculation of the rate of return are the weighted average cost of capital, the return on assets, as well as the risks inherent in the development process, including the likelihood of achieving technological success and market acceptance. Each project was analyzed to determine the unique technological innovations, the existence and reliance on patented technology, the existence of any alternative future use or current technological feasibility, and the complexity, cost and time to complete the remaining development. Future cash flows for each project were estimated based on forecasted revenue and costs, taking into account the expected product life cycles, market penetration and growth rates. We believe the amount recorded as IPR&D, as well as developed technology, represented the fair value and approximate the amount a market participant would pay for these projects as of the acquisition date.
The following table summarizes the significant assumptions underlying the valuation of IPR&D at the date of acquisition:
F-22
Useful Life 2012 2011 2010
(In years) (In millions)
Purchased Intangible Assets:
Developed technology 1 - 14 $ 1,288 $ 148 $ 156 In-process research and development N/A 267 45 55 Customer relationships 1 - 8 212 37 47 Other 1 - 10 15 3 8
$ 1,782 $ 233 $ 266
Company Acquired Development Projects
Weighted Average
Estimated Percent
Complete
Average Estimated Time to
Complete Estimated Cost
to Complete Risk Adjusted Discount Rate IPR&D
(In years) (In millions) (In millions)
2012 Acquisitions
NetLogic Microsystems, Inc. Next generation networks 10 % 4.3 $ 401 17 % $ 267 2011 Acquisitions
Provigent, Inc. Microwave 41 % 2.1 74 21 % 45 2010 Acquisitions
Gigle Networks, Inc. Powerline communication solutions 12 % 1.4 10 18 % 5 Percello Ltd. LTE/Femtocell solutions 10 % 3.2 10 17 % 10 Beceem Communications, Inc. LTE/WiMAX 51 % 1.1 32 22 % 29
Teknovus, Inc. Ethernet Passive Optical Network (EPON) chipsets and software 11 % 0.9 19 26 % 11

Table of Contents
In 2012, 2011 and 2010 there was no IPR&D related to our other acquisitions not listed above. The assumptions consist primarily of expected completion dates for the IPR&D projects, estimated costs to complete the projects, and revenue and expense projections for the products once they have entered the market. Research and development costs to bring the products of the acquired companies to technological feasibility are not expected to have a material impact on our results of operations or financial condition. Actual results to date have been consistent, in all material respects, with our assumptions at the time of the acquisitions.
In 2012, 2011 and 2010 we reclassified $1 million , $3 million and $51 million , respectively, of IPR&D costs to developed technology,
primarily related to our acquisition of Dune Networks, Inc. in 2009, and such costs will be now be amortized to cost of product revenue. Customer relationships represent the fair value of future projected revenue that will be derived from the sale of products to existing customers of the acquired companies. Contingent Earn-out Consideration
In connection with our NetLogic acquisition, we assumed a liability of $53 million related to contingent consideration in connection with
one of NetLogic’s prior acquisitions and subsequently paid this amount in the twelve months ended December 31, 2012 . Additional cash consideration of up to $57 million may be paid to the former shareholders of this prior acquisition upon satisfaction of certain future performance goals. Additional contingent earn-out consideration of up to $10 million in cash may be paid to the former holders of BroadLight capital stock and other rights upon satisfaction of certain future performance goals. As of December 31, 2012 we do not have any liabilities recorded in connection with any remaining contingent earn-out consideration, as we believe that the achievement of the future performance goals is unlikely.
Supplemental Pro Forma Data (Unaudited)
The unaudited pro forma statement of income data below gives effect to our 2012 and 2011 acquisitions as if they had occurred at the
beginning of the year prior to their respective acquisition dates. The following data includes the effects of amortization of purchased intangible assets and acquired inventory valuation step-up, stock-based compensation expense, foregone interest as a result of cash paid to acquire the companies, and other one-time transactions costs directly associated with the acquisitions such as legal, accounting and banking fees. This pro forma data is presented for informational purposes only and does not purport to be indicative of the results of future operations or of the results that would have occurred had the acquisitions taken place in the periods noted above.
F-23
Year Ended December 31,
2012 2011
(In millions, except per share data)
Pro forma net revenue $ 8,075 $ 7,873 Pro forma net income $ 839 $ 608 Pro forma net income per share (basic) $ 1.50 $ 1.12 Pro forma net income per share (diluted) $ 1.45 $ 1.07
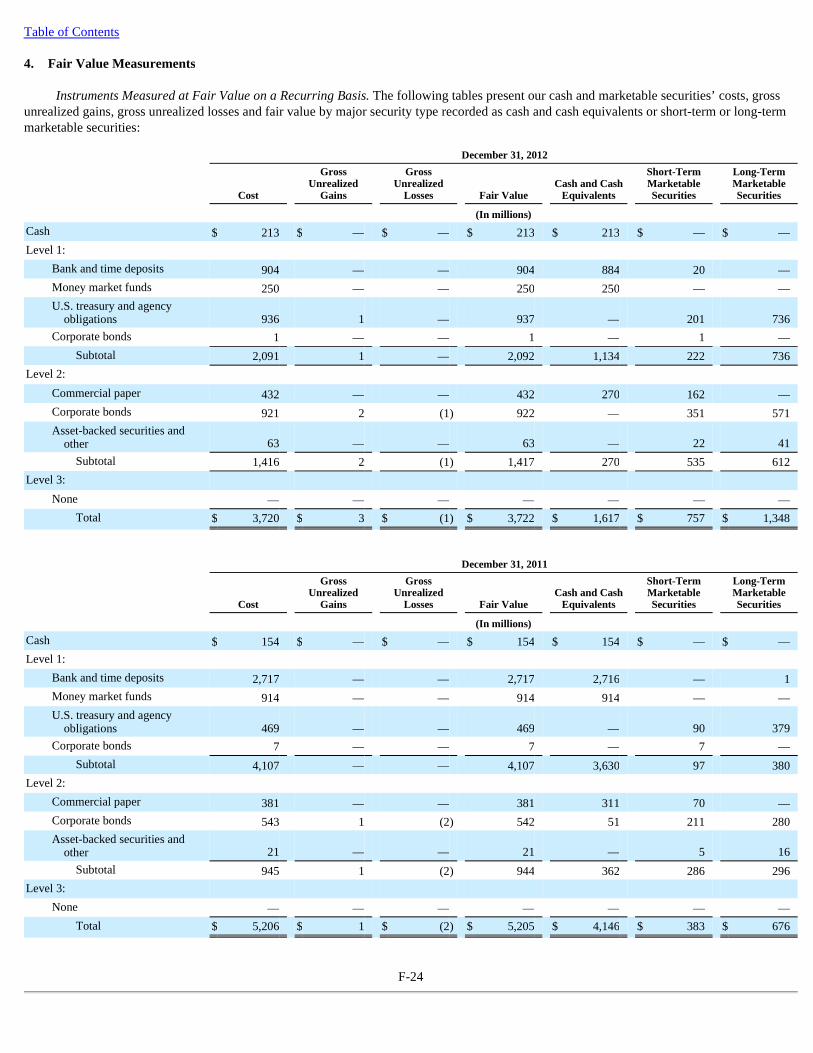
Table of Contents
Instruments Measured at Fair Value on a Recurring Basis. The following tables present our cash and marketable securities’ costs, gross
unrealized gains, gross unrealized losses and fair value by major security type recorded as cash and cash equivalents or short-term or long-term marketable securities:
F-24
4. Fair Value Measurements
December 31, 2012
Cost
Gross Unrealized
Gains
Gross Unrealized
Losses Fair Value Cash and Cash
Equivalents
Short-Term Marketable Securities
Long-Term Marketable Securities
(In millions) Cash $ 213 $ — $ — $ 213 $ 213 $ — $ — Level 1:
Bank and time deposits 904 — — 904 884 20 — Money market funds 250 — — 250 250 — — U.S. treasury and agency
obligations 936 1 — 937 — 201 736 Corporate bonds 1 — — 1 — 1 —
Subtotal 2,091 1 — 2,092 1,134 222 736 Level 2:
Commercial paper 432 — — 432 270 162 — Corporate bonds 921 2 (1 ) 922 — 351 571 Asset-backed securities and
other 63 — — 63 — 22 41 Subtotal 1,416 2 (1 ) 1,417 270 535 612
Level 3: None — — — — — — —
Total $ 3,720 $ 3 $ (1 ) $ 3,722 $ 1,617 $ 757 $ 1,348
December 31, 2011
Cost
Gross Unrealized
Gains
Gross Unrealized
Losses Fair Value Cash and Cash
Equivalents
Short-Term Marketable Securities
Long-Term Marketable Securities
(In millions) Cash $ 154 $ — $ — $ 154 $ 154 $ — $ — Level 1:
Bank and time deposits 2,717 — — 2,717 2,716 — 1 Money market funds 914 — — 914 914 — — U.S. treasury and agency
obligations 469 — — 469 — 90 379 Corporate bonds 7 — — 7 — 7 —
Subtotal 4,107 — — 4,107 3,630 97 380 Level 2:
Commercial paper 381 — — 381 311 70 — Corporate bonds 543 1 (2 ) 542 51 211 280 Asset-backed securities and
other 21 — — 21 — 5 16 Subtotal 945 1 (2 ) 944 362 286 296
Level 3: None — — — — — — —
Total $ 5,206 $ 1 $ (2 ) $ 5,205 $ 4,146 $ 383 $ 676
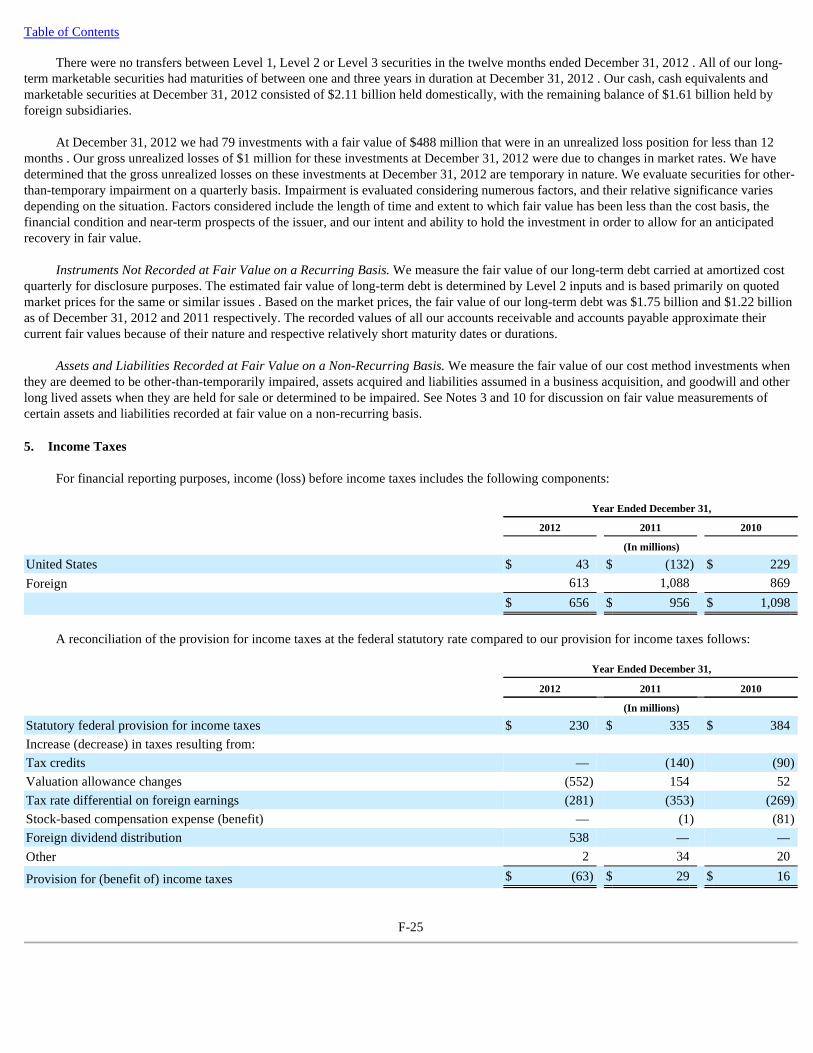
Table of Contents
There were no transfers between Level 1, Level 2 or Level 3 securities in the twelve months ended December 31, 2012 . All of our long-term marketable securities had maturities of between one and three years in duration at December 31, 2012 . Our cash, cash equivalents and marketable securities at December 31, 2012 consisted of $2.11 billion held domestically, with the remaining balance of $1.61 billion held by foreign subsidiaries.
At December 31, 2012 we had 79 investments with a fair value of $488 million that were in an unrealized loss position for less than 12
months . Our gross unrealized losses of $1 million for these investments at December 31, 2012 were due to changes in market rates. We have determined that the gross unrealized losses on these investments at December 31, 2012 are temporary in nature. We evaluate securities for other-than-temporary impairment on a quarterly basis. Impairment is evaluated considering numerous factors, and their relative significance varies depending on the situation. Factors considered include the length of time and extent to which fair value has been less than the cost basis, the financial condition and near-term prospects of the issuer, and our intent and ability to hold the investment in order to allow for an anticipated recovery in fair value.
Instruments Not Recorded at Fair Value on a Recurring Basis. We measure the fair value of our long-term debt carried at amortized cost
quarterly for disclosure purposes. The estimated fair value of long-term debt is determined by Level 2 inputs and is based primarily on quoted market prices for the same or similar issues . Based on the market prices, the fair value of our long-term debt was $1.75 billion and $1.22 billion as of December 31, 2012 and 2011 respectively. The recorded values of all our accounts receivable and accounts payable approximate their current fair values because of their nature and respective relatively short maturity dates or durations.
Assets and Liabilities Recorded at Fair Value on a Non-Recurring Basis. We measure the fair value of our cost method investments when
they are deemed to be other-than-temporarily impaired, assets acquired and liabilities assumed in a business acquisition, and goodwill and other long lived assets when they are held for sale or determined to be impaired. See Notes 3 and 10 for discussion on fair value measurements of certain assets and liabilities recorded at fair value on a non-recurring basis.
For financial reporting purposes, income (loss) before income taxes includes the following components:
A reconciliation of the provision for income taxes at the federal statutory rate compared to our provision for income taxes follows:
F-25
5. Income Taxes
Year Ended December 31,
2012 2011 2010
(In millions)
United States $ 43 $ (132 ) $ 229 Foreign 613 1,088 869
$ 656 $ 956 $ 1,098
Year Ended December 31,
2012 2011 2010
(In millions)
Statutory federal provision for income taxes $ 230 $ 335 $ 384 Increase (decrease) in taxes resulting from:
Tax credits — (140 ) (90 )
Valuation allowance changes (552 ) 154 52 Tax rate differential on foreign earnings (281 ) (353 ) (269 )
Stock-based compensation expense (benefit) — (1 ) (81 )
Foreign dividend distribution 538 — — Other 2 34 20
Provision for (benefit of) income taxes $ (63 ) $ 29 $ 16
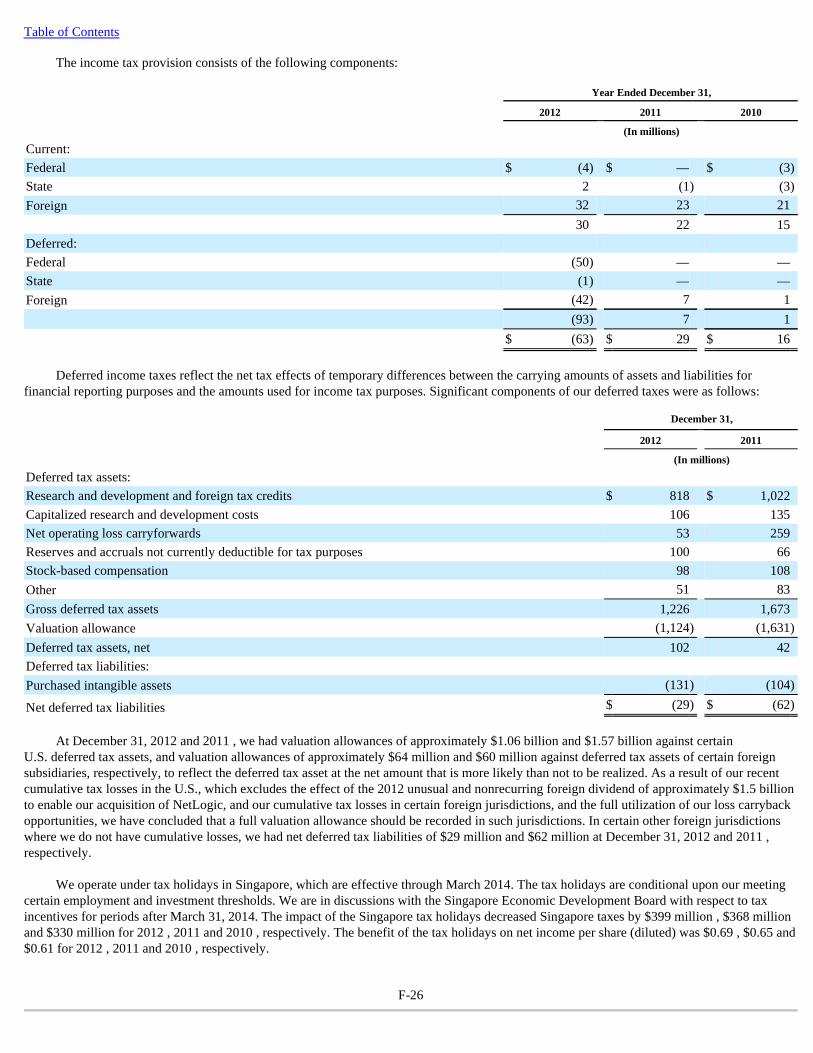
Table of Contents
The income tax provision consists of the following components:
Deferred income taxes reflect the net tax effects of temporary differences between the carrying amounts of assets and liabilities for
financial reporting purposes and the amounts used for income tax purposes. Significant components of our deferred taxes were as follows:
At December 31, 2012 and 2011 , we had valuation allowances of approximately $1.06 billion and $1.57 billion against certain
U.S. deferred tax assets, and valuation allowances of approximately $64 million and $60 million against deferred tax assets of certain foreign subsidiaries, respectively, to reflect the deferred tax asset at the net amount that is more likely than not to be realized. As a result of our recent cumulative tax losses in the U.S., which excludes the effect of the 2012 unusual and nonrecurring foreign dividend of approximately $1.5 billion to enable our acquisition of NetLogic, and our cumulative tax losses in certain foreign jurisdictions, and the full utilization of our loss carryback opportunities, we have concluded that a full valuation allowance should be recorded in such jurisdictions. In certain other foreign jurisdictions where we do not have cumulative losses, we had net deferred tax liabilities of $29 million and $62 million at December 31, 2012 and 2011 , respectively.
We operate under tax holidays in Singapore, which are effective through March 2014. The tax holidays are conditional upon our meeting
certain employment and investment thresholds. We are in discussions with the Singapore Economic Development Board with respect to tax incentives for periods after March 31, 2014. The impact of the Singapore tax holidays decreased Singapore taxes by $399 million , $368 million and $330 million for 2012 , 2011 and 2010 , respectively. The benefit of the tax holidays on net income per share (diluted) was $0.69 , $0.65 and $0.61 for 2012 , 2011 and 2010 , respectively.
F-26
Year Ended December 31,
2012 2011 2010
(In millions)
Current:
Federal $ (4 ) $ — $ (3 )
State 2 (1 ) (3 )
Foreign 32 23 21 30 22 15 Deferred:
Federal (50 ) — — State (1 ) — — Foreign (42 ) 7 1 (93 ) 7 1
$ (63 ) $ 29 $ 16
December 31,
2012 2011
(In millions)
Deferred tax assets:
Research and development and foreign tax credits $ 818 $ 1,022 Capitalized research and development costs 106 135 Net operating loss carryforwards 53 259 Reserves and accruals not currently deductible for tax purposes 100 66 Stock-based compensation 98 108 Other 51 83 Gross deferred tax assets 1,226 1,673 Valuation allowance (1,124 ) (1,631 )
Deferred tax assets, net 102 42 Deferred tax liabilities:
Purchased intangible assets (131 ) (104 )
Net deferred tax liabilities $ (29 ) $ (62 )

Table of Contents
Our deferred tax assets at December 31, 2012 and 2011 do not include $715 million and $677 million , respectively, of excess tax benefits from stock-based compensation that are a component of our net operating loss carryovers, research and development credits, and capitalized research and development expenses. Shareholders’ equity will be increased by $715 million to the extent such excess tax benefits are ultimately realized.
If and when recognized, the tax benefits relating to any reversal of the valuation allowance on deferred tax assets at December 31, 2012
will be accounted for as follows: approximately $1.11 billion will be recognized as a reduction of income tax expense and $11 million will be recorded as an increase in shareholders' equity. In 2012 we recorded a $33 million decrease in foreign deferred tax liabilities, as well as reductions in our U.S. valuation allowance on certain deferred tax assets due to recording net deferred tax liabilities for identifiable intangible assets under purchasing accounting of $51 million for our acquisitions of NetLogic and BroadLight.
At December 31, 2012 for our income tax filings we had federal, state, United Kingdom, Israel and Spain net operating loss carryforwards
of approximately $956 million , $2.20 billion , $135 million , $31 million and $11 million , respectively. A valuation allowance has been provided on substantially all of these loss carryforwards. If unutilized, the federal net operating loss carryforwards will expire between 2019 and 2031 , the state net operating loss carryforwards will expire between 2013 and 2032 , and the Spain net operating loss carryforwards will expire between 2024 and 2030 . The United Kingdom and Israel net operating losses have no expiration date . At December 31, 2012 we had Canada scientific research and experimental development expenditures of $18 million available for tax deduction in future tax years. These future tax deductions can be carried forward indefinitely.
At December 31, 2012 for our income tax filings we had foreign tax credit carryforwards of approximately $93 million , and federal, state,
Canada and Spain research and development credit carryforwards of approximately $722 million , $754 million , $41 million and $8 million , respectively. A valuation allowance has been provided on substantially all of these credit carryforwards. These foreign tax credit carryforwards expire between 2016 and 2022 , and these research and development credit carryforwards expire between 2019 and 2032 , if not previously utilized. Certain state research and development credit carryforwards have no expiration date . As of December 31, 2012 we did not record federal research and development tax credits relating to qualified research expenditures for the 2012 tax year because the federal tax credit for increasing current year research and development activities had previously expired at December 31, 2011. However, on January 2, 2013 President Obama signed into law The American Taxpayer Relief Act of 2012 , which contained a provision extending the federal research and development tax credit retroactively from January 1, 2012 through December 31, 2013. As a result of this legislation, in 2013 we expect to increase our research and development credit carryforwards, for amounts generated in 2012, by approximately $120 million . This increase in deferred tax assets is expected to be fully offset with a valuation allowance resulting in no tax benefit being recorded for this item in 2013.
At December 31, 2012 , deferred taxes have not been provided on the excess of book basis over tax basis in the amount of approximately
$4.17 billion in the shares of certain foreign subsidiaries because their bases differences are not expected to reverse in the foreseeable future and are considered permanent in duration. These bases differences arose primarily through purchase accounting and the undistributed book earnings of foreign subsidiaries that we intend to reinvest indefinitely. The bases differences could reverse through amortization or impairment of certain intangible assets recorded under purchase accounting, a sale of the subsidiaries, the receipt of dividends from the subsidiaries, or various other events. We believe that U.S. income taxes and foreign withholding taxes would be substantially offset upon reversal of this excess book basis due to the existence of net operating loss and tax credit carryforwards.
The following table summarizes the activity related to our unrecognized tax benefits:
The unrecognized tax benefits of $331 million at December 31, 2012 included $60 million of tax benefits that, if recognized, would reduce
our annual effective tax rate. Approximately $2 million of the tax benefit, if recognized, would be
F-27
Year Ended December 31,
2012 2011 2010
(In millions)
Beginning balance $ 212 $ 187 $ 401 Increases in current year 11 59 38 Expiration of the statutes of limitation for the assessment of taxes (7 ) (3 ) (3 )
Decrease related to prior year tax positions — (31 ) (249 )
Increase related to acquisitions 115 — —
Ending balance $ 331 $ 212 $ 187

Table of Contents credited to shareholder’s equity. The remaining $269 million , if recognized, would not result in a tax benefit since it would be fully offset with a valuation allowance. We reversed penalties and interest related to unrecognized tax benefits of $3 million and $1 million , respectively, during 2012, resulting from the expiration of statutes of limitation. We recorded $21 million of potential penalties related to certain foreign jurisdictions for our 2012 acquisitions, and we accrued potential penalties and interest of $2 million and $2 million , respectively, related to these unrecognized tax benefits during 2012, and in total, as of December 31, 2012 , we recorded a liability for potential penalties and interest of $31 million and $5 million , respectively. We recognize potential accrued interest and penalties related to unrecognized tax benefits within the consolidated statements of income as income tax expense.
In 2012 we had an increase in unrecognized tax benefits of approximately $115 million , relating to liabilities acquired as part of our
February 17, 2012 acquisition of NetLogic, and approximately $11 million , primarily relating to transactions with certain foreign subsidiaries. In 2011 we had an increase in unrecognized tax benefits of approximately $59 million , primarily relating to transactions with certain foreign subsidiaries. In 2010 we had a decrease in unrecognized tax benefits of approximately $273 million relating to increases to our federal and state net operating loss carryforwards, capitalized research and development costs, and tax credit carryforwards for previous years primarily resulting from the U.S. Court of Appeals for the Ninth Circuit March 22, 2010 ruling in the case between Xilinx, Inc. and the Commissioner of Internal Revenue and recorded $23 million of unrecognized tax benefits resulting from a 2010 change in judgment regarding certain tax accruals. In addition, we had an increase in unrecognized tax benefits of approximately $38 million in 2010 primarily relating to transactions with certain foreign subsidiaries. We do not expect our unrecognized tax benefits to change significantly over the next twelve months.
On May 27, 2009, the U.S. Court of Appeals for the Ninth Circuit in the case between Xilinx, Inc. and the Commissioner of Internal
Revenue overturned a 2005 U.S. Tax Court ruling regarding treatment of certain compensation expenses under a Company’s research and development cost-sharing arrangements with affiliates. The Court of Appeals originally held that related parties to such an arrangement must share stock-based compensation expenses, notwithstanding the fact that unrelated parties in such an arrangement would not share such costs. As a result of this May 27, 2009 decision, we reduced our gross deferred tax assets for federal and state net operating loss carryforwards and capitalized research and development costs, increased our deferred tax assets for certain tax credits, and increased our tax provision in 2009 by approximately $3 million . However, on January 13, 2010, the U.S. Court of Appeals for the Ninth Circuit withdrew its May 27, 2009 ruling in the Xilinx case and subsequently issued a new decision in favor of Xilinx on March 22, 2010, thereby affirming the August 30, 2005 decision of the U.S. Tax Court. Consequently, during the quarter ended March 31, 2010, we reversed the amounts we had previously recorded in 2009 related to the court’s May 27, 2009 decision. As a result, in the quarter ended March 31, 2010, we reduced our tax provision by approximately $3 million and adjusted certain of our gross deferred tax assets. Included in these adjustments was an increase in our federal and state net operating loss carryforwards of approximately $665 million and $455 million , respectively, an increase of federal and state capitalized research and development costs of approximately $10 million each, an increase in our deferred tax assets relating to stock-based compensation of approximately $65 million , and a decrease in certain tax credits of approximately $10 million . These changes in our gross deferred tax assets were fully offset by a valuation allowance adjustment, and therefore did not result in any change in our net deferred tax assets or our income tax expense for the three months ended March 31, 2010. In addition to the adjustments related to the March 22, 2010 Xilinx decision, in the three months ended March 31, 2010, we reduced our federal and state net operating losses by approximately $60 million for adjustments to our intercompany charges to foreign affiliates for the years ended 2001 to 2009. This reduction to our net operating losses was fully offset by a corresponding adjustment to the valuation allowance for deferred tax assets resulting in no net change to net deferred tax assets in our consolidated balance sheet and no adjustment to our income tax expense.
During the three months ended March 31, 2012, we accessed $1.5 billion of cash from our foreign subsidiaries to facilitate the acquisition
of NetLogic. This $1.5 billion was treated as includable in our U.S. taxable income for 2012. Nevertheless, this did not result in a significant tax liability for us because it was substantially offset by our net operating loss and tax credit carryforwards. The acquisition of NetLogic was unusual and nonrecurring. The $3.61 billion cash purchase price to acquire NetLogic greatly exceeded the purchase price of any prior cash acquisition we have made. Our previous cash acquisitions have been for significantly lower purchase prices, and we have never previously determined it prudent or necessary to access our prior years’ foreign earnings to facilitate an acquisition. We do not currently expect any future need to access our prior years’ foreign earnings, and therefore, aside from the $1.5 billion used to facilitate the NetLogic acquisition, we intend to continue to permanently reinvest our foreign earnings.
We file federal, state and foreign income tax returns in jurisdictions with varying statutes of limitations. The 2007 through 2012 tax years
generally remain subject to examination by federal and most state tax authorities. In foreign jurisdictions, the 2004 through 2012 tax years generally remain subject to examination by tax authorities. Our income tax returns for the 2007, 2008 and 2009 tax years are currently under examination by the Internal Revenue Service.
F-28
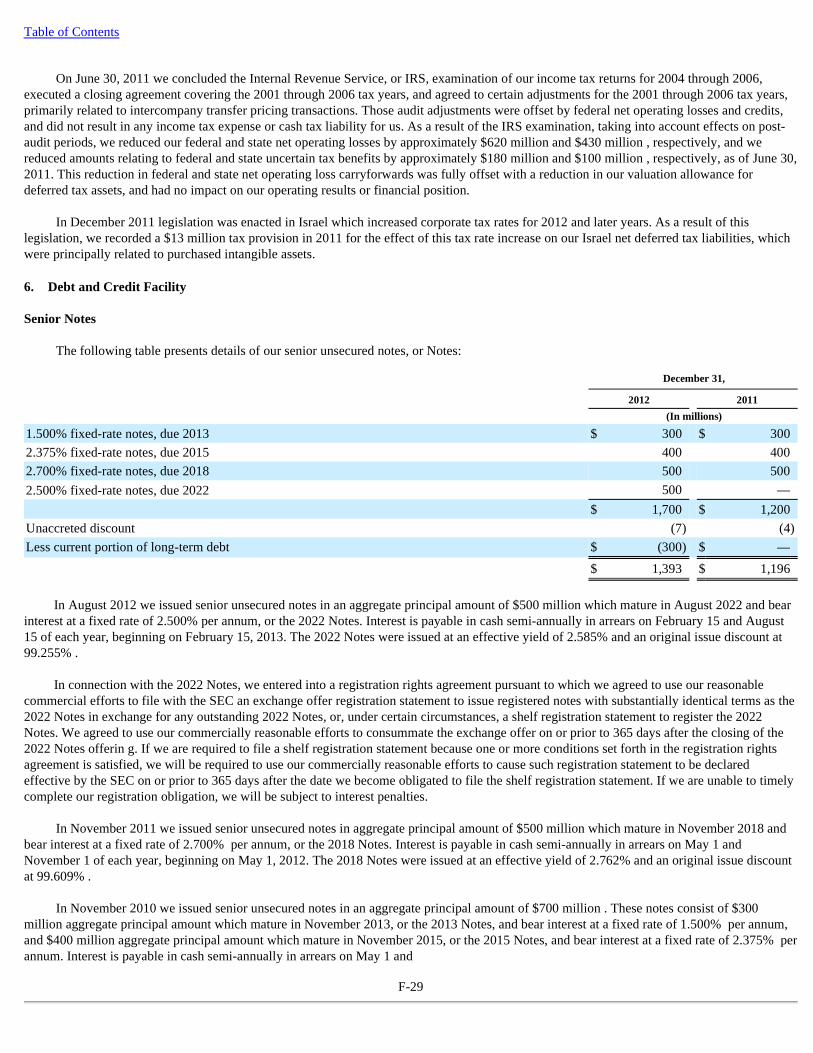
Table of Contents
On June 30, 2011 we concluded the Internal Revenue Service, or IRS, examination of our income tax returns for 2004 through 2006,
executed a closing agreement covering the 2001 through 2006 tax years, and agreed to certain adjustments for the 2001 through 2006 tax years, primarily related to intercompany transfer pricing transactions. Those audit adjustments were offset by federal net operating losses and credits, and did not result in any income tax expense or cash tax liability for us. As a result of the IRS examination, taking into account effects on post-audit periods, we reduced our federal and state net operating losses by approximately $620 million and $430 million , respectively, and we reduced amounts relating to federal and state uncertain tax benefits by approximately $180 million and $100 million , respectively, as of June 30, 2011. This reduction in federal and state net operating loss carryforwards was fully offset with a reduction in our valuation allowance for deferred tax assets, and had no impact on our operating results or financial position.
In December 2011 legislation was enacted in Israel which increased corporate tax rates for 2012 and later years. As a result of this
legislation, we recorded a $13 million tax provision in 2011 for the effect of this tax rate increase on our Israel net deferred tax liabilities, which were principally related to purchased intangible assets.
Senior Notes
The following table presents details of our senior unsecured notes, or Notes:
In August 2012 we issued senior unsecured notes in an aggregate principal amount of $500 million which mature in August 2022 and bear
interest at a fixed rate of 2.500% per annum, or the 2022 Notes. Interest is payable in cash semi-annually in arrears on February 15 and August 15 of each year, beginning on February 15, 2013. The 2022 Notes were issued at an effective yield of 2.585% and an original issue discount at 99.255% .
In connection with the 2022 Notes, we entered into a registration rights agreement pursuant to which we agreed to use our reasonable
commercial efforts to file with the SEC an exchange offer registration statement to issue registered notes with substantially identical terms as the 2022 Notes in exchange for any outstanding 2022 Notes, or, under certain circumstances, a shelf registration statement to register the 2022 Notes. We agreed to use our commercially reasonable efforts to consummate the exchange offer on or prior to 365 days after the closing of the 2022 Notes offerin g. If we are required to file a shelf registration statement because one or more conditions set forth in the registration rights agreement is satisfied, we will be required to use our commercially reasonable efforts to cause such registration statement to be declared effective by the SEC on or prior to 365 days after the date we become obligated to file the shelf registration statement. If we are unable to timely complete our registration obligation, we will be subject to interest penalties.
In November 2011 we issued senior unsecured notes in aggregate principal amount of $500 million which mature in November 2018 and
bear interest at a fixed rate of 2.700% per annum, or the 2018 Notes. Interest is payable in cash semi-annually in arrears on May 1 and November 1 of each year, beginning on May 1, 2012. The 2018 Notes were issued at an effective yield of 2.762% and an original issue discount at 99.609% .
In November 2010 we issued senior unsecured notes in an aggregate principal amount of $700 million . These notes consist of $300
million aggregate principal amount which mature in November 2013, or the 2013 Notes, and bear interest at a fixed rate of 1.500% per annum, and $400 million aggregate principal amount which mature in November 2015, or the 2015 Notes, and bear interest at a fixed rate of 2.375% per annum. Interest is payable in cash semi-annually in arrears on May 1 and
F-29
6. Debt and Credit Facility
December 31,
2012 2011
(In millions)
1.500% fixed-rate notes, due 2013 $ 300 $ 300 2.375% fixed-rate notes, due 2015 400 400 2.700% fixed-rate notes, due 2018 500 500 2.500% fixed-rate notes, due 2022 500 — $ 1,700 $ 1,200 Unaccreted discount (7 ) (4 )
Less current portion of long-term debt $ (300 ) $ —
$ 1,393 $ 1,196

Table of Contents November 1 of each year, beginning on May 1, 2011. The 2013 Notes were issued at an effective yield of 1.605% and an original issue discount at 99.694% and the 2015 Notes were issued at an effective yield of 2.494% and an original issue discount at 99.444% .
We may redeem the above Notes at any time prior to shortly before their maturity, subject to a specified make-whole premium as defined
in the indenture governing the Notes. In the event of a change of control triggering event, each holder of Notes will have the right to require us to purchase for cash all or a portion of their Notes at a redemption price of 101% of the aggregate principal amount of such Notes plus accrued and unpaid interest. Default can be triggered by any missed interest or principal payment, breach of covenant, or in certain events of bankruptcy, insolvency or reorganization.
The Notes contain a number of customary representations, warranties and restrictive covenants, including, but not limited to, restrictions
on our ability to grant liens on assets; enter into sale and lease-back transactions; or merge, consolidate or sell assets. Failure to comply with these covenants, or any other event of default, could result in acceleration of the principal amount and accrued but unpaid interest on the Notes.
These Notes are recorded net of original issue discount. The discount and debt issuance costs associated with the issuance of the Notes are
amortized to interest expense over their respective terms. The effective rates for the fixed-rate debt include the interest on the notes and the accretion of the original issue discount.
Relative to our overall indebtedness, the Notes rank in right of payment (i) equal with all of our other existing and future senior unsecured
indebtedness (ii) senior to all of our existing and future subordinated indebtedness, and (iii) effectively subordinated to all of our subsidiaries’ existing and future indebtedness and other obligations (including secured and unsecured obligations) and subordinated to our existing and future secured indebtedness and other obligations, to the extent of the assets securing such indebtedness and other obligations.
Credit Facility
In November 2010 we entered into a credit facility with certain institutional lenders that provides for unsecured revolving facility loans,
swing line loans and letters of credit in an aggregate amount of up to $500 million . We amended this credit facility in October 2011 primarily to extend the maturity date by two years to November 19, 2016, at which time all outstanding revolving facility loans (if any) and accrued and unpaid interest must be repaid. The amendment to the credit facility also decreased the interest rate margins applicable to loans made under the credit facility and the commitment fee paid on the amount of the unused commitments. We did not draw on our credit facility in 2012 or 2011.
Any advances under a Eurodollar Rate Committed Loan will accrue interest at the British Bankers Association LIBOR, or BBA LIBOR,
plus the Applicable Rate. Any advances under a US Dollar Base Rate Committed Loan will accrue interest at rates that are equal to the Applicable Rate plus the higher of (a) the Federal Funds Rate plus 0.5%, (b) Bank of America’s “prime rate” as announced from time to time, or (c) BBA LIBOR plus 1.0%. The Applicable Rate is based on our senior debt credit ratings as published by Standard & Poor’s Rating Services and Moody’s Investors Service, Inc. and can range between 0.625% and 1.500% for Eurodollar Rate Committed Loans and 0.000% to 0.500% for US Dollar Base Rate Committed Loans. We are also required to pay a commitment fee on the actual daily unused amount of commitments. We may also, upon the agreement of the existing lenders, increase the commitments under the credit facility by up to an additional $100 million . Borrowings of swing line loans bear interest at a rate equivalent to the US Dollar Base Rate Committed Loans noted above.
The credit facility contains customary representations, warranties and covenants. Financial covenants require us to maintain a consolidated
leverage ratio of no more than 3.25 to 1.00 and a consolidated interest coverage ratio of no less than 3.00 to 1.00.
F-30

Table of Contents
Common Stock
At December 31, 2012 we had 2.5 billion authorized shares of Class A common stock and 400 million authorized shares of Class B
common stock. The shares of Class A common stock and Class B common stock are substantially identical, except that holders of Class A common stock are entitled to one vote for each share held, and holders of Class B common stock are entitled to ten votes for each share held, on all matters submitted to a vote of the shareholders. In addition, holders of Class B common stock are entitled to vote separately on the proposed issuance of additional shares of Class B common stock in certain circumstances. The shares of Class B common stock are not publicly traded. Each share of Class B common stock is convertible at any time at the option of the holder into one share of Class A common stock and in most instances automatically converts upon sale or other transfer . The Class A common stock and Class B common stock are sometimes collectively referred to herein as “common stock.” In 2012 , 2011 and 2010 , 2 million , 1 million and 3 million shares, respectively, of Class B common stock were automatically converted into a like number of shares of Class A common stock upon sale or other transfer pursuant to the terms of our Articles of Incorporation. Quarterly Dividend
In January 2010 our Board of Directors adopted a dividend policy pursuant to which we intend to pay quarterly cash dividends on our
common stock. Our Board of Directors declared quarterly cash dividends of $0.08 per common share payable to holders of our common stock in each quarter of 2010. In January 2011 and 2012 our Board of Directors adopted amendments to the existing dividend policy pursuant to which we increased the quarterly cash dividend to $0.09 and $0.10 per common share, respectively, and declared quarterly cash dividends payable to holders of our common stock in each quarter of 2011 and 2012. In 2012 , 2011 and 2010 we paid $224 million , $194 million and $164 million , respectively, in dividends to holders of our Class A and Class B common stock. These dividends were paid from U.S. domestic sources other than our retained earnings and are accounted for as reductions of shareholders’ equity.
Share Repurchase Program
In February 2010 we announced that our Board of Directors had authorized an evergreen share repurchase program intended to offset dilution of incremental grants of stock awards associated with our stock incentive plans. The maximum number of shares of our Class A common stock that may be repurchased in any one year under this program (including under an accelerated share repurchase agreement or other arrangement) is equal to the total number of shares issued pursuant to our equity awards in the previous year and the current year. This program does not have an expiration date and may be suspended at any time at the discretion of the Board of Directors. It may also be complemented with an additional share repurchase program in the future. Under the evergreen program we repurchased approximately 1 million , 10 million , and 9 million shares of our Class A common stock at a weighted average price of $31.91 , $36.84 , and $30.86 in 2012 , 2011 and 2010, respectively.
In February 2011 we entered into an accelerated share repurchase, or ASR, agreement to repurchase $300 million of our Class A common stock, which was recorded as a reduction to shareholders’ equity. Under the ASR program we received and cancelled 7 million shares of our Class A common stock with a weighted average price of $42.64 per share.
Repurchases under our share repurchase programs were and are intended to be made in open market or privately negotiated transactions in
compliance with Rule 10b-18 promulgated under the Securities Exchange Act of 1934, as amended, or the Exchange Act.
Registration Statements We currently have a Form S-4 acquisition shelf registration statement on file with the SEC. The acquisition shelf registration statement on
Form S-4 enables us to issue up to 30 million shares of our Class A common stock in one or more acquisition transactions. These transactions may include the acquisition of assets, businesses or securities by any form of business combination. To date, no securities have been issued pursuant to the S-4 registration statement, which does not have an expiration date mandated by SEC rules. We previously had a Form S-3 universal shelf registration statement on file with the SEC. The universal shelf registration statement on Form S-3 permitted Broadcom to sell, in one or more public offerings, shares of our Class A common stock, shares of preferred stock or debt securities, or any combination of such securities, for proceeds in an aggregate amount of up to $1.5 billion . The 2018 Notes with an aggregate principal amount of $500 million that we issued in November 2011 (more fully described in Note 6) were issued pursuant to the Form S-3. The Form S-3 expired in accordance with applicable SEC rules on February 27, 2012.
F-31
7. Shareholders’ Equity

Table of Contents
Employee Stock Purchase Plan
We have an employee stock purchase plan, or ESPP, for all eligible employees. Under the ESPP, employees may purchase shares of our
Class A common stock at six-month intervals at 85% of fair market value (calculated in the manner provided in the plan). Employees purchase such stock using payroll deductions, which may not exceed 15% of their total cash compensation. Shares of Class A common stock are offered under the ESPP through a series of successive offering periods, generally with a maximum duration of 24 months , subject to an additional three -month extension under certain circumstances. The plan imposes certain limitations upon an employee’s right to acquire Class A common stock, including the following: (i) no employee may purchase more than 9,000 shares of Class A common stock on any one purchase date, (ii) no employee may be granted rights to purchase more than $25,000 worth of Class A common stock for each calendar year that such rights are at any time outstanding, and (iii) the maximum number of shares of Class A common stock purchasable in total by all participants in the ESPP on any purchase date is limited to 4 million shares. The number of shares of Class A common stock reserved for issuance under the plan automatically increases in January each year. The increase is equal to 1.25% of the total number of shares of common stock outstanding on the last trading day of the immediately preceding year, subject to an annual share limit.
In 2012, 2011 and 2010, 5 million , 4 million and 6 million shares, respectively, were issued under this plan at average per share prices of
$28.32 , $29.93 , and $15.23 , respectively. At December 31, 2012, 17 million shares were available for future issuance under this plan.
Stock Incentive Plans
We have in effect stock incentive plans under which incentive stock options have been granted to employees and restricted stock units and non-qualified stock options have been granted to employees and non-employee members of the Board of Directors. Our 1998 Stock Incentive Plan, as amended and restated, or 1998 Plan, is the successor equity incentive program to our 1994 Stock Option Plan, or 1994 Plan and our 1998 Special Stock Option Plan, together, the Predecessor Plans. The number of shares of Class A common stock reserved for issuance under the 1998 Plan automatically increases in January each year. The increase is equal to 4.5% of the total number of shares of common stock outstanding on the last trading day of the immediately preceding year, subject to an annual share limit. In May 2012 our shareholders approved our 2012 Stock Incentive Plan, which is substantially similar to the 1998 Plan, and will replace the 1998 Plan once the registration statement filed by us for the shares of our common stock approved for issuance under the 2012 Plan becomes effective.
The Board of Directors or the Plan Administrator determines eligibility and vesting schedules for all equity awards granted under the plans
and, for stock options, exercise prices. We grant restricted stock units to certain employees as part of our regular annual employee equity compensation review program as well as to selected new hires and to non-employee members of the Board of Directors. Restricted stock units are share awards that entitle the holder to receive freely tradable shares of our Class A common stock upon vesting. Generally, restricted stock units vest ratably on a quarterly basis over 16 quarters from the date of grant. On a limited basis, we grant certain restricted stock units that vest in their entirety after 3 years.
Beginning in 2011, we stopped granting and currently have no plans to grant stock options, other than in connection with acquisitions.
Prior stock options granted generally had a term of 10 years , and in the case of new hires were generally granted such that they would vest and become exercisable at the rate of 25% after one year and ratably on a monthly basis over a period of 36 months thereafter. Subsequent option grants to existing employees were generally granted such that they would vest and become exercisable ratably on a monthly basis over a period of 48 months measured from the date of grant . However, certain options that have been granted under our 1998 Plan or that were assumed by us in connection with certain of our acquisitions provide that the vesting of the options granted thereunder will accelerate in whole or in part upon the occurrence of certain specified events.
In January 2011 the Compensation Committee of our Board of Directors adopted a Performance Restricted Stock Units Program, or the
PRSU Program. Under the PRSU Program, if the performance goals established by the Committee for a specific one-year performance cycle are achieved, our executive officers have the opportunity to receive grants of PRSUs in the three calendar years following the performance cycle. In 2011 the Committee determined that the performance goals for the 2010 performance cycle were met and we granted 0.2 million PRSUs. In 2012 we granted 0.2 million PRSUs also related to the 2010 performance cycle. Assuming continued employment on the applicable grant date, recipients of these awards will also receive a final award in 2013 related to the 2010 performance cycle.
F-32
8. Employee Benefit Plans
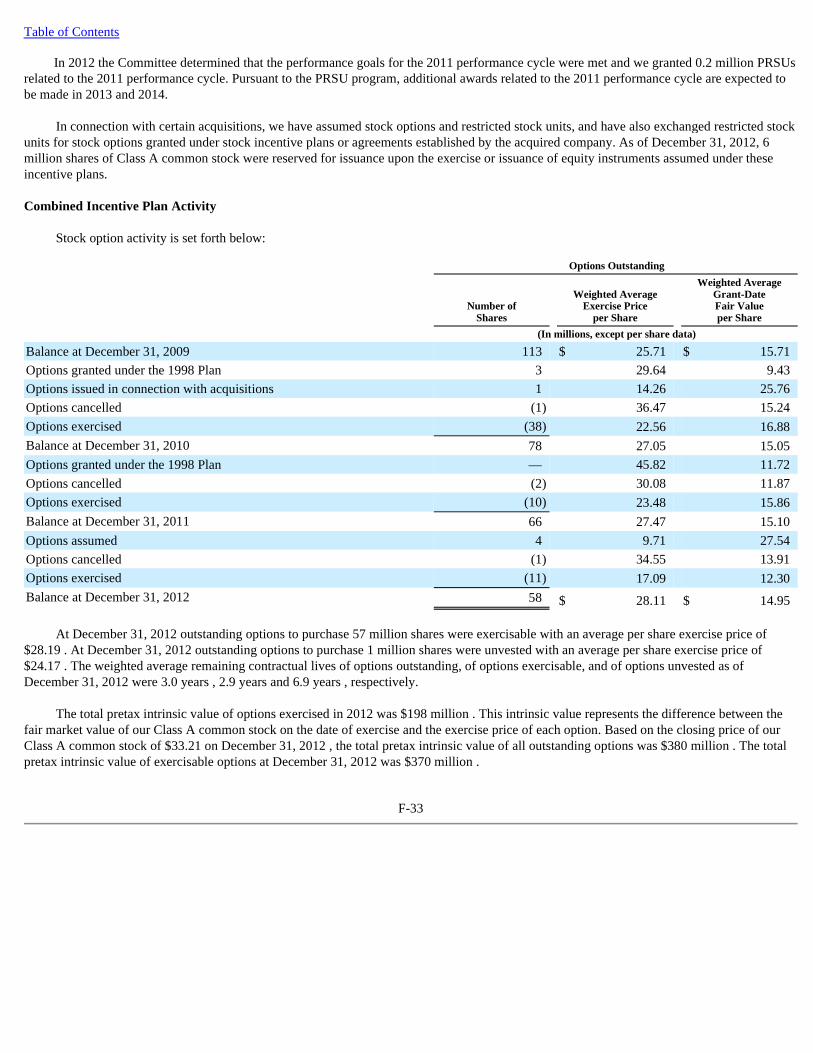
Table of Contents
In 2012 the Committee determined that the performance goals for the 2011 performance cycle were met and we granted 0.2 million PRSUs related to the 2011 performance cycle. Pursuant to the PRSU program, additional awards related to the 2011 performance cycle are expected to be made in 2013 and 2014.
In connection with certain acquisitions, we have assumed stock options and restricted stock units, and have also exchanged restricted stock
units for stock options granted under stock incentive plans or agreements established by the acquired company. As of December 31, 2012, 6 million shares of Class A common stock were reserved for issuance upon the exercise or issuance of equity instruments assumed under these incentive plans. Combined Incentive Plan Activity
Stock option activity is set forth below:
At December 31, 2012 outstanding options to purchase 57 million shares were exercisable with an average per share exercise price of
$28.19 . At December 31, 2012 outstanding options to purchase 1 million shares were unvested with an average per share exercise price of $24.17 . The weighted average remaining contractual lives of options outstanding, of options exercisable, and of options unvested as of December 31, 2012 were 3.0 years , 2.9 years and 6.9 years , respectively.
The total pretax intrinsic value of options exercised in 2012 was $198 million . This intrinsic value represents the difference between the
fair market value of our Class A common stock on the date of exercise and the exercise price of each option. Based on the closing price of our Class A common stock of $33.21 on December 31, 2012 , the total pretax intrinsic value of all outstanding options was $380 million . The total pretax intrinsic value of exercisable options at December 31, 2012 was $370 million .
F-33
Options Outstanding
Number of
Shares
Weighted Average Exercise Price
per Share
Weighted Average Grant-Date Fair Value per Share
(In millions, except per share data)
Balance at December 31, 2009 113 $ 25.71 $ 15.71 Options granted under the 1998 Plan 3 29.64 9.43 Options issued in connection with acquisitions 1 14.26 25.76 Options cancelled (1 ) 36.47 15.24 Options exercised (38 ) 22.56 16.88 Balance at December 31, 2010 78 27.05 15.05 Options granted under the 1998 Plan — 45.82 11.72 Options cancelled (2 ) 30.08 11.87 Options exercised (10 ) 23.48 15.86 Balance at December 31, 2011 66 27.47 15.10 Options assumed 4 9.71 27.54 Options cancelled (1 ) 34.55 13.91 Options exercised (11 ) 17.09 12.30 Balance at December 31, 2012 58 $ 28.11 $ 14.95

Table of Contents
Restricted stock unit activity is set forth below:
The total pretax intrinsic value of restricted stock units that vested in 2012 was $480 million . Based on the closing price of our Class A
common stock of $33.21 on December 31, 2012 , the total pretax intrinsic value of all outstanding restricted stock units was $830 million . The per share fair values of rights granted in connection with the employee stock purchase plan and stock options assumed from
acquisitions have been estimated with the following weighted average assumptions:
Stock-Based Compensation Expense
The following table presents details of total stock-based compensation expense that is included in each functional line item in the
consolidated statements of income:
F-34
Restricted Stock Units
Outstanding
Number of
Shares
Weighted Average Grant-Date Fair Value per Share
(In millions, except per share data)
Balance at December 31, 2009 29 $ 25.58 Restricted stock units granted 13 30.91 Restricted stock units cancelled (1 ) 26.04 Restricted stock units vested (13 ) 27.44 Balance at December 31, 2010 28 27.17 Restricted stock units granted 10 42.45 Restricted stock units cancelled (2 ) 31.63 Restricted stock units vested (14 ) 28.84 Balance at December 31, 2011 22 32.88 Restricted stock units granted 13 35.76 Restricted stock units assumed 6 37.54 Restricted stock units cancelled (2 ) 34.79 Restricted stock units vested (14 ) 29.18 Balance at December 31, 2012 25 $ 35.55
Employee Stock Purchase Rights Employee Stock Options
2012 2011 2010 2012 2011 2010
Expected life (in years) 1.43 1.70 1.23 1.39 3.60 4.08 Implied volatility 0.39 0.37 0.39 0.41 0.34 0.39 Risk-free interest rate 0.23 % 0.50 % 0.25 % 0.22 % 1.56 % 1.61 %
Expected dividend yield 1.19 % 0.99 % 0.76 % 1.00 % 0.80 % 1.00 %
Weighted average fair value $ 9.61 $ 11.01 $ 11.83 $ 27.54 $ 11.72 $ 13.47
Year Ended December 31,
2012 2011 2010
(In millions)
Cost of product revenue $ 27 $ 24 $ 23 Research and development 368 363 342 Selling, general and administrative 148 126 119
$ 543 $ 513 $ 484

Table of Contents
The following table presents details of unearned stock-based compensation currently estimated to be expensed in 2013 through 2017 related to unvested share-based payment awards:
The weighted-average period over which the unearned stock-based compensation is expected to be recognized is 1.30 years . If there are any modifications or cancellations of the underlying unvested awards, we may be required to accelerate, increase or cancel any
remaining unearned stock-based compensation expense. Future stock-based compensation expense and unearned stock-based compensation will increase to the extent that we grant additional equity awards or assume unvested equity awards in connection with acquisitions. Shares Reserved For Future Issuance
We had the following shares of common stock reserved for future issuance upon the exercise or issuance of equity instruments:
The table above does not reflect shares reserved for issuance under our 2012 Plan since we had not filed the registration statement for the
shares of our common stock approved for issuance under such plan by December 31, 2012. 401(k) Savings and Investment Plan
We sponsor a defined contribution 401(k) savings and investment plan covering substantially all of our U.S. employees, subject to certain
eligibility requirements. At our discretion, we may make contributions to this plan. We have a limited matching contribution policy under which we made $16 million , $14 million , $11 million in contributions to participants in this plan in 2012 , 2011 and 2010 , respectively.
Litigation
We and certain of our subsidiaries are currently parties to various legal proceedings, including those noted in this section. Unless otherwise
noted below, during the period presented we have not: recorded any accrual for loss contingencies associated with such legal proceedings; determined that an unfavorable outcome is probable or reasonably possible; or determined that the amount or range of any possible loss is reasonably estimable. We are engaged in numerous other legal actions not described below arising in the ordinary course of our business and, while there can be no assurance, we believe that the ultimate outcome of these actions will not have a material adverse effect on our operating results, liquidity or financial position.
From time to time we may conclude it is in the best interests of our shareholders, employees, and customers to settle one or more litigation
matters, and any such settlement could include substantial payments; however, other than as noted below, we have not reached this conclusion with respect to any particular matter at this time. There are a variety of factors that influence our decisions to settle and the amount we may choose to pay, including the strength of our case, developments in the litigation, the behavior of other interested parties, the demand on management time and the possible distraction of our employees associated with the case and/or the possibility that we may be subject to an injunction or other equitable remedy. It is difficult to predict whether a settlement is possible, the amount of an appropriate settlement or when is the opportune time to settle a matter in light of the numerous factors that go into the settlement decision.
F-35
2013 2014 2015 2016 2017 Total
(In millions) Unearned stock-based compensation $ 434 $ 272 $ 133 $ 24 $ 1 $ 864
Number of Shares
(In millions)
Stock options outstanding 58
Authorized for future grants under stock incentive plans 129
Authorized for future issuance under stock purchase plan 17
Restricted stock units outstanding 25
Balance at December 31, 2012 229
9. Commitments and Contingencies

Table of Contents
Intellectual Property Proceedings In September 2009 we filed a complaint in the United States District Court for the Central District of California against Emulex
Corporation, or Emulex, alleging infringement of ten patents generally relating to networking technologies. In subsequent filings, we added two additional patents and withdrew six patents, bringing the total to six asserted patents: U.S. Patents Nos. 7,058,150; 7,471,691; 7,450,500; 6,424,194; 7,486,124, and 7,724,057 (referred to as the Asserted Patents). In its answers, Emulex denied liability and asserted counterclaims seeking a declaratory judgment that the Asserted Patents are invalid and not infringed. A trial occurred in September and October 2011, and the Court heard post-trial motions in December 2011. The Court found that the Asserted Patents are not invalid. The Court further found Emulex infringed the ‘150 and ‘691 patents. In March 2012, the Court granted Broadcom’s motion for an injunction on the ‘150 and ‘691 patents and in April 2012, the Court entered an injunction against Emulex. Emulex filed an appeal of the Court’s rulings on the ‘150 and ‘691 patents to the Federal Circuit. On the remaining Asserted Patents, the jury found the ‘500 patent was not infringed and failed to reach a verdict on infringement for the ‘194, ‘124, and ‘057 patents. The Court has scheduled a new trial regarding the ‘194, ‘124, and ‘057 patents for April 2013.
On July 3, 2012, Broadcom and Emulex entered into a partial settlement and license agreement for the Asserted Patents. Under the terms
of the agreement, the parties dismissed their respective claims on the ‘691 and ‘500 patents, Emulex received a license and release related to the Asserted Patents for certain products for certain fields of use and Emulex was required to make a payment of certain amounts to Broadcom. The litigation proceedings for the ‘150, ‘194, ‘124, and ‘057 patents will continue relating to Emulex’s unlicensed activity.
In November 2009 we filed a complaint in the United States District Court for the Eastern District of Texas against the Commonwealth
Scientific and Industrial Research Organisation, or CSIRO, seeking a declaratory judgment that a certain U.S. patent number is invalid, unenforceable and not infringed. CSIRO answered the complaint and counterclaimed for infringement against Broadcom wireless LAN products and sought damages, attorney’s fees, and an injunction. Following a court ordered mediation session in March 2012, Broadcom and CSIRO entered into a settlement agreement resolving the litigation and the Court dismissed the parties’ claims with prejudice. The terms of the settlement agreement included a full release from liability for all asserted claims, the grant of a perpetual license under the asserted patent and all related patents to Broadcom, and the payment of certain amounts by Broadcom.
In August 2010, we filed a motion to intervene (i.e., to be added as a party) in U.S. Ethernet Innovations, LLC v. Acer, Inc. , Case No. 10-
cv-03724-JW (N.D. Cal.). In this case, U.S. Ethernet Innovations, LLC, or USEI, filed a patent infringement complaint alleging that numerous companies, including certain of our customers, infringe patents relating generally to Ethernet technology. USEI seeks monetary damages, attorney’s fees, and an injunction. Defendants have filed answers denying the allegations in USEI’s complaint and asserting counterclaims for declaratory judgment that USEI’s patents are invalid, unenforceable, and not infringed. We contend that we have a license related to USEI’s patents and are seeking to assert this license as a defense. In December 2010, the Court granted our motion to intervene. No trial date has been set.
We and our subsidiaries are also involved in other intellectual property proceedings, claims and litigation. We will disclose the nature of
any such matter if we believe it to be material. Particularly in the early stages of such proceedings, an assessment of materiality may be complicated by limited information, including, without limitation, limited information about the patents-in-suit and Broadcom products against which the patents are being asserted. Accordingly, our assessment of materiality may change in the future based upon availability of discovery and further developments in the proceedings at issue. Some of these intellectual property proceedings may involve, for example, “non-practicing entities” asserting claims addressing certain of our products. The resolution of intellectual property litigation can include, among other things, payment of damages, royalties, or other amounts, which could adversely, impact our product gross margins in future periods, or could prevent us from manufacturing or selling some of our products or limit or restrict the type of work that employees may perform for us. In addition, from time to time we are approached by holders of intellectual property, including non-practicing entities, to engage in discussions about our obtaining licenses to their intellectual property. We will disclose the nature of any such discussion if we determine that (i) it is probable an intellectual property holder will assert a claim of infringement, (ii) there is a reasonable possibility the outcome (assuming assertion) will be unfavorable, and (iii) the resulting liability would be material to our financial condition.
Other Proceedings In November 2009 Emulex filed a complaint in the Central District of California against us alleging violation of the antitrust laws,
defamation, and unfair competition. The complaint seeks injunctive relief and monetary damages, including treble damages and attorneys’ fees. In January 2010, Emulex filed an amended complaint in which Emulex removed, among
F-36

Table of Contents other things, the claim of unfair competition. In February 2010, we filed motions to dismiss the case and a motion to strike. In June 2010, the District Court granted in part and denied in part our motion to dismiss and denied our motion to strike. In April 2012, the Court granted a joint stipulation to dismiss Emulex’s antitrust, defamation, and unfair competition case against us without prejudice. Under the July 3, 2012 agreement referenced above, Emulex released these claims against Broadcom.
In April 2008 we delivered a Notice of Arbitration and Arbitration Claim to our former independent registered public accounting firm
Ernst & Young LLP, or E&Y, and certain related parties. The arbitration relates to the issues that led to the restatement of our financial statements for the periods from 1998 through March 31, 2006 as disclosed in an amended Annual Report on Form 10-K/A for the year ended December 31, 2005 and an amended Quarterly Report on Form 10-Q/A for the three months ended March 31, 2006, each filed with the SEC January 23, 2007. In May 2008 E&Y delivered a Notice of Defense and Counterclaim. The arbitration hearing began on January 21, 2013 and is expected to last two weeks.
In February 2012 we were notified by the SEC’s Division of Enforcement - Los Angeles Regional office that it is conducting a formal
investigation of our accounting practices related to litigation reserves. The SEC has requested documents and information for the time period commencing June 1, 2010 to the present. We believe that the SEC’s investigation was prompted by allegations of a former employee relating to our processes and decisions regarding litigation reserves in the first quarter of 2011 in connection with asserted and unasserted intellectual property claims. Following our receipt of these allegations in April 2011, we, with oversight from the Audit Committee of the Board of Directors, conducted an internal review of these allegations with the assistance of independent outside counsel and did not identify any improprieties. This investigation was completed during the three months ended June 30, 2011. In addition, based on the internal review, the results of which were discussed with the our independent registered public accounting firm, we determined that no adjustments to our fiscal 2010 and March 31, 2011 consolidated financial statements were necessary relating to the subject matter of the review. We are cooperating with the SEC’s investigation.
In July 2012, a former employee filed a lawsuit against us alleging wrongful termination in violation of the Dodd-Frank Wall Street
Reform and Consumer Protection Act and fundamental public policy under state law. The former employee alleges that he was terminated in June 2011 because he raised concerns that Broadcom did not appropriately accrue for and report certain loss contingencies in the three months ended March 31, 2011. We believe the lawsuit is without merit. On December 7, 2012, we filed a motion to dismiss the case. The hearing on this motion is scheduled to take place on February 4, 2013.
General We and our subsidiaries are also involved in other legal proceedings, claims and litigation arising in the ordinary course of business. We
will disclose the nature of any such matter if we believe it to be material. The pending proceedings described above involve complex questions of fact and law and may require the expenditure of significant funds
and the diversion of other resources to prosecute and defend. The results of legal proceedings are inherently uncertain, and material adverse outcomes are possible. From time to time we may enter into confidential discussions regarding the potential settlement of pending intellectual property or other litigation or other proceedings; however, there can be no assurance that any such discussions will occur or will result in a settlement. In the course of such settlement discussions, if we conclude that a settlement loss is probable and the settlement amount is estimable we may record settlement costs, notwithstanding not having reached a final settlement agreement. The settlement of any pending litigation or other proceedings could require us to incur substantial settlement payments and costs. Furthermore, the settlement of any intellectual property proceeding may require us to grant a license to certain of our intellectual property rights to the other party under a cross-license agreement. If any of those events were to occur, our business, financial condition and results of operations could be materially and adversely affected. See Note 1 for an additional discussion of our accounting policy under “Litigation and Settlement Costs”.
Settlement Costs (Gains) and Other Related Items
In 2012 we recorded net settlement costs of $79 million , which was comprised of $88 million of settlement costs related to patent
infringement claims, offset by settlement gains of $9 million (primarily related to the resolution of certain employment tax matters). In 2012 we received a payment of $58 million related to a partial settlement and license agreement. We accounted for this transaction as a multiple element arrangement and immediately recognized a $2 million gain on settlement of litigation and allocated the remaining $56 million to the licensing of intellectual property. The licensing portion will be recorded as net revenue over the ten year term of the license.
In 2011 we recorded net settlement gains of $18 million , which was comprised of $55 million of settlement gains (primarily related to a
settlement of our shareholder derivative action), offset by settlement costs of $37 million related to the
F-37

Table of Contents settlement of patent infringement claims. Upon the occurrence of certain events, we may be required to record additional settlement costs of up to $20 million related to a patent infringement case that settled in 2011.
In 2010 we recorded settlement costs of $53 million primarily related to licensing and settlement agreements and certain employment tax
items. On March 18, 2011 Broadcom announced that the remaining defendants in the federal consolidated shareholder derivative action relating
to the company’s historical stock option accounting practices entered into a settlement. On May 23, 2011, the District Court entered an order granting final approval of the Derivative Settlement. Pursuant to the Derivative Settlement:
Commitments and Other Contractual Obligations The following table presents details of our commitments and other contractual obligations, which are currently estimated to be paid in
2013 and thereafter:
Facilities rent expense in 2012, 2011 and 2010 was $90 million , $84 million and $71 million , respectively. Inventory and related purchase obligations represent purchase commitments for silicon wafers and assembly and test services. We depend
upon third party subcontractors to manufacture our silicon wafers and provide assembly and test services. Due to lengthy subcontractor lead times, we must order these materials and services from subcontractors well in advance. We expect to receive and pay for these materials and services within the ensuing six months. Our subcontractor relationships typically allow for the cancellation of outstanding purchase orders, but require payment of all expenses incurred through the date of cancellation.
Other obligations represent purchase commitments for lab test equipment, computer hardware, information systems infrastructure, mask and prototyping costs, intellectual property licensing arrangements and other commitments made in the ordinary course of business.
For purposes of the table above, obligations for the purchase of goods or services are defined as agreements that are enforceable and
legally binding and that specify all significant terms, including: fixed or minimum quantities to be purchased; fixed, minimum or variable price provisions; and the approximate timing of the transaction. Our purchase orders are based on current manufacturing needs and are typically fulfilled by our vendors within a relatively short time horizon. We have additional purchase orders (not included in the table above) that represent authorizations to purchase rather than binding agreements. We do not have significant agreements for the purchase of inventories or other goods specifying minimum quantities or set prices that exceed our expected requirements.
F-38
• Broadcom received a payment from Henry T. Nicholas, III, our former President and Chief Executive Officer and former Co-Chairman of the Board, of approximately $27 million ;
• Broadcom cancelled unexercised Broadcom stock options held by Dr. Henry Samueli, our Chief Technical Officer and Chairman of our Board of Directors, valued at approximately $14 million , using a Black-Scholes analysis based on the closing price of Broadcom’s Class A common stock on the date the settlement was deemed final (such stock options were originally valued at $24 million for purposes of the settlement (using the same methodology used to value equity granted to employees in the February 2011 annual focal compensation review)); and
• Dr. Samueli contributed approximately $2 million in cash to the Broadcom Foundation (through Broadcom Corporation).
Payment Obligations by Year
2013 2014 2015 2016 2017 Thereafter Total
(In millions)
Operating leases $ 144 $ 109 $ 85 $ 77 $ 55 $ 81 $ 551 Inventory and related purchase obligations 609 — — — — — 609 Other obligations 196 78 36 23 3 — 336 Long-term debt and related interest 340 35 436 26 26 1,076 1,939
$ 1,289 $ 222 $ 557 $ 126 $ 84 $ 1,157 $ 3,435

Table of Contents
In 2010 we performed the first step of the quantitative goodwill impairment assessment for each of our reporting units and determined no
impairment was indicated as the estimated fair value of each of the reporting units exceeded its respective carrying value. In 2011 we made a qualitative assessment of whether goodwill impairment exists and determined that it was more likely than not that the fair value of our reporting units exceeded their carrying values. Therefore, we did not perform the quantitative two-step goodwill impairment test. In 2012 we performed the first step of the quantitative goodwill impairment assessment for each of our reporting units and determined no impairment was indicated as the estimated fair value of each of the reporting units exceeded its respective carrying value. At December 31, 2012 the book value of the Company was $7.84 billion while the market capitalization was $18.90 billion .
For the 2012 and 2010 annual impairment assessments we performed quantitative impairment testing. We estimated the fair values of our
reporting units using a combination of the income and market approach. The income approach utilizes estimates of discounted future cash flows. The market approach, based on a peer group of each reporting unit, utilizes market multiples for revenue and earnings before income taxes. The discounted cash flows for each reporting unit were based on discrete financial forecasts developed by management for planning purposes. Cash flows beyond the discrete forecasts were estimated using a terminal value calculation, which incorporated historical and forecasted financial trends for each identified reporting unit and considered perpetual earnings growth rates for publicly traded peer companies. Future cash flows were discounted to present value by incorporating appropriate present value techniques.
Specifically, the income approach valuations included the following assumptions for 2012 and 2010:
As a result of our NetLogic acquisition in February 2012, we added $1.81 billion of additional goodwill, resulting in our Infrastructure and
Networking reporting unit having an allocated goodwill balance of $2.49 billion at December 31, 2012. Based on our asset impairment testing and the increased balance of goodwill due to our acquisition of NetLogic and a number of other companies over the last several years, at December 31, 2012 we determined there was a risk of our Infrastructure and Networking reporting unit failing the first step of the goodwill impairment test in future periods. The level of excess fair value over carrying value for this reporting unit was approximately 19% as of October 1, 2012.
In 2012 we recorded a purchased intangible impairment charge of $49 million related to our 2011 acquisition of Provigent included in our
Infrastructure and Networking reportable segment, and other impairment charges of $38 million related to six other acquisitions. The primary factor contributing to Provigent impairment charge was the reduction of forecasted cash flows related to certain legacy microwave technology products. The primary factor contributing to the other impairment charges was the reduction in the revenue outlook for certain products and the resulting decrease to the estimated cash flows identified with the impaired assets. Additionally, we recorded an impairment charge of $3 million related to certain computer software and equipment in June 2012.
In 2011 we recorded a purchased intangible impairment charge of $74 million related to our 2010 acquisition of Beceem, included in our
Mobile and Wireless reportable segment, and other impairment charges of $18 million . The primary factor contributing to this impairment charge was the continued reduction in the forecasted cash flows derived from the acquired WiMAX products as wireless service providers have accelerated their adoption of Long Term Evolution, or LTE, products.
In 2010 we recorded an impairment charge of $19 million , primarily related to a technology license that was acquired in 2008 from
Sunext Design, Inc. The primary factor contributing to these impairment charges was the continued reduction in our revenue outlook for Blu-ray product line, which was ultimately discontinued, and the related decrease to the estimated cash flows identified with the impaired assets.
In determining the amount of the impairment charges we calculated fair values as of the impairment date for acquired intangible assets.
The fair value was determined using the multiple period excess earnings method , described in Note 3. The fair values were determined using significant unobservable inputs categorized as Level 3 inputs. The key unobservable inputs
F-39
10. Impairment of Goodwill and Long-Lived Assets
2012 2010
Discount rate 12.0% - 14.3% 12.0% - 17.7% Perpetual growth rate 4.0 % 4.0 %
Tax rate 15.1 % 17.0 %
Risk free rate 2.4 % 3.4 %
Peer company beta 1.19 - 1.21 1.26 - 1.52

Table of Contents utilized in the model include discount rates ranging from 15% to 25% , a market participant tax rate of 15% , and a probability adjusted level of future cash flows based on current product and market data.
Business Enterprise Segments
Broadcom has three reportable segments consistent with our target markets. Our three reportable segments are: Broadband
Communications (Home), Mobile and Wireless (Hand), and Infrastructure and Networking (Infrastructure). Our Chief Executive Officer, who is our chief operating decision maker, or CODM, reviews financial information at the reportable segment level.
Our net revenue is generated principally from sales of integrated circuit products, the income we receive from our agreement with
Qualcomm and other licensing revenue. While we derive some revenue from other sources, that revenue is not material as it represents approximately 1% of our total net revenue. Such revenue is classified under product revenue for reporting purposes. We group our net revenue consistent with our three target markets which comprise our reportable segments, as discussed above.
With respect to the sales of integrated circuit products, we have approximately 600 products that are grouped into approximately 60
product lines. We have concluded that these products constitute a group of similar products within each reportable segment in each of the following respects:
We also report an “All Other” category that is comprised of (i) income from the Qualcomm Agreement and (ii) other licensing revenue,
since they are principally the result of corporate efforts. “All Other” also includes operating expenses that we do not allocate to our other operating segments as these expenses are not included in the segment operating performance measures evaluated by our CODM. Operating costs and expenses that are not allocated include stock-based compensation, amortization of purchased intangible assets, amortization of acquired inventory valuation step-up, impairment of goodwill and other long-lived assets, net settlement costs (gains), net restructuring costs, charitable contributions, non-recurring legal fees, change in contingent earnout liability, employer payroll tax on certain stock option exercises, and other miscellaneous expenses related to corporate allocations that were either over or under the original projections at the beginning of the year. We include stock-based compensation and acquisition-related items in the “All Other” category as decisions regarding equity compensation are made at the corporate level and our CODM reviews reportable segment performance exclusive of these charges. Our CODM does not review information regarding total assets, interest income or income taxes on an operating segment basis. The accounting policies for segment reporting are the same as for Broadcom as a whole.
The following tables present details of our reportable segments and the “All Other” category:
F-40
11. Business Enterprise Segments, Significant Customer and Geographical Information
• the integrated circuits marketed by each of our reportable segments are sold to one type of customer: manufacturers of wired and wireless communications equipment, which incorporate our integrated circuits into their electronic products;
• the integrated circuits sold by each of our reportable segments use the same standard CMOS manufacturing processes; and • all of our integrated circuits are sold through a centralized sales force and common wholesale distributors.
Reportable Segments
Broadband
Communications Mobile and
Wireless Infrastructure and
Networking All
Other Consolidated
(In millions) Year Ended December 31, 2012
Net revenue $ 2,156 $ 3,810 $ 1,853 $ 187 $ 8,006 Operating income (loss) 504 562 483 (873 ) 676 Year Ended December 31, 2011
Net revenue $ 2,039 $ 3,483 $ 1,659 $ 208 $ 7,389 Operating income (loss) 391 572 544 (554 ) 953 Year Ended December 31, 2010
Net revenue $ 2,134 $ 2,889 $ 1,588 $ 207 $ 6,818 Operating income (loss) 446 526 579 (469 ) 1,082

Table of Contents
Significant Customer and Geographical Information
Sales to our significant customers, including sales to their manufacturing subcontractors, as a percentage of net revenue were as follows:
Sales to Samsung and Apple were primarily related to our Mobile and Wireless reportable segment. No other customer represented more
than 10% of our annual net revenue in these years. The geographical distribution of our shipments, as a percentage of product revenue was as follows:
We do not own or operate a fabrication facility. Four independent third-party foundries located in Asia manufacture a majority of our
semiconductor devices in current production. Any sudden demand for an increased amount of semiconductor devices or sudden reduction or elimination of any existing source or sources of semiconductor devices could result in a material delay in the shipment of our products. In addition, substantially all of our products are assembled and tested by one of six independent third-party subcontractors in Asia. We do not have long-term agreements with any of these suppliers. Any problems associated with the fabrication facilities or the delivery, quality or cost of our products could have a material adverse effect on our business, results of operations and financial condition.
We have an international distribution center that includes engineering design and administrative facilities in Singapore as well as
engineering design facilities in Belgium, Canada, China, Denmark, France, Greece, India, Israel, Japan, Korea, the
F-41
Included in "All Other" category: Year Ended December 31,
2012 2011 2010
(In millions)
Net revenue $ 187 $ 208 $ 207 Stock-based compensation $ 543 $ 513 $ 484 Amortization of purchased intangible assets 311 84 59 Amortization of acquired inventory valuation step-up 72 24 10 Impairments of long-lived assets 90 92 19 Settlement costs (gains) 79 (18 ) 53 Restructuring costs, net 7 16 — Charitable contribution — 25 — Non recurring legal fees — 25 — Change in contingent earnout liability — (1 ) — Employer payroll tax on certain stock option exercises 10 8 10 Miscellaneous corporate allocation variances (52 ) (6 ) 41 Total other operating costs and expenses $ 1,060 $ 762 $ 676 Total operating loss for the “All Other” category $ (873 ) $ (554 ) $ (469 )
Year Ended December 31,
2012 2011 2010
Samsung 17.3 % 10.0 % 10.0 %
Apple 14.6 13.1 10.9 Five largest customers as a group 47.2 42.6 38.6
Year Ended December 31,
2012 2011 2010
China (exclusive of Hong Kong) 31.2 % 33.6 % 30.5 %
Hong Kong 27.7 26.7 26.0 Singapore, Taiwan, Thailand and Japan 27.7 24.7 34.8 United States 3.2 3.1 4.4 Europe 1.6 2.0 2.7 Other 8.6 9.9 1.6
100.0 % 100.0 % 100.0 %

Table of Contents Netherlands, Taiwan and the United Kingdom. At December 31, 2012 , $135 million , or approximately 25.0% of our tangible long-lived assets were located outside the United States. 12. Quarterly Financial Data (Unaudited)
The following table presents our unaudited quarterly financial data. In our opinion, this information has been prepared on a basis consistent with that of our audited consolidated financial statements and all necessary material adjustments, consisting of normal recurring accruals and adjustments, have been included to present fairly the unaudited quarterly financial data. Our quarterly results of operations for these periods are not necessarily indicative of future results of operations.
In January 2013 our Board of Directors adopted an amendment to our existing dividend policy pursuant to which we intend to increase the quarterly cash dividend by 10% to $0.11 per share ( $0.44 per share on an annual basis) and declared a quarterly cash dividend of $0.11 per share payable to holders of our common stock.
F-42
Total Net Revenue
Gross Profit
Net Income
Diluted Net Income
Per Share
(In millions, except per share data)
Year Ended December 31, 2012
Fourth Quarter $ 2,080 $ 1,055 $ 251 $ 0.43 Third Quarter 2,128 1,065 220 (1) 0.38 Second Quarter 1,971 950 160 (2) 0.28 First Quarter 1,827 909 88 (3) 0.15 Year Ended December 31, 2011
Fourth Quarter $ 1,820 $ 926 $ 254 $ 0.45 Third Quarter 1,957 997 270 (4) 0.48 Second Quarter 1,796 918 175 (5) 0.31 First Quarter 1,816 922 228 0.40
(1) Includes impairment of long-lived assets charges of $ 48 million. (2) Includes impairment of long-lived assets charged of $ 9 million. (3) Includes settlement costs of $ 86 million and impairment of long-lived assets charges of $ 28 million. (4) Includes settlement costs of $ 27 million and a restructuring charge of $ 17 million. (5) Includes settlement gains of $ 45 million, an impairment of long-lived assets charge of $ 74 million, a charitable contribution of $ 25 million and non-recurring legal
expenses of $ 25 million.
13. Subsequent Events

Table of Contents Exhibits and Financial Statement Schedules
Exhibit Index
Where Located
Exhibit Number Description Form File No.
Exhibit No. Filing Date
Filed Herewith
2.1
Agreement and plan of Merger, dated as of September 11, 2011, by and among Broadcom, NetLogic Microsystems and I&N Acquisition Corp.
8-K
000- 23993
2.1
9/12/2011
3.1
Second Amended and Restated Articles of Incorporation filed with the California Secretary of State on June 8, 2006
8-K
000- 23993
3.1
8/10/2006
3.2
Amended and Restated Bylaws, as amended through August 16, 2012
8-K
000- 23993
3.1
8/16/2012
4.1
Indenture, dated November 1, 2010, between the registrant and Wilmington Trust FSB
8-K
000- 23993
4.1
11/1/2010
4.2
Supplemental Indenture, dated November 1, 2010, between the registrant and Wilmington Trust FSB, including the forms of Broadcom’s 1.500% Senior Notes due 2013 and 2.375% Senior Notes due 2015
8-K
000- 23993
4.2
11/1/2010
4.3
Second Supplemental Indenture, dated November 9, 2011, between the registrant and Wilmington Trust, National Association, including the form of Broadcom’s 2.700% Senior Notes due 2018
8-K
000- 23993
4.1
11/9/2011
4.4
Third Supplemental Indenture, dated August 16, 2012, between Broadcom and Wilmington Trust, National Association, including the forms of Broadcom's 2.500% Senior Notes due 2022
8-K
000- 23993
4.1
8/16/2012
4.5
Registration Rights Agreement, dated as of August 16, 2012, by and among Broadcom Corporation, J.P. Morgan Securities LLC and Morgan Stanley & Co. LLC
8-K
000- 23993
4.2
8/16/2012
10.1*
Performance Bonus Plan (as amended and restated March 5, 2010)
8-K
000- 23993
99.1
3/9/2010
10.2*
Fourth Amendment dated August 9, 2010 to Letter Agreement between the registrant and Scott A. McGregor
10-Q
000- 23993
10.1
10/26/2010
10.3*
Third Amendment dated August 9, 2010 to Letter Agreement between the registrant and Eric K. Brandt
10-Q
000- 23993
10.2
10/26/2010
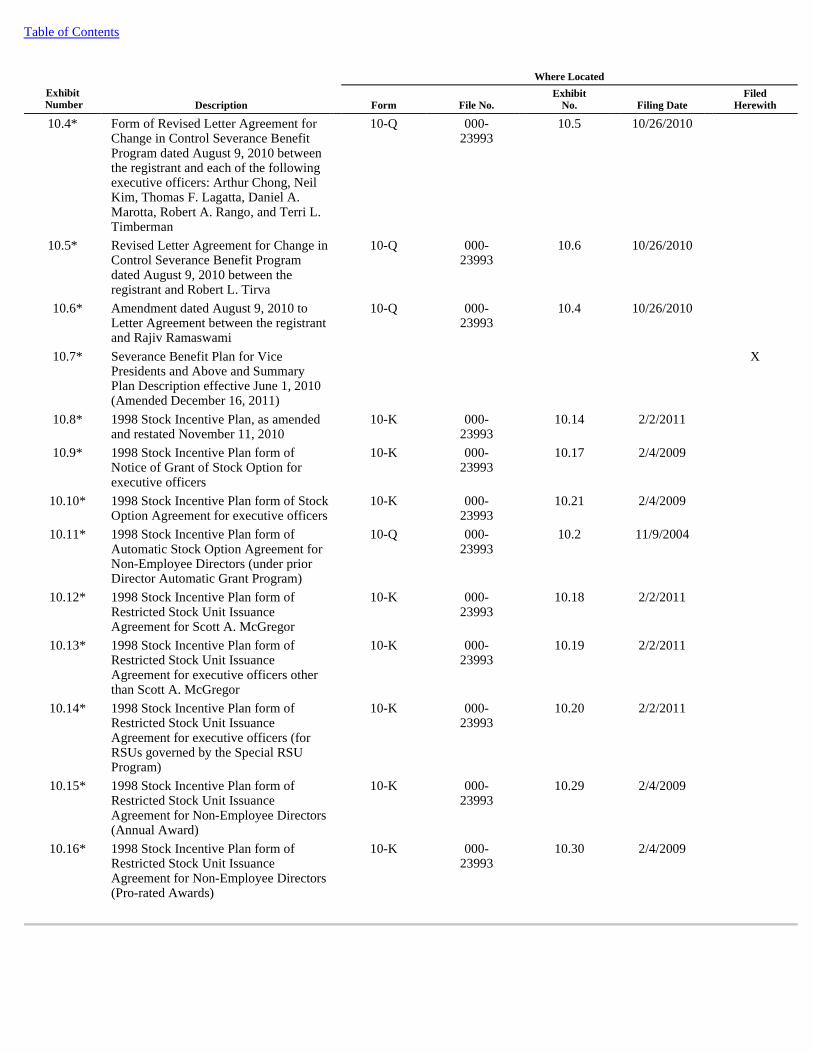
Table of Contents
Where Located
Exhibit Number Description Form File No.
Exhibit No. Filing Date
Filed Herewith
10.4*
Form of Revised Letter Agreement for Change in Control Severance Benefit Program dated August 9, 2010 between the registrant and each of the following executive officers: Arthur Chong, Neil Kim, Thomas F. Lagatta, Daniel A. Marotta, Robert A. Rango, and Terri L. Timberman
10-Q
000- 23993
10.5
10/26/2010
10.5*
Revised Letter Agreement for Change in Control Severance Benefit Program dated August 9, 2010 between the registrant and Robert L. Tirva
10-Q
000- 23993
10.6
10/26/2010
10.6*
Amendment dated August 9, 2010 to Letter Agreement between the registrant and Rajiv Ramaswami
10-Q
000- 23993
10.4
10/26/2010
10.7*
Severance Benefit Plan for Vice Presidents and Above and Summary Plan Description effective June 1, 2010 (Amended December 16, 2011)
X
10.8*
1998 Stock Incentive Plan, as amended and restated November 11, 2010
10-K
000- 23993
10.14
2/2/2011
10.9*
1998 Stock Incentive Plan form of Notice of Grant of Stock Option for executive officers
10-K
000- 23993
10.17
2/4/2009
10.10*
1998 Stock Incentive Plan form of Stock Option Agreement for executive officers
10-K
000- 23993
10.21
2/4/2009
10.11*
1998 Stock Incentive Plan form of Automatic Stock Option Agreement for Non-Employee Directors (under prior Director Automatic Grant Program)
10-Q
000- 23993
10.2
11/9/2004
10.12*
1998 Stock Incentive Plan form of Restricted Stock Unit Issuance Agreement for Scott A. McGregor
10-K
000- 23993
10.18
2/2/2011
10.13*
1998 Stock Incentive Plan form of Restricted Stock Unit Issuance Agreement for executive officers other than Scott A. McGregor
10-K
000- 23993
10.19
2/2/2011
10.14*
1998 Stock Incentive Plan form of Restricted Stock Unit Issuance Agreement for executive officers (for RSUs governed by the Special RSU Program)
10-K
000- 23993
10.20
2/2/2011
10.15*
1998 Stock Incentive Plan form of Restricted Stock Unit Issuance Agreement for Non-Employee Directors (Annual Award)
10-K
000- 23993
10.29
2/4/2009
10.16*
1998 Stock Incentive Plan form of Restricted Stock Unit Issuance Agreement for Non-Employee Directors (Pro-rated Awards)
10-K
000- 23993
10.30
2/4/2009
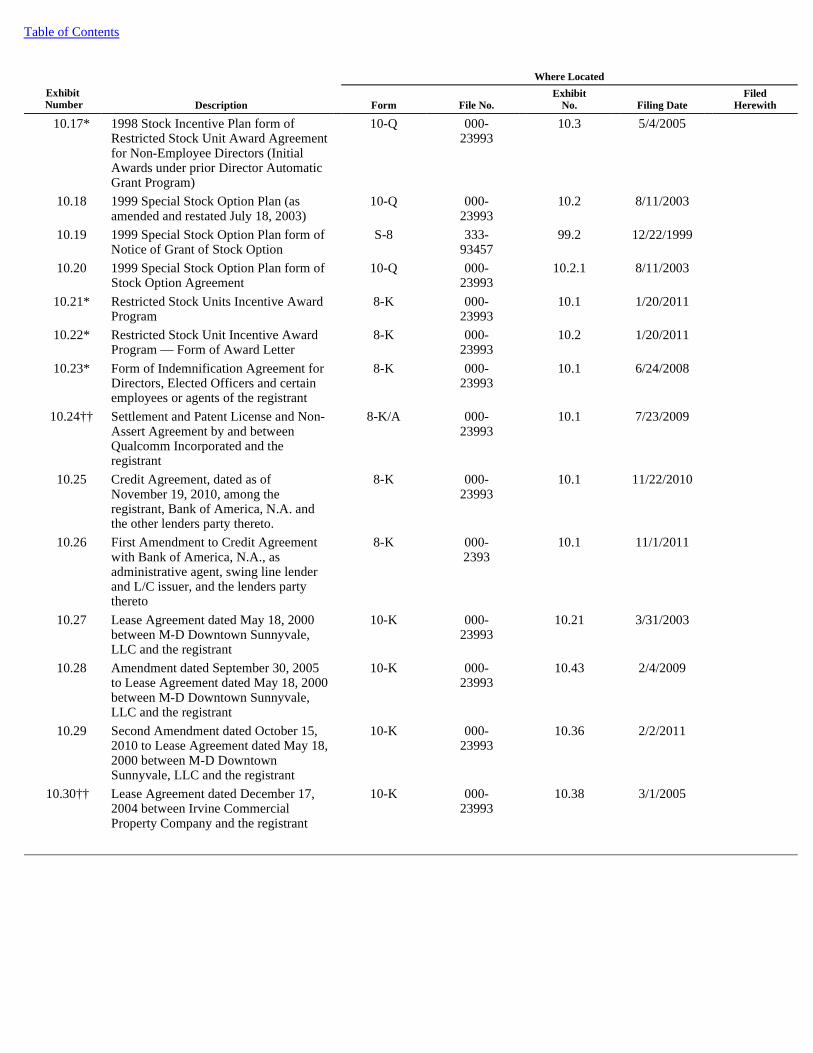
Table of Contents
Where Located
Exhibit Number Description Form File No.
Exhibit No. Filing Date
Filed Herewith
10.17*
1998 Stock Incentive Plan form of Restricted Stock Unit Award Agreement for Non-Employee Directors (Initial Awards under prior Director Automatic Grant Program)
10-Q
000- 23993
10.3
5/4/2005
10.18
1999 Special Stock Option Plan (as amended and restated July 18, 2003)
10-Q
000- 23993
10.2
8/11/2003
10.19
1999 Special Stock Option Plan form of Notice of Grant of Stock Option
S-8
333- 93457
99.2
12/22/1999
10.20
1999 Special Stock Option Plan form of Stock Option Agreement
10-Q
000- 23993
10.2.1
8/11/2003
10.21*
Restricted Stock Units Incentive Award Program
8-K
000- 23993
10.1
1/20/2011
10.22*
Restricted Stock Unit Incentive Award Program — Form of Award Letter
8-K
000- 23993
10.2
1/20/2011
10.23*
Form of Indemnification Agreement for Directors, Elected Officers and certain employees or agents of the registrant
8-K
000- 23993
10.1
6/24/2008
10.24††
Settlement and Patent License and Non-Assert Agreement by and between Qualcomm Incorporated and the registrant
8-K/A
000- 23993
10.1
7/23/2009
10.25
Credit Agreement, dated as of November 19, 2010, among the registrant, Bank of America, N.A. and the other lenders party thereto.
8-K
000- 23993
10.1
11/22/2010
10.26
First Amendment to Credit Agreement with Bank of America, N.A., as administrative agent, swing line lender and L/C issuer, and the lenders party thereto
8-K
000- 2393
10.1
11/1/2011
10.27
Lease Agreement dated May 18, 2000 between M-D Downtown Sunnyvale, LLC and the registrant
10-K
000- 23993
10.21
3/31/2003
10.28
Amendment dated September 30, 2005 to Lease Agreement dated May 18, 2000 between M-D Downtown Sunnyvale, LLC and the registrant
10-K
000- 23993
10.43
2/4/2009
10.29
Second Amendment dated October 15, 2010 to Lease Agreement dated May 18, 2000 between M-D Downtown Sunnyvale, LLC and the registrant
10-K
000- 23993
10.36
2/2/2011
10.30††
Lease Agreement dated December 17, 2004 between Irvine Commercial Property Company and the registrant
10-K
000- 23993
10.38
3/1/2005

Table of Contents
Where Located
Exhibit Number Description Form File No.
Exhibit No. Filing Date
Filed Herewith
10.31
First Amendment, Second Amendment, and Third Amendment dated June 7, 2005, April 9, 2007 and April 9, 2007, respectively, to Lease dated December 17, 2004 between Irvine Commercial Property Company LLC and the registrant
10-Q
000- 23993
10.20
10/24/2007
10.32
Fourth Amendment dated November 19, 2007 to Lease dated December 17, 2004 between Irvine Commercial Property Company LLC and the registrant
10-K
000- 23993
10.43
1/28/2008
10.33
Lease Agreement dated October 31, 2007 between Irvine Commercial Property Company LLC and the registrant
10-K
000- 23993
10.44
1/28/2008
10.34
First Amendment dated November 12, 2008 to Lease Agreement dated October 31, 2007 between Irvine Commercial Property Company LLC and the registrant
10-K
000- 23993
10.49
2/4/2009
10.35
Second Amendment, Third Amendment, and Fourth Amendment dated July 30, 2010, September 14, 2010 and November 15, 2010, respectively, to Lease Agreement dated October 31, 2007 between Irvine Commercial Property Company LLC and the registrant
10-K
000- 23993
10.42
2/2/2011
10.36
Fifth and Sixth Amendment dated April 24, 2011 and August 2, 2011, respectively to Lease Agreement dated October 31, 2007 between Irvine Commercial Property Company LLC and the registrant
10-K
000- 23993
10.45
2/1/2012
10.37
Seventh Amendment dated June 28, 2012 to Lease Agreement dated October 31, 2007 between Irvine Commercial Property Company LLC and the registrant
X
21.1 Subsidiaries of the Company X
23.1 Consent of KPMG LLP X
31.1
Certification of the Chief Executive Officer, as required pursuant to Section 302 of the Sarbanes-Oxley Act of 2002
X
31.2
Certification of the Chief Financial Officer, as required pursuant to Section 302 of the Sarbanes-Oxley Act of 2002
X
32.1
Certifications of the Chief Executive Officer and Chief Financial Officer, as required pursuant to Section 906 of the Sarbanes-Oxley Act of 2002
X
101.INS XBRL Instance Document X
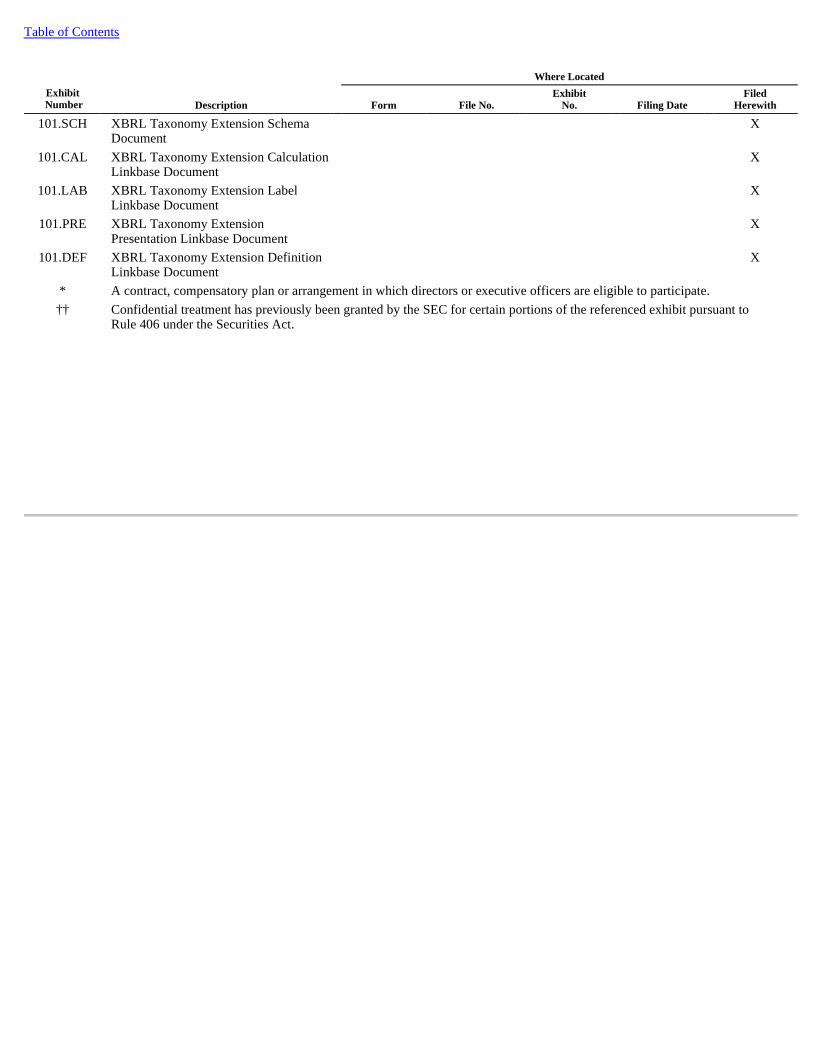
Table of Contents
Where Located
Exhibit Number Description Form File No.
Exhibit No. Filing Date
Filed Herewith
101.SCH
XBRL Taxonomy Extension Schema Document
X
101.CAL
XBRL Taxonomy Extension Calculation Linkbase Document
X
101.LAB
XBRL Taxonomy Extension Label Linkbase Document
X
101.PRE
XBRL Taxonomy Extension Presentation Linkbase Document
X
101.DEF
XBRL Taxonomy Extension Definition Linkbase Document
X
* A contract, compensatory plan or arrangement in which directors or executive officers are eligible to participate.
††
Confidential treatment has previously been granted by the SEC for certain portions of the referenced exhibit pursuant to Rule 406 under the Securities Act.
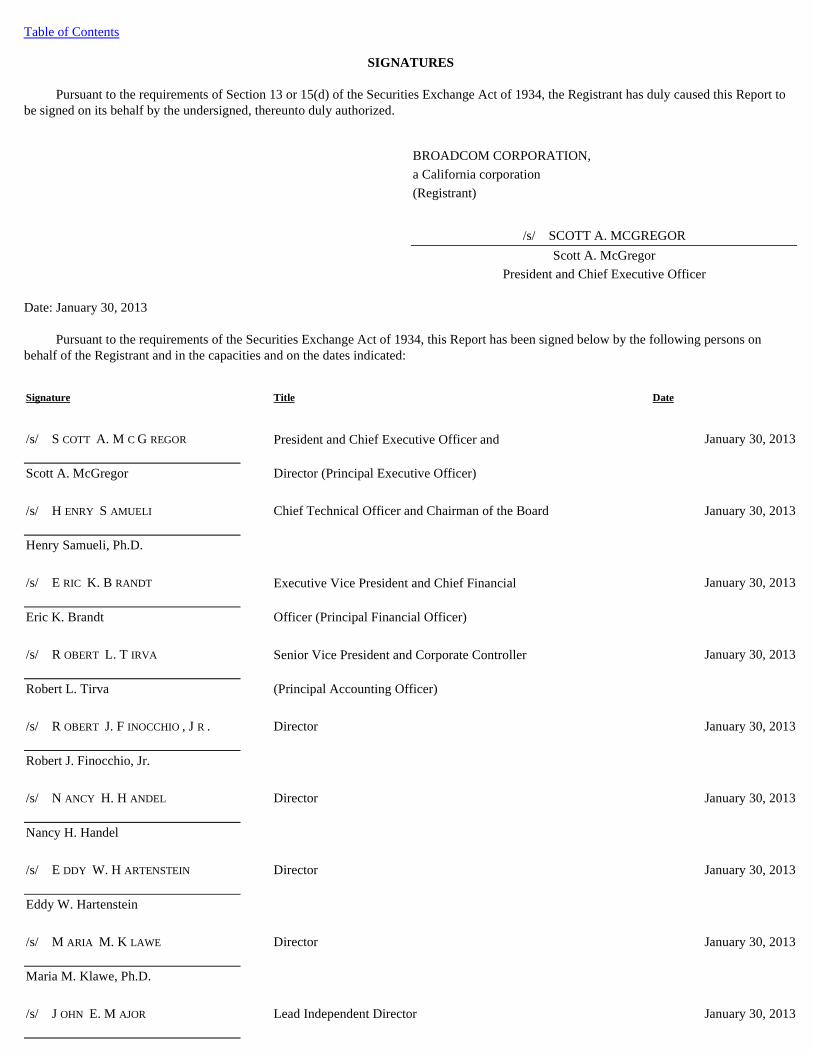
Table of Contents
SIGNATURES
Pursuant to the requirements of Section 13 or 15(d) of the Securities Exchange Act of 1934, the Registrant has duly caused this Report to be signed on its behalf by the undersigned, thereunto duly authorized.
Date: January 30, 2013
Pursuant to the requirements of the Securities Exchange Act of 1934, this Report has been signed below by the following persons on
behalf of the Registrant and in the capacities and on the dates indicated:
BROADCOM CORPORATION,
a California corporation
(Registrant)
/s/ SCOTT A. MCGREGOR
Scott A. McGregor
President and Chief Executive Officer
Signature Title Date
/s/ S COTT A. M C G REGOR
President and Chief Executive Officer and
January 30, 2013
Scott A. McGregor Director (Principal Executive Officer)
/s/ H ENRY S AMUELI
Chief Technical Officer and Chairman of the Board
January 30, 2013
Henry Samueli, Ph.D.
/s/ E RIC K. B RANDT
Executive Vice President and Chief Financial
January 30, 2013
Eric K. Brandt Officer (Principal Financial Officer)
/s/ R OBERT L. T IRVA
Senior Vice President and Corporate Controller
January 30, 2013
Robert L. Tirva (Principal Accounting Officer)
/s/ R OBERT J. F INOCCHIO , J R .
Director
January 30, 2013
Robert J. Finocchio, Jr.
/s/ N ANCY H. H ANDEL
Director
January 30, 2013
Nancy H. Handel
/s/ E DDY W. H ARTENSTEIN
Director
January 30, 2013
Eddy W. Hartenstein
/s/ M ARIA M. K LAWE
Director
January 30, 2013
Maria M. Klawe, Ph.D.
/s/ J OHN E. M AJOR
Lead Independent Director
January 30, 2013

John E. Major
/s/ W ILLIAM T. M ORROW
Director
January 30, 2013
William T. Morrow
/s/ R OBERT E. S WITZ
Director
January 30, 2013
Robert E. Switz

Table of Contents
SCHEDULE II — CONSOLIDATED VALUATION AND QUALIFYING ACCOUNTS
BROADCOM CORPORATION
S-1
Balance at Charged Charged to Balance at
Beginning of to Costs and Other End of
Description Year Expenses Accounts Deductions Year
(In millions)
Year ended December 31, 2012:
Deducted from asset accounts:
Allowance for doubtful accounts $ 9 $ — $ — $ (1 ) $ 8 Sales returns 10 31 — (29 ) 12 Restructuring liabilities 8 7 — (14 ) 1
Total $ 27 $ 38 $ — $ (44 ) $ 21
Year ended December 31, 2011:
Deducted from asset accounts:
Allowance for doubtful accounts $ 9 $ — $ — $ — $ 9 Sales returns 14 37 — (41 ) 10 Restructuring liabilities — 16 — (8 ) 8
Total $ 23 $ 53 $ — $ (49 ) $ 27
Year ended December 31, 2010:
Deducted from asset accounts:
Allowance for doubtful accounts $ 7 $ 2 $ — $ — $ 9 Sales returns 4 31 — (21 ) 14 Restructuring liabilities 1 — — (1 ) —
Total $ 12 $ 33 $ — $ (22 ) $ 23

Table of Contents
EXHIBIT INDEX
Where Located
Exhibit Number Description Form File No.
Exhibit No. Filing Date
Filed Herewith
2.1
Agreement and plan of Merger, dated as of September 11, 2011, by and among Broadcom, NetLogic Microsystems and I&N Acquisition Corp.
8-K
000- 23993
2.1
9/12/2011
3.1
Second Amended and Restated Articles of Incorporation filed with the California Secretary of State on June 8, 2006
8-K
000- 23993
3.1
8/10/2006
3.2
Amended and Restated Bylaws, as amended through August 16, 2012
8-K
000- 23993
3.1
8/16/2012
4.1
Indenture, dated November 1, 2010, between the registrant and Wilmington Trust FSB
8-K
000- 23993
4.1
11/1/2010
4.2
Supplemental Indenture, dated November 1, 2010, between the registrant and Wilmington Trust FSB, including the forms of Broadcom’s 1.500% Senior Notes due 2013 and 2.375% Senior Notes due 2015
8-K
000- 23993
4.2
11/1/2010
4.3
Second Supplemental Indenture, dated November 9, 2011, between the registrant and Wilmington Trust, National Association, including the form of Broadcom’s 2.700% Senior Notes due 2018
8-K
000- 23993
4.1
11/9/2011
4.4
Third Supplemental Indenture, dated August 16, 2012, between Broadcom and Wilmington Trust, National Association, including the forms of Broadcom's 2.500% Senior Notes due 2022
8-K
000- 23993
4.1
8/16/2012
4.5
Registration Rights Agreement, dated as of August 16, 2012, by and among Broadcom Corporation, J.P. Morgan Securities LLC and Morgan Stanley & Co. LLC
8-K
000- 23993
4.2
8/16/2012
10.1*
Performance Bonus Plan (as amended and restated March 5, 2010)
8-K
000- 23993
99.1
3/9/2010
10.2*
Fourth Amendment dated August 9, 2010 to Letter Agreement between the registrant and Scott A. McGregor
10-Q
000- 23993
10.1
10/26/2010
10.3*
Third Amendment dated August 9, 2010 to Letter Agreement between the registrant and Eric K. Brandt
10-Q
000- 23993
10.2
10/26/2010
10.4*
Form of Revised Letter Agreement for Change in Control Severance Benefit Program dated August 9, 2010 between the registrant and each of the following executive officers: Arthur Chong, Neil Kim, Thomas F. Lagatta, Daniel A. Marotta, Robert A. Rango, and Terri L. Timberman
10-Q
000- 23993
10.5
10/26/2010

Table of Contents
Where Located
Exhibit Number Description Form File No.
Exhibit No. Filing Date
Filed Herewith
10.5*
Revised Letter Agreement for Change in Control Severance Benefit Program dated August 9, 2010 between the registrant and Robert L. Tirva
10-Q
000- 23993
10.6
10/26/2010
10.6*
Amendment dated August 9, 2010 to Letter Agreement between the registrant and Rajiv Ramaswami
10-Q
000- 23993
10.4
10/26/2010
10.7*
Severance Benefit Plan for Vice Presidents and Above and Summary Plan Description effective June 1, 2010 (Amended December 16, 2011)
X
10.8*
1998 Stock Incentive Plan, as amended and restated November 11, 2010
10-K
000- 23993
10.14
2/2/2011
10.9*
1998 Stock Incentive Plan form of Notice of Grant of Stock Option for executive officers
10-K
000- 23993
10.17
2/4/2009
10.10*
1998 Stock Incentive Plan form of Stock Option Agreement for executive officers
10-K
000- 23993
10.21
2/4/2009
10.11*
1998 Stock Incentive Plan form of Automatic Stock Option Agreement for Non-Employee Directors (under prior Director Automatic Grant Program)
10-Q
000- 23993
10.2
11/9/2004
10.12*
1998 Stock Incentive Plan form of Restricted Stock Unit Issuance Agreement for Scott A. McGregor
10-K
000- 23993
10.18
2/2/2011
10.13*
1998 Stock Incentive Plan form of Restricted Stock Unit Issuance Agreement for executive officers other than Scott A. McGregor
10-K
000- 23993
10.19
2/2/2011
10.14*
1998 Stock Incentive Plan form of Restricted Stock Unit Issuance Agreement for executive officers (for RSUs governed by the Special RSU Program)
10-K
000- 23993
10.20
2/2/2011
10.15*
1998 Stock Incentive Plan form of Restricted Stock Unit Issuance Agreement for Non-Employee Directors (Annual Award)
10-K
000- 23993
10.29
2/4/2009
10.16*
1998 Stock Incentive Plan form of Restricted Stock Unit Issuance Agreement for Non-Employee Directors (Pro-rated Awards)
10-K
000- 23993
10.30
2/4/2009
10.17*
1998 Stock Incentive Plan form of Restricted Stock Unit Award Agreement for Non-Employee Directors (Initial Awards under prior Director Automatic Grant Program)
10-Q
000- 23993
10.3
5/4/2005
10.18
1999 Special Stock Option Plan (as amended and restated July 18, 2003)
10-Q
000- 23993
10.2
8/11/2003
10.19
1999 Special Stock Option Plan form of Notice of Grant of Stock Option
S-8
333- 93457
99.2
12/22/1999
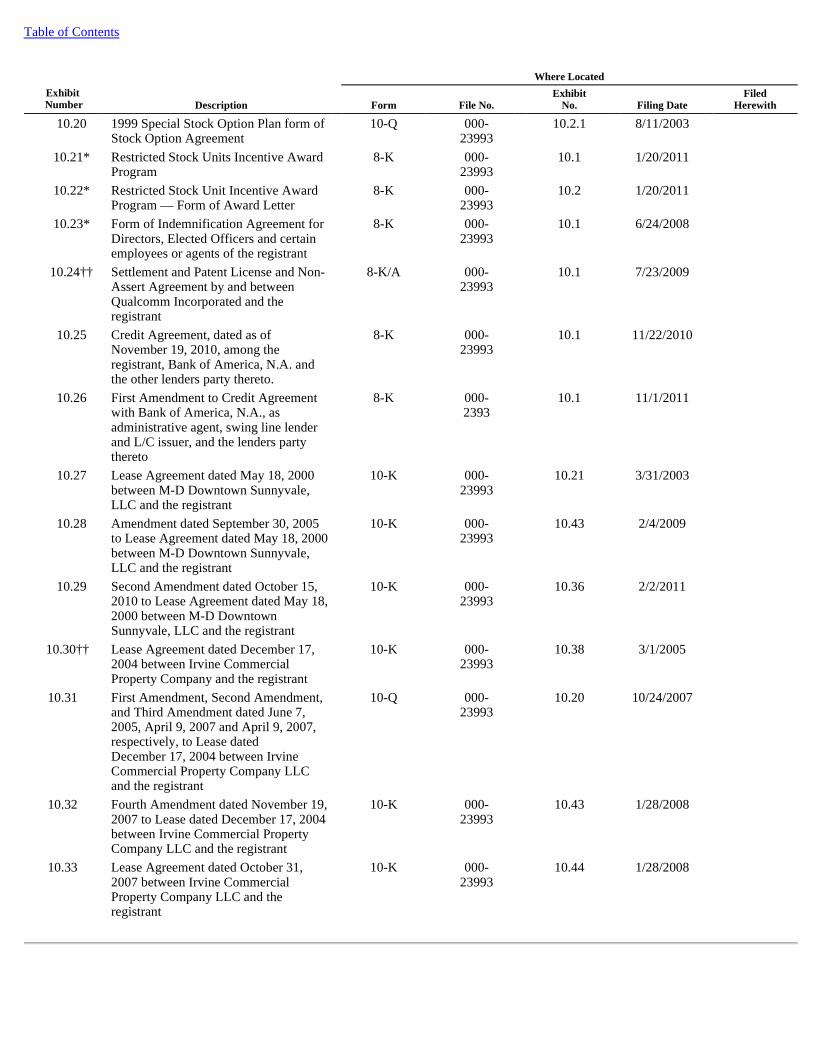
Table of Contents
Where Located
Exhibit Number Description Form File No.
Exhibit No. Filing Date
Filed Herewith
10.20
1999 Special Stock Option Plan form of Stock Option Agreement
10-Q
000- 23993
10.2.1
8/11/2003
10.21*
Restricted Stock Units Incentive Award Program
8-K
000- 23993
10.1
1/20/2011
10.22*
Restricted Stock Unit Incentive Award Program — Form of Award Letter
8-K
000- 23993
10.2
1/20/2011
10.23*
Form of Indemnification Agreement for Directors, Elected Officers and certain employees or agents of the registrant
8-K
000- 23993
10.1
6/24/2008
10.24††
Settlement and Patent License and Non-Assert Agreement by and between Qualcomm Incorporated and the registrant
8-K/A
000- 23993
10.1
7/23/2009
10.25
Credit Agreement, dated as of November 19, 2010, among the registrant, Bank of America, N.A. and the other lenders party thereto.
8-K
000- 23993
10.1
11/22/2010
10.26
First Amendment to Credit Agreement with Bank of America, N.A., as administrative agent, swing line lender and L/C issuer, and the lenders party thereto
8-K
000- 2393
10.1
11/1/2011
10.27
Lease Agreement dated May 18, 2000 between M-D Downtown Sunnyvale, LLC and the registrant
10-K
000- 23993
10.21
3/31/2003
10.28
Amendment dated September 30, 2005 to Lease Agreement dated May 18, 2000 between M-D Downtown Sunnyvale, LLC and the registrant
10-K
000- 23993
10.43
2/4/2009
10.29
Second Amendment dated October 15, 2010 to Lease Agreement dated May 18, 2000 between M-D Downtown Sunnyvale, LLC and the registrant
10-K
000- 23993
10.36
2/2/2011
10.30††
Lease Agreement dated December 17, 2004 between Irvine Commercial Property Company and the registrant
10-K
000- 23993
10.38
3/1/2005
10.31
First Amendment, Second Amendment, and Third Amendment dated June 7, 2005, April 9, 2007 and April 9, 2007, respectively, to Lease dated December 17, 2004 between Irvine Commercial Property Company LLC and the registrant
10-Q
000- 23993
10.20
10/24/2007
10.32
Fourth Amendment dated November 19, 2007 to Lease dated December 17, 2004 between Irvine Commercial Property Company LLC and the registrant
10-K
000- 23993
10.43
1/28/2008
10.33
Lease Agreement dated October 31, 2007 between Irvine Commercial Property Company LLC and the registrant
10-K
000- 23993
10.44
1/28/2008

Table of Contents
Where Located
Exhibit Number Description Form File No.
Exhibit No. Filing Date
Filed Herewith
10.34
First Amendment dated November 12, 2008 to Lease Agreement dated October 31, 2007 between Irvine Commercial Property Company LLC and the registrant
10-K
000- 23993
10.49
2/4/2009
10.35
Second Amendment, Third Amendment, and Fourth Amendment dated July 30, 2010, September 14, 2010 and November 15, 2010, respectively, to Lease Agreement dated October 31, 2007 between Irvine Commercial Property Company LLC and the registrant
10-K
000- 23993
10.42
2/2/2011
10.36
Fifth and Sixth Amendment dated April 24, 2011 and August 2, 2011, respectively to Lease Agreement dated October 31, 2007 between Irvine Commercial Property Company LLC and the registrant
10-K
000- 23993
10.45
2/1/2012
10.37
Seventh Amendment dated June 28, 2012 to Lease Agreement dated October 31, 2007 between Irvine Commercial Property Company LLC and the registrant
X
21.1 Subsidiaries of the Company X
23.1 Consent of KPMG LLP X
31.1
Certification of the Chief Executive Officer, as required pursuant to Section 302 of the Sarbanes-Oxley Act of 2002
X
31.2
Certification of the Chief Financial Officer, as required pursuant to Section 302 of the Sarbanes-Oxley Act of 2002
X
32.1
Certifications of the Chief Executive Officer and Chief Financial Officer, as required pursuant to Section 906 of the Sarbanes-Oxley Act of 2002
X
101.INS XBRL Instance Document X
101.SCH
XBRL Taxonomy Extension Schema Document
X
101.CAL
XBRL Taxonomy Extension Calculation Linkbase Document
X
101.LAB
XBRL Taxonomy Extension Label Linkbase Document
X
101.PRE
XBRL Taxonomy Extension Presentation Linkbase Document
X
101.DEF
XBRL Taxonomy Extension Definition Linkbase Document
X
* A contract, compensatory plan or arrangement in which directors or executive officers are eligible to participate.
††
Confidential treatment has previously been granted by the SEC for certain portions of the referenced exhibit pursuant to Rule 406 under the Securities Act.

EXHIBIT 10.7
BROADCOM CORPORATION SEVERANCE BENEFIT PLAN FOR VICE PRESIDENTS AND ABOVE
AND SUMMARY PLAN DESCRIPTION
(Effective June 1, 2010)
(Amended December 16, 2011)
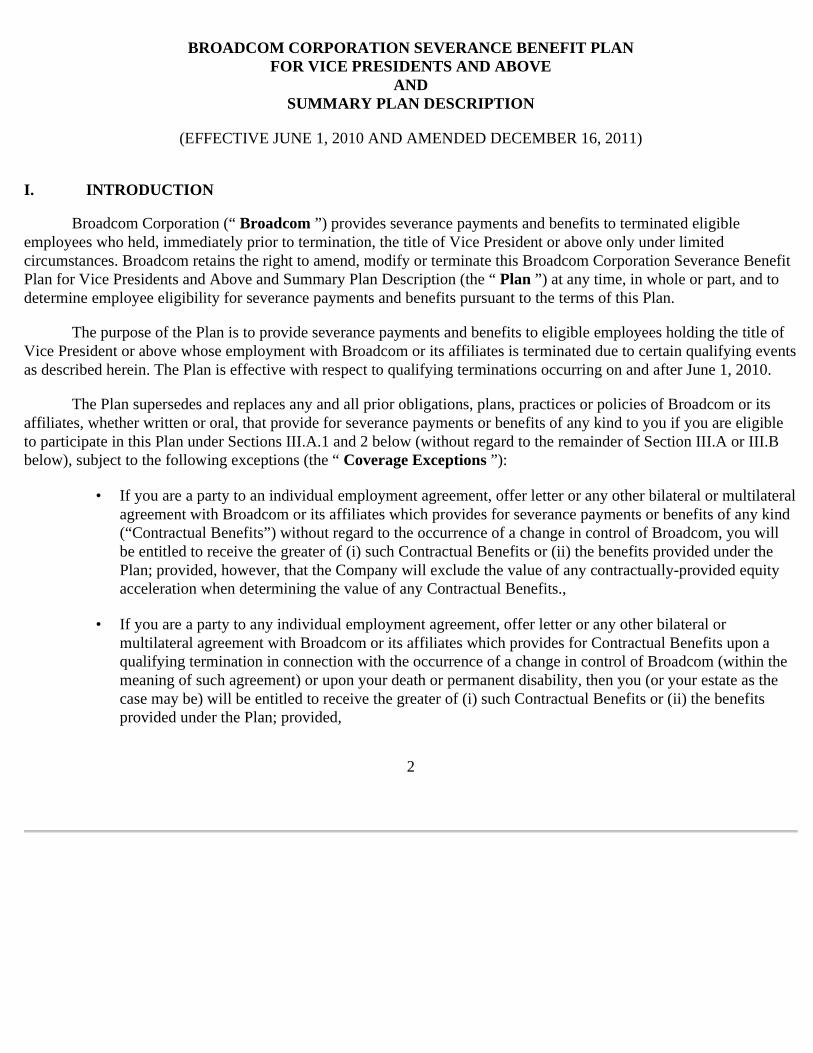
BROADCOM CORPORATION SEVERANCE BENEFIT PLAN
FOR VICE PRESIDENTS AND ABOVE AND
SUMMARY PLAN DESCRIPTION
(EFFECTIVE JUNE 1, 2010 AND AMENDED DECEMBER 16, 2011)
I. INTRODUCTION
Broadcom Corporation (“ Broadcom ”) provides severance payments and benefits to terminated eligible employees who held, immediately prior to termination, the title of Vice President or above only under limited circumstances. Broadcom retains the right to amend, modify or terminate this Broadcom Corporation Severance Benefit Plan for Vice Presidents and Above and Summary Plan Description (the “ Plan ”) at any time, in whole or part, and to determine employee eligibility for severance payments and benefits pursuant to the terms of this Plan.
The purpose of the Plan is to provide severance payments and benefits to eligible employees holding the title of Vice President or above whose employment with Broadcom or its affiliates is terminated due to certain qualifying events as described herein. The Plan is effective with respect to qualifying terminations occurring on and after June 1, 2010.
The Plan supersedes and replaces any and all prior obligations, plans, practices or policies of Broadcom or its affiliates, whether written or oral, that provide for severance payments or benefits of any kind to you if you are eligible to participate in this Plan under Sections III.A.1 and 2 below (without regard to the remainder of Section III.A or III.B below), subject to the following exceptions (the “ Coverage Exceptions ”):
2
• If you are a party to an individual employment agreement, offer letter or any other bilateral or multilateral agreement with Broadcom or its affiliates which provides for severance payments or benefits of any kind (“Contractual Benefits”) without regard to the occurrence of a change in control of Broadcom, you will be entitled to receive the greater of (i) such Contractual Benefits or (ii) the benefits provided under the Plan; provided, however, that the Company will exclude the value of any contractually-provided equity acceleration when determining the value of any Contractual Benefits.,
• If you are a party to any individual employment agreement, offer letter or any other bilateral or multilateral agreement with Broadcom or its affiliates which provides for Contractual Benefits upon a qualifying termination in connection with the occurrence of a change in control of Broadcom (within the meaning of such agreement) or upon your death or permanent disability, then you (or your estate as the case may be) will be entitled to receive the greater of (i) such Contractual Benefits or (ii) the benefits provided under the Plan; provided,

however, that the Company will exclude the value of any contractually-provided equity acceleration when determining the value of any Contractual Benefits..
This Plan is designed to be an “employee welfare benefit plan,” as defined in Section 3(1) of the Employee Retirement Income Security Act of 1974, as amended (“ ERISA ”) and to meet the descriptive requirements of a plan constituting a “severance pay plan” within the meaning of regulations published by the Secretary of Labor at Title 29, Code of Federal Regulations, section 2510.3-2(b). This document shall also serve as a Summary Plan Description.
II. DEFINITIONS
1. “ Affiliate ” means, with respect to any person, any other person that directly or indirectly through one or more intermediaries controls, is controlled by or is under common control with, the person in question. As used herein, the term “control” means the possession, direct or indirect, of the power to direct or cause the direction of the management and policies of a person, whether through ownership of voting securities, by contract or otherwise.
2. “ Alternative Position ” shall mean a position that (a) is not more than fifty (50) miles from the location of your current position as of the effective date of this Plan (for positions that are of a telecommuting nature or are essentially mobile, this limitation does not apply); (b) provides you with pay that is at least 85% of your Base Salary as of the effective date of this Plan and (c) would not otherwise constitute a change in your position that would allow for resignation for Good Reason under the Plan.
3. “ Base Salary ” shall mean your annual base salary in effect as of your Termination Date.
4. “ Board ” shall mean the Board of Directors of Broadcom, or any successor to it, or a committee of the Board of Directors specifically designated for the purpose of making compensation determinations.
5. “Cause ” shall mean the occurrence of any one or more of the following events:
(i) Your willful and continued failure to substantially perform your duties with the Company (other than any such failure resulting from your incapacity due to physical or mental illness);
(ii) Your willful commission of an act of fraud, embezzlement, theft, misappropriation or dishonesty resulting in economic or financial injury to the Company;
(iii) Your conviction of, or entry by you of a guilty or no contest plea to, the commission of a felony or a crime involving moral turpitude;
(iv) Your willful breach of your fiduciary duty to the Company which results in economic or other injury to the Company;
3

(v) Your willful and knowing participation in the preparation or release of false or materially
misleading financial statements relating to Broadcom’s operations and financial condition or your willful and knowing submission of any false or erroneous certification required of you under the Sarbanes-Oxley Act of 2002 or any securities exchange on which shares of Broadcom’s Class A common stock are at the time listed for trading;
(vi) Your material breach of a material term of the Confidentiality and Invention Assignment Agreement between you and Broadcom or your material breach of any material provision or policy set forth in Broadcom’s Code of Ethics and Corporate Conduct; or
(vii) Your material breach of any other written agreement between you and the Company; provided that, in each case, unless the described activity cannot (in the Plan Administrator’s sole discretion) be cured, corrected or ceased, you have received written notice of the described activity in accordance with the Plan, have been afforded a reasonable opportunity to cure or correct the activity described in the notice, and have failed to fully cure, correct or cease the activity, as appropriate.
6. “ COBRA ” shall mean the Consolidated Omnibus Budget Reconciliation Act of 1985, as amended.
7. “ Code ” shall mean the Internal Revenue Code of 1986, as amended.
8. “ Committee ” shall mean the Compensation Committee of the Board or such other committee appointed by the Board to assist the Company in making determinations required under the Plan in accordance with its terms. The “Committee” may delegate its authority under the Plan to an individual or another committee.
9. “ Company ” shall mean Broadcom and any of its Affiliates, other than an Affiliate that the Committee excludes from participation in the Plan.
10. “ Good Reason ” shall mean the occurrence of any one or more of the following events:
(i) Except as you may otherwise agree in writing, a change in your position (including status, offices, titles and reporting requirements) with the Company that materially reduces your then-current authority, duties or responsibilities, or any other action by the Company that results in a material diminution in such authority, duties or responsibilities, excluding for this purpose an isolated, insubstantial or inadvertent action not taken in bad faith and that is remedied by the Company reasonably promptly after the Company receives your notice thereof;
(ii) A more than fifteen percent (15%) reduction by the Company in your then-current base salary;
4

(iii) Any action by the Company that would reduce the aggregate value of your then-current annual
bonus opportunity by more than fifteen percent (15%) in the aggregate; provided, however , that (A) a reduction in your annual bonus opportunity that is part of a broad-based reduction in corresponding bonuses or awards for management employees and pursuant to which your opportunity is not reduced by a greater percentage than the reductions applicable to other management employees or (B) a reduction in your annual bonus opportunity occurring as a result of your failure or the Company’s failure to satisfy performance criteria applicable to such bonus opportunity, in either case, shall not constitute Good Reason;
(iv) A material change to the geographic location at which you must provide services (within the meaning of Section 409A of the Code), provided, however, that in no event shall a relocation of less than fifty (50) miles be deemed material for purposes of this clause (iv); or
(vi) Any material breach by the Company of the terms and conditions of this Plan.
The foregoing shall constitute an exclusive list of the events or contingencies that may constitute Good Reason under the Plan. For purposes of the Plan, a termination of employment by you shall not be deemed to be for Good Reason unless (A) you give the Company written notice describing the event or events which are the basis for such termination within ninety (90) days after the event or events occur, (B) such grounds for termination (if susceptible to correction) are not corrected by the Company within thirty (30) days of the Company’s receipt of such notice (“Correction Period”), and (C) you terminate your employment no later than thirty (30) days following the Correction Period.
11. “ Plan Administrator ” shall mean the individual(s) appointed by the Committee to administer the terms of the Plan, or if no such individual is appointed, then the Plan Administrator shall be the Committee.
12. “ Separation from Service ” shall have the meaning set forth in Section 409A(a)(2)(A)(i) of the Code and Treasury Regulation Section 1.409A-1(h)).
13. “ Termination Date ” shall mean the date on which you incur a Separation from Service from the Company.
14. “ WARN Act ” shall mean the federal Workers Adjustment and Retraining Act or any state law that mandates advanced notice of a plant closing, mass layoff, or other economically motivated reduction in force.
III. ELIGIBILITY
A. Eligibility Criteria
5

You generally are eligible for benefits under the Plan if you satisfy each of the following conditions:
1. You are a full-time U.S. employee of the Company.
2. You hold the title of Vice President, Senior Vice President or Executive Vice President with the Company.
3. You have signed the Company’s standard Confidentiality and Invention Assignment Agreement, or similar document with a predecessor of the Company, that covers the period of your employment with the Company (and/or with any predecessor of the Company) and also includes post-employment obligations concerning the Company’s confidential information.
4. You have returned to the Company, on or within five (5) business days after your employment termination date, all Company documents created and received by you during your employment (electronic and paper) with the exception only of your personal copies of documents evidencing your hire, termination, compensation, benefits and stock options, and any other documents you have received as a shareholder of Broadcom or any parent or subsidiary of Broadcom.
5. Your employment with the Company is terminated by the Company without Cause or you resign for Good Reason and you incur a Separation from Service.
6. If you previously received an advance(s) for business travel and entertainment expenses, (i) you have properly completed and submitted an expense reimbursement form(s) and supporting receipts to the Company within fifteen (15) days after your Termination Date, (ii) the Company has approved your expenses, and (iii) you have repaid within that fifteen (15)-day period any amount advanced but not used.
7. On or before your Termination Date, you have met with your manager or other person designated by the Company and: (i) you have satisfactorily transitioned your work and information concerning your work; and (ii) you have provided the Company with all passwords and pass codes you have created for documents, email and electronic files that you created or used on Company’s computers and computer systems.
8. On or before your Termination Date, you have returned to the Company all items of property received by you for your use during employment, including, but not limited to, any laptops, computer equipment, software programs, cell phones, Secure ID tokens, keys and passes, and credit and calling cards.
9. You are not in one of the excluded categories listed below.
B. Criteria for Exclusion from Eligibility
You are not eligible for severance benefits under this Plan if any of the following apply:
6

1. You are a temporary, leased or seasonal employee of the Company.
2. You work for the Company as an independent contractor, consultant, or agent under a written contract or purchase order or you are otherwise classified as such by the Company (whether or not such classification is upheld on governmental, judicial or other review).
3. You were previously employed by NetLogic Microsystems, Inc. (“NetLogic”) and your employment with NetLogic, the Company or one of its Affiliates is terminated within twelve (12) months following the effective date of the Company’s acquisition of NetLogic pursuant to the Agreement and Plan of Merger, dated as of September 11, 2011, by and among NetLogic, the Company and I&N Acquisition Corp., a wholly owned subsidiary of the Company, and you are not otherwise subject to a written agreement signed by a duly authorized agent of the Company entitling you to participation in the Plan.
4. You voluntarily resign without Good Reason.
5. Your employment is terminated by the Company for Cause.
6. You are offered (without regard to whether you accept or decline) an Alternative Position by the Company, or a company or entity that acquires, merges with, acquires some or all of the assets of, or otherwise carries on the business of the Company relating to your employment.
7. Your employment with the Company or an entity that carries on the business of the Company or a unit of the Company does not terminate.
8. You incur a Separation from Service by reason of your death or a long-term or permanent disability that renders you unable to perform your essential job functions even with accommodation.
9. The payments or benefits to which you would otherwise be entitled under the Plan are excluded under a Coverage Exception.
10. The Plan Administrator determines, in its sole discretion, that your receipt of severance benefits would not under the circumstances further the purposes of the Plan or would otherwise be inappropriate and not in the best interests of the Company; provided, however, that the foregoing discretion shall not be available to the Plan Administrator in the event that you terminate employment for Good Reason under the Plan (it being understood that the Plan Administrator’s exercise of discretion pursuant to this Section III.B.9 shall not, in and of itself, constitute Good Reason).
IV. HOW THE PLAN WORKS
A. Severance Payments and Benefits
7

Upon satisfaction of the eligibility criteria of Section III above and subject to Sections IV.B and C below, you
will be entitled to receive the following severance payments and benefits under the Plan if you incur a Separation from Service from the Company by reason of a termination of your employment either by the Company without Cause or by you for Good Reason. In the event you are entitled to prior notice of your termination pursuant to the provisions of a WARN Act, and you are eligible for severance payments and benefits under this Plan, you will receive, without condition, pay and benefits in lieu of any notice period required by the WARN Act for which actual notice was not provided, and the severance payments and benefits to which you are entitled under this Plan will be the difference between the pay and benefits provided to you in lieu of notice and the payments and benefits otherwise provided in this Section IV.A.
11. Base Salary Severance . You will be paid, in a single lump sum cash payment on the 60th day immediately following your Termination Date, an amount equal to the number of months of your then-current Base Salary as set forth in the table below based on your title with the Company immediately prior to your Termination Date.
12. Bonus Payment . You will be paid, in a single lump sum cash payment, an amount equal to the product of (i) 100% of your target bonus (as determined by the Plan Administrator in its sole discretion) under the Company’s Performance Bonus Plan for the fiscal year in which your Termination Date occurs, without regard to the actual payout under such plan with respect to such fiscal year, multiplied by (ii) a fraction, the numerator of which is the number of months set forth in the table below based on your title with the Company immediately prior to your Termination Date, and the denominator of which is 12 (the “ Bonus Payment ”). The Bonus Payment shall be paid to you at the same time as all other bonus payments are made to participants in the Company’s Performance Bonus Plan for the fiscal year in which your Termination Date occurs, but in any event, no later than March 15 th of the year following the relevant fiscal year.
8

13. Cash Equivalent of Equity Award Vesting . Except as provided below, you will be paid, in a
single lump sum cash payment on the 60th day immediately following your Termination Date, an amount equal to the cash equivalent of the number of months of service vesting credit (as if you had remained employed by the Company for such period), as set forth in the table below based on your title with the Company immediately prior to your Termination Date, with respect to each outstanding stock option, restricted stock unit and other equity award held by you as of your Termination Date, as determined based on the excess, if any, of the “fair market value” (as defined under the terms of Broadcom’s 1998 Stock Incentive Plan, as amended from time to time) on the Termination Date over the exercise price with respect to the aggregate shares underlying any such outstanding stock option, and the fair market value on the Termination Date of the aggregate shares underlying any restricted stock unit or other equity award that is so deemed to be vested. Notwithstanding the foregoing or any provision of the Plan to the contrary, (i) restricted stock units granted under any Broadcom Special Retention Program, as determined in the sole discretion of the Administrator (including, without limitation, restricted stock units that vest in full on the date that is either three years from the award date or three years from the vesting commencement date), shall be disregarded for purpose of this Section IV.A.3 and shall be governed exclusively by the terms and conditions of the applicable award agreement, and (ii) this Section IV.A.3 shall not apply to any award that constitutes “nonqualified deferred compensation” within the meaning of Code Section 409A if the application of this provision to such award would constitute an impermissible acceleration of the payment of such award or would otherwise result in the imposition of tax under Section 409A of the Code (in which case any such award shall be governed solely by the applicable grant documents).
14. Health Benefit Payment . If you are enrolled in a health plan offered by the Company immediately prior to your Termination Date, you will be paid, in a single lump-sum cash payment on the 60th day immediately following your Termination Date, an amount equal to the cost to obtain COBRA continuation coverage for yourself and, to the extent enrolled immediately prior to your Termination Date, your spouse and eligible dependents, in each case, under the Company’s applicable employee group health plan for the number of months set forth in the table below based on your title with the Company immediately prior to your Termination Date. It shall be solely your responsibility to actually obtain COBRA continuation coverage for you and your dependents, should you so elect, and to take all necessary steps associated with obtaining such coverage (subject to the Company’s obligations under law), notwithstanding the Company’s payment obligations under this Section IV.A.4.
15. Outplacement . You will be provided with outplacement services through a vendor selected by the Company for a period up to the number of months set forth in the table below based on your title with the Company immediately prior to your Termination Date. Such services must be initiated within forty-five (45) days of your Termination Date and shall include only those services authorized by the Company.
9

B. Release Requirement
Notwithstanding any provision of the Plan to the contrary, it shall be a condition to your right to receive the amounts provided for in Section IV.A above that you have signed the General Release of All Claims (the “ Required Release ”) and delivered it to the Company in accordance with following requirements:
1. If you are under age forty (40), then (i) your executed Required Release must be in the form that will be provided to you by the Company, (ii) you must sign that document and deliver it to the Company within ten (10) business days after the date of your Termination Date and (iii) the Required Release must become effective after the expiration of any applicable revocation period.
2. If you are age forty (40) or older, then (i) your executed Required Release must be in the form that will be provided to you by the Company , (ii) you must sign that document and deliver it to the Company within twenty-one (21) days after your Termination Date (or, when applicable, forty-five (45) days after the later of your Termination Date or the date you receive all required disclosures) and (iii) the Required Release must become effective after the expiration of any applicable revocation period.
C. Termination of Benefits
Notwithstanding any provision of the Plan to the contrary, you will not be entitled to the Bonus Payment portion of the severance described in Section IV.A.2 above in the event that you breach any material agreement between you and the Company prior to the date on which such Bonus Payment is paid, including, without limitation, under any severance agreement or the Company’s Confidentiality and Invention Assignment Agreement.
D. Six-Month Delay
10
Position/Title Base Salary Severance
Bonus Payment Cash Equivalent of Equity Award Vesting
Health Benefit Payment
Outplacement Services
Vice President 6 months 6 months 6 months 6 months 6 months
Senior Vice President
9 months 9 months 9 months 9 months 6 months
Executive Vice President
12 months 12 months 12 months 12 months 6 months

Notwithstanding anything to the contrary in the Plan, no compensation or benefits, including without limitation
any severance payments or benefits payable under Section IV.A, shall be paid to you during the 6-month period following your Separation from Service if the Company determines that paying such amounts at the time or times indicated in the Plan would be a prohibited distribution under Section 409A(a)(2)(B)(i) of the Code. If the payment of any such amounts is delayed as a result of the previous sentence, then on the first business day following the end of such 6-month period (or such earlier date upon which such amount can be paid under Section 409A of the Code without resulting in a prohibited distribution, including as a result of your death), the Company shall pay you a lump-sum amount equal to the cumulative amount that would have otherwise been payable to you during such period.
E. Taxes and Other Withholdings
The lump sum payment of the severance payments and benefits determined in accordance with Section IV.A above will be subject to legally required tax withholdings and all other applicable payroll deductions. Such withholdings and deductions will not include 401(k) Plan contributions or other elective benefit and benefit plan contributions as participation in such benefits and plans terminates upon termination of employment.
F. Administrator Discretion
The Plan Administrator may, as it deems appropriate and in its sole discretion, authorize severance benefits in an amount different from that set forth in Section IV.B. Under certain circumstances, the Plan Administrator may, in its sole discretion, waive or modify, with respect to one or more employees or classes of employees, the eligibility requirements for severance benefits or modify the amount of severance benefits. In such circumstances, such waiver or modification shall be treated as an amendment to the Plan with respect to such employee(s) or classes of employees and shall continue to be governed by the terms of the Plan. In no event, however, shall any severance benefit payments be structured in a manner, or shall the Plan Administrator take any other action, that would contravene the applicable requirements, restrictions and limitations of Section 409A of the Code and the Treasury Regulations thereunder or otherwise result in a prohibited acceleration, or impermissible deferral, of benefit payments under Section 409A of the Code and the Treasury Regulations thereunder.
G. Miscellaneous
Regardless of whether you meet the eligibility criteria of Section II and are eligible for benefits under the Plan, you will be subject to the following rights and obligations in connection with your Termination:
1. In your final paycheck, you will receive a lump sum payment equal to the aggregate amount of your earned but unpaid Base Salary.
2. As of the effective date of your Termination, you will cease participation in all employee benefits and benefit plans that the Company makes available to its employees, in accordance with the terms and conditions of such benefits and benefit plans.
11
3. In accordance with COBRA, you and/or your eligible dependents may elect temporary continuation
coverage under the Company's group health benefit plans (medical, dental and/or vision), provided that you timely elect such coverage and you timely pay the full amount of premiums due. In connection with your termination, you and your eligible dependents will be provided with COBRA election forms and a notice that describes your rights to, and the terms and conditions of, temporary continuation coverage under COBRA. These documents will be provided separately.
4. During the limited post-service exercise period and pursuant to the terms specified in your stock option agreement(s), you may exercise any outstanding stock options that vested on or prior to the effective date of your termination provided that any and all trades made post-employment comply with Broadcom’s insider trading policy. If you are subject to Broadcom’s trading windows and your Termination Date falls within a closed window period, you will remain subject to Broadcom’s trading window policy and subject to applicable restrictions on stock sales until the next trading window opens. This means that if your Termination Date falls within a closed window, you may not engage in any open market transactions until the trading window opens, unless you have a trading plan in place that complies with Rule 10b5-1 under the Securities Exchange Act of 1934. If your Termination Date falls within an open window, you are generally not subject to further trading window restrictions, unless advised to the contrary. As always, you may never trade when in possession of “inside information” (as defined in Broadcom’s insider trading policy), regardless of whether you are subject to a trading window.
5. You will receive information describing unemployment insurance benefits separately.
V. OTHER IMPORTANT INFORMATION
A. Plan Administration . As the Plan Administrator, the Committee or individual(s) appointed by the Committee has full discretionary authority to administer and interpret the Plan, including discretionary authority to determine eligibility for participation and for benefits under the Plan, the amount of benefits (if any) payable per participant, and to interpret terms of the Plan. The Plan Administrator may delegate any or all of its administrative duties to Company personnel. Any such delegation will carry with it the full discretionary authority of the Plan Administrator to carry out the delegated duties. Any determination by the Plan Administrator or its delegate will be final and conclusive upon all persons. Broadcom will indemnify and hold harmless any person serving in the capacity of Plan Administrator (or a delegate thereof); provided, however, such person does not act with gross negligence or willful misconduct with respect to such duties.
12

B. Benefits . All benefits will be paid from the general assets of the Company. The Company will not establish
a trust to fund the Plan. The benefits provided under this Plan are not assignable or transferable, in whole or in part, either directly or by operation of law or otherwise, and may be conditioned upon your compliance with any confidentiality agreement you have entered into with the Company or upon your compliance with any Company policy or program. The payment of benefits under this Plan does not increase the benefits due to you under any other benefit plan or Company policy.
C. Code Section 409A. To the extent applicable, the Plan shall be interpreted and applied consistent and in accordance with Section 409A of the Code and Department of Treasury regulations and other interpretive guidance issued thereunder. Notwithstanding any provision of the Plan to the contrary, if the Company determines that any compensation or benefits payable under the Plan may not be either exempt from or compliant with Section 409A of the Code and related Department of Treasury guidance, the Company may in its sole discretion adopt such amendments to the Plan or adopt other policies and procedures (including amendments, policies and procedures with retroactive effect), or take any other actions, that the Company determines are necessary or appropriate to (i) exempt the compensation and benefits payable under the Plan from Section 409A of the Code, (ii) comply with the requirements of Section 409A of the Code and related Department of Treasury guidance, and/or (iii) otherwise avoid the imposition of tax under Section 409A of the Code; provided , however , that this Section V.C does not create an obligation on the part of the Company to adopt any such amendment, policy or procedure, to take any other action or to indemnify any person for any failure to do any of the foregoing.
D. Claims Procedure.
1. Application for Benefits . If you believe you are incorrectly denied a benefit or are entitled to a greater benefit than the benefit you receive under the Plan, you may submit a signed, written application to the Plan Administrator within ninety (90) days the effective date of your Termination.
2. Denial of Application for Benefits . In the event that your application for benefits is denied in whole or in part, the Plan Administrator must notify you, in writing, of the denial of the application, and of your right to review the denial. The written notice of denial will be set forth in a manner designed to be understood by you, and will include specific reasons for the denial, specific references to the Plan provision upon which the denial is based, a description of any information or material that the Plan Administrator needs to complete the review and an explanation of the Plan's review procedure.
13

This written notice will be given to you within ninety (90) days after the Plan Administrator receives the application, unless special circumstances require an extension of time, in which case, the Plan Administrator has up to an additional ninety (90) days for processing the application. If an extension of time for processing is required, written notice of the extension will be furnished to you before the end of the initial ninety (90) day period. This notice of extension will describe the special circumstances necessitating the additional time and the date by which the Plan Administrator is to render its decision on the application. If written notice of denial of the application for benefits is not furnished within the specified time, the application shall be deemed to be denied. You will then be permitted to appeal the denial in accordance with the review procedure described below.
3. Request for Review . If your application for benefits is denied (or deemed denied), in whole or in part, you (or your authorized representative) may appeal the denial by submitting a request for a review to the Plan Administrator within sixty (60) days after the application is denied (or deemed denied). The Plan Administrator will give you (or your representative) an opportunity to review pertinent documents in preparing a request for a review. A request for a review shall be in writing. A request for review must set forth all of the grounds on which it is based, all facts in support of the request and any other matters that you feel are pertinent. The Plan Administrator may require you to submit additional facts, documents or other material as it may find necessary or appropriate in making its review.
4. Decision on Review . The Plan Administrator will act on each request for review within sixty (60) days after receipt of the request, unless special circumstances require an extension of time (not to exceed an additional 60 days) for processing the request for a review. If an extension for review is required, written notice of the extension will be furnished to you within the initial sixty (60) day period. The Plan Administrator will give prompt, written notice of its decision to you. In the event that the Plan Administrator confirms the denial of the application for benefits in whole or in part, the notice will outline, in a manner calculated to be understood by you, the specific reasons for the decision and the Plan provisions upon which the decision is based. If written notice of the Plan Administrator's decision is not given to you within the time prescribed in this subsection (4), the application will be deemed denied on review.
5. Exhaustion of Remedies . No legal action for benefits under the Plan may be brought until: (i) you have submitted a written application for benefits in accordance with the procedures described by Section V.D.1., above; (ii) you have been notified by the Plan Administrator that the application is denied (or the application is deemed denied due to the Plan Administrator's failure to act on it within the established time period); (iii) you have filed a written request for a review of the application in accordance with the appeal procedure described in Section V.D.3., above; and (iv) you have been notified in writing that the Plan Administrator has denied the appeal (or the appeal is deemed to be denied due to the Plan Administrator's failure to take any action on the claim within the time prescribed by Section V.D.4., above).
14
E. Plan Terms . This Plan supersedes any and all prior separation, severance and salary continuation
arrangements, programs and plans which were previously offered by the Company to eligible employees of this Plan, except such terms as are set forth in a written agreement signed by an authorized officer of the Company or any subsidiary of the Company.
F. Plan Amendment or Termination . Broadcom reserves the right to change, suspend or discontinue all or any part of this Plan at any time and shall do so in writing signed by the Chief Executive Officer of Broadcom. This Plan terminates by its own terms when all benefits hereunder have been paid.
G. Taxes and Other Payroll Deductions . The Company will withhold taxes and all other applicable payroll deductions from any severance payments or benefits under this Plan. The Company may also offset from any severance payments or benefits any amounts owed to the Company, except to the extent such offset would contravene any applicable restrictions or limitations under Section 409A of the Code or other applicable law.
H. No Right to Employment . No provision of this Plan is intended to provide you or any other employee with any right to continue employment or other service role with Company or otherwise to affect the right of the Company which right is expressly reserved, to terminate the employment of any individual at any time for any reason, without cause.
I. Governing Law. This Plan is intended to be interpreted, administered, and enforced in accordance with ERISA. It is expressly intended that ERISA preempt the application of state laws to this Plan, to the maximum extent permitted by Section 514 of ERISA. To the extent that state law is applicable, the statutes and common laws of the State of California (excluding its choice of law principles) shall apply.
J. Successors.
1. The Plan is personal to you and shall not be assignable by you otherwise than by will or the laws of descent and distribution. The Plan shall inure to the benefit of and be enforceable by your legal representatives.
2. The Program shall inure to the benefit of and be binding upon Broadcom and its successors and assigns.
VI. STATEMENT OF ERISA RIGHTS
As a participant, you are entitled to certain rights and protections under the Employment Retirement Income Security Act of 1974, as amended (“ ERISA ”). ERISA provides that all Plan participants shall be entitled to:
1. Examine, without charge, at the Plan Administrator's office, all Plan documents, including all documents filed by the Plan with the U.S. Department of Labor, such as plan descriptions.
15

2. Obtain copies of all Plan documents and other Plan information upon written request to the Plan
Administrator. The Plan Administrator may make a reasonable charge for the copies.
In addition to creating rights for certain employees of the Company under the Plan, ERISA imposes obligations upon the people who are responsible for the operation of the Plan. The people who operate the Plan (called “fiduciaries”) have a duty to do so prudently and in the interest of the Company's employees who are covered by the Plan.
No one, including your employer or any other person, may terminate your employment or otherwise discriminate against you in any way to prevent you from obtaining a benefit to which you are entitled under the Plan or from exercising your rights under ERISA.
If your claim for a benefit under this Plan is denied in whole or in part, you must receive a written explanation of the reason for the denial. You have the right to have the Plan Administrator review and reconsider your claim. Under ERISA, there are steps you can take to enforce the above rights. For instance, if you request materials from the Plan and do not receive them within thirty (30) days, you may file suit in a federal court. In such a case, the court may require the Plan Administrator to provide the materials and pay you up to $110 a day until you receive the materials, unless the materials were not sent because of reasons beyond the control of the Plan Administrator. If you have a claim for a benefit under this Plan that is denied or ignored, in whole or in part, you may file suit in a federal or a state court. If it should happen that the Plan fiduciaries misuse the Plan's assets (if any) or if you are discriminated against for asserting your rights, you may seek assistance from the U.S. Department of Labor or you may file suit in a federal court. The court will decide who should pay court costs and legal fees. If you are successful in your lawsuit, the court may order the party you have sued to pay your legal costs, including attorney fees. However, if you lose, the court may order you to pay these costs and fees, for example, if it finds that your claim or suit is frivolous.
If you have any questions about the Plan, this statement or your rights under ERISA, you should contact the Plan Administrator or the nearest Area Office of the Pension and Welfare Benefits Administration, U.S. Department of Labor, listed in your local telephone directory or contact the Division of Technical Assistance and. Inquiries, Pension and Welfare Benefits Administration, U.S. Department of Labor, 200 Constitution Avenue N.W., Washington, D.C. 20210.
16

ADDITIONAL PLAN INFORMATION
IN WITNESS WHEREOF, BROADCOM CORPORATION. HAS CAUSE D THIS SEVERANCE BENEFIT PLAN TO BE EXECUTED ON ITS BEHALF BY ITS DULY AUTHO RIZED OFFICER ON THE DATE AND YEAR INDICATED BELOW
BROADCOM CORPORATION
By: /s/Scott McGregor
Scott McGregor Chief Executive Officer
Dated: December 16, 2011
17
Plan Sponsor: Broadcom Corporation
Plan Name: Broadcom Corporation Severance Benefit Plan For Vice Presidents and Above
Employer Identification Number 33-0480482
Plan Effective Date: June 1, 2010, as Amended December 16, 2011
Plan Administrator: Executive Vice President Human Resources Severally With Chief Executive Officer
Direct Inquiries to: Plan Administrator c/o General Counsel
Agent for Service of Legal Process: National Registered Agents, Inc. 2875 Michelle Drive, Ste. 100 Irvine, CA 92606
Type of Plan: Severance Plan / Employee Welfare Benefit Plan
Plan Costs: The cost of the plan is paid by Broadcom Corporation.
EXHIBIT 10.37 SEVENTH AMENDMENT TO LEASE
(5201 California) I. PARTIES AND DATE.
This Seventh Amendment to Lease (the “ Amendment ”) dated and effective as of June 28, 2012, is by and between THE IRVINE COMPANY LLC, a Delaware limited liability company (“ Landlord ”), and BROADCOM CORPORATION, a California corporation (“ Tenant ”). II. RECITALS.
On October 31, 2007, Landlord and Tenant entered into a lease (the “ Original Lease ”) for all of the rentable space (approximately 63,440 rentable square feet) in the building located at 5211 California, Irvine, California (the “5211 California Premises ” and the “ 5211 California Building ”, respectively), which lease was amended by a First Amendment to Lease dated November 12, 2008 (the “ First Amendment ”) wherein Landlord leased to Tenant all of the rentable space (approximately 53,840 rentable square feet) in the building located at 5241 California Avenue (the “5241 California Premises ” and the “ 5241 California Building ”, respectively) as part of the Premises subject to the Lease, by a Second Amendment to Lease dated July 21, 2010 (the “ Second Amendment ”) wherein Landlord leased to Tenant approximately 14,336 rentable square feet of space commonly known as Suite 140, Suite 160, Suite 210, and Suite 250 in a building located at 5251 California Avenue (the “ 5251 California Building ”) as part of the Premises subject to the Lease, by a Third Amendment to Lease dated September 14, 2010 (the “ Third Amendment ”) wherein Landlord leased to Tenant all of the rentable space (approximately 53,840 rentable square feet) in the building located at 5231 California Avenue (the “ 5231 California Premises ” and the “ 5231 California Building ”, respectively) as part of the Premises subject to the Lease, by a Fourth Amendment to Lease dated November 15, 2010 (the “ Fourth Amendment ”) wherein Landlord leased to Tenant approximately 2,021 rentable square feet of space commonly known as Suite 150 in the 5251 California Building, by a Fifth Amendment to Lease dated April 26, 2011 (the “ Fifth Amendment ”) wherein Landlord leased to Tenant approximately 3,404 rentable square feet of space commonly known as Suite 230 in the 5251 California Building, and by a Sixth Amendment to Lease dated August 2, 2011 (the “ Sixth Amendment ”) wherein Landlord leased to Tenant approximately 2,021 rentable square feet of space commonly known as Suite 130 in the 5251 California Building. The portion of the Premises leased by Tenant in the 5251 California Building pursuant to the Second Amendment, the Fourth Amendment, the Fifth Amendment, the Sixth Amendment is collectively referred to herein as the “ 5251 California Premises ”; and the Original Lease, as so amended, is referred to herein as the “ Lease ”.
Landlord and Tenant each desire to further modify the Lease to add approximately 44,240 rentable square feet of space consisting of all the rentable square footage of the building located at 5201 California, Irvine, California (the “5201 California Premises ” and the “ 5201 California Building ”, respectively), which 5201 California Premises is more particularly described on Exhibit A attached to this Amendment, to adjust the Basic Rent and to make such other modifications as are set forth in “III. MODIFICATIONS” next below. III. MODIFICATIONS.
A. Premises . From and after the “Commencement Date for the 5201 California Premises” (as hereinafter
defined), the “Premises” under the Lease shall collectively consist of the 5201 California Premises
1
together with the 5251 California Premises, the 5231 California Premises, the 5211 California Premises and the 5241 California Premises.
B. Building . From and after the Commencement Date for the 5201 California Premises, all references to the
“Building” shall include the 5201 California Building, and shall continue to refer to (a) the 5211 California Building, the 5231 California Building and the 5241 California Building, and (b) the 5251 California Building during any portion of the Term of the Lease as to the 5251 California Premises.
C. Basic Lease Provisions . The Basic Lease Provisions are hereby amended as follows:
“ Commencement Date for the 5201 California Premises ” shall mean the earlier to occur of (a) “Substantial Completion” of the “Tenant Improvements” in the 5201 California Premises (as those terms are defined in the Work Letter attached to this Amendment as Exhibit X ), but not sooner than April 1, 2013, or (b) the commencement of Tenant’s regular business operations in the 5201 California Premises. Within thirty (30) days following the Commencement Date for the 5201 California Premises, the parties shall document such date by a written memorandum on a form provided by Landlord (the “ 5201 California Commencement Date Notice ”). Tenant’s failure to execute such Notice within ten (10) days following its receipt thereof from Landlord shall not affect the validity of Landlord’s correct determination of the Commencement Date set forth in the applicable Notice. The acknowledgments by Tenant contained in the second, third and fourth sentences of Section 2.2 of the Lease shall be applicable and binding with respect to Tenant’s lease of the 5201 California Premises. As of the Commencement Date for the 5201 California Premises, Tenant shall be conclusively deemed to have accepted that the 5201 California Premises are in satisfactory condition and in conformity with the provisions of the Lease and the Work Letter, but for the Landlord’s minor punch-list work required to complete the “Tenant Improvement Work” in the 5201 California Premises (as provided in Exhibit X attached to this Amendment).”
2. Item 5 of the Lease is hereby amended by adding the following:
“ Lease Term as to the 5201 California Premises : The Term of the Lease as to the 5201 California Premises shall expire at midnight on April 30, 2017.
3. Effective as of the Commencement Date for the 5201 California Premises, Item 6 of the Lease is hereby amended by adding the following as additional paragraphs of the rent schedule:
Basic Rent for the 5201 California Premises : Commencing on the Commencement Date for the 5201 California Premises, the Basic Rent for the 5201 California Premises shall be Fifty Seven Thousand Five Hundred Twelve Dollars ($57,512.00) per month, based on $1.30 per rentable square foot. Commencing twelve (12) months following the Commencement Date for the 5201 California Premises, the Basic Rent for the 5201 California Premises shall be Sixty
2
1. Item 4 is hereby amended by adding the following:
Thousand Six Hundred Nine Dollars ($60,609.00) per month, based on $1.37 per rentable square foot. Commencing twenty-four (24) months following the Commencement Date for the 5201 California Premises, the Basic Rent for the 5201 California Premises shall be Sixty Three Thousand Two Hundred Sixty-Three Dollars ($63,263.00) per month, based on $1.43 per rentable square foot. Commencing thirty-six (36) months following the Commencement Date for the 5201 California Premises, the Basic Rent for the 5201 California Premises shall be Sixty Six Thousand Three Hundred Sixty Dollars ($66,360.00) per month, based on $1.50 per rentable square foot.”
4. Effective as of the Commencement Date for 5201 California Premises, Item 8 of the Lease shall be deleted in its entirety and substituted therefor shall be the following:
“8. Floor Area of Premises: Approximately 237,142 rentable square feet, comprised of the following: 5201 California Premises – approximately 44,240 rentable square feet; 5211 California Premises – approximately 63,440 rentable square feet; 5231 California Premises – approximately 53,840 rentable square feet; 5241 California Premises – approximately 53,840 rentable square feet; and 5251 California Premises, Suite 130, Suite 140, Suite 150, Suite 160, Suite 210, Suite 230, and Suite 250 – approximately 21,782 rentable square feet.”
5. Effective as of the Commencement Date for 5201 California Premises, Item 15 shall be deleted in its entirety and substituted therefor shall be the following:
“15. Vehicle Parking Spaces: Eight Hundred Six (806); provided that for the duration of the 5251 California Lease Term, Tenant shall be entitled to an additional seventy-two (72) vehicle parking spaces.”
D. Right to Extend . The parties confirm and agree that Tenant’s right to extend the Lease set forth in Section 3.4
of the Lease shall apply to the 5201 California Premises. E. Delay in Delivery . The parties hereby acknowledge that there is an existing tenant in occupancy of the 5201
California Premises. Landlord will use commercially reasonable efforts to cause the tenant in possession to vacate the 5201 California Premises on or before November 1, 2012, but in the event the existing tenant in possession does not vacate the 5201 California Premises on or before February 1, 2013 (the “ Outside Date ”), then Tenant, as its sole recourse, shall have the right to terminate its obligation to lease the 5201 California Premises by written notice given to Landlord at any time following the Outside Date but prior to the actual vacation of the 5201 California Premises by the tenant in possession. Upon any such termination by Tenant, neither party shall have any further obligation to the other under this Amendment, and Landlord shall reimburse Tenant for its reasonable out-of-pocket costs in connection with the preparation of the “Preliminary Plan” and the “Working Drawings and Specifications” (as defined in the attached Work Letter) incurred as of the date of such termination within 30 days following invoicing by Tenant.
3

F. Condition of 5201 California Premises . The warranty on the part of Landlord contained in Section 2.4 of the Lease shall be applicable and binding on Landlord as to 5201 California Premises as of the Commencement Date for 5201 California Premises.
G. Signs . Effective as of the Commencement Date for the 5201 California Premises, and for so long as Tenant leases the entire 5201 California Building, Section 5.2 of the Lease is hereby amended to provide Tenant with the exclusive right to one (1) exterior “eyebrow” sign and one (1) exterior “building top” sign on the 5201 California Building.
H. Utilities and Services . The parties confirm and agree that Tenant shall pay charges for “after hours” usage of
HVAC units servicing the 5201 California Premises in accordance with the applicable provisions of the initial paragraph of Section 6.1 of the Lease.
I. Communications Equipment . Effective as of the Commencement Date for the 5201 California Premises,
Section 7.6 of the Lease, entitled “Communications Equipment” shall be amended to provide Tenant a license (at no additional cost to Tenant) to install, maintain and operate one or more antennae (including but not limited to satellite dishes, line of sight transmitters and receivers, and the like) on the 5201 California Building pursuant to the provisions of said Section 7.6.
J. Broker’s Commission . Article XVIII of the Lease is amended to provide that the parties recognize Irvine
Realty Company (“ Landlord’s Broker ”) as the broker representing Landlord in connection with the negotiation of this Amendment, and that no broker has represented Tenant in connection with the negotiation of this Amendment. Landlord shall be responsible for the payment of a brokerage commission to Landlord’s Broker. The warranty and indemnity provisions of Article XVIII of the Lease, as amended hereby, shall be binding and enforceable in connection with the negotiation of this Amendment.
K. Tenant Improvements for the 5201 California Premises . Landlord hereby agrees to complete the “Tenant Improvements” for the 5201 California Premises in accordance with the provisions of Exhibit X , Work Letter, attached hereto.
IV. GENERAL.
A. Effect of Amendments . The Lease shall remain in full force and effect except to the extent that it is modified by this Amendment.
B. Entire Agreement . This Amendment embodies the entire understanding between Landlord and Tenant with respect to the modifications set forth in “III. MODIFICATIONS” above and can be changed only by a writing signed by Landlord and Tenant.
C. Counterparts . If this Amendment is executed in counterparts, each is hereby declared to be an original; all, however, shall constitute but one and the same amendment. In any action or proceeding, any photographic, photostatic, or other copy of this Amendment may be introduced into evidence without foundation.
D. Defined Terms . All words commencing with initial capital letters in this Amendment and defined in the Lease shall have the same meaning in this Amendment as in the Lease, unless they are otherwise defined in this Amendment.
4

E. Corporate and Partnership Authority . If Tenant is a corporation or partnership, or is comprised of either or both of them, Tenant represents that each individual executing this Amendment for the corporation or partnership is duly authorized to execute and deliver this Amendment on behalf of the corporation or partnership and that this Amendment is binding upon the corporation or partnership in accordance with its terms. V. EXECUTION.
Landlord and Tenant executed this Amendment on the date as set forth in “I. PARTIES AND DATE.” above. LANDLORD: TENANT: THE IRVINE COMPANY LLC BROADCOM CORPORATION, a Delaware limited liability company a California corporation By: /s/ Steven M. Case By: /s/ Ryan Lorey Steven M. Case Name: Ryan Lorey Executive Vice President Title: Senior Director, Global Real Estate Office Properties By : /s/ Michael T. Bennett By: /s/ Eric Brandt Michael T. Bennett, Senior Vice President Name: Eric Brandt Operations, Office Properties Title: Executive Vice President and CFO Broadcom Corporation agrees to furnish supplementally a copy of any of the foregoing exhibits to the SEC upon request.
5

EXHIBIT 21.1
SUBSIDIARIES OF THE COMPANY
Name of Entity State or Other Jurisdiction of Incorporation or Organization
Broadcom International Limited Cayman Islands
Broadcom Singapore Pte Ltd. Singapore
Broadcom Cayman Limited Cayman Islands
Broadcom Bermuda LP Bermuda
Broadcom Asia Distribution Pte Ltd. Singapore
NetLogic I LLC (formerly known as NetLogic Microsystems, Inc.) Delaware
NetLogic Microsystems Caymans Ltd. Cayman Islands
ServerWorks Corporation Delaware
ServerWorks International Ltd. Cayman Islands

EXHIBIT 23.1
Consent of Independent Registered Public Accounting Firm
The Board of Directors Broadcom Corporation: We consent to the incorporation by reference in the registration statements (Nos. 333-93457, 333-114405, 333-116877, 333-117866, 333-127775, 333-132533, 333-142526, 333-148971, 333-157089, 333-164685, 333-172017, 333- 179273, and 333-179871) on Form S-8, and (No. 333-112997) on Form S-4 of Broadcom Corporation of our reports dated January 30, 2013 , with respect to the consolidated balance sheets of Broadcom Corporation and subsidiaries as of December 31, 2012 and 2011 , and the related consolidated statements of income, comprehensive income, shareholders' equity, and cash flows for each of the years in the three-year period ended December 31, 2012 , and the related consolidated financial statement schedule, and the effectiveness of internal control over financial reporting as of December 31, 2012 , which reports appear in the December 31, 2012 annual report on Form 10-K of Broadcom Corporation. Our report on the consolidated financial statements refers to a change in the presentation of other comprehensive income in 2012 and change in accounting for testing goodwill for impairment in 2011. /s/ KPMG LLP
Irvine, California January 30, 2013

EXHIBIT 31.1
CERTIFICATION OF CHIEF EXECUTIVE OFFICER PURSUANT TO SECTION 302 OF THE SARBANES-OXLEY ACT OF 2002
I, Scott A. McGregor, certify that:
1. I have reviewed this Annual Report on Form 10-K of Broadcom Corporation;
2. Based on my knowledge, this report does not contain any untrue statement of a material fact or omit to state a material fact necessary to make the statements made, in light of the circumstances under which such statements were made, not misleading with respect to the period covered by this report;
3. Based on my knowledge, the financial statements, and other financial information included in this report, fairly present in all material respects the financial condition, results of operations and cash flows of the registrant as of, and for, the periods presented in this report;
4. The registrant’s other certifying officer and I are responsible for establishing and maintaining disclosure controls and procedures (as defined in Exchange Act Rules 13a-15(e) and 15d-15(e)) and internal control over financial reporting (as defined in Exchange Act Rules 13a-15(f) and 15d-15(f)) for the registrant and have:
(a) Designed such disclosure controls and procedures, or caused such disclosure controls and procedures to be designed under our supervision, to ensure that material information relating to the registrant, including its consolidated subsidiaries, is made known to us by others within those entities, particularly during the period in which this report is being prepared;
(b) Designed such internal control over financial reporting, or caused such internal control over financial reporting to be designed under our supervision, to provide reasonable assurance regarding the reliability of financial reporting and the preparation of financial statements for external purposes in accordance with generally accepted accounting principles;
(c) Evaluated the effectiveness of the registrant’s disclosure controls and procedures and presented in this report our conclusions about the effectiveness of the disclosure controls and procedures, as of the end of the period covered by this report based on such evaluation; and
(d) Disclosed in this report any change in the registrant’s internal control over financial reporting that occurred during the registrant’s most recent fiscal quarter that has materially affected, or is reasonably likely to materially affect, the registrant’s internal control over financial reporting; and
5. The registrant’s other certifying officer and I have disclosed, based on our most recent evaluation of internal control over financial reporting, to the registrant’s auditors and the audit committee of the registrant’s board of directors (or persons performing the equivalent functions):
(a) All significant deficiencies and material weaknesses in the design or operation of internal control over financial reporting which are reasonably likely to adversely affect the registrant’s ability to record, process, summarize and report financial information; and
(b) Any fraud, whether or not material, that involves management or other employees who have a significant role in the registrant’s internal control over financial reporting.
Date: January 30, 2013
/s/ S COTT A. M C G REGOR
Scott A. McGregor
President and Chief Executive Officer
(Principal Executive Officer)
EXHIBIT 31.2
CERTIFICATION OF CHIEF FINANCIAL OFFICER PURSUANT TO SECTION 302 OF THE SARBANES-OXLEY ACT OF 2002
I, Eric K. Brandt, certify that:
1. I have reviewed this Annual Report on Form 10-K of Broadcom Corporation;
2. Based on my knowledge, this report does not contain any untrue statement of a material fact or omit to state a material fact necessary to make the statements made, in light of the circumstances under which such statements were made, not misleading with respect to the period covered by this report;
3. Based on my knowledge, the financial statements, and other financial information included in this report, fairly present in all material respects the financial condition, results of operations and cash flows of the registrant as of, and for, the periods presented in this report;
4. The registrant’s other certifying officer and I are responsible for establishing and maintaining disclosure controls and procedures (as defined in Exchange Act Rules 13a-15(e) and 15d-15(e)) and internal control over financial reporting (as defined in Exchange Act Rules 13a-15(f) and 15d-15(f)) for the registrant and have:
(a) Designed such disclosure controls and procedures, or caused such disclosure controls and procedures to be designed under our supervision, to ensure that material information relating to the registrant, including its consolidated subsidiaries, is made known to us by others within those entities, particularly during the period in which this report is being prepared;
(b) Designed such internal control over financial reporting, or caused such internal control over financial reporting to be designed under our supervision, to provide reasonable assurance regarding the reliability of financial reporting and the preparation of financial statements for external purposes in accordance with generally accepted accounting principles;
(c) Evaluated the effectiveness of the registrant’s disclosure controls and procedures and presented in this report our conclusions about the effectiveness of the disclosure controls and procedures, as of the end of the period covered by this report based on such evaluation; and
(d) Disclosed in this report any change in the registrant’s internal control over financial reporting that occurred during the registrant’s most recent fiscal quarter that has materially affected, or is reasonably likely to materially affect, the registrant’s internal control over financial reporting; and
5. The registrant’s other certifying officer and I have disclosed, based on our most recent evaluation of internal control over financial reporting, to the registrant’s auditors and the audit committee of the registrant’s board of directors (or persons performing the equivalent functions):
(a) All significant deficiencies and material weaknesses in the design or operation of internal control over financial reporting which are reasonably likely to adversely affect the registrant’s ability to record, process, summarize and report financial information; and
(b) Any fraud, whether or not material, that involves management or other employees who have a significant role in the registrant’s internal control over financial reporting.
Date: January 30, 2013
/s/ E RIC K. B RANDT
Eric K. Brandt
Executive Vice President and
Chief Financial Officer
(Principal Financial Officer)
EXHIBIT 32
The following certifications are being furnished solely to accompany the Report pursuant to 18 U.S.C. § 1350, and pursuant to SEC Release No. 33-8238 are being “furnished” to the SEC rather than “filed” either as part of the Report or as a separate disclosure statement, and are not to be incorporated by reference into the Report or any other filing of the Company, whether made before or after the date hereof, regardless of any general incorporation language in such filing. The foregoing certifications shall not be deemed “filed” for purposes of Section 18 of the Securities Exchange Act of 1934, as amended, or otherwise subject to the liabilities of Section 18 or Sections 11 and 12(a)(2) of the Securities Act of 1933, as amended.
Certification of Chief Executive Officer
Pursuant to 18 U.S.C. § 1350, as created by Section 906 of the Sarbanes-Oxley Act of 2002, the undersigned officer of Broadcom Corporation (the “Company”) hereby certifies, to such officer’s knowledge, that:
(i) the accompanying Annual Report on Form 10-K of the Company for the annual period ended December 31, 2012 (the “Report”) fully complies with the requirements of Section 13(a) of the Securities Exchange Act of 1934, as amended; and
(ii) the information contained in the Report fairly presents, in all material respects, the financial condition and results of operations of the Company.
Date: January 30, 2013
Certification of Chief Financial Officer
Pursuant to 18 U.S.C. § 1350, as created by Section 906 of the Sarbanes-Oxley Act of 2002, the undersigned officer of Broadcom Corporation (the “Company”) hereby certifies, to such officer’s knowledge, that:
(i) the accompanying Annual Report on Form 10-K of the Company for the annual period ended December 31, 2012 (the “Report”) fully complies with the requirements of Section 13(a) of the Securities Exchange Act of 1934, as amended; and
(ii) the information contained in the Report fairly presents, in all material respects, the financial condition and results of operations of the Company.
Date: January 30, 2013
/ S / S COTT A. M C G REGOR
Scott A. McGregor
Chief Executive Officer
/ S / E RIC K. B RANDT
Eric K. Brandt
Chief Financial Officer