Embed Size (px)
Citation preview

ICIC
I S
ecurit
ies –
Retail E
quit
y R
esearch
MO
ME
NT
UM
PIC
K
• The IT index continues to move within the leading
quadrant highlighting the continuance of relative
outperformance of IT stocks. The decline within the
quadrant suggests profit booking in IT stocks. However,
the bias in IT stocks remains positive
• BSE consumer goods has seen a pick-up in relative
momentum and moved into the leading quadrant from
the improving quadrant implying that consumer stocks
have started a fresh up move after recent consolidation
• BSE Bankex and BSE Auto have moved higher within
the lagging quadrant indicating a pick-up in relative
momentum and are likely to see stock specific action in
the above sector in the coming month
Sectors likely to outperform on Relative Strength Model Relative Rotation Graph
Our May edition of Monthly Technical Outlook highlighted a
possibility of correction in May while reiterating that such a
correction would create an incremental buying opportunity
for investors. Ongoing corrective phase amid global volatility
and higher crude prices have resulted in a sizeable price
correction in the broader markets helping stocks to work off
excesses built in the previous rally.
Contrary to well known adage of “Sell in May and go away”,
empirical evidence in Indian equities favours buying in May.
In the last two decades, 75% of the time, buying in May, has
generated positive returns over the next six months for
investors as calculated from May lows. In the current
context, we expect the Nifty to consolidate above the strong
support of 10400 and eventually head towards 10930.
Hence, we reiterate our stance and recommend investors
with a medium term horizon utilise volatility, to build
portfolio in quality stocks.
Technical Outlook.. NSE Nifty Weekly Bar Chart
Source: Bloomberg, ICICI Direct Research
Month
ly T
echn
ical
Outlo
ok
May 31, 2018 ICICI Securities Ltd. | Retail Equity Research 1
Nifty:Pendulum to swing towards 10930…
Domestic Indices
Research Analyst
Dharmesh Shah
Nitin Kunte, CMT
Pabitro Mukherjee
Ninad Tamhanekar, CMT
Vinayak Parmar
% from 1-month
Indices 200 DMA % chg
Sensex 34949 4.1 -0.7
CNX Nifty 10614 2.5 -0.8
CNX Mid Cap 18975 -2.7 -6.1
CNX Small Cap 7907 -4.7 -5.3
CNX IT 13558 12.2 -3.3
BSE Auto 24568 -1.7 -5.0
CNX Pharma 8321 -9.1 -8.1
CNX FMCG 28658 7.6 0.1
BSE Banking 29411 3.5 2.8
BSE Oil & Gas 14352 -7.2 -1.2
BSE Metal 13638 -4.4 -4.3
BSE Capital Goods 19071 2.5 -3.1
BSE Power 2133 -5.6 -4.5
BSE Realty 2257 -3.5 -7.3
BSE PSU 7857 -9.2 -0.1
* Closing Price of May 30, 2018
Close
ICIC
I S
ecurit
ies –
Retail E
quit
y R
esearch
MO
ME
NT
UM
PIC
K
Nifty (10614)
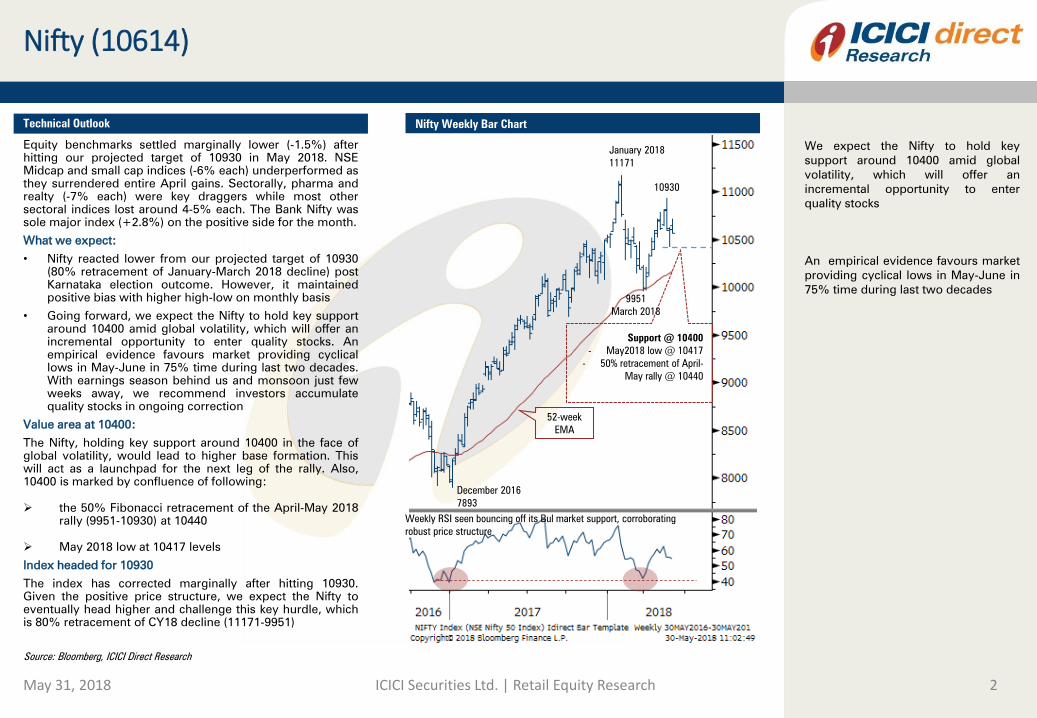
Equity benchmarks settled marginally lower (-1.5%) after
hitting our projected target of 10930 in May 2018. NSE
Midcap and small cap indices (-6% each) underperformed as
they surrendered entire April gains. Sectorally, pharma and
realty (-7% each) were key draggers while most other
sectoral indices lost around 4-5% each. The Bank Nifty was
sole major index (+2.8%) on the positive side for the month.
What we expect:
• Nifty reacted lower from our projected target of 10930
(80% retracement of January-March 2018 decline) post
Karnataka election outcome. However, it maintained
positive bias with higher high-low on monthly basis
• Going forward, we expect the Nifty to hold key support
around 10400 amid global volatility, which will offer an
incremental opportunity to enter quality stocks. An
empirical evidence favours market providing cyclical
lows in May-June in 75% time during last two decades.
With earnings season behind us and monsoon just few
weeks away, we recommend investors accumulate
quality stocks in ongoing correction
Value area at 10400:
The Nifty, holding key support around 10400 in the face of
global volatility, would lead to higher base formation. This
will act as a launchpad for the next leg of the rally. Also,
10400 is marked by confluence of following:
the 50% Fibonacci retracement of the April-May 2018
rally (9951-10930) at 10440
May 2018 low at 10417 levels
Index headed for 10930
The index has corrected marginally after hitting 10930.
Given the positive price structure, we expect the Nifty to
eventually head higher and challenge this key hurdle, which
is 80% retracement of CY18 decline (11171-9951)
May 31, 2018 ICICI Securities Ltd. | Retail Equity Research 2
Technical Outlook Nifty – Weekly Bar Chart
Source: Bloomberg, ICICI Direct Research
January 2018
11171
9951
March 2018
December 2016
7893
52-week
EMA
Weekly RSI seen bouncing off its Bul market support, corroborating
robust price structure
Support @ 10400
- May2018 low @ 10417
- 50% retracement of April-
May rally @ 10440
Nifty Weekly Bar Chart
10930
We expect the Nifty to hold key
support around 10400 amid global
volatility, which will offer an
incremental opportunity to enter
quality stocks
An empirical evidence favours market
providing cyclical lows in May-June in
75% time during last two decades

ICIC
I S
ecurit
ies –
Retail E
quit
y R
esearch
MO
ME
NT
UM
PIC
K
Seasonality favours Bulls…
May 31, 2018 ICICI Securities Ltd. | Retail Equity Research 3
May has typically provided cyclical lows for index..
There is an old adage in overseas markets, “Sell in May and
go away”. This is based on the assumption that stocks
typically underperform during the May-October period.
We have closely examined the performance of NSE Nifty
index over the past 20 years to verify, if this adage holds
true in the Indian context. Empirical evidence suggest that in
fact May has offered a decent buying opportunity for
investors as 75% of the time year-end returns as calculated
from May lows has been positive
The adjacent table lists May lows every year for the Nifty and
year-end returns as calculated from May lows.
To conclude, seasonality clearly favours buying in May.
Investors would therefore be better off utilising volatility
around Karnataka elections and fear of rising interest rates
by RBI, as incremental buying opportunity to ride the
structural uptrend.
Seasonality favours buying in May…
Source: Bloomberg, ICICI Direct Research
Table showing year-end returns of Nifty from May lows every year
CY Lows in May Return till Year-end
2017 9270 13.59
2016 7678 6.6
2015 7997 -0.64
2014 6638 24.77
2013 5910 6.67
2012 4789 23.3
2011 5328 -13.21
2010 4786 28.17
2009 3478 49.54
2008 4802 -38.38
2007 3981 54.18
2006 2896 36.95
2005 1898 49.42
2004 1292 60.99
2003 931 67.02
2002 1020 7.16
2001 1096 -3.38
2000 1201 5.16
1999 968 52.89
1998 1038 -14.84

ICIC
I S
ecurit
ies –
Retail E
quit
y R
esearch
MO
ME
NT
UM
PIC
K
Bank Nifty (26210): Index moving in rising channel highlighting continuance of positive bias
The Bank Nifty gained for a second consecutive month and
ended up more than 3%. The PSU bank index snapped a five
months decline and ended up more than 4% during the
previous month whereas the private bank index ended higher
for a second consecutive month and closed higher by more
than 3%. Positive global market and normal monsoon forecasts
led to the positive sentiments in the market.
The monthly price action formed a second consecutive bull
candle with a higher high and higher low in the monthly time
frame signaling continuance of the positive bias. The entire up
move since March 2018 low (23605) is well channelled
highlighting sustained demand at elevated levels. The index
during the corrective decline of mid May 2018 has rebounded
from the lower band of the rising channel highlighting positive
bias and a higher base formation in the index. In the coming
month, we expect the index to maintain positive bias and head
towards 27000 as it is the confluence of the recent high of mid
May 2018 (26972) and the trend line resistance joining highs of
January 2018 (27652) and May 2018 (26972) around 26900.
The overall bias in the index remains positive. Any corrective
decline from current level is likely to form a higher base and can
be used to accumulate fresh long position. We have revised the
short-term support level higher towards 25500-25700 as it is the
confluence of following:
the lower band of the rising channel containing the entire up
move since march 2018 low of 23605
the 50 days EMA placed around 25600, which has acted as
support during the recent up move since March 2018
38.2% retracement of the entire up move since March 2018
(23605-26972) at 25680
Among oscillators, the weekly 14 period’s RSI remain in strong
uptrend and has been sustaining above its nine period’s average
thus supports the continuation of the positive bias in the index
in the coming month.
May 31, 2018 ICICI Securities Ltd. | Retail Equity Research 4
Technical Outlook Bank Nifty Weekly Bar Chart
Source: Bloomberg, ICICI Direct Research
Index continue to form higher peak and higher trough and is
seen moving in a rising channel thus supports the positive bias
in the coming month
Weekly 14 period’s RSI remains in uptrend and has been
sustaining above its nine period’s average
27652
23605
25622
26972
Major support revised
higher towards @
25600-25800 being
confluence of:
- 38.2% retracement
of previous up move
- The lower band of
the rising channel

ICIC
I S
ecurit
ies –
Retail E
quit
y R
esearch
MO
ME
NT
UM
PIC
K
Sectoral merry-go-round…
• The IT index continues to move within the leading quadrant
highlighting the continuance of relative outperformance of IT
stocks. The decline within the quadrant suggests profit
booking in IT stocks but the bias in IT stocks remain positive
• BSE consumer goods have seen a pick-up in relative
momentum and moved into the leading quadrant from the
improving quadrant implying that the consumer stocks has
started a fresh up move after recent consolidation
• The Capital Goods index is poised at the neutral line implying
an in line performance with the benchmarks. Capital goods
stocks likely to perform at par with the benchmark indices
• BSE Bankex and BSE Auto has moved higher within the
lagging quadrant indicating a pick-up in relative momentum
and are likely to see stock specific action in the above sector
in the coming month
• BSE healthcare index is seen moving in a range signalling
sock specific action to continue in the coming month
• BSE Power index is moving within the lagging quadrant and
has failed to move into improving quadrant as was expected
in last edition signalling continuation of the consolidation in
the power stocks
• Oil & gas and PSU indices have been hovering in the lagging
quadrant suggesting loss of relative momentum and implying
further consolidation in these sectors
• Metal and realty indices have lost further ground after slipping
into the lagging quadrant as it continues to see deceleration
in relative price and momentum suggesting further
consolidation indicating relative underperformance in the
near term
May 31, 2018 ICICI Securities Ltd. | Retail Equity Research 5
Sectoral Rotation Relative Rotation Graph
Source: Bloomberg, ICICI Direct Research
In this section, we focus on the relative
performance of the BSE sectoral indices.
The adjacent scatter chart highlights the
relative performance of the 11 major
sectors of the BSE relative to the Sensex
with the y-axis plotting the relative price
momentum in the past 12 months and the
x-axis plotting the relative price. The chart
is then subdivided into four quadrants
Leadership quadrant: Top right is
“Leadership” quadrant, which represents a
sector that has strengthened in relative
price and momentum vis-à-vis the Sensex.
Weakening quadrant: Bottom right is the
“Weakening” quadrant where the relative
price of a sector has started to deteriorate
and momentum has started to slow.
Lagging quadrant: Bottom left is the
“Lagging” quadrant where the relative
price of a sector has become negative
with momentum suggesting
underperformance vis-à-vis the
benchmark.
Improving quadrant: Top left is the
“Improving” quadrant where the relative
price trend of the sector has started to rise
with momentum.
In summary, if a sector appears in the top
right quadrant, it indicates the sector is
trending higher and outperforming the
benchmarks. If a sector appears on the
bottom left it indicates it is trending lower.
Sectors appearing on the bottom right
indicate they are underperforming the
benchmark while if they appear in the top
left it suggests an improving price
momentum.
Notes
ICIC
I S
ecurit
ies –
Retail E
quit
y R
esearch
MO
ME
NT
UM
PIC
K
Sectoral Indices – Relative to benchmarks
May 31, 2018 ICICI Securities Ltd. | Retail Equity Research 6
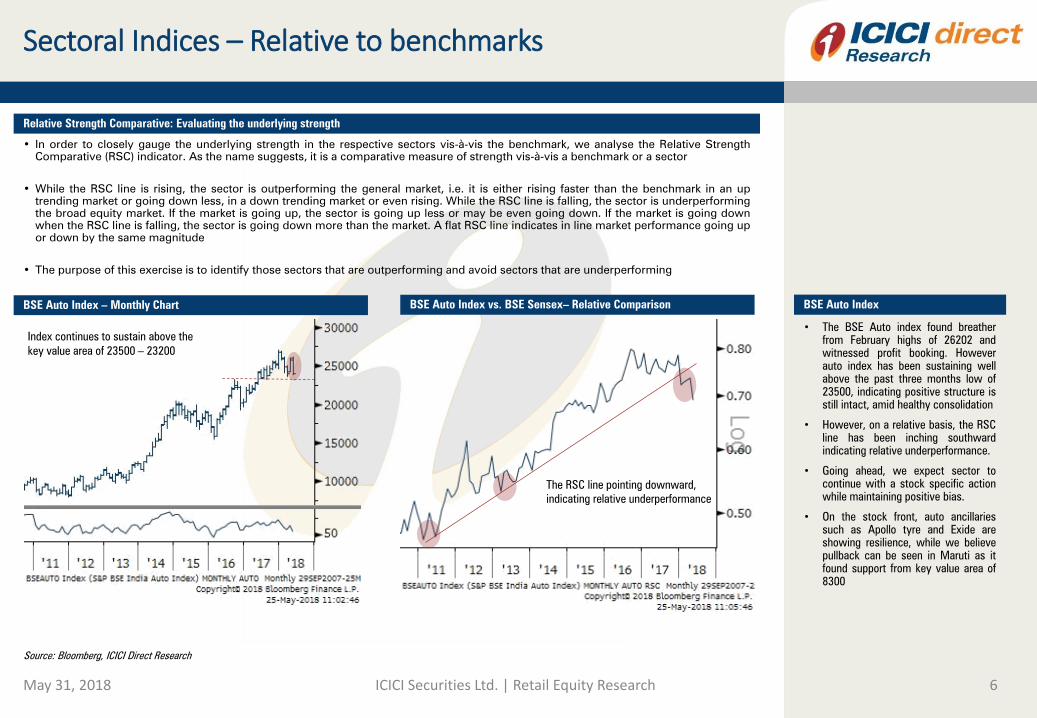
• In order to closely gauge the underlying strength in the respective sectors vis-à-vis the benchmark, we analyse the Relative Strength
Comparative (RSC) indicator. As the name suggests, it is a comparative measure of strength vis-à-vis a benchmark or a sector
• While the RSC line is rising, the sector is outperforming the general market, i.e. it is either rising faster than the benchmark in an up
trending market or going down less, in a down trending market or even rising. While the RSC line is falling, the sector is underperforming
the broad equity market. If the market is going up, the sector is going up less or may be even going down. If the market is going down
when the RSC line is falling, the sector is going down more than the market. A flat RSC line indicates in line market performance going up
or down by the same magnitude
• The purpose of this exercise is to identify those sectors that are outperforming and avoid sectors that are underperforming
Relative Strength Comparative: Evaluating the underlying strength
BSE Auto Index – Monthly Chart
• The BSE Auto index found breather
from February highs of 26202 and
witnessed profit booking. However
auto index has been sustaining well
above the past three months low of
23500, indicating positive structure is
still intact, amid healthy consolidation
• However, on a relative basis, the RSC
line has been inching southward
indicating relative underperformance.
• Going ahead, we expect sector to
continue with a stock specific action
while maintaining positive bias.
• On the stock front, auto ancillaries
such as Apollo tyre and Exide are
showing resilience, while we believe
pullback can be seen in Maruti as it
found support from key value area of
8300
BSE Auto Index vs. BSE Sensex– Relative Comparison
Source: Bloomberg, ICICI Direct Research
BSE Auto Index
The RSC line pointing downward,
indicating relative underperformance
Index continues to sustain above the
key value area of 23500 – 23200
ICIC
I S
ecurit
ies –
Retail E
quit
y R
esearch
MO
ME
NT
UM
PIC
K
Sectoral Indices – Relative to benchmarks
May 31, 2018 ICICI Securities Ltd. | Retail Equity Research 7
BSE Oil & Gas Index – Monthly Chart BSE Oil & Gas vs. BSE Sensex – Relative Comparison
BSE Capital Goods Index – Monthly Chart BSE Capital Goods vs. BSE Sensex– Relative Comparison
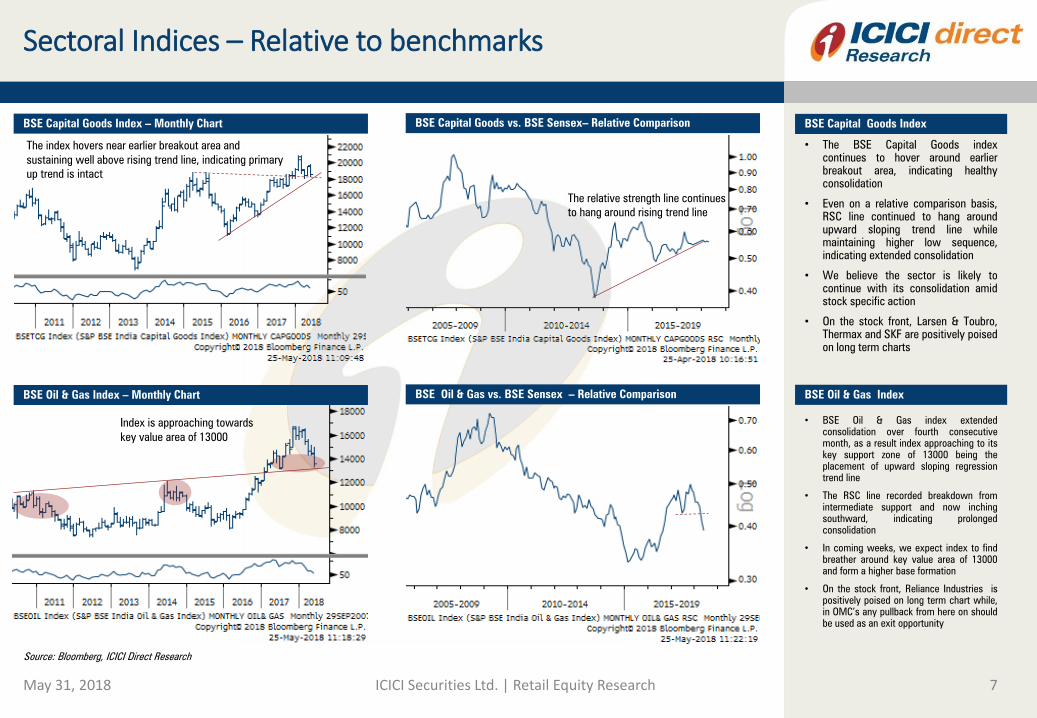
• The BSE Capital Goods index
continues to hover around earlier
breakout area, indicating healthy
consolidation
• Even on a relative comparison basis,
RSC line continued to hang around
upward sloping trend line while
maintaining higher low sequence,
indicating extended consolidation
• We believe the sector is likely to
continue with its consolidation amid
stock specific action
• On the stock front, Larsen & Toubro,
Thermax and SKF are positively poised
on long term charts
• BSE Oil & Gas index extended
consolidation over fourth consecutive
month, as a result index approaching to its
key support zone of 13000 being the
placement of upward sloping regression
trend line
• The RSC line recorded breakdown from
intermediate support and now inching
southward, indicating prolonged
consolidation
• In coming weeks, we expect index to find
breather around key value area of 13000
and form a higher base formation
• On the stock front, Reliance Industries is
positively poised on long term chart while,
in OMC’s any pullback from here on should
be used as an exit opportunity
BSE Capital Goods Index
BSE Oil & Gas Index
Source: Bloomberg, ICICI Direct Research
The index hovers near earlier breakout area and
sustaining well above rising trend line, indicating primary
up trend is intact
The relative strength line continues
to hang around rising trend line
Index is approaching towards
key value area of 13000
ICIC
I S
ecurit
ies –
Retail E
quit
y R
esearch
MO
ME
NT
UM
PIC
K
Sectoral Indices – Relative to benchmarks
May 31, 2018 ICICI Securities Ltd. | Retail Equity Research 8
BSE Realty Index – Monthly Chart BSE Realty vs. BSE Sensex – Relative Comparison
BSE Metal Index – Monthly Chart BSE Metal vs. BSE Sensex– Relative Comparison
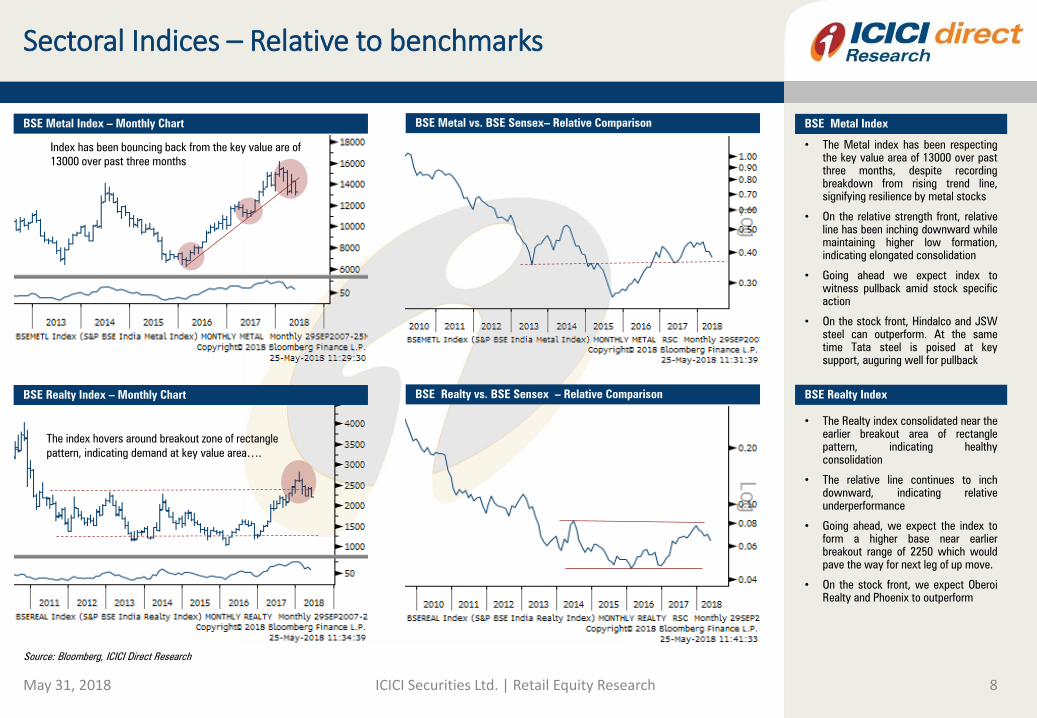
• The Metal index has been respecting
the key value area of 13000 over past
three months, despite recording
breakdown from rising trend line,
signifying resilience by metal stocks
• On the relative strength front, relative
line has been inching downward while
maintaining higher low formation,
indicating elongated consolidation
• Going ahead we expect index to
witness pullback amid stock specific
action
• On the stock front, Hindalco and JSW
steel can outperform. At the same
time Tata steel is poised at key
support, auguring well for pullback
• The Realty index consolidated near the
earlier breakout area of rectangle
pattern, indicating healthy
consolidation
• The relative line continues to inch
downward, indicating relative
underperformance
• Going ahead, we expect the index to
form a higher base near earlier
breakout range of 2250 which would
pave the way for next leg of up move.
• On the stock front, we expect Oberoi
Realty and Phoenix to outperform
BSE Metal Index
BSE Realty Index
Source: Bloomberg, ICICI Direct Research
Index has been bouncing back from the key value are of
13000 over past three months
The index hovers around breakout zone of rectangle
pattern, indicating demand at key value area….
ICIC
I S
ecurit
ies –
Retail E
quit
y R
esearch
MO
ME
NT
UM
PIC
K
Sectoral Indices – Relative to benchmarks
May 31, 2018 ICICI Securities Ltd. | Retail Equity Research 9
NSE IT – Weekly Chart NSE IT Index vs. Nifty – Relative Comparison
NSE Pharma – Monthly Chart NSE Pharma Index vs. Nifty – Relative Comparison
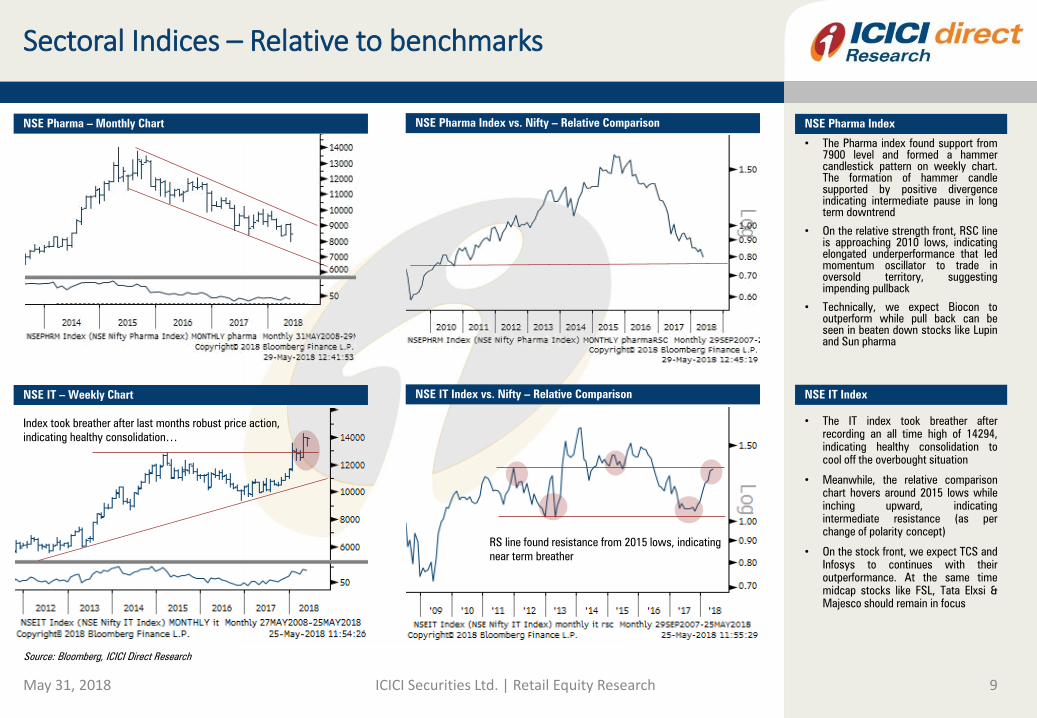
• The Pharma index found support from
7900 level and formed a hammer
candlestick pattern on weekly chart.
The formation of hammer candle
supported by positive divergence
indicating intermediate pause in long
term downtrend
• On the relative strength front, RSC line
is approaching 2010 lows, indicating
elongated underperformance that led
momentum oscillator to trade in
oversold territory, suggesting
impending pullback
• Technically, we expect Biocon to
outperform while pull back can be
seen in beaten down stocks like Lupin
and Sun pharma
• The IT index took breather after
recording an all time high of 14294,
indicating healthy consolidation to
cool off the overbought situation
• Meanwhile, the relative comparison
chart hovers around 2015 lows while
inching upward, indicating
intermediate resistance (as per
change of polarity concept)
• On the stock front, we expect TCS and
Infosys to continues with their
outperformance. At the same time
midcap stocks like FSL, Tata Elxsi &
Majesco should remain in focus
NSE Pharma Index
NSE IT Index
Source: Bloomberg, ICICI Direct Research
Index took breather after last months robust price action,
indicating healthy consolidation…
RS line found resistance from 2015 lows, indicating
near term breather

ICIC
I S
ecurit
ies –
Retail E
quit
y R
esearch
MO
ME
NT
UM
PIC
K
Sectoral Indices – Relative to benchmarks
May 31, 2018 ICICI Securities Ltd. | Retail Equity Research 10
NSE FMCG – Weekly Chart NSE FMCG Index vs. Nifty – Relative Comparison
• The FMCG witnessed range bound
activity post 10% rally over last month
and recorded an all time high of 29134
• On the relative strength front, RSC line
continues to inch upward, indicating
outperformance by FMCG stocks
• Going ahead, we expect index to enter
into healthy consolidation and
gradually pave the way for next leg of
up move
• On the stock front, we expect Colgate-
Palmolive, Hindustan Unilever and
Dabur to outshine the FMCG pack. At
the same time, Jyothy Laboratories
and ITC are positively poised on long
term chart
NSE FMCG Index
Source: Bloomberg, ICICI Direct Research
Index recorded an all time high, indicating
outperformance
ICIC
I S
ecurit
ies –
Retail E
quit
y R
esearch
MO
ME
NT
UM
PIC
K
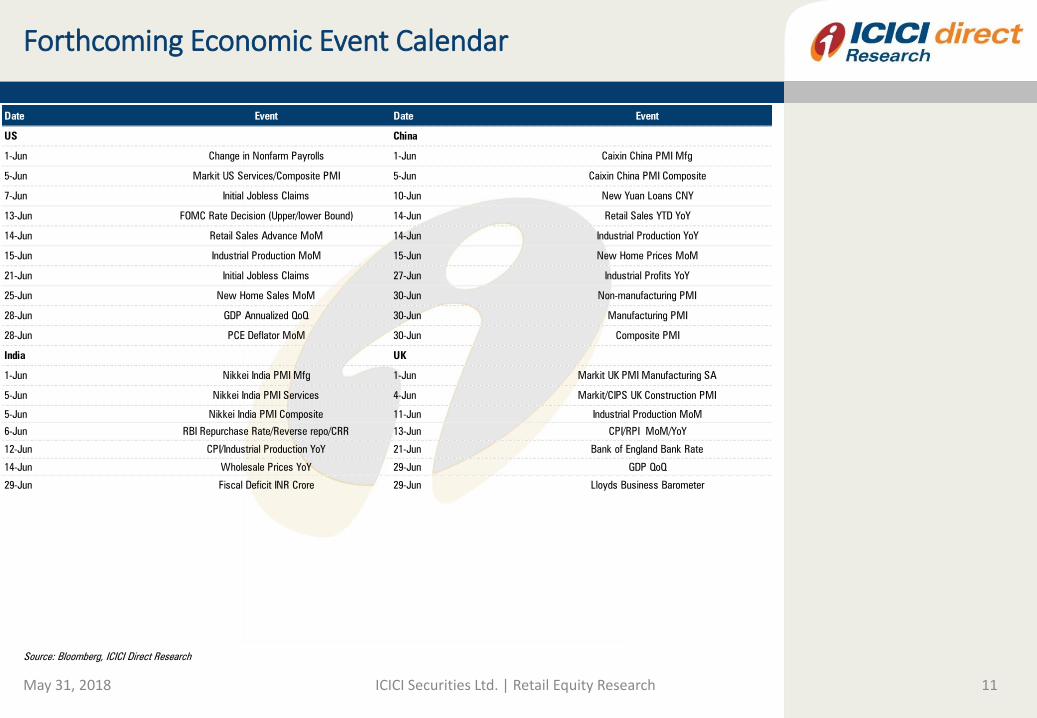
Forthcoming Economic Event Calendar
May 31, 2018 ICICI Securities Ltd. | Retail Equity Research 11
Source: Bloomberg, ICICI Direct Research
Date Event Date Event
US China
1-Jun Change in Nonfarm Payrolls 1-Jun Caixin China PMI Mfg
5-Jun Markit US Services/Composite PMI 5-Jun Caixin China PMI Composite
7-Jun Initial Jobless Claims 10-Jun New Yuan Loans CNY
13-Jun FOMC Rate Decision (Upper/lower Bound) 14-Jun Retail Sales YTD YoY
14-Jun Retail Sales Advance MoM 14-Jun Industrial Production YoY
15-Jun Industrial Production MoM 15-Jun New Home Prices MoM
21-Jun Initial Jobless Claims 27-Jun Industrial Profits YoY
25-Jun New Home Sales MoM 30-Jun Non-manufacturing PMI
28-Jun GDP Annualized QoQ 30-Jun Manufacturing PMI
28-Jun PCE Deflator MoM 30-Jun Composite PMI
India UK
1-Jun Nikkei India PMI Mfg 1-Jun Markit UK PMI Manufacturing SA
5-Jun Nikkei India PMI Services 4-Jun Markit/CIPS UK Construction PMI
5-Jun Nikkei India PMI Composite 11-Jun Industrial Production MoM
6-Jun RBI Repurchase Rate/Reverse repo/CRR 13-Jun CPI/RPI MoM/YoY
12-Jun CPI/Industrial Production YoY 21-Jun Bank of England Bank Rate
14-Jun Wholesale Prices YoY 29-Jun GDP QoQ
29-Jun Fiscal Deficit INR Crore 29-Jun Lloyds Business Barometer
ICIC
I S
ecurit
ies –
Retail E
quit
y R
esearch
MO
ME
NT
UM
PIC
K
Pankaj Pandey Head – Research [email protected]
ICICI Direct Research Desk,
ICICI Securities Limited,
1st Floor, Akruti Trade Centre,
Road No 7, MIDC,
Andheri (East)
Mumbai – 400 093
May 31, 2018 ICICI Securities Ltd. | Retail Equity Research 12

ICIC
I S
ecurit
ies –
Retail E
quit
y R
esearch
MO
ME
NT
UM
PIC
K
We /I, Dharmesh Shah, Nitin Kunte, Ninad Tamhanekar, Pabitro Mukherjee, Vinayak Parmar Research Analysts, authors and the names subscribed to this report, hereby certify that all of the views expressed in this research report accurately reflect our views about the
subject issuer(s) or securities. We also certify that no part of our compensation was, is, or will be directly or indirectly related to the specific recommendation(s) or view(s) in this report.
Terms & conditions and other disclosures:
ICICI Securities Limited (ICICI Securities) is a full-service, integrated investment banking and is, inter alia, engaged in the business of stock brokering and distribution of financial products. ICICI Securities Limited is a SEBI registered Research Analyst with SEBI
Registration Number – INH000000990.ICICI Securities is a wholly-owned subsidiary of ICICI Bank which is India’s largest private sector bank and has its various subsidiaries engaged in businesses of housing finance, asset management, life insurance, general
insurance, venture capital fund management, etc. (“associates”), the details in respect of which are available on www.icicibank.com
ICICI Securities is one of the leading merchant bankers/ underwriters of securities and participate in virtually all securities trading markets in India. We and our associates might have investment banking and other business relationship with a significant percentage of
companies covered by our Investment Research Department. ICICI Securities generally prohibits its analysts, persons reporting to analysts and their relatives from maintaining a financial interest in the securities or derivatives of any companies that the analysts cover.
The information and opinions in this section have been prepared by ICICI Securities and are subject to change without any notice. The report and information contained herein is strictly confidential and meant solely for the selected recipient and may not be altered in
any way, transmitted to, copied or distributed, in part or in whole, to any other person or to the media or reproduced in any form, without prior written consent of ICICI Securities. While we would endeavour to update the information herein on reasonable basis, ICICI
Securities is under no obligation to update or keep the information current. Also, there may be regulatory, compliance or other reasons that may prevent ICICI Securities from doing so. Non-rated securities indicate that rating on a particular security has been
suspended temporarily and such suspension is in compliance with applicable regulations and/or ICICI Securities policies, in circumstances where ICICI Securities might be acting in an advisory capacity to this company, or in certain other circumstances.
The research recommendations are based on information obtained from public sources and sources believed to be reliable, but no independent verification has been made nor is its accuracy or completeness guaranteed. These research recommendations and
information herein is solely for informational purpose and shall not be used or considered as an offer document or solicitation of offer to buy or sell or subscribe for securities or other financial instruments. ICICI Securities will not treat recipients as customers by
virtue of their receiving these recommendations. Nothing in this section constitutes investment, legal, accounting and tax advice or a representation that any investment or strategy is suitable or appropriate to your specific circumstances. The securities discussed and
opinions expressed herein may not be suitable for all investors, who must make their own investment decisions, based on their own investment objectives, financial positions and needs of specific recipient. This may not be taken in substitution for the exercise of
independent judgment by any recipient. The recipient should independently evaluate the investment risks. The value and return on investment may vary because of changes in interest rates, foreign exchange rates or any other reason. ICICI Securities accepts no
liabilities whatsoever for any loss or damage of any kind arising out of the use of these recommendations. Past performance is not necessarily a guide to future performance. Investors are advised to see Risk Disclosure Document to understand the risks associated
before investing in the securities markets. Actual results may differ materially from those set forth in projections. Forward-looking statements are not predictions and may be subject to change without notice.
ICICI Securities or its associates might have managed or co-managed public offering of securities for the subject company or might have been mandated by the subject company for any other assignment in the past twelve months.
ICICI Securities or its associates might have received any compensation from the companies mentioned herein during the period preceding twelve months from the date of these recommendations for services in respect of managing or co-managing public offerings,
corporate finance, investment banking or merchant banking, brokerage services or other advisory service in a merger or specific transaction.
ICICI Securities or its associates might have received any compensation for products or services other than investment banking or merchant banking or brokerage services from the companies mentioned herein in the past twelve months.
ICICI Securities encourages independence in research report preparation and strives to minimize conflict in preparation of research report. ICICI Securities or its associates or its Analysts did not receive any compensation or other benefits from the companies
mentioned in the report or third party in connection with preparation of the research report. Accordingly, neither ICICI Securities nor Research Analysts and their relatives have any material conflict of interest at the time of publication of this reports.
It is confirmed that Dharmesh Shah, Nitin Kunte, Ninad Tamhanekar, Pabitro Mukherjee and Vinayak Parmar, Research Analysts giving these recommendations have not received any compensation from the companies mentioned herein in the preceding twelve
months.
Compensation of our Research Analysts is not based on any specific merchant banking, investment banking or brokerage service transactions
ICICI Securities or its subsidiaries collectively or Research Analysts or their relatives do not own 1% or more of the equity securities of the company/companies mentioned herein as of the last day of the month preceding the publication of these research
recommendations.
Since Associates (ICICI group companies) of ICICI Securities are engaged in various financial service businesses, they might have financial interests or beneficial ownership in various companies including the subject company/companies mentioned herein.
It is confirmed that Research Analysts do not serve as an officer, director or employee or advisory board member of the companies mentioned herein.
ICICI Securities may have issued other reports that are inconsistent with and reach different conclusion from the information presented herein.
Neither the Research Analysts nor ICICI Securities have been engaged in market making activity for the companies mentioned herein.
We submit that no material disciplinary action has been taken on ICICI Securities by any Regulatory Authority impacting Equity Research Analysis activities.
This report or recommendations are not directed or intended for distribution to, or use by, any person or entity who is a citizen or resident of or located in any locality, state, country or other jurisdiction, where such distribution, publication, availability or use would be
contrary to law, regulation or which would subject ICICI Securities and affiliates to any registration or licensing requirement within such jurisdiction. The securities described herein may or may not be eligible for sale in all jurisdictions or to certain category of
investors. Persons in whose possession this document may come are required to inform themselves of and to observe such restriction
May 31, 2018 ICICI Securities Ltd. | Retail Equity Research 13
Disclaimer