Embed Size (px)
Citation preview

BROOKINGS INDIAQUALITY. INDEPENDENCE. IMPACT
WORKING PAPER 02
TRADE POLICY REFORM IN INDIA SINCE 1991
Harsha Vardhana Singh

Brookings India Working Paper
© 2017 Brookings Institution India CenterNo. 6, Second Floor, Dr. Jose P Rizal MargChanakyapuri, New Delhi - 110021 www.brookings.in
Recommended citation:
Singh, Harsha Vardhana. “Trade Policy Reform in India Since 1991,” Brookings India Working Paper 02, March 2017
The Brookings Institution India Center serves as a platform for cutting-edge, independent, policy-relevant research andanalysis on the opportunities and challenges facing India and the world. Established in 2013, the Center is based in NewDelhi, and registered as a company limited by shares and not for profit, under Section 8 (formerly Section 25) of theCompanies Act, 1956. Our work is centered on the motto of “Quality, Independence, Impact.”
All content reflects the individual views of the author(s). Brookings India does not hold an institutional view on any subject.
BROOKINGS INDIAQUALITY. INDEPENDENCE. IMPACT

BROOKINGS INDIA
1 | Trade Policy Reform in India Since 1991
Trade Policy Reform in India Since 1991
Harsha Vardhana Singh1
March 2017
1I thank Rakesh Mohan for his detailed comments, and Arvind Subramanian, Geethanjali Nataraj and Ramandeep
Singh for their comments and discussions. This paper was completed before the presentation of the Union Budget in
2017. The substantive insights and key messages from this paper remain unchanged.

BROOKINGS INDIA
2 | Trade Policy Reform in India Since 1991
1. Summary
Trade policy reform, focusing on tariffs and quantitative restrictions, was an important part of the
economic reform initiated in 1991. Supplemented by recommendations of an Expert Committee,
India's trade policy reform paved the road for a major reduction of average tariffs, tariff peaks,
simplification of the tariff and quota regimes, and removal of several import restrictions. These
changes reflected a larger vision of reform to enhance the efficiency of domestic industry,
together with a number of other objectives such as promoting infant industry, exports,
technological upgradation and food security. Trade policy reform was continued by every
Government that came to power, both in the conventional areas of trade policy, as well as the
new areas of trade policy that have emerged in the last 25 years. This paper discusses these
changes, identifying both the significant progress made through reform and the areas where
further progress is required. Moreover, the scope and coverage of trade policy has kept on
evolving over time, thus indicating a need for a continued focus on identifying the areas which
need further attention and reform. The paper also identified some of the key areas in this context.
Interestingly, one of the most significant facts which emerges from this paper is that India is
actually a country with very low weighted average tariffs, comparable to low tariff economies
such as the United States. This implies that the conventional view of India being a country with
relatively high tariff barriers needs to be revised. An appreciation of this reality would pave the
way towards both simplifying the present tariff regime, and developing a new trade negotiation
strategy that combines ongoing changes in tariffs as well as several trade-related measures
which are usually considered as part of domestic policy or even macroeconomic policy.
2. Introduction
In his 1991 Union Budget speech introducing a vast range of Indian economic reforms, Dr.
Manmohan Singh said: “As we enter the last decade of the twentieth century, India stands at the
cross-roads. The decisions we take and do not take, at this juncture, will determine the shape of
things to come for quite some time. … But India’s future development depends crucially on how
well the planning process is adapted to the needs of a fast changing situation.”
For trade policy, these words ring as true today as they did 25 years ago, even though India has
covered a long distance in the direction set out in 1991. India is once again at crossroads, with
BROOKINGS INDIA
3 | Trade Policy Reform in India Since 1991
global market conditions changing rapidly in a world where even the notion of international trade
and trade policy is not what it was a couple of decades ago. Thus, trade policy reform has to be
based on an evolving framework which needs to be renewed and focused upon in the context of
the times, bearing in mind both the conventional and new areas of trade policy.
An important part of Indian experience with trade policy reform since 1991 is that these changes
were managed without major disruptive consequences. The economy has been on a strong
growth trend, though from time to time there are concerns about its weaknesses, with even a
revision of the direction of trade policy in certain sectors such as electronics.
In the last 20 years global markets have changed in major ways, with increased competitive
pressures resulting from larger participation of several developing economies in world trade
(particularly China). The rise in FDI stock has meant an increasing overlap between trade and
investment, and a rise in the significance of international value chains and lead firms managing
those value chains to specify the conditions relevant for quality and social and sustainability
standards. An important realisation in the context of value chains is that imports contribute to
exports. Recent data show that imported inputs contribute about one quarter of the total value of
India’s exports.2
The world of international trade and trade policy continues to evolve as the focus areas in trade
policy are framed by new efforts to establish trade agreements, especially bilateral and regional
trade agreements by some large economies.
This implies a need for trade policy reform to encompass both the likely changes in regional and
global markets and the evolution of international trade policy in major economies. In this
background, a quick look at the evolution of the scope of trade policy will help us better
understand the range of trade policies currently relevant for policy makers and business.
(a) Evolution of trade policy
Earlier, trade policy focused mainly on border measures, such as tariffs, quotas, import licensing,
and prohibitions on imports. Some inside-the-border policies which were seen as impacting upon
trade conditions, such as subsidies and local content requirements, were also part of the
consideration. Over time, many more inside-the-border policies that affect trade began to be part
2 OECD (2015). Trade in Value Added Indicators. Available at: https://stats.oecd.org/index.aspx?queryid=66237

BROOKINGS INDIA
4 | Trade Policy Reform in India Since 1991
of the trade policy focus, such as IPR, trade-related investment measures, and a recognition that
trade rules also needed to apply to services (including regulatory conditions). With increasing
competition in global markets and larger economic presence of a number of developing
economies, additional trade policies considerations started emerging which reflected an
increasing focus in developed economies on conditions which they considered as necessary to
create a “level playing field” in world trade. These included policies which affect “competitive
neutrality” like differences in social and sustainability (labour and environment) standards,
preferential support provided to state enterprise, competition policy, regulatory practices, and
“responsible business conduct”. Rules or codes of conduct had to be agreed also for ensuring
that standards do not become trade barriers, thus leading to a focus on principles of good
regulatory practice, the framework for regulatory coherence and emphasis on establishing
Memorandum of Understanding or processes for determining conformity among the standards
used in different economies.
World trade has been accompanied by an increase in foreign direct investment (FDI), which
together with greater tradability of services, led to a rise in the prominence of international value
chains in world trade. Effective and efficient value chains require quick response and turnover,
with consistent good quality products and reliable supply. This changed the focus of trade policy
towards greater facilitation of processes and value chains, improving infrastructure, and on
conditions of investment in other economies.
The spread of digital services and their importance in trade have brought into trade-policy focus
the rules for e-commerce, data transfer, e-commerce and certain intellectual property rights (IPR)
issues relevant to the digital realm. An interesting feature of the disaggregated value chain
component shows that a large part for many of the major products with a wide reach (e.g., the
cellphone) is returns to technology and knowledge (IPRs). The new technologies that are
emerging in several areas such as communications technology, material science, biotechnology,
and renewable energy are creating new technology-intensive “sunrise sectors” in global markets.
The emergence of new technologies and related “sunrise industries” has meant greater
emphasis on IPRs by owners of technology.
Together with the growth of FDI and value chains, services markets too have opened-up,
encouraged by greater tradability of services, improved communications technology, greater
experience with generally accepted principles of “good regulation”. This has led to a recognition

BROOKINGS INDIA
5 | Trade Policy Reform in India Since 1991
of a need to expand the concept of trade as applied to services (spanning Mode 1 to Mode 4 as
agreed in the World Trade Organization’s [WTO] General Agreement on Trade in Services3).
The rise of international value chains has also led to a recognition of the fact that a significant
portion of value added in goods is due to services. This led to new ways of identifying and
collecting trade data on services trade. Recent data on trade in terms of value added has shown
that the share of services in international trade is much higher than previous calculations
because manufactured products also include value added from services.4 Value added trade
data shows that the share of services in international trade is about 40 per cent, much more than
previous estimates. As Lanz and Maurer explain: “Services account for more than 70 per cent of
world gross domestic product (GDP) but only for around 20 per cent of world trade in balance of
payments terms. In value added terms, accounting for services embodied in exported goods,
services account for 40 per cent of world trade.”5
An important feature of services trade policy reform is that it involves both opening-up of market
entry to new service providers, and creating a “level playing field” for newcomers through a
robust regulatory regime. This consequently established the importance of regulatory regimes as
an integral part of services trade policy.
The enhanced role of value chains and larger links between goods, services and investment in
trade have extended the scope of trade policy. There is a growing awareness of the importance
of facilitation for international value chains, because consistency of standards and timely
response are crucial for efficient operation of these chains.
With several rounds of trade negotiations at the General Agreement on Tariffs and Trade
(GATT)/WTO, the incidence of tariffs and import quotas has come down, though they still remain
3Trade in services is classified in four different categories based on the manner in which services exports take place.
This differs from the conventional situation of goods trade which involves the exported product crossing the border into
the territory of import. These four different categories are referred to as four “Modes” of services exports, and are
specified in Article I.2 of the WTO’s General Agreement on Trade in Services (GATS), which states: “For the purposes
of this Agreement, trade in services is defined as the supply of a service: (a) from the territory of one Member into the
territory of any other Member; (b) in the territory of one Member to the service consumer of any other Member; (c) by a
service supplier of one Member, through commercial presence in the territory of any other Member; (d) by a service
supplier of one Member, through presence of natural persons of a Member in the territory of any other Member.” The
classification under a, to d in this definition are respectively referred to as Modes 1 to 4 of services exports. 4For India’s services content of different exports categories, see Figures 10 and 11 of OECD (2015). Trade in Value
Added: India. Available at: https://www.oecd.org/sti/ind/tiva/CN_2015_India.pdf 5See Abstract and page 3 of Rainer Lanz and Andreas Maurer, 2015, “Services and Global Value Chains – Some
Evidence on Servicification of Manufacturing and Services Networks” WTO Working Paper ERSD-2015-03, 2 March
2015.

BROOKINGS INDIA
6 | Trade Policy Reform in India Since 1991
a focus in trade negotiations. However, other, inside-the-border trade-related policies are now a
much larger part of trade policy considerations. This has implied not only that trade policies have
a wider scope and coverage, but that they are now more controversial as policies hitherto
considered the complete domain of domestic policy are now part of trade policy considerations,
both globally and within India.
While efforts within the WTO continue to evolve disciplines in new areas of trade policy, greater
scope of trade policy agreements can be witnessed from recent trade negotiations involving
large economies. The implicit aim of these negotiations is to create trade policy disciplines that
would potentially apply more widely, and pave the way for common standards being applicable to
their producers and markets.
This paper discusses India’s trade policy changes since the 1990s in many of the above-
mentioned areas. We begin with a summary look at the economic situation since 1991 and then
take a more detailed look at the main trade policy developments in the country. The issues
relating to tariffs and non-tariff measures are addressed in some detail, followed by trade
facilitation and services. The paper concludes with a summary look at factors relevant to
ongoing trade policy concerns, such as international value chains, investment, social and
sustainable standards, and some other policy areas likely to become significant in the near
future.
3. Evolution of Some Key Economic Parameters Since 1991
Table 1 shows that India’s experience in terms of the external sector has a number of positive
achievements as well as some emerging concerns. Foreign exchange reserves have increased
and the current account deficit is relatively low, but the trade deficit as a share of GDP has
increased to very high levels. This results in the government focusing on the large increase in
merchandise imports compared to exports, and on seeking ways that would limit the rise in
imports and improve the country’s export performance.

BROOKINGS INDIA
7 | Trade Policy Reform in India Since 1991
Table 1. India: Some important indicators of the situation relevant to international trade
Year
Ratio of Trade
Account Deficit
to GDP
Ratio of
Current
Account
Deficit to
GDP
Foreign
Exchange
Reserves
Million $
(at end of fiscal
year)
Foreign Exchange
Reserves (Months
of Imports
Equivalent)#
Ratio of Trade
(Goods and
Services) to
GDP
1990/91 -2.89 -2.96 5834 2.04 14.13
1991/92 -0.96 -0.33 9220 2.92 14.93
1995/96 -3.10 -1.60 21687 5.13 22.29
2000/01 -2.61 -0.53 42281 6.12 23.77
2005/06 -6.22 -1.18 151622 8.52 36.47
2010/11 -7.46 -2.82 304818 7.76 42.04
2015/16 -6.21 -1.05 360176 6.61* 36.87
Source: RBI, Handbook of Statistics on Indian Economy, various Issues; World Bank, World Development Indicators,
various issues.
Note: * 2014; # The equivalence is in relation to imports of goods and services.
The overall improved economic performance shows that since 1991 India has, in general,
managed positive economic achievement with limited disruptions that otherwise usually follow
major economic reforms. Today, with its greater economic strength, India should be able to
continue its process of reform to address the current situation in international trade.
4. Trade Policy: Many Types of Policies and Still Evolving
There is a whole range of trade policies which need to be considered for understanding
comprehensively the evolution of Indian trade policy reform (see for example, Table 2).
Furthermore, with potential new Free Trade Agreements such as the Trans Pacific Partnership
(TPP), the issues covered in the context of trade policies is even more extensive.6
6See O N G Derechos Digitales and others, ‘TransPacific Partnership’, pages 1–17. . With strong anti-TPP positions
taken by U.S. President Donald Trump, the possibility of implementing TPP is now out of question. However, the issues
covered by TPP are those which U.S. industry wants to address in a trade agreement, and they are likely to re-emerge
after a few years to help pave the way for a similar trade agreement. See H. V. Singh, 2016, (forthcoming)

BROOKINGS INDIA
8 | Trade Policy Reform in India Since 1991
Table 2. Examples of trade policies covered by WTO’s Trade Policy Review Report
Tariffs, other charges affecting imports,
Tariff concessions, Tariff rate quotas, Preferential
tariffs
Import prohibitions, restrictions, and licensing;
Import surveillance; Import quotas; other import
restrictions
Customs procedures and requirements; pre-
shipment inspection; Customs valuation;
Rules of origin
Standards and other technical requirements,
Certification and conformity assessment,
accreditation
Anti-dumping, countervailing, and safeguard
measures
Export taxes, charges, and levies; Minimum export
prices
Export support and promotion, Special economic
zones (SEZs), Drawback schemes, Export duty
and tax concessions,
Export procedures and requirements, Export
prohibitions, restrictions, and licensing
Export promotion and marketing assistance,
Export finance, insurance and guarantees
Government Procurement, IPRs, Competition
Policy, Subsidies, Price controls, State trading
This paper will not cover each of these policies in detail. It will focus on some of the major trade
policy areas to show the direction of trade policy change for India in the last twenty-five years,
and based on that indicate some further steps needed in that context. The paper begins with the
key features of trade policy reform introduced in 1991. This reform addressed four different
aspects of trade policy: tariffs, non-tariff measures, measures affecting exports, and institutions
and procedures relating to trade. The paper takes a summary look at these trade policy areas,
and then discusses trade policy reforms in the context of other areas such as services, whose
importance in terms of trade policy has grown in more recent times. This is followed by a
discussion of the more current trade policy concerns and the need to recognise that trade policy
initiatives are taking place in multiple ways, with a shift from formal and government led initiatives
to informal and more private sector participation in determining the contours of trade policy
frameworks. This suggests a need for enlarging the scope of our trade policy considerations and
preparation to carry forward the momentum that was provided by the reform in 1991.
5. Trade policy reform in 1991
In 1991, India’s foreign exchange reserves had plummeted to levels which would finance only a
fortnight’s imports, the debt service burden was one-fifth of current account receipts, fiscal deficit
was above 8 per cent, leading to pressure on balance of payments, and the consumer price

BROOKINGS INDIA
9 | Trade Policy Reform in India Since 1991
index had increased by 13.6 per cent with implications for changing the foreign exchange rate.
Those was dire times which required major policy changes.7
The 1991 Union Budget recognised the significance of trade policy reform as part of the overall
reform programme, stating for instance that: “The policies for industrial development are
intimately related to policies for trade.”8
A number of steps were taken to reform trade policy: a more outward oriented regime was put in
place, tariffs were reduced in a phased manner, import duties were streamlined or simplified, and
a process transforming quantitative border restrictions to price based measures was begun.
Likewise, export incentives were continued or new ones provided for a number of products9, and
institutional changes were made to bring transparency and to facilitate transactions involving
domestic and foreign markets. This included the establishment of certain institutions or revised
mandate for existing institutions that would help implement the new focus areas (e.g., the Tariff
Commission10).
The1991 Union Budget speech11 gives the main thrust of policy change as follows: “The time has
come to expose Indian industry to competition from abroad in a phased manner. As a first step in
this direction, the government has introduced changes in import export policy, aimed at a
reduction of import licensing, vigorous export promotion and optimal import compression. The
exchange rate adjustments on July 1 and 3, 1991 and the enlargement and liberalisation of the
replenishment licence system constitute the two major initial steps in the direction of trade policy
reform. They represent the beginning of a transition from a regime of quantitative restrictions to a
price based mechanism.” (paragraph 11)
7See for example paragraphs 2-5 of the 1991-92 Union Budget speech. Available at:
http://indiabudget.nic.in/bspeech/bs199192.pdf 8See paragraph 11 of the Union Budget speech. 9Software, processed minerals, leather, certain capital goods, TCMTB and PCMC, polyurethane film and foil, polyols,
isocyanates, isocyanates, tourism exports encouraged by lower duty on adventure sports equipment, and 100 per cent
export oriented units. 10There was a Tariff Commission even before the present one was established in September 1997. The present Tariff
Commission was established by giving a new mandate which included the core mandate of erstwhile Bureau of
Industrial Costs and Prices (BICP), and some additional tasks relating to making “recommendations as an expert body,
on matters referred to it by Government regarding fixation of tariff and all tariff related issues in relation to trade in goods
and services, keeping in view the interest of various sectors including production, trade and consumers and taking into
account the international commitments.” See
‘History Background of Predecessor Bodies’, Avaiable at: http://tc.nic.in/History.pdf 11This Budget speech that introduced trade policy reform, was given on July 24, 1991.

BROOKINGS INDIA
10 | Trade Policy Reform in India Since 1991
The 1991 trade policy reform was an exercise that balanced several objectives. For instance,
loss of revenue was a major concern, and this was mentioned as a reason for not reducing the
import duty more than was being announced. In a number of instances, import tariffs were kept
high to encourage infant industry. The need for protecting Indian industry against foreign
competition, and to save foreign exchange, were explicitly recognised (paragraphs 10, 80 and
130 of the Union Budget speech). This was balanced with a reduction in tariffs to lower input
costs and to encourage export activities.12 The speech stated, for instance:
“I have attempted to structure the proposals for customs and excise levies in a manner that
indigenous industries are encouraged, and, at the same time, imports of items required for export
production are not thwarted. In the long term, if revenues are buoyant and tax compliance
improves, I expect to bring down the rates of customs and excise levies. Even now, some
moderation in import duties is being attempted and a more broad-based effort may be attempted
to streamline the structure and reduce the rates in the next budget. I have also tried to ensure
that the proposed changes improve competitiveness of the industrial sector, particularly the
export oriented industries.” (paragraph 105)
“In the sphere of customs duties, over time, the objective of protection for infant industries and
the need to raise revenues have led to a situation where import duties prescribed for certain
items are inordinately high and, in several cases, more than 300 percent. As a measure of
reform, I propose to reduce the ad valorem rate of basic plus auxiliary duties of customs to a
maximum of 150 per cent where it is more than that at present, thereby eliminating the tariff
peaks above 150 per cent. The only exceptions that would remain hereafter are imported
alcoholic beverages and passenger baggage.” (paragraph 107)
Interestingly, while a major part of the budget was oriented towards reform, much of it was
conventionally focusing on certain ongoing objectives emphasised by the government and
promoted through the budget, such as promoting technological upgradation, facilitating capital
goods imports, keeping prices low for products such as essential drugs and certain machinery
and equipment, improving the environment, promoting tourism by facilitating products that
contribute to the value chain, and promoting software exports.
12See paragraphs 111 to 114 of the 1991 Budget Speech. The Budget also mentioned objectives such as environment
protection.
BROOKINGS INDIA
11 | Trade Policy Reform in India Since 1991
Three interesting features emerge from the 1991 Union Budget. One, though the tariff levels
were reduced, they were still kept at significantly high levels. Two, the trade policy reform in 1991
was an initial step, which would be continued over time. Three, the nature and pace of reform
would depend on the underlying economic factors which were a matter of concern for the
Government. The trade policy reforms were notified by the Five-Year Expert-Import (EXIM)
Policy in 1992, which provided stability to the content and direction of change brought in by the
1991 reform.
Another important feature of the 1991 reform was that it began opening up the regime for FDI.
While FDI was not linked at that time with trade policy, it created a base for increasing economic
linkages with global markets. We consider below how this objective of greater links with world
markets was implemented through changes in tariffs and non-tariff measures.
6. Tariff reform
The government established a committee under Raja Chelliah on Tax Reform to provide expert
inputs for policy reform. In its final report in 1993, with respect to tariffs, the Chelliah Committee
was of the view that, “the very high or high rates applicable to most commodities, the multiplicity
of statutory rates, the wide spread of rates and the continued issue of a large number of
exemption or concessional rate notifications not only made the administration of the system
extremely complicated, but led to unintended and undesirable effects on the allocation of
resources in the economy. …there is general agreement now that the import tariff system should
be drastically simplified, the levels and spread of the rates of duty must be reduced significantly
and as early as possible with the re-structuring of the duties, most of the notifications must be
eliminated.”13
The committee suggested seven different rates covering different product categories14 to be in
place latest by March 1998.15 The committee recommended that India’s import weighted duty
rate should come down to 25 per cent by March 1998. The government accepted the Report and
further tariff reform in India was based on these recommendations.16
13Page 1 of Chelliah Committee Final Report on Tax Reforms, Part II (January 1993). 14These categories excluded petroleum products and agriculture subject to quantitative restraints, and non-essential
good that are banned. The categories were dealt with separately in the proposals. 155 per cent for essential goods; 10 to 15 per cent for basic raw materials; 20 per cent for capital goods and parts; 25
per cent for chemical intermediaries; 30 per cent for final products; and 50 per cent for non-essential consumer
products. The committee also recommended the possibility of a time bound surcharge on imports. 16To get a quick idea on some of the changes in India’s customs duties see pages 11, 15 and 16 in International
Monetary Fund (IMF), 1998, “India: Selected Issues”, IMF Staff Country Report Number 98/112.
BROOKINGS INDIA
12 | Trade Policy Reform in India Since 1991
A clear enunciation of the various considerations that underlay India’s tariff reform initiation is
contained in the Budget speech of 1993, and is very instructive to understand the reasoning
behind those changes. The factors enunciated then remain largely relevant even today in terms
of such reform. Relevant excerpts from that speech are reproduced in the Annex I to this paper.
(a) A Major Decrease In Tariffs Over Time, Including Reducing Maximum Tariff Rates
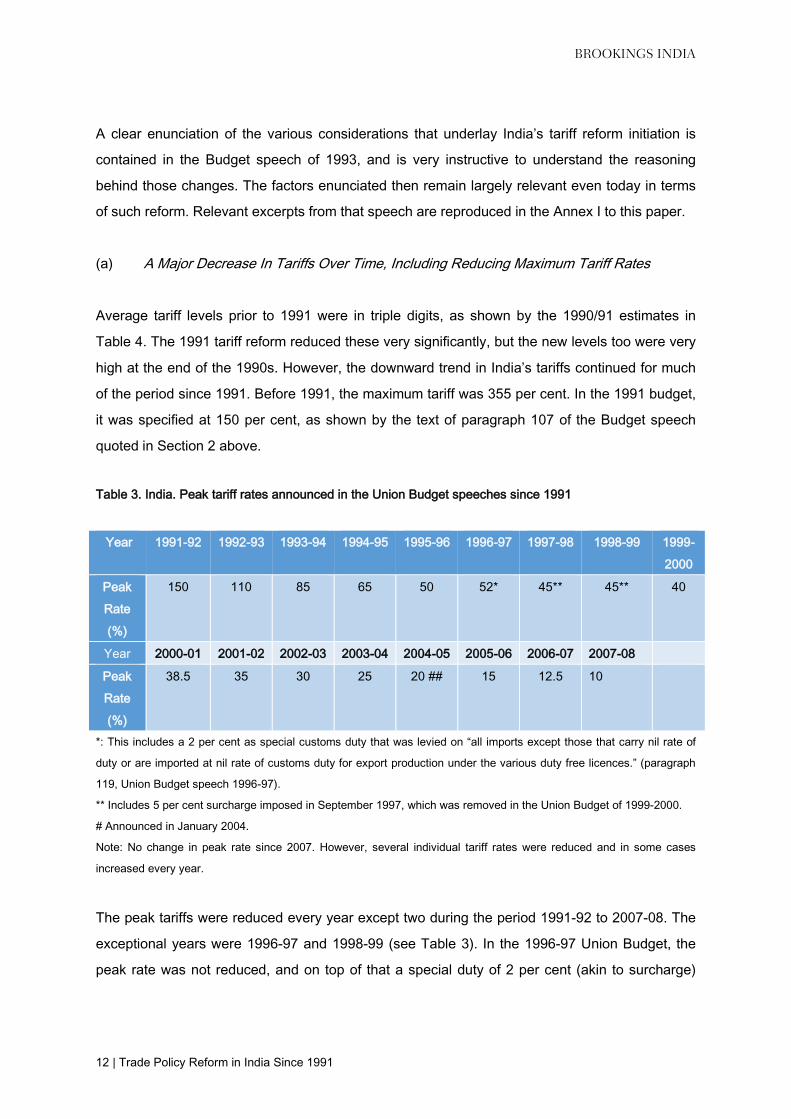
Average tariff levels prior to 1991 were in triple digits, as shown by the 1990/91 estimates in
Table 4. The 1991 tariff reform reduced these very significantly, but the new levels too were very
high at the end of the 1990s. However, the downward trend in India’s tariffs continued for much
of the period since 1991. Before 1991, the maximum tariff was 355 per cent. In the 1991 budget,
it was specified at 150 per cent, as shown by the text of paragraph 107 of the Budget speech
quoted in Section 2 above.
Table 3. India. Peak tariff rates announced in the Union Budget speeches since 1991
Year 1991-92 1992-93 1993-94 1994-95 1995-96 1996-97 1997-98 1998-99 1999-
2000
Peak
Rate
(%)
150 110 85 65 50 52* 45** 45** 40
Year 2000-01 2001-02 2002-03 2003-04 2004-05 2005-06 2006-07 2007-08
Peak
Rate
(%)
38.5 35 30 25 20 ## 15 12.5 10
*: This includes a 2 per cent as special customs duty that was levied on “all imports except those that carry nil rate of
duty or are imported at nil rate of customs duty for export production under the various duty free licences.” (paragraph
119, Union Budget speech 1996-97).
** Includes 5 per cent surcharge imposed in September 1997, which was removed in the Union Budget of 1999-2000.
# Announced in January 2004.
Note: No change in peak rate since 2007. However, several individual tariff rates were reduced and in some cases
increased every year.
The peak tariffs were reduced every year except two during the period 1991-92 to 2007-08. The
exceptional years were 1996-97 and 1998-99 (see Table 3). In the 1996-97 Union Budget, the
peak rate was not reduced, and on top of that a special duty of 2 per cent (akin to surcharge)

BROOKINGS INDIA
13 | Trade Policy Reform in India Since 1991
was added, thus raising the maximum tariff rate. Similarly, in 1998-99, the previous year’s peak
rate plus surcharge was not reduced.
However, in both these budgets, tariffs were reduced for a large number of products.17 While
several tariffs were reduced, some items were also subjected to higher tariffs in line with the
Finance Minister’s statements that: “The gradual reduction of import duties in the past few years
has resulted in certain distortions and anomalies. My proposals seek to correct them as far as
found feasible without causing abrupt disruption in the duty structure.”18
A noteworthy feature of India’s tariff peaks and averages in the early 1990s was that though they
were reduced from high levels, they were high (particularly for non-agriculture) compared with
most tariffs prevailing in economies with low tariffs, e.g. the United States19.
In 1992-93, India’s maximum tariff rate was reduced to 110 per cent, with the exception of
alcoholic beverages and baggage.20 This trend was continued and the peak customs duty in
India was brought down to 50 per cent in 1995-96. The reduction in peak tariffs continued again
every year since 1999-2000 to reach 10 per cent in 2007-08 (See Table 3 and Annex II).
Interestingly, in the early part of the previous decade, more than one Finance Minister signaled
the intention to continue decreasing tariffs. The budget speech in 2004 stated that India would
continue to decrease its tariffs in a measured way, with the intention to align India’s tariff
structure with that of Association of Southeast Asian Nations (ASEAN) countries. This view was
reiterated in 2005, the year when tariffs on 217 items covered under the WTO’s Information
Technology Agreement (ITA) were reduced to zero.
Two interesting features of the reduction in India’s peak tariffs are that:
these peak rates are not necessarily the maximum tariffs prevailing, but the highest rate
for a large proportion of tariff lines (say, 70 per cent or more lines); and,
17See paragraphs 102 to 129 of the 1996-97 Union Budget speech, and 123 to 141 of the 1998-99 Union Budget. 18Paragraph 122 of the 1998 Union Budget speech. For the changes made, see paragraphs 123 to 147 of that speech. 19In the case of the United States, paragraph 9 on page 46 of the WTO’s Trade Policy Review, Secretariat Report 1996
(WT/TPR/S/46), states: “From 1 January 1995, zero m.f.n. rates were applied [by the US] to 18.3 per cent of all tariff
lines, as compared to 15.3 per cent of all tariff lines in 1992. Eighty-three per cent of tariff lines (including ad valorem
equivalents) have tariff rates of 10 per cent or less and 3.8 per cent of tariff lines are subject to rates above 20 per
cent.9 Tariff escalation is not a major feature of U.S. trade policy. However, tariff peaks at above 15 per cent are
concentrated in agricultural, food and tobacco products, as well as in textiles and footwear; above-quota tariffs on
tobacco (reflecting tariffication) are as high as 350 per cent.” 20Paragraph 77 of the speech. Alcoholic beverages and baggage remained the exception in other years as well when
maximum tariff rates were reduced.

BROOKINGS INDIA
14 | Trade Policy Reform in India Since 1991
these rates do not apply to agricultural items. 21
These two aspects are shown in certain parts of Annex II, when the Finance Ministers mentioned
tariffs higher than the peak rate and also that the peak rate reduction applies only to industrial
products.
(b) Reduction in Tariffs Peaks Prepare India’s Pathway to Being A Low Tariff Economy
The sustained focus on reducing tariff peaks has contributed to India moving towards being a low
tariff economy. Table 4 shows that as a result of the tariff changes introduced since the tariff
reform in 1991, India’s simple average tariff in 2015/16 was about one-tenth of that in 1990/91.
Table 4. India: Effective simple average tariff, 1990/91 to 2014/15
(per cent, effective means basic applied tariff rate adjusted for exemptions)
1990/91 1993/94 1995/96 1996/97 1997/98 2010/11 2014/15
Agriculture 113 43 27 26 26 28.8 29.6
Mining 100 70 30 26 25 5.1 5.3
Manufacturing 126 73 42 40 36 11.1 12.1
Whole Economy 125 71 41 39 35 12 13
Source: WTO, Trade Policy Reviews of India – Secretariat Reports, various years
Notes: 1990/91 average tariffs are prior to tariff reform. The estimates include auxiliary duty mostly of 45 per cent.
Auxiliary duty was the same as customs duty, i.e. it was an additional custom duty over and above the basic custom
duty. Therefore, simplification of the basic custom duty regime would have meant that duty to be merged with auxiliary
duty. In 1993/94 budget, the auxiliary duty was merged with the basic custom duty (See Annex II).
On the basis of these estimates, with about 13 per cent simple average applied Most Favoured
Nation (MFN) tariffs, India today is close to the upper part of the range of tariffs in ASEAN
economies.22 If we consider only the MFN tariffs, then it would appear that considerable further
tariff reduction would be required if India aims to reach the middle part of the ASEAN tariff
structure, with average applied MFN tariffs of Indonesia, Malaysia, Myanmar and the Philippines
ranging between 5.6 per cent and 6.9 per cent.
21Thus, Indian announcement of a peak rate reduction is different from the general use of the term “peak tariff” which
denotes the highest tariff levels in the tariff schedule. 22This includes Thailand (11.6 per cent), Cambodia (11.2 per cent), Laos (10 per cent) and Vietnam (9.5 per cent).
BROOKINGS INDIA
15 | Trade Policy Reform in India Since 1991
However, an important point to bear in mind is that though the tariff averages for India based on
MFN tariffs and certain adjustments show relatively high tariffs, the actual applied average tariffs
which encompass all concessions and exemptions are shown by estimating the customs tariffs
per unit imports. We can see the difference between the usual estimates of tariffs and those
based on customs duties from the information provided in Tables 4 and 5.
Thus, if we alternatively consider the weighted average tariff based on customs revenues for
India, the picture is very different. In terms of its weighted average tariff, India is already one of
the low tariff economies in the world.
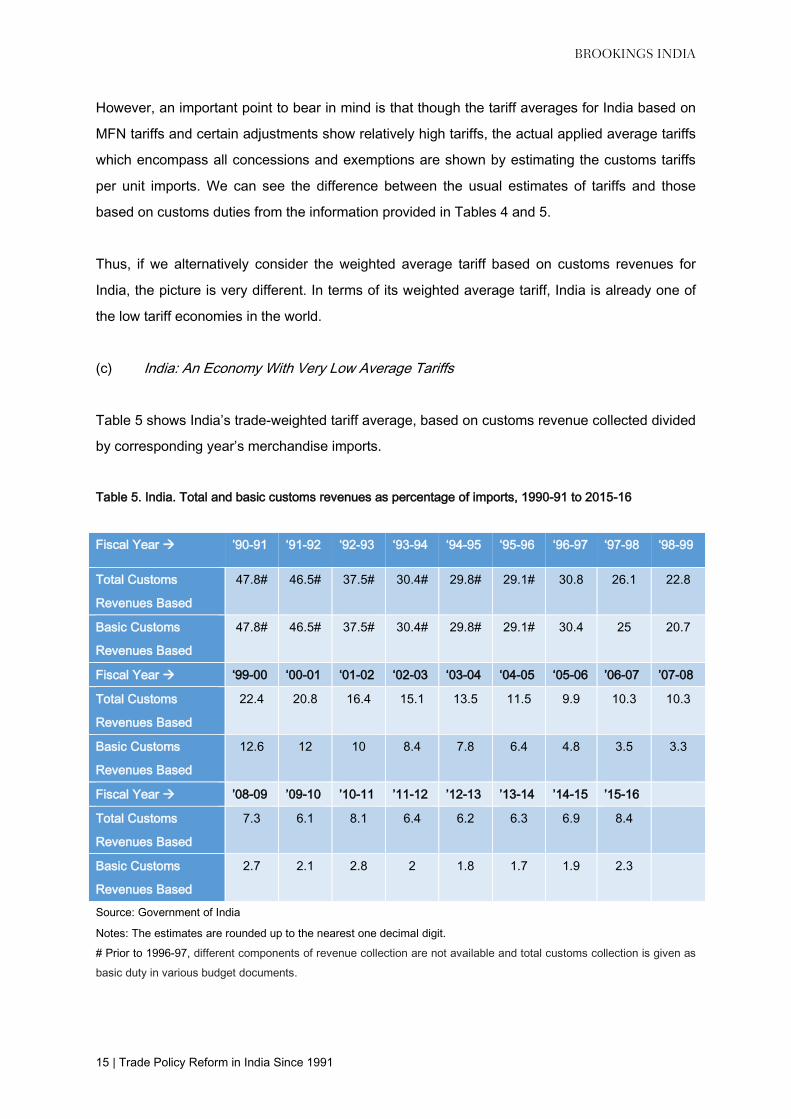
(c) India: An Economy With Very Low Average Tariffs
Table 5 shows India’s trade-weighted tariff average, based on customs revenue collected divided
by corresponding year’s merchandise imports.
Table 5. India. Total and basic customs revenues as percentage of imports, 1990-91 to 2015-16
Fiscal Year ’90-91 ‘91-92 ‘92-93 ‘93-94 ‘94-95 ‘95-96 ‘96-97 ‘97-98 ‘98-99
Total Customs
Revenues Based
47.8# 46.5# 37.5# 30.4# 29.8# 29.1# 30.8 26.1 22.8
Basic Customs
Revenues Based
47.8# 46.5# 37.5# 30.4# 29.8# 29.1# 30.4 25 20.7
Fiscal Year ‘99-00 ‘00-01 ‘01-02 ‘02-03 ‘03-04 ‘04-05 ‘05-06 ’06-07 ’07-08
Total Customs
Revenues Based
22.4 20.8 16.4 15.1 13.5 11.5 9.9 10.3 10.3
Basic Customs
Revenues Based
12.6 12 10 8.4 7.8 6.4 4.8 3.5 3.3
Fiscal Year ’08-09 ’09-10 ’10-11 ’11-12 ’12-13 ’13-14 ’14-15 ’15-16
Total Customs
Revenues Based
7.3 6.1 8.1 6.4 6.2 6.3 6.9 8.4
Basic Customs
Revenues Based
2.7 2.1 2.8 2 1.8 1.7 1.9 2.3
Source: Government of India
Notes: The estimates are rounded up to the nearest one decimal digit.
# Prior to 1996-97, different components of revenue collection are not available and total customs collection is given as
basic duty in various budget documents.

BROOKINGS INDIA
16 | Trade Policy Reform in India Since 1991
Table 5 shows two estimates relating to customs revenues as a proportion of import value in that
year. “Total customs revenue” includes both tariffs and the countervailing duties (CVD) on
imports, the latter being imposed on imports in lieu of domestic excise tax. “Basic custom
revenue” shows the revenue from only tariffs, i.e. it excludes revenues due to CVD – see section
(h) below for discussion of CVD. To examine the average level for only tariffs, we should
consider the estimates based on basic customs revenues.
We can see that after 1991, a large fall in weighted average applied tariffs (without CVD) took
place till end 1990s, reaching about 13 per cent of a tariff level of almost 50 per cent. From 2005-
06 onwards, India’s average tariffs based on total customs duties collected was mostly in single
digits; average tariffs in terms of basic customs duties were in single digits from 2002-03 itself. It
is noteworthy that the average customs duty corrected for CVD is below 2 per cent in the years
from 2012-13 to 2014-15.23
The difference between CVD and actual tariff rates started increasing in the late 1990s and has
continued till today, showing a preponderance of CVD in total customs duties of India.
It should be noted that the estimates of tariffs given in other Tables are not strictly comparable to
those calculated on the basis of customs revenue shown in Table 5. The other tariff estimates
are based on MFN tariffs or adjustments made to the MFN tariffs for concessions. The estimates
in Table 5 are a composite estimate taking account of all aspects of concessions in an aggregate
way.
The customs revenue based weighted average tariff for the United States is 1.5 per cent,
computed on the basis of dividing the U.S. customs revenue by its merchandise imports.24 The
estimate for India is not too different from that of the United States, which is one of the low
average tariff economies.
This shows that India is far more open than what has normally been perceived till now, in terms
of tariffs.
23An important reason for the increase in weighted average tariffs increased in 2015-16 was the decline in import share
of petroleum (a low tariff item), due to the oil price de crease. 24The data can be seen from WTO, Trade Profiles 2016, page 378 for imports; and, for customs revenue from Table 2.5
of the publication, Office of Management and Budget, Fiscal Year 2017 Historical Tables of the U.S. government. For
the latter, see https://www.whitehouse.gov/sites/default/files/omb/budget/fy2017/assets/hist.pdf. For the former, see
WTO, ‘Trade Profiles’, 2016. Available at: https://www.wto.org/english/res_e/booksp_e/trade_profiles16_e.pdf
BROOKINGS INDIA
17 | Trade Policy Reform in India Since 1991
(d) Does The Picture Change Due To A Downward Bias of Trade Weighted Average Tariff?
The weighted average tariff estimates in Table 5 are downwards biased because of relatively
lower imports of products with higher tariffs. This estimate does, nonetheless, provide a
reasonable indication of the overall qualitative low tariff level, particularly if most of tariff lines are
in the lower range of tariffs. This is the situation for India, which has a large share of its tariff lines
with low tariffs.
Table 6 below shows that 13 per cent of agriculture tariff lines and 90 per cent of non-agriculture
tariff lines are with tariffs of 10 per cent or below.25 Internationally, most of the focus of tariff
liberalization is towards non-agriculture products, which in India’s case have an overwhelming
share of their tariffs between zero and 10 per cent. For example, even within the TPP, immediate
tariff elimination applied only to 70 per cent (Vietnam) to 100 per cent (Singapore) of non-
agriculture tariff lines, but in the case of agriculture tariff lines this ratio was 42.6 (Vietnam) to 100
(Singapore) per cent; in the case of Japan and the United States, immediate elimination under
TPP was agreed only for, respectively, 51.3 and 55.5 per cent of their agriculture tariff lines.26
Annex Table 1 shows the relatively few non-agriculture tariff lines in India that are above 10 per
cent. Annex Table 2 suggests that most of these non-agricultural products with tariffs above 10
per cent, are not likely to be among major traded items for India. We see from Annex Table 2
that the overall import share of non-agricultural products with tariffs above 10 per cent in total
imports is 4.54 per cent. Of these, iron and steel and articles of iron and steel (HS categories 72
and 73, with tariff of 15 per cent) account for 3.93 per cent. The rest of the products account for
only about 0.6 per cent of total imports. The combined impact of a reduction in tariffs for these
items and the consequent rise in their imports is unlikely to contribute to a significant increase in
India’s weighted average tariff.27
Therefore, it would be reasonable to consider that the low average weighted tariff shown in Table
5 gives a correct message about India’s effective tariffs, namely that on average, India is a low
tariff economy similar to some of the developed economies that are seen as more open in terms
of their low tariffs.
25Non-agriculture tariff lines account for 86 per cent of India’s total tariff lines. 26See, Global Agenda Council on Trade & FDI, 2016, Will the Trans-Pacific Partnership Agreement Reshape the Global
Trade and Investment System? What’s In and What’s New: Issues and Options”, World Economic Forum, pages 6 and
7. 27Any decrease in current tariff of the high tariff item, say the tariff falls by 1/X times, will require a multiple of “X times”
increase in imports of the product concerned, say “Y” times, where Y/X is greater than one, for the overall average tariff
to rise. Even in that situation, the increase in overall tariff would be mitigated by the very small import share of the
product, i.e. the average total tariff would increase by a very small fraction of Y/X. Furthermore, such situations are also
valid for the other countries with very low average tariffs, in that they too have some products with high tariffs.

BROOKINGS INDIA
18 | Trade Policy Reform in India Since 1991
An important message from this estimate is that we need to revise the general impression that
average tariffs in India are significantly higher compared with those in other large countries. The
average tariffs of India are close to those prevailing amongst the economies which are
considered to be the lowest tariff economies.
(e) India: Different Tariff Patterns For Agriculture And Non-Agriculture Products
The profile of tariff distribution across agriculture and non-agriculture products (Table 6) show the
greater tariff protection provided by India to its agriculture. This is not unusual, as can be seen
for several developed economies as well, including the United States and very much the EU.28
India’s agriculture tariffs were affected by two very important events at the WTO, one which
increased the extent of tariffs and another which reduced them.
The first was the fact that under the Uruguay Round results, all non-tariff measures of
agriculture, for all WTO members, were converted into tariffs. The WTO Agreement allowed this
for certain developing countries (including India) under the so-called “ceiling binding” scheme
under the Agreement on Agriculture concluded in the Uruguay Round.29 This implied that the
prevailing tariffs for agriculture in India were increased at the end of Uruguay Round to replace
the prevailing quantitative restrictions by tariffs.
The second was a significant development which led to a further liberalisation of India’s tariff and
non-tariff regime, namely the Balance of Payments (BOP) related dispute which India lost at the
WTO. Loss in that dispute meant India did not have the possibility to claim under WTO that it
was entitled to implement higher trade restrictions than those allowed in WTO under normal
circumstances, on the grounds that it faced a BOP problem.30 Though the focus of the dispute
brought by the United States was on quantitative restrictions, it also led to a reduction in a
number of tariffs.31 This added to the momentum of changes brought about through a general
emphasis on reducing tariffs by successive finance ministers.
28 See pages 81 and 175 of the World Tariff Profiles 2016 for the spread of tariffs in the EU and the United States.
Availble at: https://www.wto.org/english/res_e/booksp_e/trade_profiles16_e.pdf 29 For more detail on “ceiling binding”, see R. Sharma, “Preparing for Negotiating Further Reductions of Bound Tariffs”,
FAO. For a comparison of India’s ceiling bindings with other developing countries, see Table 2 of this 30 If there is a balance of payments problem, then Article XVIII(b) of GATT allows developing countries to breach
commitments under WTO and impose higher trade restrictions than allowed under WTO under normal conditions
without balance of payments problem. 31 The maximum period for implementing the decrease the relevant tariffs following loss in the dispute was April 1, 2001.
See WTO Dispute Settlement - DS90.

BROOKINGS INDIA
19 | Trade Policy Reform in India Since 1991
The combination of the “ceiling binding” and concern to provide high tariff protection to
agriculture has led to relatively higher tariffs for these products compared to non-agriculture.
Thus, a closer look at India’s tariff structure shows that India’s overall average tariffs are low
primarily because of the low tariffs for non-agricultural products and their large share in total
imports (see Table 6 below). The weighted average tariff for agriculture is increased32 both due
to a preponderance of significant share of agricultural tariff lines with higher tariffs and the larger
share of imports subject to these higher tariffs (Table 6).
Table 6. India. MFN tariffs for agriculture and non-agriculture (2015) and import shares (2014) for different
tariff ranges (%)
MFN Tariff Range (%)
Tariff Lines:
Agriculture (%)
Tariff Lines: Non-
Agriculture (%)
% Imports:
Agriculture
% Imports:
Non-Agriculture
Duty free 5.3 2.5 8.1 35
0 to 5 3.5 9.8 19.6 20.6
Above 5 & upto 10 4.3 77.7 7 43.8
Above 10 & upto 15 5.4 1.4 4.3 0.2
Above 15 & upto 25 4.1 1.7 3.1 0.3
Above 25 & upto 50 67 5.8 22.5 0.1
Above 50 & upto 100 8.3 0.4 33.8 0.1
Above 100 2.2 0 1.6 0
Source: WTO, ITC and UNCTAD, 2016, World Tariff Profiles 2016. Page 96
Note: For current high tariffs for non-industrial products, see Annex Tables. 1 and 2. For detailed tariffs for each tariff
line, see Tariffs 2015-2016, CBEC
These estimates show that the conventional view that India is a high tariff economy is incorrect
even for most tariff lines with MFN tariffs. The tariff estimates in Table 6 suggest that Indian MFN
average tariffs for non-agriculture products too are likely to be close to that of economies which
are considered very open in terms of their tariff regime.
(f) Comparison of India’s Average MFN Tariffs With Tariffs Of APEC Economies
32 India’s trade weighted average MFN tariff in 2015 was 47.2 per cent for agriculture and 4.9 per cent for non-
agriculture. See, WTO, International Trade Center (ITC) and United Nations Conference on Trade and Development
(UNCTAD), 2016, World Tariff Profiles 2016. Page 96.
BROOKINGS INDIA
20 | Trade Policy Reform in India Since 1991
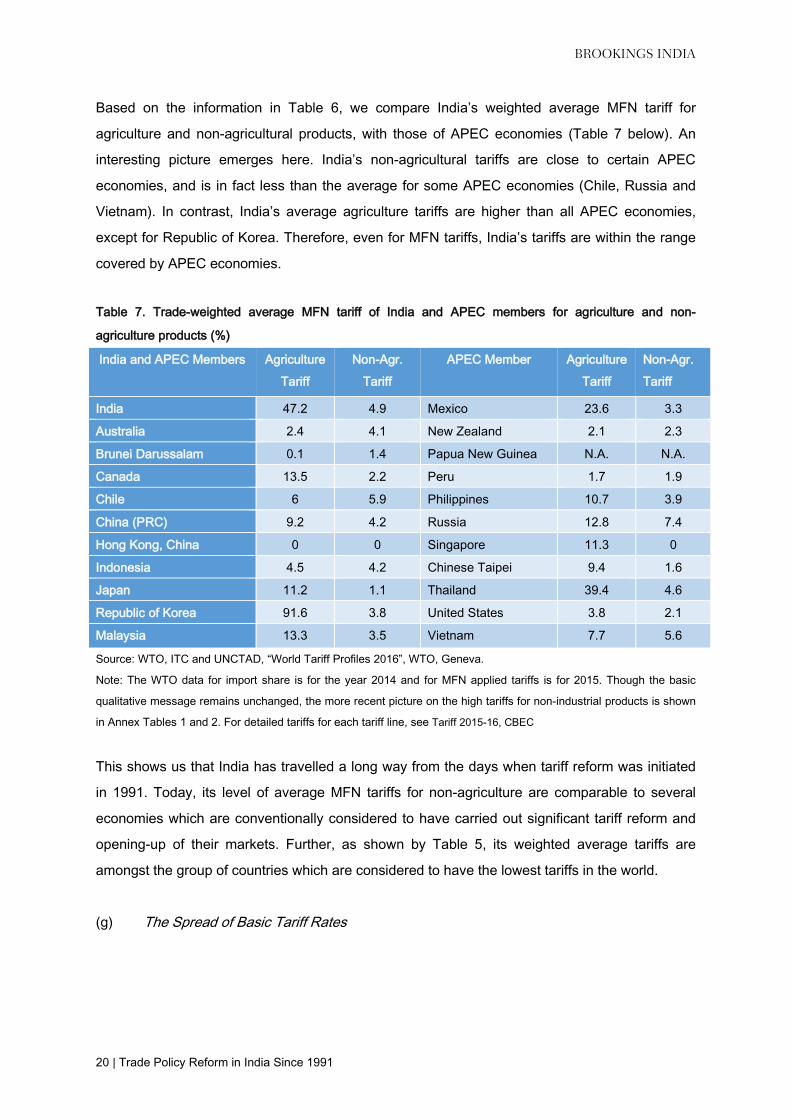
Based on the information in Table 6, we compare India’s weighted average MFN tariff for
agriculture and non-agricultural products, with those of APEC economies (Table 7 below). An
interesting picture emerges here. India’s non-agricultural tariffs are close to certain APEC
economies, and is in fact less than the average for some APEC economies (Chile, Russia and
Vietnam). In contrast, India’s average agriculture tariffs are higher than all APEC economies,
except for Republic of Korea. Therefore, even for MFN tariffs, India’s tariffs are within the range
covered by APEC economies.
Table 7. Trade-weighted average MFN tariff of India and APEC members for agriculture and non-
agriculture products (%)
India and APEC Members Agriculture
Tariff
Non-Agr.
Tariff
APEC Member Agriculture
Tariff
Non-Agr.
Tariff
India 47.2 4.9 Mexico 23.6 3.3
Australia 2.4 4.1 New Zealand 2.1 2.3
Brunei Darussalam 0.1 1.4 Papua New Guinea N.A. N.A.
Canada 13.5 2.2 Peru 1.7 1.9
Chile 6 5.9 Philippines 10.7 3.9
China (PRC) 9.2 4.2 Russia 12.8 7.4
Hong Kong, China 0 0 Singapore 11.3 0
Indonesia 4.5 4.2 Chinese Taipei 9.4 1.6
Japan 11.2 1.1 Thailand 39.4 4.6
Republic of Korea 91.6 3.8 United States 3.8 2.1
Malaysia 13.3 3.5 Vietnam 7.7 5.6
Source: WTO, ITC and UNCTAD, “World Tariff Profiles 2016”, WTO, Geneva.
Note: The WTO data for import share is for the year 2014 and for MFN applied tariffs is for 2015. Though the basic
qualitative message remains unchanged, the more recent picture on the high tariffs for non-industrial products is shown
in Annex Tables 1 and 2. For detailed tariffs for each tariff line, see Tariff 2015-16, CBEC
This shows us that India has travelled a long way from the days when tariff reform was initiated
in 1991. Today, its level of average MFN tariffs for non-agriculture are comparable to several
economies which are conventionally considered to have carried out significant tariff reform and
opening-up of their markets. Further, as shown by Table 5, its weighted average tariffs are
amongst the group of countries which are considered to have the lowest tariffs in the world.
(g) The Spread of Basic Tariff Rates

BROOKINGS INDIA
21 | Trade Policy Reform in India Since 1991
In 2015/16, the range of maximum MFN tariffs for the different chapters covering agriculture33 is
from 30 per cent to 150 per cent. Within this group, the most common maximum tariff is either 30
per cent or 100 per cent. For the non-agriculture products34, Annex Table 1 shows that the
highest maximum MFN tariffs apply to motor vehicles (125 per cent).
For most tariff lines, a peak MFN applied tariff of 10 per cent is the common rate. As shown by
Table 6, about 78 per cent of tariff lines for non-agriculture products are between 5 to 10 per
cent; 90 per cent of India’s tariff lines on non-agriculture products are in the range zero to 10 per
cent.
Annex Table 1 shows a large dispersion amongst the relatively higher tariffs for non-agricultural
items, with ten different rates ranging from 12.5 to 125 per cent (without considering the rates for
personal baggage). This indicates the possibility of rationalising this tariff structure to both reduce
the number of tariffs rates and to simplify the tariff regime. In this context, it is worth recalling the
Chelliah Committee Report of 1993 which had recommended a smaller number of basic tariff
rates even in the early phase of reform, in comparison to the present spread of tariffs.
The Chelliah Committee reports stated: “A large number of rates not only create administrative
problems, but leads to non-transparency in the degrees of effective protection given to different
products as well as to distortions in the allocation of resources. By keeping only a limited number
of rates, we shall render administration of the tariff a fairly easy task, and by limiting the spread,
we shall minimise distortions…. We are recommending that by 1997 or 1998 March end, the
structure of ad valorem rates of duties in place should be: 5, 10, 15, 20, 25 and 30. In addition,
when non-essential consumer goods are allowed to be imported, there should be another “slot”
for them, namely, 50 per cent.”35
The number of basic tariff rates have come down in a major way, from 22 different basic tariff
rates in 1991-92, to only 4 by 2001-2002.36 We can see from Annex Table 1, that the number of
these different basic tariff rates have gone up since the early 2000s.
33 These include chapters 1 to 24 of HS nomenclature. 34 The definition of agriculture is as used by the WTO in its data on World Tariff Profiles. 35 Page 4 of the final report. It is interesting that the committee recommended not to have any zero duties. In the world
of today with free trade areas and a recognition of the importance of imports in both domestic and international value
chains at a time of intense international competition, this would seem to be a proposition that would need
reconsideration. 36 See, Table 3 of Montek S. Ahluwalia, 2002, “Economic Reforms in India Since 1991: Has Gradualism Worked?”, The
Journal of Economic Perspectives, Volume 16, Number 3, pages. 67-88.
BROOKINGS INDIA
22 | Trade Policy Reform in India Since 1991
This suggests that the current spread of tariff rates is an obvious area to focus for tariff reform.
(h) Auxiliary duties, additional duties, special additional duties, and surcharges
Before 1991, India imposed high auxiliary duties on imports. These were merged with basic
tariffs and the overall combined tariff level (basic rate plus auxiliary inclusive of specific duties)
was capped at the rate specified in the budget: 150 per cent in 1991, 110 per cent in 1992, and
so on as discussed earlier. In the 1993 Union Budget, the government merged the auxiliary duty
with basic duty rate, thus doing away with the auxiliary duty.
In addition to basic customs duty, all goods imported into India are subject to additional duty of
customs, popularly known in India as “CVD”.37 This additional duty of customs equivalent to
excise duty38, and is refundable through the credit provided under the CENVAT scheme.39
Further, imported goods are also subject to special additional duty of customs, popularly known
in India as “SAD”. This SAD is levied in lieu of State taxes, local taxes or any other charges40.
The additional duty and special additional duty on imports have continued to be part of the import
duty regime in different years. This is supposed to be in lieu of internal tax, in order to provide a
level playing field for domestic producers. The tax system allows crediting these taxes back if the
product is used as a part of the value chain and subsequent enters domestic sales as an input.
From time to time, the government has changed the additional and special additional duties, and
imposed surcharges. For example, special duty of 2 per cent was imposed in the 1996-97 Union
Budget41, which was raised to 5 per cent in September 1997. This was discontinued in the
Budget of 1999-2000. Nonetheless, a uniform surcharge of 10 per cent of the basic duty was
imposed on many products. The proportion of additional and special additional duties in total
charges on imports at the border was small when tariffs were high. With a decrease in tariffs
where bulk of them are not over 10 per cent, the significance of CVD and SAD has increased in
the total charges at the border.
37 This CVD is different from the countervailing (or anti-subsidy duties) which are imposed to counter the adverse effects
of subsidized imports which cause material injury to domestic industry. 38 This imposed under Section 3, Sub-section 1 of Customs Tariff Act 1975.For an explanation, see page 1 onwards the
Act given in the General Notes section. 39 “Under the Cenvat Scheme, a manufacturer of final product or provider of taxable service shall be allowed to take
credit of duty of excise as well as of service tax paid on any input received in the factory or any input service received
by manufacturer of final product.” See, Business Portal of India : Taxation : Value Added Tax (VAT). 40 This imposed under Section 3, Sub-section 5 of Customs Tariff Act 1975.For an explanation, see page 5 onwards the
Act given in the General Notes section in The Customs Tariff Act , 1975 ( 51 Of 1975 ). 41 See paragraph 119 of the Budget Speech 1996-97.

BROOKINGS INDIA
23 | Trade Policy Reform in India Since 1991
(i) Devaluation/Depreciation of the Rupee
An important point to note is that, increased protection is provided to domestic production
because of high tariffs as well as depreciation of the currency. The value of the Indian rupee fell
in comparison to the US dollar, at the same time when India’s average tariffs declined (Chart 1).
In 1991, the reduction in tariffs announced through the Budget was cushioned due to a
devaluation of the Indian rupee, with a two-step downward exchange rate adjustment by 9 per
cent and 11 per cent between July 1 and 3, 1991 to counter the massive draw down in the
foreign exchange reserves, to install confidence in the investors and to improve domestic
competitiveness.42 In March 1992, India established the “Liberalised Exchange Rate
Management System” (LERMS) with a dual exchange rate system for one year.
Chart 1 below shows that the period till 1992-93 saw a devaluation of the rupee which more than
compensated for the reduction in India’s trade weighted average tariff reduction.
A unified exchange rate system was established in March 1993, with the exchange rate system
moving from adjustable peg to market based exchange rate for trading. As stated in the Union
Budget speech of 1993-94:
“last year, … a dual exchange rate regime was introduced, and import licensing was
eliminated on most items of capital goods, raw materials, intermediates and components.
These items became freely importable against foreign exchange purchased in the
market. The system has worked fairly well and the market exchange rate has been
remarkably stable. The existence of a dual rate, however, hurts exporters and other
foreign exchange earners who have to surrender 40 per cent of their earnings at the
official rate, getting the benefit of the higher market rate on only 60 per cent. Many
exporters have said that this amounts to a tax on exporters of goods and services whose
continuation cannot be justified at a time when exports must receive our fullest support.
There is merit in this point of view, and the experience of the past year gives ground for
confidence that we can unify the exchange rate and still manage the balance of
payments with a reasonable degree of stability in the exchange rate. The Government
has therefore decided to eliminate the dual rate arrangement. All exporters, as well as
other foreign exchange earners such as our workers abroad, will henceforth be allowed
42 For more details, see Pami Dua and Rajiv Ranjan, “Exchange Rate Policy and Modelling in India”, RBI Development
Research Group, Study Number 33.
BROOKINGS INDIA
24 | Trade Policy Reform in India Since 1991
to convert 100 per cent of their earnings at the market rate. All imports will also
henceforth have to be paid for at the market rate.” (paragraph 26)
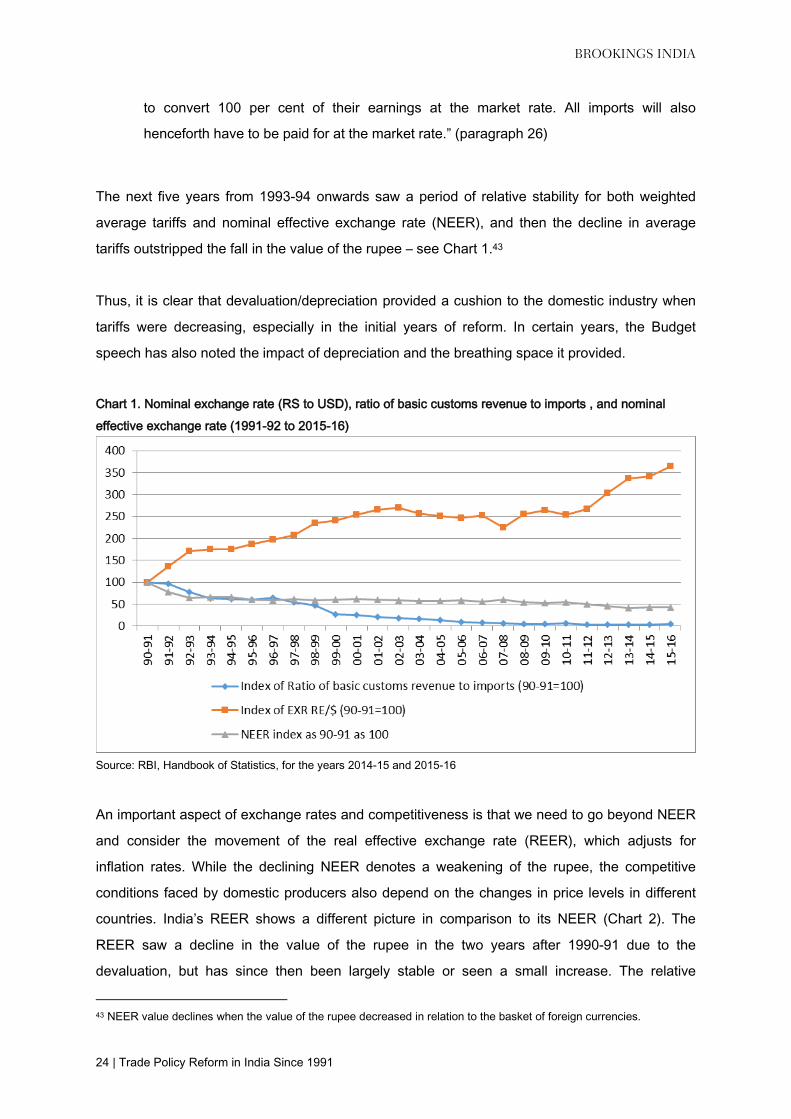
The next five years from 1993-94 onwards saw a period of relative stability for both weighted
average tariffs and nominal effective exchange rate (NEER), and then the decline in average
tariffs outstripped the fall in the value of the rupee – see Chart 1.43
Thus, it is clear that devaluation/depreciation provided a cushion to the domestic industry when
tariffs were decreasing, especially in the initial years of reform. In certain years, the Budget
speech has also noted the impact of depreciation and the breathing space it provided.
Chart 1. Nominal exchange rate (RS to USD), ratio of basic customs revenue to imports , and nominal
effective exchange rate (1991-92 to 2015-16)
Source: RBI, Handbook of Statistics, for the years 2014-15 and 2015-16
An important aspect of exchange rates and competitiveness is that we need to go beyond NEER
and consider the movement of the real effective exchange rate (REER), which adjusts for
inflation rates. While the declining NEER denotes a weakening of the rupee, the competitive
conditions faced by domestic producers also depend on the changes in price levels in different
countries. India’s REER shows a different picture in comparison to its NEER (Chart 2). The
REER saw a decline in the value of the rupee in the two years after 1990-91 due to the
devaluation, but has since then been largely stable or seen a small increase. The relative
43 NEER value declines when the value of the rupee decreased in relation to the basket of foreign currencies.

BROOKINGS INDIA
25 | Trade Policy Reform in India Since 1991
competitiveness of the rupee has thus not improved even though a substantial fall in the value of
the rupee has taken place in nominal terms.
Chart 2. India. Real effective exchange rate (REER) and nominal effective exchange rate (NEER), 1990-91
to 20015-16
Source: RBI, Handbook of Statistics, for the years 2014-15 and 2015-16
(j) Simplification of tariff regime
The 2002-03 budget expressed a vision that, “by the year 2004-05, there would be only two
basic rates of customs duties, namely, 10 per cent covering generally raw materials,
intermediates and components and 20 per cent covering generally final products.”
Over time, different Finance Ministers have reduced the number of tariff slabs, but India still has
a large number of them. Nonetheless, two very important changes have taken place over time.
One, there is a concentration of tariffs in a single, small range: about 72 per cent of tariffs are in
the range 5 to 10 per cent tariffs; for non-agriculture products, the share is about 78 per cent. In
contrast, the largest concentration in 1993 was with tariff ranges of 30 to 40 per cent and 80 to
90 per cent, each with about a quarter of the total tariff lines. Second, most tariff lines are with
tariffs at 10 per cent or below.44
44 Tariffs above 10 per cent are only for 14.8 per cent of total lines. Of these, 9.7 per cent of the tariff lines are in the
range 25 to 30 per cent.

BROOKINGS INDIA
26 | Trade Policy Reform in India Since 1991
Thus, in effect, the Indian tariff structure has been considerably simplified compared with earlier.
However, we are still far from the vision expressed in the 2002-03 budget, and more needs to be
done to further simplify the tariff structure.45
(k) Structure of tariff escalation
The Chelliah Committee Report had proposed its tariffs with a view to have tariff escalation or
effective protection for domestic industry, with inputs or products at lower stages of processing
having lower tariffs than final products. For average tariffs, this was achieved by 1996/97 and
1997/98 (Table 8). However, compared to the late 1990s, the tariffs on unprocessed products did
not decrease much but those on semi-processed and processed manufactured products
decreased significantly. This led to a reduction in effective protection; in fact, one of the concerns
of some industries in India is that the tariffs on their inputs are higher than the tariffs on finished
products. This is one of the areas of tariff reform that remains incomplete.
Table 8. India: Effective simple average tariff by stage of processing in manufacturing 1990/91 to 2014/15
(per cent, effective means basic tariff rate adjusted for exemptions)
1990/91 1993/94 1995/96 1996/97 1997/98 2010/11 2014/15
Unprocessed 107 50 27 25 25 22.5 23.5
Semi-processed 122 75 44 38 35 8.6 9
Processed 130 73 43 42 37 12.2 13.6
Source: WTO, Trade Policy Reviews of India – Secretariat Reports, various years
(l) Tariff concessions
Tariff concessions were quite pervasive when reform began in 1991. They made the tariff
scheme complex and non-transparent, with tariffs for specific product categories often linked to
end-use aimed at social, industrial, economic and industrial use for tariff classifications at six,
eight or ten tariff lines. Over time, the scope of these was enhanced when free trade zones were
established. In line with duty drawback or refund schemes across the world for imported and
domestic inputs used in exports, India also provides other concessions when a product is
exported.46 The proportion of this aspect of concessions has increased over time as the share of
45 See for example, the tariff changes introduced by the 2016 Union Budget in the Table from page 53 onwards in the
Union Budget 2016-17 and the tariff schedules given in Tariffs 2015-16, CBEC. 46 See for example, http://www.indianindustry.com/trade-information/export-incentives.html , or
https://fieo.org/view_section.php?lang=0&id=0,30

BROOKINGS INDIA
27 | Trade Policy Reform in India Since 1991
imports in India’s exports has increased. Analysis of Indian products as part of global value
chains shows that: “The foreign content of India's exports has increased significantly in the last
two decades, more than doubling from under 10 per cent in 1995 to 24 per cent in 2011”.47
Even today, India continues to have a number of concessions in its tariff regime. Though less
than earlier, they are still a part of the system, introducing unpredictability and lack of
transparency.
(m) Lower tariffs due to free trade agreements (FTAs)
With the ongoing WTO negotiations facing a deadlock, the focus of trade negotiations has
moved towards FTAs. For both strategic and economic reasons, therefore, India will have to
focus on FTA while being active in improving the substantive content of the work in WTO.
In the early 1990s, India had few Free Trade Agreements (FTAs) or Preferential Trade
Agreements (PTAs).48 Over time, these have increased and the proliferation of FTAs has been
supplemented by larger agreements in the form of Comprehensive Economic Partnership
Agreement (CEPA) or Comprehensive Economic Cooperation Agreement (CECA) which cover
many more areas than conventional market opening under FTAs. Most of the significant Indian
FTAs/PTAs have been implemented in this century, in general from 2005 onwards. The
agreements prior to 2005 were with relatively small coverage or less deep than the more
comprehensive economic partnership agreements later; the first CECA was with Singapore, in
2005.49 In addition, India provides preferential schemes for least developed countries.
The situation for India is summarised in a government note on FTAs as follows: “India has
preferential access, economic cooperation and Free Trade Agreements (FTA) with about 54
individual countries. India has signed bilateral trade deals in the form of Comprehensive
Economic Partnership Agreement (CEPA)/ Comprehensive Economic Cooperation Agreement
(CECA)/FTA/Preferential Trade Agreements (PTAs) with some 18 groups/countries. India is a
late, and cautious, starter in concluding comprehensive preferential tariff agreements covering
substantially all trade with some of its trading partners.”50
47See OECD-WTO (2015). Trade In Value Added: India. Available at:
https://www.oecd.org/sti/ind/tiva/CN_2015_India.pdf 48It signed the “India - Bhutan Agreement on Trade, Commerce and Transit” in January 1972; Asia Pacific Trade
Agreement in 1975; Global System of Trade Preferences in 1988. 49 See ‘Signing Of FTAs 2014, Ministry of Commerce and Industry’ 50See page 4 of Department of Commerce, Government of India, “Free Trade Agreements. Frequently Asked
Questions”, April 9, 2014.
BROOKINGS INDIA
28 | Trade Policy Reform in India Since 1991
The different agreements lead to diverse rules of origin criteria for imports from different sources.
This causes additional costs of trading and confusion in carrying out international trade,
particularly for small and medium enterprises.
These preferential or free trade initiatives have resulted in much lower tariffs faced by a number
of India’s trading partners, a feature likely to increase further with new FTAs such as the
Regional Comprehensive Economic Partnership Agreement (RCEP).
The combined effects on tariff decline due to MFN tariff reductions over time, exemptions on
tariffs and to some extent the impact of FTAs/PTAs on tariffs can be seen in Table 5 above.
Another way of considering the overall situation regarding the impact of concessions on tariffs is
to consider the difference between the average MFN tariff and the average tariff reflected by
basic customs revenue collected. Table 9 shows this difference between these two estimates.
We can see that even though the average MFN tariff of India has decreased very significantly
over time, the difference between India’s MFN tariffs and trade weighted tariff average calculated
from basic customs revenue is almost as much as the MFN simple tariff average itself.

BROOKINGS INDIA
29 | Trade Policy Reform in India Since 1991
Table 9. India. MFN tariff simple average, trade-weighted average, tariff based on basic customs revenue
collected, and difference between MFN average and trade-weighted average tariff (%)
Fiscal Year ‘99-00 ‘00-01 ‘01-02 ‘02-03 ‘03-04 ‘04-05 ‘05-06 ’06-07 ’07-08
MFN Tariff Simple
Average
36.6 34.9 30.6 26.9 29.5 19.2 16.8 17.2 12.8
Ratio Basic Customs
Revenues To
Imports
12.6 12 10 8.4 7.8 6.4 4.8 3.5 3.3
Difference Between
MFN and Weighted
Avg. Tariffs
24 22.9 20.6 18.5 21.7 12.8 12 13.7 9.5
Fiscal Year ’08-09 ’09-10 ’10-11 ’11-12 ’12-13 ’13-14 ’14-15 ’15-16
MFN Tariff Average 13.1 12.5 13.4 14 13.9 13.5 13.4
Ratio Basic Customs
Revenues To
Imports
2.7 2.1 2.8 2 1.8 1.7 1.9 2.3
Difference Between
MFN and Weighted
Avg. Tariffs
10.4 10.4 10.6 12 12.1 11.8 11.5
Source: WTO, and Table 5 above.
Though the estimates of simple average MFN tariff and weighted average tariff are not directly
comparable, this difference does qualitatively indicate the large combined effect of tariff reduction
resulting from concession schemes and the FTAs.51 Two insights seem relevant from this
information.
One, that any judgement of the tariff regime of India based on the MFN tariffs would not be
appropriate. Second, that there is a large potential for simplifying the existing tariff regime, and
providing more transparent forms of lower tariffs.
51In this context, it is worthwhile to recall the analysis earlier in the paper to show that reduction of tariffs for high tariff
items will not likely increase average trade weighted tariff in a major way.

BROOKINGS INDIA
30 | Trade Policy Reform in India Since 1991
7. Non-Tariff Measures
India’s non-tariff measures are mainly contingency trade protection measures (anti-dumping,
countervailing measures and safeguards), Technical Barriers to Trade (TBT) and Sanitary and
Phytosanitary (SPS) Measures, Quantity Control or licensing and quantitative restrictions, and
export- related measures (see Table 10).
Table 10. India. Number of non-tariff measures, mid-year 2016
Contingent Trade
Protection
SPS TBT Export-related
measures
Quantity
Control
Price
Control
Pre-shipment
Inspection
Other
325 72 46 37 30 11 2 7
Source: UNCTAD. http://i-tip.unctad.org/Forms/MemberView.aspx?mode=modify&action=search
Notes: (a) Contingent trade protection includes anti-dumping, countervailing measures (or anti-subsidy), and safeguard
measures. (b) Other measures include: price control measures (including additional taxes and charges), finance
measures, measures affecting competition, trade related investment measures, distribution restrictions, restrictions on
post-sales services, subsidies (excluding export subsidies), government procurement restrictions, intellectual property,
and rules of origin.
The largest number of contingency measures used by India are anti-dumping actions, as shown
by Table 11 below.
Table 11. India. Different forms of contingency protection measures in force on June 20, 2016
Anti-Dumping Countervailing Measures Safeguards Measures
252 1 6
Source: Annual Reports (2016) of the WTO Committees on Anti-Dumping; Subsidies and Countervailing Measures; and
Safeguard Measures
Note: The data in this table corresponds to the bilateral measures reported by the UNCTAD database. Bilateral
contingent trade protection measures are 259. In addition, UNCTAD reports contingent protection measures affecting all
members in terms of on-going investigations (66 for India), which added to the figure in Table 11 makes it consistent
with that in Table 10. For details on contingency protection measures by UNCTAD, see ‘UNCTAD - Integrated Trade
Intelligence Portal’ .
In this section, we will focus on three important non-tariff measures affecting imports: quantitative
restrictions (including licensing), anti-dumping measures, and SPS/TBT measures.
BROOKINGS INDIA
31 | Trade Policy Reform in India Since 1991
8(a). Quantitative restrictions including Licensing
As in the case of every country, India has provisions for import restrictions, including import
prohibition, quantitative restrictions or licensing. In many cases, these restrictions are for health
and safety reasons, to meet environmental or moral objectives, or to implement obligations under
international agreements.
India’s import restriction regime today is much more liberal than the early 1990s, due to both the
policy of easing trade restrictions over time and a consequence of India losing the WTO BOP
related dispute in 1999 which pertained to India’s quantitative import restrictions. Following the
WTO dispute, India had to remove its quantitative restrictions that it had imposed for BOP
reasons. It did so in two tranches, first one by April 1, 2000 and second by April 1, 2001: “At the
DSB [Dispute Settlement Body of WTO] meeting of April 5, 2001, India announced that, with
effect from April 1, 2001, it had removed the quantitative restrictions on imports in respect of the
remaining 715 items and had thus implemented the DSB’s recommendations in this case.”52
(emphasis added)
In the case of agriculture, the Uruguay Round Agreement required all quantitative restrictions to
be replaced by “equivalent” tariffs. Therefore, at one stroke, the quantitative import restrictions
for agriculture were removed.
In 1991, India’s import licensing regime was considerably complex and highly restrictive. All
imports unless specifically exempted were subject to licensing requirements which operated
under a system with 26 “positive” commodity lists. Imports were classified under four broad
categories: banned items, restricted items, limited permissible items, and open general license
(OGL) items. Different import approval systems applied for different license categories. While
OGL was notionally unrestricted, several OGL items required government approval and were
subject to “actual user” conditions: the actual user condition required the importer to also be a
user of the imported product.
This scheme was considerably simplified by the Export Import Policy of 1992, which replaced the
previous lists by a consolidated “negative” list that specified products subject to import licensing.
Other products were freely importable. Nonetheless, almost all consumer goods were still under
52 See WTO Dispute-DS90. Available at: https://www.wto.org/english/tratop_e/dispu_e/cases_e/ds90_e.htm

BROOKINGS INDIA
32 | Trade Policy Reform in India Since 1991
import licensing53, and both consumer products and other products were part of the negative
list.54
Even today, India continues with import prohibitions and other restrictions on imports, mostly for
health and safety reasons, technical compatibility of requisite standards, moral reasons or
environmental reasons. In certain cases, the interests of domestic industries also form a basis of
these policies. For these reasons, imports are prohibited for 60 eight-digit tariff lines (about 0.5
per cent of tariff lines). In addition, 8 four-digit lines covering milk and products of milk are at
present temporarily prohibited for imports from China.55Import licensing is required for 428 eight-
digit tariff lines (about 3.6 per cent of total lines) whose imports are restricted.56 In addition, toxic
and other chemicals, psychotropic drugs and narcotic substances require import licensing, eight
narcotic drugs are banned for imports, and three can be imported only by the Government
Opium and Alkaloid Factory.57
These types of various import prohibitions or restrictions are used by other nations as well, for
reasons similar to those used by India. These restrictions are normally not focused on import
substitution, but on other public policy reasons linked to for instance health, safety, moral
reasons, and meeting international obligations (chemical weapons, endangered species,
Montreal Protocol and other international agreements).
Though India still has import restrictions in place, their number is much less than in 1991. The
regime is more simple and transparent.
53For a list of the consumer goods allowed without restrictions, see page 75-76 of WTO, India: Trade Policy Review
1993 Report by the Secretariat. 54The other products included precious, semi-precious and other stones; safety, security and related items; seeds,
plants and animals; pesticides and insecticides; electronic items; drugs and pharmaceuticals; chemicals; articles related
to the small-scale sector; miscellaneous items; and special items required by hotels, restaurants, and sports and
recreational bodies. See WTO, Trade Policy Report by Secretariat, 1993, page 72. 55These are milk and milk products, chocolates and chocolate products and candies/confectionary/food preparations
with milk or milk solid as an ingredient. 56The list of prohibited and restricted imports can be seen at Foreign Trade Policy 2009-2014, Ministry of Commerce
and Industry. Available at: http://dgft.gov.in/exim/2000/download-ftp1213.htm 57Details on these latter set of restrictions are provided in ITC (HS). Schedule 1 – Import Policy. Appendices I and II.
Appendix III specifies the products subjects to mandatory BIS certification. While the appendices provide a summary
information on these aspects, tariff line level treatment for different products can be seen from the links at this website
to each Chapter of the Indian Trade Classification (ITC).

BROOKINGS INDIA
33 | Trade Policy Reform in India Since 1991
8(b). Anti-Dumping
India imposed its first ever provisional anti-dumping duty in January 1993.58 Over the years, it
has become among the largest users of anti-dumping measures in the world. On June 30, 2016,
it had the second-largest number of anti-dumping measures in force (21 less than the top-most
user, United States)- see Table 12.
Table 12. Top 10 users of anti-dumping measures in the world, in terms of number of anti-dumping
measures in force on June 30, 2016
Measures in Force on
30 June 2016#
Provisional
Measures
Definitive Duties Price
Undertakings
TOTAL 1598 119 151 2
US 273 40 19 0
India 252 9 38 0
Brazil 162 3 9 0
Turkey 149 5 8 0
EU 114 6 10 0
China 93 12 8 0
Argentina 87 0 4 0
Canada 66 5 2 0
Mexico 61 11 14 0
Australia 54 7 8 0
# Measures = Definitive Duties and Price Undertakings.
Source: Annex C of the Document: WTO, Report (2016) Of The Committee On Anti-Dumping Practices, Document
G/L/1158 and G/ADP/23, 1st November 2016
It is interesting that as India’s tariffs have decreased, its number of anti-dumping actions
increased over the next 10 years, and continue to be at a significantly higher level compared to
the initial years after the commencement of tariff reform (Chart 3).59 This is consistent with the
conventional understanding of political economy of trade liberalisation where the general
opening-up of the economy is accompanied by alternative trade restrictions like anti-dumping, or
other non-tariff measures to provide targeted protection to sensitive sectors whenever there is a
felt need for doing so.
58The duties were on PVC imports from Argentina, Brazil, Mexico, Korea and the United States. 59Between 2008 and 09, the average number of anti-dumping initiations has been 38; the mode and median averages
for anti-dumping initiations during this period are 34 initiations.

BROOKINGS INDIA
34 | Trade Policy Reform in India Since 1991
Chart 3. Anti-dumping initiations (July to June), and total customs revenue divided by imports (fiscal year),
1990-91 to 2014-15
Source: WTO and Government of India
Though India is amongst the largest users of anti-dumping in the world, till now only four of its
anti-dumping actions have been brought to dispute settlement panel since the WTO was
established in 1995. In contrast, 49 disputes have been brought against the United States, out of
a total of 114 anti-dumping cases under the WTO dispute settlement system. The third highest
user in Table 10 (Brazil) has only two cases brought against its anti-dumping actions. Therefore,
it is not just the number of actions but also size of the economy or share in global trade which
determines the total number of WTO disputes brought against the anti-dumping action of a
country. For instance, China’s anti-dumping actions have faced eight disputes within the WTO,
though its number of definitive anti-dumping measures in force on June 30, 2016 were about
one-third the number of such actions taken by India. Therefore, as India’s market share
increases together with the number of its anti-dumping measures, other nations subject to those
actions will give greater importance to questioning the basis for those actions. In this
background, it would be useful for Indian authorities to examine the procedures in place so that
they follow both the WTO legal requirements in an obvious way as well as meet the criteria of
good governance in general.60
60It is noteworthy that India has filed nine disputes settlement cases as complainant, against anti-dumping actions of
others. Following good governance principles will generate a stronger basis for India to demand similar treatment of its
exports by others.

BROOKINGS INDIA
35 | Trade Policy Reform in India Since 1991
A significant feature in the context of contingent protection is that till recently, India had not
established regulations or amended its law to impose contingency protection measures under
FTAs, a gap which needs to be addressed.
8(c). SPS/TBT
Large international markets today are far more impacted by standards than tariffs or other non-
tariff measures; even anti-dumping measures, which are far more numerous but more limited in
scope, do not affect trade at as wide-scale a level as standards. Furthermore, while anti-dumping
measures are used only by the government, standards are imposed by both the government and
the private sector, with most value chains subject to specified standards overseen by lead firms
in that chain. Therefore, standards are amongst the most significant trade measures in present
day markets. Further, their scope is increasing from only quality or health and safety concerns to
include social and sustainability concerns which are now prominent in most large markets.
Interestingly, these concerns are also increasingly emphasised in FDI.
It is important to bear in mind the fact that standards are not always trade barriers or trade
restrictions: They are required to achieve legitimate policy goals. They become barriers when
their operational conditions or levels exceed what may be required to meet the desired objective.
That is when trade concerns arise with respect to standards. Therefore, standards related
policies (SPS/TBT) address five aspects of policy: addressing trade related concerns;
transparency and provision of relevant information to stakeholders; opportunity to provide
comments on standards when they are being formulated; bring trade related concerns to the
attention of the implementing party and seeking solutions; and, developing domestic capacity in
the context of standards.
Building domestic capacity to meet standards is an essential part of creating trade opportunities.
However, in the context of international trade, meeting standards is not sufficient for exports to
be accepted in other markets. Accepted conformity assessment procedures are very important to
get agreement in other markets that standards have been met by the product exported to that
market.
The story of standards trade policy in India has been an increasing realization regarding the
importance of all these factors; shifting from a focus on developing domestic standards towards
aligning policies and capabilities towards international standards; recognition of the importance
BROOKINGS INDIA
36 | Trade Policy Reform in India Since 1991
of private standards, conformity assessment, and expanding the capabilities of small and
medium enterprise through focused training; and including social and sustainability standards in
the scope of both training and conformity assessment.
Recognising the importance of standards for international trade, the Government of India
established an annual meeting in 2014 under a Standards Conclave, which brings all standards-
related stakeholders on a single platform and develops roadmaps for standards-related policies.
The government has designated Quality Council of India (QCI) as India’s focal point agency for
private standards. It has changed two laws to facilitate the policy framework for conformity
assessment, has enabled training programmes which use step-wise upgrading of small and
medium enterprises to reach regional or global standards, and has streamlined and increased
scope of linking up with international standards. The Government encourages or supports
initiatives for MOUs between Indian agencies and international agencies that work on standards
(i.e. agencies which develop or validate standards/conformity assessment). Such MOUs have
been signed with the African nodal standards agency as well as those in many developed
economies.
Regarding India’s use of standards for trade restrictive purposes, it is useful to consider the
specific trade concerns (STCs) raised in WTO about India’s SPS and TBT policies. These data
show that India has been amongst the top 10 economies whose standards were raised as a
concern in the WTO, though far less than the top countries in terms of new STCs.61 Thus, for
TBT, during 1995 to 2015, new concerns raised for Indian measures were 24, in comparison to
102 for the EU, 56 for China and 47 for the US. For SPS, during 1995 to 2015, India’s policies
were raised as STC in 13 instances in the WTO’s Committee on SPS, in comparison to 77 for
the EU, 45 for the US and 27 for China. It is worth bearing in mind that China became a member
of WTO in November 2001, and its STCs were therefore mentioned in this process from only
2002 onwards.
In terms of standards related disputes in WTO, India has not faced many complaints. Only three
WTO disputes have been raised with respect to Indian SPS policies and one for TBT.
This could be both because India’s policies are a matter of lower concern and the fact that the
Indian market is not large enough for more concerns to be expressed at the relevant SPS/TBT
61The WTO Committees on SPS and TBT discuss both new and old STCs (i.e. those still to be adequately addressed
and remain a matter of concern). For TBT, see WTO Document G/TBT/Rev./1, Chart 19. For SPS, see
G/SPS/GEN/204/Rev.16, Table 1.1.

BROOKINGS INDIA
37 | Trade Policy Reform in India Since 1991
fora in the WTO. Nonetheless, there is a prevailing view amongst many stakeholders that India’s
quality of domestic products and process standards need to improve, particularly for products of
the large informal sector in India. This issue would need to be addressed through training and
better implementation of existing systems, to encouraging and pacing the way for sequentially
moving towards international standards. Some schemes which build capacities in a progressive
and step-wise manner are now part of the Indian standards training methods.62
9. Export-Related Policies
Similar to imports, India’s exports too are subject to controls and monitoring for several products,
but with a much smaller coverage. In 1991, a limited number of exports were prohibited (mainly
for moral or environmental reasons) or were subject to export quotas. A relatively larger number
of products were subject to export licensing. While exports taxes were used, they were applied to
selected specified products.63
Exports policies have been reformed significantly since the early 1990s. Now, exporters have a
self-assessment system to facilitate trade. Currently, about 80 per cent transactions are cleared
without intervention by Customs and 98 per cent of documents are processed electronically.64
Exporters are required to register and get a Code for record and facilitating any processes.
Several products are subject to quality inspections and certification. This is required both to
reduce risks of exports being rejected and to meet various conditions relating to internationally
agreed practices. Export taxes and cess do apply to a few items. In some cases, minimum
export prices are imposed for some sensitive products. Likewise, exports of some products are
prohibited or subject to export licensing: about 190 tariff line items are subject to export licensing.
Thus, over time, export policy reform has facilitated and provided greater freedom to exporters to
conduct their business. However, though with major facilitating steps implemented, some
aspects of the broad nature of policies remain similar to those used in the 1990s, though the
restrictive coverage of such policies is much less today and their focus is on a limited number of
products for various reasons of public policy.65
62One example is the ZED scheme of Quality Council of India, which takes an SME from its present capability level to
global standards in five sequential steps. 63For the list subject to export taxes and exemptions to these taxes, see ‘Central Board of Excise and Customers, The
Second Schedule - Export Tariff, 2011'. Available at: http://www.cbec.gov.in/resources//htdocs-cbec/customs/cs-
tariff2015-16/sch2-exptariff.pdf 64WTO Secretariat Report for India’s Trade Policy Review, 2015, paragraphs 3.117 and 3.118. 65For a range of different steps to facilitate exports, see Foreign Trade Policy 2015-2020, Government of India.
BROOKINGS INDIA
38 | Trade Policy Reform in India Since 1991
We have earlier mentioned the schemes which provide concessions and support to exports. The
Foreign Trade Policy (FTP) 2015-2020 aims to raise India's share of global exports from 2 per
cent to 3.5 per cent by 2020.66 Exports have conventionally been encouraged through various
types of support schemes, e.g., duty exemption of remission schemes, export subsidies, export
credit schemes, export promotion agencies established for specific products, 29 separate export
promotion Councils provide advice and other support, and easier procedures for exports from
Special Economic Zones.67
10. Services and Regulation as Integral Part of Trade Policy Reform
India is amongst a small number of countries whose experience has changed the conventional
understanding that the pattern of growth follows a transition from agriculture to manufactures,
and then to services. India is widely seen as more prominent in services exports than
manufactures, and has served as a model for several other developing nations to seek
opportunities from international trade in services.
Many services, particularly in developing countries, were earlier provided by Public Sector
Enterprises, as they require large fixed investment. Many major services sectors were earlier
considered as not being amenable to international trade. This situation changed with the advent
of new technology (particularly communications), increasing sophistication of financial markets,
growth in FDI, international supply chains, and a break-up of existing large service providers in
certain service sectors which showed that smaller size of service suppliers could also be
efficient. These changes led inter alia to seeking trade policy regulatory disciplines within trade
agreements, most importantly at the WTO.
An interesting feature of the progress of trade negotiations in WTO was a recognition that trade
in services trade could occur in four different ways, including movement of labour, capital and
consumers, in addition to that conventional cross-border trade that is the way goods trade is
conceptualised.
66See, paragraph 2 in the Executive Summary contained in ‘EXIM, Foreign Trade Policy Statement'. Available at:
http://dgft.gov.in/exim/2000/FTPstatement2015.pdf 67For a list of export promotion schemes, see pages 155 to 158 of the WTO’s 2015 Trade Policy Review of India,
Secretariat Report, WTO Document WT/TPR/S/313/Rev.1.

BROOKINGS INDIA
39 | Trade Policy Reform in India Since 1991
Thus, trade policy reform in services requires different combination of policy steps in comparison
to goods, including market access and regulatory reform to create conditions for introducing
competition in the sector and to ensure good quality of services. The possibility of new entrants
in services markets with dominant suppliers meant that regulatory conditions had to be created
to enable efficient entry and maintenance of a “level playing field”, in order to address the
possibility of anti-competitive behaviour in the market. This implies the provision of both B2B
and B2C services in a timely manner at the requisite quality and reasonable prices.
Consequently, an essential part of services trade reform is establishment of a regulatory body
and a regulatory framework to give predictability and facilitate entry of competitors in the market.
In addition, the large network or fixed capital required for expanding the reach and scope of
services may need both supportive policies and re-orientation of public policy.
The Indian government has established regulatory bodies in several services related areas such
as telecom, ports, insurance, pensions, food safety, petroleum and natural gas, electricity, and
inland waterways. In certain cases such as power, separate regulatory authorities are
established at the Centre and the individual States because of the nature of distinct
responsibilities in that service area for the Center and the States. In addition to sector-specific
regulatory bodies, India has also established those with a more wide-ranging reach, such as the
Competition Commission of India. The government has also helped with development of
infrastructure in several of these areas (in railways, it is effectively a monopoly), and some of its
flagship projects focusing on digital, ease of doing business, skill building, and improving cost
effectiveness, contribute to reform and efficiency in the services sector. Thus, services trade
policy reform, which became a focus of reform much later than goods trade policy, has
progressed considerably. Nonetheless, as shown by Table 13 below, there is considerable scope
for improvement in a number of these areas.68
68There is some evidence that services trade flows are adverse affected both by trade restrictiveness in services as well
as regulatory heterogeneity. See, Nordås, H. K. (2016), “Services Trade Restrictiveness Index (STRI): The Trade Effect
of Regulatory Differences”, OECD Trade Policy Papers, No. 189, OECD Publishing, Paris. Available at:
http://dx.doi.org/10.1787/5jlz9z022plp-en

BROOKINGS INDIA
40 | Trade Policy Reform in India Since 1991
Table 13. Comparison of services trade restriction index of India (selected sectors)
India Brazil China Indonesia South Africa
Logistics (1) 0.25 to 0.39 0.2 to 0.7 0.25 to 0.46 0.31 to 0.57 0.17 to 0.3
Accounting 0.89 0.29 0.39 0.46 0.24
Architecture 0.61 0.28 0.25 0.3 0.22
Insurance 0.63 0.35 0.49 0.52 0.19
Telecom 0.46 0.46 0.41 0.57 0.32
Road Freight Transport 0.15 0.17 0.39 0.35 0.14
Distribution 0.36 0.13 0.33 0.42 0.15
Commercial Banking 0.49 0.41 0.47 0.54 0.27
Source: Organisation for Economic Cooperation and Development (OECD)
Notes: (1) Range for logistics covers logistics cargo-handling, logistics storage and warehouse, logistics freight
forwarding, and logistics customs brokerage.
(2) Higher the value of index, greater the restriction.
Improving the efficiency in services sector is of major importance because services are products
which potentially have extensive upstream and downstream impact in the production chain. They
affect the operations of a country’s economic system relating to trade and investment, value
chains and ability to compete with others to be an effective part of international value chains. An
important part of services reform is to introduce timeliness and quick response, efficient and
effective infrastructure, and procedures which seamlessly link up the different part of the supply
chain.
11. Trade Facilitation
The combination of FDI, international value chains and services reform has led to a shift in the
focus of trade policy from restrictions towards trade facilitation. Trade facilitation policies include
a focus on timeliness, transparency, paperless procedures (domestic and cross-border),
simplifying procedural formalities, and institutional arrangement and domestic and international
cooperation.69 The OECD includes a more specific list of components in its consideration of trade
facilitation: advance rulings, appeal procedures, fees and charges, formalities (documents),
69For a discussion, see Joint United Nations Regional Commissions, 2015, Trade Facilitation and Paperless Trade
Implementation Survey 2015. Global Report, United Nations. The OECD includes the following components: advance
rulings, appeal procedures, fees and charges, formalities – documents, formalities – automation, formalities –
procedures, internal border agency cooperation, governance and impartiality, information availability, and involvement
of the trade community.

BROOKINGS INDIA
41 | Trade Policy Reform in India Since 1991
formalities (automation), formalities (procedures), internal border agency cooperation.
governance and impartiality, information availability, and involvement of the trade community.70
These aspects have been a part of reform in India for about two decades, with the momentum
picking up in recent years. Significant importance to trade facilitation was given by the Task
Force on Indirect Taxes, set up under the chairmanship of Vijay Kelkar.71 More recently India has
signed on to the Trade Facilitation Agreement of the WTO. Thus, while the importance of trade
facilitation was recognised in the early 2000s, a stronger focus on it has emerged in this decade
after a substantive and practical recognition of its significance for improving competitiveness,
ability to connect with international value chains and attracting FDI based on ease of doing
business within the country.72 Even in the budget of 2016, specific focus was given to some trade
facilitation measures.73
Thus, considerable movement has taken place towards trade facilitation in India, but as in the
case of other trade policy areas, much more needs to be done.74
12. Other Emerging Trade Policy-Related Issues
The discussion above shows that the scope of trade policy has expanded with larger coverage of
existing topics and addition of new topics under the framework of trade-related policies.
Examples of both these can be found most clearly in Trans Pacific Partnership (TPP), in the
chapters relating to market access in goods and services, competition policy, investment, e-
commerce, IPR, TBT and SPS, regulatory coherence, trade facilitation, supply chains, co-
operation and capacity building.
70See, “OECD Trade Facilitation Indicators – India”, April 2014. Available at: https://www.oecd.org/tad/facilitation/india-
oecd-trade-facilitation-indicators-april-2014.pdf 71For the consultation paper of the Task Force, released in 2002, see ‘Task Force on Indirect Taxes', 2002. Available at:
http://www.finmin.nic.in/kelkar/report.pdf 72See for example, Moïsé, E. and S. Sorescu (2015), “Contribution of Trade Facilitation Measures to the Operation of
Supply Chains”, OECD Trade Policy Papers, No. 181, OECD Publishing, Paris. Available at:
http://dx.doi.org/10.1787/5js0bslh9m25-en 73Examples include continuing with the implementation of the Indian Customs Single Window Project, allowing deferred
payment of customs duties for importers and exporters with proven track record, and shift from physical control to
record based control for customs bonded warehouses, supported by sophisticated IT systems. 74For certain trade facilitation components, India’s performance is better than the country with the best global overall
performance (e.g. for advance rulings) or equal to the best overall performance country (e.g. for internal border agency
co-operation or information availability). For some other components, however, India is substantially below the average
for Asia (e.g. fees and charges and procedural formalities). See, “OECD Trade Facilitation Indicators – India”, op. cit.

BROOKINGS INDIA
42 | Trade Policy Reform in India Since 1991
Recent trade agreements or negotiations indicate that trade policy is also seen as an integral
part of strategic policy. Furthermore, with an increase in economic importance of countries such
as China in global trade, producers in developed economies who are losing market share, have
started taking a closer look at the conditions of production in the emerging economies. The
objective is to have a “level playing field” and one of the areas of emphasis is social and
sustainability standards regime in different economies. Both formal and informal efforts are being
made to extend the standards prevalent in supply chains of developed markets, to other parts of
the global markets as well.
Another development regarding trade policy is the growing importance of informal methods in
comparison to formal ones. The formal efforts are through trade agreements. Informal efforts are
through decisions of groups such as G7, or the OECD guidelines, and most importantly through
private standards which are a major part of trade transactions in large markets.
Yet another area with significant private presence is the digital platform, where technology is
progressing rapidly and the public policy maker does not have the capacity to keep abreast with
new developments and policy implications without support from the private stakeholders who are
more closely associated with these technologies. Further, a digital platform combined with
mobility and new technologies such as 3D printing or machine-to-machine (M2M)
communications, makes it very difficult to determine location or to ascertain ex-ante either the
package of services that could be bundled together or the pricing strategy which could be used
when diverse products are bundled as a package. This in turn has implications for the relevant
regulatory regime that would be effective or relevant in the new situation. The limited extent of
national jurisdiction in a world where location is indeterminate, also points towards an increasing
need for collaboration amongst the relevant regulatory agencies in different nations.
In this context, a policy emphasised frequently by producers in developed economies is the IPR
regime, particularly for new technologies, including digital or e-commerce. Many “sunrise
industries” embody new technology and knowledge, and IPR becomes an important mechanism
to sustain market leadership in those areas.
Another area which is acquiring prominence in trade policy discussions and negotiations, is the
issue of exchange rate used as a trade policy tool. This issue is emphasised both by developing
economies (e.g. Brazil) and developed economies (e.g., the U.S. in its TPP negotiations and
thereafter). The objective is to develop disciplines against the use of exchange rate as a
mechanism for tilting the competitive position in favour of domestic producers.

BROOKINGS INDIA
43 | Trade Policy Reform in India Since 1991
These developments have several implications. One, the composition of trade policy becomes
more open ended with an evolving set of new issues becoming part of consideration, including
those mentioned above and others such as corporate social responsibility75, corruption76, and
remuneration systems77. Two, the increasing scope of trade policy means that no single
international institution deals with all relevant issues. Therefore, policy makers would need a
comprehensive perspective and knowledge of both the relevant topics and initiatives at the
diverse institutions that deal with them. Three, without a common understanding, different
regulatory and standards schemes are likely to come up in different economies, showing a need
for regulatory coherence at the bilateral, regional or multilateral level. Four, there are
considerable tensions in world markets following the adverse economic conditions since the
major economic decline in 2008/09, and the pressure on jobs as new labour saving technologies
emerge, creating significant difficulties particularly for the small and medium enterprises. This
implies a need to augment the framework of trade policy from one with a major focus on market
opening or higher levels of trade policy disciplines, to one which includes mechanisms (or
safeguards) to address trade-related concerns in domestic markets, collaborate and assist each
other in building capacity for SMEs and develop closer regulatory co-operation and coherence.
All these areas require coordinated efforts amongst domestic policy makers and industry in any
nation, to better address the large and increasing agenda of today’s trade policy issues.
13. Conclusion
Trade policy reform in India has come a long way on the road which was paved since 1991, with
a large reduction in tariffs (including peak tariffs), simplification of tariffs, improved regime for
non-tariff measures, services regulation and opening up internal markets for services, greater
opportunities for investment, better trade facilitation institutions and policies, and improving
domestic capacities to meet the relevant standards required to link up with domestic and
international value chains.
Since 1991, trade policy reform has opened up India’s trade. It has increasingly provided Indian
consumers and producers access respectively to world-class consumer goods and the relevant
capital and intermediate goods. The situation today is extremely different compared to the period
when trade policy encompassed high border restrictions. The major trade policy reform, together
75See for example, Article 9.17 of the TPP Chapter on Investment. 76Chapter 26 of TPP. 77At present, TPP has this issue under Cooperation under its Article 19.10.6 (g).

BROOKINGS INDIA
44 | Trade Policy Reform in India Since 1991
with other policy changes have led to a greater integration of India with the world economy, and
improved capacities as well as potential for growth.
It is worth recalling that India’s trade reforms were accomplished with a high degree of success
in the sense that domestic disruption was manageable. High trade growth was achieved until the
recent past, with ratio of exports and imports to GDP reaching about 49 per cent in 2014 from
about 24 per cent in 2000. The current account deficit has also been contained at sustainable
levels except for a brief period between 2011 and 2013.
The trade deficit, however, has been significantly high. With recent experience of exports and
imports declining for one and a half years and subdued global markets, policy makers would be
particularly hesitant in their approach towards further trade policy reform in terms of border
measures.
However, the content and substance of trade policy has expanded compared to the 1990s. We
have to thus again examine whether there is a need to consider further trade policy reform with
significant impact on consumers, producers, and economic efficiency.
Further, in addition to various trade policy changes, it is worth recalling that in the initial years,
trade policy reform was accompanied by exchange rate changes as an important complementary
tool to soften the impact of tariff reductions. Bearing in mind that complementarity of changes in
tariffs and exchange rates, and the increasing reliance and significance of exchange rate issues
in the context of trade policy, a pertinent question would be whether attention is needed to
address this situation through the exchange rate. This is especially so since the REER now is
higher than in 2008-2009, the years since global trade has suffered due to the massive economic
and financial crisis. Of course, ultimately, India would need to improve its overall productivity
through technological and skill enhancement, in order to progress beyond the middle-income
category to become a high income economy. Several trade policy reforms have contributed to
paving the way towards greater competitiveness of Indian enterprises.
In the area of tariffs, we saw in this paper that the prevailing view of India being a high tariff
economy is not correct. India’s average applied MFN tariffs are close to those of some APEC
economies. Importantly, India’s weighted average tariffs calculated based on customs tariffs are
very low by global standards, close to those for economies considered to have amongst the
lowest average tariffs in the world. This suggests that India’s further tariff reform may need to

BROOKINGS INDIA
45 | Trade Policy Reform in India Since 1991
mainly consider lowering the tariff peaks applicable to certain product categories, reducing the
number of rates applied, and simplifying the tariff regime to make it more transparent and
predictable.
On non-tariff measures (including for services), this paper has shown a number of areas where
more needs to be done to consolidate the reform that is already underway. India is emphasising
a number of facilitating policies through its flagship programmes like Make in India. The different
initiatives would need to be advanced in a coordinated manner, with further simplification and
reducing arbitrariness. These steps have to be supplemented by capacity augmentation and
regulatory coherence, two very significant reform oriented initiatives that will need to be
combined with other efforts, to implement trade policy reform through an integrated and
coordinated approach.
We see from the discussion in this paper that while significant trade policy reform has been
achieved, India still has a number of remaining areas to address even for the conventional trade
policy areas, e.g., simplification and completing some features of trade policy reform which were
identified in the first few years of since 1991. The steps required include these as well as more
recent areas covered in trade policy discussions. Moreover, we need to consider trade policy and
domestic policy in an integrated manner, keeping in mind the evolution of trade policy,
emergence of new market conditions, and the growth of both formal and informal mechanisms
which determine the opportunities provided by global markets.
This implies that the trade policy and trade negotiations governance mechanisms would need to
have an over-arching reach with timely, informed and interactive consideration of issues. A new
approach, using the tools of new technology and an overall large database shared commonly
amongst the governance agencies, would need to be developed.
Important aspects of future trade policy reform include establishing systems to enable such quick
information coming to the policy makers about the diverse areas which are emerging as part of
the extended framework of trade policy, both formal and informal. In this context, policy makers
need to participate to the extent possible, in both formal and informal initiatives dealing with the
expanded trade policy agenda. Furthermore, the new emerging developments due to the
evolving or disruptive technologies, growth of social and sustainability considerations, and the
tendency of policy issues to spill over into the practices of private sector lead firms in global
value chains, imply that the policy maker has to not only work with a much wider agenda than

BROOKINGS INDIA
46 | Trade Policy Reform in India Since 1991
earlier but also interact much more closely with the private sector than is the conventional
practice.
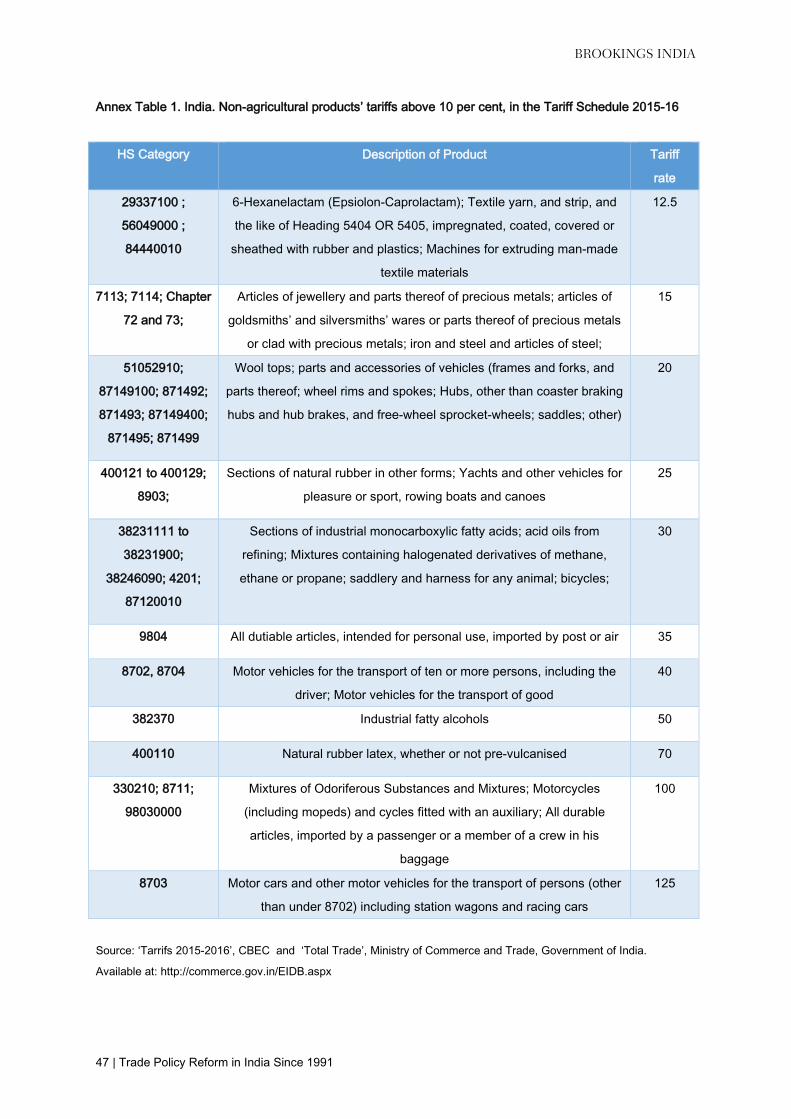
BROOKINGS INDIA
47 | Trade Policy Reform in India Since 1991
Annex Table 1. India. Non-agricultural products’ tariffs above 10 per cent, in the Tariff Schedule 2015-16
HS Category Description of Product Tariff
rate
29337100 ;
56049000 ;
84440010
6-Hexanelactam (Epsiolon-Caprolactam); Textile yarn, and strip, and
the like of Heading 5404 OR 5405, impregnated, coated, covered or
sheathed with rubber and plastics; Machines for extruding man-made
textile materials
12.5
7113; 7114; Chapter
72 and 73;
Articles of jewellery and parts thereof of precious metals; articles of
goldsmiths’ and silversmiths’ wares or parts thereof of precious metals
or clad with precious metals; iron and steel and articles of steel;
15
51052910;
87149100; 871492;
871493; 87149400;
871495; 871499
Wool tops; parts and accessories of vehicles (frames and forks, and
parts thereof; wheel rims and spokes; Hubs, other than coaster braking
hubs and hub brakes, and free-wheel sprocket-wheels; saddles; other)
20
400121 to 400129;
8903;
Sections of natural rubber in other forms; Yachts and other vehicles for
pleasure or sport, rowing boats and canoes
25
38231111 to
38231900;
38246090; 4201;
87120010
Sections of industrial monocarboxylic fatty acids; acid oils from
refining; Mixtures containing halogenated derivatives of methane,
ethane or propane; saddlery and harness for any animal; bicycles;
30
9804 All dutiable articles, intended for personal use, imported by post or air 35
8702, 8704 Motor vehicles for the transport of ten or more persons, including the
driver; Motor vehicles for the transport of good
40
382370 Industrial fatty alcohols 50
400110 Natural rubber latex, whether or not pre-vulcanised 70
330210; 8711;
98030000
Mixtures of Odoriferous Substances and Mixtures; Motorcycles
(including mopeds) and cycles fitted with an auxiliary; All durable
articles, imported by a passenger or a member of a crew in his
baggage
100
8703 Motor cars and other motor vehicles for the transport of persons (other
than under 8702) including station wagons and racing cars
125
Source: ‘Tarrifs 2015-2016’, CBEC and ‘Total Trade’, Ministry of Commerce and Trade, Government of India.
Available at: http://commerce.gov.in/EIDB.aspx

BROOKINGS INDIA
48 | Trade Policy Reform in India Since 1991
Note: This list is based on only those items which have ad valorem tariffs. Any tariff lines with specific or composite
tariffs are not included in this Table. The definition of agriculture is the same as used by the WTO in its data on World
Tariff Profiles.
Annex Table 2. India. Imports share in total imports of non-agricultural products with tariffs above 10 per
cent
Tariff Rates (%) Import Share Of Products In The Tariff Rate (%)
12.5 0.019
15 4.118
20 0.034
25 0.186
30 0.072
35 0.001
40 0.013
50 0.016
70 0.003
100 0.028
125 0.054
Sources: http://commerce.gov.in/EIDB.aspx, and http://www.cbec.gov.in/htdocs-cbec/customs/cs-tariff2015-16/cst2015-
16-idx
Note: This list of tariff categories in this Table is same as in Annex Table 1.. Any tariff lines with specific or composite
tariffs are not included in this Table.

BROOKINGS INDIA
49 | Trade Policy Reform in India Since 1991
Annex I
Parts of the Union Budget Speech in 1993 That Relate to Customs Duties and explain the
Various Considerations Underlying the Customs Duty Reform
(Paragraphs 82 to 99. See Budget Speech 1993-1994)
82. Since 1973, we have been levying a separate auxiliary duty in addition to the basic customs
duty. In order to simplify the tariff structure and the assessment process, I propose to do away
with the separate auxiliary duty and merge it with the basic duty.
83. Our first priority in restructuring customs duty should be in the area of capital goods and
project imports since these duties affect the incentives for new investment. Last year the duty on
projects and general machinery was brought down from 80 per cent to 55 per cent. This is still
too high compared with rates in competitor countries and a further reduction is necessary. I,
therefore, propose to lower the import duty on projects and general machinery to 35 per cent.
Projects in certain priority sectors such as, power, coal mining and petroleum refining currently
attract a duty rate of 30 per cent. I propose to reduce the rate to 25 per cent in the case of coal
mining and petroleum refining. In view of the special importance of the power sector, the duty on
power projects is being reduced to 20 per cent and this rate is also being extended to machinery
required for modernisation and renovation of power plants.
84. The House can rest assured that in restructuring duties on capital goods, I have made every
effort to protect the legitimate interests of domestic capital goods industry. We have had
extensive discussions with various Ministries as well as representatives of concerned industries.
In order to ensure that lower duties on 16 imported machinery do not hurt the domestic capital
goods industry, it is necessary to lower the import duty on components, to enable our
manufacturers to compete effectively. I therefore, propose to reduce to 25 per cent the duty on
components of general machinery which presently is either 40 per cent or 35 per cent. In order,
however, to ensure that domestic industries producing such components are not adversely
affected, I propose to impose countervailing duty on such components at 10 per cent with full
facility of setoff under MODVAT.
85. At present there are a number of other capital goods, including various types of machine
tools, which attract different rates of duty in the range of 60-110 per cent. There are also
instruments which attract duties varying from 40 per cent to 110 per cent. I propose to rationalise

BROOKINGS INDIA
50 | Trade Policy Reform in India Since 1991
this structure into three duty rate slots, viz., 40 per cent, 60 per cent and 80 per cent. The
rationalisation involves generally a duty reduction between 20 to 30 percentage points.
Consequential reduction is being made in the rates of duty on specified parts and components.
86. Hand-operated tools are capital goods for artisans and skilled workers and currently attract
duties varying from 40 per cent to 110 per cent. I propose to prescribe a uniform rate of 40 per
cent for all these tools.
87. The logic of reducing duties on capital goods requires lowering of duties on metals and metal
goods as well, as these are the basic raw materials of the domestic capital goods industry.
Accordingly, to help domestic producers, I propose to lower the customs duty rates on ferrous
metals by 10 to 20 percentage points in most cases. In line with these changes the import duty
on steel scrap is being refixed at 15 per cent. The import duty on specified refractory raw
materials is being reduced to 30 per cent. Turning to non-ferrous metals, I propose to reduce the
duty rates by 10 to 55 percentage points in most cases. The resulting rates on unwrought and
unalloyed forms will vary from 25 per cent to 50 per cent and on wrought forms from 70 per cent
to 80 per cent.
88. The duty structure for chemicals is characterised by a multiplicity of rates and many
irrationalities. Input duties are often out of line with duties on finished products. I, therefore,
propose to restructure the duty rates on chemicals with a view to significantly lowering duty rates
at the upper end and also ensuring that the duty rates on inputs are not generally higher than the
duty on end products. The present duty rates on basic feed stocks such as, ethylene, propylene,
butadiene, benzene, styrene and ethylene dichloride vary between 25 per cent and 80 per cent.
These rates are being replaced by a uniform low duty rate of 15 per cent. The duties on xylenes,
paraxylene, toluene, acrylonitrile and cumene are being reduced to 40 per cent. The duties on
DMT, PTA and MEG which represent a higher stage of production, are being reduced and
unified at 70 per cent. In the case of caprolactum, however, the duty is being increased from 50
per cent to 60 per cent, in order to adequately protect the interests of the domestic units.
89. The electronics industry has the potential of becoming a world class industry contributing to
our export effort and to employment generation. I propose to take up this challenge. The rates of
duty on project imports and on specified capital goods for electronics attract duty at either 30 per
cent or 50 per cent at present. I propose to reduce these rates to a uniform rate of 25 per cent.
The import duties on raw materials, piece-parts and components at present are levied at 40 per

BROOKINGS INDIA
51 | Trade Policy Reform in India Since 1991
cent, 60 per cent and 80 per cent. These rates are being reduced to 20 per cent, 35 per cent and
50 per cent, respectively. The import duty on specified raw materials for the manufacture of
optical fibre cables is being drastically 17 reduced from 90 per cent to 20 per cent in recognition
of the urgency of extending and modernising the telecom sector.
90. In order to strengthen our export capability in existing export-thrust areas such as textiles,
leather, marine products, gems and jewelry, etc. where we have a comparative advantage, I
propose to reduce the import duty on specified capital goods for these sectors from 40 per cent
to 25 per cent. In addition, certain recommendations have been made by the Groups on Extreme
Focus items for export for augmenting the export potential of certain sectors such as food
processing, horticulture and floricultural industries. Accordingly, the import duty on specified
items for these sectors is being reduced to 25 per cent.
91. The ship-breaking industry is employment intensive and an important source of raw materials
for the secondary sector of our steel industry. In order to encourage the growth of this industry, I
propose to prescribe a lower merged duty of customs at 5 per cent ad valorem. The ferrous
materials obtained from breaking up of such ships etc. which are presently subject to excise duty
are being fully exempted.
92. Our film industry is one of the largest in the world in terms of the footage of films produced.
Although it has achieved this status without much need for incentives, it is now facing greater
competition from the electronic media, and deserves some special encouragement. I, therefore,
propose to reduce the duties on jumbo rolls of cine positive films from 55 per cent to 25 per cent
and on finished cine film rolls from about 65 per cent to 40 per cent. I also propose to reduce the
duty on negative cine films from about 35 per cent to 25 per cent.
93. In order to encourage the development of non-conventional energy sources, especially solar
energy, the import duty on specified raw materials and items of this industry is being reduced by
15 to 20 percentage points. In respect of wind operated electricity generators I propose to reduce
the import duty from 40 per cent to 25 per cent.
94. As a gesture of goodwill towards Bangladesh, I propose to fully exempt the famous
Jamdanee saris from payment of import duties. Small-scale units, eligible for excise duty
exemption for clearances to domestic area are at present required to pay excise duty on goods

BROOKINGS INDIA
52 | Trade Policy Reform in India Since 1991
exported by them to Nepal and Bhutan. I propose to exempt these from this levy. I hope these
steps will make a contribution towards improving trade with SAARC countries.
95. At present, accredited press cameramen have the facility of importing photographic
equipment free of duty upto a limit of Rs.60,000 but no such facility is available to other
journalists to import specialised equipment such as, laptop computers, personal computers, fax
machines and typewriters. I have often wondered whether this explains why my photographs in
the Press are better than the editorial comments! As a measure of my commitment to encourage
modern technology in Indian journalism, and in recognition of the sterling role played by our
Pressmen in creating a wider appreciation of issues of economic reform in the country, I propose
to allow accredited journalists also a one time facility to import such equipment duty free upto a
value of Rs.60,000.
96. The duty rate on certain specified items of baggage was recently reduced from 255 per cent
to 150 per cent. As a measure of simplification, I propose to reduce the general baggage rate
itself from 255 per cent to 150 per cent.
97. In line with these reductions in import duties for individual sectors, and keeping in mind the
present exchange rate, there is scope for reduction in the maximum rate of duty on all goods.
Accordingly I propose to reduce the maximum rate from 110 per cent to 85 per cent except for a
few items including passenger baggage and alcoholic beverages.
98. I am aware that Honourable Members will be concerned that lowering of import duties and
import liberalisation may put too much pressure on our industry and make it vulnerable to unfair
competition and dumping. I would like to assure Honourable Members that these issues have
been carefully considered and the proposed changes will not put undue pressure on industry.
The change in the exchange rate over the past two years has created considerable room for duty
reduction without hurting domestic industry. Besides, I am also reducing duties on raw materials
and inputs which will help to reduce cost for our producers, enabling them to compete more
effectively. Even with these changes, duties on finished products will be well above the long term
structure recommended by the Chelliah Committee. We can move to that goal in phases over the
next few years. As for unfair competition through dumping, our anti-dumping laws are already
operational and action under these laws will be taken expeditiously whenever it is needed. I may
mention that provisional action has recently been taken in one case.
BROOKINGS INDIA
53 | Trade Policy Reform in India Since 1991
99. In last year’s Budget export duties had been imposed on iron ore and unpolished granite.
Certain difficulties faced by these sectors have since been brought to my notice. I, therefore,
propose to withdraw the export duty on iron ore and unpolished granite.

BROOKINGS INDIA
54 | Trade Policy Reform in India Since 1991
Annex II: Excerpts from Budget Speeches in Various Years
1992
77. Last year I had begun the process of reducing import duties by lowering the ad valorem rates
of basic plus auxiliary duties of customs to a maximum of 150 per cent. I now propose to lower
the peak tariff level further by reducing the basic plus auxiliary rates of import duties (inclusive of
specific duties) to a maximum of 110 per cent with the exception of passenger baggage and
alcoholic beverages.
1993
See Annex I, text reproduced for paragraphs 82, 97 and 98.
1994
56. … key features of my customs tariff reform proposals are:-
Further reduction in the peak rate of customs duty;
Substantial reduction in duties on key raw materials, such as steel and chemicals;
Reduction in customs duties on capital goods to boost investment combined with other
incentives which will help the domestic capital goods industry;
Reduction or removal of anomalies caused by import duties on raw materials and components
being higher than on finished products;
A systematic effort to unify rates on similar products to serve both economic rationality and to
reduce the scope for classification disputes;
A major pruning of notifications including end use exemptions to about half their present number,
thus reducing discretionary power and possibilities for disputes;
57. I propose to reduce the peak rate of customs duty from 85 per cent to 65 per cent. Items like
baggage and liquor will however continue to attract higher duty as at present.
1995
77. I shall deal first with import duties. The present peak rate of import duty of 65 per cent is still
very high compared to other developing countries, let alone industrialised nations. I propose to
continue the process of phased reduction in the peak rate by lowering it to 50 per cent.
1997
110. On more than one occasion, I have stated that we would achieve the average levels of
tariffs prevalent in ASEAN countries by the turn of the century. This will give time to Indian
industry to adjust to these changes. This year’s proposals should be seen in this background.
111. I propose to reduce the peak rate of customs duty from 50 per cent to 40 per cent

BROOKINGS INDIA
55 | Trade Policy Reform in India Since 1991
112. High levels of customs duties on capital good are inconsistent with our policy of attracting
the best technology. Greenfield investments in large projects should be globally competitive. I
have tried to harmonise the needs of the Indian industry with the requirements of the capital
goods sector. I, therefore, propose a modest reduction in duty on capital goods from 25 per cent
to 20 per cent. This reduced rate of 20 per cent will also apply to project imports. Over the next
two to three years these rates would need to be further adjusted to conform to levels prevalent in
other developing Asian countries.
1999
71. Mr. Speaker, Sir, I now turn to my proposals relating to customs duties. My proposals here
reflect a balance of differing considerations. On the one hand, we are committed to a calibrated
integration of our economy with the world economy. This would entail further phasing down of
our customs duties to Asian levels. On the other hand, is the need to raise revenue and the fact
that in a year of exceptional turbulence and uncertainty in the world economy, our industry
should be cushioned against unusual surges of competitive pressure from imports.
72. Sir, a special customs duty of 2 per cent was imposed in the budget of 1996-97, and a further
special customs duty of 3 per cent was imposed on certain items in 1997-98. The special
customs duty of 5% is in force till 31.3.1999. I have in the course of another discussion assured
this House that the period of validity of this special customs duty will not be extended. I
announce the discontinuance of the 5 per cent special customs duty with effect from 28.2.1999.
73. After careful examination of various possibilities, and close interaction with the apex
organisations of Commerce and Industry, I propose to reduce the existing 7 major ad-valorem
rates of customs duty to 5 basic rates. The new rates will be:
- 5 per cent - which will remain unchanged;
- 15 per cent by substituting the existing 10 per cent rate;
- 25 per cent by merging the 20 per cent and 25 per cent rates;
- 35 per cent by merging the 30 per cent and 35 per cent rates;
- 40 per cent - which will remain unchanged.
75. To garner revenue to meet the country’s irreducible needs, I propose a uniform surcharge of
10 per cent on all commodities, excluding the following categories:
Crude Oil and Petroleum Products;
Items attracting 40 per cent rate of basic duty;
Certain GATT- bound items;
Gold and Silver
76. Taking into account that special customs duty is being discontinued, and that crude oil and
petroleum products are exempt from surcharge, the effective import duty rates on these products

BROOKINGS INDIA
56 | Trade Policy Reform in India Since 1991
will stand reduced. This is consistent with the Government’s established policy of rationalising
indirect taxes on these products in an agreed time-frame.
77. By exempting items attracting 40 per cent rate of basic duty from the surcharge, there is a
modest but clear reduction in the peak rate of protective custom duty from 45 per cent to 40 per
cent.
2000
108. I am conscious that in this area, I face serious constraints. We have to maintain a judicious
balance between the need for providing adequate protection and growth impulses to the
domestic industry and calibrating tariffs to international levels. We also need to carry the reform
and rationalization process further.
109. Taking all factors into consideration, I propose to reduce the peak rate of basic customs
duty from 40 per cent to 35 per cent, thereby reducing the total number of customs duty rates
from 5 to 4, i.e. 35 per cent, 25 per cent, 15 per cent and 5 per cent.
110. The surcharge of 10 per cent, which I am constrained to continue on revenue
considerations, will also apply to the new peak rate of 35 per cent. Crude oil and petroleum
products, certain WTO bound items and gold and silver would continue to be exempt.
114 . Customs is not all about raising revenues. It is also a powerful tool for building our
industrial capabilities and improving our international competitiveness. I propose to take several
measures in this regard, picking up three sectors for special attention. These are integral parts of
the “convergence revolution” which is fast becoming a reality.
115 . First, and foremost, the Information Technology (IT) sector, which leads the current
excitement. I propose to reduce the customs duty on several items for the IT sector.
2001
102. In my earlier budgets, I have endeavoured to ensure a continuity of approach in framing
my revenue proposals. The principles that have guided me have been the need for growth in
revenues, simplification and rationalization of the tax regime, and effective tax compliance
through measures, which are friendly for the honest taxpayer, and a deterrent to the evader. I
have reduced the number of rates in both customs and excise duties, simplified procedures and
introduced measures to improve tax compliance. I have given up my discretionary power to grant
excise and customs duty exemptions in individual cases thus saving hundreds of crore of
revenue for Government. The policy of penalties against tax evaders has also been made non-
discretionary. With all these steps I have sought to put an end to a system that pressure groups
or lobbies could influence. My attempt this year is to take this process to its logical conclusion.
122. In my previous budgets, I have reduced the total number of major customs duty rates to
four, that is, 35 per cent, 25 per cent, 15 per cent and 5 per cent. I do not wish to propose any

BROOKINGS INDIA
57 | Trade Policy Reform in India Since 1991
further reduction in the number of customs duty rates this year. However, I propose to
discontinue the surcharge of 10 per cent. With this, peak level of customs duty will decline
marginally from 38.5 per cent to 35 per cent.
123. All agricultural produce already attracts the peak rate of duty of 35 per cent or more.
Current tariffs on major cereals are: Wheat (50 per cent), Rice (70-80 per cent) and Maize (50
per cent). I now propose to increase the customs duty on tea, coffee, copra, and coconut and
desiccated coconut from the present 35 per cent to 70 per cent.
126. Mr. Speaker, Sir, with the abolition of the remaining Quantitative Restrictions in April this
year second hand cars will also become freely importable. To allay the fears of surge in import of
second hand cars, the rate of basic customs duty on their import will be raised to 105 per cent,
which is three times the peak rate. The total duty now applicable to second hand cars will be
more than 180 per cent. I propose a similar structure of duty for the import of old multi utility
vehicles, scooters and motor cycles.
2002
132 . The House may recall that, in my last budget, I had announced that I would move
progressively to reduce the peak rate of customs duty to 20 per cent within three years. I had
also said that the modalities for this would be worked out in time for the next budget. I had
accordingly set up an Inter-Ministerial Working Group to recommend the modalities. The Group
has suggested a road map for this starting with this year’s budget. After careful consideration of
the Group’s report, I have decided that, by the year 2004-05, there would be only two basic rates
of customs duties, namely, 10 per cent covering generally raw materials, intermediates and
components and 20 per cent covering generally final products. The existing rates would be
adjusted and subsumed in these two basic rates with some exceptions on account of WTO
bindings or higher tariffs for agricultural products. In accordance with the road map, I propose to
reduce the peak rate from 35 per cent to 30 per cent this year. I also propose to make some
changes to take care of some current problems.
2003
External liberalisation
172 . Rate rationalisation and reduction of peak rates of customs duties has been an integral part
of economic reform in the country. The economy has not only ‘weathered’ the removal of
quantitative restrictions on imports and the reduction in customs duty rates, but has responded
by improving its competitiveness and demonstrating the inherent strength of its external balance
of payments. As a part of this continuous process, and in line with the pronouncements made by
several of my predecessors, I now propose to reduce the peak rate of customs duty from 30 per
cent to 25 per cent, excluding agriculture and dairy products.

BROOKINGS INDIA
58 | Trade Policy Reform in India Since 1991
2004
119. Now, I turn to my indirect tax proposals. The policy signal that needs to be reiterated is that
customs duties will be brought down in a measured way. It is my intention to align India’s tariff
structure to those of ASEAN countries. Eventually, there should be a uniform rate of tax on
goods and services. During the last four years, my predecessors had adjusted excise duties and
moved them towards a Central VAT rate. That process must continue. The most important goods
in the manufacturing sector must therefore bear an excise duty of 16 per cent.
120. Another principle that requires to be emphasised is that where an excise duty is levied,
subject to only a few exceptions, like goods when imported should attract an equivalent
countervailing duty (CVD). In my tax proposals, I have, therefore, removed the exemption from
CVD enjoyed by some imported goods where there is no corresponding exemption from excise
duty on Indian made goods.
121. I may also point out that customs tariffs and excise duties are inter-related. While
considering the tax regime for any sector, one must look at both customs duties and excise
duties applicable to that sector.
122. The peak rate of customs duty was reduced to 20 per cent in January 2004. I propose to
maintain the peak rate for the rest of the current fiscal year.
2005
112. I intend to advance the Government’s declared policy of making the customs duty
structure closer to that of our East Asian neighbours. Therefore, I propose to reduce the peak
rate for non-agricultural products from 20 per cent to 15 per cent.
2006
120. In line with the Government’s policy of reducing customs duties, I propose to reduce the
peak rate for non-agricultural products from 15 per cent to 12.5 per cent. I believe that we are
now only a short distance away from East Asian rates.
2007
126. In January 2007, Government announced wide ranging reductions in tariffs. Import duties
on capital goods, project imports, metals and specified inorganic chemicals were reduced by 2.5
percentage points and, in some cases, by 5 percentage points. Duties on some edible oils were
reduced by 10 to 12.5 percentage points.
127. In order to take one more step towards comparable East Asian rates, I propose to reduce
the peak rate for non-agricultural products from 12.5 per cent to 10 per cent.
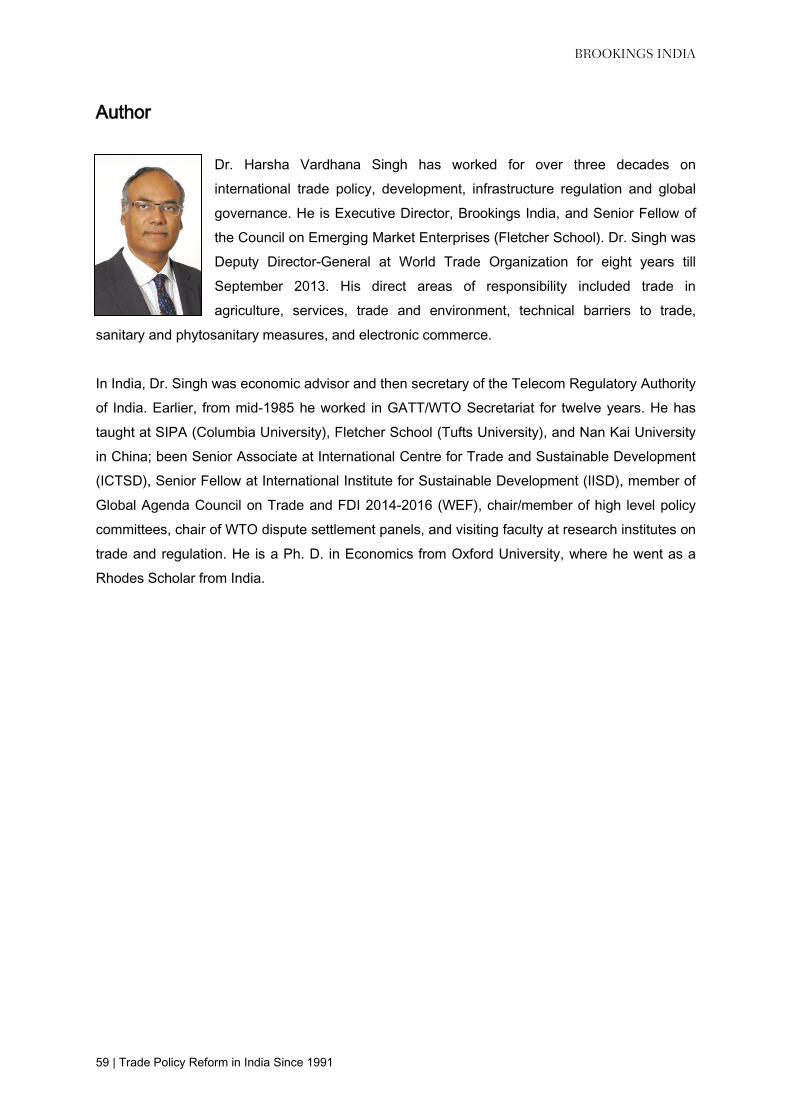
BROOKINGS INDIA
59 | Trade Policy Reform in India Since 1991
Author
Dr. Harsha Vardhana Singh has worked for over three decades on
international trade policy, development, infrastructure regulation and global
governance. He is Executive Director, Brookings India, and Senior Fellow of
the Council on Emerging Market Enterprises (Fletcher School). Dr. Singh was
Deputy Director-General at World Trade Organization for eight years till
September 2013. His direct areas of responsibility included trade in
agriculture, services, trade and environment, technical barriers to trade,
sanitary and phytosanitary measures, and electronic commerce.
In India, Dr. Singh was economic advisor and then secretary of the Telecom Regulatory Authority
of India. Earlier, from mid-1985 he worked in GATT/WTO Secretariat for twelve years. He has
taught at SIPA (Columbia University), Fletcher School (Tufts University), and Nan Kai University
in China; been Senior Associate at International Centre for Trade and Sustainable Development
(ICTSD), Senior Fellow at International Institute for Sustainable Development (IISD), member of
Global Agenda Council on Trade and FDI 2014-2016 (WEF), chair/member of high level policy
committees, chair of WTO dispute settlement panels, and visiting faculty at research institutes on
trade and regulation. He is a Ph. D. in Economics from Oxford University, where he went as a
Rhodes Scholar from India.


QUALITY. INDEPENDENCE. IMPACT.
Brookings Institution India CenterNo. 6, Second FloorDr. Jose P Rizal MargChanakyapuriNew Delhi – 110021www.brookings.in