Embed Size (px)
Citation preview

Comprehensive Annual Financial Report For the Years Ended September 30, 2014 and 2013
Brooks Development Authority (A Component Unit of the City of San Antonio, Texas) San Antonio, Texas

Brooks Development Authority (A Component Unit of the City of San Antonio, Texas)
San Antonio, Texas
Comprehensive Annual Financial Report For the Years Ended September 30, 2014 and 2013
Prepared by: Department of Finance, Accounting, and Administration
Milo D. Nitschke Chief Financial Officer

I‐1
Brooks Development Authority San Antonio, Texas For the Years Ended September 30, 2014 and 2013
Table of Contents Page
INTRODUCTORY SECTION
Letter of Transmittal I‐5
Board Members I‐9
Leadership and Advisors I‐10
Organization Chart I‐11
Geographic Map I‐12
FINANCIAL SECTION
Independent Auditor’s Report 3
Management’s Discussion and Analysis – Unaudited 5
Basic Financial Statements
Statements of Net Position 18
Statements of Revenues, Expenses, and Changes in Net Position 19
Statements of Cash Flows 20
Notes to the Financial Statements 21
STATISTICAL SECTION – UNAUDITED
Financial Trends
Net Position by Component 46
Changes in Net Position 47
Revenue Capacity
Lease Revenue Components 50
Direct Rates Applied to the Revenue Base 51
Information About Major Payors and Remitters of Lease Revenue 52
Debt Capacity
Ratios of Total Outstanding Debt 54
Debt Coverage Ratios 55
Demographic and Economic Information
City of San Antonio Demographic and Economic Statistics 58
Principal Employers 59

I‐2
Page
Operating Information
Full‐Time Equivalent Employees by Department 62
Level Demand for Services 63
Tax Increment Reinvestment Zone 64
Regional Center EB‐5 Program 66
Master Land Use Plan and Maps 67
Economic Impact 70
Proposed Infrastructure Projects 71

I‐3
Introductory Section

I‐4
(This page intentionally left blank.)

I‐5
March 24, 2015
To the Board of Directors of Brooks Development Authority:
We are pleased to present the Comprehensive Annual Financial Report of the Brooks Development Authority (“BDA”) for the year ended September 30, 2014. This report was prepared by BDA’s Department of Finance, Accounting, and Administration. This Comprehensive Annual Financial Report is published to provide our Board of Directors, citizens, bondholders and other interested parties with detailed information concerning the financial condition and activities of BDA. Management assumes full responsibility for the completeness and reliability of the presented data including all disclosures. We believe the information, as presented, is accurate in all material respects and that it is presented in a manner designed to fairly set forth the financial position and results of operations of BDA. Padgett, Stratemann & Co., L.L.P., Certified Public Accountants, have issued an unmodified (“clean”) opinion on BDA’s financial statements for the year ended September 30, 2014. The Independent Auditor’s Report is located at the front of the Financial Section of this report. Management’s Discussion and Analysis (“MD&A”) immediately follows the Independent Auditors’ Report and provides a narrative introduction, overview, and analysis of the basic financial statements. MD&A complements this letter of transmittal and should be read in conjunction with it. PROFILE OF THE BROOKS DEVELOPMENT AUTHORITY BDA is a Defense Base Development Authority, which is a special purpose political subdivision under Section 379B of the Local Government Code of Texas. On September 27, 2001 a resolution was passed by the San Antonio City Council that established the BDA. Under the provisions of Section 379B of the Local Government Code of Texas, the City of San Antonio was empowered to create a Defense Base Development Authority to accept title to Brooks Air Force Base and engage in economic development of the base, a military installation located within the City of San Antonio. Brooks Air Force Base was sold and transferred to the community by the Secretary of the Air Force, pursuant to authority conferred by the Military Construction Act, Public Law No. 106‐246, and is now known as Brooks City Base. In addition to its role in economic development, the BDA is responsible for property and infrastructure maintenance, development, land use and environmental planning for Brooks City Base.

I‐6
The 2005 Base Realignment and Closure (BRAC) decision relocated Air Force missions to other installations and brought to an end 95 years of active military operations at Brooks City Base. In September 2011 a new era of innovation began at Brooks City Base as the Air Force officially left the development. For the first time in more than 95 years, Brooks City Base became an open campus as part of that transition. Today, Brooks City Base represents a master planned community offering affordable housing and more than 1,200 acres of real estate for mixed‐use development. Since its inception, the community has attracted 29 businesses including public and private sector players in healthcare, energy, education, recreation, and other industries. This area features amenities, infrastructure, and resources that make it an ideal location for companies looking to locate or expand their presence in a competitive business environment. Surrounded by a variety of entertainment and hospitality options, and positioned among major national and international trade routes. Brooks City Base offers unique incentives, a sound investment, and an ideal location to live, work, learn, and play. As the owner and developer, BDA offers a variety of creative financial assistance programs to encourage business attraction and expansion. BDA is governed by a board of directors consisting of eleven members, individually appointed by the City Council of San Antonio. There are two standing board committees: the Planning & Development Committee and the Finance Committee. The Planning & Development Committee responsibilities include vision, goals, objectives, strategies, definition and measurement of success, physical planning, marketing, development and construction, historic preservation, and sales and leasing. The Finance Committee responsibilities include accounting, legal, risk, regulatory, personnel, administration, management, property and resource management, utilities, equipment maintenance, safety and security. FACTORS AFFECTING FINANCIAL CONDITION The information presented in the financial statements is perhaps best understood when it is considered from the broader perspective of the specific environment within which the BDA operates. LOCAL ECONOMY Brooks City Base is located in southeast San Antonio, Texas encompassing 1,200 acres of public and private sector players, which include healthcare, energy, education, recreation, and other industries. Since its inception, the community has attracted 29 businesses including DPT Laboratories, Mission Trail Baptist Hospital, Mission Solar, Calumet, and the University of the Incarnate Word Medical School. Brooks City Base has access to major national and international trade routes, as well as its proximity to quality healthcare facilities, and contributes to its strong economic development. In 2014, total economic activity attributed to businesses located within Brooks City Base supported over 2,699 jobs.
I‐7
LONG TERM FINANCIAL PLANNING BDA employs a comprehensive multi‐year, Financial Master Plan which incorporates the operating budget and capital improvement planning programs which are updated annually. Capital improvements include public infrastructure construction of roads, drainage, parking, utilities, historic preservation, parks, hike and bike trails, public transportation, and other public improvements. Capital improvements also includes economic development capital outlays for land and vertical structures to support a mixed use community of retail outlets, office space, education facilities, dining establishments, hospitality businesses, and other community components that make up a live, work, learn, and play community. Capital improvements are long‐term investments with asset life expectancies of three to fifty years or more. Debt management is a major component of the financial planning model which incorporates projected financing needs for public and economic development infrastructure that is consistent with BDA’s Land Use Plan while at the same time measuring and assessing the cost and timing of each debt issuance. Financial Management incorporates BDA’s fiduciary responsibilities to protect asset values while maximizing the use of financial resources, minimizing costs, and mitigating financial risk. The Finance Department is responsible for the administration and management of BDA’s budget, debt program, investment practice, and implementation of banking services. The financial management practice is comprehensive and dynamic which utilizes the application of quantitative technical analysis to evaluate, update, design, structure and restructure its financial position. On‐going financial analysis is used to: (1) develop financing structures that incorporate multiple sources of funding such as land equity, cash equity, debt, EB‐5 financing, New Market Tax Credits (NMTC), Historic Tax Credits and other financial instruments and tools to finance capital improvements; (2) design financing structures that are financially sound, prudent and secure; (3) minimize the cost of financing; (4) develop and protect BDA’s credit‐worthiness; (5) evaluate and advise on financial options, costs, risks, and limitations on projects to be financed; (6) evaluate financing proposals; and (7) perform cash flow analyses on project and fund balances, revenues, projected short and long‐term capital improvement program financings and existing debt and future debt issuances. Management of BDA is responsible for establishing and maintaining an internal control structure designed to ensure that the assets of BDA are protected from loss, theft, or misuse and to ensure that adequate accounting data are compiled to allow for the preparation of financial statements in conformity with generally accepted accounting principles. The concept of reasonable assurance recognizes that the cost of a control should not exceed the expected benefits and that the evaluation of costs and benefits require management’s estimates. The concept of reasonable assurance recognizes that: (1) the cost of a control should not exceed the benefits likely to be derived: and (2) the valuation of costs and benefits require estimates and judgments by management. All internal control evaluations occur within the above framework. Because of the inherent limitations in all control systems, no evaluation of


I‐9
Brooks Development Authority Board Members Fiscal Year 2014
Manuel A. Pelaez‐Prada District 7
Board of Directors ‐ Chair
John P. Jennings Margaret Wilson‐Anaglia Michelle Krupa Ramiro A. Cavazos Carlos Contreras District 1 District 2 District 3 District 4 District 5 ‐ City Manager’s Office Manuel Villa Steven Goldberg Tamara Tapman Jesse Hereford Iñigo Arzac District 6 District 8 District 9 District 10 Mayor’s Office (Resigned December 2014)
I‐10
Brooks Development Authority San Antonio, Texas
Leadership and Advisors
Leadership
Leo Gomez President and Chief Executive Officer Roland A. Lozano Chief Operating Officer Milo Nitschke Chief Financial Officer Karen Dickson, CEcD Vice President of Economic Development John C. McCarthy Vice President of Facilities and Infrastructure Debbie D. Perales Vice President of Administration and Tenant Relations Natalia Martinez Director of Public Affairs Sha‐Rone Caffie‐Reyes Director of Brooks City Base EB‐5 Regional Center Sonia Veliz Executive Assistant to the President and Chief Executive Officer
Advisors
Davidson Troilo Ream & Garza PC General Counsel
San Antonio, Texas
First Southwest Company Financial Advisor San Antonio, Texas
Padgett, Stratemann & Co., L.L.P.
Certified Public Accountants – Audit Firm San Antonio, Texas


Page 1
Financial Section

Page 2
(This page intentionally left blank.)

AUSTIN HOUSTON SAN ANTONIO 811 BARTON SPRINGS ROAD, SUITE 550 1980 POST OAK BOULEVARD, SUITE 1500 100 N.E. LOOP 410, SUITE 1100 TOLL FREE: 800 879 4966
AUSTIN, TEXAS 78704 HOUSTON, TEXAS 77056 SAN ANTONIO, TEXAS 78216 WEB: PADGETT‐CPA.COM
512 476 0717 800 879 4966 210 828 6281
Independent Auditor’s Report To the Board of Directors Brooks Development Authority San Antonio, Texas Report on the Financial Statements We have audited the accompanying financial statements of the business‐type activities of Brooks Development Authority (“BDA”), a component unit of the City of San Antonio, Texas, as of and for the years ended September 30, 2014 and 2013, and the related notes to the financial statements, which collectively comprise BDA’s basic financial statements, as listed in the table of contents. Management’s Responsibility for the Financial Statements Management is responsible for the preparation and fair presentation of these financial statements in accordance with accounting principles generally accepted in the United States of America; this includes the design, implementation, and maintenance of internal control relevant to the preparation and fair presentation of financial statements that are free from material misstatement, whether due to fraud or error. Auditor’s Responsibility Our responsibility is to express an opinion on these financial statements based on our audits. We conducted our audits in accordance with auditing standards generally accepted in the United States of America. Those standards require that we plan and perform the audit to obtain reasonable assurance about whether the financial statements are free from material misstatement. An audit involves performing procedures to obtain audit evidence about the amounts and disclosures in the financial statements. The procedures selected depend on the auditor’s judgment, including the assessment of the risks of material misstatement of the financial statements, whether due to fraud or error. In making those risk assessments, the auditor considers internal control relevant to BDA’s preparation and fair presentation of the financial statements in order to design audit procedures that are appropriate in the circumstances, but not for the purpose of expressing an opinion on the effectiveness of BDA’s internal control. Accordingly, we express no such opinion. An audit also includes evaluating the appropriateness of accounting policies used and the reasonableness of significant accounting estimates made by management, as well as evaluating the overall presentation of the financial statements. We believe that the audit evidence we have obtained is sufficient and appropriate to provide a basis for our audit opinion.

Page 4
Opinion In our opinion, the financial statements referred to above present fairly, in all material respects, the financial position of the business‐type activities of BDA as of September 30, 2014 and 2013, and the changes in its financial position and its cash flows for the years then ended, in accordance with accounting principles generally accepted in the United States of America. Other Matters Required Supplementary Information Accounting principles generally accepted in the United States of America require that the Management’s Discussion and Analysis, as listed in the table of contents, be presented to supplement the basic financial statements. Such information, although not a part of the basic financial statements, is required by the Governmental Accounting Standards Board, who considers it to be an essential part of financial reporting for placing the basic financial statements in an appropriate operational, economic, or historical context. We have applied certain limited procedures to the required supplementary information in accordance with auditing standards generally accepted in the United States of America, which consisted of inquiries of management about the methods of preparing the information and comparing the information for consistency with management’s responses to our inquiries, the basic financial statements, and other knowledge we obtained during our audit of the basic financial statements. We do not express an opinion or provide any assurance on the information because the limited procedures do not provide us with sufficient evidence to express an opinion or provide any assurance. Other Information Our audit was conducted for the purpose of forming an opinion on the financial statements that collectively comprise BDA’s basic financial statements. The Introductory Section and the Statistical Section, as listed in the table of contents, are presented for purposes of additional analysis and are not a required part of the basic financial statements. The Introductory and Statistical Sections have not been subjected to the auditing procedures applied in the audits of the basic financial statements and, accordingly, we do not express an opinion or provide any assurance on them.
San Antonio, Texas December 19, 2014

Brooks Development Authority San Antonio, Texas
Management’s Discussion and Analysis – Unaudited Years Ended September 30, 2014 and 2013
Page 5
As management of Brooks Development Authority (“BDA”), we offer the following Management’s Discussion and Analysis (“MD&A”). The MD&A serves as an introduction to the financial statements for the fiscal years ended September 30, 2014 and 2013 and is designed to assist the reader in focusing on significant financial issues and activities and identifying any significant changes in financial position. We encourage readers to consider the information presented here in conjunction with the financial statements as a whole.
Financial Highlights
The assets of BDA exceeded its liabilities at the close of 2014 by $59,047,038. Of this amount, $18,432,893 is considered unrestricted and may be used to meet ongoing financial obligations. The balance of net position, $40,614,145, is the net amount invested in capital assets.
The BDA’s total net position increased by $6,893,865 from fiscal year 2013. This increase is primarily due to the sale of the Landings I Apartments, which is a gain on sale of capital assets, and is included in nonoperating revenues totaling $10,388,383. The sale of the Landing I Apartments allowed BDA to designate some of the sales proceeds as board‐designated funds to cover anticipated future shortfalls. Additionally, BDA wrote off net book value of $57,626 in buildings, which were considered permanently impaired. In fiscal year 2013, net position decreased by $21,602,694 from fiscal year 2012. This decrease is primarily due to BDA releasing to the City of San Antonio $23,062,201 in net book value of roads and infrastructure. Additionally, BDA wrote off net book value of $504,336 in buildings, which were considered permanently impaired.
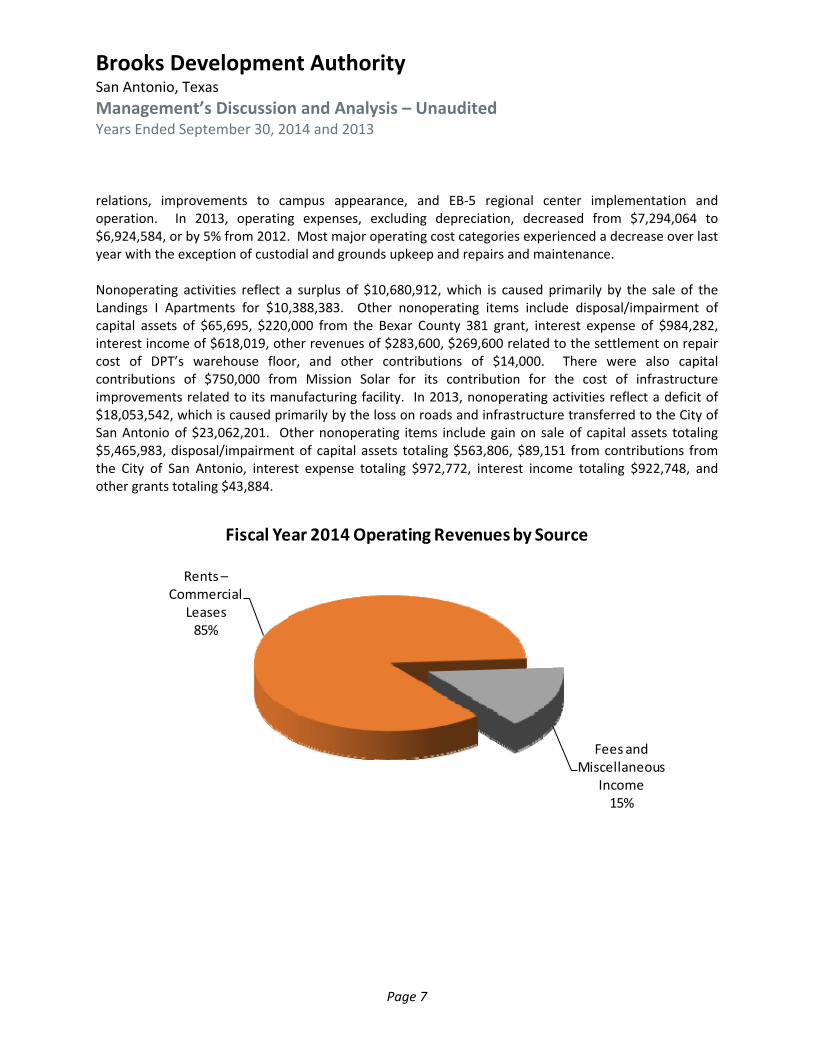
The primary source of BDA’s operating revenue of $8,240,475 stems from its commercial leases; this year totaling $7,011,484, or 85% of total operating revenue. In addition, BDA realized $1,228,991 from common area maintenance (“CAM”) fees, utility reimbursements, and other miscellaneous income. BDA continues to increase its commercial leases, increasing them by 10% over fiscal year 2013. BDA has realized $1,396,916 in revenue from its agreement with NRP Management, LLC (“NRP”) related to managing the 163 single‐family homes and duplexes, which comprise the Brooks Heritage Oaks at Brooks City‐Base (the “Heritage Project”), formerly military residential housing. As of September 30, 2014, BDA has recognized $500,000 as ground lease revenue related to the Mission Solar Manufacturing Facility, which was completed in July 2014. Fiscal year 2013 represents the second year BDA operated without Air Force lease revenue. Commercial leases increased by 5% in fiscal year 2013 after a drop of 43% in fiscal year 2012.
Basic Financial Statements The basic financial statements are comprised of the statement of financial position, statements of revenues, expenses, and changes in net position, and the statements of cash flows. The basic financial statements report information using accounting methods similar to those used by private sector companies. These financial statements are prepared under the accrual basis of accounting in which

Brooks Development Authority San Antonio, Texas
Management’s Discussion and Analysis – Unaudited Years Ended September 30, 2014 and 2013
Page 6
revenues and assets are recognized when earned or acquired, and expenses and liabilities are recognized when incurred, regardless of when cash is received or paid. These financial statements also offer short‐term and long‐term financial information about its activities. The statements of net position include all BDA’s assets, deferred outflow of resources, and liabilities and provides information about the nature and amount of investments in resources (assets) and the obligations to creditors (liabilities). It also provides the basis for evaluating the capital structure of BDA and assessing the liquidity and its financial flexibility. The statements of revenues, expenses, and changes in net position present operating revenues and expenses and nonoperating revenues and expenses. Operating revenues and expenses consist of revenues earned and expenses incurred related to the operation and maintenance of the Brooks City Base property. Nonoperating revenues and expenses consist of investment income, capital assets sales, and dispositions related to permanent impairments or transfers to the City of San Antonio; and grants in aid from the City of San Antonio, and the Office of Economic Adjustment on behalf of the Department of Defense, and a grant from Bexar County for reimbursement of capital expenditures, as well as interest expense. The statements of cash flows report cash inflows and outflows and net changes in cash resulting from operating, capital, and financing activities and provides answers to such questions as where did cash come from, what was the cash used for, and what was the change in the cash balance during the reporting period.
Notes to the Financial Statements The notes provide additional information that is essential for a full understanding of the data provided in the basic financial statements.
Financial Analysis BDA’s total fiscal year 2014 operating revenues increased by 9% over fiscal year 2013 as a result of BDA’s effort to continue to increase its commercial lease revenues after the Air Force lease vacated in fiscal year 2011. Commercial lease revenue increased by 10% over last year going from $6,385,056 in fiscal year 2013 to $7,011,484 in fiscal year 2014. In 2013, operating revenues increased by 3% over fiscal year 2012 as a result of BDA’s effort to replace Air Force lease revenue, which ended in fiscal year 2011. Commercial lease revenue increased by 5% over last year going from $6,054,329 in fiscal year 2012 to $6,385,056 in fiscal year 2013. Operating expenses, excluding depreciation, increased from $6,924,584 to $8,923,679, or by 29% from fiscal year 2013. Most major operating cost categories experienced an increase over last year with the exception of utilities, property management and development, and depreciation. These increases are due mainly to the new direction that leadership is undertaking which includes an aggressive marketing program to promote Brooks City Base, plus an increase in staff, increase in outreach, travel, tenant
Brooks Development Authority San Antonio, Texas
Management’s Discussion and Analysis – Unaudited Years Ended September 30, 2014 and 2013
Page 7
relations, improvements to campus appearance, and EB‐5 regional center implementation and operation. In 2013, operating expenses, excluding depreciation, decreased from $7,294,064 to $6,924,584, or by 5% from 2012. Most major operating cost categories experienced a decrease over last year with the exception of custodial and grounds upkeep and repairs and maintenance. Nonoperating activities reflect a surplus of $10,680,912, which is caused primarily by the sale of the Landings I Apartments for $10,388,383. Other nonoperating items include disposal/impairment of capital assets of $65,695, $220,000 from the Bexar County 381 grant, interest expense of $984,282, interest income of $618,019, other revenues of $283,600, $269,600 related to the settlement on repair cost of DPT’s warehouse floor, and other contributions of $14,000. There were also capital contributions of $750,000 from Mission Solar for its contribution for the cost of infrastructure improvements related to its manufacturing facility. In 2013, nonoperating activities reflect a deficit of $18,053,542, which is caused primarily by the loss on roads and infrastructure transferred to the City of San Antonio of $23,062,201. Other nonoperating items include gain on sale of capital assets totaling $5,465,983, disposal/impairment of capital assets totaling $563,806, $89,151 from contributions from the City of San Antonio, interest expense totaling $972,772, interest income totaling $922,748, and other grants totaling $43,884.
Rents –Commercial
Leases85%
Fees and Miscellaneous
Income15%
Fiscal Year 2014 Operating Revenues by Source

Brooks Development Authority San Antonio, Texas
Management’s Discussion and Analysis – Unaudited Years Ended September 30, 2014 and 2013
Page 8
Administration and Support
60%
Custodial and Grounds Upkeep
6%
Environmental and Safety
4%Insurance
4%
Property Management
and Development
1%
Repairs and Maintenance
16%
Utilities9%
Fiscal Year 2014 Operating Expenses by Source(Excluding Depreciation Expense)
Investment and Interest Income
5%
Gain on Sale of Capital Assets
89%
Other Grants2%
Other Revenue2%
Other2%
Fiscal Year 2014 Nonoperating Revenues by Source

Brooks Development Authority San Antonio, Texas
Management’s Discussion and Analysis – Unaudited Years Ended September 30, 2014 and 2013
Page 9
Table 1 Condensed Statement of Net Position Information
2012
2014 2013 (Restated)
Current assets $ 24,857,337 $ 19,948,957 $ 13,203,933Capital assets 63,031,578 58,398,728 80,414,521Deferred outflow of resources 2,396,709 2,593,557 3,871,515
Total assets and deferred outflow
of resources $ 90,285,624 $ 80,941,242 $ 97,489,969
Current liabilities $ 3,944,816 $ 3,914,272 $ 2,452,994Noncurrent liabilities 27,293,770 24,873,797 21,281,108
Total liabilities 31,238,586 28,788,069 23,734,102
Net position:Net investment in capital assets 40,614,145 39,314,000 62,274,829Unrestricted 18,432,893 12,839,173 11,481,038
Total net position 59,047,038 52,153,173 73,755,867
Total liabilities and net position $ 90,285,624 $ 80,941,242 $ 97,489,969
BDA’s net position increased $6,893,865 from $52,153,173 to $59,047,038 (Table 2) resulting from a combination of net operating loss of $4,537,047, gain on sale of capital assets of $10,388,383, net nonoperating revenues of $358,224, and disposal/impairment of capital assets of $65,695. In 2013, net position decreased $21,602,694 from $73,755,867 to $52,153,173 (Table 2) resulting from a combination of net operating loss of $3,549,152, net nonoperating revenues of $17,331, gain on sale of capital assets of $5,465,983, and contributions of $89,151. In addition, the decrease in net position is primarily attributed to noncash items consisting of depreciation expense of $4,155,130, disposal/ impairment of capital assets of $563,806, and loss on roads and infrastructure transferred to City of San Antonio of $23,062,201.

Brooks Development Authority San Antonio, Texas
Management’s Discussion and Analysis – Unaudited Years Ended September 30, 2014 and 2013
Page 10
Table 2 Condensed Revenues, Expenses, and Changes in Net Position Information
2012
2014 2013 (Restated)
Operating RevenuesRents – commercial leases $ 7,011,484 $ 6,385,056 $ 6,054,329 Fees and miscellaneous income 1,228,991 1,145,506 1,277,668
Total operating revenues 8,240,475 7,530,562 7,331,997
Operating expenses 8,923,679 6,924,584 7,294,064Depreciation 3,853,843 4,155,130 4,934,981
Total operating expenses 12,777,522 11,079,714 12,229,045
Operating loss (4,537,047) (3,549,152) (4,897,048)
Nonoperating Revenues (Expenses)Gain on sale of capital assets 10,388,383 5,465,983 915,174Disposal/impairment of capital assets (65,695) (563,806) (2,001,163)Loss on roads and infrastructuretransferred to City of San Antonio ‐ (23,062,201) (4,997,611)
Contributions ‐ 89,151 2,042,812Nonoperating revenues (expenses) – net 358,224 17,331 671,126
Total nonoperating revenues (expenses) – net 10,680,912 (18,053,542) (3,369,662)
Capital contributions 750,000 ‐ ‐
Change in net position 6,893,865 (21,602,694) (8,266,710)
Net position at beginning of year – as restated 52,153,173 73,755,867 82,022,577
Net position at end of year $ 59,047,038 $ 52,153,173 $ 73,755,867
Other Key Initiatives The following are significant events that impacted BDA in fiscal year 2014. BDA continues to undertake initiatives to transform the former Air Force base into the vibrant Brooks City Base. Policy Development/Governance
In December 2013, BDA executed a contract with Land Analytics, LLC to perform the appraisal of the 789 acres of land and various buildings.

Brooks Development Authority San Antonio, Texas
Management’s Discussion and Analysis – Unaudited Years Ended September 30, 2014 and 2013
Page 11
In January 2014, BDA executed a contract with Live Oak Gottesman to provide Master Development Services.
In March 2014, BDA negotiated and executed a contract with Beaty Palmer Architects for the design and construction services for the Brooks Linear Park and Multi‐Use Pathways Project (Phase I).
In May 2014, BDA negotiated and executed a funding agreement with the City of San Antonio totaling $2,940,000 for the design and construction of Phase 1 of the Brooks Linear Park and Multi‐Use Pathways Project.
In June 2014, BDA negotiated and executed a funding agreement with the City of San Antonio totaling $245,000 for support of the restoration of Hangar 9.
In July 2014, BDA approved the Development Principles and Land Use Plan that will guide the development of the Brooks campus.
Land Sales and New Leases
In November 2013, BDA negotiated and executed a development agreement with 210 Development Group, LLC for the remodel of Buildings 718 and 719. The overall project will be 86 residential units, made up of 54 remodeled residential units and construction of 32 new residential units on 4.2 acres.
In December 2014, BDA negotiated and executed a 60‐month lease amendment to the lease agreement with the City of San Antonio SAPD K‐9 unit reducing the original 5 acres of outside area to 1.64 acres at a rate of $1.00 per year.
In December 2014, BDA negotiated and executed a ten‐month lease with the City of San Antonio Animal Care Services for Buildings 1014 and 1017 and approximately 1.94 acres.
In March 2014, BDA negotiated and executed all documents related to the assignment of the lease on the Landings I Apartments to Pensam Capital, Inc. for approximately $39,500,000.
In March 2014, BDA negotiated and executed a 24‐month lease for Building 1195 with DPT Laboratories on an as‐is basis at the rate of $2,500 per month, or $30,000 annually.
In May 2014, BDA negotiated and executed a Memorandum of Understanding with the University of the Incarnate Word (“UIW”) to reserve up to 7 buildings and up to 23 acres of land on the “The Hill” for a medical school campus.
In May 2014, BDA negotiated and executed an application for a hotel franchise; negotiated and executed agreements with an architect and engineering design team, a consultant for contract/ agreement development; and extended the Memorandum of Understanding with Phoenix Hospitality Group – McClure Hagee Management for an amount not to exceed $205,000.

Brooks Development Authority San Antonio, Texas
Management’s Discussion and Analysis – Unaudited Years Ended September 30, 2014 and 2013
Page 12
In June 2014, BDA negotiated a 12‐month second lease renewal for Buildings 159, 160, and 170 with Wyle Laboratories, Inc. for a total annual extended base rental amount of $362,500, plus $69,750 annual CAM, for a total annual amount of $432,250.
In July 2014, BDA executed an amendment with Bridge PTS where tenants will begin paying CAM immediately, and future rent payments will be adjusted based on revenues and financial condition of tenant.
In July 2014, BDA negotiated and executed a development agreement with Phoenix Hospitality Group for the development and construction of a hotel.
In July 2014, BDA negotiated and executed a 25‐year lease agreement with UIW for approximately 16.13 acres of land and approximately 112,321 gross square feet of classrooms, laboratories, and office space with an expansion option “Phase 2,” situated on approximately 7.52 acres of land, which includes approximately 109,342 square feet of building space, plus approximately 46,135 square feet remaining in Building 180 not included in Phase 1. UIW will pay a CAM charge of $250,000 per annum.
In July 2014, BDA negotiated and executed an 11 ½ month lease for a portion of Building 1106 with the Bexar County Office of Emergency Management for approximately 13,092 square feet at $5.00 per square foot ($5,455 monthly; $65,460 annually).
In September 2014, BDA negotiated and executed all documents related to the purchase of 1.7 acres of undeveloped land at the corner of South Presa and Henderson Court totaling $205,000. BDA will have 90 days after the execution and delivery of a signed sales contract relating to an inspection period to complete its due diligence.
Financial Planning
On September 16, 2014, BDA’s Board of Directors approved the establishment of board‐designated funds totaling $12,532,941. Board‐designated reserve funds were created for the following purposes: (1) cover projected operating revenue shortfalls through fiscal year 2016; (2) comply with the QPM Partners Escrow Fund requirements; (3) provide an operating reserve to cover unexpected shortfalls; (4) establish a repair and replacement fund; (5) create a balance to be used solely for the purpose of making improvements to Hangar 9; and (6) to transfer an amount to the Brooks City Base Foundation to be used for BDA improvements.
In August 2014, BDA executed a commitment letter for an 18‐month bridge loan with Brevet Capital Advisors for a hotel project totaling $7,300,000 at an internal rate of return of 15% with a payoff of $9,163,078.
In August 2014, BDA executed a commitment letter for a bridge loan for the Aviator Apartment Project totaling $4,600,000.

Brooks Development Authority San Antonio, Texas
Management’s Discussion and Analysis – Unaudited Years Ended September 30, 2014 and 2013
Page 13
Leveraging Resources
In August 2014, the fiscal year 2015 Operating Budget was approved, which sets into motion the new direction that leadership is undertaking which involves increasing awareness of Brooks City Base through the use of an aggressive marketing program, improvements to campus appearance, securing additional public funding, and utilizing the EB‐5 program to attract foreign investors to Brooks City Base.
Project Development
In February 2014, BDA negotiated and executed a contract with Valla Construction for ADA renovations at Building 532, which is occupied by Volt Information Systems. BDA agreed to provide revisions to the front handicap parking spaces; install sidewalk ramps, striping, and signage; renovations to the second floor men and women’s restrooms; flooring repairs; replacement of the elevator cab’s grab bar and installation of wall button Braille designations; and completion of HVAC and lighting/electrical. Completion of this project is expected in the first quarter of fiscal year 2015.
In May 2014, BDA negotiated and executed a contract with D. Plata Construction Co., LLC for the completion of parking lot and landscaping improvements at Building 661, which is occupied by Calumet Specialty Products, totaling $321,635. The parking lot was reconfigured, and BDA agreed to increase the number of marked parking spaces from 87 to 192.
Marketing In fiscal year 2014 Brooks City Base implemented a public affairs strategy that integrated all communications for the organization in order to effectively promote Brooks City Base as a as a premier mixed‐use community. The public affairs strategy incorporates marketing, public relations, and legislative programs focused on establishing relationships with key organizations to leverage economic development, as well as investment attraction and retention efforts. The three pillars of the integrative public affairs strategy consisted of the following:
Marketing – the new brand, established in November 2013, was promoted in local, regional, and international target markets. The purpose was to increase brand awareness and position Brooks City Base as an ideal business location by way of a road show where the new campus‐wide land use plan was rolled out into the community.
Public Relations – new development on Brooks City Base was showcased through a series of public events to announce new project ground breakings, ribbon cuttings, etc. The aim was to reinforce positive brand equity by broadcasting and celebrating economic impact initiatives through community engagement.

Brooks Development Authority San Antonio, Texas
Management’s Discussion and Analysis – Unaudited Years Ended September 30, 2014 and 2013
Page 14
Legislative Programs – relationships with local, state, and federal government entities were strengthened to raise Brooks City Base’s profile as a model for redevelopment in the BRAC (Base Realignment and Closure) community. The main objective was to increase accessibility to public funding opportunities tied to economic development on the Brooks City Base campus.
Capital Assets BDA’s capital assets totaled $63,031,578 (net of accumulated depreciation) as of September 30, 2014. Capital assets include land, roads, building, leasehold improvements, infrastructure and improvements, equipment and furniture and fixtures. Significant capital asset events occurring during the current fiscal year included the following:
There was a total of $443,389 in investment in equipment, furniture, and fixtures, which included $314,852 in fire alarm systems for various buildings, three security vehicle for $43,929, landscaping equipment for $26,877, two maintenance vehicles for $46,853, and other equipment for $10,878.
Infrastructure improvements included parking lot lighting and striping for $494,310 supporting Building 775.
Building improvements and renovations totaled $1,472,388, which included DPT flooring repair for $432,618, second floor improvements to Building 532 for $705,525, renovations to Building 510A for $24,586 and Building 511 for $145,564, roof replacement to Building 502 for $69,329, and Building 532 ADA renovations for $94,766.
The Research Plaza road extension and Mission Creek Detention Basin Project were completed totaling $7,248,288.
Additional information on BDA’s capital assets can be found in Note 6 to the financial statements.

Brooks Development Authority San Antonio, Texas
Management’s Discussion and Analysis – Unaudited Years Ended September 30, 2014 and 2013
Page 15
The property under operating leases and property not under lease at September 30, 2014 are as follows:
Table 3
Capital Assets
Under NotOperating UnderLeases Leases Total
Land $ ‐ $ 4,500,178 $ 4,500,178Construction in progress ‐ 1,969,805 1,969,805Roads ‐ 13,272,434 13,272,434Infrastructure and improvements – depreciable ‐ 12,544,461 12,544,461
Facilities and other improvements ‐ 616,225 616,225Buildings 44,306,164 18,648,833 62,954,997Furniture, fixtures, and equipment 5,905,310 3,571,064 9,476,374Software ‐ 321,953 321,953
50,211,474 55,444,953 105,656,427Less accumulated depreciation 18,103,114 24,521,735 42,624,849
Net capital assets $ 32,108,360 $ 30,923,218 $ 63,031,578
Investments As of September 30, 2014, BDA had $13,747,832 in investments that consisted entirely of money market funds ($7,344,364 in 2013). See Note 2 to the financial statements for classification of investments on the statements of net position (reported as cash and cash equivalents on the statements of net position).
Debt As of September 30, 2014, BDA had a balance of $22,417,434 in outstanding debt. This is made up of a loan of $11,625,140 from JPMorgan Chase for the DPT Laboratories construction project, three loans from the State Energy Conservation Office Stimulus Program totaling $6,192,294, and a loan with Brevet Capital Special Opportunities Fund III, L.P. for $4,600,000. In 2013, BDA had a balance of $19,284,728 in outstanding debt. This is made up of a loan of $12,180,226 from JPMorgan Chase for the DPT Laboratories construction project, San Antonio Water System (“SAWS”) agreement of $200,000, and three loans from the State Energy Conservation Office Stimulus Program totaling $6,904,502. Additional information on BDA’s debt can be found in Note 11 to the financial statements.

Brooks Development Authority San Antonio, Texas
Management’s Discussion and Analysis – Unaudited Years Ended September 30, 2014 and 2013
Page 16
Risk Factors Influencing Future Operations BDA’s mission is to promote, develop, and sustain a vibrant community and catalyst for progressive economic development and prosperity. To enhance administrative efficiency, BDA has undergone a comprehensive evaluation of its internal strengths and weaknesses and external opportunities and threats. The following are factors influencing the future operations of BDA:
BRAC – The most significant factor is the ability of BDA to renovate and commercially lease the facilities vacated by the Air Force.
Tax Incremental Reinvestment Zone (“TIRZ”) – Brooks City Base was approved as a TIRZ, which may provide up to approximately $55,000,000 to aid in the development of South New Braunfels Avenue Road Extension Project. The South New Braunfels Avenue Road Extension Project is estimated to cost a total of $58,400,000, including financing costs. BDA will have to seek additional funding to assist in completing this project. The completion of this new thoroughfare will connect Brooks City Base with the major roadway of Loop 410 South.
Commercial development – Many of the buildings that were vacated by the Air Force are past their useful life. The liability or cost of demolition has an effect on the plan for commercial development.
Leveraging assets – Leveraging assets will continue to play a major role in securing financing for future capital development projects, as well as establishing public/private partnerships for achieving financing goals.
Request for Information This financial report is designed to provide a general overview of BDA’s finances. Questions concerning any of the information provided in this report or requests for additional financial information should be addressed to the Chief Financial Officer, 3201 Sidney Brooks, San Antonio, Texas 78235.

Page 17
Basic Financial Statements

Brooks Development Authority San Antonio, Texas
Statements of Net Position September 30, 2014 and 2013
The accompanying notes form an integral part of these statements. Page 18
ASSETS AND DEFERRED OUTFLOW OF RESOURCES 2014 2013
Current AssetsCash and cash equivalents $ 24,236,406 $ 13,526,123Accounts receivable – net of allowance for doubtful accounts 461,006 1,281,098Mezzanine notes receivable ‐ 3,909,510Accrued interest 5,378 1,058,502Prepaid expenses 110,265 128,963Inventories 44,282 44,761
Total current assets 24,857,337 19,948,957
Noncurrent AssetsCapital assets – net 63,031,578 58,398,728
Deferred Outflow of ResourcesDerivative instrument 2,396,709 2,593,557
Total assets and deferred outflow of resources $ 90,285,624 $ 80,941,242
LIABILITIES AND NET POSITION
Current LiabilitiesAccounts payable $ 1,610,370 $ 1,677,518Accrued expenses 84,132 113,556Current portion of long‐term liabilities 1,420,192 1,349,002Unearned revenues 669,289 613,363Tenant security deposits 160,833 160,833
Total current liabilities 3,944,816 3,914,272
Long‐Term LiabilitiesUnearned revenues 3,739,262 4,208,333 Derivative instrument liability 2,396,709 2,593,557Long‐term debt and other liabilities 21,157,799 18,071,907
Total long‐term liabilities 27,293,770 24,873,797
Total liabilities 31,238,586 28,788,069
Net PositionNet investment in capital assets 40,614,145 39,314,000Unrestricted 18,432,893 12,839,173
Total net position 59,047,038 52,153,173
Total liabilities and net position $ 90,285,624 $ 80,941,242

Brooks Development Authority San Antonio, Texas
Statements of Revenues, Expenses, and Changes in Net Position Years Ended September 30, 2014 and 2013
The accompanying notes form an integral part of these statements. Page 19
2014 2013
Operating RevenuesRents – commercial leases $ 7,011,484 $ 6,385,056Fees and miscellaneous income 1,228,991 1,145,506
Total operating revenues 8,240,475 7,530,562
Operating ExpensesAdministration and support 5,316,530 3,614,869Custodial and grounds upkeep 530,731 257,106Environmental and safety 408,036 379,598Repairs and maintenance 1,392,706 1,293,775Utilities 832,211 993,425Insurance 355,038 248,510Property management and development 88,427 137,301Depreciation 3,853,843 4,155,130
Total operating expenses 12,777,522 11,079,714
Operating loss (4,537,047) (3,549,152)
Nonoperating Revenues (Expenses)Investment income 20,887 23,471Interest income 618,019 922,748Interest expense (984,282) (972,772)Gain on sale of capital assets 10,388,383 5,465,983Disposal/impairment of capital assets (65,695) (563,806)Loss on roads and infrastructure transferred toCity of San Antonio ‐ (23,062,201)
Other grants 220,000 43,884Other revenue 283,600 ‐ Contributions from City of San Antonio ‐ 89,151Debt write‐off 200,000 ‐
Total nonoperating revenues (expenses) – net 10,680,912 (18,053,542)
Capital contributions 750,000 ‐
Change in net position 6,893,865 (21,602,694)
Net position at beginning of year 52,153,173 73,755,867
Net position at end of year $ 59,047,038 $ 52,153,173

Brooks Development Authority San Antonio, Texas
Statements of Cash Flows Years Ended September 30, 2014 and 2013
The accompanying notes form an integral part of these statements. Page 20
2014 2013Cash Flows From Operating ActivitiesReceipts from tenants and others $ 8,499,104 $ 11,713,581Payments to employees (2,322,714) (1,789,066)Payments to suppliers for goods and services (6,654,915) (4,547,422)
Net cash provided by (used in) operating activities (478,525) 5,377,093
Cash Flows From Capital and Related Financing ActivitiesAcquisition and construction of assets (8,452,148) (5,579,076)DPT land purchase option fee 80,000 ‐ Proceeds from sale of capital assets ‐ 5,465,983Proceeds from sale of Landings I Apartments 14,217,893 ‐ Payments on loans (1,267,294) (1,012,819)Mission Solar contribution 750,000 ‐ Notes payable proceeds 4,600,000 1,957,855Interest payments (983,351) (973,804)
Net cash provided by (used in) capital and related financing activities 8,945,100 (141,861)
Cash Flows From Noncapital Financing ActivitiesContributions from local and federal governments 31,515 887,986DPT floor settlement 269,600 ‐ Other grants 220,000 ‐ Other receipts 31,847 31,521
Net cash provided by noncapital financing activities 552,962 919,507
Cash Flows From Investing ActivitiesInvestment income 20,903 23,471Interest income 1,669,843 681,909
Net cash provided by investing activities 1,690,746 705,380
Net increase in cash and cash equivalents 10,710,283 6,860,119
Cash and cash equivalents at beginning of year 13,526,123 6,666,004
Cash and cash equivalents at end of year $ 24,236,406 $ 13,526,123
Reconciliation of Operating Loss to Net CashProvided By (Used In) Operating Activities
Operating loss $ (4,537,047) $ (3,549,152)Adjustments to reconcile operating loss to net cashprovided by (used in) operating activities:Depreciation 3,853,843 4,155,130Allowance for doubtful accounts 27,515 ‐ Changes in operating assets and liabilities:Accounts receivable 643,172 (555,120)Prepaid expenses 18,698 (31,109)Inventories 479 1,439Accounts payable (28,827) 1,363,262Accrued expenses (68,677) (767,212)Compensated absences 24,376 21,715Unearned revenues (412,057) 4,717,526Tenant security deposits ‐ 20,614
Net cash provided by (used in) operating activities $ (478,525) $ 5,377,093
Brooks Development Authority San Antonio, Texas
Notes to the Financial Statements Years Ended September 30, 2014 and 2013
Page 21
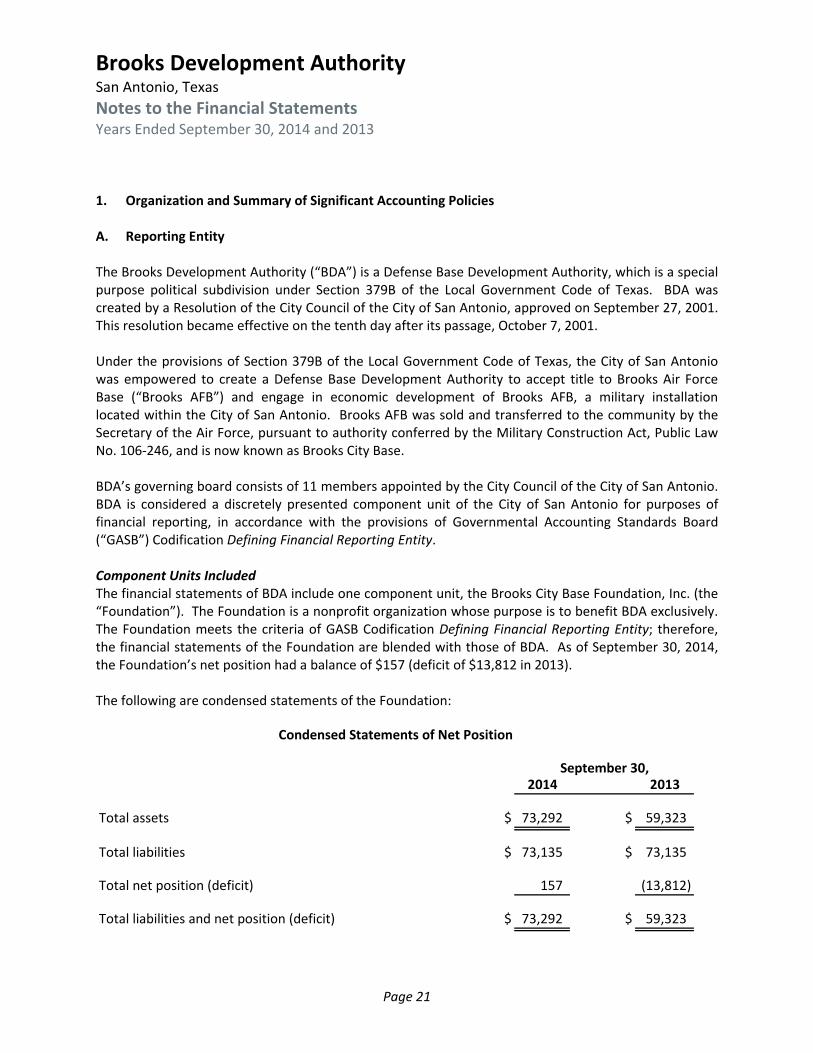
1. Organization and Summary of Significant Accounting Policies A. Reporting Entity The Brooks Development Authority (“BDA”) is a Defense Base Development Authority, which is a special purpose political subdivision under Section 379B of the Local Government Code of Texas. BDA was created by a Resolution of the City Council of the City of San Antonio, approved on September 27, 2001. This resolution became effective on the tenth day after its passage, October 7, 2001. Under the provisions of Section 379B of the Local Government Code of Texas, the City of San Antonio was empowered to create a Defense Base Development Authority to accept title to Brooks Air Force Base (“Brooks AFB”) and engage in economic development of Brooks AFB, a military installation located within the City of San Antonio. Brooks AFB was sold and transferred to the community by the Secretary of the Air Force, pursuant to authority conferred by the Military Construction Act, Public Law No. 106‐246, and is now known as Brooks City Base. BDA’s governing board consists of 11 members appointed by the City Council of the City of San Antonio. BDA is considered a discretely presented component unit of the City of San Antonio for purposes of financial reporting, in accordance with the provisions of Governmental Accounting Standards Board (“GASB”) Codification Defining Financial Reporting Entity. Component Units Included The financial statements of BDA include one component unit, the Brooks City Base Foundation, Inc. (the “Foundation”). The Foundation is a nonprofit organization whose purpose is to benefit BDA exclusively. The Foundation meets the criteria of GASB Codification Defining Financial Reporting Entity; therefore, the financial statements of the Foundation are blended with those of BDA. As of September 30, 2014, the Foundation’s net position had a balance of $157 (deficit of $13,812 in 2013). The following are condensed statements of the Foundation:
2014 2013
Total assets $ 73,292 $ 59,323
Total liabilities $ 73,135 $ 73,135
Total net position (deficit) 157 (13,812)
Total liabilities and net position (deficit) $ 73,292 $ 59,323
Condensed Statements of Net Position
September 30,

Brooks Development Authority San Antonio, Texas
Notes to the Financial Statements Years Ended September 30, 2014 and 2013
Page 22
2014 2013
Operating revenues $ 14,016 $ 16Operating expenses 47 73
Change in net position 13,969 (57)
Net position (deficit) at beginning of year (13,812) (13,755)
Net position (deficit) at end of year $ 157 $ (13,812)
Condensed Statements of Revenues, Expenses, and Change in Net Position (Deficit)
Years EndedSeptember 30,
2014 2013
Operating activities $ 13,969 $ (57)
Net increase (decrease) in cash and cash equivalents 13,969 (57)
Cash and cash equivalents at beginning of year 52,103 52,160
Cash and cash equivalents at end of year $ 66,072 $ 52,103
Condensed Statements of Cash Flows
Years EndedSeptember 30,
B. Basis of Accounting All BDA’s activities are reported in a single proprietary (enterprise) fund and are prepared on the accrual basis of accounting and the economic resource measurement focus in accordance with accounting principles generally accepted in the United States of America (“GAAP”). Revenues are recorded when earned, and expenses are recorded when a liability is incurred, regardless of the timing of the cash flows. Grants and similar items are recognized as revenue as soon as all eligibility requirements imposed by the provider have been met and qualifying expenditures have been incurred. C. Cash and Cash Equivalents For purposes of the statements of cash flows, noninterest‐bearing demand deposit accounts and cash in interest‐bearing demand accounts with commercial banks are considered cash equivalents. Short‐term, highly liquid investments that are both readily convertible and invested in money market funds with original maturities of three months or less are “cash equivalents.”

Brooks Development Authority San Antonio, Texas
Notes to the Financial Statements Years Ended September 30, 2014 and 2013
Page 23
D. Accounts Receivable Tenant, other receivables, and the allowance for doubtful accounts are shown separately on the financial statements. The allowance for doubtful accounts is established as losses are estimated to have occurred though a provision for bad debts charged to earnings. Losses are charged against the allowance when management believes the uncollectibility is confirmed. Subsequent recoveries, if any, are credited to the allowance. The allowance for doubtful accounts is evaluated on a regular basis by management and is based on historical experience and specifically‐identified questionable receivables. The evaluation is inherently subjective, as it requires estimates that are susceptible to significant revision as more information becomes available. E. Capital Assets and Depreciation Property and equipment consist of the appraised fair market value of Brooks AFB property transferred to BDA by the United States Air Force (the “Air Force”) on July 22, 2002. All other capital assets built or purchased by BDA are recorded on the basis of cost. Depreciation of BDA’s property that was transferred by the Air Force began July 22, 2002 and was computed on the remaining estimated useful life of property, as established by independent appraisers. This remaining life ranged from 3 to 45 years. Depreciation on newly purchased assets was based upon the below established depreciation lives as follows: Buildings 10‐30 years Improvements 10‐30 years Roads 20 years Furniture, fixtures, and equipment 5‐10 years BDA has a policy to capitalize expenditures for renewals and betterments in excess of $10,000. BDA accounts for public infrastructure construction costs funded by grants and other revenue sources as construction in progress. Infrastructure assets (e.g., roads, sidewalks), which are completed and accepted by the City of San Antonio, are recorded as nonoperating expenses in the year the infrastructure is accepted. In the current year, infrastructure placed into service that has not yet been accepted by the City of San Antonio was transferred to roads and depreciated over their useful life. F. Impairment of Long‐Lived Assets BDA reviews the carrying value of assets for impairment whenever events and circumstances indicate the carrying value of an asset may not be recoverable from the estimated future cash flows expected to result from its use and eventual disposition. In cases where undiscounted expected cash flows are less than the carrying value, an impairment loss is recognized equal to an amount by which the carrying value exceeds the fair value of assets. The factors considered by management in performing this assessment include current operating results, trends and prospects, and effects of obsolescence,

Brooks Development Authority San Antonio, Texas
Notes to the Financial Statements Years Ended September 30, 2014 and 2013
Page 24
demand, competition, and other economic factors. BDA recorded $57,626 of net impairment losses on vacated buildings that are no longer suitable to lease to commercial tenants ($504,336 in 2013). The impairment is reported as a loss on disposal/impairment of capital assets in the financial statements. See Note 6. G. Deferred Outflow of Resources In addition to assets, the statements of net position will sometime report a separate section for deferred outflow of resources. This separate financial statement element, deferred outflow of resources, represents a consumption of net position that applies to a future period(s) and will not be recognized as an outflow or resources (expense) until then. BDA only has one item that qualifies for reporting in this category. H. Inventories All inventories are valued at cost using the first‐in, first‐out method. Inventories are recorded as an expense when consumed rather than when purchased. I. Compensated Absences BDA employees accrue vacation of 5 to 10 days. Employees can carry over 30 days of vacation and up to 30 days of vacation is payable at termination. The amount of vested vacation pay accrued as of September 30, 2014 and 2013 totaled $160,557 and $136,181, respectively. J. Unearned Revenues BDA receives rental income in advance from customers. The balance in the unearned revenue represents these advances. K. Risk Management BDA is exposed to various risks of loss related to general liability, property and casualty, workers’ compensation, unemployment, and employee health insurance claims. BDA carries commercial insurance for risk of loss that may arise from such losses. This insurance is for property, casualty, general liability, workers’ compensation, and employee health. Settled claims resulting from other risks of loss have not exceeded commercial insurance coverage in any of the past two years. L. In‐Kind Revenues/Expenses
In‐kind revenues/expenses are comprised of donated services, which are measured and recorded at their fair value.

Brooks Development Authority San Antonio, Texas
Notes to the Financial Statements Years Ended September 30, 2014 and 2013
Page 25
M. Operating Revenues and Expenses BDA’s operating revenues and expenses consist of revenues earned and expenses incurred relating to the operation and maintenance of its Brooks City Base property. All other revenues and expenses are reported as nonoperating revenues and expenses. N. Capital Contributions Capital contributions consist of funds received through various grants to assist in the acquisition or construction of capital assets. O. Comparative Data Comparative data for the prior year has been presented to provide an understanding of the changes in financial position and operations. P. Reclassifications Certain amounts presented in the prior year data have been reclassified in order to be consistent with the current year presentation. Q. Use of Estimates The preparation of financial statements in conformity with GAAP requires management to make estimates and assumptions that affect certain reported amounts and disclosures. Accordingly, actual results could differ from those estimates. R. Restricted and Unrestricted Resources When both restricted and unrestricted net position are available for use, it is BDA’s policy to use restricted net position first, and then unrestricted net position as needed. S. Contingencies Certain conditions may exist as of the date the financial statements are issued, which may result in a loss to BDA, but which will only be resolved when one or more future events occur or fail to occur. BDA’s management and its legal counsel assess such contingent liabilities and such assessment inherently involves an exercise of judgment. In assessing loss contingencies related to legal proceedings that are pending against BDA or unasserted claims that may result in such proceedings, BDA’s legal counsel evaluates the perceived merits of any legal proceedings or unasserted claims, as well as the perceived merits of the amount of relief sought or expected to be sought therein.

Brooks Development Authority San Antonio, Texas
Notes to the Financial Statements Years Ended September 30, 2014 and 2013
Page 26
If the assessment of a contingency indicates it is probable that a material loss has been incurred, and the amount of the liability can be estimated, then the estimated liability would be accrued in BDA’s financial statements. If the assessment indicates a potentially material loss contingency is not probable, but is reasonably possible, or is probable, but cannot be estimated, then the nature of the contingent liability, together with an estimate of the range of possible loss, if determinable and material, would be disclosed. Loss contingencies considered remote are generally not disclosed unless they involve guarantees, in which case the guarantees would be disclosed. 2. Cash and Cash Equivalents Cash and cash equivalents consist of the following:
2014 2013
Cash in bank $ 10,488,574 $ 6,181,759Cash equivalents:Money market funds:INVESCO Aim Treasury Portfolio 343,759 343,713INVESCO Aim Government Agency Portfolio 13,404,073 7,000,651
Total cash and cash equivalents $ 24,236,406 $ 13,526,123
September 30,
Deposits At September 30, 2014, the carrying amount of BDA’s bank deposits totaled $10,488,574 ($6,181,759 in 2013), and the bank balance totaled $10,562,045 ($6,265,977 in 2013). BDA’s cash deposits at September 30, 2014 and 2013 were covered by the Federal Deposit Insurance Corporation and by pledged collateral held by BDA’s agent bank in BDA’s name. Investments State statutes govern BDA’s investment policies. State authorized investments include obligations of the United States Treasury and United States Government agencies, commercial paper, and repurchase agreements. BDA complies with applicable provisions of the State of Texas Public Funds Investment Act. Realized and unrealized gains and losses on investments are reported as investment income. Investments are valued at fair value. Credit Risk – BDA’s investment policy requires obligations of other governments be rated by a nationally recognized rating firm at not less than A, commercial paper be rated not less than A‐I or P‐I, and mutual funds be rated no less than AAA. BDA’s two money market funds are rated AAA (Moody’s) and AAA (Standard & Poor’s).

Brooks Development Authority San Antonio, Texas
Notes to the Financial Statements Years Ended September 30, 2014 and 2013
Page 27
Interest Rate Risk – As required by state law and BDA’s investment policy, investments in obligations are limited to having maturities at the date of purchase of no more than 10 years. BDA also limits maturities of commercial paper to no more than 270 days from the date of issuance and requires mutual funds have a weighted‐average maturity of 90 days or fewer. Concentration of Credit Risk – BDA places no limit on the amount it may invest in any one issuer. BDA’s total investments are held in money market funds. The money market funds hold only repurchase agreements and United States Treasury obligations. 3. Derivative Instrument Interest Rate Swap Objective of the Interest Rate – To reduce the risk associated with possible projected interest rate increases, BDA entered into an interest rate swap agreement in connection with an adjustable rate promissory note in the amount of $14,270,451. This note served as the permanent financing of construction costs associated with build‐to‐suit buildings for a BDA lessee. This loan is scheduled to mature on July 11, 2024, but will be modified to coincide with the related building lease agreement ending date. Terms – The interest rate swap agreement and the related loan are scheduled to mature on July 11, 2024 and have been extended to match the lease agreement. The interest rate swap’s notional amount of $14,851,837 matches the maximum principal amount of the permanent adjustable rate note that will be used to pay‐off the interim construction loan. In 2008, the lease agreement was extended to a 20‐year term and, accordingly, the permanent note was extended to a 20‐year term, and the principal amount was increased to $15,000,000. During 2008, the original adjustable rate promissory note was revised to become a principal plus interest note. The interest rate is a floating rate, which is based on LIBOR plus 1.50%. As of September 30, 2014, LIBOR was 0.15% (0.17% in 2013) plus 1.50%, resulting in an overall rate of 1.65% (1.67% in 2013). Fair Value – The interest rate swap had a negative fair value of $2,396,709 and $2,593,557 as of September 30, 2014 and 2013, respectively. The fair value was estimated using a proprietary valuation model developed by a counterparty. The interest rate swap has been deemed an effective hedge and, therefore, qualifies for hedge accounting treatment. Since the fair value is negative, the fair value is recorded as a noncurrent liability. Changes in the interest rate swap’s fair value are recorded as a deferred outflow and included in deferred outflow of resources. Credit Risk – BDA was not exposed to credit risk on its outstanding interest rate swap at September 30, 2014 and 2013 because the interest rate swap had a negative fair value. However, should interest rates change and the interest rate swap becomes positive, BDA would be exposed to credit risk in the amount

Brooks Development Authority San Antonio, Texas
Notes to the Financial Statements Years Ended September 30, 2014 and 2013
Page 28
of the interest rate swap’s fair value. The interest rate swap’s counterparty has guaranteed all payments and is rated AAA by Standard & Poor’s. The interest rate swap agreement provides no collateral by the counterparty. Interest Rate Risk – The interest rate swap decreases BDA’s exposure to interest rate risk. Termination Risk – The interest rate swap was issued pursuant to the International Swap Dealers Association (“ISDA”) Master Agreement, which includes standard termination events, such as failure to pay and bankruptcy. BDA or the counterparty may terminate the interest rate swap if the other party fails to perform under the terms of the contract. If the interest rate swap is terminated, the related variable rate promissory note would no longer carry a synthetic interest rate. Also, if at the time of termination the interest rate swap has a negative fair value, BDA would be liable to the counterparty for a payment equal to the swap’s fair value. As of September 30, 2014 and 2013, the interest rate swap had negative fair values of $2,396,709 and $2,593,557, respectively. Swap Payments and Associated Debt – Adjustable rate promissory note and related interest rate swap payments are effective July 11, 2006. Debt associated with the interest rate swap at September 30, 2014 and 2013 totaled $11,625,140 and $12,180,226, respectively. BDA Collateral – Under the terms of the ISDA Master Agreement, BDA is required to provide credit support (collateral) for the interest rate swap in the form of cash collateral deposited with the counterparty. The completed buildings serve as collateral. 4. Accounts Receivable The allowance for doubtful accounts was based upon management’s evaluation of the accounts receivable collectibility. Accounts receivable consist of the following:
2014 2013
Accounts receivable – tenants $ 299,685 $ 1,046,334Less allowance for doubtful accounts (148,740) (121,225)
Total accounts receivable – tenants 150,945 925,109
Federal government 7,220 38,733Local governments 52,592 52,592Housing management 191,613 207,069Other 58,636 57,595
Total accounts receivable $ 461,006 $ 1,281,098
September 30,

Brooks Development Authority San Antonio, Texas
Notes to the Financial Statements Years Ended September 30, 2014 and 2013
Page 29
5. Mezzanine Notes Receivable During fiscal year 2011, BDA executed a master lease and development agreement with NRP to develop a 15‐acre parcel on Brooks City Base into a multi‐family project with 300 multi‐family apartment units (the “Project”). BDA will own the Project and lease it to NRP with a net revenue participation component in the master lease. NRP agreed to construct the Project and secure senior debt nonrecourse financing for the Project with NRP contributing $3,900,000 to the cost of the Project. Such contributions to be partially financed by a mezzanine loan from BDA in the amount of $1,954,768, at an annual interest rate of 18%, and the remaining $1,944,742 to be financed by NRP. However, on December 29, 2011, BDA acquired an additional mezzanine loan (NRP financing portion) in the amount of $1,954,742 at an interest rate of 18%. Frost Bank agreed to lend NRP $21,000,000 on senior nonrecourse debt financing for the construction of the Project and secured a lien on the 15‐acre parcel. At September 30, 2013 the outstanding balance on these notes receivable totaled $3,909,510. In July 2013, BDA received $679,653 as payment on accrued interest leaving a balance of $1,050,705 as accrued interest receivable. In March 2014, NRP obtained a buyer for the Landings I Apartment, Pensam Capital, Inc., to take over the lease for a prepaid rental amount of $39,500,000, the sales price. Net cash to BDA for the assignment of the lease totaled $15,475,676. The two mezzanine notes, totaling $3,909,510, and unpaid interest of $860,721 were paid off with the sales price. During fiscal year 2014, BDA was paid accrued interest of $806,700 and, thus, as of September 30, 2014 total interest paid to BDA was $1,667,421.

Brooks Development Authority San Antonio, Texas
Notes to the Financial Statements Years Ended September 30, 2014 and 2013
Page 30
6. Capital Assets Changes in BDA’s capital assets for the year ended September 30, 2014 consist of the following:
October 1, September 30,2013 Additions Deletions Transfers 2014
Land $ 4,500,178 $ ‐ $ ‐ $ ‐ $ 4,500,178Construction in progress 3,075,790 8,432,423 (8,570) (9,529,838) 1,969,805
Capital assets not subjectto depreciation 7,575,968 8,432,423 (8,570) (9,529,838) 6,469,983
Roads 6,024,146 ‐ ‐ 7,248,288 13,272,434Infrastructure andimprovements 12,050,151 ‐ ‐ 494,310 12,544,461
Facilities and otherimprovements 616,225 ‐ ‐ ‐ 616,225
Buildings 61,576,550 ‐ (93,941) 1,472,388 62,954,997Furniture, fixtures, andequipment 9,055,421 128,537 (22,436) 314,852 9,476,374
Software 321,953 ‐ ‐ ‐ 321,953
Total depreciable assets 89,644,446 128,537 (116,377) 9,529,838 99,186,444
Total capital assets 97,220,414 8,560,960 (124,947) ‐ 105,656,427
Accumulated depreciation:Roads (5,777,088) (41,723) ‐ ‐ (5,818,811)Infrastructure andimprovements (2,916,665) (638,101) ‐ ‐ (3,554,766)
Facilities and otherimprovements (446,921) (58,745) ‐ ‐ (505,666)
Buildings (28,158,730) (2,483,884) 36,424 ‐ (30,606,190)Furniture, fixtures, andequipment (1,200,329) (631,390) 14,256 ‐ (1,817,463)
Software (321,953) ‐ ‐ ‐ (321,953)
Total accumulateddepreciation (38,821,686) (3,853,843) 50,680 ‐ (42,624,849)
Net capital assets $ 58,398,728 $ 4,707,117 $ (74,267) $ ‐ $ 63,031,578
As part of BDAs’ annual review of vacated buildings, management has determined certain buildings were considered permanently impaired and not suitable to lease to commercial tenants. The net book value of these buildings totaled $57,626 and were written off as of September 30, 2014 ($504,336 in 2013). This permanent impairment is reflected as disposal/impairment of capital assets in the financial statements. As of September 30, 2013, BDA also released to the City of San Antonio net book value of $23,062,201 in roads and infrastructure, which is also reflected as loss on roads and infrastructure transferred to City of San Antonio in the financial statements.

Brooks Development Authority San Antonio, Texas
Notes to the Financial Statements Years Ended September 30, 2014 and 2013
Page 31
Changes in BDA’s capital assets for the year ended September 30, 2013 consist of the following:
October 1, September 30,2012 Additions Deletions Transfers 2013
Land $ 4,577,678 $ ‐ $ (77,500) $ ‐ $ 4,500,178Construction in progress 1,100,215 5,769,922 ‐ (3,794,347) 3,075,790
Capital assets not subjectto depreciation 5,677,893 5,769,922 (77,500) (3,794,347) 7,575,968
Roads 30,869,157 ‐ (24,845,011) ‐ 6,024,146Infrastructure andimprovements 10,245,576 ‐ ‐ 1,804,575 12,050,151
Facilities and otherimprovements 616,225 ‐ ‐ ‐ 616,225
Buildings 62,950,610 ‐ (1,406,014) 31,954 61,576,550Furniture, fixtures, andequipment 7,120,079 32,172 (54,648) 1,957,818 9,055,421
Software 321,953 ‐ ‐ ‐ 321,953
Total depreciable assets 112,123,600 32,172 (26,305,673) 3,794,347 89,644,446
Total capital assets 117,801,493 5,802,094 (26,383,173) ‐ 97,220,414
Accumulated depreciation:Roads (7,017,764) (542,134) 1,782,810 ‐ (5,777,088)Infrastructure andimprovements (2,364,905) (551,760) ‐ ‐ (2,916,665)
Facilities and otherimprovements (388,176) (58,745) ‐ ‐ (446,921)
Buildings (26,575,103) (2,485,104) 901,477 ‐ (28,158,730)Furniture, fixtures, andequipment (719,071) (517,387) 36,129 ‐ (1,200,329)
Software (321,953) ‐ ‐ ‐ (321,953)
Total accumulateddepreciation (37,386,972) (4,155,130) 2,720,416 ‐ (38,821,686)
Net capital assets $ 80,414,521 $ 1,646,964 $ (23,662,757) $ ‐ $ 58,398,728
7. State Energy Conservation Office (“SECO”) Stimulus Program During fiscal year September 30, 2011, BDA became a participant in two loan programs from the SECO Stimulus Program totaling $1,657,000 and $3,780,000. The $1,657,000 loan is for energy utilization improvements to portions of two existing buildings (Buildings 160 and 170), and the replacement of the heating, ventilation, and air conditioning (“HVAC”) systems associated with the buildings. The $3,780,000 loan is for upgrades to Buildings 150, 532, 570, and 775 for the installation of roof top solar panels and the replacement of the HVAC system. In May 2012, BDA was awarded a third loan from SECO in the amount of $2,400,000, which was subsequently reduced to $1,662,230 for energy savings upgrades to Buildings 155, 502, 704, 754, and 940 and to 163 residential housing units. In December 2012, the third loan was increased to $1,952,932. BDA received the first two loans at 2% interest with a term of ten years and the third note at 3% interest and a term of eight years utilizing the energy savings

Brooks Development Authority San Antonio, Texas
Notes to the Financial Statements Years Ended September 30, 2014 and 2013
Page 32
realized from the upgrades. As of September 30, 2012, BDA has expended $1,657,000 of the $1,657,000 loan, $3,664,226 of the $3,780,000 loan, and $16,480 of the $1,952,932 loan. Projects funded by the first two loans were completed in January 2012, and the first loan payments on both loans were due and paid on November 30, 2012 in the amounts of $46,565 and $103,419, respectively. During fiscal year September 30, 2013, projects funded by the third loan were completed in May 2013 and July 2013 and all loan proceeds were expended plus accrued interest for a total of $1,974,334. The first payment on the third loan was due and paid in November 2013. As of September 30, 2014 and 2013, the combined outstanding balance of these three loans totaled $6,192,294 and $6,904,502, respectively. 8. Note Payable – JPMorgan Chase The purpose of this loan was to provide funding for the construction of a built‐to‐suit facility for a lessee of BDA. In 2008, the promissory note, dated November 28, 2006, was revised to become a principal plus interest note. The interest portion of the note will vary monthly between the interest rate swap (Note 3) settlement payment and the floating interest portion of the note. This revision will assure principal plus interest payments on the note plus the interest rate swap settlement payments will total approximately $115,500. As interest rates fell during 2008, the interest rate swap settlement payments increased significantly and, when combined with fixed monthly note payment of $115,544, the total payment amounts exceeded the monthly lease payment. The original interest rate swap agreement was designed to hedge against rising interest rates. This revised note will ensure that such funding deficits will not occur going forward by assuring the note payment and the interest rate swap settlement payments will total approximately $115,500 monthly. As of September 30, 2014 and 2013, BDA owed $11,625,140 and $12,180,226, respectively, to JPMorgan Chase. 9. Utility Upgrade Agreement As part of the property transfer from the Air Force, BDA agreed to make upgrades to the utility infrastructure. On July 22, 2002, BDA transferred the water and wastewater infrastructure to San Antonio Water System (“SAWS”). As part of the agreement for the transfer of the utilities to SAWS, BDA agreed to make the required infrastructure improvements with a portion of the funding coming from BDA. The significant term of this agreement is as follows. SAWS Agreement BDA agreed to pay $3,500,000 in water and wastewater upgrades to SAWS. This agreement does not accrue interest and is payable in eight installments of $437,500. The liability to SAWS at September 30, 2014 and 2013 totaled $0 and $200,000, respectively.

Brooks Development Authority San Antonio, Texas
Notes to the Financial Statements Years Ended September 30, 2014 and 2013
Page 33
10. Note Payable – Brevet Capital On September 30, 2014, BDA closed on a bridge loan with Brevet Capital Special Opportunities Fund III, L.P. (“Brevet Capital”) in the amount of $4,600,000, for development costs, as part of a financing package for the construction of the Aviator Apartments. Terms of the loan are 5 years with interest at a fixed rate of 14% compounded monthly for 18 months and thereafter at a floating rate equal to 1‐month LIBOR plus 11% subject to a LIBOR floor of 4% and a LIBOR cap of 6%; payable at the end of the term, pre‐payable after 18 months. Fees include a 1.75% closing fee and a $2,500 per month administrative agent fee. 11. Long‐Term Liabilities Long‐term debt activity for the year ended September 30, 2014 is as follows:
Balance Balance October 1, September 30, Due in
2013 Additions Reductions 2014 One Year
Notes payable:JPMorgan Chase $ 12,180,226 $ ‐ $ 555,086 $ 11,625,140 $ 595,189SECO I and II 4,930,167 ‐ 505,110 4,425,057 515,288SECO III 1,974,335 ‐ 207,098 1,767,237 213,381 Brevet Capital note ‐ 4,600,000 ‐ 4,600,000 ‐
Total notes payable 19,084,728 4,600,000 1,267,294 22,417,434 1,323,858
Other long‐term liabilities:SAWS agreement 200,000 ‐ 200,000 ‐ ‐
Compensated absences 136,181 75,183 50,807 160,557 96,334
Total long‐term liabilities $ 19,420,909 $ 4,675,183 $ 1,518,101 $ 22,577,991 $ 1,420,192

Brooks Development Authority San Antonio, Texas
Notes to the Financial Statements Years Ended September 30, 2014 and 2013
Page 34
Long‐term debt activity for the year ended September 30, 2013 is as follows:
Balance Balance October 1, September 30, Due in
2012 Additions Reductions 2013 One Year
Notes payable:JPMorgan Chase $ 12,697,912 $ ‐ $ 517,686 $ 12,180,226 $ 555,086SECO I and II 5,425,300 ‐ 495,133 4,930,167 505,110SECO III 16,480 1,957,855 ‐ 1,974,335 207,097
Total notes payable 18,139,692 1,957,855 1,012,819 19,084,728 1,267,293
Other long‐term liabilities:SAWS agreement 200,000 ‐ ‐ 200,000 ‐
Compensated absences 114,466 40,769 19,054 136,181 81,709
Total long‐term liabilities $ 18,454,158 $ 1,998,624 $ 1,031,873 $ 19,420,909 $ 1,349,002
The principal and interest payments on the notes payable for the next five years and in five‐year increments thereafter are summarized below: Years Ending September 30, Principal Interest Total
2015 $ 1,323,858 $ 586,185 $ 1,910,0432016 5,981,587 1,623,770 7,605,3572017 1,446,930 501,336 1,948,2662018 1,514,035 455,471 1,969,5062019 1,585,136 407,143 1,992,279
2020‐2024 7,245,338 1,257,176 8,502,5142025‐2027 3,320,550 178,813 3,499,363
$ 22,417,434 $ 5,009,894 $ 27,427,328
12. Reinvestment Zone Agreement On July 18, 2009, BDA entered into an amended development agreement with the City of San Antonio, Texas (the “City”) and the Board of Directors of Reinvestment Zone Sixteen. Under this agreement, BDA is to construct the New Braunfels Infrastructure Project (Phases I through V) and other street public improvements, as set forth on the final project plan and financing plan. The project costs will be paid with available tax increment funds. Available tax increment funds are defined under the agreement as the tax increments contributed by the City to a fund established and maintained by the City for the purpose of implementing the projects of the Tax Incremental Reinvestment Zone (the “TIRZ”), less the City’s administrative costs (limited to $420,000), and any debt obligation of the City for debt dedicated to BDA’s development of public improvements within the TIRZ. The City issued a series of certificates of obligation to be used by BDA for this project. The City will make available $10,455,000 in certificates of obligation, of which $2,500,000 will not be reimbursed via tax increment. The agreement ends on the

Brooks Development Authority San Antonio, Texas
Notes to the Financial Statements Years Ended September 30, 2014 and 2013
Page 35
date which is the earlier to occur of the following: (i) the date BDA receives final payment for completing the project; (ii) the date this agreement is terminated, as provided in Article X or III of the agreement; or (iii) September 30, 2029. If there are no sufficient available tax increment funds on hand 60 days prior to each semiannual debt service payment date to pay the City’s debt incurred and dedicated to BDA’s development of public improvements within the TIRZ, BDA will be required to make up the shortfall within 30 days, upon notice by the City of such shortfall, to the extent BDA has available funds. Should BDA have exhausted its resources and a shortfall remains, BDA agrees in good faith to utilize all funding options available and permitted by law to cure such a shortfall. The total payment to BDA under the agreement will not exceed $55,464,027. This payment is not intended to cover all BDA’s costs incurred in connection with performing its obligations under this agreement. Under the agreement, BDA shall bear all risks associated with payments from the City, including, but not limited, to pre‐development agreement costs, incorrect estimates of tax increment, changes in tax rates or tax collections, changes in state law or interpretations thereof, changes in market or economic conditions impacting the project, changes in interest rates or capital markets, changes in building and development code requirements, changes in City policy, default by tenants, unanticipated effects covered under legal doctrine of force majeure, and/or other unanticipated factors. BDA recognizes that any liability or obligation incurred in anticipation of payments from City debt proceeds without a board‐approved phase development plan will be BDA’s responsibility. BDA is also responsible for the maintenance of all improvements until acceptance by the City and for one year after completion. Also, upon acceptance of a street or drainage improvement for maintenance by the City, BDA or its contractor shall deliver to the City a one‐year extended warranty bond, naming the City as the obligee. The cost of repair, replacement, and maintenance for defects discovered during the first year after completion shall be paid by BDA, its contractor, or the bond company and shall not be paid out of the TIRZ fund. During the years ended September 30, 2014 and 2013, BDA incurred $0 and $89,151, respectively, in project costs. These costs are reported as part of capital assets, subject to depreciation. Cumulative to date, as of September 30, 2014 and 2013, BDA has been reimbursed $0 and $666,343, respectively, of project costs. 13. Bexar County Grant In 2008, BDA entered into an agreement with Bexar County (the “County”) where the County will reimburse BDA for certain capital expenditures. The reimbursement will be made from certain ad valorem taxes collected from a defined area exceeding the base year (January 1, 2008) value in the defined area. Based on the grant agreement, the County will pay BDA the lesser of $220,000 or the actual amount of ad valorem taxes received by the County for qualifying capital expenditures made for a period of 15 years not to exceed $3,300,000 starting in 2012. BDA has incurred up to $3,300,000 in what management believes to be qualifying expenditures for this grant. This amount has not been recognized as revenue in the financial statements since the County is not under any obligation to pay this grant until the related ad valorem taxes have been collected. Revenue will be recognized in future

Brooks Development Authority San Antonio, Texas
Notes to the Financial Statements Years Ended September 30, 2014 and 2013
Page 36
years equal to the amount of qualifying expenditures and ad valorem taxes collected not to exceed $3,300,000. During the years ended September 30, 2014 and 2013, BDA received $220,000 and $0, respectively, from the County. 14. Operating Leases BDA leases Brooks City Base property to commercial tenants under cancellable leases ranging from 1 to 50 years. Leased property consists of commercial rental realty and ground leases. For the years ended September 30, 2014 and 2013, BDA received $7,011,484 and $6,385,056, respectively, from rents under its operating leases as follows:
Amount Percentage Amount Percentage
Rent – commercial leases $ 7,011,484 85% $ 6,385,056 85%
Total rents 7,011,484 6,385,056
Fees and miscellaneous income 1,228,991 15% 1,145,506 15%
Total income $ 8,240,475 100% $ 7,530,562 100%
Year Ended Year EndedSeptember 30, September 30,
2014 2013
The carrying value of BDA property held for the above operating leases is as follows:
2014 2013
Buildings $ 44,306,164 $ 42,903,105Furniture, fixtures, and equipment 5,905,310 5,905,310
50,211,474 48,808,415Less accumulated depreciation 18,103,114 16,065,798
Total $ 32,108,360 $ 32,742,617
September 30,

Brooks Development Authority San Antonio, Texas
Notes to the Financial Statements Years Ended September 30, 2014 and 2013
Page 37
At September 30, 2014, future lease revenues from noncancellable leases for each of the five succeeding fiscal years and five‐year increments thereafter are as follows: Year Ending September 30, Amount
2015 $ 6,178,0342016 5,623,6602017 4,634,9782018 4,691,3342019 4,099,160
2020‐2024 16,090,4992025‐2029 9,121,7242030‐2034 4,339,5282035‐2104 10,890,500
$ 65,669,418
15. Major Customer DPT Laboratories (“DPT”) occupies office space, warehouse, and lab space in a build‐to‐suit facility, which was financed by a construction loan with JPMorgan Chase. Lease payments from DPT serve as debt service payments which, for the years ended September 30, 2014 and 2013, totaled $1,386,525 and $1,386,525, respectively. DPT also pays a CAM fee, which totaled $97,815 and $97,815 in 2014 and 2013, respectively. In fiscal year 2014, DPT started leasing additional office space, which totaled $17,895. 16. Commitments and Contingencies A. Grant Funding BDA participated in various state, city, and county grant programs that are governed by various rules and regulations of the grantor agencies. Costs charged to the respective grant programs are subject to audit and adjustment by the grantor agencies; therefore, to the extent BDA has not complied with the rules and regulations governing the grants, refunds of money received may be required. The amount, if any, of expenditures which may be disallowed by grantor agencies cannot be determined at this time, although BDA’s management expects such amounts, if any, to be immaterial to the financial statements. B. Pending Lawsuits and Claims From time to time, BDA is a defendant in lawsuits or claims filed against it. It is the opinion of management that the outcome of these lawsuits or claims will not have a material adverse effect on BDA’s financial position or operations.

Brooks Development Authority San Antonio, Texas
Notes to the Financial Statements Years Ended September 30, 2014 and 2013
Page 38
C. Construction Contracts BDA is committed under various construction contracts or acquisition of capital assets. Changes in commitments occurred as follows:
Beginning New EndingBalance Contracts Payments Balance
2014 $ 5,995,770 $ 762,843 $ 6,359,909 $ 398,7042013 324,076 9,499,017 3,827,323 5,995,770
D. Environmental Issues BDA is aware of various existing conditions that will require environmental remediation to facilitate development. The Air Force remains responsible for the remediation of any environmental contamination resulting from its past activities, whether it is known to exist or is currently undiscovered. Since the Air Force remains responsible for these matters, it is the opinion of management the effect, if any, would be immaterial to the financial statements. 17. Unearned Revenues Unearned revenues consist of the following:
2014 2013
The Foundation $ 30,929 $ 30,929Unearned tenant rent 4,377,622 4,789,679Other ‐ 1,088
$ 4,408,551 $ 4,821,696
September 30,
In February 2013, BDA received $5,000,000 from Mission Solar, previously called Nexolon America, LLC, as a one‐time prepayment for a lease with option to purchase 85.86 acres of land upon which Mission Solar will construct a photovoltaic solar panel manufacturing facility. Mission Solar will invest more than $115,000,000 in real and personal property to construct and establish the facility made up of several buildings. Mission Solar will conduct the design, engineering, and construction of the facility and anticipates completing construction of the manufacturing facility in the second quarter of 2014. BDA has designated this project as a redevelopment project under Section 379B.009 of the Texas Local Government Code. The lease agreement with BDA is for a term of ten years. Upon completion of the construction, the facility will become the property of BDA, and BDA will continue to own the land and facility during the term of the lease until title is transferred. Upon substantial completion of the facility, Mission Solar will commence making additional annual rent payments of $275,000 to BDA, plus an annual consumer price index increase not to exceed 2%, to be paid during the entire term of the lease.

Brooks Development Authority San Antonio, Texas
Notes to the Financial Statements Years Ended September 30, 2014 and 2013
Page 39
BDA agrees to provide Mission Solar the option to request transfer of title to the land and improvements at any time during, or at the end of the ten‐year lease term, with the understanding that such real property, once owned by Mission Solar, will then be subject to full taxation. As of September 30, 2014 and 2013, BDA has recognized $500,000 and $291,667, respectively, as lease revenue and the remaining balance of $4,208,333 as of September 30, 2014 is reflected as unearned rent ($4,708,333 in 2013). The facility was substantially completed in July 2014 and, as of September 30, 2014, a receivable of $68,750 is reflected for the additional rent. 18. Deferred Compensation Plan BDA offers its employees a deferred compensation plan created in accordance with Internal Revenue Code, Section 457. The plan, available to all regular BDA employees, permits them to defer a portion of their salary until future years. Participation in the plan is optional. The deferred compensation is not available to employees until termination, retirement, death, or unforeseeable emergency. BDA makes a two‐for‐one matching contribution in an amount equal to 200% of the employee’s deferred salary reduction, up to a maximum of 6% participant contribution. BDA’s contributions are fully vested after five years of continuous service. Employees’ contributions vest immediately. Employees receive credit for their contribution, as well as BDAs, and benefits are based on the total assets owned in the employee’s individual accounts. All employees may defer amounts up to the maximum allowed by the Internal Revenue Service each year. All assets and liabilities are in a trust for the exclusive benefit of the participants and their beneficiaries. The plan is not included in BDA’s financial statements. BDA and employees’ contributions for the fiscal years ended September 30, 2014 and 2013 totaled $308,949 and $220,409, respectively. 19. NRP Management Agreement On July 19, 2010, BDA signed an agreement with NRP, in which NRP will serve as manager of the 163 single‐family homes and duplexes, which comprise the Heritage Oaks, formerly military residential housing. The initial term is through September 30, 2011 with four one‐year renewable options. Effective October 1, 2011, the contract was amended to allow BDA, at the end of every month, to sweep all collected funds in excess of $50,000 into BDA’s general operating account. At September 30, 2014, BDA had received $1,282,117 ($1,284,760 in 2013) of collected funds and recorded a receivable of $114,799 ($95,687 in 2013) for total revenue of $1,396,916 ($1,380,447 in 2013). For fiscal year 2014, the performance bonus payable to NRP totaling $29,044 is to be paid from the Heritage Oaks operating budget. 20. Board‐Designated Reserve Funds On September 16, 2014, BDA’s Board of Directors approved the establishment of board‐designated reserve funds totaling $12,532,941. Board‐designated reserve funds were created for the following purposes: (1) cover projected operating revenue shortfalls through fiscal year 2016; (2) comply with the QPM Partners Escrow Fund requirements; (3) provide an operating reserve to cover unexpected

Brooks Development Authority San Antonio, Texas
Notes to the Financial Statements Years Ended September 30, 2014 and 2013
Page 40
shortfalls; (4) establish a repair and replacement fund; (5) create a balance to be used solely for the purpose of making improvements to Hangar 9; and (6) to transfer an amount to the Brooks City Base Foundation to be used for BDA improvements. 21. Subsequent Events On November 6, 2014, BDA closed on an Amended and Restated Loan Agreement with Brevet Capital, which amended the original bridge loan of $4,600,000 by increasing the amount of the loan to $5,000,000 and the first lien loan with Inter National Bank for construction costs related to the Aviator Apartments in the amount of $21,500,000. Terms are for 7 years with interest at 4.35% fixed for 36 months, then at The Wall Street Journal prime plus 1.35%, with a floor of 4.35%; payable 24 months of interest only, and thereafter in 59 payments of principal and interest (amortized over 25 years) with a balloon payment due at the end of the term, with a penalty for prepayment. The loan will be secured by a first lien on the land (approximately 13.463 acres) and the buildings located thereon (now and to be constructed). There is a 2% loan origination fee, and this loan is guaranteed by the developer.

Page 41
Statistical Section – Unaudited

Page 42
(This page intentionally left blank.)

Page 43
Statistical Section
The goal of the statistical section is to provide a chief source of information regarding a government’s economic condition. All information presented in the statistical section is organized around five specific objectives. Financial Trends data is provided to help users understand and assess a government’s financial position may have changed over a period of time. Revenue Capacity data is provided to help users understand and assess a government’s ability to generate own‐source revenues. Debt Capacity data is provided to help users understand and assess a government’s burden and its ability to issue additional debt. Demographic and Economic Information is provided to help users understand and assess a government’s socioeconomic environment and facilitate comparisons of financial statement information over time and among governments. Operating Information is provided to help users understand and assess a government’s operations and resources, as well as to provide a context for understanding and assessing its economic condition.

Page 44
(This page intentionally left blank.)

Page 45
Financial Trends

Brooks Development Authority San Antonio, Texas
Net Position by Component Last Ten Fiscal Years
Page 46
2012 2011 2010 2009 20052014 2013 (Restated) (Restated) (Restated) (Restated) 2008 2007 2006 (Restated)
Net PositionNet investment incapital assets $ 40,614,145 $ 39,314,000 $ 62,274,829 $ 68,745,724 $ 66,950,662 $ 58,990,161 $ 58,247,455 $ 52,972,703 $ 52,913,654 $ 16,851,703
Unrestricted 18,432,893 12,839,173 11,481,038 13,276,853 10,848,985 11,848,505 6,698,859 (693,689) (3,731,762) (820,861)
Total net position $ 59,047,038 $ 52,153,173 $ 73,755,867 $ 82,022,577 $ 77,799,647 $ 70,838,666 $ 64,946,314 $ 52,279,014 $ 49,181,892 $ 16,030,842
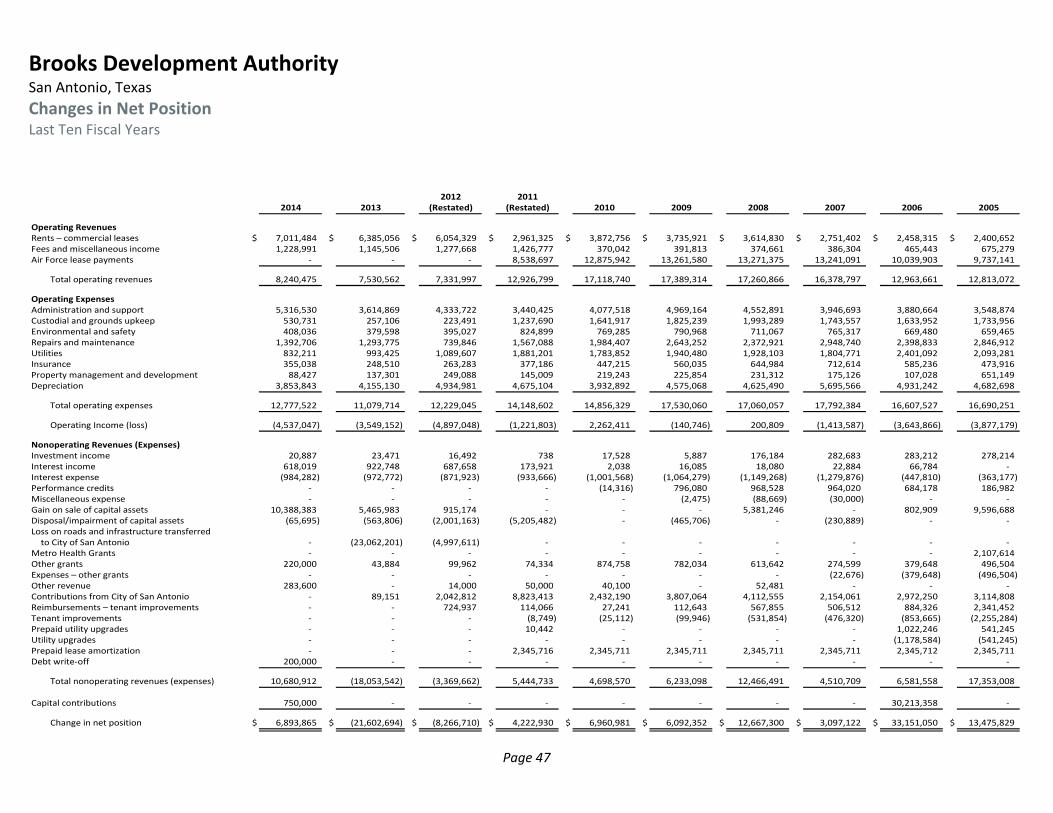
Brooks Development Authority San Antonio, Texas
Changes in Net Position Last Ten Fiscal Years
Page 47
2012 20112014 2013 (Restated) (Restated) 2010 2009 2008 2007 2006 2005
Operating RevenuesRents – commercial leases $ 7,011,484 $ 6,385,056 $ 6,054,329 $ 2,961,325 $ 3,872,756 $ 3,735,921 $ 3,614,830 $ 2,751,402 $ 2,458,315 $ 2,400,652Fees and miscellaneous income 1,228,991 1,145,506 1,277,668 1,426,777 370,042 391,813 374,661 386,304 465,443 675,279Air Force lease payments ‐ ‐ ‐ 8,538,697 12,875,942 13,261,580 13,271,375 13,241,091 10,039,903 9,737,141
Total operating revenues 8,240,475 7,530,562 7,331,997 12,926,799 17,118,740 17,389,314 17,260,866 16,378,797 12,963,661 12,813,072
Operating ExpensesAdministration and support 5,316,530 3,614,869 4,333,722 3,440,425 4,077,518 4,969,164 4,552,891 3,946,693 3,880,664 3,548,874Custodial and grounds upkeep 530,731 257,106 223,491 1,237,690 1,641,917 1,825,239 1,993,289 1,743,557 1,633,952 1,733,956Environmental and safety 408,036 379,598 395,027 824,899 769,285 790,968 711,067 765,317 669,480 659,465Repairs and maintenance 1,392,706 1,293,775 739,846 1,567,088 1,984,407 2,643,252 2,372,921 2,948,740 2,398,833 2,846,912Utilities 832,211 993,425 1,089,607 1,881,201 1,783,852 1,940,480 1,928,103 1,804,771 2,401,092 2,093,281Insurance 355,038 248,510 263,283 377,186 447,215 560,035 644,984 712,614 585,236 473,916Property management and development 88,427 137,301 249,088 145,009 219,243 225,854 231,312 175,126 107,028 651,149Depreciation 3,853,843 4,155,130 4,934,981 4,675,104 3,932,892 4,575,068 4,625,490 5,695,566 4,931,242 4,682,698
Total operating expenses 12,777,522 11,079,714 12,229,045 14,148,602 14,856,329 17,530,060 17,060,057 17,792,384 16,607,527 16,690,251
Operating Income (loss) (4,537,047) (3,549,152) (4,897,048) (1,221,803) 2,262,411 (140,746) 200,809 (1,413,587) (3,643,866) (3,877,179)
Nonoperating Revenues (Expenses)Investment income 20,887 23,471 16,492 738 17,528 5,887 176,184 282,683 283,212 278,214Interest income 618,019 922,748 687,658 173,921 2,038 16,085 18,080 22,884 66,784 ‐ Interest expense (984,282) (972,772) (871,923) (933,666) (1,001,568) (1,064,279) (1,149,268) (1,279,876) (447,810) (363,177)Performance credits ‐ ‐ ‐ ‐ (14,316) 796,080 968,528 964,020 684,178 186,982Miscellaneous expense ‐ ‐ ‐ ‐ ‐ (2,475) (88,669) (30,000) ‐ ‐ Gain on sale of capital assets 10,388,383 5,465,983 915,174 ‐ ‐ ‐ 5,381,246 ‐ 802,909 9,596,688Disposal/impairment of capital assets (65,695) (563,806) (2,001,163) (5,205,482) ‐ (465,706) ‐ (230,889) ‐ ‐ Loss on roads and infrastructure transferredto City of San Antonio ‐ (23,062,201) (4,997,611) ‐ ‐ ‐ ‐ ‐ ‐ ‐
Metro Health Grants ‐ ‐ ‐ ‐ ‐ ‐ ‐ ‐ ‐ 2,107,614Other grants 220,000 43,884 99,962 74,334 874,758 782,034 613,642 274,599 379,648 496,504Expenses – other grants ‐ ‐ ‐ ‐ ‐ ‐ ‐ (22,676) (379,648) (496,504)Other revenue 283,600 ‐ 14,000 50,000 40,100 ‐ 52,481 ‐ ‐ ‐ Contributions from City of San Antonio ‐ 89,151 2,042,812 8,823,413 2,432,190 3,807,064 4,112,555 2,154,061 2,972,250 3,114,808Reimbursements – tenant improvements ‐ ‐ 724,937 114,066 27,241 112,643 567,855 506,512 884,326 2,341,452Tenant improvements ‐ ‐ ‐ (8,749) (25,112) (99,946) (531,854) (476,320) (853,665) (2,255,284)Prepaid utility upgrades ‐ ‐ ‐ 10,442 ‐ ‐ ‐ ‐ 1,022,246 541,245Utility upgrades ‐ ‐ ‐ ‐ ‐ ‐ ‐ ‐ (1,178,584) (541,245)Prepaid lease amortization ‐ ‐ ‐ 2,345,716 2,345,711 2,345,711 2,345,711 2,345,711 2,345,712 2,345,711Debt write‐off 200,000 ‐ ‐ ‐ ‐ ‐ ‐ ‐ ‐ ‐
Total nonoperating revenues (expenses) 10,680,912 (18,053,542) (3,369,662) 5,444,733 4,698,570 6,233,098 12,466,491 4,510,709 6,581,558 17,353,008
Capital contributions 750,000 ‐ ‐ ‐ ‐ ‐ ‐ ‐ 30,213,358 ‐
Change in net position $ 6,893,865 $ (21,602,694) $ (8,266,710) $ 4,222,930 $ 6,960,981 $ 6,092,352 $ 12,667,300 $ 3,097,122 $ 33,151,050 $ 13,475,829

Page 48
(This page intentionally left blank.)
Page 49
Revenue Capacity

Brooks Development Authority San Antonio, Texas
Lease Revenue Components Last Ten Fiscal Years
Page 50
2014 2013 2012 2011 2010 2009 2008 2007 2006 2005
Rent $ 7,011,484 $ 6,385,056 $ 6,054,329 $ 3,422,174 $ 3,872,756 $ 3,735,921 $ 3,614,830 $ 2,751,402 $ 2,458,315 $ 2,298,816CAM charges (1) 837,143 687,667 556,914 357,228 239,832 234,050 230,999 193,053 111,834 112,609Air Force lease payments ‐ ‐ ‐ 8,538,697 12,875,942 13,261,580 13,271,375 13,241,091 10,039,903 9,737,141
Total lease revenue components $ 7,848,627 $ 7,072,722 $ 6,611,243 $ 12,318,099 $ 16,988,530 $ 17,231,551 $ 17,117,204 $ 16,185,546 $ 12,610,052 $ 12,148,566
(1) Included in fees and miscellaneous income on the Statement of Revenues, Expenses, and Changes in Net Position

Brooks Development Authority San Antonio, Texas
Direct Rates Applied to the Revenue Base
Page 51
Total Leased Total Number Average Leased Average Average DirectFiscal Year Square Footage of Tenants Square Footage Yearly Rent Yearly Rent Term (Months) Rate
2012 1,338,191 23 58,182.22 6,054,329$ 263,232$ 106 4.52$ 2013 1,039,856 23 45,211.13 6,385,056 277,611 106 6.14 2014 1,336,557 24 55,689.88 7,011,484 292,145 139 5.25
Note: The United States Air Force (“USAF”) maintained a presence at BDA as it reassessed its mission during the years 2005 to 2011. While the USAF was reducing its mission, BDA was an active military installation with security measures in force that limited the ability to economically develop BDA. The data for years 2005‐2011 is representative of a military installation that is closing down, and is not representative of an active economic development area. All USAF personnel and activities were closed in September 2011. Since then a new Board of Directors, and a new Chief Executive Officer have adopted a new vision and mission with an aggressive economic development plan to include a defined land use plan for the entire campus. The results of the initial efforts, the departure of the USAF, and the aggressive economic development program are reflective in the financial information for years 2012 to 2014, as presented. The ten‐year data required by this schedule will be presented prospectively.

Brooks Development Authority San Antonio, Texas
Information About Major Payors and Remitters of Lease Revenue Current Fiscal Year and Nine Years Ago
Page 52
Tenant Square Footage Lease Term (in
months) Lease Income
Percentage to Total
Lease Revenue
DPT Laboratories, Ltd. 256,500 241 $ 1,386,525 19.78%
Volt Information Sciences, Inc. 70,562 100 930,720 13.27%
Texas A&M 77,648 60 668,237 9.53%
Nexolon (Mission Solar) 350,000 120 568,750 * 8.11%
Calumet (NuStar) 41,003 120 434,364 6.20%
Total Major Payors $ 3,988,596 56.89%
Total Lease Revenue $ 7,011,484
*Includes noncash lease revenue items.
Tenant Square Footage Lease Term (in
months) Lease Income
Percentage to Total
Lease Revenue
United States Air Force N/A N/A $ 9,737,141 80.90%
Earth Tech, Inc. 26,332 63 $ 242,142.84 2.01%
City of San Antonio – Vehicle Maintenance 21,912 60 $ 92,030.40 0.76%
Holt Cat 9,375 34 $ 60,544.00 0.50%
Proxtronics 6,870 72 $ 55,203.85 0.46%
Alamo Community College District 3,115 60 $ 20,000.00 0.17%
Total Major Payors $ 10,207,062 84.80%
Total Lease Revenue $ 12,035,957
2014
2005
Source: Executed lease agreements

Page 53
Debt Capacity

Brooks Development Authority San Antonio, Texas
Ratios of Total Outstanding Debt
Page 54
Ratio of Debt
Gross Total Debt Per
Fiscal Operating to Gross Square Feet Square Feet
Year Notes Payable (a) Revenues Revenue Leased (b) Leased
2014 22,417,434$ 8,240,475$ 2.72 1,336,557 16.77
2013 19,284,728 7,530,562 2.56 1,039,856 18.55
2012 18,339,691 7,331,997 2.50 1,338,191 13.70
Note: The United States Air Force (“USAF”) maintained a presence at BDA as it reassessed its mission during the years 2005 to 2011. While the USAF was reducing its mission, BDA was an active military installation with security measures in force that limited the ability to economically develop BDA. The data for years 2005‐2011 is representative of a military installation that is closing down, and is not representative of an active economic development area. All USAF personnel and activities were closed in September 2011. Since then a new Board of Directors, and a new Chief Executive Officer have adopted a new vision and mission with an aggressive economic development plan to include a defined land use plan for the entire campus. The results of the initial efforts, the departure of the USAF, and the aggressive economic development program are reflective in the financial information for years 2012 to 2014, as presented. The ten‐year data required by this schedule will be presented prospectively. (a) Details regarding outstanding debt can be found in the notes to the financial statements. Air Force
leaseback liability and prepaid utility upgrades are excluded from schedule. (b) Represents total square feet leased out to tenants as of fiscal year‐end.

Brooks Development Authority San Antonio, Texas
Debt Coverage Ratios Last Ten Fiscal Years
Page 55
Note: The schedule is not presented since BDA’s nongeneral obligation debt is not secured by pledged revenue stream.

Page 56
(This page intentionally left blank.)

Page 57
Demographic and Economic Information

Brooks Development Authority San Antonio, Texas
City of San Antonio Demographic and Economic Statistics Last Ten Fiscal Years
Page 58
Total PersonalIncome (b) Per Capita
Fiscal (Thousands Personal UnemploymentYear Population (a) of Dollars) Income (b) Employment (c) Rate (d)
2013 1,817,610 $ 90,990,321 $ 39,951 910,300 6.0
2012 1,785,787 87,169,022 39,019 887,500 6.1
2011 1,754,167 83,554,526 38,124 864,400 7.7
2010 1,714,773 76,395,393 35,481 842,200 7.4
2009 1,685,628 72,676,281 34,515 832,300 7.1
2008 1,651,709 73,403,787 35,611 853,500 5.0
2007 1,615,210 69,238,604 34,421 840,300 4.2
2006 1,573,935 64,793,892 33,120 818,800 4.5
2005 1,529,270 59,377,643 31,312 789,900 4.9
2004 1,500,919 54,964,602 29,589 764,100 5.4
Note: Ten years from 2004‐2013 since 2014 data was not available at time of this report. Source: U.S. Census Bureau (a) Source: Texas Workforce Commission, Labor Market Career Information, MSA 2000‐Defined, Bureau of
Economic Analysis, San Antonio/New Braunfels Metropolitan Area (b) Source: Texas Workforce Commission, Labor Market Career Information, CES MSA 2000‐Defined,
San Antonio/New Braunfels Metropolitan Area (c) Source: Texas Workforce Commission, Labor Market Career Information, LAUS MSA 2000‐Defined,
San Antonio/New Braunfels Metropolitan Area (d) Source: Texas Workforce Commission, Labor Market Career Information, LAUS MSA 2000‐Defined,
San Antonio/New Braunfels Metropolitan Area

Brooks Development Authority San Antonio, Texas
Principal Employers Current Fiscal Year and Nine Years Ago
Page 59
2014Percentageof Total City
Employer Employees Rank Employment (1)
Joint Base San Antonio (Lackland,Fort Sam Houston, and Randolph) 80,165 1 8.60%
H‐E‐B 20,000 2 2.15%
USAA 16,000 3 1.72%
Northside I.S.D. 12,751 4 1.37%
North East I.S.D. 10,052 5 1.08%
City of San Antonio 9,145 6 0.98%
Methodist Healthcare System 8,118 7 0.87%
Baptist Health System 7,205 8 0.77%
San Antonio I.S.D. 7,000 9 0.75%
JP Morgan Chase 5,200 10 0.56%
2005Percentageof Total City
Employer Employees Rank Employment (2)
Joint Base San Antonio (Lackland,Fort Sam Houston, and Randolph) 74,500 1 9.43%
USAA 13,773 2 1.74%
Northside I.S.D. 10,320 3 1.31%
H‐E‐B 9,942 4 1.26%
H.B. Zachry Co. 8,000 5 1.01%
San Antonio I.S.D. 7,685 6 0.97%
North East I.S.D. 7,574 7 0.96%
Alamo Community College 7,200 8 0.91%
Methodist Healthcare System 7,027 9 0.89%
SBC Communications 7,000 10 0.89%
Source: Economic Development Division, City of San Antonio, Texas Book of Lists 2006 and 2014 (1) Percent based on an Employment estimate of 932,300 of nonfarm jobs in the San Antonio‐New Braunfels
Metropolitan Statistical Area as of August 2014. Figure provided by the Texas Workforce Commission, Labor Market Career Information.
(2) Percent based on an Employment estimate of 789,900 of nonfarm jobs in the San Antonio‐New Braunfels
Metropolitan Statistical Area as of September 2005. Figure provided by the Texas Workforce Commission, Labor Market Career Information.

Page 60
(This page intentionally left blank.)
Page 61
Operating Information
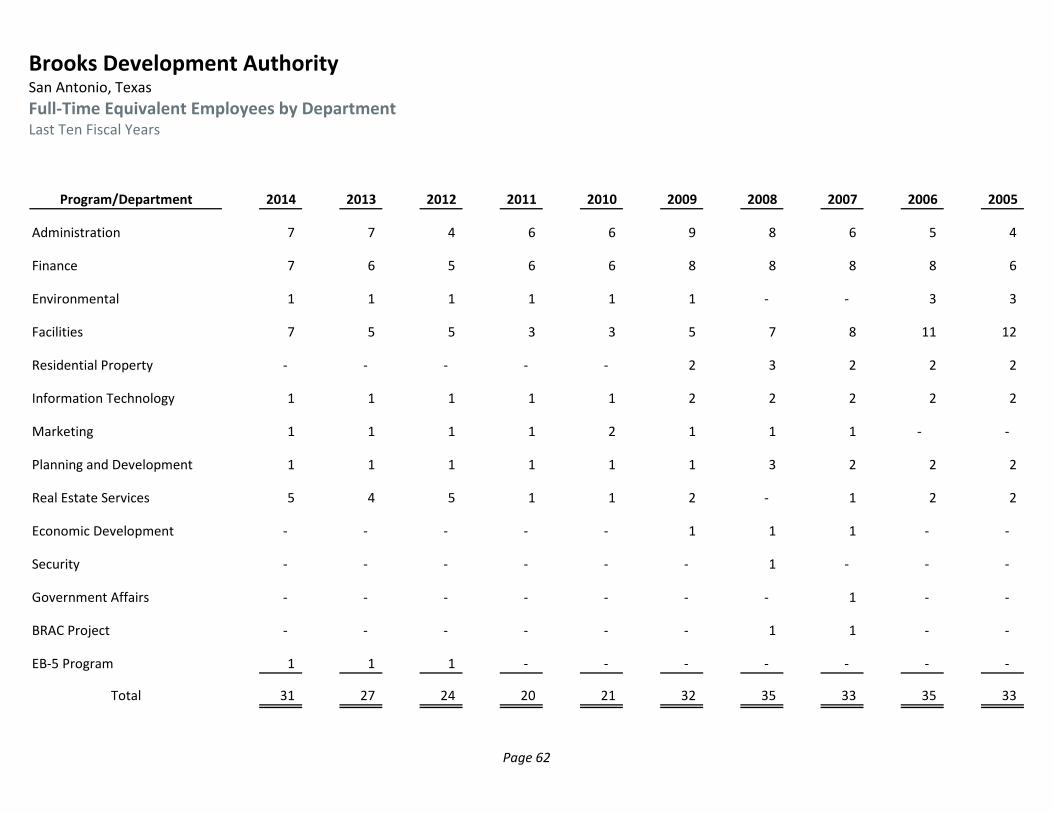
Brooks Development Authority San Antonio, Texas
Full‐Time Equivalent Employees by Department Last Ten Fiscal Years
Page 62
Program/Department 2014 2013 2012 2011 2010 2009 2008 2007 2006 2005
Administration 7 7 4 6 6 9 8 6 5 4
Finance 7 6 5 6 6 8 8 8 8 6
Environmental 1 1 1 1 1 1 ‐ ‐ 3 3
Facilities 7 5 5 3 3 5 7 8 11 12
Residential Property ‐ ‐ ‐ ‐ ‐ 2 3 2 2 2
Information Technology 1 1 1 1 1 2 2 2 2 2
Marketing 1 1 1 1 2 1 1 1 ‐ ‐
Planning and Development 1 1 1 1 1 1 3 2 2 2
Real Estate Services 5 4 5 1 1 2 ‐ 1 2 2
Economic Development ‐ ‐ ‐ ‐ ‐ 1 1 1 ‐ ‐
Security ‐ ‐ ‐ ‐ ‐ ‐ 1 ‐ ‐ ‐
Government Affairs ‐ ‐ ‐ ‐ ‐ ‐ ‐ 1 ‐ ‐
BRAC Project ‐ ‐ ‐ ‐ ‐ ‐ 1 1 ‐ ‐
EB‐5 Program 1 1 1 ‐ ‐ ‐ ‐ ‐ ‐ ‐
Total 31 27 24 20 21 32 35 33 35 33

Brooks Development Authority San Antonio, Texas
Level Demand for Services Last Ten Fiscal Years
Page 63
Note: This schedule is not presented since BDA does not provide services to its citizens.

Brooks Development Authority San Antonio, Texas
Tax Increment Reinvestment Zone
Page 64
Introduction The Brooks City‐Base Tax Increment Reinvestment Zone (“TIRZ”) is located in the southeast side of the City and will encompass approximately 2,522 acres. The approximate boundaries of the TIRZ lie west of I‐ 37, south of South New Braunfels Avenue and S.E. Military Drive, east of South Presa Street and Old Corpus Christi Road, and north of Dave Erwin Drive and S.E. Loop 410 (please refer to map on page 5). This TIRZ is City‐initiated and is designed to leverage ongoing area development in support of a special joint project between the U.S. Air Force and the City of San Antonio to successfully convert and redevelop the former Brooks Air Force Base. The City of San Antonio created the Brooks Development Authority (“BDA”) in September 2001 to receive title of 1,300 acres of real property of the former military base and to transition it into a business and technology park. The BDA is the project’s Developer. The life of the TIRZ is projected to be 24.82 years with a termination date of September 30, 2029. Public Infrastructure The public infrastructure improvements and related capital costs include streets, drainage, and water improvements and other costs approved by the TIRZ Board. The TIRZ will provide a source of funding for public improvements. Annual construction of public improvements will be reimbursed as TIRZ revenues become available. The estimated TIRZ revenue to be received through September 30, 2029 is $55,464,027.

Brooks Development AuthoritySan Antonio, Texas
Tax Increment Reinvestment Zone – Continued
Page 65

Brooks Development Authority San Antonio, Texas
Regional Center EB‐5 Program
Page 66
The mission of BDA’s Regional Center EB‐5 Program is to promote, develop, and sustain a thriving community and catalyst for progressive economic development and prosperity. Our vision is to create a premier community that attracts local, national, and international investment to stimulate world class opportunities that will transform the surrounding area and region while respecting its rich and vibrant history, thus supporting Brooks City Base’s ambition to becoming a community to Live, Work, Learn, and Play. The EB‐5 program was created by Congress in 1990 to stimulate the U.S. economy through job creation and foreign capital investment. Qualified investors obtain an expedited U.S. Visa by investing $500,000 or $1,000,000 dollars into a U.S. based project. The project must create 10 full‐time American jobs per investor. The investment is repaid to the investor within two to five years. The investor must prove that the capital investment was invested and that 10 jobs were created and maintained for at least 24 months. BDA’s strategic goal is to fund a project(s) utilizing the Brooks City Base Regional Center and leverage opportunities for Foreign Direct Investment (FDI). To date, the program has identified projects on and off campus and has built an investment network to raise roughly $19 million in EB5/FDI funds for the Aviator Apartment Lofts and Hotel projects, a cumulative registry of 38 investors at $500,000 invested each. Both of these projects have the ability to generate between $950,000 ‐ $1.9 million in FY15 in administration fees which will offset the Brooks Regional Center expenses (travel, marketing, etc.), and we anticipate raising $500,000 – $950,000 in FY15. The BCBRC’s goal to identify off‐campus potential projects has outlined the following projects:
Multi‐specialty Ambulatory Surgery Center, Southside of San Antonio
Hospital and multi‐family housing, Eastside of San Antonio
Wholesale Produce Cold Storage and Warehousing, South San Antonio The BCBRC’s goal to identify on‐campus potential projects has outlined the following projects:
Multi‐family housing (Aviator Lofts)
A full‐service hotel
Class A office building
Multi‐family housing (The Landings II)

Brooks Development Authority San Antonio, Texas
Master Land Use Plan and Maps
Page 67
In December 2013, BDA engaged the services of Live Oak Gottesman to develop a Master Land Use Plan, which was adopted in July 2014. The Master Land Use Plan divides the main campus into three main parcels. Parcel A: Encompasses an estimated 225 acres which is projected to yield at least
1,637,004 sq. ft. of building space that is available for lease or sale over the next five years. Parcel A land use will be allocated to retail, education, mid and low density residential use, commercial and mixed use businesses and living space. In addition Parcel A includes approximately 40 acres of linear parkway, trails, and ponds. The University of the Incarnate Word School of Osteopathic Medicine will also be located in Parcel A. A lease agreement has been entered into with the expected opening of the school in Fall 2017.
Parcel B: Encompasses an estimated 245 acres which is projected to yield at least
1,778,752 sq. ft. of building space that is available for lease or sale over the next five years. Parcel B land use will be allocated to low density residential use, commercial and mixed use businesses and living space.
Parcel C: Encompasses an estimated 319 acres which is projected to yield at least
2,319,574 sq. ft. of building space that is available for lease or sale over the next five years. Parcel C land use will be allocated to light industrial development.

ov
er
la
nd
A1
A2
A3
A4
A5
A6
A7 A9
A8
A10
A14
A15
A16
A11
A13
A12
A18
A21
A17
A19
A22
A20
B10
B1
B6
B5
B2
B4B7
B3
B8
B9
A
B
C
P3P1
P1
P2
P2
A23
P4
P4
B11
B12
B13
C1
C2
C3
C4
Reta
il
Civ
ic /
Pub
lic
Aca
dem
ic
Hot
el
Low
-Den
sity
Res
iden
tial
Med
-Den
sity
Res
iden
tial
Futu
re M
ixed
Use
Park
/ O
pen
Sp
ace
Econ
omic
Dev
elop
men
t Zo
ne
(Lig
ht In
dus
tria
l)
Sola
r
Loca
l Com
mer
cial
Low
-Den
sity
Mix
ed U
se
Offi
ce /
Com
mer
cial
Aca
dem
ic /
Rec
reat
ion
LAN
D US
E
Dev
elop
ed P
arce
ls
LAN
DIN
GS
I
EOC
& P
SAP
HEA
D
& N
ECK
BAPT
IST
HO
SPIT
AL
MIS
SIO
N
SOLA
R
CITY
BA
SE L
AN
DIN
G
DPT
Brooks Development Authority San Antonio, TexasMaster Land Use and Maps – Continued
Page 68

ov
er
la
nd
Acre
sC
om
me
nts
62.5
4.0
Bap
tist
Ho
spit
al
48.5
20.8
see o
pti
on
2.5
14.5
17.0
85.6
To
tal
25
5.4
De
ve
lop
ab
leLan
dA
cre
sD
esc
rip
tio
nSiz
e
A1
13.7
A2
9.0
A3
4.5
A4
16.4
A5
6.3
A6
2.1
A7
7.8
A8
6.2
A9
5.8
Calu
met
41,0
03 R
SF
A10
7.0
A11
2.0
A12
4.4
A13
13.6
A14
7.3
A15
12.3
A16
12.5
A17
13.7
Pend
ing
- A
viato
rLo
fts
| 210 D
eve
lop
ers
A18
12.1
A19
2.9
Hang
ar
9
A20
2.9
A21
6.5
Gym
22,2
96 R
SF
A22
11.9
TA
MU
77,6
48 R
SF
A23
52.7
The H
ill500,0
00 R
SF +
/-
B1
63.5
Heri
tag
e O
aks
Ho
usi
ng
B2
2.2
B3
30.4
B4
7.5
Gru
bb
Eng
ineeri
ng
30,2
95 R
SF
B5
6.2
B6
5.3
B7
3.0
B8
9.6
Vo
lt70,5
62 R
SF
B9
3.1
Vo
lt
B10
10.0
B11
9.1
B12
16.4
B13
61.6
C1
15.6
DP
T -
Op
tio
n s
trik
e=
$1.7
5 p
sf
C2
198.2
C3
62.2
C4
43.1
To
tal
78
0.6
Lan
dw
ith
Bu
ild
ing
sth
at
will
stay
Bld
g.
#A
cre
sB
uild
ing
Are
a(S
F)
FA
R
The H
ill59.9
00.0
0%
775
TA
MU
17.3
77,6
48
10.3
0%
661
Calu
met
5.9
33,8
10
13.1
6%
532
Vo
lt9.0
72,8
90
18.5
9%
Hang
ar
93.0
0.0
0%
570
Gru
bb
Eng
ineeri
ng
7.5
30,2
95
9.2
7%
Gym
10.0
22,2
96
5.1
2%
BA
SE
8.2
25,7
84
7.2
2%
Heri
tag
e O
aks
Ho
usi
ng
66.8
0.0
0%
To
tal
18
7.6
Park
s/T
ree
Pre
serv
ati
on
/De
ten
tio
n P
on
ds
P1
91.9
P2
22.1
P3
8.0
P4
23.0
To
tal
14
5.0
To
tal
Lan
d A
cre
ag
e
"A
" D
eve
lop
ab
le L
and
are
a : 2
33.6
acr
es
"B
" D
eve
lop
ab
le L
and
are
a : 2
27.9
acr
es
"C
" D
eve
lop
ab
le L
and
are
a : 3
19.1
acr
es
SIT
E T
OT
AL B
OU
ND
AR
Y :
1,3
08
acre
s
Head
and
Neck
EO
C/P
SA
P
Land
ing
s I
Mis
sio
n S
ola
r
Th
ird
Part
yLan
d
Cit
y B
ase
Land
ing
Lim
ited
Serv
ice H
ote
ls
DP
T
Acre
sC
om
me
nts
62.5
4.0
Bap
tist
Ho
spit
al
48.5
20.8
see o
pti
on
2.5
14.5
17.0
85.6
To
tal
25
5.4
De
ve
lop
ab
leLan
dA
cre
sD
esc
rip
tio
nSiz
e
A1
13.7
A2
9.0
A3
4.5
A4
16.4
A5
6.3
A6
2.1
A7
7.8
A8
6.2
A9
5.8
Calu
met
41,0
03 R
SF
A10
7.0
A11
2.0
A12
4.4
A13
13.6
A14
7.3
A15
12.3
A16
12.5
A17
13.7
Pend
ing
- A
viato
rLo
fts
| 210 D
eve
lop
ers
A18
12.1
A19
2.9
Hang
ar
9
A20
2.9
A21
6.5
Gym
22,2
96 R
SF
A22
11.9
TA
MU
77,6
48 R
SF
A23
52.7
The H
ill500,0
00 R
SF +
/-
B1
63.5
Heri
tag
e O
aks
Ho
usi
ng
B2
2.2
B3
30.4
B4
7.5
Gru
bb
Eng
ineeri
ng
30,2
95 R
SF
B5
6.2
B6
5.3
B7
3.0
B8
9.6
Vo
lt70,5
62 R
SF
B9
3.1
Vo
lt
B10
10.0
B11
9.1
B12
16.4
B13
61.6
C1
15.6
DP
T -
Op
tio
n s
trik
e=
$1.7
5 p
sf
C2
198.2
C3
62.2
C4
43.1
To
tal
78
0.6
Lan
dw
ith
Bu
ild
ing
sth
at
will
stay
Bld
g.
#A
cre
sB
uild
ing
Are
a(S
F)
FA
R
The H
ill59.9
00.0
0%
775
TA
MU
17.3
77,6
48
10.3
0%
661
Calu
met
5.9
33,8
10
13.1
6%
532
Vo
lt9.0
72,8
90
18.5
9%
Hang
ar
93.0
0.0
0%
570
Gru
bb
Eng
ineeri
ng
7.5
30,2
95
9.2
7%
Gym
10.0
22,2
96
5.1
2%
BA
SE
8.2
25,7
84
7.2
2%
Heri
tag
e O
aks
Ho
usi
ng
66.8
0.0
0%
To
tal
18
7.6
Park
s/T
ree
Pre
serv
ati
on
/De
ten
tio
nP
on
ds
P1
91.9
P2
22.1
P3
8.0
P4
23.0
To
tal
14
5.0
To
tal
Lan
dA
cre
ag
e
"A
" D
eve
lop
ab
le L
and
are
a : 2
33.6
acr
es
"B
" D
eve
lop
ab
le L
and
are
a : 2
27.9
acr
es
"C
" D
eve
lop
ab
le L
and
are
a : 3
19.1
acr
es
SIT
ET
OT
AL
BO
UN
DA
RY
:1
,30
8acre
s
Head
and
Neck
EO
C/P
SA
P
Land
ing
s I
Mis
sio
n S
ola
r
Th
ird
Part
y L
an
d
Cit
y B
ase
Land
ing
Lim
ited
Serv
ice H
ote
ls
DP
T
Acre
sC
om
me
nts
62.5
4.0
Bap
tist
Ho
spit
al
48.5
20.8
see o
pti
on
2.5
14.5
17.0
85.6
To
tal
25
5.4
De
ve
lop
ab
le L
an
dA
cre
sD
esc
rip
tio
nSiz
e
A1
13.7
A2
9.0
A3
4.5
A4
16.4
A5
6.3
A6
2.1
A7
7.8
A8
6.2
A9
5.8
Calu
met
41,0
03 R
SF
A10
7.0
A11
2.0
A12
4.4
A13
13.6
A14
7.3
A15
12.3
A16
12.5
A17
13.7
Pend
ing
- A
viato
r Lo
fts
| 210 D
eve
lop
ers
A18
12.1
A19
2.9
Hang
ar
9
A20
2.9
A21
6.5
Gym
22,2
96 R
SF
A22
11.9
TA
MU
77,6
48 R
SF
A23
52.7
The H
ill500,0
00 R
SF +
/-
B1
63.5
Heri
tag
e O
aks
Ho
usi
ng
B2
2.2
B3
30.4
B4
7.5
Gru
bb
Eng
ineeri
ng
30,2
95 R
SF
B5
6.2
B6
5.3
B7
3.0
B8
9.6
Vo
lt70,5
62 R
SF
B9
3.1
Vo
lt
B10
10.0
B11
9.1
B12
16.4
B13
61.6
C1
15.6
DP
T -
Op
tio
n s
trik
e=
$1.7
5 p
sf
C2
198.2
C3
62.2
C4
43.1
To
tal
78
0.6
Lan
dw
ith
Bu
ild
ing
sth
at
will
stay
Bld
g.
#A
cre
sB
uild
ing
Are
a(S
F)
FA
R
The H
ill59.9
00.0
0%
775
TA
MU
17.3
77,6
48
10.3
0%
661
Calu
met
5.9
33,8
10
13.1
6%
532
Vo
lt9.0
72,8
90
18.5
9%
Hang
ar
93.0
0.0
0%
570
Gru
bb
Eng
ineeri
ng
7.5
30,2
95
9.2
7%
Gym
10.0
22,2
96
5.1
2%
BA
SE
8.2
25,7
84
7.2
2%
Heri
tag
e O
aks
Ho
usi
ng
66.8
0.0
0%
To
tal
18
7.6
Park
s/T
ree
Pre
serv
ati
on
/De
ten
tio
nP
on
ds
P1
91.9
P2
22.1
P3
8.0
P4
23.0
To
tal
14
5.0
To
tal
Lan
dA
cre
ag
e
"A
" D
eve
lop
ab
le L
and
are
a : 2
33.6
acr
es
"B
" D
eve
lop
ab
le L
and
are
a : 2
27.9
acr
es
"C
" D
eve
lop
ab
le L
and
are
a : 3
19.1
acr
es
SIT
ET
OT
AL
BO
UN
DA
RY
:1
,30
8acre
s
Head
and
Neck
EO
C/P
SA
P
Land
ing
s I
Mis
sio
n S
ola
r
Th
ird
Part
yLan
d
Cit
y B
ase
Land
ing
Lim
ited
Serv
ice H
ote
ls
DP
T
CB
A
T R A I L S / R I V E R
BR
OO
KS
GR
EE
NW
AY
THE
HIL
L
HA
NG
AR
9
Brooks Development Authority San Antonio, TexasMaster Land Use and Maps – Continued
Page 69

Brooks Development Authority San Antonio, Texas
Economic Impact
Page 70
Of the original 1,308 acres of land conveyed to Brooks, approximately 238 have been sold or under a long‐term lease, approximately 281 acres are under lease, designated green area or are a drainage area. Brooks also acquired 55 acres located on the east side of Presa street, north of SE Military Dr., of these 55 acres, approximately 22 acres is drainage area. The gross developable area is 789 acres on the Brooks campus and 33 acres at the off campus site for a total of 844 acres. Brooks has twenty‐nine business tenants or owner enterprises on the campus employing an estimated 2,699 individuals with an approximate average annual salary of $50,000. A listing of the businesses and number of employees is shown in the following table.
No. of
No. Tenant Name Employees
1 Bexar County Office of Emergency Management 20
2 Bridge PTS 7
3 Brooks Academy of Science & Engineering 120
4 Brooks City‐Base Health and Wellness Center 7
5 City of San Antonio ‐ City Council, District 3 8
6 City of San Antonio ‐ Emergency Operations Center 40 7 City of San Antonio ‐ Metro Health 28
8 City of San Antonio ‐ Police Fire Safety & Emergency Dispatch Center 250
9 City of San Antonio ‐ Purchasing 26
10 City of San Antonio ‐ SAPD K‐9 Unit 16
11 Carenet 170
12 Calumet Specialty Products 98
13 Community Bible Church 2
14 DPT Laboratories 180
15 Grubb Engineering 17
16 Head & Neck 15
17 Heritage Oaks 4
18 Mission Trail Baptist Hospital 650
19 South San Antonio Chamber of Commerce 3
20 Spine and Pain Center of SA 14
21 Texas A& M ‐ San Antonio 70
22 Texas House of Representative, District 119 2
23 Texas State Senate 6
24 The Landings at Brooks City‐Base 6
25 VOLT 700
26 Wyle Integrated Science and Engineering 40 27 Mission Solar 200
28 Aviator (Development in Progress)
29 University of the Incarnate Word (Development Pending)
Total 2,699
Brooks Development Authority

Brooks Development Authority San Antonio, Texas
Proposed Infrastructure Projects
Page 71
Building 470 The renovation of building 470, a 3,336 square feet former child care building, will be adaptively re‐used by the expanding Brooks Development Authority (“BDA”) staff. The renovation will consist of stabilization of the buildings foundation and structural frame, replacement of air conditioning and heating systems, roof repairs, accessibility improvements to allow for universal access, and an interior finish out to accommodate staff needs for office and meeting space. The estimated project cost is $660,000. Northwest Corner Drainage The Northwest Corner Drainage project will make infrastructure improvements at two discontinuous sites to facilitate the development of a full service hotel and retail development. The scope of work will include securing entitlements such as platting and zoning and extending and/or relocating both dry and wet utility services to the development parcels including drainage structures, water, sanitary sewer, telecommunications, and power. The estimated cost for these infrastructure improvements is $828,000. South New Braunfels Avenue South New Braunfels Avenue is a four‐lane divided roadway with a raised concrete median, 2 southbound and 2 northbound lanes. S. New Braunfels Avenue is designated as a Secondary Arterial Type A with 86 feet of right‐of‐way on the City of San Antonio’s Major Thoroughfare Plan (MTP). The MTP shows South New Braunfels extending south from its current terminus to Southton Road/Siluria Street at the intersection with South Presa Street and continuing south to the intersection of Loop 410. The estimated construction cost of S. New Braunfels is $24,584,500. Kennedy Hill Kennedy Hill (formerly Dave Erwin Dr.) is a proposed north‐south, three‐lane, un‐divided roadway extending 2,545 feet from SE Military to Sidney Brooks. Kennedy Hill is classified as a Collector street with 44 feet of pavement and 70 feet of right‐of‐way. The proposed realignment of Kennedy Hill will provide access to the new School of Osteopathic Medicine at Incarnate Word University. The project will include demolition of existing Dave Erwin Dr. and reconstruction as Kennedy Hill along with required utility infrastructure. The estimated construction cost of Kennedy Hill is $9,226,174.

Brooks Development Authority San Antonio, Texas
Proposed Infrastructure Projects – Continued
Page 72
Brooks Linear Park The proposed project will transform 40 acres of unutilized floodplain land and drainage channels into a linear park unique to Brooks City Base and San Antonio alike. The heart of the park is made up of a series of 5 ponds that step down with the natural topography of the area. Woven around the ponds are 3 miles of lighted hike‐and‐bike trails that will connect Brooks City Base to the San Antonio River. In total, the park will provide 8 acres of wet ponds, 9 acres of manicured recreation areas, 15 acres of restored native vegetation, 3 acres of vegetated bio‐swales, 1 acre of natural wetlands, 3 pavilions, 12 picnic areas, a restroom facility, an amphitheater, and 2 parking areas. In addition to the amenities and aesthetic enhancement of the area, the park will also stimulate opportunities for economic development, improve storm‐water management, and promote campus interconnectivity through alternate modes of transportation. Animal Care Services Center The proposed build to suit option of a single story, 2,500 square foot facility on an approximately 0.65 acre site on Brooks City Base would create spay and neuter clinic. Brooks would develop the building to a shell condition with the City of San Antonio and/or veterinarians then providing the furnishings, fixtures, and equipment. With the high demand for spay and neuter services in the vicinity of Brooks City Base and the south side of town, the on‐campus Animal Care Services Center will be an expansion of the COSA Animal Care Services Department and would provide low cost spay and neuter services that would be open to the public. In tandem with COSA spay and neuter clinics, the new clinic would solicit and utilize private veterinarians to operate out of the facility, and it would be first center of its kind equipped with its own dog park. The facility would be located behind a major retail center and between the proposed Vantage apartments the newly proposed hotel near the corner of City Base Landing Drive and Goliad Road. Brooks Town Center The Brooks Town Center is located in the west, northwest area of the Brooks campus. The area will serve as a walkable and integrated, open‐air, multiuse development that is organized around a clearly identifiable and energized public realm where citizens can gather and strengthen their community bonds. It is anchored by retail, dining, and leisure uses, as well as by vertical or horizontal residential uses. The Brooks Town Center development will include offices, hospitality, civic, and cultural uses. The Brooks Town Center will be the most dense and most diverse part of the Brooks’ community, with strong connections to its historical heritage and geographic surroundings.

Brooks Development Authority San Antonio, Texas
Proposed Infrastructure Projects – Continued
Page 73
The infrastructure design will support a well‐conceived street and block pattern and network: A sound pattern and an effective street and open‐space plan which allows flexibility and adaptability that permits the public realm to evolve, change, and grow over time. Emphasis is placed on connectivity and design of streets, sidewalks, plazas, squares, parks, promenades, courtyards, walkways connecting to parking facilities and surrounding areas, enclosed public spaces, public and civic buildings, cultural facilities, and parking facilities.

Page 74
(This page intentionally left blank.)