Embed Size (px)
Citation preview
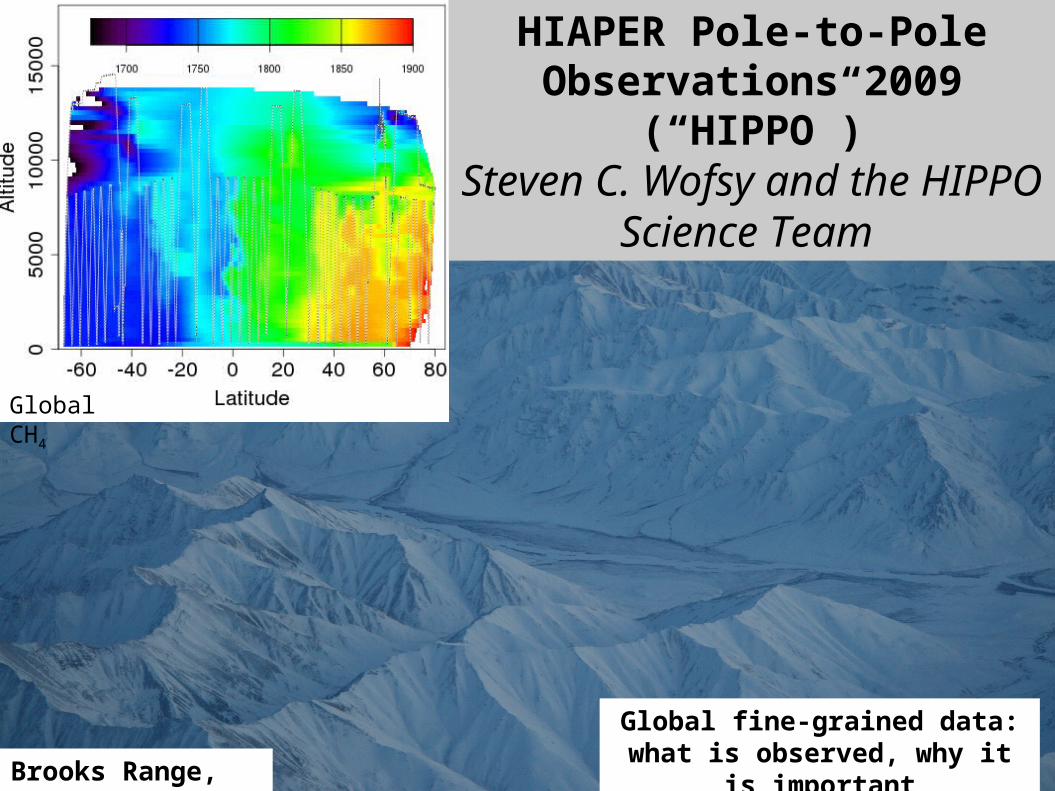
Brooks Range, AK
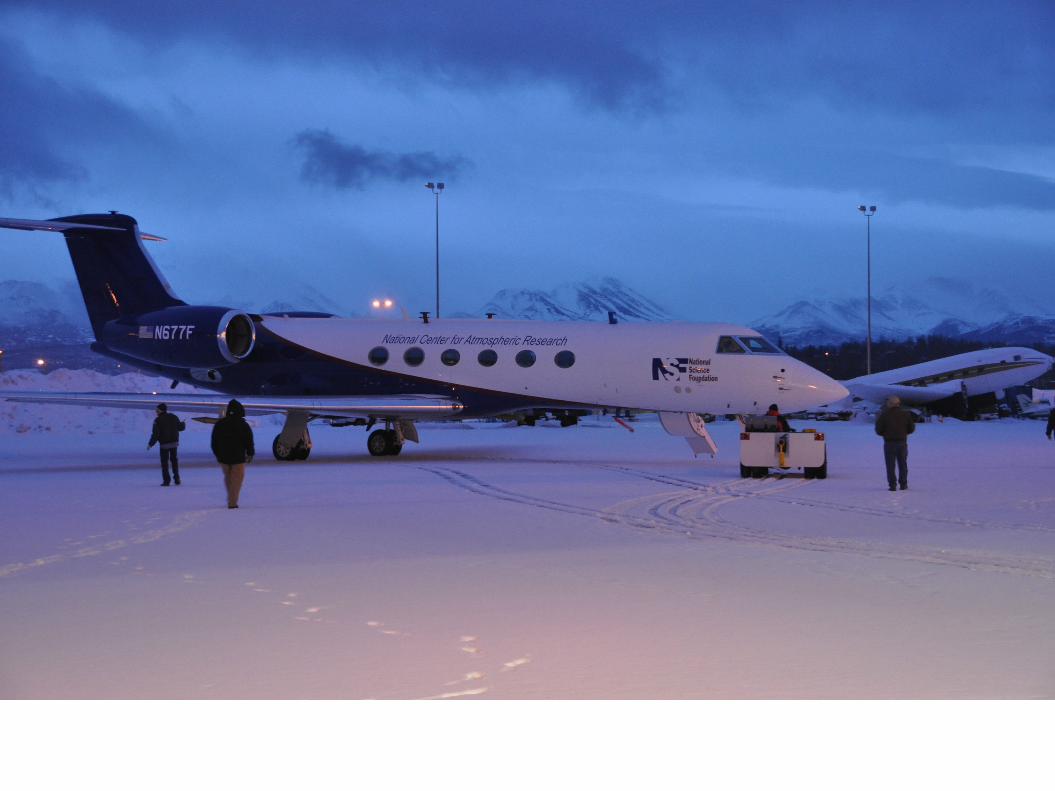
HIAPER Pole-to-Pole Observations 2009 (“HIPPO”)
Steven C. Wofsy and the HIPPO Science Team
Global CH4
Global fine-grained data: what is observed, why it is important
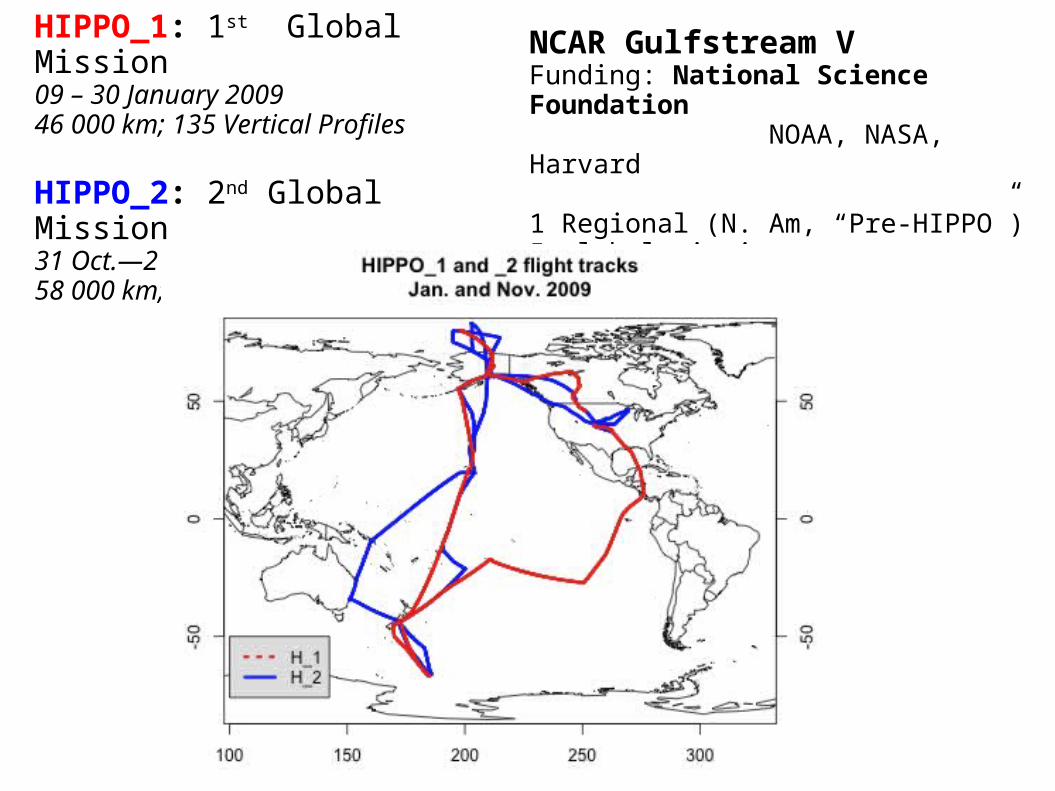
HIPPO_1: 1st Global Mission09 – 30 January 200946 000 km; 135 Vertical Profiles
HIPPO_2: 2nd Global Mission31 Oct.—21 Nov. 200958 000 km; 150 Vertical Profiles
NCAR Gulfstream VFunding: National Science Foundation NOAA, NASA, Harvard
1 Regional (N. Am, “Pre-HIPPO”)5 global missions
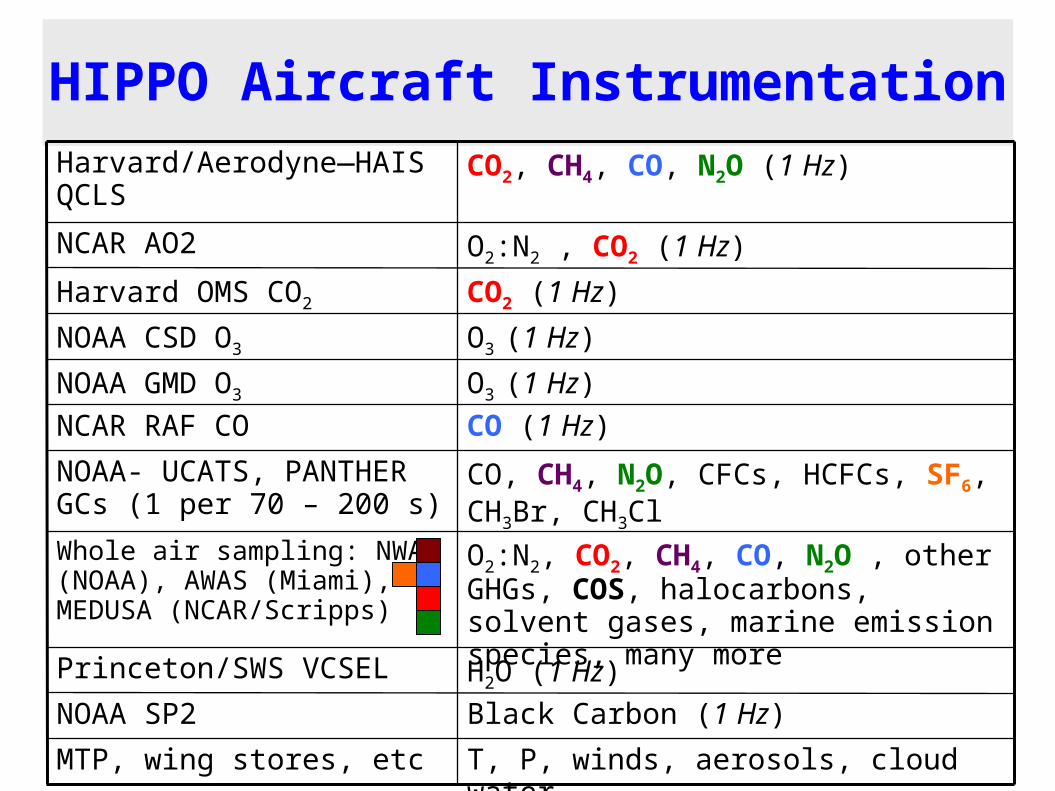
HIPPO Aircraft Instrumentation
O2:N2, CO2, CH4, CO, N2O , other GHGs, COS, halocarbons, solvent gases, marine emission species, many more
Whole air sampling: NWAS (NOAA), AWAS (Miami), MEDUSA (NCAR/Scripps)
O3 (1 Hz)NOAA GMD O3
T, P, winds, aerosols, cloud waterMTP, wing stores, etc
Black Carbon (1 Hz)NOAA SP2
H2O (1 Hz)Princeton/SWS VCSEL
CO, CH4, N2O, CFCs, HCFCs, SF6, CH3Br, CH3Cl
NOAA- UCATS, PANTHER GCs (1 per 70 – 200 s)
CO (1 Hz)NCAR RAF CO
O3 (1 Hz)NOAA CSD O3
CO2 (1 Hz)Harvard OMS CO2
O2:N2 , CO2 (1 Hz)NCAR AO2
CO2, CH4, CO, N2O (1 Hz)Harvard/Aerodyne—HAIS QCLS
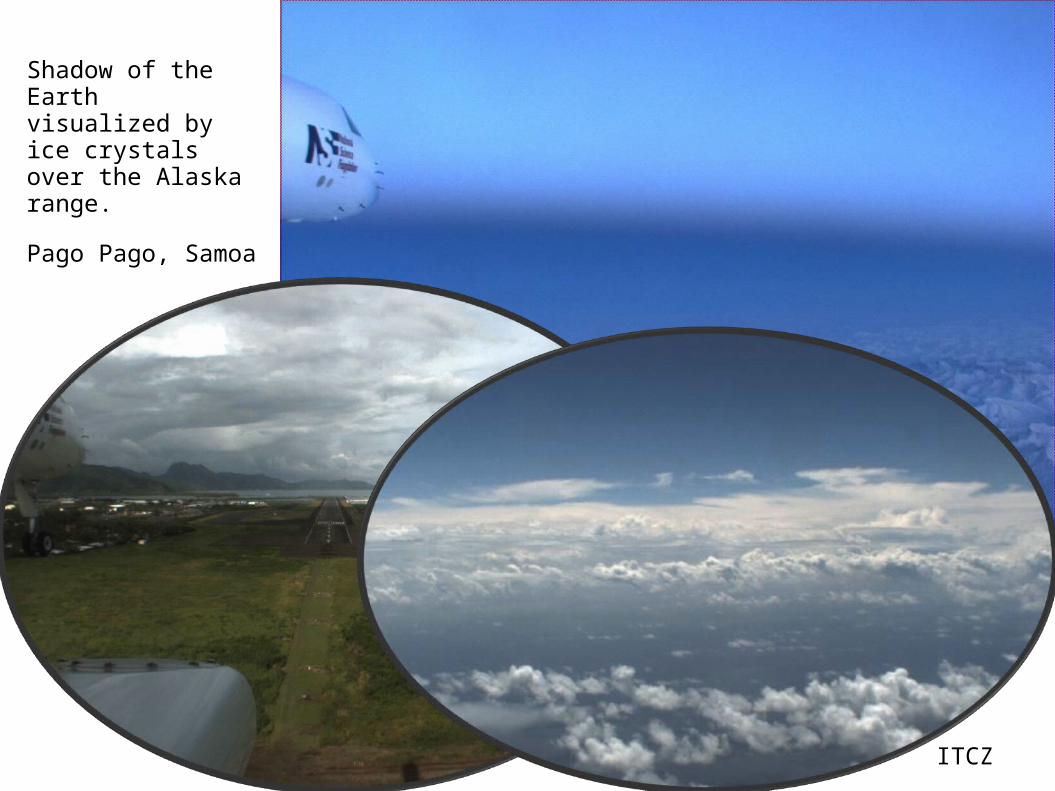
Shadow of the Earth visualized by ice crystals over the Alaska range.
Pago Pago, Samoa
ITCZ
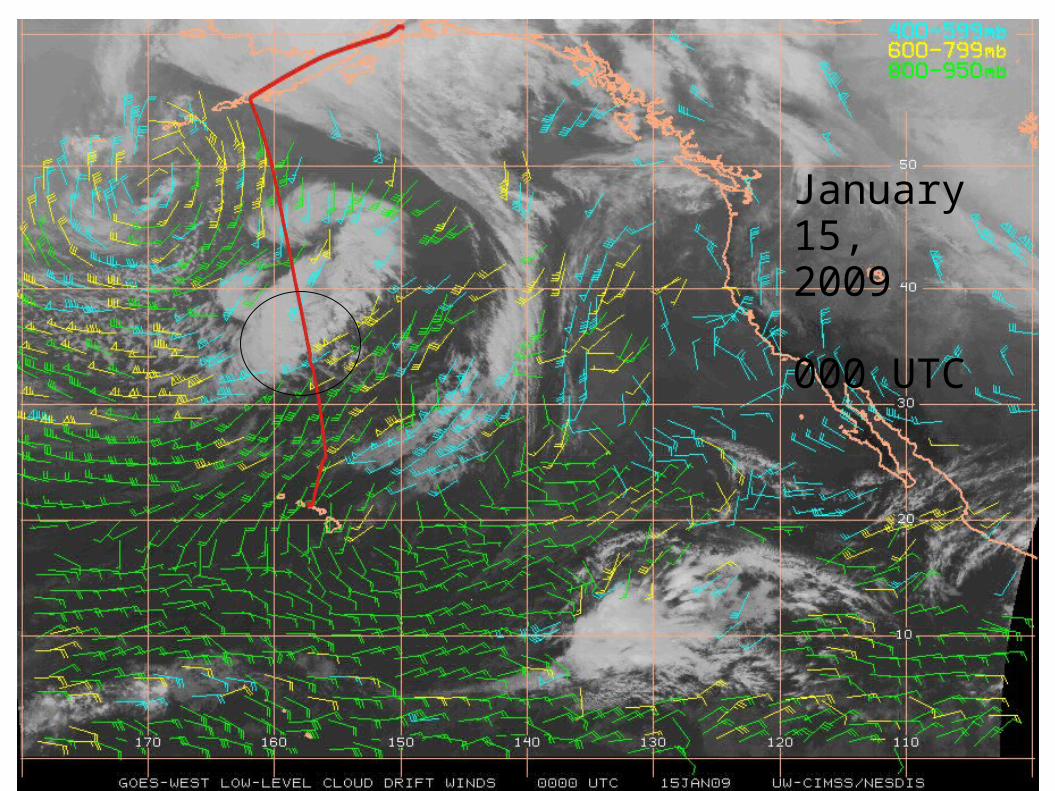
January 15, 2009
000 UTC
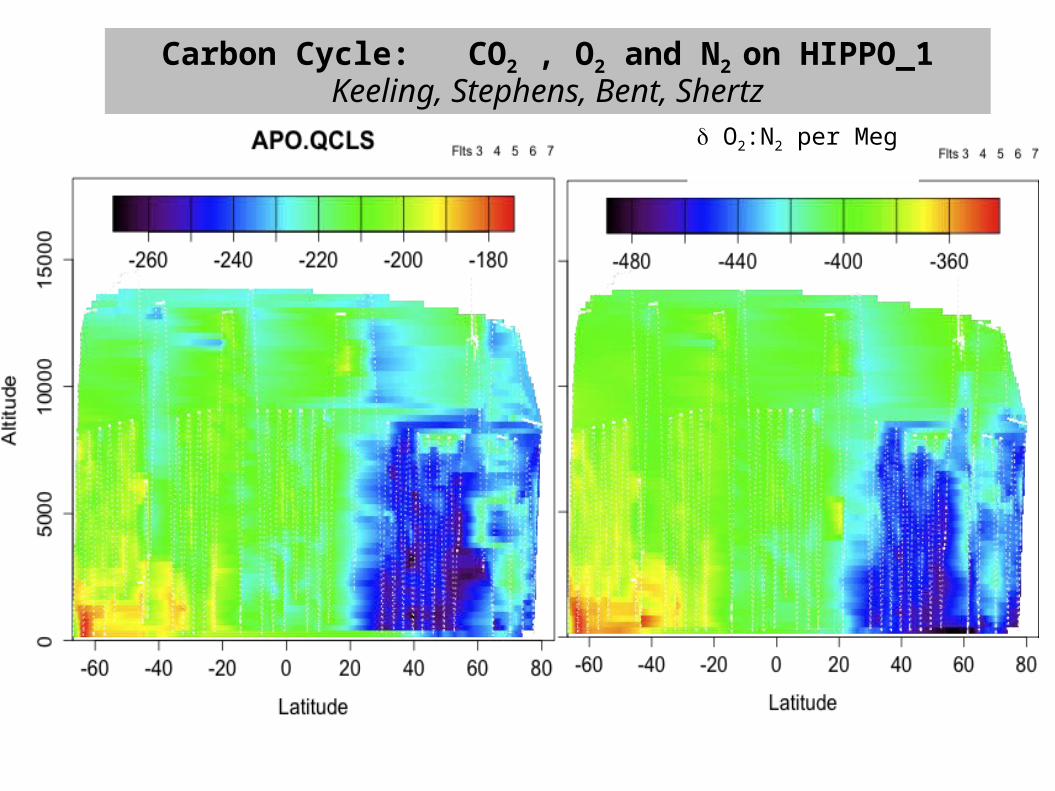
O2:N2 per Meg
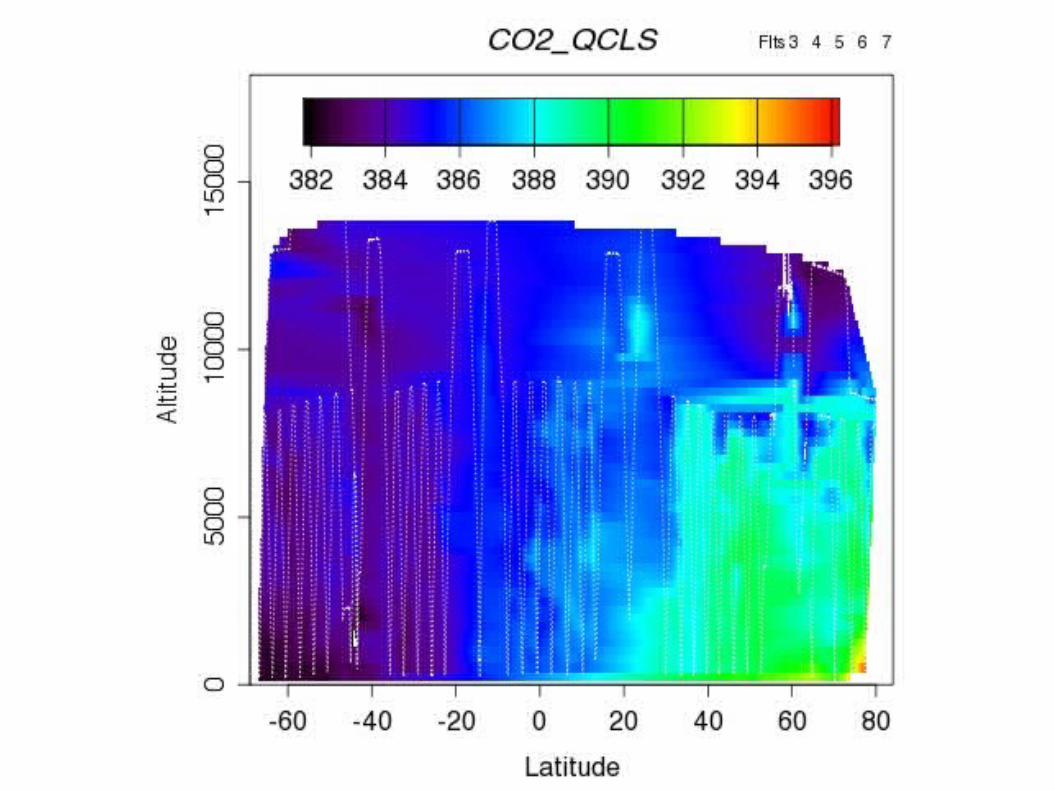
Carbon Cycle: CO2 , O2 and N2 on HIPPO_1Keeling, Stephens, Bent, Shertz
-50 -25 0 25 50 75
12500
10000
7500
5000
2500
GGLATavg
GGALTavg
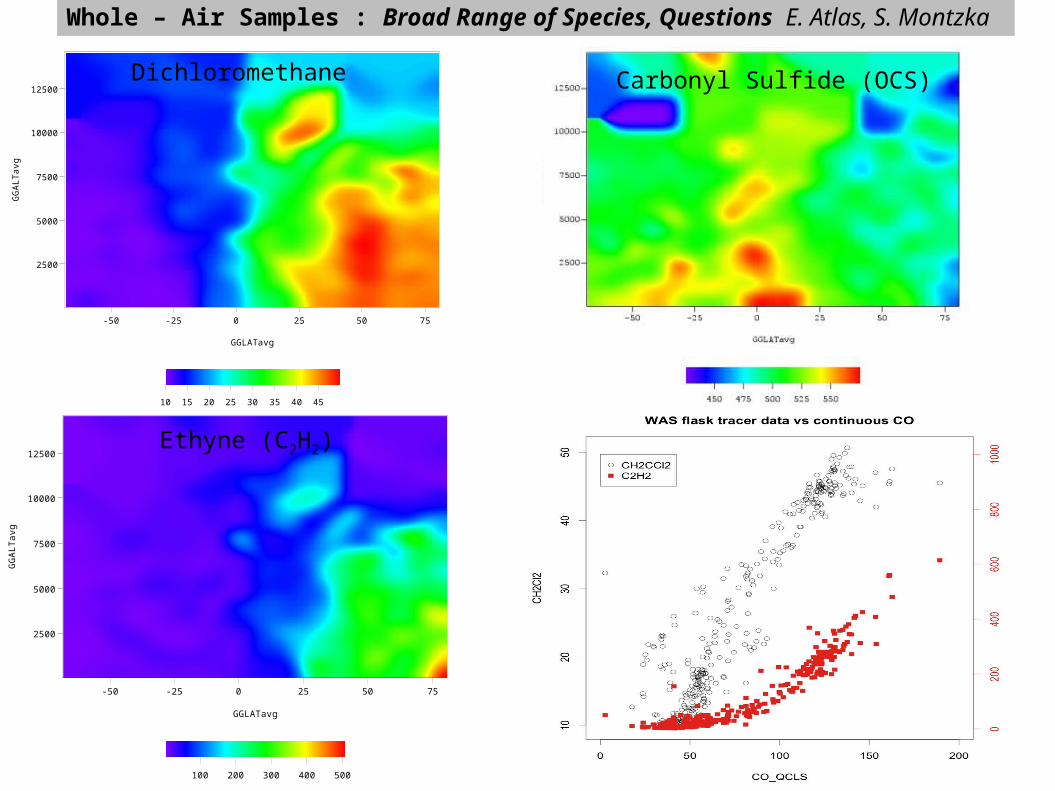
10 15 20 25 30 35 40 45
CH2Cl2_md
Dichloromethane Carbonyl Sulfide (OCS)
-50 -25 0 25 50 75
12500
10000
7500
5000
2500
GGLATavg
GGALTavg
100 200 300 400 500
ethyne_md
Ethyne (C2H2)
Whole – Air Samples : Broad Range of Species, Questions E. Atlas, S. Montzka
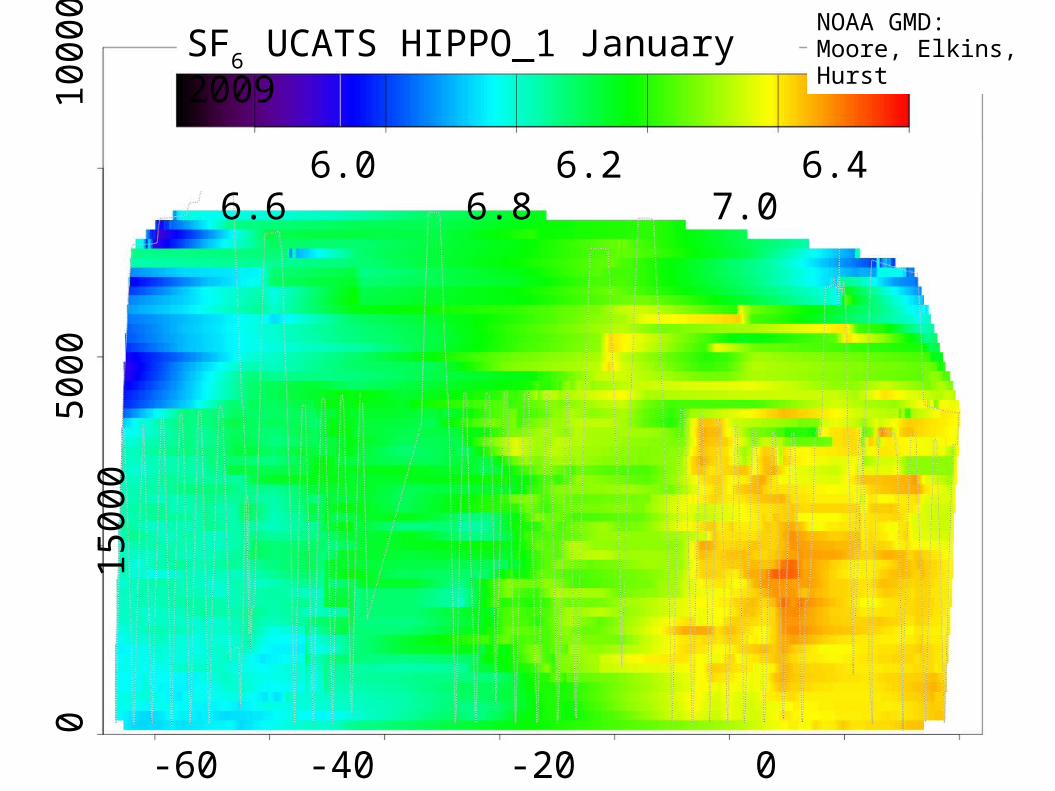
SF6 UCATS HIPPO_1 January 2009
6.0 6.2 6.4 6.6 6.8 7.0
0
5
000
10
000
150
00
-60 -40 -20 0 20 40 60 80
NOAA GMD: Moore, Elkins, Hurst
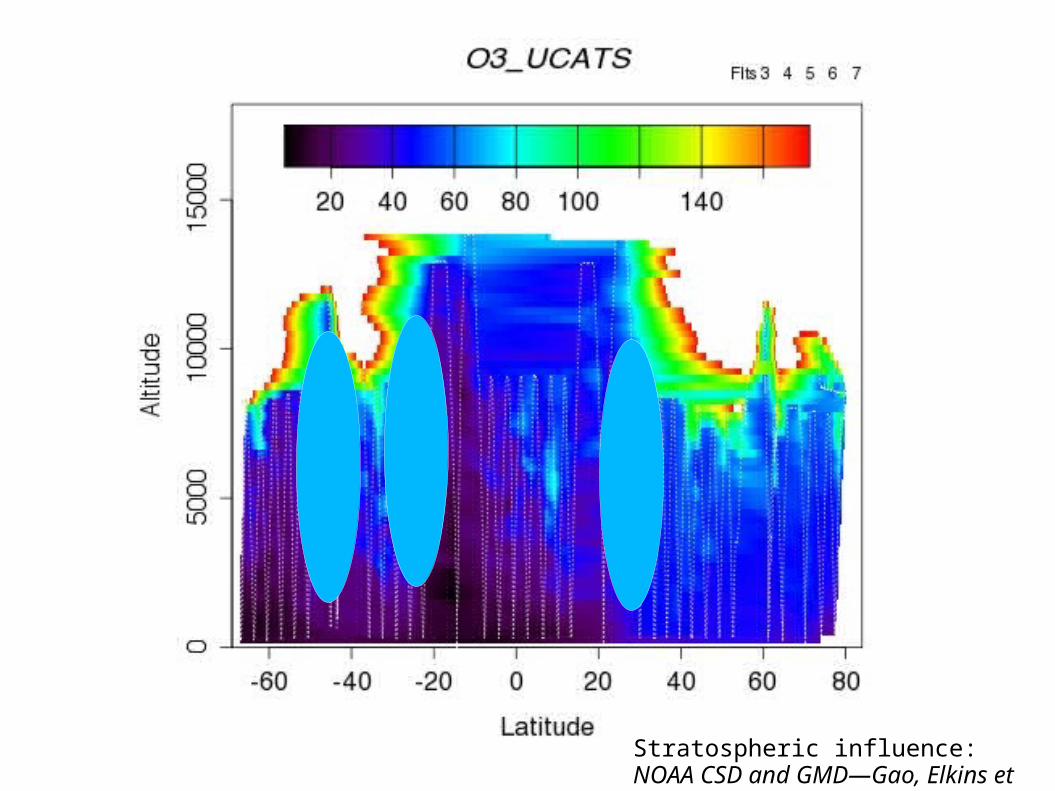
Stratospheric influence: NOAA CSD and GMD—Gao, Elkins et al.
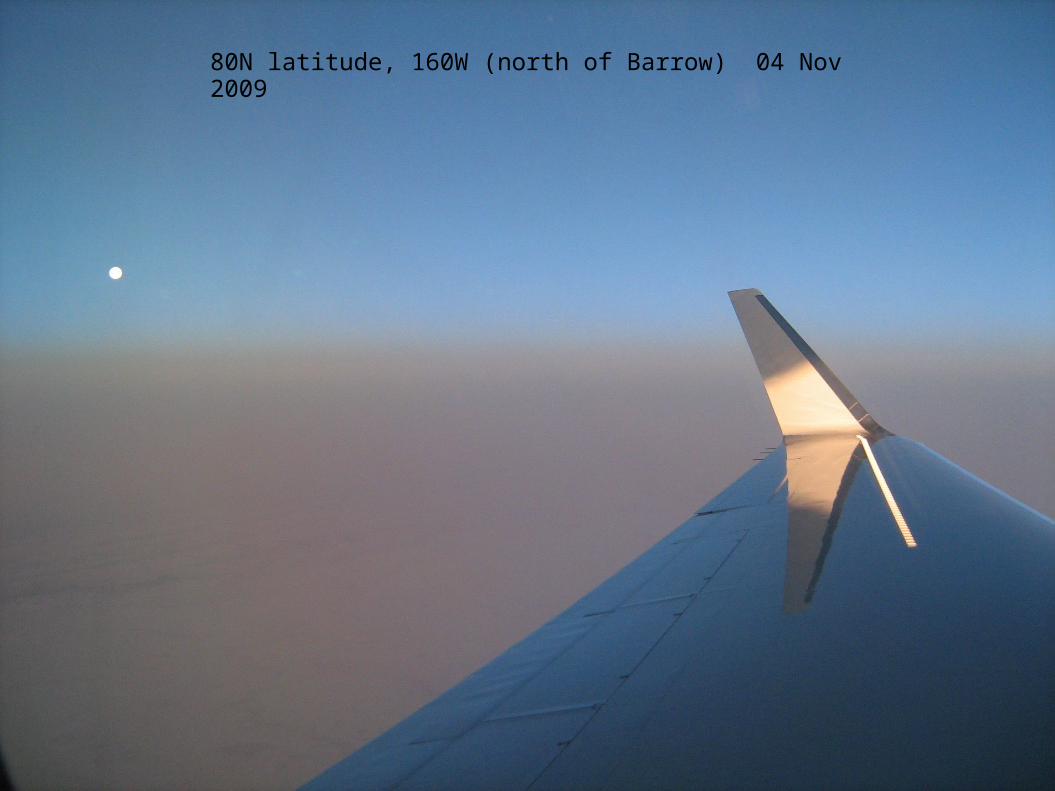
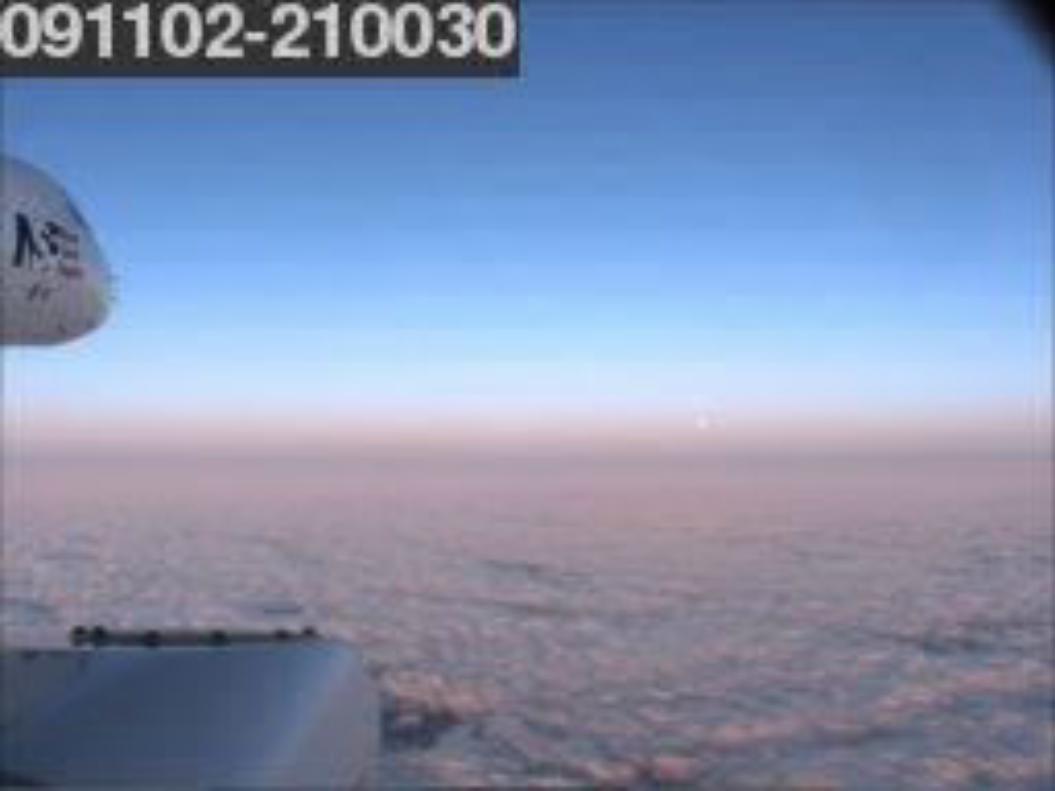
80N latitude, 160W (north of Barrow) 04 Nov 2009
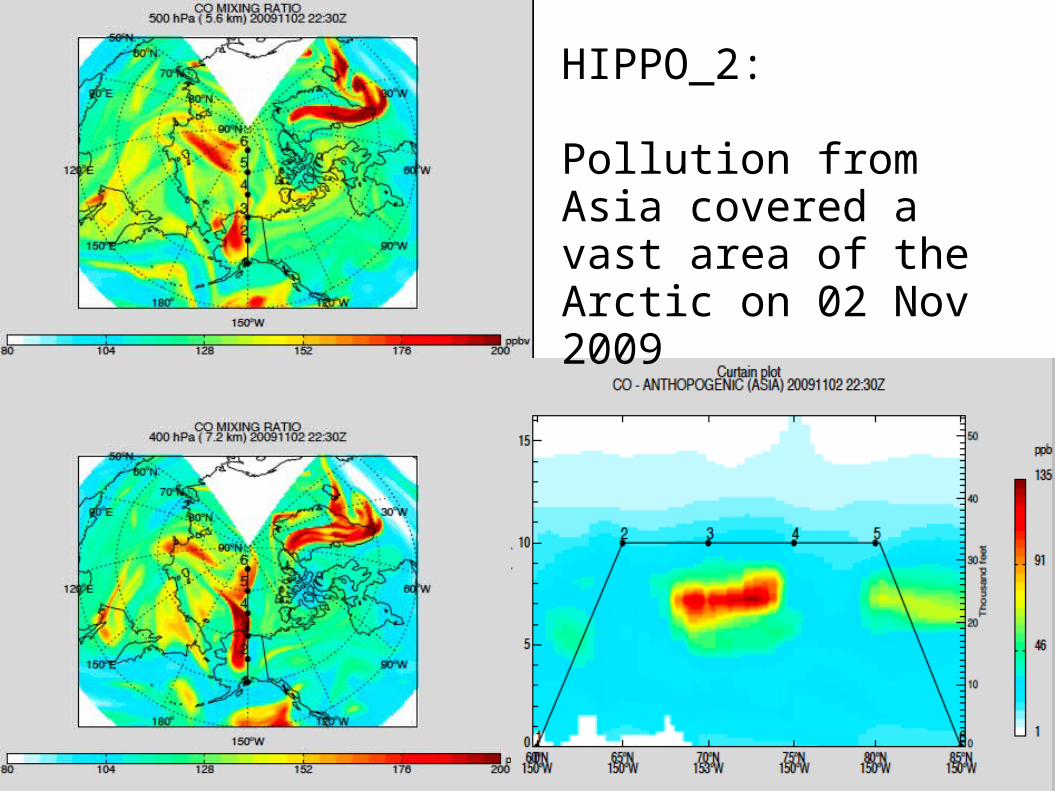
HIPPO_2:
Pollution from Asia covered a vast area of the Arctic on 02 Nov 2009
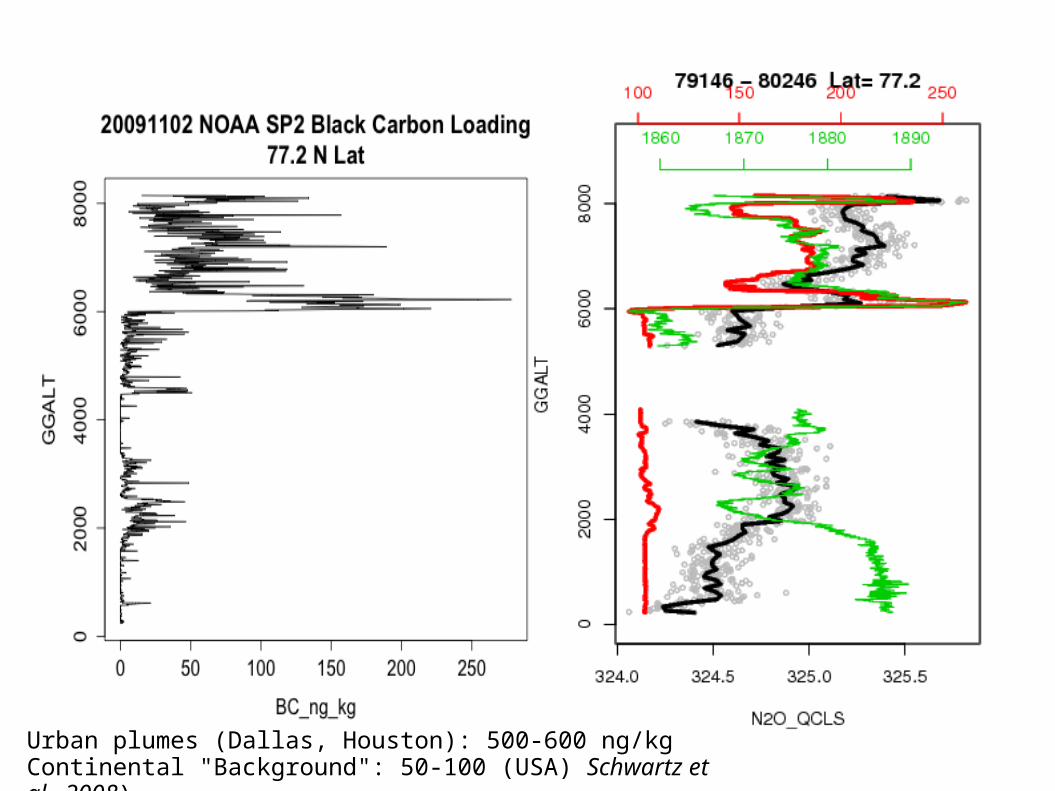
Urban plumes (Dallas, Houston): 500-600 ng/kgContinental "Background": 50-100 (USA) Schwartz et al., 2008)
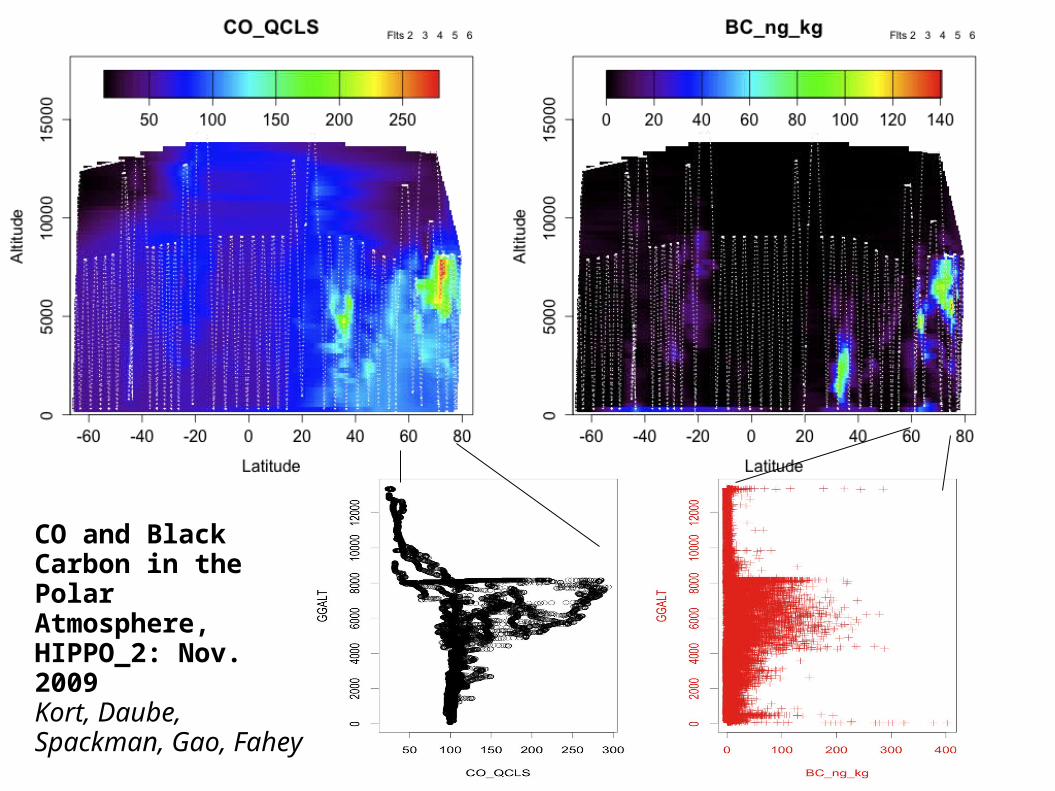
CO and Black Carbon in the Polar Atmosphere, HIPPO_2: Nov. 2009 Kort, Daube, Spackman, Gao, Fahey
"HIAPER Pole-to-Pole Observations" (HIPPO)
•Intensive aircraft measurements provide a unique perspective on the distributions of CO2 and other greenhouse gases, O2:N2 ratio, halocarbons, black carbon, and ozone, challenging global models and giving new insights into how to use long-term station data and aircraft flask collections to characterize global distributions.
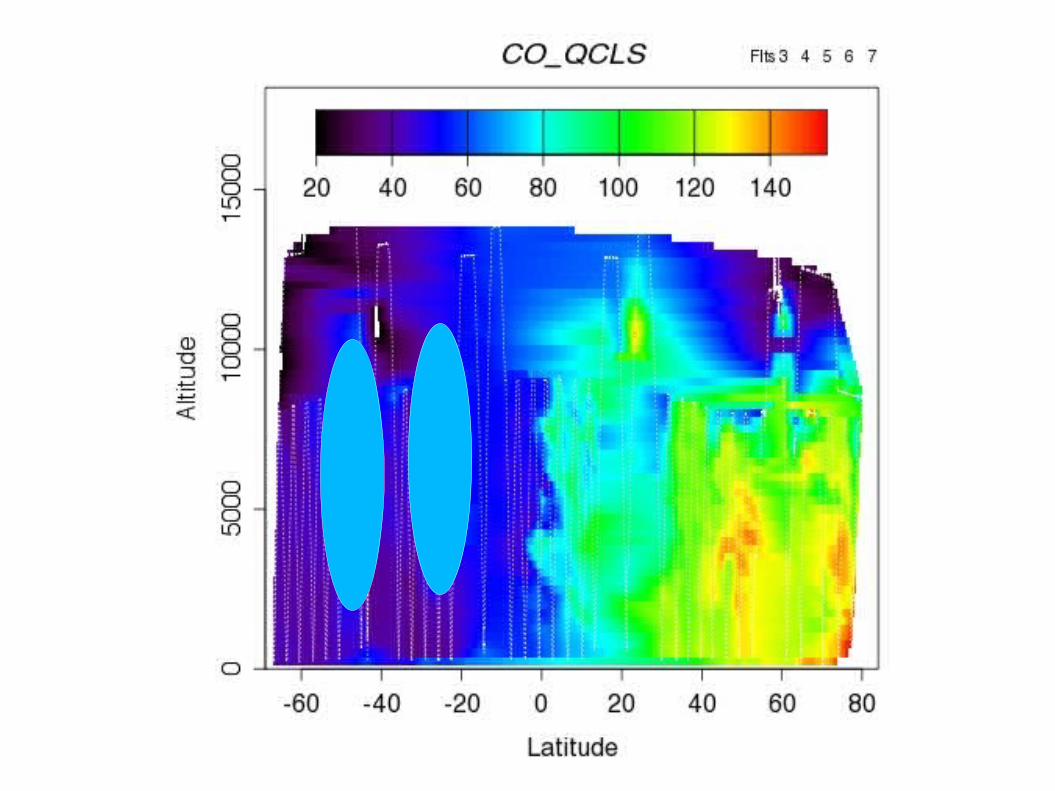
•Sharp latitudinal gradients are observed, strongly distinguished according to lifetime and marked by boundaries between polar, mid-latitude, subtropical, and equatorial air.
•Vertical gradients were weak in January, but in November, strong inverted gradients revealed global scale layers of pollutant gases and aerosols, concentrated far above the surface.
•HIPPO data quantitatively describe effects of global scale transport that must be simulated for accurate inverse analysis of sources and sinks. The data show the locations of global inputs of many species from distinct sources including tropical and Southern oceans, that are difficult to observe any other way.