Embed Size (px)
Citation preview
Attendance Rate by School LevelOn Average
94%of students are in school everyday
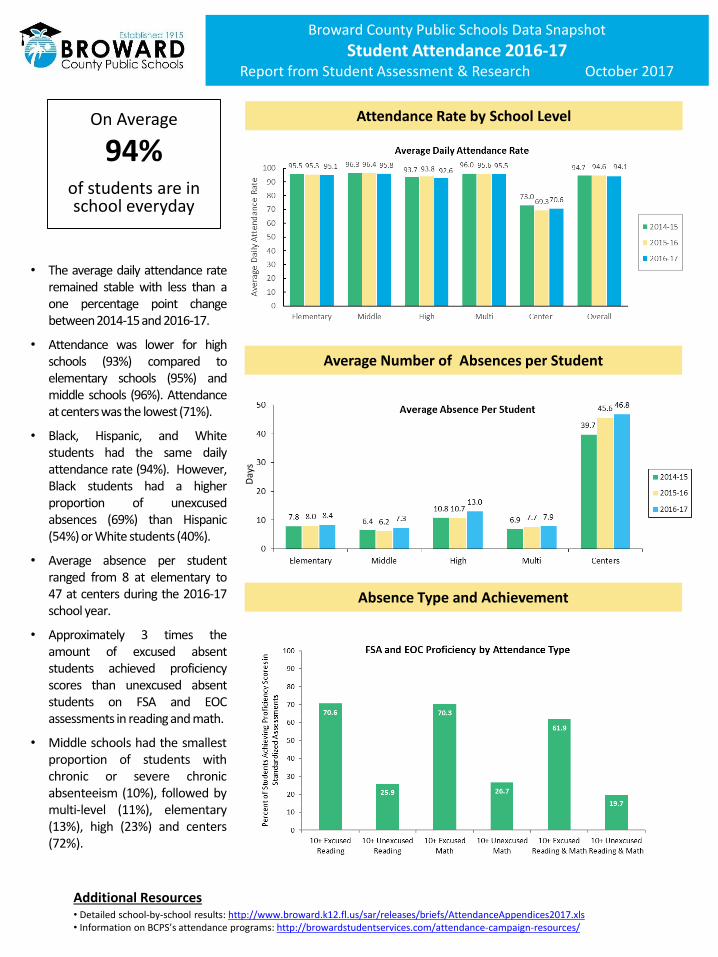
• The average daily attendance rateremained stable with less than aone percentage point changebetween2014-15and 2016-17.
• Attendance was lower for highschools (93%) compared toelementary schools (95%) andmiddle schools (96%). Attendanceat centerswas the lowest (71%).
• Black, Hispanic, and Whitestudents had the same dailyattendance rate (94%). However,Black students had a higherproportion of unexcusedabsences (69%) than Hispanic(54%) or White students (40%).
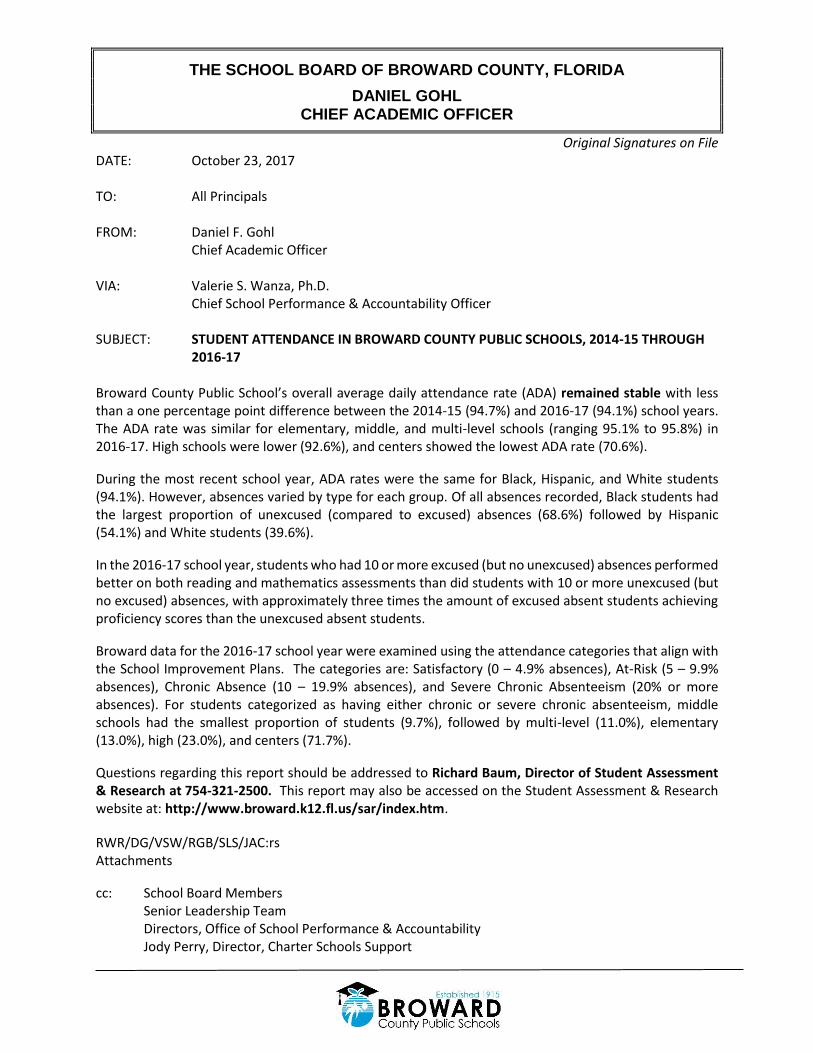
• Average absence per studentranged from 8 at elementary to47 at centers during the 2016-17school year.
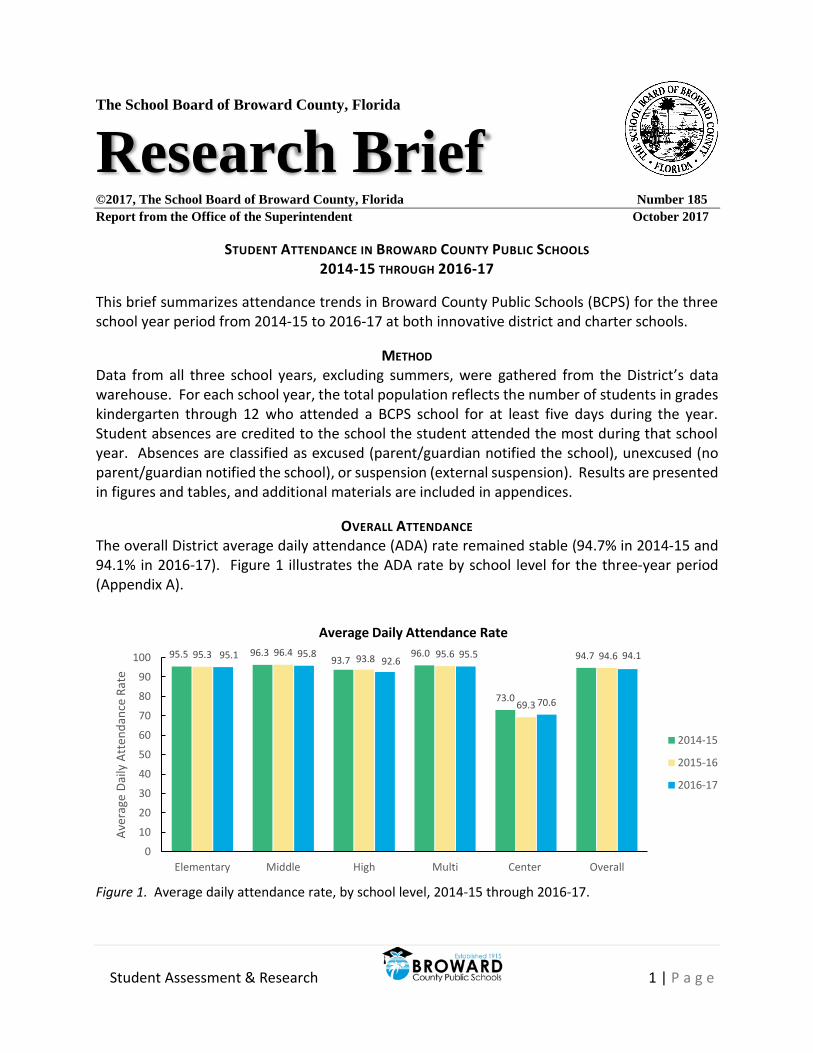
• Approximately 3 times theamount of excused absentstudents achieved proficiencyscores than unexcused absentstudents on FSA and EOCassessments in reading and math.
• Middle schools had the smallestproportion of students withchronic or severe chronicabsenteeism (10%), followed bymulti-level (11%), elementary(13%), high (23%) and centers(72%).
Additional Resources• Detailed school-by-school results: http://www.broward.k12.fl.us/sar/releases/briefs/AttendanceAppendices2017.xls• Information on BCPS’s attendance programs: http://browardstudentservices.com/attendance-campaign-resources/
Broward County Public Schools Data Snapshot
Student Attendance 2016-17Report from Student Assessment & Research October 2017
Average Number of Absences per Student
Absence Type and Achievement
Day
s
THE SCHOOL BOARD OF BROWARD COUNTY, FLORIDA
DANIEL GOHL CHIEF ACADEMIC OFFICER
Original Signatures on File DATE: October 23, 2017 TO: All Principals FROM: Daniel F. Gohl Chief Academic Officer VIA: Valerie S. Wanza, Ph.D. Chief School Performance & Accountability Officer SUBJECT: STUDENT ATTENDANCE IN BROWARD COUNTY PUBLIC SCHOOLS, 2014-15 THROUGH 2016-17 Broward County Public School’s overall average daily attendance rate (ADA) remained stable with less than a one percentage point difference between the 2014-15 (94.7%) and 2016-17 (94.1%) school years. The ADA rate was similar for elementary, middle, and multi-level schools (ranging 95.1% to 95.8%) in 2016-17. High schools were lower (92.6%), and centers showed the lowest ADA rate (70.6%).
During the most recent school year, ADA rates were the same for Black, Hispanic, and White students (94.1%). However, absences varied by type for each group. Of all absences recorded, Black students had the largest proportion of unexcused (compared to excused) absences (68.6%) followed by Hispanic (54.1%) and White students (39.6%).
In the 2016-17 school year, students who had 10 or more excused (but no unexcused) absences performed better on both reading and mathematics assessments than did students with 10 or more unexcused (but no excused) absences, with approximately three times the amount of excused absent students achieving proficiency scores than the unexcused absent students.
Broward data for the 2016-17 school year were examined using the attendance categories that align with the School Improvement Plans. The categories are: Satisfactory (0 – 4.9% absences), At-Risk (5 – 9.9% absences), Chronic Absence (10 – 19.9% absences), and Severe Chronic Absenteeism (20% or more absences). For students categorized as having either chronic or severe chronic absenteeism, middle schools had the smallest proportion of students (9.7%), followed by multi-level (11.0%), elementary (13.0%), high (23.0%), and centers (71.7%).
Questions regarding this report should be addressed to Richard Baum, Director of Student Assessment & Research at 754-321-2500. This report may also be accessed on the Student Assessment & Research website at: http://www.broward.k12.fl.us/sar/index.htm.
RWR/DG/VSW/RGB/SLS/JAC:rs Attachments
cc: School Board Members Senior Leadership Team
Directors, Office of School Performance & Accountability Jody Perry, Director, Charter Schools Support
Student Assessment & Research 1 | P a g e
The School Board of Broward County, Florida
Research Brief ©2017, The School Board of Broward County, Florida Number 185
Report from the Office of the Superintendent October 2017
STUDENT ATTENDANCE IN BROWARD COUNTY PUBLIC SCHOOLS 2014-15 THROUGH 2016-17
This brief summarizes attendance trends in Broward County Public Schools (BCPS) for the three school year period from 2014-15 to 2016-17 at both innovative district and charter schools.
METHOD Data from all three school years, excluding summers, were gathered from the District’s data warehouse. For each school year, the total population reflects the number of students in grades kindergarten through 12 who attended a BCPS school for at least five days during the year. Student absences are credited to the school the student attended the most during that school year. Absences are classified as excused (parent/guardian notified the school), unexcused (no parent/guardian notified the school), or suspension (external suspension). Results are presented in figures and tables, and additional materials are included in appendices.
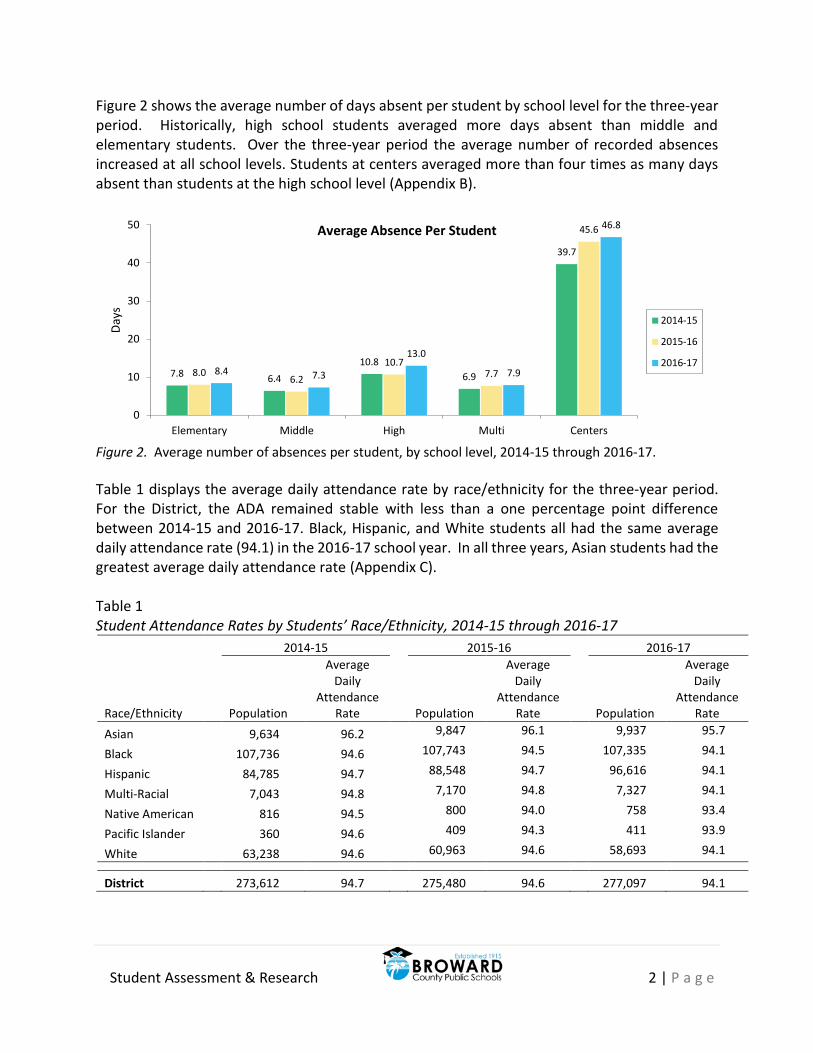
OVERALL ATTENDANCE The overall District average daily attendance (ADA) rate remained stable (94.7% in 2014-15 and 94.1% in 2016-17). Figure 1 illustrates the ADA rate by school level for the three-year period (Appendix A).
Figure 1. Average daily attendance rate, by school level, 2014-15 through 2016-17.
95.5 96.393.7
96.0
73.0
94.795.3 96.493.8 95.6
69.3
94.695.1 95.892.6
95.5
70.6
94.1
0
10
20
30
40
50
60
70
80
90
100
Elementary Middle High Multi Center Overall
Ave
rage
Dai
ly A
tten
dan
ce R
ate
Average Daily Attendance Rate
2014-15
2015-16
2016-17
Student Assessment & Research 2 | P a g e
Figure 2 shows the average number of days absent per student by school level for the three-year period. Historically, high school students averaged more days absent than middle and elementary students. Over the three-year period the average number of recorded absences increased at all school levels. Students at centers averaged more than four times as many days absent than students at the high school level (Appendix B).
Figure 2. Average number of absences per student, by school level, 2014-15 through 2016-17.
Table 1 displays the average daily attendance rate by race/ethnicity for the three-year period. For the District, the ADA remained stable with less than a one percentage point difference between 2014-15 and 2016-17. Black, Hispanic, and White students all had the same average daily attendance rate (94.1) in the 2016-17 school year. In all three years, Asian students had the greatest average daily attendance rate (Appendix C). Table 1 Student Attendance Rates by Students’ Race/Ethnicity, 2014-15 through 2016-17
2014-15 2015-16 2016-17
Race/Ethnicity Population
Average Daily
Attendance Rate Population
Average Daily
Attendance Rate Population
Average Daily
Attendance Rate
Asian 9,634 96.2 9,847 96.1
9,937 95.7
Black 107,736 94.6 107,743 94.5
107,335 94.1
Hispanic 84,785 94.7 88,548 94.7
96,616 94.1
Multi-Racial 7,043 94.8 7,170 94.8
7,327 94.1
Native American 816 94.5 800 94.0 758 93.4
Pacific Islander 360 94.6 409 94.3
411 93.9
White 63,238 94.6 60,963 94.6 58,693 94.1
District 273,612 94.7 275,480 94.6 277,097 94.1
7.8 6.4
10.8
6.9
39.7
8.06.2
10.77.7
45.6
8.4 7.3
13.0
7.9
46.8
0
10
20
30
40
50
Elementary Middle High Multi Centers
Day
s
Average Absence Per Student
2014-15
2015-16
2016-17
Student Assessment & Research 3 | P a g e
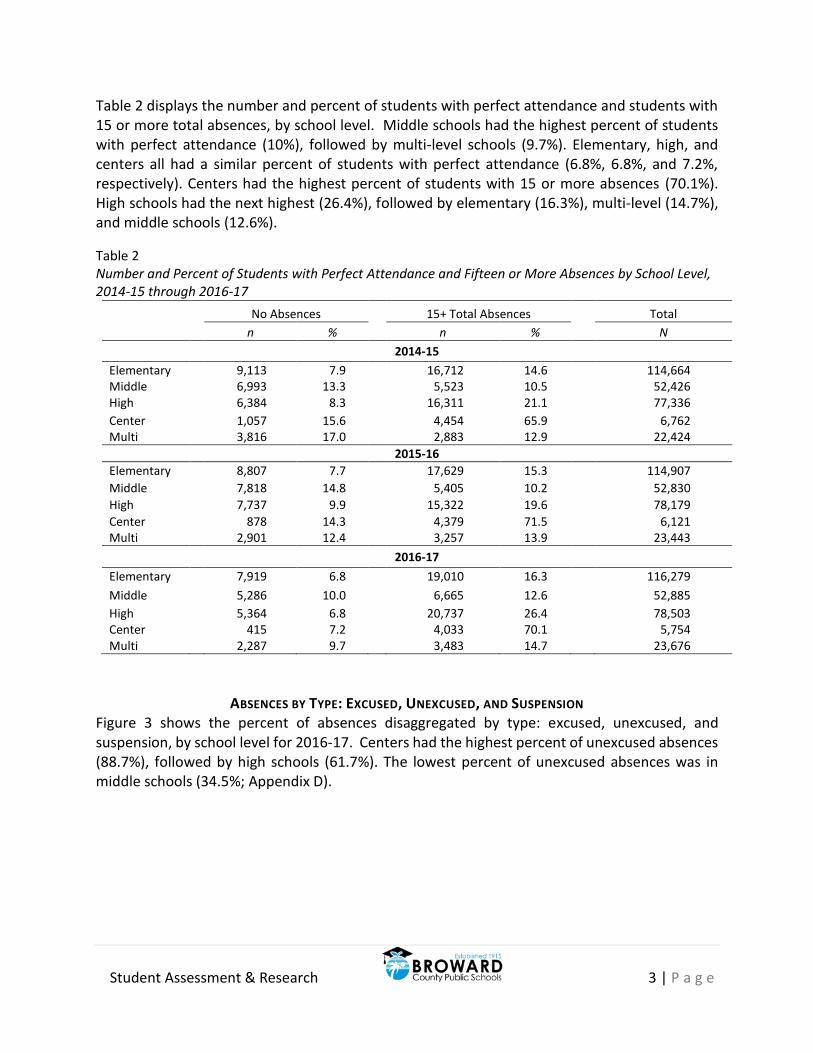
Table 2 displays the number and percent of students with perfect attendance and students with 15 or more total absences, by school level. Middle schools had the highest percent of students with perfect attendance (10%), followed by multi-level schools (9.7%). Elementary, high, and centers all had a similar percent of students with perfect attendance (6.8%, 6.8%, and 7.2%, respectively). Centers had the highest percent of students with 15 or more absences (70.1%). High schools had the next highest (26.4%), followed by elementary (16.3%), multi-level (14.7%), and middle schools (12.6%).
Table 2 Number and Percent of Students with Perfect Attendance and Fifteen or More Absences by School Level, 2014-15 through 2016-17
No Absences 15+ Total Absences Total
n % n % N
2014-15
Elementary
9,113 7.9
16,712 14.6
114,664 Middle
6,993 13.3
5,523 10.5
52,426
High
6,384 8.3
16,311 21.1
77,336
Center
1,057 15.6
4,454 65.9
6,762 Multi
3,816 17.0
2,883 12.9
22,424
2015-16
Elementary
8,807 7.7 17,629 15.3 114,907
Middle
7,818 14.8 5,405 10.2 52,830
High
7,737 9.9 15,322 19.6 78,179
Center
878 14.3 4,379 71.5 6,121 Multi
2,901 12.4 3,257 13.9 23,443
2016-17
Elementary
7,919 6.8 19,010 16.3 116,279
Middle
5,286 10.0 6,665 12.6 52,885
High
5,364 6.8 20,737 26.4 78,503 Center
415 7.2 4,033 70.1 5,754
Multi
2,287 9.7 3,483 14.7 23,676
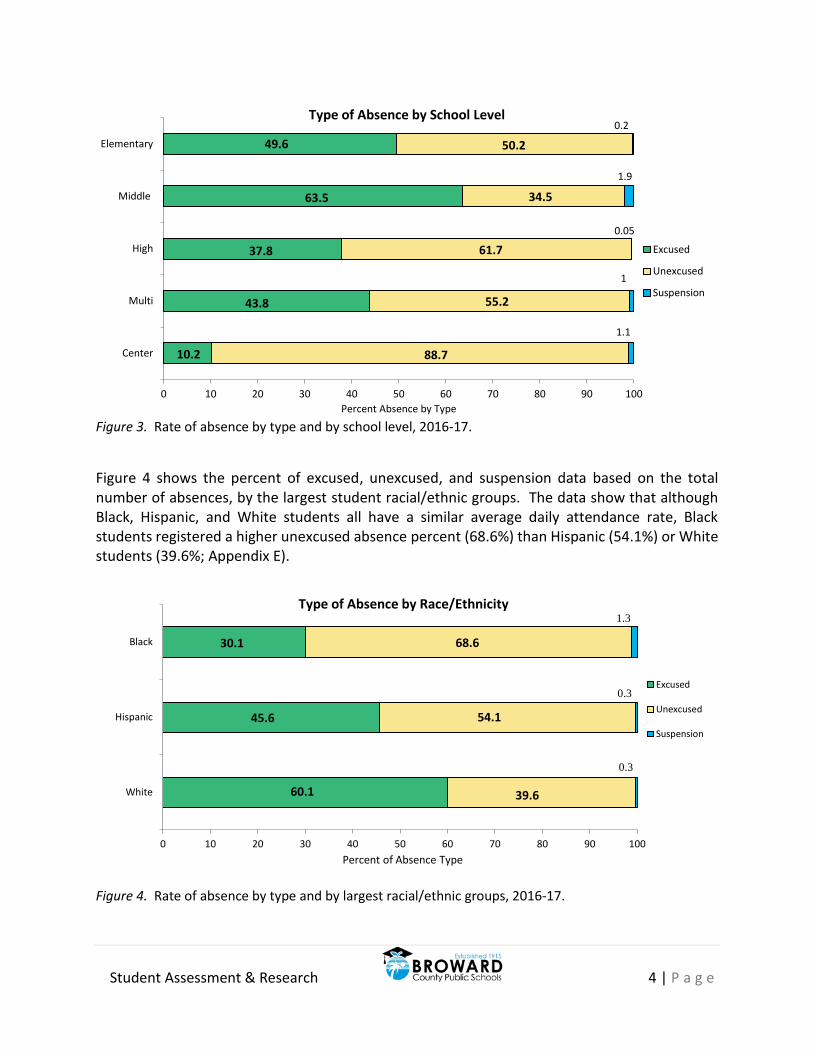
ABSENCES BY TYPE: EXCUSED, UNEXCUSED, AND SUSPENSION Figure 3 shows the percent of absences disaggregated by type: excused, unexcused, and suspension, by school level for 2016-17. Centers had the highest percent of unexcused absences (88.7%), followed by high schools (61.7%). The lowest percent of unexcused absences was in middle schools (34.5%; Appendix D).
Student Assessment & Research 4 | P a g e
Figure 3. Rate of absence by type and by school level, 2016-17.
Figure 4 shows the percent of excused, unexcused, and suspension data based on the total number of absences, by the largest student racial/ethnic groups. The data show that although Black, Hispanic, and White students all have a similar average daily attendance rate, Black students registered a higher unexcused absence percent (68.6%) than Hispanic (54.1%) or White students (39.6%; Appendix E).
Figure 4. Rate of absence by type and by largest racial/ethnic groups, 2016-17.
10.2
43.8
37.8
63.5
49.6
88.7
55.2
61.7
34.5
50.2
1.1
1
0.05
1.9
0.2
0 10 20 30 40 50 60 70 80 90 100
Center
Multi
High
Middle
Elementary
Percent Absence by Type
Type of Absence by School Level
Excused
Unexcused
Suspension
60.1
45.6
30.1
39.6
54.1
68.6
0.3
0.3
1.3
0 10 20 30 40 50 60 70 80 90 100
White
Hispanic
Black
Percent of Absence Type
Type of Absence by Race/Ethnicity
Excused
Unexcused
Suspension
Student Assessment & Research 5 | P a g e
ABSENCE TYPE AND ACHIEVEMENT PERFORMANCE
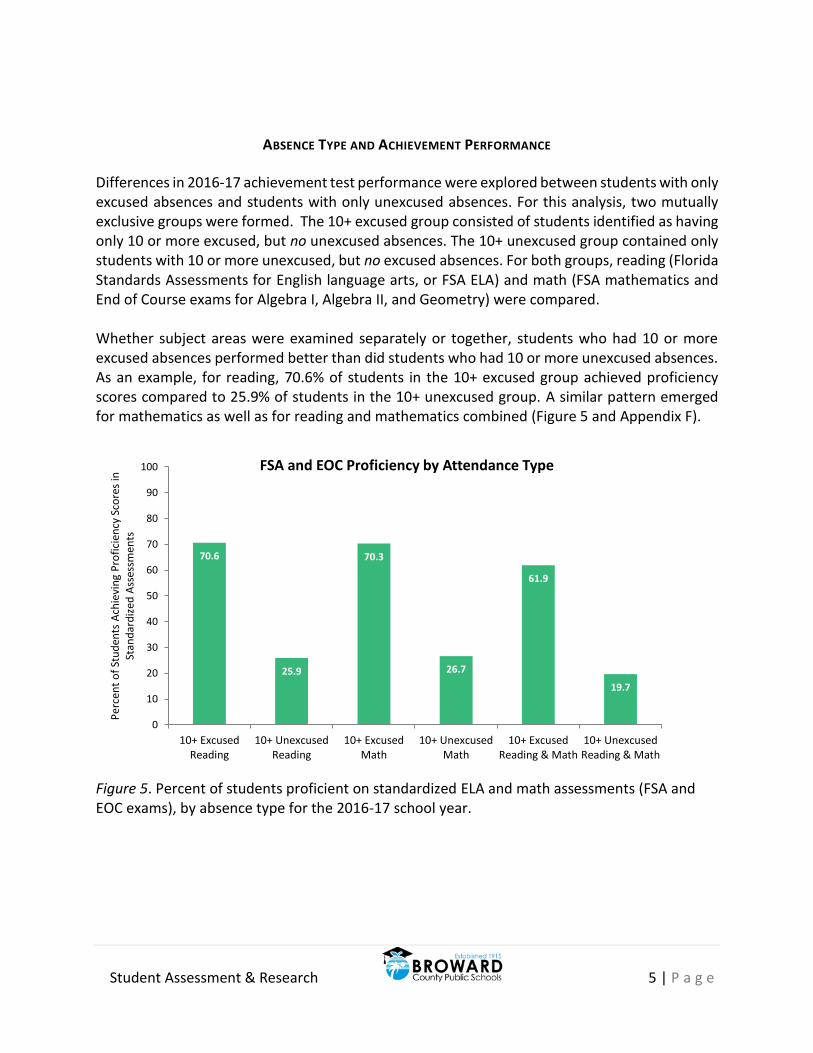
Differences in 2016-17 achievement test performance were explored between students with only excused absences and students with only unexcused absences. For this analysis, two mutually exclusive groups were formed. The 10+ excused group consisted of students identified as having only 10 or more excused, but no unexcused absences. The 10+ unexcused group contained only students with 10 or more unexcused, but no excused absences. For both groups, reading (Florida Standards Assessments for English language arts, or FSA ELA) and math (FSA mathematics and End of Course exams for Algebra I, Algebra II, and Geometry) were compared. Whether subject areas were examined separately or together, students who had 10 or more excused absences performed better than did students who had 10 or more unexcused absences. As an example, for reading, 70.6% of students in the 10+ excused group achieved proficiency scores compared to 25.9% of students in the 10+ unexcused group. A similar pattern emerged for mathematics as well as for reading and mathematics combined (Figure 5 and Appendix F).
Figure 5. Percent of students proficient on standardized ELA and math assessments (FSA and EOC exams), by absence type for the 2016-17 school year.
70.6
25.9
70.3
26.7
61.9
19.7
0
10
20
30
40
50
60
70
80
90
100
10+ ExcusedReading
10+ UnexcusedReading
10+ ExcusedMath
10+ UnexcusedMath
10+ ExcusedReading & Math
10+ UnexcusedReading & Math
Per
cen
t o
f St
ud
ents
Ach
ievi
ng
Pro
fici
ency
Sco
res
in
Stan
dar
diz
ed A
sses
smen
ts
FSA and EOC Proficiency by Attendance Type
Student Assessment & Research 6 | P a g e
ATTENDANCE CATEGORIES IN 2016-17
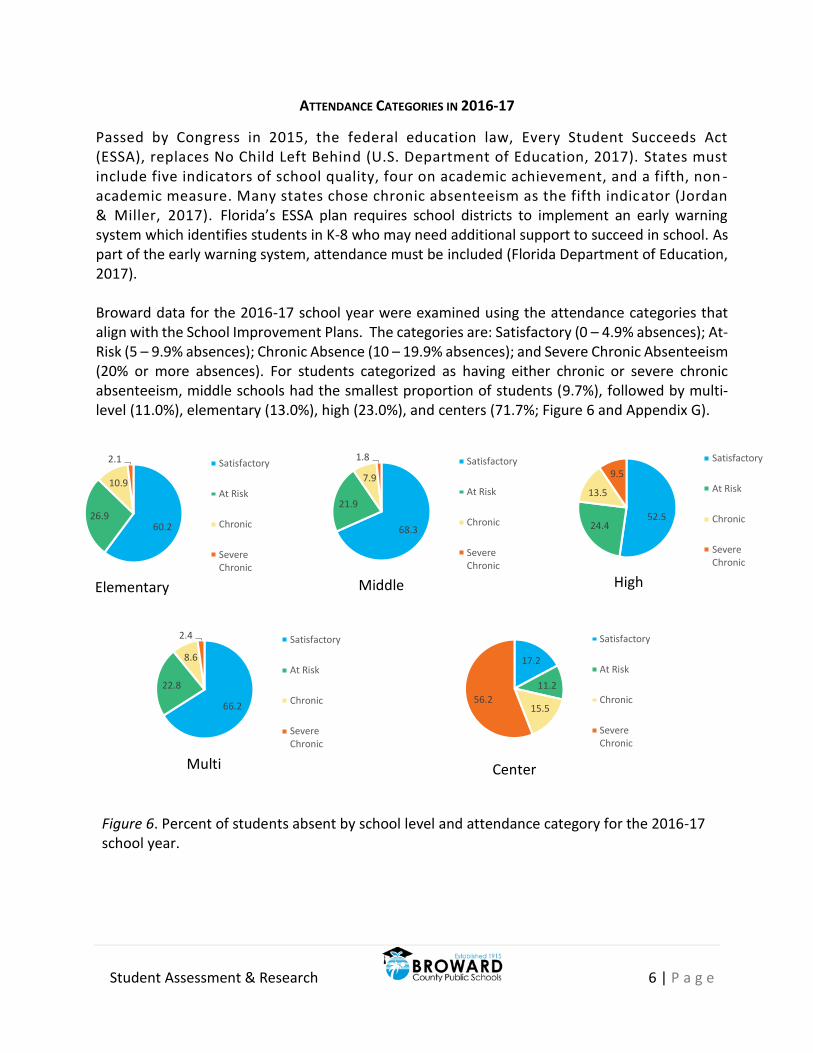
Passed by Congress in 2015, the federal education law, Every Student Succeeds Act (ESSA), replaces No Child Left Behind (U.S. Department of Education, 2017). States must include five indicators of school quality, four on academic achievement, and a fifth, non -academic measure. Many states chose chronic absenteeism as the fifth indicator (Jordan & Miller, 2017). Florida’s ESSA plan requires school districts to implement an early warning system which identifies students in K-8 who may need additional support to succeed in school. As part of the early warning system, attendance must be included (Florida Department of Education, 2017). Broward data for the 2016-17 school year were examined using the attendance categories that align with the School Improvement Plans. The categories are: Satisfactory (0 – 4.9% absences); At-Risk (5 – 9.9% absences); Chronic Absence (10 – 19.9% absences); and Severe Chronic Absenteeism (20% or more absences). For students categorized as having either chronic or severe chronic absenteeism, middle schools had the smallest proportion of students (9.7%), followed by multi-level (11.0%), elementary (13.0%), high (23.0%), and centers (71.7%; Figure 6 and Appendix G).
Elementary Middle High
60.226.9
10.9
2.1 Satisfactory
At Risk
Chronic
SevereChronic
68.3
21.9
7.9
1.8 Satisfactory
At Risk
Chronic
SevereChronic
52.524.4
13.5
9.5
Satisfactory
At Risk
Chronic
SevereChronic
17.2
11.2
15.556.2
Satisfactory
At Risk
Chronic
SevereChronic
66.2
22.8
8.6
2.4 Satisfactory
At Risk
Chronic
SevereChronic
Multi Center
Figure 6. Percent of students absent by school level and attendance category for the 2016-17 school year.
Student Assessment & Research 7 | P a g e
SCHOOL LEVEL ATTENDANCE INFORMATION IN 2016-17 Three years of detailed attendance information at the school level, including absence by type, students with 10 or more unexcused absences, students with 15 or more total absences, the average daily attendance rate, and the average number of absences per student, are available in Appendix H.
SUMMARY
Overall Trends in Attendance
• The District’s average daily attendance rate remained stable with less than one percentage point change from 2014-15 (94.7%) to 2016-17 (94.1%) (Figure 1 and Appendix A).
• Attendance was lower for high schools (92.6%) compared to both elementary (95.1%) and middle schools (95.8%). Attendance at centers was the lowest (70.6%); however, this represents an increase in the average daily attendance rate at centers of 1.3 percentage points from the 2015-16 school year to the 2016-17 school year (Figure 1 and Appendix A).
• Students enrolled at centers missed an average of 47 days during the 2016-17 school year. On average, high school students missed 13 days, middle school students 7 days, and elementary school students 8 days during the same time-period (Figure 2 and Appendix B).
• Black, Hispanic, and White students all had the same average daily attendance rate (94.1) in the 2016-17 school year, while in all three years, Asian students had the greatest average daily attendance rate (Table 1 and Appendix C).
Attendance Type in 2016-17
• Perfect attendance: Middle schools had the highest percent of students with perfect attendance (10%), followed by multi-level schools (9.7%). Elementary, high, and centers all had a similar percent of students with perfect attendance (6.8%, 6.8%, and 7.2%, respectively (Table 2).
• Fifteen or more absences: Centers had the highest percent of students with 15 or more absences (70.1%). High schools had the next highest (26.4%), followed by elementary (16.3%), multi-level (14.7%) and middle schools (12.6%; Table 2).
• Unexcused absences by school level: Centers had the highest percent of unexcused absences (88.7%), followed by high schools (61.7%). The lowest percent of unexcused absences was in middle schools (34.5%; Figure 3 and Appendix D).
• Unexcused absences by race/ethnicity: Black students had a higher percent of unexcused absences (68.6%), compared to Hispanic students (54.1%), and White students (39.6%; Figure 4 and Appendix E).
Student Assessment & Research 8 | P a g e
Attendance Type and Achievement in 2016-17
• Students who had 10 or more excused (but no unexcused) absences performed better on both reading and mathematics assessments than did students with 10 or more unexcused (but no excused) absences, with approximately three times the amount of excused absent students achieving proficiency scores than the unexcused absent students (Figure 5 and Appendix F).
Attendance Categories in 2016-17
• For students categorized as having either chronic or severe chronic absenteeism, middle schools had the smallest proportion of students (9.7%), followed by multi-level (11.0%), elementary (13.0%), high (23.0%), and centers (71.7%; Figure 6 and Appendix G).
DISCUSSION
The Student Services Department, responsible for monitoring attendance and initiating policy change, has taken the following actions to address attendance in the past school year: New Position Created: Coordinator, District Attendance Following the implementation of the Attendance Symposium in September 2016, the School Board approved a position within the Student Services Department to address Tier 1 attendance needs within the District. Responsibilities include: determining pertinent data that can be added to school reports, updating the Attendance Plan Template to align with ESSA guidelines, providing best practices for improving attendance and school reporting, increasing social media presence to promote good attendance (follow @BCPS_180 on Twitter), organizing future Attendance Symposium events, serving as chairperson for the District Attendance Committee, serving on the Reading by Grade-Level Initiative partnering with Children’s Services Council of Broward County, and organizing the annual attendance recognition event, “Evening Among the Stars.” Previously, these duties were distributed among support staff and leaders within the Student Services Department. This new coordinator position provides all schools with additional resources and supports programs within Student Support Initiatives. The coordinator works directly to support program leaders for School Social Work, Family Counseling, HEART (Homeless Education Assistance Resource Team), Foster Care, and Mentoring Tomorrow’s Leaders. Defining Chronic Absenteeism for Broward County Public Schools Chronic Absenteeism is when a student misses 10% of possible school days for any reason (including excused absences, unexcused absences, and suspensions). This helps us to use chronic absenteeism as an early warning indicator as early as the 20th day of school. By using a percent as an indicator of chronic absenteeism rather than a fixed number, services and support can be implemented early in the school year. Attendance data are available for all school personnel through BASIS to assist in identifying chronically absent students.
Student Assessment & Research 9 | P a g e
Annual Attendance Plan Template for Schools During the 2016-17 school year, the Attendance Plan within the School Improvement Plan was revised to provide data that helps schools identify how many students are chronically absent. The revised plan mirrors data collected by the State of Florida for ESSA and categorizes students for attendance as: Satisfactory (0 – 4.9% absences), At-Risk (5 – 9.9% absences), Chronic Absence (10 – 19.9% absences), and Severe Chronic Absenteeism (20% or more absences). All data from the 2016-17 school year were uploaded into the School Improvement Plan prior to the first day of school for 2017-18 and is accessible to the team of stakeholders that develop plans to be shared with the community. The attendance plan is accompanied by a list of resources that include strategies for students at all levels of attendance.
All schools in BCPS provided a representative that attended the training for the School Improvement Plan, which included a comprehensive review of the revisions and updates for the Attendance Plan. Expanded use of Attendance Success Coaches ReServe South Florida is an organization that utilizes retired professionals to serve as Attendance Success Coaches. The coaches meet directly with students who were chronically absent during the previous school year. Coaches convey to the students the importance of regular attendance, doing well in school, and getting along with peers. They also give students the opportunity to discuss their feelings about school and academic challenges, and provide students with attention from a caring adult. Increased Awareness Activities Several initiatives to promote attendance have been implemented since the 2015-16 school year. In 2016-17, all middle schools, and select elementary and center schools, were provided with materials to promote increased attendance awareness among the students, school, parents and community. Promotional materials included outdoor banners, flyers, pledge cards, lanyards, and stickers for the elementary level. Additionally, the Student Services Department delivered presentations at open houses and community events, and at a board meeting. During the 2016-17 school year, the Community Foundation of Broward provided 13 middle schools participating in the “School is Cool” grant with funds to support attendance rallies and attendance initiatives. Participating schools utilized incentives for students and actively promoted attendance at community events. September was once again declared “Attendance Awareness Month” at a regularly scheduled board meeting. Prior to the start of the 2017-18 school year, school social workers delivered newly updated retractable attendance banners for the school’s front office and outdoor mesh banners for
Student Assessment & Research 10 | P a g e
community display to promote the message that “Attendance Counts! All Day, Every Day.” Every public school in Broward County received these promotional materials. Continuing Student Attendance Recognition Annually, students with exceptionally high attendance are recognized. Perfect Attendance recognitions are awarded to students who did not miss a day of school for the entire time they were at that school level (elementary, middle, or high). Elementary school students are recognized at the end of 5th grade (including students attending a K-8 school). Middle school students are recognized in 8th grade (including K-8 and 6-12 schools). High school students are recognized in their senior year. A “Best in Class” attendance recognition is awarded yearly to high school seniors that have been continuously enrolled in a BCPS school from kindergarten through 12th grade, and have the best cumulative attendance in Broward County Public Schools. Attendance Policy 5.5 and Additional Attendance Information The complete BCPS attendance policy (Policy 5.5) is available at: http://browardstudentservices.com/wp-content/uploads/2014/08/Policy-5.5-Attendance-06-21-16.doc_.pdf The Department of Student Services handles all matters concerning student attendance. For further information regarding attendance policies and/or initiatives please contact Phillip Shaver, Coordinator, District Attendance, Student Services at 754-321-1550.
Student Assessment & Research 11 | P a g e
DETAILED APPENDICES
(Available On-line at http://www.broward.k12.fl.us/sar/Releases.htm)
Appendix A: Average daily attendance rate by school level, 2014-15 through 2016-17
Appendix B: Average number of absences per student, by school level, 2014-15 through 2016-17
Appendix C: Average daily attendance rate by students' demographics, 2014-15 through 2016-17
Appendix D: Number and percent of excused and unexcused absence, by school level, 2014-15 through 2016-17 Appendix E: Number and percent of excused and unexcused absence, by race/ethnicity, 2014-15 through 2016-17
Appendix F: Student achievement by excused and unexcused absence, by school level, 2016-17
Appendix G: Chronic absenteeism by school level and by school, 2016-17
Appendix H: Number and percent of excused and unexcused absence, students with 10 or more unexcused absences, 15 or more total absences, average daily attendance rate, and average number of absences per student, by school 2014-15 through 2016‑17
Student Assessment & Research 12 | P a g e
References
Florida Department of Education, 2017. Retrieved on October 4, 2017 from http://www.fldoe.org/core/fileparse.php/14196/urlt/ESSADraftStatePlan.pdf.
Jordan, P.W. & Miller, R. (2017 , September). Who’s in. Chronic absenteeism under the
every student succeeds act. Retrieved on October 4, 2017 from https://www.future-ed.org/whos-in-chronic-absenteeism-under-the-every-student- succeeds-act/.
U.S. Department of Education (2017, October 4). Retrieved from
https://www.ed.gov/essa. Prepared by Jack Ciminera, Database Researcher IV Elizabeth Ashley, Ph.D., Database Researcher I Sandra Skinner, Ph.D., Research Specialist Richard Baum, Director The School Board of Broward County, Florida
Abby M. Freedman, Chair Nora Rupert, Vice Chair
Robin Bartleman Heather Brinkworth
Patricia Good Donna P. Korn
Laurie Rich Levinson Ann Murray
Dr. Rosalind Osgood
Robert W. Runcie, Superintendent of Schools
The School Board of Broward County, Florida prohibits any policy or procedure that results in discrimination on the basis of age, color, disability, gender, national origin, marital status, race, religion, or sexual orientation.