Embed Size (px)
Citation preview

AS OF SEPTEMBER 30, 2018
Brown Advisory U.S. Large-Cap Growth Strategy

2
Brown Advisory Overview
FIRM INVESTMENT ASSETS LARGE-CAP GROWTH
1993Launched as an investment management arm of Alex. Brown & Sons
45 equity professionals 1996Brown Advisory Large-Cap Growth strategy incepted
1998Investment team and management-led buyout enables independence, focus and expansion
15 yearsAverage years of investment experience for our equity research team
1999Mutual fund vehicle launched
2008Expands globally and today has clients in 36 countries
$68 billion*In total assets under management for private clients, non-profits and institutions*
$13.2 billionBrown Advisory Large-Cap Growth strategy assets under management*
100%Of our colleagues collectively own 70% of the firm’s equity
$31 billion*Institutionally marketed strategy assets under management
Independent, fundamentally driven investment management firm
*Please see the end of the presentation for information regarding assets and important disclosures.

3
Large-Cap Growth Strategy Assets By Client Type Breakdown1
Brown Advisory Asset Summary
$13,212MILLION
As of 09/30/2018
Firmwide Institutional Strategy Assets By Strategy Breakdown1
1Numbers may not total due to rounding. Firmwide Institutional Strategy Breakdown represents assets under management in institutionally marketed strategies. 2Fixed Income strategy assetsinclude the Core Fixed Income, Sustainable Core Fixed Income, Enhanced Cash, Intermediate Income, Limited Duration, Municipal Bond, Strategic Bond and Tax-Exempt Sustainable strategies.This information is supplemental to the Brown Advisory Large-Cap Growth Composite presentation.
Large-Cap Growth$13,212
Flexible Equity$5,534
Mid-Cap Growth$206Equity Income
$412
Small-Cap Growth$3,510
Fixed Income2
$3,803
Latin American$349
Small-CapFundamental
Value$1,999
$31,173MILLION
Large-CapSustainable
Growth$1,799
Global Leaders$274
Client-Driven Solutions$76
Corporate$1,813 Endowments
& Foundations
$413Private Client
& Other$497
Sub-advised$6,377
Taft-Hartley$329
Registered Funds$2,922
Insurance$182
Public$681

4
U.S. Large-Cap Growth Investment Strategy

5
Investment Philosophy
We believe that a concentrated portfolio of companies with sound, sustainable business models has the potential to deliver attractive risk-adjusted returns over time. We are also disciplined, and invest where we believe outcomes are skewed heavily in our favor.
Distinctive Features
We seek business models that we believe can support high absolute growth rates.
We are sector agnostic as to where we find consistent growth.
Our process is built upon fundamental analysis.

6
Collaborative Investment Team
Experienced portfolio management
Kenneth Stuzin, CFA, investment experience dating from 1986, joined Brown Advisory in 1996
“Right-sized” team of research analysts
Compensation structure that supports teamwork and aligns interests
Broad perspective, given Brown Advisory’s other investment strategies and network of external thought leaders

7
CONSUMER
ERIC CHA, CFAInvestment experience since 1999
PATRICK MAHONEYInvestment experience since 2007
DAN MOONEY, CFAInvestment experience since 2001
ALEX TREVINOInvestment experience since 2016
FINANCIALS
PRIYANKA AGNIHOTRI, CFAInvestment experience since 2009
KENNETH COE, CFAInvestment experience since 2010
SHA HUANGInvestment experience since 2016
CAMERON MATHISInvestment experience since 2013
HEALTH CARE
SANJEEV JOSHI, CFAInvestment experience since 1994
MARK KELLYInvestment experience since 2008
SUNG PARK, CFAInvestment experience since 2003
INDUSTRIALS, BASIC MATERIALS & ENERGY
JAMIE WYATTInvestment experience since 2018
ADI PADVAInvestment experience since 2005
SIMON PATERSON, CFAInvestment experience since 2002
BERTIE THOMSON, CFAPortfolio Manager, Global LeadersInvestment experience since 2002
TECHNOLOGY
JOHN BOND, CFAInvestment experience since 1999
JOHN CANNING, CFAInvestment experience since 2014
EMILY WACHTMEISTER, CFAInvestment experience since 2011
SUSTAINABILITY
EMILY DWYERInvestment experience since 2014
KATHERINE KROLLInvestment experience since 2015
GENERALIST
THOMAS FITZALAN HOWARDInvestment experience since 2016
MICHAEL POGGI, CFAAssociate Portfolio Manager, Small-Cap Fundamental ValueInvestment experience since 2003
GEORGE SAKELLARIS, CFAAssociate Portfolio Manager / Portfolio Manager, Small/ Mid-Cap Growth Investment experience since 2001
RODDY SEYMOUR-WILLIAMSInvestment experience since 2017
BUSINESS SERVICES
ROBERT FURLONG, CFAInvestment experience since 2000
INVESTIGATIVE
LAUREN CAHALANInvestment experience since 2018
DOUGLAS FALKInvestment experience since 2014
RISK
ERIN CAWLEYInvestment experience since 2017
Equity Research Team
Equity Research Team Principles
Uphold an investment-performance-driven approach
Promote the highest standards of ethics, transparency and professionalism
Commit to a culture of shared responsibility
Invest in our professional and personal growth
DIRECTOR OF RESEARCH
KENNETH STUZIN, CFAInvestment experience since 1986
PORTFOLIO MANAGEMENT
ERIC GORDON, CFAInvestment experience since 1998
PRODUCT SPECIALIST
KEVIN OSTEN, CFAInvestment experience since 1999
8
Investment Process
Initial universe is approximately 3,000 names
Broad quantitative screens result in approximately 250 names
Minimum of $2 billion in market cap, but cognizant of large-cap role
Business-model growth rate of at least 14%
Qualitative screens focus on:
Core competitive advantages
Capable and dedicated management
UNIVERSE IDEA GENERATION
DUE DILIGENCE
DECISION PROCESS
PORTFOLIO MANAGEMENT
SELL DISCIPLINE

9
Investment Process
Portfolio manager
Multivariable screens
Research analysts
Company visits / industry contacts
Other Brown Advisory investment strategies
Idea generation can come from “360º.” It is not where it comes from but the quality of the idea that counts.
UNIVERSE IDEA GENERATION
DUE DILIGENCE
DECISION PROCESS
PORTFOLIO MANAGEMENT
SELL DISCIPLINE

10
Investment Process
“Inside-out investing”—identify drivers of growth
Create detailed bottom-up financial model using public filings
Visit company management and conduct rigorous interviews
Interview competitors / customers
Build upside / downside scenario-based valuation framework
“Stress test” thesis with sell-side
UNIVERSE IDEA GENERATION
DUE DILIGENCE
DECISION PROCESS
PORTFOLIO MANAGEMENT
SELL DISCIPLINE
11
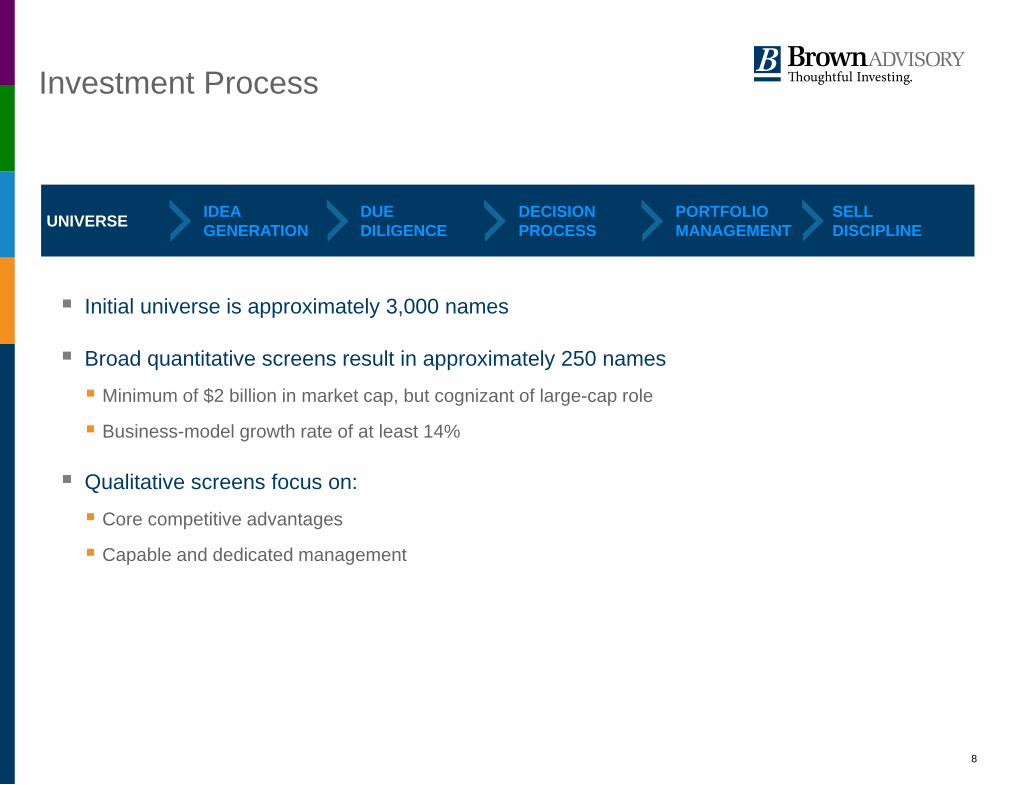
Investment Process
Finalize investment thesis & upside/downside targets
Likely scenarios with usable spans
Entry & exit decisions
Mitigates emotion in investing
Valuation framework
Maximize upside
Minimize downside volatility
Control risk
UNIVERSE IDEA GENERATION
DUE DILIGENCE
DECISION PROCESS
PORTFOLIO MANAGEMENT
SELL DISCIPLINE
XYZ Company share price at $20 Upside Scenario$28
Downside Scenario$16Sh
are
Pric
e
1 Year 3 Year
Time Period
40%
20%
12
-50
-25
0
25
50
75
-50 -25 0 25 50 75-40
-20
0
20
40
-40 -20 0 20 40-30
-15
0
15
30
-30 -15 0 15 30
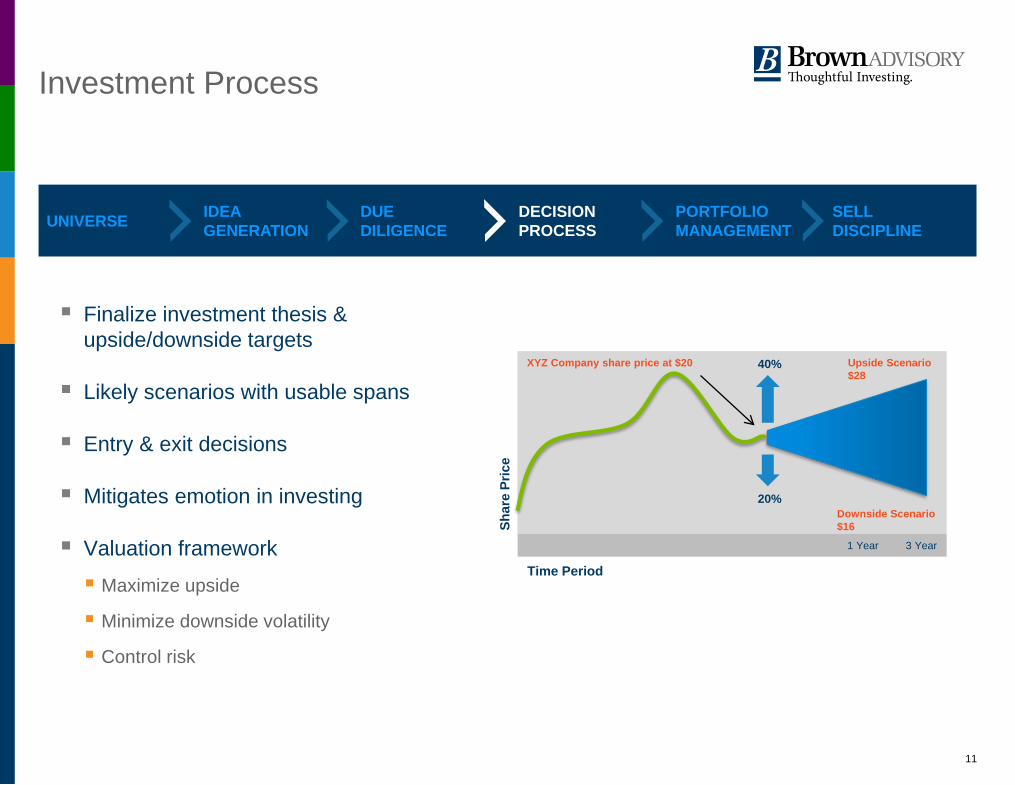
Our strategy has performed well in a variety of market conditions.
Process-Driven Excess Return
Past performance is not indicative of future results. The composite performance shown above reflects the Brown Advisory Large-Cap Growth Institutional Composite,, managed by Brown Advisory Institutional. Brown Advisory Institutional is a GIPS compliant firm and is a division of Brown Advisory LLC. Please see the Brown Advisory Large-Cap Growth Institutional disclosure statement at the end of this presentation for a GIPS compliant presentation. Please see the Brown Advisory Large-Cap Growth Institutional composite disclosure for more information.
During some short-term periods of pronounced momentum investing we have underperformed. However, we have outperformed 77% of the rolling five-year and 100% of the rolling ten-year
periods since inception.
ROLLING MONTHLY TOTAL RETURN ANALYSIS, GROSS OF FEESBrown Advisory Large-Cap Growth Institutional Composite Vs. Russell 1000® Growth IndexSince Strategy Inception (07/01/1996 – 09/30/2018)
10-Year Rolling Returns: 100% Outperformance
5-Year Rolling Returns: 77% Outperformance
3-Year Rolling Returns: 64% Outperformance
1-Year Rolling Returns: 59% Outperformance
Strategy outperformed 148 timesIndex outperformed 0 times
Strategy outperformed 160 timesIndex outperformed 48 times
Strategy outperformed 148 timesIndex outperformed 84 times
Strategy outperformed 152 timesIndex outperformed 104 times
Annualized Russell 1000® Growth Index Returns (%), monthly periodicity.
Com
posi
te A
nnua
lized
Ince
ptio
n-to
-Dat
e G
ross
Tot
al R
etur
ns (%
)
Outperformance
Underperformance Underperformance Underperformance
OutperformanceOutperformance
As of 09/30/2018
Outperformance
Underperformance-15
0
15
-15 0 15

13
Investment Process
Typical portfolio attributes
# of positions: 30-35
Position size: 1.5%-5%
Top 10 weight: 35%-50%
Cash position: 1%-5.0%
Constantly optimizing the portfolio—risk management
Trimming names to match upside/downside profiles
Self imposed “one in, one out” portfolio management discipline—Darwinian Capitalism
UNIVERSE IDEA GENERATION
DUE DILIGENCE
DECISION PROCESS
PORTFOLIO MANAGEMENT
SELL DISCIPLINE

14
We generally sell stocks for three reasons:
FundamentalsUnderlying investment thesis is violated
Market Expectations Alternative Opportunities
Growth rate impeded by competition or poor execution
Change in strategy
Compromise in management ability
In concentrated portfolios, limited membership creates competition for capital
Valuation considerably overstates the fundamentals and is a “headwind” to total return
Investment Process
UNIVERSE IDEA GENERATION
DUE DILIGENCE
DECISION PROCESS
PORTFOLIO MANAGEMENT
SELL DISCIPLINE
1 2 3

15
Portfolio AttributesAs of 09/30/2018

16
Portfolio HoldingsRepresentative Large-Cap Growth Account
Source: FactSet. Numbers may not total due to rounding. The information provided in this material is not intended to be and should not be considered to be a recommendation or suggestion to engage in or refrain from a particular course of action or to make or hold a particular investment or pursue a particular investment strategy, including whether or not to buy, sell, or hold any of the securities mentioned. It should not be assumed that investments in such securities have been or will be profitable. References to specific securities are for illustrative purposes only and do not represent all of the securities purchased, sold or recommended for advisory clients. Portfolio information is based on a representative Large-Cap Growth account, includes cash and is provided as supplemental information. Please see the Brown Advisory Large-Cap Growth Institutional composite disclosure for more information.
As of 09/30/2018
SECURITY % PORTFOLIO
1 Amazon.com, Inc. 4.8
2 Visa, Inc. 4.4
3 Zoetis, Inc. 4.3
4 Intuitive Surgical, Inc. 4.2
5 Intuit, Inc. 4.0
6 Salesforce.com, Inc. 3.6
7 Alphabet. Inc. Class C 3.6
8 PayPal Holdings, Inc 3.5
9 Thermo Fisher Scientific, Inc. 3.5
10 Roper Technologies, Inc. 3.3
11 Sherwin-Williams Co. 3.3
12 Adobe Systems, Inc. 3.2
13 Fortive Corp. 3.2
14 Dexcom, Inc. 3.2
15 Electronic Arts, Inc. 3.2
16 Cash & Equivalents 3.1
SECURITY % PORTFOLIO
17 Costco Wholesale Corp. 3.0
18 Facebook, Inc. 3.0
19 SBA Communications Corp. 3.0
20 Booking Holdings, Inc. 2.9
21 Danaher Corp. 2.9
22 TJX Companies, Inc. 2.8
23 Amphenol Corp. Cl A 2.8
24 Autodesk, Inc. 2.6
25 Edwards Lifesciences Corp. 2.6
26 Cintas Corp. 2.4
27 Alibaba Group Holding Ltd. - Sponsored ADR 2.4
28 Estee Lauder Companies, Inc. Cl A 2.3
29 Genpact Ltd. 2.2
30 BWX Technologies Inc 1.8
31 A.O. Smith Corp. 1.7
32 NXP Semiconductor NV 1.5
33 FleetCor Technologies Inc. 1.5

17
Source: FactSet. Portfolio information is based on a representative Large-Cap Growth account and is provided as supplemental information. Characteristics and sector breakdown exclude cash and cash equivalents. Sectors are based on the Global Industry Classification Standard (GICS ®) classification system. Please see statements at the end of this presentation for additional information and a complete list of terms and definitions. Numbers may not total due to rounding.
Characteristics Sector Breakdown (Percentage of Portfolio, %)
LARGE-CAP GROWTH REPRESENTATIVE
ACCOUNTRUSSELL 1000®
GROWTH INDEX
Weighted Avg. Market Cap $164.6 $320.1
Weighted Median Market Cap $58.8B $115.3B
Earnings Growth (3-5 Year Estimate) 18.6% 17.4%
P/E Ratio (FY2 Est.) 26.4x 20.6x
PEG Ratio 1.4x 1.2x
Portfolio Turnover (3 Year Avg). 32.7% --
Portfolio AttributesRepresentative Large-Cap Growth AccountAs of 09/30/2018
Representative Large-CapGrowth Account
Russell 1000® Growth Index
0.0
2.0
1.7
32.7
12.0
13.8
4.2
0.9
5.5
15.4
12.0
0.0
3.1
3.4
30.4
12.9
21.2
0.0
0.0
5.6
13.4
10.1
0 10 20 30 40
Utilities
Real Estate
Materials
Info. Tech.
Industrials
Health Care
Financials
Energy
Consumer Staples
Consumer Disc.
Comm. Services

18
Source FactSet. All returns greater than one year are annualized. Past performance is not indicative of future results. The composite performance shown above reflects the Large-Cap Growth Institutional Composite, managed by Brown Advisory Institutional. Brown Advisory Institutional is a GIPS compliant firm and is a division of Brown Advisory LLC. Please see the Brown Advisory Large-Cap Growth Institutional disclosure statement at the end of this presentation for a GIPS compliant presentation.
Performance as of 09/30/2018 Return (%)
Annual PerformanceReturn (%)
Composite Performance
8.0
23.5
33.6
19.6
14.7 15.112.0
10.17.9
23.2
33.1
19.2
14.3 14.611.6
9.69.2
17.1
26.3
20.6
16.614.3
10.78.6
0
5
10
15
20
25
30
35
40
3 MOS. YTD 1 YR. 3 YR. 5 YR. 10 YR. 15 YR. ITD (05/31/1996)
Brown Advisory Large-CapGrowth InstitutionalComposite Gross Returns
Brown Advisory Large-CapGrowth InstitutionalComposite Net Returns
Russell 1000® GrowthIndex
31.7
-2.3
7.8 7.1
30.3
16.7
0.4
25.7
53.0
-35.7
12.1
31.2
-2.7
7.4 6.6
29.7
16.2
0.0
25.3
53.0
-36.3
11.8
30.2
7.1 5.713.0
33.5
15.3
2.6
16.7
37.2
-38.4
11.8
-40
-20
0
20
40
60
2017 2016 2015 2014 2013 2012 2011 2010 2009 2008 2007
Brown Advisory Large-CapGrowth InstitutionalComposite Gross Returns
Brown Advisory Large-CapGrowth InstitutionalComposite Net Returns
Russell 1000® GrowthIndex

19
Appendix
20
Representative Large-Cap Growth Account Russell 1000® Growth Index
Port
folio
Allo
catio
n %
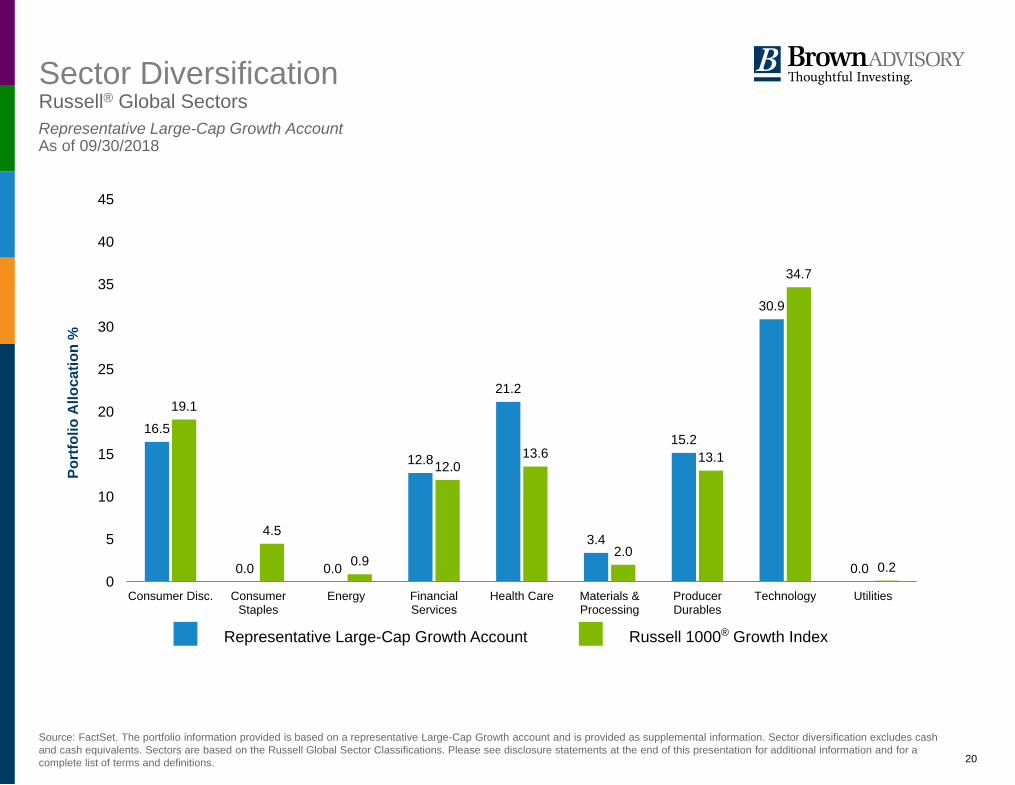
Sector Diversification Russell® Global Sectors
Source: FactSet. The portfolio information provided is based on a representative Large-Cap Growth account and is provided as supplemental information. Sector diversification excludes cash and cash equivalents. Sectors are based on the Russell Global Sector Classifications. Please see disclosure statements at the end of this presentation for additional information and for a complete list of terms and definitions.
Representative Large-Cap Growth AccountAs of 09/30/2018
16.5
0.0 0.0
12.8
21.2
3.4
15.2
30.9
0.0
19.1
4.5
0.9
12.013.6
2.0
13.1
34.7
0.20
5
10
15
20
25
30
35
40
45
Consumer Disc. ConsumerStaples
Energy FinancialServices
Health Care Materials &Processing
ProducerDurables
Technology Utilities

21
Large-Cap Growth Fee Schedule
Institutional Separate Account Management Fee Schedule
Fee(basis points) Investment Amount
80 On the first $10 million
65 On the next $15 million
50 On the next $25 million
40 On the balance over $50 million
Minimum account size is $5 million
Note: For a full description of fees, please see the firm’s Form ADV Part 2A.
Sub-advisory and other fees will be negotiated on a case-by-case basis.
22
Terms and Definitions for Representative Account Calculations
The views expressed are those of the author and Brown Advisory as of the date referenced and are subject to change at any time based on market or other conditions. These views are not intended to be and should not be relied upon as investment advice and are not intended to be a forecast of future events or a guarantee of future results. Past performance is not a guarantee of future performance and you may not get back the amount invested. The information provided in this material is not intended to be and should not be considered to be a recommendation or suggestion to engage in or refrain from a particular course of action or to make or hold a particular investment or pursue a particular investment strategy, including whether or not to buy, sell, or hold any of the securities mentioned. It should not be assumed that investments in such securities have been or will be profitable. To the extent specific securities are mentioned, they have been selected by the author on an objective basis to illustrate views expressed in the commentary and do not represent all of the securities purchased, sold or recommended for advisory clients. The information contained herein has been prepared from sources believed reliable but is not guaranteed by us as to its timeliness or accuracy, and is not a complete summary or statement of all available data. This piece is intended solely for our clients and prospective clients, is for informational purposes only, and is not individually tailored for or directed to any particular client or prospective client.
All financial statistics and ratios are calculated using information from FactSet as of the report date unless otherwise noted.
As of September 30, 2018, Brown Advisory had approximately $68.4 billion in client assets for the following entities: Brown Advisory LLC, Brown Investment Advisory & Trust Company, Brown Advisory Securities LLC, Brown Advisory Ltd., Brown Advisory Trust Company of Delaware, LLC Brown Advisory Investment Solutions Group LLC and Meritage Capital LLC.
Market Capitalization refers to the aggregate value of a company’s publicly traded stock. Statistics are calculated as follows: Weighted Average: the average of each holding’s market cap, weighted by its relative position size in the portfolio (in such a weighting scheme, larger positions have a greater influence on the calculation); Weighted Median: the value at which half the portfolio's market capitalization weight falls above and half falls below; Maximum and Minimum: the market caps of the largest and smallest companies, respectively, in the portfolio.
Est. 3-5 Yr EPS Growth is the average predicted annual earnings growth over the next three to five years based on estimates provided to FactSet by various outside brokerage firms, calculated according to each broker’s methodology.
Price-Earnings Ratio (P/E Ratio) is the ratio of the share of a company’s stock compared to its per-share earnings. P/E calculations presented use FY2 earnings estimates; FY1 estimates refer to the next unreported fiscal year, and FY2 estimates refer to the fiscal year following FY1.
P/E / Growth Ratio, or PEG Ratio, is the ratio of a portfolio’s P/E Ratio divided by its Est. 3-5 Yr. EPS Growth rate.
All of the above ratios for a portfolio are expressed as a weighted average of the relevant ratios of each portfolio holding, EXCEPT for P/E ratios, which are expressed as a weighted harmonic average.
Portfolio Turnover is the ratio of the lesser of the portfolio’s aggregate purchases or sales during a given period, divided by the average value of the portfolio during that period, calculated on a monthly basis. Portfolio turnover is provided for a three-year trailing period.

23
PRIYANKA AGNIHOTRI, CFAFinancial Services Research Analyst Lady Shri Ram College for Women, New Delhi. B.A.;
Indian Institute of Management, Ahmedabad, PGDip; Columbia University, M.B.A.
Analyst, Bernstein Research; Analyst, Phoenix Asset Management Partners
Investment experience since 2009; Joined Brown Advisory 2015
TY ANDREWSFixed Income Portfolio Analyst Towson University, B.S. Financial Associate, Morgan Stanley; Investment
Services, T. Rowe Price Investment experience since 2016; Joined Brown
Advisory 2014
MANEESH BAJAJ, CFAFlexible Equity Portfolio Manager University of Kentucky, M.S. University of Pennsylvania,
The Wharton School, M.B.A. Senior Associate, McKinsey & Company; Senior
Associate, Standard & Poor’s Investment experience since 2003; Joined Brown
Advisory 2005
TOM BANDUROWSKI, CFAFixed Income Research Analyst Boston University, B.S.B.A, B.A. Manager, Credit Restructuring Advisory, EY; Associate,
Restructuring & Special Situations Group, Macquarie Capital
Investment experience since 2006; Joined Brown Advisory 2016
CHRISTOPHER BERRIERSmall-Cap Growth Portfolio Manager; Mid-Cap Growth Portfolio Manager Princeton University, A.B. Vice President, T. Rowe Price Group Investment experience since 2000; Joined Brown
Advisory 2005
JOHN BOND, CFATechnology Equity Research Analyst Harvard University, A.B.; Columbia Business School,
M.B.A. Senior Analyst and Assistant Portfolio Manager, Nicusa
Capital Investment experience since 1999; Joined Brown
Advisory 2012
RUPERT BRANDT, CFALatin American Portfolio Manager University of Manchester, BSc, University of Exeter,
M.A. Portfolio Manager, Findlay Park Latin American Fund.
Merged into Brown Advisory Latin American Fund on 30th April 2018. Analyst, Foreign and Colonial Investment Trust.
Investment experience since 1994; Joined Brown Advisory 2018
JOHN CANNING, CFATechnology Equity Research Analyst Dartmouth College, B.A. Investment experience since 2014; Joined Brown
Advisory 2014
LAUREN CAHALANInvestigative Equity Research Analyst Towson University, B.S. Investment experience since 2018; Joined Brown
Advisory 2018
ERIN CAWLEYRisk Equity Research Analyst Loyola University, B.S. Investment experience since 2017; Joined Brown
Advisory 2012
PETER CAWSTONLatin American Portfolio Manager University of Cambridge, M.A., MPhil. Portfolio Manager, Findlay Park Latin American Fund.
Merged into Brown Advisory Latin American Fund on 30th April 2018. Analyst and Fund Manager, Baillie Gifford.
Investment experience since 2001; Joined Brown Advisory 2018
ERIC CHA, CFAConsumer Equity Research Analyst University of Virginia, B.A.; New York University, M.B.A. Equity Analyst, Bethlehem Steel Pension Fund; Equity
Analyst, Oppenheimer Funds Investment experience since 2000; Joined Brown
Advisory 2007
PAUL CHEW, CFAChief Investment Officer Mount St. Mary’s, B.A.; Duke University, Fuqua School
of Business, M.B.A. International Asset Management Department, J.P.
Morgan & Co. Investment experience since 1989; Joined Brown
Advisory 1995
KENNETH COE, CFAFinancial Services Equity Research Analyst Wake Forest University, B.A. Analyst, First Annapolis Consulting; Research,
Independent Financial Econometrics Study Investment experience since 2010; Joined Brown
Advisory 2013
PAUL CORBINFixed Income Portfolio Manager University of Virginia, B.A.; George Washington
University, M.B.A. Senior Portfolio Manager, First Maryland Asset
Management Investment experience since 1977; Joined Brown
Advisory 1991
Research & Investment Team

24
JAMES DAVIE, CFAFixed Income Research Analyst Ithaca College, B.A.; Boston University, M.B.A. Performance Analyst, State Street Investment Analytics Investment experience since 2010; Joined Brown Advisory
in 2015
MICK DILLON, CFAGlobal Leaders Portfolio Manager University of Melbourne, B.A. Co-Head of Asian Equities & Portfolio Manager, HSBC
Global Asset Management; Analyst, Arete Research Investment experience since 2000; Joined Brown Advisory
2014
EMILY DWYERSustainability Equity Research Analyst Smith College, B.A. Investment experience since 2014; Joined Brown Advisory
2014
DOUGLAS FALKInvestigative Equity Research Analyst Goucher College, B.A. Investment Analyst and Financial Advisor Merrill Lynch Investment experience since 2014; Joined Brown Advisory
2016
THOMAS FITZALAN HOWARDGeneral Equity Research Analyst University of Edinburgh, M.A. Investment experience since 2016; Joined Brown Advisory
2016
MICHAEL FOSS, CFAFlexible Equity Research Analyst Virginia Tech, B.A.; University of Pennsylvania, The
Wharton School, M.B.A. Equity Research, Alex. Brown Investment Management;
Managing Director & Portfolio Manager, JP Morgan Fleming; Equity Analyst, Gabelli & Co.; Retail Broker, Tucker Anthony
Investment experience since 1987; Joined Brown Advisory 2004
KARINA FUNK, CFAHead of Sustainable Investing; Large-Cap Sustainable Growth Portfolio Manager Purdue University, B.S.; MIT, Masters in Civil &
Environmental Engineering; MIT, Masters in Technology & Policy; École Polytechnique - France, Post-Graduate Diploma in Management of Technology
Manager, Massachusetts Renewable Energy Trust; Principal, Charles River Ventures
Investment experience since 2003; Joined Brown Advisory 2007
ROBERT FURLONG, CFABusiness Services Equity Research Analyst York College of Pennsylvania, B.S.; University of Baltimore,
Merrick School of Business, M.S.F. Portfolio Manager, Carson Group; Director of Research,
GARP Research & Securities Investment experience since 2000; Joined Brown Advisory
2018
ERIC GORDON, CFADirector of Equity Research University of North Carolina, Chapel Hill, B.A. Equity Research, Alex. Brown Investment Management;
Investment Banking Analyst, Deutsche Bank Alex. Brown, Merrill Lynch & Co.; Equity Research, Citigroup
Investment experience since 1998; Joined Brown Advisory 2008
THOMAS GRAFF, CFAHead of Fixed Income; Fixed Income Portfolio Manager Loyola University, B.A. Managing Director, Cavanaugh Capital Management Investment experience since 1999; Joined Brown Advisory
1999
BRIAN GRANEY, CFAEquity Income Portfolio Manager George Washington University, B.A. Portfolio Manager, Equity Research, Alex. Brown
Investment Management; Writer/Analyst, The Motley Fool Investment experience since 1996; Joined Brown Advisory
2001
TIMOTHY HATHAWAY, CFAHead of Institutional Business Randolph-Macon College, B.A.; Loyola University, M.B.A. Co-Portfolio Manager of Small-Cap Growth Strategy, Brown
Advisory; Investor Relations, T. Rowe Price Investment experience since 1993; Joined Brown Advisory
1995
AMY HAUTER, CFAFixed Income Associate Portfolio Manager; ESG Research Analyst Old Dominion University, B.S. Fixed Income Client Service, Morgan Stanley Investment experience since 2011; Joined Brown Advisory
2012
SHA HUANGFinancials Equity Research Analyst Vassar College, B.A. Investment experience since 2016; Joined Brown Advisory
2016
JOHN HENRY IUCKERFixed Income Associate Portfolio Manager Johns Hopkins University B.A. Investment experience since 2013; Joined Brown Advisory
2013
Research & Investment Team

25
SANJEEV JOSHI, CFAHealth Care Equity Research Analyst India Institute of Technology – Roorkee B.S.; University of
Mumbai, M.A.; University of Chicago M.B.A. Equity Research, UBS Asset Management; Equity
Research, SG Asia Securities; Equity Research, DBS Securities; Analyst, Kotak Securities
Investment experience since 1994; Joined Brown Advisory 2018
MARK KELLYHealth Care Equity Research Analyst Johns Hopkins University B.A.; Johns Hopkins University
M.H.S. Equity Research, Stifel Nicolaus; Managing Consultant,
Navigant Investment experience since 2008; Joined Brown Advisory
2017
KATHERINE KROLLSustainability Equity Research Analyst University of Vermont, B.A. Shareholder Advocate, Green Century Capital
Management; Operations Coordinator, Renewable Energy Vermont
Investment experience since 2015; Joined Brown Advisory 2018
KATHERINE LEEFixed Income Credit Analyst Duke University, B.S. Analyst, PFM Group; Investment Banking Associate,
Raymond James & Associates Investment experience since 2012; Joined Brown Advisory
2018
PATRICK MAHONEYConsumer Equity Research Analyst University of Notre Dame, B.S. Associate Analyst, Oppenheimer & Co. Investment experience since 2007; Joined Brown Advisory
2013
CAMERON MATHISFinancials Equity Research Analyst University of Pennsylvania, B.A. Investment Banking, Equity Research, Evercore Investment experience since 2013; Joined Brown Advisory
2018
KELLY MCCONKEYFixed Income Portfolio Analyst Coastal Carolina University, B.S.B.A. Investment experience since 2015; Joined Brown Advisory
2011
DAN MOONEY, CFAConsumer Equity Research Analyst Georgetown University, B.S.; University of Virginia, M.B.A. Senior REIT Analyst, CB Richard Ellis Investors; Investment
Banker, Barclays Capital; Equity Research Senior Associate, Green Street Advisors; Fixed Income Research Associate, Bear Sterns
Investment experience since 2001; Joined Brown Advisory 2011
KEVIN OSTEN, CFAProduct Specialist Parks College of St. Louis University, B.S.; University of
Missouri St. Louis, M.B.A. Senior Research Analyst, Summit Strategies; Institutional
Consulting, Merrill Lynch Pierce, Fenner & Smith Investment experience since 1999; Joined Brown Advisory
2012
ADI PADVAIndustrials & Basic Materials Equity Research Analyst Open University of Israel, B.A.; Harvard Business School,
M.B.A. Senior Research Analyst, Neuberger Berman Investment experience since 2005; Joined Brown Advisory
2015
SUNG PARK, CFAHealth Care Equity Research Analyst Johns Hopkins University, B.A.; University of Maryland,
Smith School of Business, M.B.A. Associate Portfolio Manager and Research Analyst, Croft
Leominster Investment experience since 2003; Joined Brown Advisory
2006
SIMON PATERSON, CFAIndustrials & Basic Materials Equity Research Analyst Queen’s University, Ontario, Canada B.Sc. and B.A.;
Princeton University, M.A. Senior Equity Analyst, MTB Investment Advisors Investment experience since 2002; Joined Brown Advisory
2011
JOSHUA PERRY, CFA, CAIA, FRMFixed Income Associate Portfolio Manager Princeton University, B.S.E.; University of Chicago, M.B.A. Analyst, Driehaus Capital Management Investment experience since 2006; Joined Brown Advisory
2012
MICHAEL POGGI, CFASmall-Cap Fundamental Value Associate Portfolio Manager University of Richmond, B.S.B.A. Investment experience since 2003; Joined Brown Advisory
2003
DAVID POWELL, CFALarge-Cap Sustainable Growth Portfolio Manager Bowdoin College, B.A. Investor Relations, T. Rowe Price Investment experience since 1997; Joined Brown Advisory
1999
Research & Investment Team

26
GEORGE SAKELLARIS, CFAMid-Cap Growth Portfolio Manager; Small-Cap Growth Associate Portfolio Manager Robert H. Smith School of Business, M.B.A.; University of
Maryland, B.S. Portfolio Manager, Credo Capital Management; Director of
Research, GARP Research & Securities Investment experience since 2001; Joined Brown Advisory
2014
J. DAVID SCHUSTERSmall-Cap Fundamental Value Portfolio Manager, Fundamental Long/Short Fund Portfolio Manager Georgetown University, B.S.B.A. Managing Director, Citigroup; Managing Director, Lazard
Freres & Co.; Officer, U.S. Army Investment experience since 1995; Joined Brown Advisory
2008
RODDY SEYMOUR-WILLIAMSGeneral Equity Research Analyst University of Bristol, B.S. Investment experience since 2018; Joined Brown Advisory
2018
STEPHEN SHUTZ, CFAFixed Income Portfolio Manager Frostburg State University, B.S. Vice President and Assistant Portfolio Manager, Cavanaugh
Capital Management Investment experience since 1996; Joined Brown Advisory
2003
ROBERT SNYDERFixed Income Portfolio Manager Cornell University, B.A. Principal, Kingsland Capital; Senior Analyst, Katonah
Capital; Securities and Lending, Chase Manhattan Bank; Cash Management, Morgan Stanley Trust Company
Investment experience since 1997; Joined Brown Advisory 2014
KENNETH STUZIN, CFALarge-Cap Growth Portfolio Manager Columbia University, B.A.; Columbia Business School,
M.B.A. Senior Portfolio Manager and Quantitative Strategist, J.P.
Morgan Investment experience since 1986; Joined Brown Advisory
1996
TORY SZCZAWINSKIFixed Income Research Analyst Loyola University Maryland, B.B.A Investment experience since 2017; Joined Brown Advisory
2014
BERTIE THOMSON, CFAGlobal Leaders Portfolio Manager Edinburgh University, M.A. Senior Investment Manager, Aberdeen Asset Management Investment experience since 2002; Joined Brown Advisory
2015
DAVID THOMPSON, CFAFixed Income Portfolio Manager University of Denver, B.S.B.A.; Babson College, M.B.A. Director of Fixed Income, North American Management;
Senior Vice President, Director of Fixed Income, Hale and Dorr Capital Management
Investment experience since 1972; Joined Brown Advisory 2015
ALEX TREVINOConsumer Equity Research Analyst University of Virginia, B.S. Investment experience since 2016; Joined Brown Advisory
2016
R. HUTCHINGS VERNON, CFAFlexible Equity Portfolio Manager University of Virginia, B.A. Portfolio Manager & Equity Research, Alex. Brown
Investment Management; Portfolio Manager and Research Analyst, T. Rowe Price, Legg Mason and Wachovia Bank
Investment experience since 1982; Joined Brown Advisory 1993
JASON VLOSICHFixed Income Associate Portfolio Manager; Fixed Income Trader University of Baltimore, B.S.; Loyola University, M.B.A. Taxable Fixed Income Trader, Ferris, Baker Watts, Inc. and
Deutsche Bank Alex. Brown Investment experience since 1998; Joined Brown Advisory
2008
EMILY WACHTMEISTER, CFATechnology Equity Research Analyst Washington & Lee University, B.A. Junior Associate, Morgan Stanley Investment experience since 2011; Joined Brown Advisory
2013
LYN WHITE, CFAFixed Income Research Analyst University of Delaware, B.S. Senior Investment Analyst, Fidelity & Guaranty Life
Insurance; Senior Portfolio Manager, Standard Insurance Company
Investment experience since 2003; Joined Brown Advisory 2015
JAMIE WYATTIndustrials & Basic Materials Equity Research Analyst Johns Hopkins University, B.S. Investment experience since 2018; Joined Brown Advisory
2018
Research & Investment Team

27
NINA YUDELLPortfolio Manager; Flexible Equity Generalist University of Baltimore, B.S., M.B.A.; Johns Hopkins
University, M.S.B. Portfolio Manager and Investment Analyst, Alex. Brown
Investment Management; Investment Assistant, Oppenheimer & Co., Inc.; Investment Assistant, T. Rowe Price
Investment experience since 1986; Joined Brown Advisory 1992
Research & Investment Team

28
WILLIAM C. BAKER*Will is a director of Brown Advisory Incorporated and Brown Investment Advisory & Trust Company. He is president and CEO of the Chesapeake Bay Foundation. He is a trustee of Johns Hopkins Medicine, the Open Society Institute — Baltimore and the Clayton Baker Trust. He also serves as an emeritus board member of the Baltimore Community Foundation, a director of the Central Maryland Transportation Alliance, a member of the UMBC Board of Visitors and an honorary board member of the Garden Club of America. He is a founding director of the Greater Washington Board of Trade's Green Committee and the Living Classrooms Foundation.
HOWARD E. COX JR.Howard is a director of Brown Advisory Incorporated. He is a special limited partner with Greylock Partners. In addition to his past Greylock Partners directorships, he is a past director of the Boston Globe, former director of the Foundation Board of Forum of Young Global Leaders, former director of the Population Council, former director of Partners HealthCare’s investment committee, former director of the Kleberg Foundation’s investment committee and the past chair of the National Venture Capital Association. He is director emeritus of Stryker (NYSE: SYK), a director for the Defense Business Board, and an executive committee member and board member of In-Q-Tel. Howard is an investment committee member of the Dana-Farber Cancer Institute, the Brookings Institution and the Museum of Fine Arts. He also serves as advisory trustee of various Fidelity mutual funds. Howard serves on various advisory boards for the Harvard Business School, Harvard Kennedy School, Harvard Medical School and Harvard T.H. Chan School of Public Health. He is president of the Clermont Foundation.
JOHN O. DOWNINGJohn is the vice chairman of the board of directors of Brown Advisory Incorporated, and a co-founder of CDK|Brown Advisory, a predecessor firm focused on hedge fund advisory solutions. Prior to founding CDK in 2002, he spent 19 years at Goldman Sachs & Co., where he was a general partner from 1992 to 2000 and served on the firm’s Commitments and Credit Committees. During his last 10 years at Goldman Sachs, he ran European Equity Capital Markets and subsequently was one of several senior partners in the Global Equity Capital Markets group in New York. John is on the Investment Committee of Hotchkiss School, is a director of the Medical University of South Carolina Foundation and has served on several other endowment boards including Vanderbilt University. Additionally, John is the co-founder and board member of Vermont 99 Foods.
ROBERT J. FLANAGANBob is a director of Brown Advisory Incorporated and serves as chair of the governance committee. He is president of Clark Enterprises and oversees the acquisition, management and development of new investment opportunities. He is also managing director of CNF Investments and serves on the boards of Eagle Oil & Gas Co, Svelte Medical Systems and Vascular Therapies. He is a director of the A. James & Alice B. Clark Foundation. Bob is also a member of the board of advisors of Georgetown University's McDonough School of Business. He was chair of the board of directors of Washington, D.C.'s Federal City Council, Martek Biosciences Corporation (NASDAQ: MATK) and Sagent Pharmaceuticals (NASDAQ: SGNT). Bob also was treasurer, secretary and a member of the board of directors of the Baltimore Orioles.
BENJAMIN H. GRISWOLD IV*Ben is a partner of Brown Advisory and serves as a senior advisor. He is a director of Brown Advisory Incorporated, where he serves as chair of the investment committee, and is the chair of Brown Investment Advisory & Trust Company. Ben graduated from Princeton University and served as an artillery officer in the U.S. Army before receiving his MBA from Harvard. He joined Alex. Brown & Sons and became a partner of the firm in 1972, was elected director and vice chair of the board in 1984, and became chair of the board in 1987. Ben was a former director of the New York Stock Exchange and Stanley Black & Decker Inc. He is currently nonexecutive chair of W.P. Carey & Co. LLC and is a member of Flowers Foods (lead director), Signal Hill Capital and Deutsche Bank’s Americas advisory boards. He is trustee emeritus of the Johns Hopkins University.
MICHAEL D. HANKIN*Mike is a partner, a member of the Executive Team and serves as president and chief executive officer. He is a director of both Brown Advisory Incorporated and Brown Investment Advisory & Trust Company. As chair of the Baltimore Healthy Harbor Project and executive committee member of the Baltimore Waterfront Partnership and Management Authority, he has challenged the city to achieve a goal of making Baltimore’s Inner Harbor swimmable and fishable by 2020. He is a trustee of the Johns Hopkins University, trustee and vice chair of Johns Hopkins Medicine and chair of the board of managers of the Johns Hopkins University Applied Physics Lab. He also serves as president of Land Preservation Trust, is a trustee of the Center for Large Landscape Conservation, and is a director for the National Steeplechase Association and Associated Black Charities. Mike also serves on the board of directors of Stanley Black & Decker Inc. and on the boards of directors of three private companies, Tate Engineering Services, Inc., The Wills Group, Inc. and 1251 Capital Group, Inc. Mike earned a B.A. and M.A. from Emory University in 1979 where he graduated Summa Cum Laude and Phi Beta Kappa, and he received a J.D. from The University of Virginia School of Law in 1982.
Brown Advisory Board of Directors
*Also a director of Brown Investment Advisory and Trust Company
Our independent Board of Directors provides objective guidance and insights.

29
BEATRICE H.M. HOLLONDBea is a director of Brown Advisory Incorporated. She is the chair of the U.K. Pearson’s family investment office, chair of Millbank Investment Management and deputy chair of Millbank Financial Services. Bea also serves as the chair of Keystone Investment Trust, nonexecutive director and chair of the audit committee at Henderson Smaller Companies Investment Trust, senior independent director at Templeton Emerging Markets Investment Trust, independent director at M&G Group Limited, nonexecutive director of Telecom Plus and nonexecutive director of Foreign & Colonial Investment Trust. Bea remains involved at her alma mater, serving as chair of the investment committee and as an advisory fellow at Pembroke College at Oxford University. Additionally, Bea serves as a board member of the Soho Theatre Company in London, as trustee and as investment committee member of the Esmée Fairbairn Foundation and as a member of the finance advisory group of Salisbury Cathedral.
KATHERINE B. KALINKatherine is a director of Brown Advisory Incorporated. She has more than 25 years experience as a senior executive in the healthcare and professional services industries. Katherine’s healthcare industry expertise spans diagnostics, medical devices and pharmaceuticals. Most recently, she led corporate strategy at Celgene for five years. She also held leadership roles in marketing, sales, strategy and new business development at Johnson & Johnson. Prior to that, Katherine was a partner at McKinsey and Company, where she negotiated and led consulting assignments, operating as a strategic advisor to senior executives. She also served as a manager in corporate finance at Nomura International in the U.K. and Japan. Her international work experience includes Asia, Europe and North America. Katherine also serves as a board member for Clinical Genomics Technologies and Primari Analytics.
GLENN R. MARTIN*Glennie is a director of both Brown Advisory Incorporated and Brown Investment Advisory & Trust Company. She is the president of Clay County Port and of Universal Sales Corporation. Glennie serves as trustee for the Women’s Hospital Foundation, the Missionary Emergency Foundation and the Richard S. Reynolds Foundation.
ROBERT S. MURLEYBob is a director of Brown Advisory Incorporated and serves as chair of the finance committee. He is vice chair and a senior advisor at Credit Suisse (NYSE: CS) and chair of investment banking in the Americas. Bob serves as the vice chair of the Ann & Robert H. Lurie Children’s Hospital of Chicago, chair of the Lurie Children’s Foundation, chair of the board of the UCLA Anderson School of Management, trustee of the Museum of Science and Industry of Chicago and a member of the Economic Club and the Commercial Club of Chicago. Bob also serves as trustee emeritus of his alma mater, Princeton University, and of the Princeton University Investment Company.
CHARLES E. NOELL IIICharlie is a director of Brown Advisory Incorporated. He is the co-founder of JMI Equity Partners, a technology-focused private equity firm based in Baltimore, MD and San Diego, CA. He currently serves as a director of CoreHR, Iris Software Systems, LZ Labs, Scalable Software and Greystar Real Estate Partners. Since 1991, Charlie has been president of the family investment company of John J. Moores, the founder and former chairman and CEO of BMC Software, Inc. Prior to joining JMI, Charlie served as a managing director and co-head of the technology group of investment bank Alex. Brown & Sons. He serves on the Board of Trustees of Center Stage, Baltimore’s largest professional producing theatre, and on the Board of Governors of St. Christopher’s School and St. James Academy.
WALTER D. PINKARD JR.*Wally is a director of Brown Advisory Incorporated and Brown Investment Advisory & Trust Company. He is a senior advisor at Cushman & Wakefield. He also serves as president, investment committee member and board member for the France-Merrick Foundation and as a trustee of Johns Hopkins Medicine. He is the chair of the Hippodrome Foundation and of the National Advisory Council of the Johns Hopkins University School of Nursing. Wally is a trustee emeritus of the Johns Hopkins University, the Baltimore Community Foundation and the Stulman Foundation. Wally is a board member of Dome Corporation and Central Maryland Transportation Alliance. Wally is a director and chair of finance and the investment committee for Baltimore Life Insurance Company.
Brown Advisory Board of Directors
*Also a director of Brown Investment Advisory and Trust Company
Our independent Board of Directors provides objective guidance and insights.

30
1. *For the purpose of complying with the GIPS standards, the firm is defined as Brown Advisory Institutional, the Institutional and Balanced Institutional asset management divisions of Brown Advisory. As of July 1, 2016, the firm was redefined to exclude the Brown Advisory Private Client division, due to an evolution of the three distinct business lines.
2. The Large-Cap Growth Institutional Composite includes all discretionary institutional portfolios (and carve-outs through 2009) invested in U.S. equities with strong earnings growth characteristics and large market capitalizations. This composite has been examined for the periods from January 1, 2006 through December 31, 2009. The examination reports are available upon request. The minimum account market value required for composite inclusion is $1.5 million.
3. Through 2009, cash was allocated to carve-outs based on a strategic asset allocation percentage. For calendar year end 2006-2009, the percent of the composite composed of carve-outs was 85%, 38%, 33% and 5% respectively
4. This composite was created in 1997.5. The dispersion of annual returns is measured by the equal weighted standard deviation of portfolio returns. 6. The benchmark is the Russell 1000® Growth Index. The Russell 1000® Growth Index measures the performance of the large-cap growth segment of the U.S. equity universe. It includes those Russell 1000®
Index companies with higher price-to-book ratios and higher forecasted growth values. The Russell 1000® Growth Index is constructed to provide a comprehensive and unbiased barometer for the large-cap growth segment. The Index is completely reconstituted annually to ensure new and growing equities are included and that the represented companies continue to reflect growth characteristics. The Russell 1000® Growth Index and Russell® are trademarks/service marks of the London Stock Exchange Group companies. An investor cannot invest directly into an index. Benchmark returns are not covered by the report of the independent verifiers.
7. Gross-of-fees performance returns are presented before management fees but after all trading commissions, and gross of foreign withholding taxes (if applicable). Net-of-fee performance returns reflect the deduction of actual management fees and all trading commissions. Other expenses can reduce returns to investors. The standard management fee schedule is as follows: 0.80% on the first $10 million; 0.65% on the next $15 million; 0.50% on the next $25 million; and 0.40% on the balance over $50 million. Further information regarding investment advisory fees is described in Part II A of the firm’s Form ADV. Actual fees paid by accounts in the composite may differ from the current fee schedule.
8. For calendar year end 2006-2009 the percent of the composite composed of carve-outs was 69%, 62%, 56%,and 23% respectively.9. The three-year annualized ex-post standard deviation measures the variability of the composite (using gross returns) and the benchmark for the 36-month period ended on December 31.10. Valuations and performance returns are computed and stated in U.S. Dollars. All returns reflect the reinvestment of income and other earnings.11. A complete list of composite descriptions, policies for valuing portfolios, calculating performance, and preparing compliant presentations are available upon request.12. Past performance does not indicate future results. 13. This piece is provided for informational purposes only and should not be construed as a research report, a recommendation or suggestion to engage in or refrain from a particular course of action or to make or
hold a particular investment or pursue a particular investment strategy , including whether or not to buy, sell or hold any of the securities mentioned, including any mutual fund managed by Brown Advisory.
Year
CompositeTotal Gross Returns (%)
CompositeTotal Net
Returns (%)Benchmark Returns (%)
Composite 3-Yr Annualized
Standard Deviation (%)
Benchmark 3-Yr AnnualizedStandard
Deviation (%)
Portfolios in Composite at End of Year
Composite Dispersion (%)
CompositeAssets
($USD Millions)*
GIPS Firm Assets
($USD Millions)*
2017 31.7 31.2 30.2 11.5 10.5 119 0.3 10,005 33,1552016 -2.3 -2.7 7.1 11.2 11.2 148 0.1 9,786 30,4172015 7.8 7.4 5.7 10.2 10.7 168 0.3 12,583 43,7462014 7.1 6.6 13.1 11.0 9.6 181 0.2 14,674 44,7722013 30.3 29.7 33.5 15.5 12.2 212 0.3 15,740 40,7392012 16.7 16.2 15.3 18.7 15.7 148 0.4 8,525 26,7942011 0.4 0.0 2.6 19.7 17.8 102 0.3 5,622 19,9622010 25.7 25.3 16.7 22.5 22.1 65 0.5 3,936 16,8592009 53.3 53.0 37.2 20.0 19.7 41 0.6 1,191 11,0582008 -35.7 -36.3 -38.4 16.5 16.4 32 0.3 120 8,5472007 12.1 11.8 11.8 8.9 8.5 30 0.3 160 7,385
Brown Advisory Institutional claims compliance with the Global Investment Performance Standards (GIPS®) and has prepared and presented this report in compliance with the GIPS standards. Brown Advisory Institutional has been independently verified for the periods from January 1, 1993 through December 31, 2017. The Verification reports are available upon request. Verification assesses whether (1) the firm has complied with all the composite construction requirements of the GIPS standards on a firm-wide basis and (2) the firm’s policies and procedures are designed to calculate and present performance in compliance with the GIPS standards. Verification does not ensure the accuracy of any specific composite presentation. GIPS® is a registered trademark owned by CFA Institute.
Large-Cap Growth Institutional Composite