Embed Size (px)
Citation preview
DGO Gold Limited (DGO.AX) 31 May 2021
Brownfield Investments Still Delivering; Value Not Fully Reflected in Share Price DGO’s Differentiated Strategy DGO differentiates itself from exploration companies by leveraging its extensive gold discovery experience and comprehensive research to invest in the highest potential gold discovery opportunities. These investments take the form of direct ownership of highly prospective greenfield targets or by taking influential positions in high potential exploration companies. DGO’s goal is to create shareholder value by capitalising on the significant margin between the cost of discovery and the value attributed to resources by the market.
Market Undervalues Brownfield Investments in DGO Share Price and Gives Greenfield No Value The underlying value of the brownfield ASX-listed investments (De Grey Mining, Dacian Gold, and Yandal Resources) is not reflected in the DGO Gold share price by a significant margin. The underlying value of the ASX-listed investments is $4.69 per DGO share, compared to DGO’s share price of $3.58, a 31% undervaluation. This undervaluation rises to 35% when adding in DGO’s cash (less corporate expenses). The underlying value of the DEG investment alone is A$4.33.
Furthermore, the current share price attributes no value to the highly prospective greenfield exploration portfolio.
DGO’s Brownfield Investments Continue to Deliver DGO’s investments in ASX-listed De Grey Mining (DEG: 15.8% ownership), Yandal Resources (YRL: 14.3%) and Dacian Gold (DCN: 6.4%) continue to deliver robust exploration results and show further potential. In particular, the underlying performance of DEG and YRL has been strong recently, reflecting this exploration success.
Greenfield Exploration Showing Promise DGO continues to explore across multiple targets in Western Australia and South Australia for gold and copper. The Pernatty opportunity in SA looks extremely promising, with the initial drilling showing strong similarities to Zambian Copper Belt–style deposits. Mellina in WA has commenced a 140 hole 8,000m programme. Bryah and Yerrida in WA have intersected results that require follow-up drilling.
Valuation Range A$4.82 –A$6.52: More Brownfield Upside; Free Option on Greenfield Exploration We see substantial potential value in the greenfield programme given DGO management’s geological experience and track record in finding new deposits. The greenfield portfolio sits in highly prospective regions.
The value being attributed to DGO by the market effectively gives the DGO shareholder a discounted entry to DEG, investments in YRL and DCN for free as well as complete ‘free option’ on the greenfield portfolio.
We have increased our valuation range to A$4.82–$6.52 (vs. our range at initiation in March 2021 of A$3.26–A$5.35) resulting from the increase in the share prices and consensus valuations for the listed brownfield investments.
Key Risk to DGO is the performance of the underlying Brownfield investments.
DGO Gold Limited
DGO Gold Limited’s (DGO) vision is to build a portfolio of gold discovery opportunities including high potential brownfield gold investments and large-scale greenfield discovery opportunities to provide leverage to the gold price and achieve substantial growth in shareholder value. www.dgogold.com.au
Stock ASX: DGO
Price A$3.58
Market cap A$263m
Valuation (per share) A$4.82–A$6.52
Next steps
Ongoing Greenfield drilling programme
Ongoing YRL Exploration, DEG Resource Definition
DGO share price (A$) – 1 Year
Source: FactSet.
DGO Share Price v Value of Listed Investments
Michael Bentley [email protected]
1.50
2.00
2.50
3.00
3.50
4.00
4.50
2.50
3.00
3.50
4.00
4.50
5.00
Implied DGO Share Price - Underlying Securities DGO Share Price
Page 2
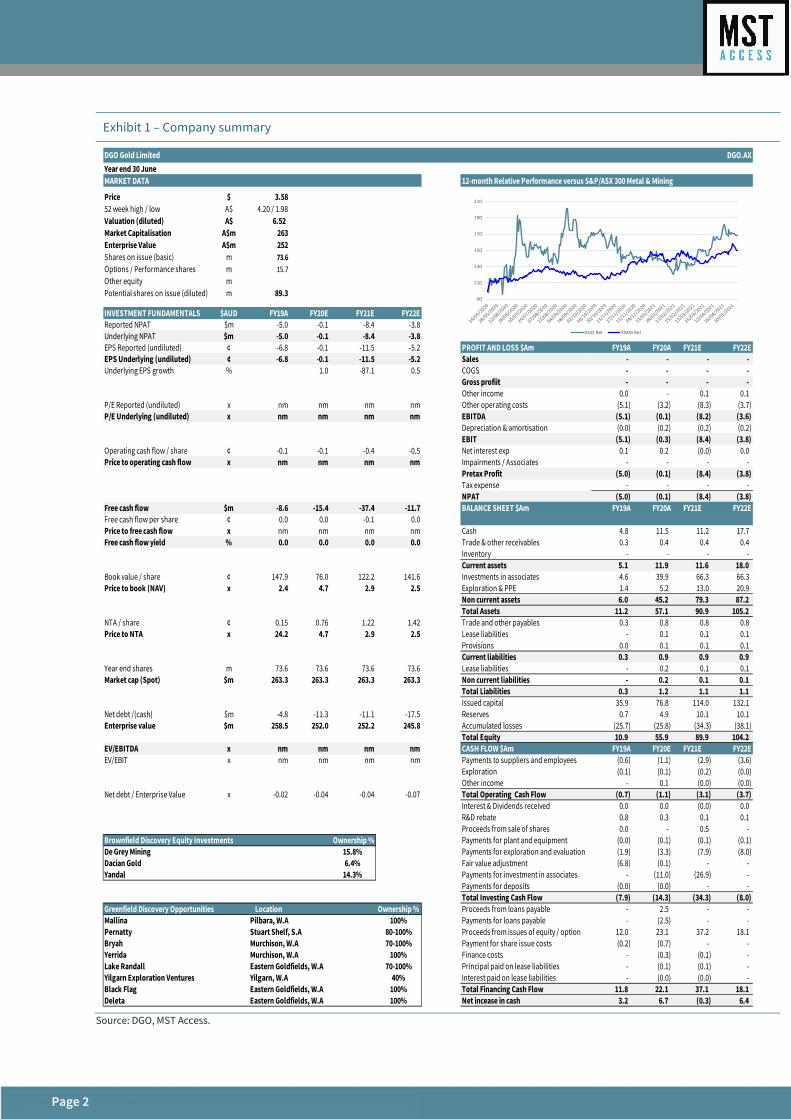
Exhibit 1 – Company summary
Source: DGO, MST Access.
DGO Gold LimitedYear end 30 JuneMARKET DATA 12-month Relative Performance versus S&P/ASX 300 Metal & Mining
Price $ 3.5852 week high / low A$ 4.20 / 1.98Valuation (diluted) A$ 6.52 Market Capitalisation A$m 263Enterprise Value A$m 252Shares on issue (basic) m 73.6Options / Performance shares m 15.7Other equity mPotential shares on issue (diluted) m 89.3
INVESTMENT FUNDAMENTALS $AUD FY19A FY20E FY21E FY22EReported NPAT $m -5.0 -0.1 -8.4 -3.8Underlying NPAT $m -5.0 -0.1 -8.4 -3.8EPS Reported (undiluted) ¢ -6.8 -0.1 -11.5 -5.2 PROFIT AND LOSS $Am FY19A FY20A FY21E FY22EEPS Underlying (undiluted) ¢ -6.8 -0.1 -11.5 -5.2 Sales - - - - Underlying EPS growth % 1.0 -87.1 0.5 COGS - - - -
Gross profiit - - - - Other income 0.0 - 0.1 0.1
P/E Reported (undiluted) x nm nm nm nm Other operating costs (5.1) (3.2) (8.3) (3.7) P/E Underlying (undiluted) x nm nm nm nm EBITDA (5.1) (0.1) (8.2) (3.6)
Depreciation & amortisation (0.0) (0.2) (0.2) (0.2) EBIT (5.1) (0.3) (8.4) (3.8)
Operating cash flow / share ¢ -0.1 -0.1 -0.4 -0.5 Net interest exp 0.1 0.2 (0.0) 0.0 Price to operating cash flow x nm nm nm nm Impairments / Associates - - - -
Pretax Profit (5.0) (0.1) (8.4) (3.8) Tax expense - - - - NPAT (5.0) (0.1) (8.4) (3.8)
Free cash flow $m -8.6 -15.4 -37.4 -11.7 BALANCE SHEET $Am FY19A FY20A FY21E FY22EFree cash flow per share ¢ 0.0 0.0 -0.1 0.0Price to free cash flow x nm nm nm nm Cash 4.8 11.5 11.2 17.7 Free cash flow yield % 0.0 0.0 0.0 0.0 Trade & other receivables 0.3 0.4 0.4 0.4
Inventory - - - - Current assets 5.1 11.9 11.6 18.0
Book value / share ¢ 147.9 76.0 122.2 141.6 Investments in associates 4.6 39.9 66.3 66.3 Price to book (NAV) x 2.4 4.7 2.9 2.5 Exploration & PPE 1.4 5.2 13.0 20.9
Non current assets 6.0 45.2 79.3 87.2 Total Assets 11.2 57.1 90.9 105.2
NTA / share ¢ 0.15 0.76 1.22 1.42 Trade and other payables 0.3 0.8 0.8 0.8 Price to NTA x 24.2 4.7 2.9 2.5 Lease liabilities - 0.1 0.1 0.1
Provisions 0.0 0.1 0.1 0.1 Current liabilities 0.3 0.9 0.9 0.9
Year end shares m 73.6 73.6 73.6 73.6 Lease liabilities - 0.2 0.1 0.1 Market cap (Spot) $m 263.3 263.3 263.3 263.3 Non current liabilities - 0.2 0.1 0.1
Total Liabilities 0.3 1.2 1.1 1.1 Issued capital 35.9 76.8 114.0 132.1
Net debt /(cash) $m -4.8 -11.3 -11.1 -17.5 Reserves 0.7 4.9 10.1 10.1 Enterprise value $m 258.5 252.0 252.2 245.8 Accumulated losses (25.7) (25.8) (34.3) (38.1)
Total Equity 10.9 55.9 89.9 104.2 EV/EBITDA x nm nm nm nm CASH FLOW $Am FY19A FY20E FY21E FY22EEV/EBIT x nm nm nm nm Payments to suppliers and employees (0.6) (1.1) (2.9) (3.6)
Exploration (0.1) (0.1) (0.2) (0.0) Other income - 0.1 (0.0) (0.0)
Net debt / Enterprise Value x -0.02 -0.04 -0.04 -0.07 Total Operating Cash Flow (0.7) (1.1) (3.1) (3.7) Interest & Dividends received 0.0 0.0 (0.0) 0.0 R&D rebate 0.8 0.3 0.1 0.1 Proceeds from sale of shares 0.0 - 0.5 -
Brownfield Discovery Equity Investments Ownership % Payments for plant and equipment (0.0) (0.1) (0.1) (0.1) De Grey Mining 15.8% Payments for exploration and evaluation (1.9) (3.3) (7.9) (8.0) Dacian Gold 6.4% Fair value adjustment (6.8) (0.1) - - Yandal 14.3% Payments for investment in associates - (11.0) (26.9) -
Payments for deposits (0.0) (0.0) - - Total Investing Cash Flow (7.9) (14.3) (34.3) (8.0)
Greenfield Discovery Opportunities Location Ownership % Proceeds from loans payable - 2.5 - - Mallina Pilbara, W.A 100% Payments for loans payable - (2.5) - - Pernatty Stuart Shelf, S.A 80-100% Proceeds from issues of equity / option 12.0 23.1 37.2 18.1 Bryah 70-100% Payment for share issue costs (0.2) (0.7) - - Yerrida 100% Finance costs - (0.3) (0.1) - Lake Randall 70-100% Principal paid on lease liabilities - (0.1) (0.1) - Yilgarn Exploration Ventures 40% Interest paid on lease liabilities - (0.0) (0.0) - Black Flag 100% Total Financing Cash Flow 11.8 22.1 37.1 18.1 Deleta 100% Net incease in cash 3.2 6.7 (0.3) 6.4
DGO.AX
Murchison, W.AMurchison, W.A
Yilgarn, W.AEastern Goldfields, W.A
Eastern Goldfields, W.A
Eastern Goldfields, W.A
90
110
130
150
170
190
210
DGO Rel XMM Rel
Page 3
Significant Gap Between DGO Shares and Value of Underlying Listed Investments; Free Option on Greenfield Discovery
DGO’s share price is currently trading below the value of the underlying investments in listed companies De Grey Mining, Dacian Gold and Yandal Resources and cash by some A$1.11 per share (31%).
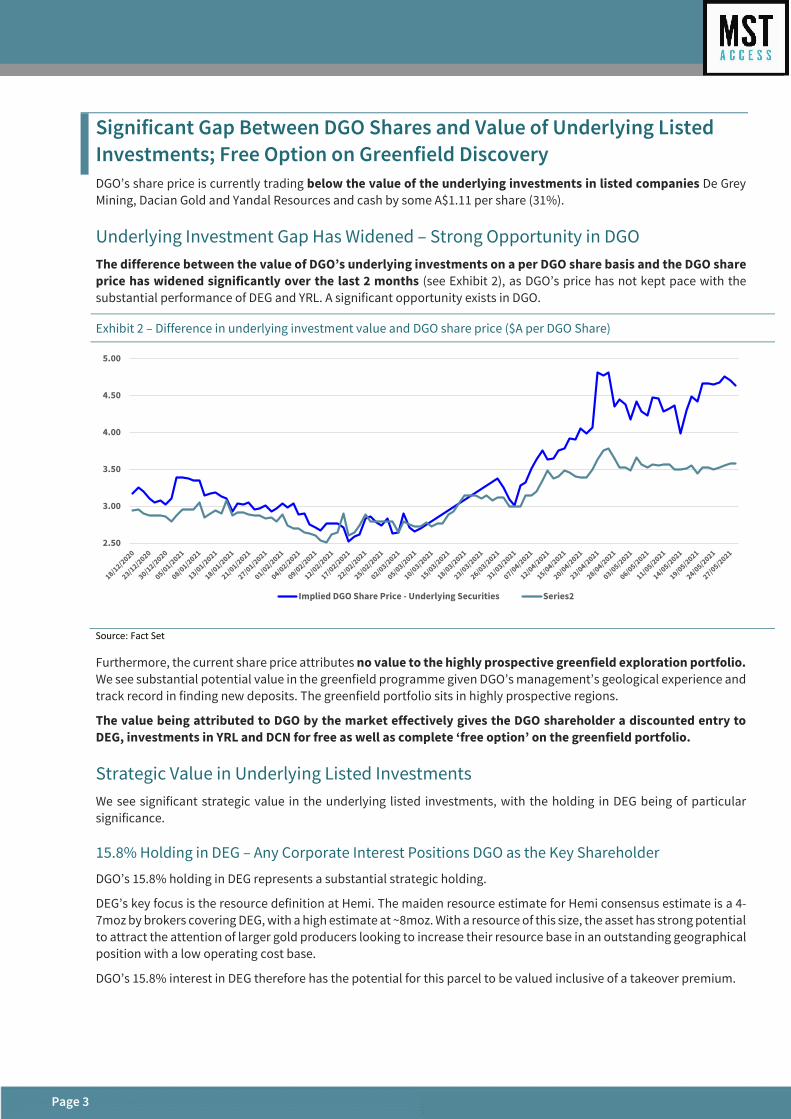
Underlying Investment Gap Has Widened – Strong Opportunity in DGO The difference between the value of DGO’s underlying investments on a per DGO share basis and the DGO share price has widened significantly over the last 2 months (see Exhibit 2), as DGO’s price has not kept pace with the substantial performance of DEG and YRL. A significant opportunity exists in DGO.
Exhibit 2 – Difference in underlying investment value and DGO share price ($A per DGO Share)
Source: Fact Set
Furthermore, the current share price attributes no value to the highly prospective greenfield exploration portfolio. We see substantial potential value in the greenfield programme given DGO’s management’s geological experience and track record in finding new deposits. The greenfield portfolio sits in highly prospective regions.
The value being attributed to DGO by the market effectively gives the DGO shareholder a discounted entry to DEG, investments in YRL and DCN for free as well as complete ‘free option’ on the greenfield portfolio.
Strategic Value in Underlying Listed Investments We see significant strategic value in the underlying listed investments, with the holding in DEG being of particular significance.
15.8% Holding in DEG – Any Corporate Interest Positions DGO as the Key Shareholder
DGO’s 15.8% holding in DEG represents a substantial strategic holding.
DEG’s key focus is the resource definition at Hemi. The maiden resource estimate for Hemi consensus estimate is a 4-7moz by brokers covering DEG, with a high estimate at ~8moz. With a resource of this size, the asset has strong potential to attract the attention of larger gold producers looking to increase their resource base in an outstanding geographical position with a low operating cost base.
DGO’s 15.8% interest in DEG therefore has the potential for this parcel to be valued inclusive of a takeover premium.
2.50
3.00
3.50
4.00
4.50
5.00
Implied DGO Share Price - Underlying Securities Series2
Page 4
DGO’s Brownfield Investments Continue to Deliver Subsequent to our initiation on 16 March 2021, De Grey Mining (DEG) and Yandal Resources (YRL) have continued with extensive drilling programmes and have had continued success. Results of those programmes are detailed below.
De Grey update
DGO owns 15.8% of DEG (market capitalisation $2.02bn). DEG’s primary focus is the 100%-owned Mallina Gold Province (MGP) in the Pilbara region of WA. MGP is a large-scale, high-value, near surface gold province, with the key focus the Hemi discovery. The Hemi mineralisation extends approximately 3.5km east-west. All zones at Hemi remain open.
De Grey has 8 rigs drilling on Hemi now. The focus on the Crow and Acquila deposits is resource definition drilling, with De Grey aiming to announce an updated and significantly upgraded resource on Hemi by Q2CY2021. In addition, further exploration drilling is being conducted on the Falcon, Eagle and Diucon deposits to continue to demonstrate the potential to rapidly add to the gold endowment at Hemi in a cost-effective manner.
Crow and Aquila – resource definition drilling Drilling results continue to expand the resource potential at the Crow and Aquila deposits. Key results are as follows:
Crow • 25.0m @ 12.1g/t Au including 6.0m @ 44.9g/t Au from 178m • 48.7m @ 2.8g/t Au including 6m @ 9.3g/t Au from 201m and 7.3m @ 5.4g/t Au from 231m.
Aquila • 11m @ 10.5g/t Au including 1m @ 105.5g/t Au • 44m @ 2.0g/t Au including 4m @ 6.4g/t Au • 57m @ 1.4g/t Au from 117m
Falcon, Eagle and Diucon – exploration success De Grey has also been drilling the Hemi region, identifying new gold-bearing prospects at Falcon, Diucon and Eagle.
Falcon Drilling results at Falcon have been positive, extending the depth and strike of mineralisation. Wide gold has also been extended near surface in the north of Falcon proximal to the Aquila zone. Highlights include:
• 45m @ 1.5g/t Au from 175m • 41m @ 2.2g/t Au from 61m • 25m @ 1.2g/t Au from 148m Depth extensions include: • 63.7m @ 1.5g/t Au from 263.3m Resource definition drilling include: • 50m @ 3.9g/t Au from 56m • 70m @ 2.4g/t Au from 144m
Diucon The Diucon prospect, west of Crow and Aquila, has mineralised strike at approximately 900m and remains open at depth beneath sediments to the west. Significant results are as follows:
• 2m @ 12.6g/t Au from 187m • 19.0m @ 4.4g/t Au from 194m • 17m @ 5.7g/t Au from 282m
Eagle The Eagle prospect has mineralised strike at approximately 600m and remains open north, west and at depth. Significant results are as follows:
• 61m @ 2.6g/t Au from 116m including 6m @ 13.4g/t Au from 142m.
Page 5
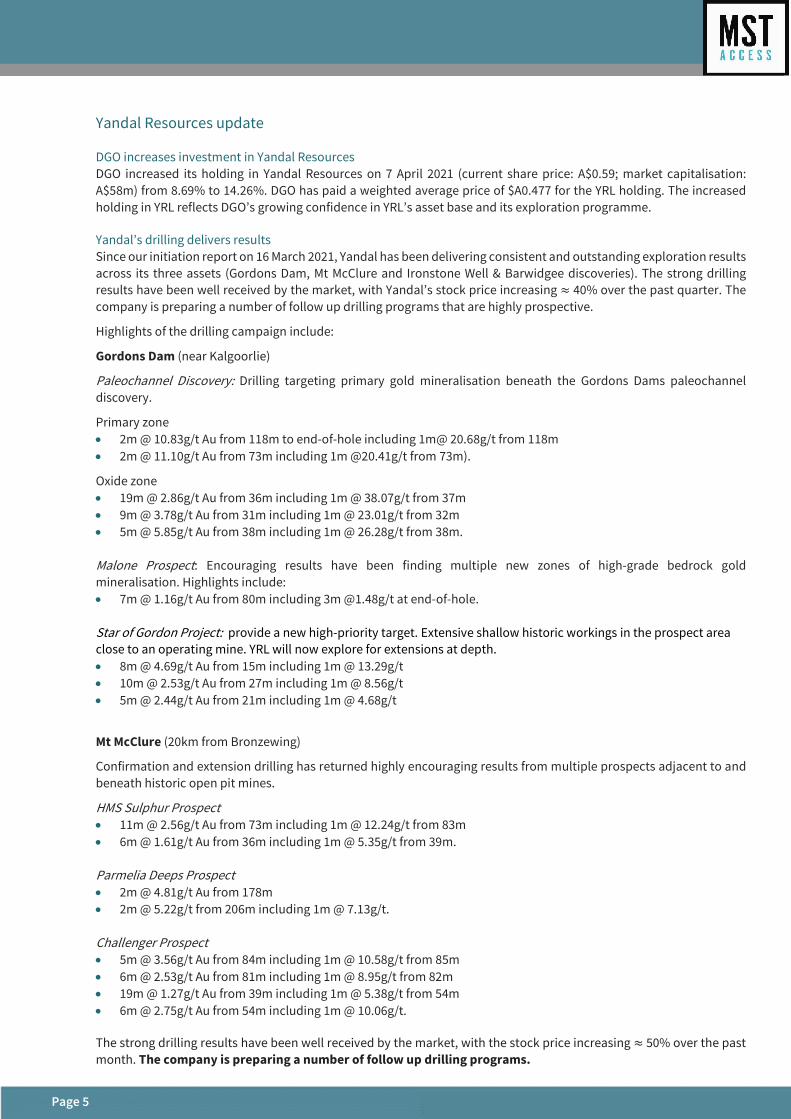
Yandal Resources update
DGO increases investment in Yandal Resources DGO increased its holding in Yandal Resources on 7 April 2021 (current share price: A$0.59; market capitalisation: A$58m) from 8.69% to 14.26%. DGO has paid a weighted average price of $A0.477 for the YRL holding. The increased holding in YRL reflects DGO’s growing confidence in YRL’s asset base and its exploration programme.
Yandal’s drilling delivers results Since our initiation report on 16 March 2021, Yandal has been delivering consistent and outstanding exploration results across its three assets (Gordons Dam, Mt McClure and Ironstone Well & Barwidgee discoveries). The strong drilling results have been well received by the market, with Yandal’s stock price increasing ≈ 40% over the past quarter. The company is preparing a number of follow up drilling programs that are highly prospective.
Highlights of the drilling campaign include:
Gordons Dam (near Kalgoorlie)
Paleochannel Discovery: Drilling targeting primary gold mineralisation beneath the Gordons Dams paleochannel discovery.
Primary zone • 2m @ 10.83g/t Au from 118m to end-of-hole including 1m@ 20.68g/t from 118m • 2m @ 11.10g/t Au from 73m including 1m @20.41g/t from 73m).
Oxide zone • 19m @ 2.86g/t Au from 36m including 1m @ 38.07g/t from 37m • 9m @ 3.78g/t Au from 31m including 1m @ 23.01g/t from 32m • 5m @ 5.85g/t Au from 38m including 1m @ 26.28g/t from 38m. Malone Prospect: Encouraging results have been finding multiple new zones of high-grade bedrock gold mineralisation. Highlights include: • 7m @ 1.16g/t Au from 80m including 3m @1.48g/t at end-of-hole. Star of Gordon Project: provide a new high-priority target. Extensive shallow historic workings in the prospect area close to an operating mine. YRL will now explore for extensions at depth. • 8m @ 4.69g/t Au from 15m including 1m @ 13.29g/t • 10m @ 2.53g/t Au from 27m including 1m @ 8.56g/t • 5m @ 2.44g/t Au from 21m including 1m @ 4.68g/t
Mt McClure (20km from Bronzewing)
Confirmation and extension drilling has returned highly encouraging results from multiple prospects adjacent to and beneath historic open pit mines.
HMS Sulphur Prospect • 11m @ 2.56g/t Au from 73m including 1m @ 12.24g/t from 83m • 6m @ 1.61g/t Au from 36m including 1m @ 5.35g/t from 39m.
Parmelia Deeps Prospect • 2m @ 4.81g/t Au from 178m • 2m @ 5.22g/t from 206m including 1m @ 7.13g/t. Challenger Prospect • 5m @ 3.56g/t Au from 84m including 1m @ 10.58g/t from 85m • 6m @ 2.53g/t Au from 81m including 1m @ 8.95g/t from 82m • 19m @ 1.27g/t Au from 39m including 1m @ 5.38g/t from 54m • 6m @ 2.75g/t Au from 54m including 1m @ 10.06g/t. The strong drilling results have been well received by the market, with the stock price increasing ≈ 50% over the past month. The company is preparing a number of follow up drilling programs.
Page 6
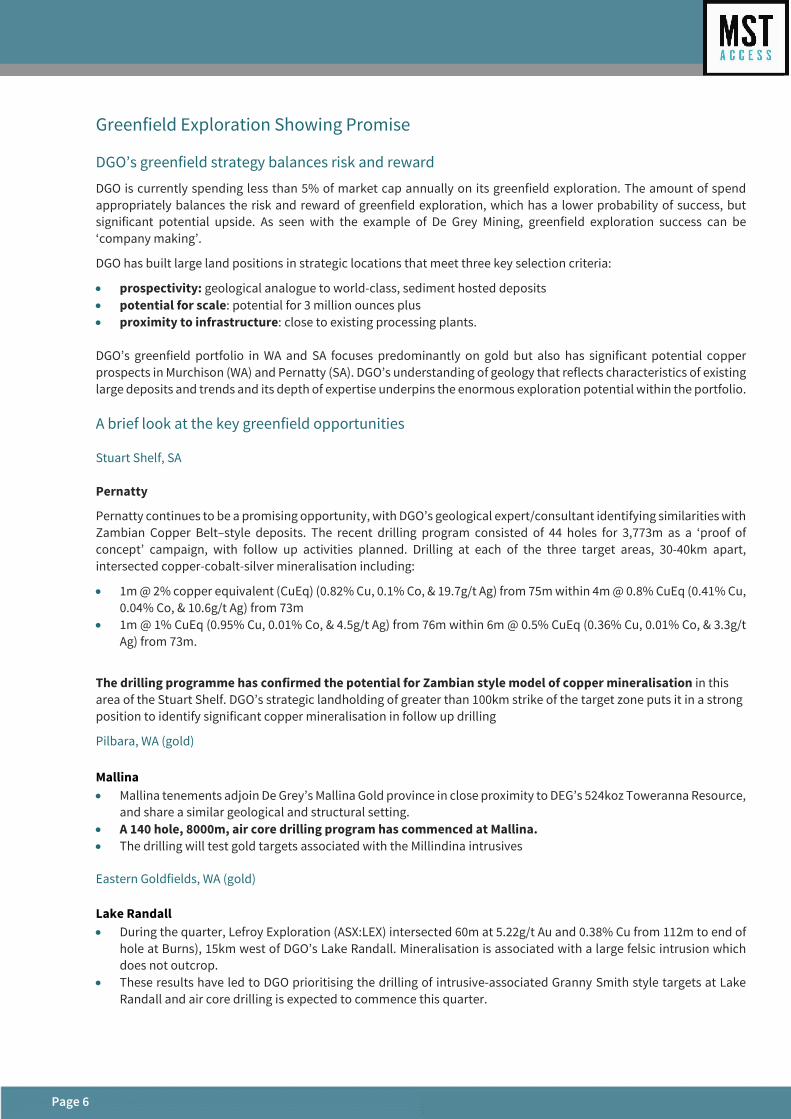
Greenfield Exploration Showing Promise
DGO’s greenfield strategy balances risk and reward
DGO is currently spending less than 5% of market cap annually on its greenfield exploration. The amount of spend appropriately balances the risk and reward of greenfield exploration, which has a lower probability of success, but significant potential upside. As seen with the example of De Grey Mining, greenfield exploration success can be ‘company making’.
DGO has built large land positions in strategic locations that meet three key selection criteria:
• prospectivity: geological analogue to world-class, sediment hosted deposits • potential for scale: potential for 3 million ounces plus • proximity to infrastructure: close to existing processing plants. DGO’s greenfield portfolio in WA and SA focuses predominantly on gold but also has significant potential copper prospects in Murchison (WA) and Pernatty (SA). DGO’s understanding of geology that reflects characteristics of existing large deposits and trends and its depth of expertise underpins the enormous exploration potential within the portfolio.
A brief look at the key greenfield opportunities
Stuart Shelf, SA Pernatty
Pernatty continues to be a promising opportunity, with DGO’s geological expert/consultant identifying similarities with Zambian Copper Belt–style deposits. The recent drilling program consisted of 44 holes for 3,773m as a ‘proof of concept’ campaign, with follow up activities planned. Drilling at each of the three target areas, 30-40km apart, intersected copper-cobalt-silver mineralisation including:
• 1m @ 2% copper equivalent (CuEq) (0.82% Cu, 0.1% Co, & 19.7g/t Ag) from 75m within 4m @ 0.8% CuEq (0.41% Cu, 0.04% Co, & 10.6g/t Ag) from 73m
• 1m @ 1% CuEq (0.95% Cu, 0.01% Co, & 4.5g/t Ag) from 76m within 6m @ 0.5% CuEq (0.36% Cu, 0.01% Co, & 3.3g/t Ag) from 73m.
The drilling programme has confirmed the potential for Zambian style model of copper mineralisation in this area of the Stuart Shelf. DGO’s strategic landholding of greater than 100km strike of the target zone puts it in a strong position to identify significant copper mineralisation in follow up drilling
Pilbara, WA (gold) Mallina • Mallina tenements adjoin De Grey’s Mallina Gold province in close proximity to DEG’s 524koz Toweranna Resource,
and share a similar geological and structural setting. • A 140 hole, 8000m, air core drilling program has commenced at Mallina. • The drilling will test gold targets associated with the Millindina intrusives
Eastern Goldfields, WA (gold) Lake Randall • During the quarter, Lefroy Exploration (ASX:LEX) intersected 60m at 5.22g/t Au and 0.38% Cu from 112m to end of
hole at Burns), 15km west of DGO’s Lake Randall. Mineralisation is associated with a large felsic intrusion which does not outcrop.
• These results have led to DGO prioritising the drilling of intrusive-associated Granny Smith style targets at Lake Randall and air core drilling is expected to commence this quarter.
Page 7
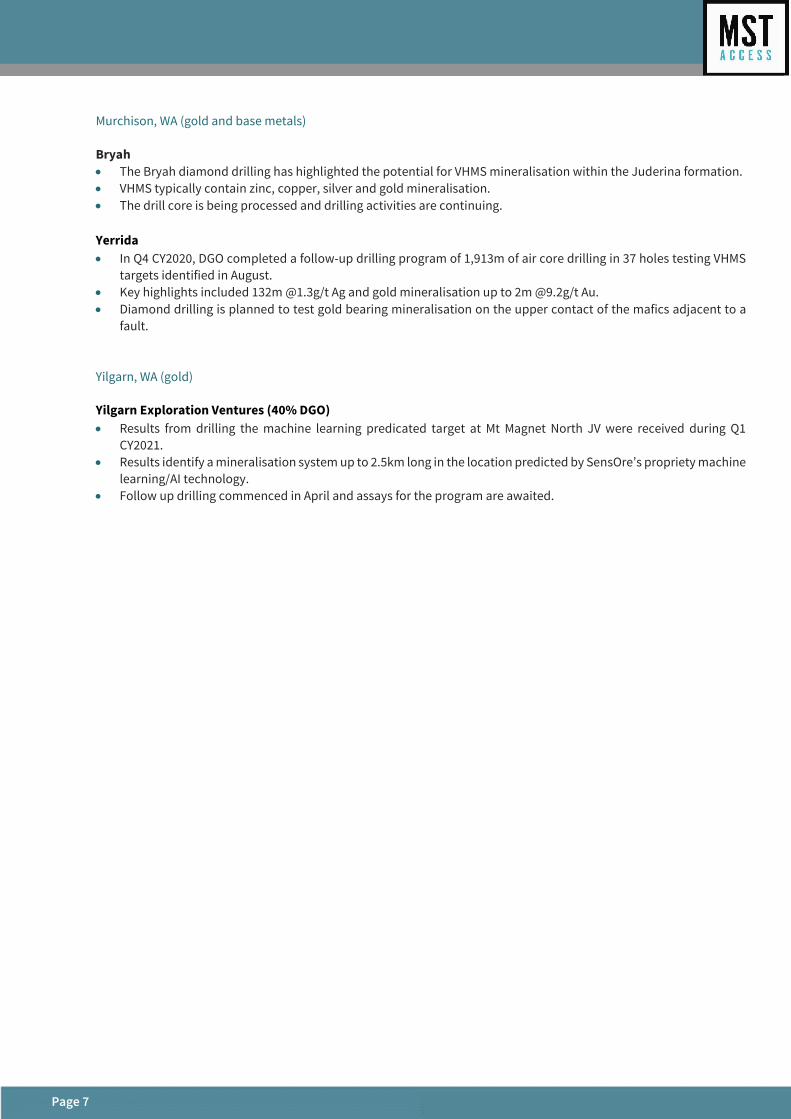
Murchison, WA (gold and base metals) Bryah • The Bryah diamond drilling has highlighted the potential for VHMS mineralisation within the Juderina formation. • VHMS typically contain zinc, copper, silver and gold mineralisation. • The drill core is being processed and drilling activities are continuing. Yerrida • In Q4 CY2020, DGO completed a follow-up drilling program of 1,913m of air core drilling in 37 holes testing VHMS
targets identified in August. • Key highlights included 132m @1.3g/t Ag and gold mineralisation up to 2m @9.2g/t Au. • Diamond drilling is planned to test gold bearing mineralisation on the upper contact of the mafics adjacent to a
fault.
Yilgarn, WA (gold) Yilgarn Exploration Ventures (40% DGO) • Results from drilling the machine learning predicated target at Mt Magnet North JV were received during Q1
CY2021. • Results identify a mineralisation system up to 2.5km long in the location predicted by SensOre’s propriety machine
learning/AI technology. • Follow up drilling commenced in April and assays for the program are awaited.
Page 8
Valuation: Significant Gap Between DGO Share Price and Value of Underlying Listed Investments; Free Option on Greenfield Discovery
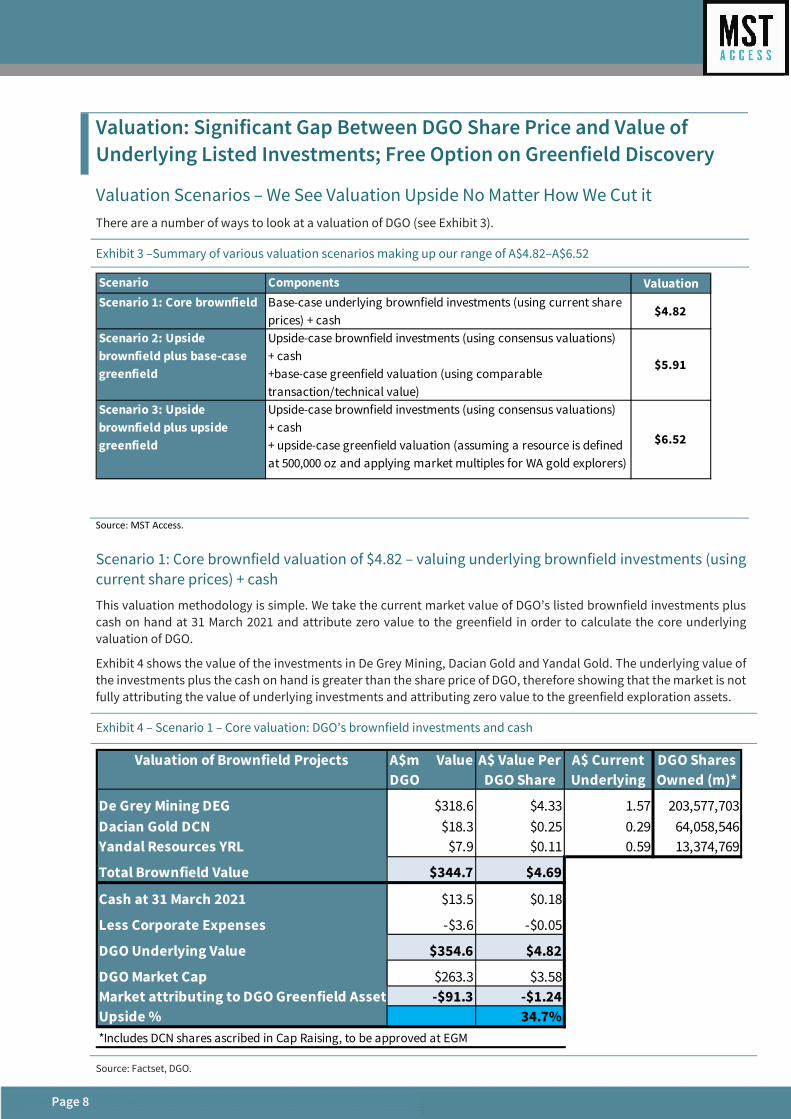
Valuation Scenarios – We See Valuation Upside No Matter How We Cut it There are a number of ways to look at a valuation of DGO (see Exhibit 3).
Exhibit 3 –Summary of various valuation scenarios making up our range of A$4.82–A$6.52
Source: MST Access.
Scenario 1: Core brownfield valuation of $4.82 – valuing underlying brownfield investments (using current share prices) + cash
This valuation methodology is simple. We take the current market value of DGO’s listed brownfield investments plus cash on hand at 31 March 2021 and attribute zero value to the greenfield in order to calculate the core underlying valuation of DGO.
Exhibit 4 shows the value of the investments in De Grey Mining, Dacian Gold and Yandal Gold. The underlying value of the investments plus the cash on hand is greater than the share price of DGO, therefore showing that the market is not fully attributing the value of underlying investments and attributing zero value to the greenfield exploration assets.
Exhibit 4 – Scenario 1 – Core valuation: DGO’s brownfield investments and cash
Source: Factset, DGO.
Scenario Components ValuationScenario 1: Core brownfield Base-case underlying brownfield investments (using current share
prices) + cash$4.82
Scenario 2: Upside brownfield plus base-case greenfield
Upside-case brownfield investments (using consensus valuations)+ cash+base-case greenfield valuation (using comparable transaction/technical value)
$5.91
Scenario 3: Upside brownfield plus upside greenfield
Upside-case brownfield investments (using consensus valuations)+ cash+ upside-case greenfield valuation (assuming a resource is defined at 500,000 oz and applying market multiples for WA gold explorers)
$6.52
Valuation of Brownfield Projects A$m ValueDGO
A$ Value Per DGO Share
A$ Current Underlying
DGO Shares Owned (m)*
De Grey Mining DEG $318.6 $4.33 1.57 203,577,703Dacian Gold DCN $18.3 $0.25 0.29 64,058,546Yandal Resources YRL $7.9 $0.11 0.59 13,374,769
Total Brownfield Value $344.7 $4.69
Cash at 31 March 2021 $13.5 $0.18
Less Corporate Expenses -$3.6 -$0.05
DGO Underlying Value $354.6 $4.82
DGO Market Cap $263.3 $3.58Market attributing to DGO Greenfield Assets -$91.3 -$1.24Upside % 34.7%*Includes DCN shares ascribed in Cap Raising, to be approved at EGM
Page 9
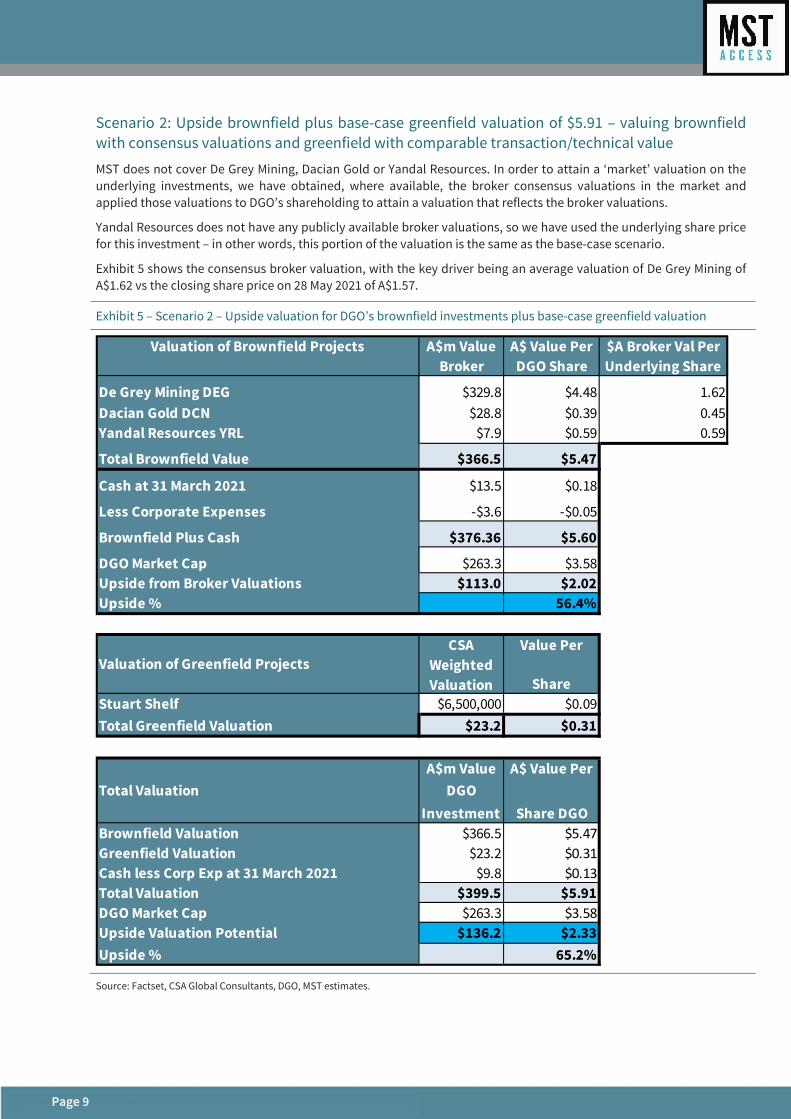
Scenario 2: Upside brownfield plus base-case greenfield valuation of $5.91 – valuing brownfield with consensus valuations and greenfield with comparable transaction/technical value
MST does not cover De Grey Mining, Dacian Gold or Yandal Resources. In order to attain a ‘market’ valuation on the underlying investments, we have obtained, where available, the broker consensus valuations in the market and applied those valuations to DGO’s shareholding to attain a valuation that reflects the broker valuations.
Yandal Resources does not have any publicly available broker valuations, so we have used the underlying share price for this investment – in other words, this portion of the valuation is the same as the base-case scenario.
Exhibit 5 shows the consensus broker valuation, with the key driver being an average valuation of De Grey Mining of A$1.62 vs the closing share price on 28 May 2021 of A$1.57.
Exhibit 5 – Scenario 2 – Upside valuation for DGO’s brownfield investments plus base-case greenfield valuation
Source: Factset, CSA Global Consultants, DGO, MST estimates.
Valuation of Brownfield Projects A$m Value Broker
A$ Value Per DGO Share
$A Broker Val Per Underlying Share
De Grey Mining DEG $329.8 $4.48 1.62Dacian Gold DCN $28.8 $0.39 0.45Yandal Resources YRL $7.9 $0.59 0.59
Total Brownfield Value $366.5 $5.47
Cash at 31 March 2021 $13.5 $0.18
Less Corporate Expenses -$3.6 -$0.05
Brownfield Plus Cash $376.36 $5.60
DGO Market Cap $263.3 $3.58Upside from Broker Valuations $113.0 $2.02Upside % 56.4%
Valuation of Greenfield ProjectsCSA
Weighted Valuation
Value Per
ShareStuart Shelf $6,500,000 $0.09Total Greenfield Valuation $23.2 $0.31
Total ValuationA$m Value
DGO Investment
A$ Value Per
Share DGO Brownfield Valuation $366.5 $5.47Greenfield Valuation $23.2 $0.31Cash less Corp Exp at 31 March 2021 $9.8 $0.13Total Valuation $399.5 $5.91DGO Market Cap $263.3 $3.58Upside Valuation Potential $136.2 $2.33Upside % 65.2%
Page 10
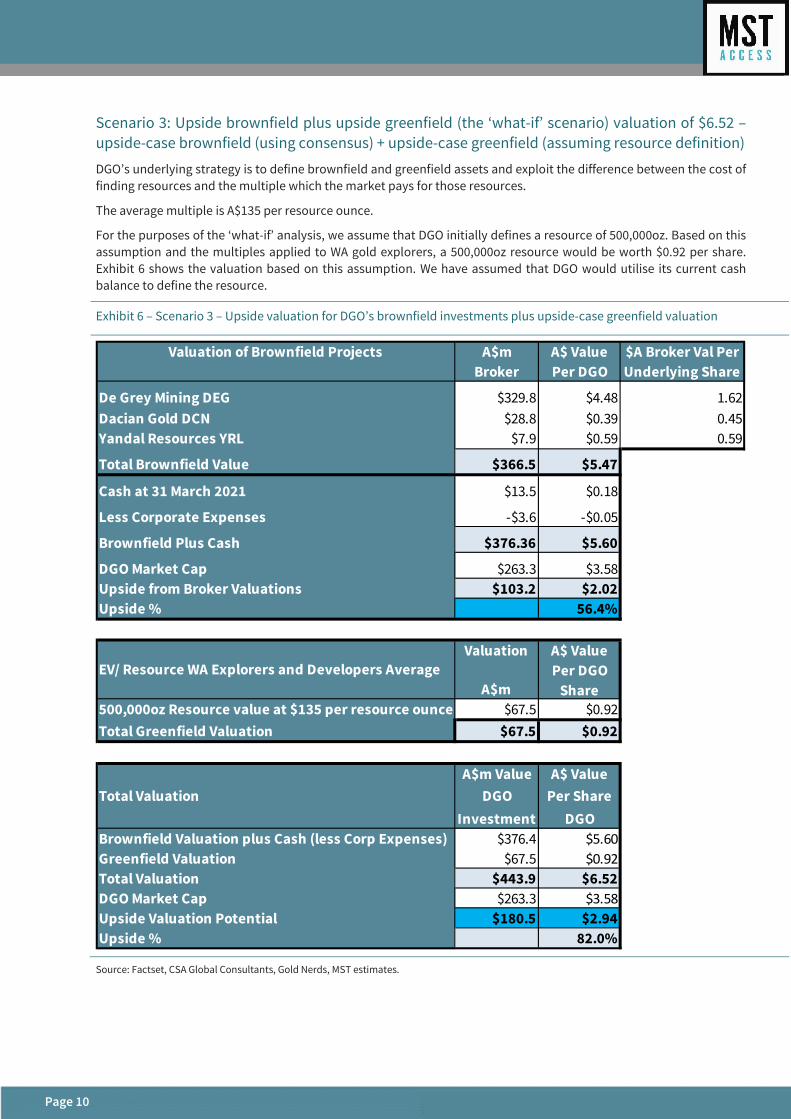
Scenario 3: Upside brownfield plus upside greenfield (the ‘what-if’ scenario) valuation of $6.52 –upside-case brownfield (using consensus) + upside-case greenfield (assuming resource definition)
DGO’s underlying strategy is to define brownfield and greenfield assets and exploit the difference between the cost of finding resources and the multiple which the market pays for those resources.
The average multiple is A$135 per resource ounce.
For the purposes of the ‘what-if’ analysis, we assume that DGO initially defines a resource of 500,000oz. Based on this assumption and the multiples applied to WA gold explorers, a 500,000oz resource would be worth $0.92 per share. Exhibit 6 shows the valuation based on this assumption. We have assumed that DGO would utilise its current cash balance to define the resource.
Exhibit 6 – Scenario 3 – Upside valuation for DGO’s brownfield investments plus upside-case greenfield valuation
Source: Factset, CSA Global Consultants, Gold Nerds, MST estimates.
Valuation of Brownfield Projects A$m Broker
A$ Value Per DGO
$A Broker Val Per Underlying Share
De Grey Mining DEG $329.8 $4.48 1.62Dacian Gold DCN $28.8 $0.39 0.45Yandal Resources YRL $7.9 $0.59 0.59
Total Brownfield Value $366.5 $5.47
Cash at 31 March 2021 $13.5 $0.18
Less Corporate Expenses -$3.6 -$0.05
Brownfield Plus Cash $376.36 $5.60
DGO Market Cap $263.3 $3.58Upside from Broker Valuations $103.2 $2.02Upside % 56.4%
EV/ Resource WA Explorers and Developers AverageValuation
A$m
A$ Value Per DGO
Share500,000oz Resource value at $135 per resource ounce $67.5 $0.92Total Greenfield Valuation $67.5 $0.92
Total ValuationA$m Value
DGO Investment
A$ Value Per Share
DGO Brownfield Valuation plus Cash (less Corp Expenses) $376.4 $5.60Greenfield Valuation $67.5 $0.92Total Valuation $443.9 $6.52DGO Market Cap $263.3 $3.58Upside Valuation Potential $180.5 $2.94Upside % 82.0%
Page 11
Positive Catalysts for the Share Price
Key drivers of share price upside
Brownfield investment share price appreciation The share prices of DGO investments De Grey, Dacian Gold and Yandal are driven by exploration success, resource definition and gold production. Share price appreciation for these companies is the key driver of DGO’s share price. DGO is most leveraged to De Grey Mining.
New brownfield investments DGO’s highly skilled management and technical teams have a track record of investing in brownfield investments that have appreciated in price. New brownfield investments would be seen as a positive for DGO.
Greenfield drilling success DGO is spending around $8m per annum on greenfield drilling. The drilling is high risk, but high reward. Discovery of new deposits would be a strong driver of the share price.
Greenfield resource definition The key value driver for greenfield is resource definition. WA explorers’ and developers’ resources are valued highly by the market and would add significant value to DGO.
Capital raisings due to successful drilling As an explorer, DGO is leveraged to drilling success. Drilling success would require further capital to be raised to fund further drilling and resource definition. Capital raisings for these purposes would be seen as a positive by the market.
Other potential share price catalysts
Gold price increase As a gold-leveraged investment, increased gold prices would be positive for DGO.
Other metals discovery Several of DGO’s deposits have opportunities for the discovery of other metals than gold, particularly copper. Such discoveries would be a positive for DGO.
Corporate interest DGO’s strong portfolio may attract corporate interest.
Page 12
Risks to the Share Price and Valuation
Key risks to the share price
Brownfield investment share price decline The share prices of DGO investments De Grey, Dacian Gold and Yandal are driven by exploration success, resource definition and gold production. A decline in the share prices of these three companies is the key risk to DGO’s share price. DGO is most leveraged to De Grey Mining.
Lack of new brownfield investments A key driver of DGO’s share price has been its investment in brownfield projects. Lack of definition of further investments is a risk to DGO’s share price.
Lack of greenfield drilling success DGO is spending around $8m per annum on greenfield drilling. The drilling is high risk, and may lead to few discoveries. Lack of success with drilling is a key risk to DGO’s share price.
No greenfield resource definition The key value driver to greenfield is resource definition. WA explorers’ and developers’ resources are valued highly by the market. Delay in greenfield resource definition is a key risk to the share price.
Other potential risks to the share price
Gold price decrease As a gold-leveraged investment, decreased gold prices would be negative for DGO.
Capital raisings due to lack of drilling success Greenfield drilling consumes cash, and lack of success may require the company to raise further capital to look at riskier targets.
Increased drilling costs There is a lot of exploration activity in the gold sector. Pressure has increased on obtaining rigs and operators. Increased drilling costs are a risk to DGO and may accelerate the need to raise capital.
Disclaimers
MST Access is a registered business name of MST Financial Services Pty Ltd (ACN 617 475 180 “MST Financial”) which is a limited liability company incorporated in Australia on 10 April 2017 and holds an Australian Financial Services Licence (Number: 500 557). This research is issued in Australia through MST Access which is the research division of MST Financial. The research and any access to it, is intended only for "wholesale clients" within the meaning of the Corporations Act 2001 of Australia. Any advice given by MST Access is general advice only and does not take into account your personal circumstances, needs or objectives. You should, before acting on this advice, consider the appropriateness of the advice, having regard to your objectives, financial situation and needs. If our advice relates to the acquisition, or possible acquisition, of a particular financial product you should read any relevant Product Disclosure Statement or like instrument.
This report has been prepared and issued by Michael Bentley of MST Access. The analyst has received assistance from the company in preparing this document. MST Financial has provided and received compensation for investment banking services to the subject company within the past 12 months. The company has provided the analyst with communication with senior management and information on the company and industry. As part of due diligence, the analyst has independently and critically reviewed the assistance and information provided by the company to form the opinions expressed in the report. Diligent care has been taken by the analyst to maintain an honest and fair objectivity in writing this report and making the recommendation. Where MST Access has been commissioned to prepare Content and receives fees for its preparation, please note that NO part of the fee, compensation or employee remuneration paid will either directly or indirectly impact the Content provided.
Accuracy of content: All information used in the publication of this report has been compiled from publicly available sources that are believed to be reliable, however we do not guarantee the accuracy or completeness of this report and have not sought for this information to be independently verified. Opinions contained in this report represent those of MST Access at the time of publication. Forward-looking information or statements in this report contain information that is based on assumptions, forecasts of future results and estimates of amounts not yet determinable, and therefore involve known and unknown risks, uncertainties and other factors which may cause the actual results, performance or achievements of their subject matter to be materially different from current expectations.
Exclusion of liability: To the fullest extent allowed by law, MST Access shall not be liable for any direct, indirect or consequential losses, loss of profits, damages, costs or expenses incurred or suffered by you arising out or in connection with the access to, use of or reliance on any information contained in this report. No guarantees or warranties regarding accuracy, completeness or fitness for purpose are provided by MST Access, and under no circumstances will any of MST Financial’s officers, representatives, associates or agents be liable for any loss or damage, whether direct, incidental or consequential, caused by reliance on or use of the content.
General Advice Warning MST Access Research may not be construed as personal advice or recommendation. MST encourages investors to seek independent financial advice regarding the suitability of investments for their individual circumstances and recommends that investments be independently evaluated. Investments involve risks and the value of any investment or income may go down as well as up. Investors may not get back the full amount invested. Past performance is not indicative of future performance. Estimates of future performance are based on assumptions that may not be realised. If provided, and unless otherwise stated, the closing price provided is that of the primary exchange for the issuer’s securities or investments. The information contained within MST Access Research is published solely for information purposes and is not a solicitation or offer to buy or sell any financial instrument or participate in any trading or investment strategy. Analysis contained within MST Access Research publications is based upon publicly available information and may include numerous assumptions. Investors should be aware that different assumptions can and do result in materially different results.
MST Access Research is distributed only as may be permitted by law. It is not intended for distribution or use by any person or entity located in a jurisdiction where distribution, publication, availability or use would be prohibited. MST makes no claim that MST Access Research content may be lawfully viewed or accessed outside of Australia. Access to MST Access Research content may not be legal for certain persons and in certain jurisdictions. If you access this service or content from outside of Australia, you are responsible for compliance with the laws of your jurisdiction and/or the jurisdiction of the third party receiving such content. MST Access Research is provided to our clients through our proprietary research portal and distributed electronically by MST to its MST Access clients. Some MST Access Research products may also be made available to its clients via third party vendors or distributed through alternative electronic means as a convenience. Such alternative distribution methods are at MST’s discretion.
Access and Use Any access to or use of MST Access Research is subject to the Terms and Conditions of MST Access Research. By accessing or using MST Access Research you hereby agree to be bound by our Terms and Conditions and hereby consent to MST collecting and using your personal data (including cookies) in accordance with our Privacy Policy (https://mstfinancial.com.au/privacy-policy/), including for the purpose of a) setting your preferences and b) collecting readership data so we may deliver an improved and personalised service to you. If you do not agree to our Terms and Conditions and/or if you do not wish to consent to MST’s use of your personal data, please do not access this service.
Copyright of the information contained within MST Access Research (including trademarks and service marks) are the property of their respective owners. MST Access Research, or any portion thereof, may not be reprinted, sold or redistributed without the prior and written consent of MST.