Embed Size (px)
Citation preview
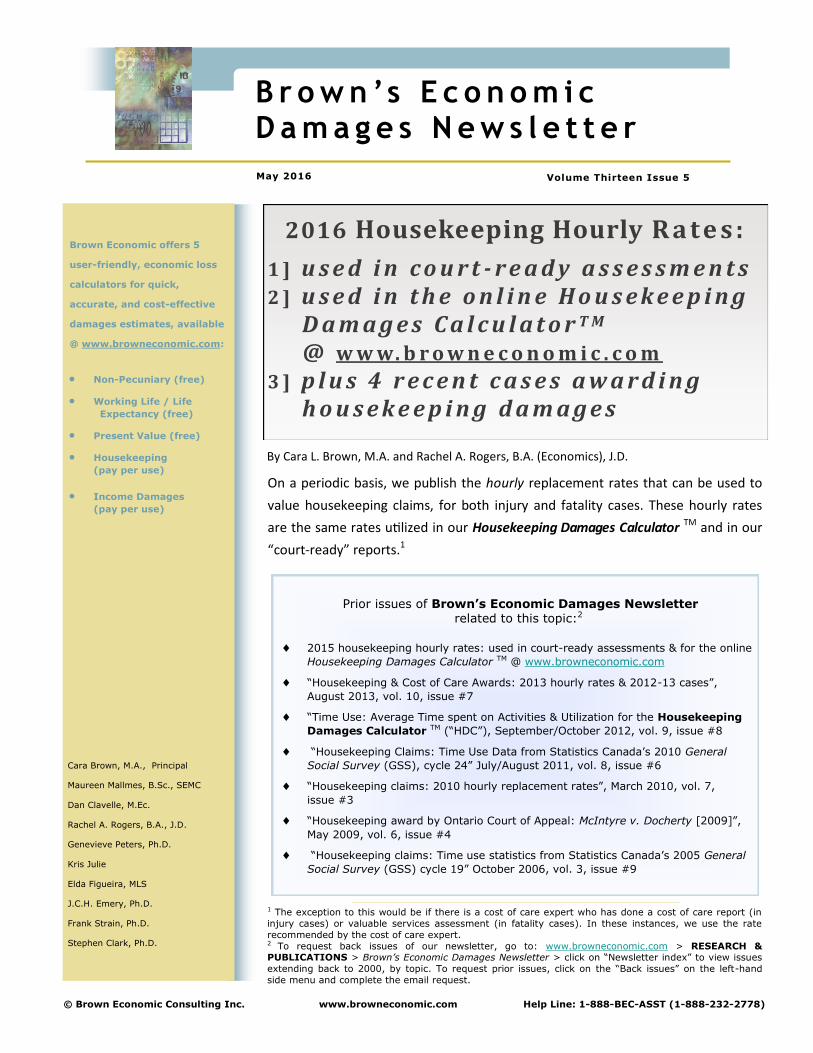
On a periodic basis, we publish the hourly replacement rates that can be used to
value housekeeping claims, for both injury and fatality cases. These hourly rates
are the same rates utilized in our Housekeeping Damages Calculator TM and in our
“court-ready” reports.1
2016 Housekeeping Hourly R a t e s :
1 ] u s e d i n c o u r t - r e a d y a s s e s s m e n t s 2 ] u s e d i n t h e o n l i n e H o u s e k e e p i n g D a m a g e s C a l c u l a t o r T M @ w w w. b r o w n e c o n o m i c . c o m
3 ] p l u s 4 r e c e n t c a s e s a w a r d i n g h o u s e k e e p i n g d a m a g e s
B r o w n ’s E c o n o m i c D a m a g e s N e w s l e t t e r
May 2016 Volume Thirteen Issue 5
Brown Economic offers 5
user-friendly, economic loss
calculators for quick,
accurate, and cost-effective
damages estimates, available
@ www.browneconomic.com:
Non-Pecuniary (free)
Working Life / Life
Expectancy (free)
Present Value (free)
Housekeeping
(pay per use)
Income Damages
(pay per use)
Cara Brown, M.A., Principal
Maureen Mallmes, B.Sc., SEMC
Dan Clavelle, M.Ec.
Rachel A. Rogers, B.A., J.D.
Genevieve Peters, Ph.D.
Kris Julie
Elda Figueira, MLS
J.C.H. Emery, Ph.D.
Frank Strain, Ph.D.
Stephen Clark, Ph.D.
© Brown Economic Consulting Inc. www.browneconomic.com Help Line: 1-888-BEC-ASST (1-888-232-2778)
By Cara L. Brown, M.A. and Rachel A. Rogers, B.A. (Economics), J.D.
Prior issues of Brown’s Economic Damages Newsletter related to this topic:2
2015 housekeeping hourly rates: used in court-ready assessments & for the online
Housekeeping Damages Calculator TM @ www.browneconomic.com
“Housekeeping & Cost of Care Awards: 2013 hourly rates & 2012-13 cases”,
August 2013, vol. 10, issue #7
“Time Use: Average Time spent on Activities & Utilization for the Housekeeping
Damages Calculator TM (“HDC”), September/October 2012, vol. 9, issue #8
“Housekeeping Claims: Time Use Data from Statistics Canada’s 2010 General
Social Survey (GSS), cycle 24” July/August 2011, vol. 8, issue #6
“Housekeeping claims: 2010 hourly replacement rates”, March 2010, vol. 7,
issue #3
“Housekeeping award by Ontario Court of Appeal: McIntyre v. Docherty [2009]”,
May 2009, vol. 6, issue #4
“Housekeeping claims: Time use statistics from Statistics Canada’s 2005 General
Social Survey (GSS) cycle 19” October 2006, vol. 3, issue #9
1 The exception to this would be if there is a cost of care expert who has done a cost of care report (in
injury cases) or valuable services assessment (in fatality cases). In these instances, we use the rate
recommended by the cost of care expert. 2 To request back issues of our newsletter, go to: www.browneconomic.com > RESEARCH & PUBLICATIONS > Brown’s Economic Damages Newsletter > click on “Newsletter index” to view issues
extending back to 2000, by topic. To request prior issues, click on the “Back issues” on the left-hand
side menu and complete the email request.
p a g e 2 V o l u m e T h i r t e e n I s s u e 5 M a y 2 0 1 6
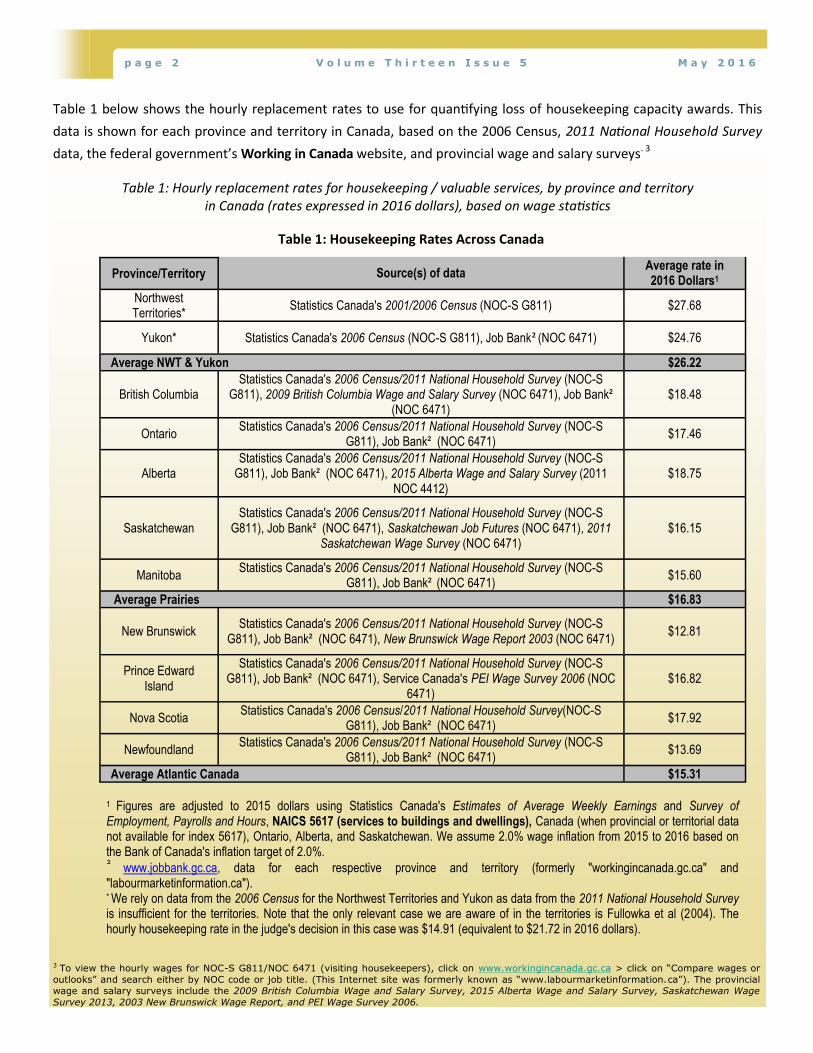
Table 1 below shows the hourly replacement rates to use for quantifying loss of housekeeping capacity awards. This
data is shown for each province and territory in Canada, based on the 2006 Census, 2011 National Household Survey
data, the federal government’s Working in Canada website, and provincial wage and salary surveys. 3
Table 1: Hourly replacement rates for housekeeping / valuable services, by province and territory in Canada (rates expressed in 2016 dollars), based on wage statistics
Province/Territory Source(s) of data Average rate in 2016 Dollars1
Northwest Territories*
Statistics Canada's 2001/2006 Census (NOC-S G811) $27.68
Yukon* Statistics Canada's 2006 Census (NOC-S G811), Job Bank² (NOC 6471) $24.76
Average NWT & Yukon $26.22
British Columbia
Statistics Canada's 2006 Census/2011 National Household Survey (NOC-S G811), 2009 British Columbia Wage and Salary Survey (NOC 6471), Job Bank²
(NOC 6471) $18.48
Ontario Statistics Canada's 2006 Census/2011 National Household Survey (NOC-S
G811), Job Bank² (NOC 6471) $17.46
Alberta
Statistics Canada's 2006 Census/2011 National Household Survey (NOC-S G811), Job Bank² (NOC 6471), 2015 Alberta Wage and Salary Survey (2011
NOC 4412) $18.75
Saskatchewan
Statistics Canada's 2006 Census/2011 National Household Survey (NOC-S G811), Job Bank² (NOC 6471), Saskatchewan Job Futures (NOC 6471), 2011
Saskatchewan Wage Survey (NOC 6471) $16.15
Manitoba Statistics Canada's 2006 Census/2011 National Household Survey (NOC-S
G811), Job Bank² (NOC 6471) $15.60
Average Prairies $16.83
New Brunswick Statistics Canada's 2006 Census/2011 National Household Survey (NOC-S
G811), Job Bank² (NOC 6471), New Brunswick Wage Report 2003 (NOC 6471) $12.81
Prince Edward Island
Statistics Canada's 2006 Census/2011 National Household Survey (NOC-S G811), Job Bank² (NOC 6471), Service Canada's PEI Wage Survey 2006 (NOC
6471) $16.82
Nova Scotia Statistics Canada's 2006 Census/2011 National Household Survey(NOC-S
G811), Job Bank² (NOC 6471) $17.92
Newfoundland Statistics Canada's 2006 Census/2011 National Household Survey (NOC-S
G811), Job Bank² (NOC 6471) $13.69
Average Atlantic Canada $15.31
1 Figures are adjusted to 2015 dollars using Statistics Canada's Estimates of Average Weekly Earnings and Survey of Employment, Payrolls and Hours, NAICS 5617 (services to buildings and dwellings), Canada (when provincial or territorial data not available for index 5617), Ontario, Alberta, and Saskatchewan. We assume 2.0% wage inflation from 2015 to 2016 based on the Bank of Canada's inflation target of 2.0%. ² www.jobbank.gc.ca, data for each respective province and territory (formerly "workingincanada.gc.ca" and "labourmarketinformation.ca"). * We rely on data from the 2006 Census for the Northwest Territories and Yukon as data from the 2011 National Household Survey is insufficient for the territories. Note that the only relevant case we are aware of in the territories is Fullowka et al (2004). The hourly housekeeping rate in the judge's decision in this case was $14.91 (equivalent to $21.72 in 2016 dollars).
Table 1: Housekeeping Rates Across Canada
3 To view the hourly wages for NOC-S G811/NOC 6471 (visiting housekeepers), click on www.workingincanada.gc.ca > click on “Compare wages or
outlooks” and search either by NOC code or job title. (This Internet site was formerly known as “www.labourmarketinformation.ca”). The provincial
wage and salary surveys include the 2009 British Columbia Wage and Salary Survey, 2015 Alberta Wage and Salary Survey, Saskatchewan Wage
Survey 2013, 2003 New Brunswick Wage Report, and PEI Wage Survey 2006.
B r o w n ’ s E c o n o m i c D a m a g e s N e w s l e t t e r p a g e 3
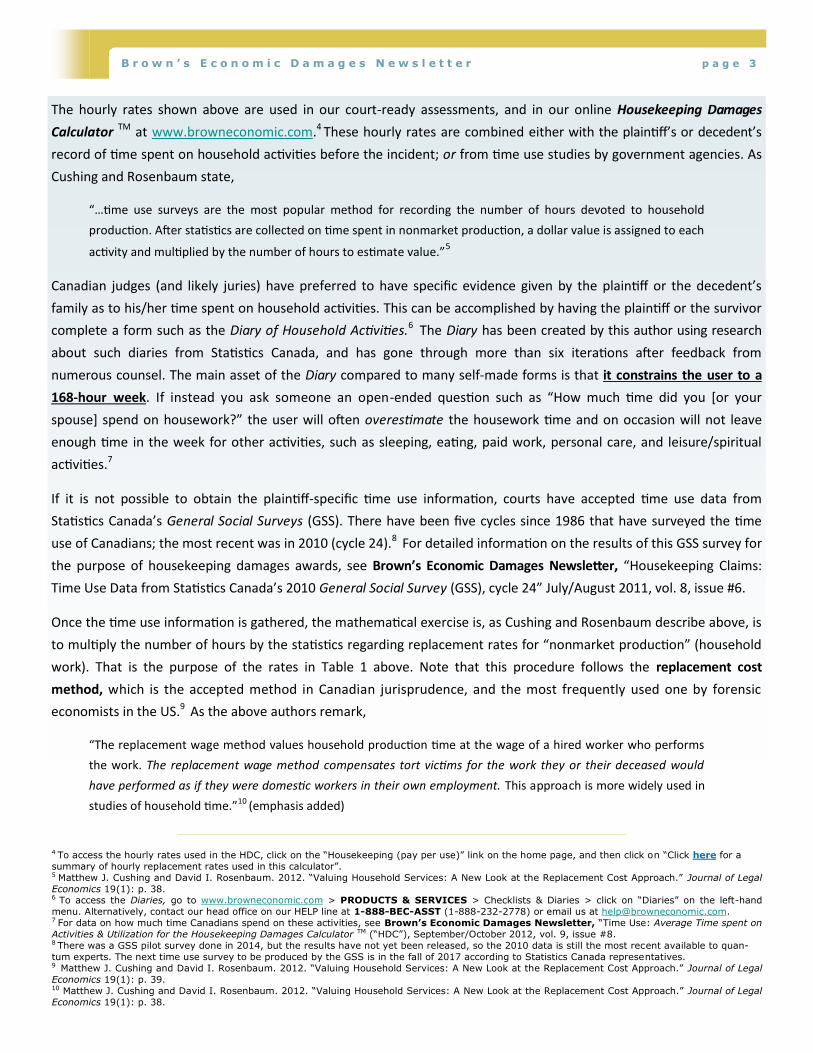
The hourly rates shown above are used in our court-ready assessments, and in our online Housekeeping Damages
Calculator TM at www.browneconomic.com.4 These hourly rates are combined either with the plaintiff’s or decedent’s
record of time spent on household activities before the incident; or from time use studies by government agencies. As
Cushing and Rosenbaum state,
“…time use surveys are the most popular method for recording the number of hours devoted to household
production. After statistics are collected on time spent in nonmarket production, a dollar value is assigned to each
activity and multiplied by the number of hours to estimate value.”5
Canadian judges (and likely juries) have preferred to have specific evidence given by the plaintiff or the decedent’s
family as to his/her time spent on household activities. This can be accomplished by having the plaintiff or the survivor
complete a form such as the Diary of Household Activities.6 The Diary has been created by this author using research
about such diaries from Statistics Canada, and has gone through more than six iterations after feedback from
numerous counsel. The main asset of the Diary compared to many self-made forms is that it constrains the user to a
168-hour week. If instead you ask someone an open-ended question such as “How much time did you [or your
spouse] spend on housework?” the user will often overestimate the housework time and on occasion will not leave
enough time in the week for other activities, such as sleeping, eating, paid work, personal care, and leisure/spiritual
activities.7
If it is not possible to obtain the plaintiff-specific time use information, courts have accepted time use data from
Statistics Canada’s General Social Surveys (GSS). There have been five cycles since 1986 that have surveyed the time
use of Canadians; the most recent was in 2010 (cycle 24).8 For detailed information on the results of this GSS survey for
the purpose of housekeeping damages awards, see Brown’s Economic Damages Newsletter, “Housekeeping Claims:
Time Use Data from Statistics Canada’s 2010 General Social Survey (GSS), cycle 24” July/August 2011, vol. 8, issue #6.
Once the time use information is gathered, the mathematical exercise is, as Cushing and Rosenbaum describe above, is
to multiply the number of hours by the statistics regarding replacement rates for “nonmarket production” (household
work). That is the purpose of the rates in Table 1 above. Note that this procedure follows the replacement cost
method, which is the accepted method in Canadian jurisprudence, and the most frequently used one by forensic
economists in the US.9 As the above authors remark,
“The replacement wage method values household production time at the wage of a hired worker who performs
the work. The replacement wage method compensates tort victims for the work they or their deceased would
have performed as if they were domestic workers in their own employment. This approach is more widely used in
studies of household time.”10 (emphasis added)
4 To access the hourly rates used in the HDC, click on the “Housekeeping (pay per use)” link on the home page, and then click on “Click here for a
summary of hourly replacement rates used in this calculator”. 5 Matthew J. Cushing and David I. Rosenbaum. 2012. “Valuing Household Services: A New Look at the Replacement Cost Approach.” Journal of Legal
Economics 19(1): p. 38. 6 To access the Diaries, go to www.browneconomic.com > PRODUCTS & SERVICES > Checklists & Diaries > click on “Diaries” on the left-hand
menu. Alternatively, contact our head office on our HELP line at 1-888-BEC-ASST (1-888-232-2778) or email us at [email protected]. 7 For data on how much time Canadians spend on these activities, see Brown’s Economic Damages Newsletter, “Time Use: Average Time spent on
Activities & Utilization for the Housekeeping Damages Calculator TM (“HDC”), September/October 2012, vol. 9, issue #8. 8 There was a GSS pilot survey done in 2014, but the results have not yet been released, so the 2010 data is still the most recent available to quan-
tum experts. The next time use survey to be produced by the GSS is in the fall of 2017 according to Statistics Canada representatives. 9 Matthew J. Cushing and David I. Rosenbaum. 2012. “Valuing Household Services: A New Look at the Replacement Cost Approach.” Journal of Legal
Economics 19(1): p. 39. 10 Matthew J. Cushing and David I. Rosenbaum. 2012. “Valuing Household Services: A New Look at the Replacement Cost Approach.” Journal of Legal
Economics 19(1): p. 38.
p a g e 4 V o l u m e T h i r t e e n I s s u e 5 M a y 2 0 1 6
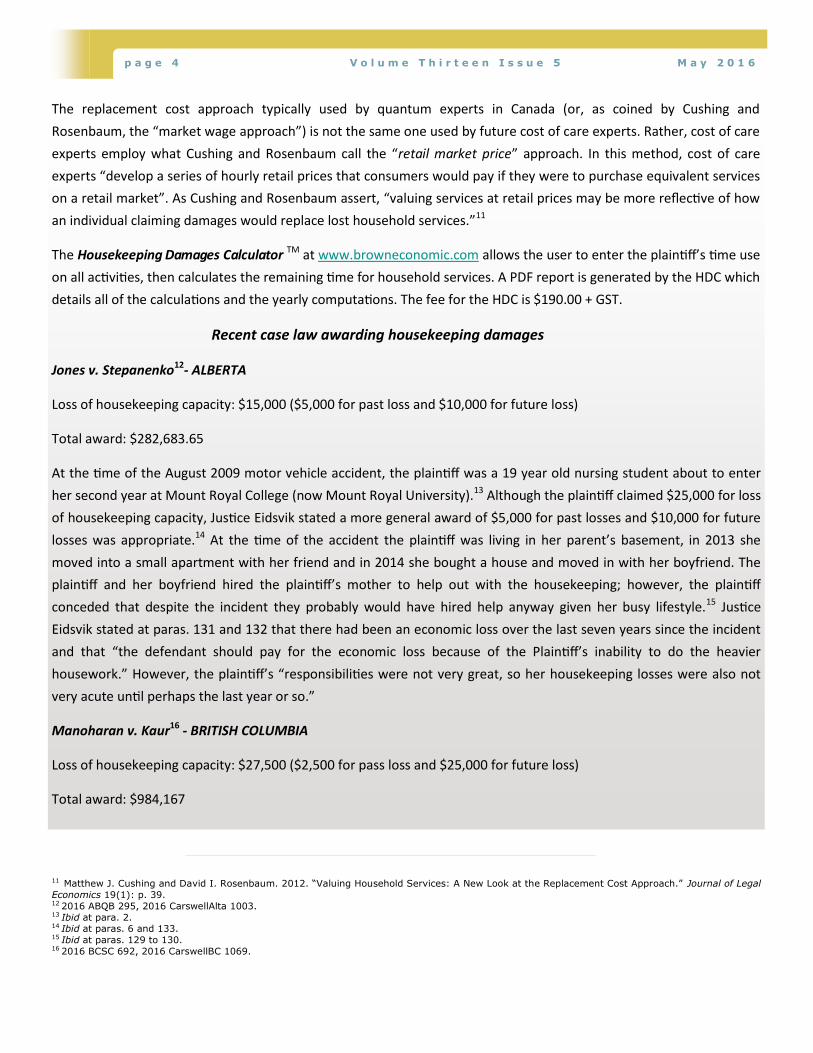
The replacement cost approach typically used by quantum experts in Canada (or, as coined by Cushing and
Rosenbaum, the “market wage approach”) is not the same one used by future cost of care experts. Rather, cost of care
experts employ what Cushing and Rosenbaum call the “retail market price” approach. In this method, cost of care
experts “develop a series of hourly retail prices that consumers would pay if they were to purchase equivalent services
on a retail market”. As Cushing and Rosenbaum assert, “valuing services at retail prices may be more reflective of how
an individual claiming damages would replace lost household services.”11
The Housekeeping Damages Calculator TM at www.browneconomic.com allows the user to enter the plaintiff’s time use
on all activities, then calculates the remaining time for household services. A PDF report is generated by the HDC which
details all of the calculations and the yearly computations. The fee for the HDC is $190.00 + GST.
Recent case law awarding housekeeping damages
Jones v. Stepanenko12- ALBERTA
Loss of housekeeping capacity: $15,000 ($5,000 for past loss and $10,000 for future loss)
Total award: $282,683.65
At the time of the August 2009 motor vehicle accident, the plaintiff was a 19 year old nursing student about to enter
her second year at Mount Royal College (now Mount Royal University).13 Although the plaintiff claimed $25,000 for loss
of housekeeping capacity, Justice Eidsvik stated a more general award of $5,000 for past losses and $10,000 for future
losses was appropriate.14 At the time of the accident the plaintiff was living in her parent’s basement, in 2013 she
moved into a small apartment with her friend and in 2014 she bought a house and moved in with her boyfriend. The
plaintiff and her boyfriend hired the plaintiff’s mother to help out with the housekeeping; however, the plaintiff
conceded that despite the incident they probably would have hired help anyway given her busy lifestyle.15 Justice
Eidsvik stated at paras. 131 and 132 that there had been an economic loss over the last seven years since the incident
and that “the defendant should pay for the economic loss because of the Plaintiff’s inability to do the heavier
housework.” However, the plaintiff’s “responsibilities were not very great, so her housekeeping losses were also not
very acute until perhaps the last year or so.”
Manoharan v. Kaur16 - BRITISH COLUMBIA
Loss of housekeeping capacity: $27,500 ($2,500 for pass loss and $25,000 for future loss)
Total award: $984,167
11 Matthew J. Cushing and David I. Rosenbaum. 2012. “Valuing Household Services: A New Look at the Replacement Cost Approach.” Journal of Legal
Economics 19(1): p. 39. 12 2016 ABQB 295, 2016 CarswellAlta 1003. 13 Ibid at para. 2. 14 Ibid at paras. 6 and 133. 15 Ibid at paras. 129 to 130. 16 2016 BCSC 692, 2016 CarswellBC 1069.
B r o w n ’ s E c o n o m i c D a m a g e s N e w s l e t t e r p a g e 5
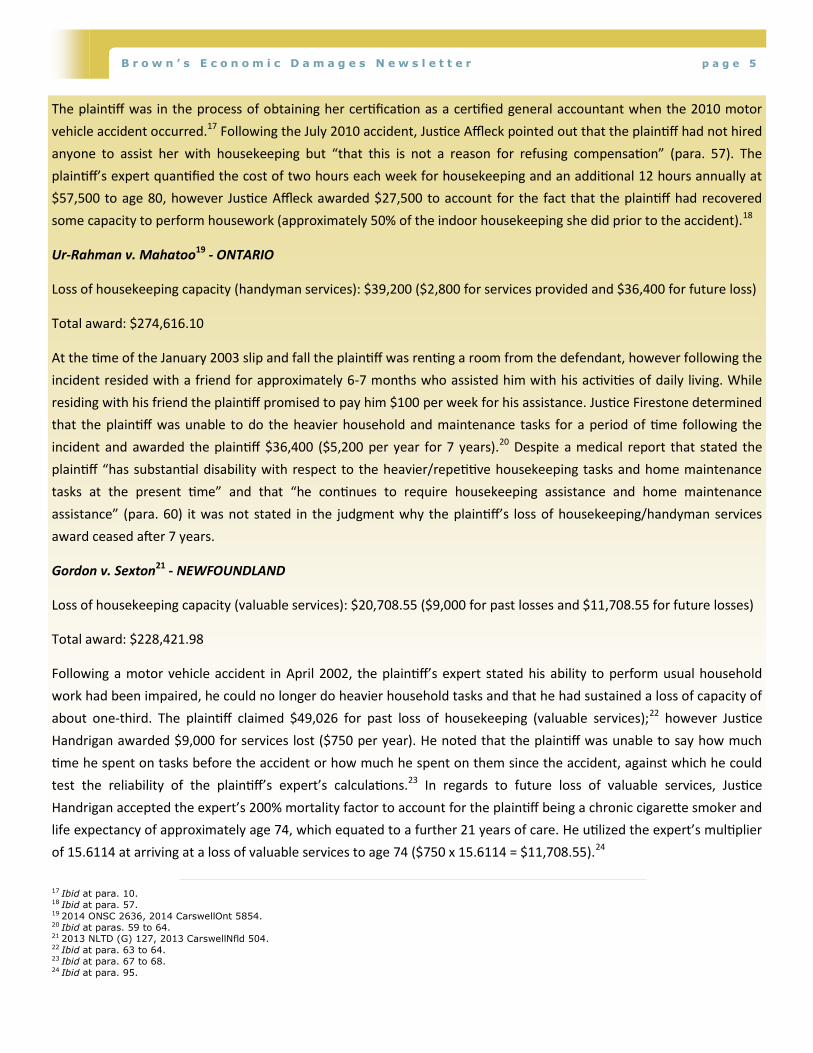
The plaintiff was in the process of obtaining her certification as a certified general accountant when the 2010 motor
vehicle accident occurred.17 Following the July 2010 accident, Justice Affleck pointed out that the plaintiff had not hired
anyone to assist her with housekeeping but “that this is not a reason for refusing compensation” (para. 57). The
plaintiff’s expert quantified the cost of two hours each week for housekeeping and an additional 12 hours annually at
$57,500 to age 80, however Justice Affleck awarded $27,500 to account for the fact that the plaintiff had recovered
some capacity to perform housework (approximately 50% of the indoor housekeeping she did prior to the accident).18
Ur-Rahman v. Mahatoo19 - ONTARIO
Loss of housekeeping capacity (handyman services): $39,200 ($2,800 for services provided and $36,400 for future loss)
Total award: $274,616.10
At the time of the January 2003 slip and fall the plaintiff was renting a room from the defendant, however following the
incident resided with a friend for approximately 6-7 months who assisted him with his activities of daily living. While
residing with his friend the plaintiff promised to pay him $100 per week for his assistance. Justice Firestone determined
that the plaintiff was unable to do the heavier household and maintenance tasks for a period of time following the
incident and awarded the plaintiff $36,400 ($5,200 per year for 7 years).20 Despite a medical report that stated the
plaintiff “has substantial disability with respect to the heavier/repetitive housekeeping tasks and home maintenance
tasks at the present time” and that “he continues to require housekeeping assistance and home maintenance
assistance” (para. 60) it was not stated in the judgment why the plaintiff’s loss of housekeeping/handyman services
award ceased after 7 years.
Gordon v. Sexton21 - NEWFOUNDLAND
Loss of housekeeping capacity (valuable services): $20,708.55 ($9,000 for past losses and $11,708.55 for future losses)
Total award: $228,421.98
Following a motor vehicle accident in April 2002, the plaintiff’s expert stated his ability to perform usual household
work had been impaired, he could no longer do heavier household tasks and that he had sustained a loss of capacity of
about one-third. The plaintiff claimed $49,026 for past loss of housekeeping (valuable services);22 however Justice
Handrigan awarded $9,000 for services lost ($750 per year). He noted that the plaintiff was unable to say how much
time he spent on tasks before the accident or how much he spent on them since the accident, against which he could
test the reliability of the plaintiff’s expert’s calculations.23 In regards to future loss of valuable services, Justice
Handrigan accepted the expert’s 200% mortality factor to account for the plaintiff being a chronic cigarette smoker and
life expectancy of approximately age 74, which equated to a further 21 years of care. He utilized the expert’s multiplier
of 15.6114 at arriving at a loss of valuable services to age 74 ($750 x 15.6114 = $11,708.55).24
17 Ibid at para. 10. 18 Ibid at para. 57. 19 2014 ONSC 2636, 2014 CarswellOnt 5854. 20 Ibid at paras. 59 to 64. 21 2013 NLTD (G) 127, 2013 CarswellNfld 504. 22 Ibid at para. 63 to 64. 23 Ibid at para. 67 to 68. 24 Ibid at para. 95.
p a g e 2 V o l u m e S i x I s s u e 1 J a n u a r y 2 0 0 9 2 0 0 9
B r o w n ’ s E c o n o m i c D a m a g e s N e w s l e t t e r p a g e 6
#907, 1128 Sunset Drive
Kelowna, B.C. V1Y 9W7
Toll 1.800.301.8801
1701 Hollis Street Suite 800
Halifax, NS B3J 3M8
Toll 1.800.301.8801
Email [email protected]
Web www.browneconomic.com
HEAD OFFICE
#216, 5718-1A Street South West
Calgary, AB T2H 0E8
T 403.571.0115 F 403.571.0932
B r o w n E c o n o m i c C o n s u l t i n g I n c .
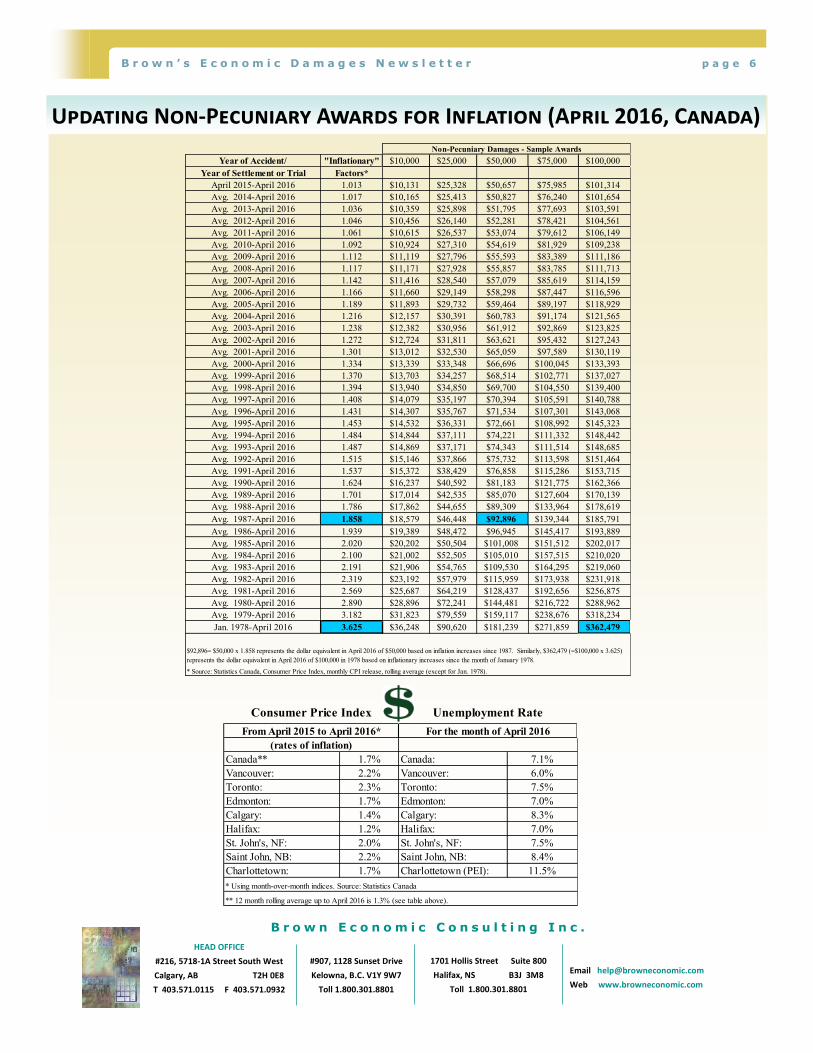
Updating Non-Pecuniary Awards for Inflation (April 2016, Canada)
Year of Accident/ "Inflationary" $10,000 $25,000 $50,000 $75,000 $100,000
Year of Settlement or Trial Factors*
April 2015-April 2016 1.013 $10,131 $25,328 $50,657 $75,985 $101,314
Avg. 2014-April 2016 1.017 $10,165 $25,413 $50,827 $76,240 $101,654
Avg. 2013-April 2016 1.036 $10,359 $25,898 $51,795 $77,693 $103,591
Avg. 2012-April 2016 1.046 $10,456 $26,140 $52,281 $78,421 $104,561
Avg. 2011-April 2016 1.061 $10,615 $26,537 $53,074 $79,612 $106,149
Avg. 2010-April 2016 1.092 $10,924 $27,310 $54,619 $81,929 $109,238
Avg. 2009-April 2016 1.112 $11,119 $27,796 $55,593 $83,389 $111,186
Avg. 2008-April 2016 1.117 $11,171 $27,928 $55,857 $83,785 $111,713
Avg. 2007-April 2016 1.142 $11,416 $28,540 $57,079 $85,619 $114,159
Avg. 2006-April 2016 1.166 $11,660 $29,149 $58,298 $87,447 $116,596
Avg. 2005-April 2016 1.189 $11,893 $29,732 $59,464 $89,197 $118,929
Avg. 2004-April 2016 1.216 $12,157 $30,391 $60,783 $91,174 $121,565
Avg. 2003-April 2016 1.238 $12,382 $30,956 $61,912 $92,869 $123,825
Avg. 2002-April 2016 1.272 $12,724 $31,811 $63,621 $95,432 $127,243
Avg. 2001-April 2016 1.301 $13,012 $32,530 $65,059 $97,589 $130,119
Avg. 2000-April 2016 1.334 $13,339 $33,348 $66,696 $100,045 $133,393
Avg. 1999-April 2016 1.370 $13,703 $34,257 $68,514 $102,771 $137,027
Avg. 1998-April 2016 1.394 $13,940 $34,850 $69,700 $104,550 $139,400
Avg. 1997-April 2016 1.408 $14,079 $35,197 $70,394 $105,591 $140,788
Avg. 1996-April 2016 1.431 $14,307 $35,767 $71,534 $107,301 $143,068
Avg. 1995-April 2016 1.453 $14,532 $36,331 $72,661 $108,992 $145,323
Avg. 1994-April 2016 1.484 $14,844 $37,111 $74,221 $111,332 $148,442
Avg. 1993-April 2016 1.487 $14,869 $37,171 $74,343 $111,514 $148,685
Avg. 1992-April 2016 1.515 $15,146 $37,866 $75,732 $113,598 $151,464
Avg. 1991-April 2016 1.537 $15,372 $38,429 $76,858 $115,286 $153,715
Avg. 1990-April 2016 1.624 $16,237 $40,592 $81,183 $121,775 $162,366
Avg. 1989-April 2016 1.701 $17,014 $42,535 $85,070 $127,604 $170,139
Avg. 1988-April 2016 1.786 $17,862 $44,655 $89,309 $133,964 $178,619
Avg. 1987-April 2016 1.858 $18,579 $46,448 $92,896 $139,344 $185,791
Avg. 1986-April 2016 1.939 $19,389 $48,472 $96,945 $145,417 $193,889
Avg. 1985-April 2016 2.020 $20,202 $50,504 $101,008 $151,512 $202,017
Avg. 1984-April 2016 2.100 $21,002 $52,505 $105,010 $157,515 $210,020
Avg. 1983-April 2016 2.191 $21,906 $54,765 $109,530 $164,295 $219,060
Avg. 1982-April 2016 2.319 $23,192 $57,979 $115,959 $173,938 $231,918
Avg. 1981-April 2016 2.569 $25,687 $64,219 $128,437 $192,656 $256,875
Avg. 1980-April 2016 2.890 $28,896 $72,241 $144,481 $216,722 $288,962
Avg. 1979-April 2016 3.182 $31,823 $79,559 $159,117 $238,676 $318,234
Jan. 1978-April 2016 3.625 $36,248 $90,620 $181,239 $271,859 $362,479
$92,896= $50,000 x 1.858 represents the dollar equivalent in April 2016 of $50,000 based on inflation increases since 1987. Similarly, $362,479 (=$100,000 x 3.625)
represents the dollar equivalent in April 2016 of $100,000 in 1978 based on inflationary increases since the month of January 1978.
* Source: Statistics Canada, Consumer Price Index, monthly CPI release, rolling average (except for Jan. 1978).
Non-Pecuniary Damages - Sample Awards
Canada** 1.7% Canada: 7.1%
Vancouver: 2.2% Vancouver: 6.0%
Toronto: 2.3% Toronto: 7.5%
Edmonton: 1.7% Edmonton: 7.0%
Calgary: 1.4% Calgary: 8.3%
Halifax: 1.2% Halifax: 7.0%
St. John's, NF: 2.0% St. John's, NF: 7.5%
Saint John, NB: 2.2% Saint John, NB: 8.4%
Charlottetown: 1.7% Charlottetown (PEI): 11.5%
** 12 month rolling average up to April 2016 is 1.3% (see table above).
(rates of inflation)
From April 2015 to April 2016*
Consumer Price Index Unemployment Rate
For the month of April 2016
* Using month-over-month indices. Source: Statistics Canada