Embed Size (px)
Citation preview
INVESTOR PRESENTATION DECEMBER 2016
2 Investor Presentation
December 2016
Forward-Looking Statements
Certain statements in this presentation about the Company’s current and future plans, expectations and intentions, results, levels of activity, performance,
goals or achievements or any other future events or developments constitute forward-looking statements. The words “may”, “will”, “would”, “should”, “could”,
“expects”, “plans”, “intends”, “trends”, “indications”, “anticipates”, “believes”, “estimates”, “predicts”, “likely” or “potential” or the negative or other variations of
these words or other comparable words or phrases, are intended to identify forward-looking statements.
Forward-looking statements are based on estimates and assumptions made by the Company in light of its experience and perception of historical trends,
current conditions and expected future developments, as well as other factors that the Company believes are appropriate and reasonable in the
circumstances, but there can be no assurance that such estimates and assumptions will prove to be correct or that the Company ’s business guidance,
objectives, plans and strategic priorities will be achieved.
Many factors could cause the Company’s actual results, level of activity, performance or achievements or future events or developments to differ materially
from those expressed or implied by the forward-looking statements, including, without limitation, the following factors, which are discussed in greater detail
under the heading “Risk Factors” of the Company’s Management Discussion and Analysis for the quarter ended January 31, 2016 dated March 17, 2016:
impact of adverse economic conditions on consumer spending; decline in social acceptability of the Company’s products; fluctuations in foreign currency
exchange rates; high levels of indebtedness; unavailability of additional capital; unfavourable weather conditions; seasonal sales fluctuations; the Company’s
ability to comply with product safety, health, environmental and noise pollution laws; dependence on dealers, distributors, suppliers, financing sources and
other strategic partners who may be sensitive to economic conditions; large fixed cost base; inability of dealers and distributors to secure adequate access to
capital; supply problems, termination or interruption of supply arrangements or increases in the cost of materials; covenants in the Company’s financing and
other material agreements; competition in product lines; loss of members of management team or employees who possess specialized market knowledge and
technical skills; inability to maintain and enhance reputation and brands; adverse determination in any significant product l iability claim against the Company;
significant product repair and/or replacement due to product warranty claims or product recalls; reliance on a network of independent dealers and distributors
to manage the retail distribution of its products; dependence on OEM customers for its outboard engine and Rotax engine business; unsuccessful
management of inventory levels; risks associated with international operations; unsuccessful execution of growth strategy; protection of intellectual property;
failure of information technology systems; declining prices for used versions of products and oversupply by competitors; unsuccessful execution of
manufacturing strategy; changes in tax laws and unanticipated tax liabilities; higher fuel costs; deterioration in relationships with employees; pension plan
liabilities; natural disasters; failure to carry proper insurance coverage; volatile market price for Subordinate Voting Shares; no current plans to pay dividends;
conduct of business through subsidiaries; significant influence by Beaudier Group and Bain Capital; and future sales of Shares by Beaudier Group, Bain
Capital, directors, officers or senior management of the Company. These factors are not intended to represent a complete list of the factors that could affect
the Company; however, these factors should be considered carefully.
The purpose of the forward-looking statements is to provide the reader with a description of management’s expectations regarding the Company’s financial
performance and may not be appropriate for other purposes; readers should not place undue reliance on forward-looking statements made herein.
Furthermore, unless otherwise stated, the forward-looking statements contained in this Annual Information Form are made as of the date of this Annual
Information Form, and the Company has no intention and undertakes no obligation to update or revise any forward-looking statements, whether as a result of
new information, future events or otherwise, except as required by applicable securities regulations. The forward-looking statements contained in this Annual
Information Form are expressly qualified by this cautionary statement.
3 Investor Presentation
December 2016
2,133
2,653
2,896
3,194
3,525
3,829
Up 5% to 9%
217
262
335 380
421 460
Up 7 to 10%
FY11 FY12 FY13 FY14 FY15 FY16 FY17
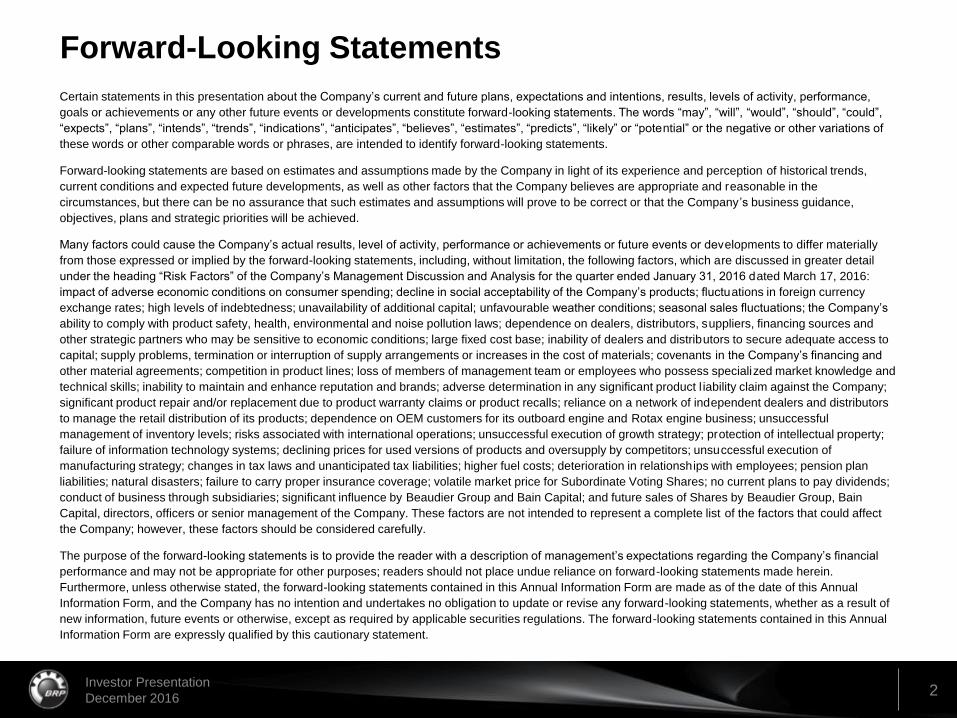
Company Overview
A World Leader in Powersports
Diversified product portfolio
4 product categories
6 powerful brands
7 product lines
Market leader in R&D
~750 engineers and technicians
4 state-of-the-art development centers
Invest annually ~4.5% of revenues in R&D
Established global distribution network
~4,200 dealers in over 100 countries
Global, modern manufacturing footprint
7 facilities in 5 countries
~7,900 employees worldwide
Financial Performance
CA$ millions
Revenues
Normalized
EBITDA[1]
Product Portfolio
Based on FY16 Revenues
Can-Am ATV
Can-Am SSV
Can-Am Roadster
Ski-Doo Snowmobile
Lynx Snowmobile
Sea-Doo PWC
Evinrude
Outboard
Engines
Rotax
Engines
[1] For a reconciliation of net income to Normalized Net Income and
Normalized EBITDA, see the reconciliation tables in appendix
Net Income $35M $84M $119M $60M $70M
Year-Round Products Seasonal Products
Propulsion Systems Parts, Accessories & Clothing (PAC)
36%
16% 10%
38%
$52M
4 Investor Presentation
December 2016
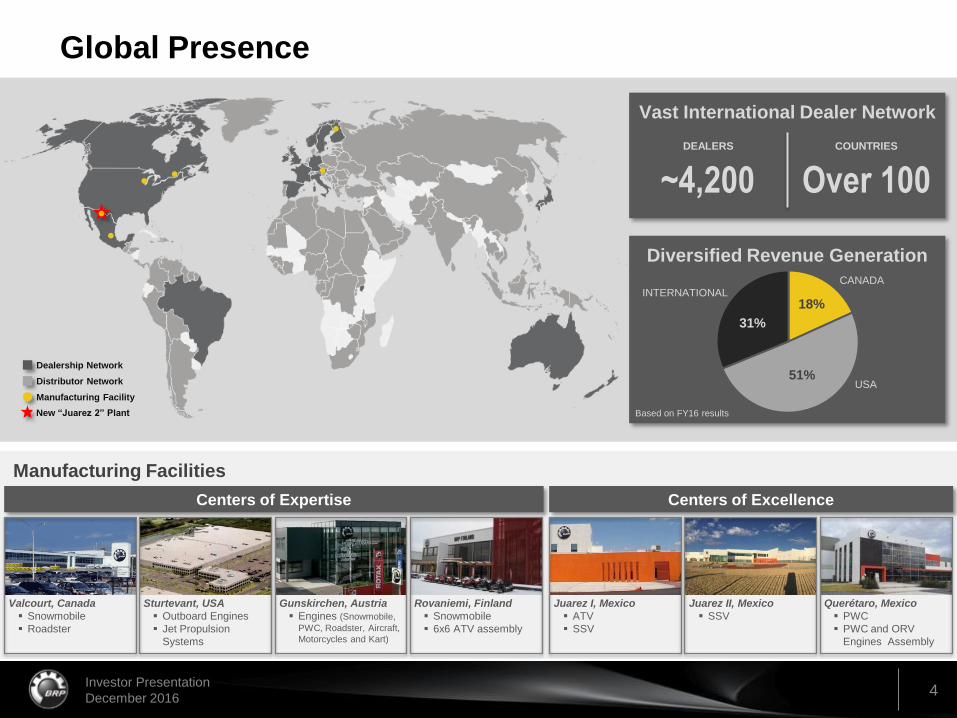
Global Presence
Dealership Network
Distributor Network
Manufacturing Facility
Vast International Dealer Network
DEALERS
~4,200 COUNTRIES
Over 100
Diversified Revenue Generation
18%
51%
31%
CANADA
USA
INTERNATIONAL
Based on FY16 results
Manufacturing Facilities
Valcourt, Canada
Snowmobile
Roadster
Juarez I, Mexico
ATV
SSV
Querétaro, Mexico
PWC
PWC and ORV
Engines Assembly
Sturtevant, USA
Outboard Engines
Jet Propulsion
Systems
Gunskirchen, Austria
Engines (Snowmobile,
PWC, Roadster, Aircraft,
Motorcycles and Kart)
Rovaniemi, Finland
Snowmobile
6x6 ATV assembly
New “Juarez 2” Plant
Juarez II, Mexico
SSV
Centers of Expertise Centers of Excellence
5 Investor Presentation
December 2016
STRATEGIC PRIORITIES UPDATE
INVESTOR PRESENTATION
DECEMBER 2016
6 Investor Presentation
December 2016
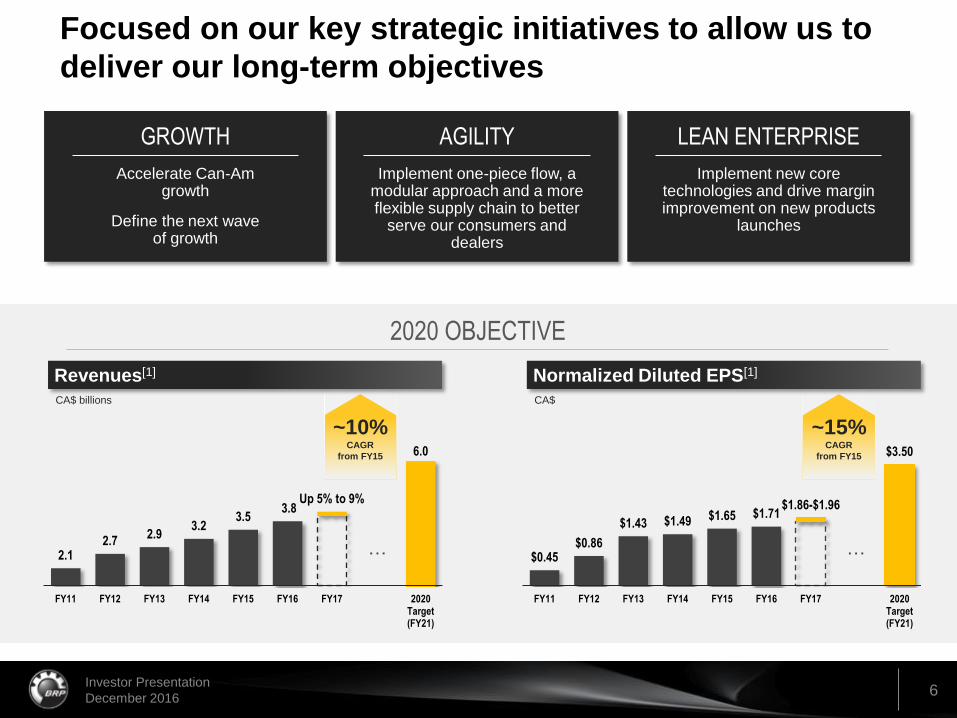
Focused on our key strategic initiatives to allow us to
deliver our long-term objectives
… …
~10% CAGR
from FY15
~15% CAGR
from FY15
2020 OBJECTIVE
Revenues[1]
CA$ billions
Normalized Diluted EPS[1]
CA$
2.1 2.7
2.9 3.2
3.5 3.8
Up 5% to 9%
6.0
FY11 FY12 FY13 FY14 FY15 FY16 FY17 2020 Target (FY21)
$0.45 $0.86
$1.43 $1.49 $1.65 $1.71 $1.86-$1.96
$3.50
FY11 FY12 FY13 FY14 FY15 FY16 FY17 2020 Target (FY21)
LEAN ENTERPRISE
Implement new core technologies and drive margin improvement on new products
launches
AGILITY
Implement one-piece flow, a modular approach and a more flexible supply chain to better
serve our consumers and dealers
GROWTH
Accelerate Can-Am growth
Define the next wave of growth
7 Investor Presentation
December 2016
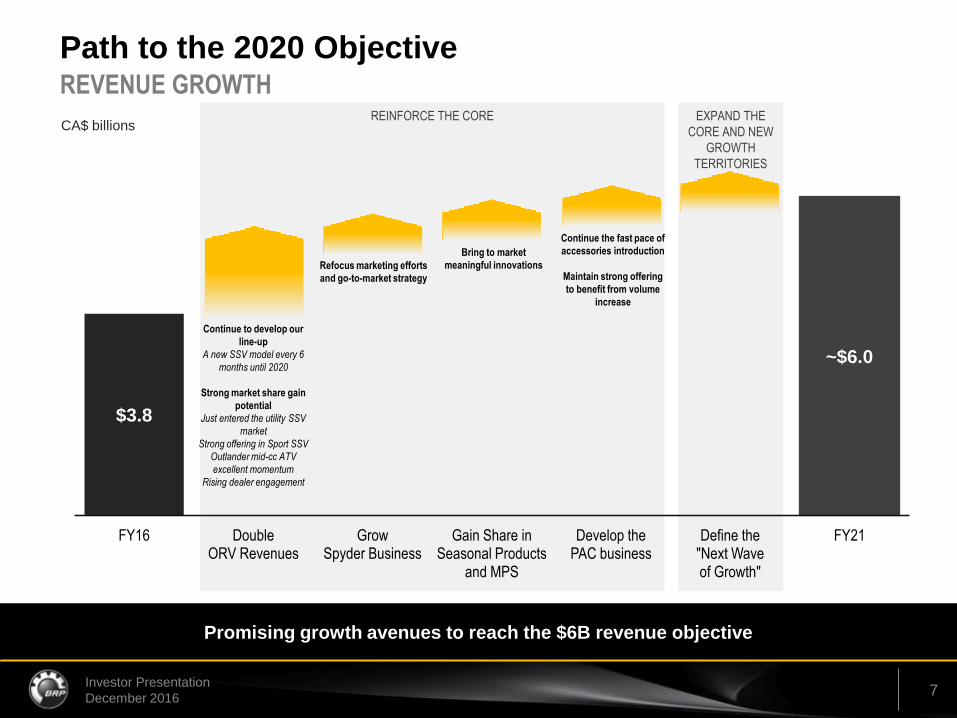
EXPAND THE
CORE AND NEW
GROWTH
TERRITORIES
REINFORCE THE CORE
Path to the 2020 Objective REVENUE GROWTH
$3.8
~$6.0
FY16 Double ORV Revenues
Grow Spyder Business
Gain Share in Seasonal Products
and MPS
Develop the PAC business
Define the "Next Wave of Growth"
FY21
Promising growth avenues to reach the $6B revenue objective
CA$ billions
Continue to develop our
line-up
A new SSV model every 6
months until 2020
Strong market share gain
potential
Just entered the utility SSV
market
Strong offering in Sport SSV
Outlander mid-cc ATV
excellent momentum
Rising dealer engagement
Refocus marketing efforts
and go-to-market strategy
Bring to market
meaningful innovations
Continue the fast pace of
accessories introduction
Maintain strong offering
to benefit from volume
increase
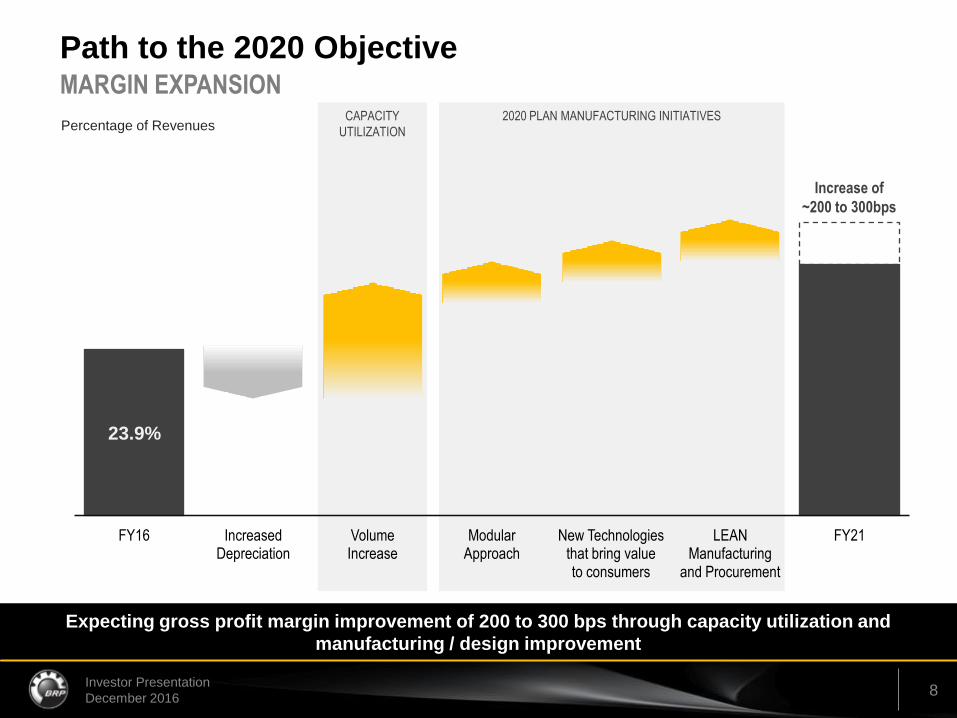
8 Investor Presentation
December 2016
CAPACITY
UTILIZATION
2020 PLAN MANUFACTURING INITIATIVES
Path to the 2020 Objective
23.9%
FY16 Increased Depreciation
Volume Increase
Modular Approach
New Technologies that bring value to consumers
LEAN Manufacturing
and Procurement
FY21
Expecting gross profit margin improvement of 200 to 300 bps through capacity utilization and
manufacturing / design improvement
Percentage of Revenues
MARGIN EXPANSION
Increase of
~200 to 300bps
9 Investor Presentation
December 2016
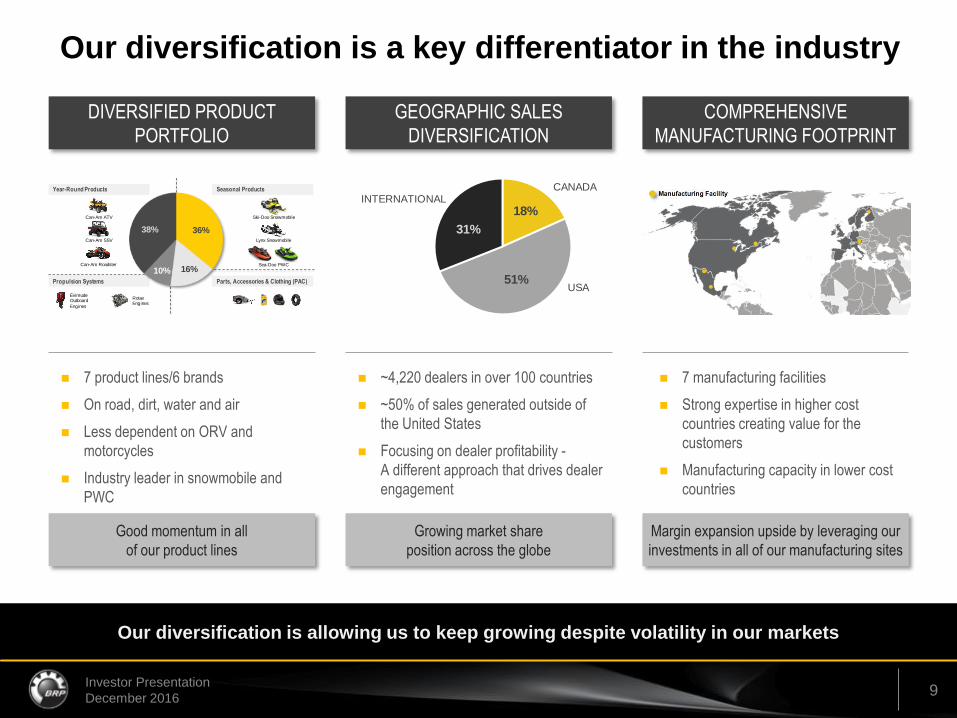
Our diversification is a key differentiator in the industry
7 product lines/6 brands
On road, dirt, water and air
Less dependent on ORV and
motorcycles
Industry leader in snowmobile and
PWC
Our diversification is allowing us to keep growing despite volatility in our markets
DIVERSIFIED PRODUCT
PORTFOLIO
GEOGRAPHIC SALES
DIVERSIFICATION
COMPREHENSIVE
MANUFACTURING FOOTPRINT
~4,220 dealers in over 100 countries
~50% of sales generated outside of
the United States
Focusing on dealer profitability -
A different approach that drives dealer
engagement
7 manufacturing facilities
Strong expertise in higher cost
countries creating value for the
customers
Manufacturing capacity in lower cost
countries
Can-Am ATV
Can-Am SSV
Can-Am Roadster
Ski-Doo Snowmobile
Lynx Snowmobile
Sea-Doo PWC
EvinrudeOutboard
Engines
RotaxEngines
Year-Round Products Seasonal Products
Propulsion Systems Parts, Accessories & Clothing (PAC)
36%
16%10%
38%
18%
51%
31%
CANADA
USA
INTERNATIONAL
Good momentum in all
of our product lines
Growing market share
position across the globe
Margin expansion upside by leveraging our
investments in all of our manufacturing sites
10 Investor Presentation
December 2016
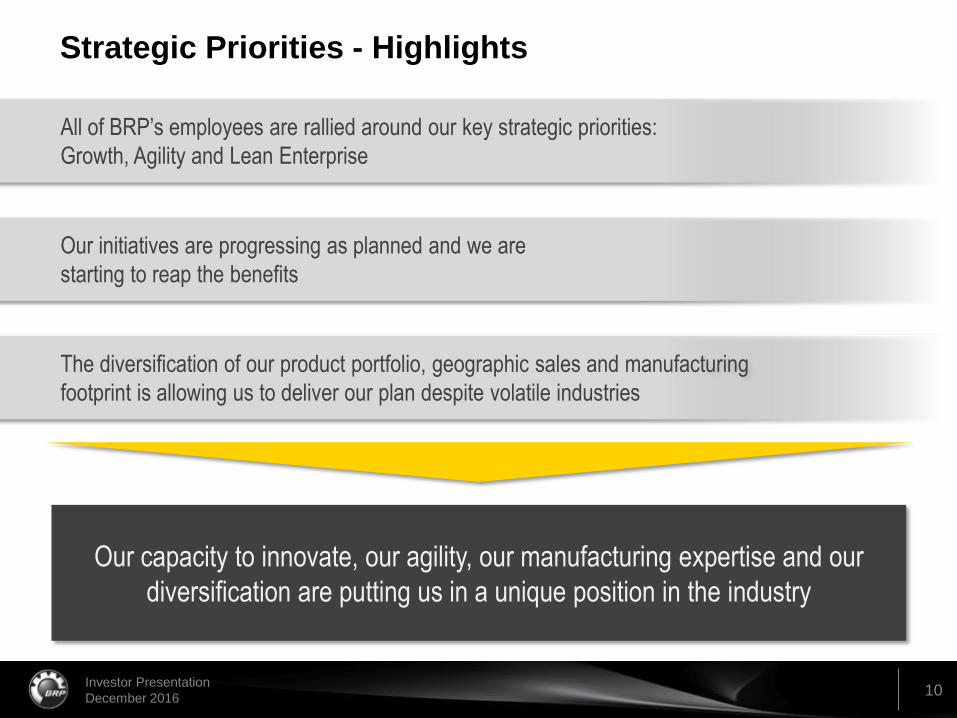
All of BRP’s employees are rallied around our key strategic priorities:
Growth, Agility and Lean Enterprise
The diversification of our product portfolio, geographic sales and manufacturing
footprint is allowing us to deliver our plan despite volatile industries
Strategic Priorities - Highlights
Our initiatives are progressing as planned and we are
starting to reap the benefits
Our capacity to innovate, our agility, our manufacturing expertise and our
diversification are putting us in a unique position in the industry
11 Investor Presentation
December 2016
FY17 UPDATE
DECEMBER 2016
INVESTOR PRESENTATION
12 Investor Presentation
December 2016
Increase of 7% in revenues primarily driven by higher wholesale in Year-Round
Products, partially offset by lower wholesales in Seasonal Products
Gross profit margin increased 400 basis points to 28.4%
Normalized EBITDA[1] of $196.9M, an increase of $55.4M, and Normalized diluted
earnings per share[1] of $0.93, a decrease of $0.31
Net loss of $78.7M, an increase of $13.2M
North American BRP retail sales for Seasonal Products and Year-Round Products
decreased 12%, or increased 10% when excluding snowmobiles
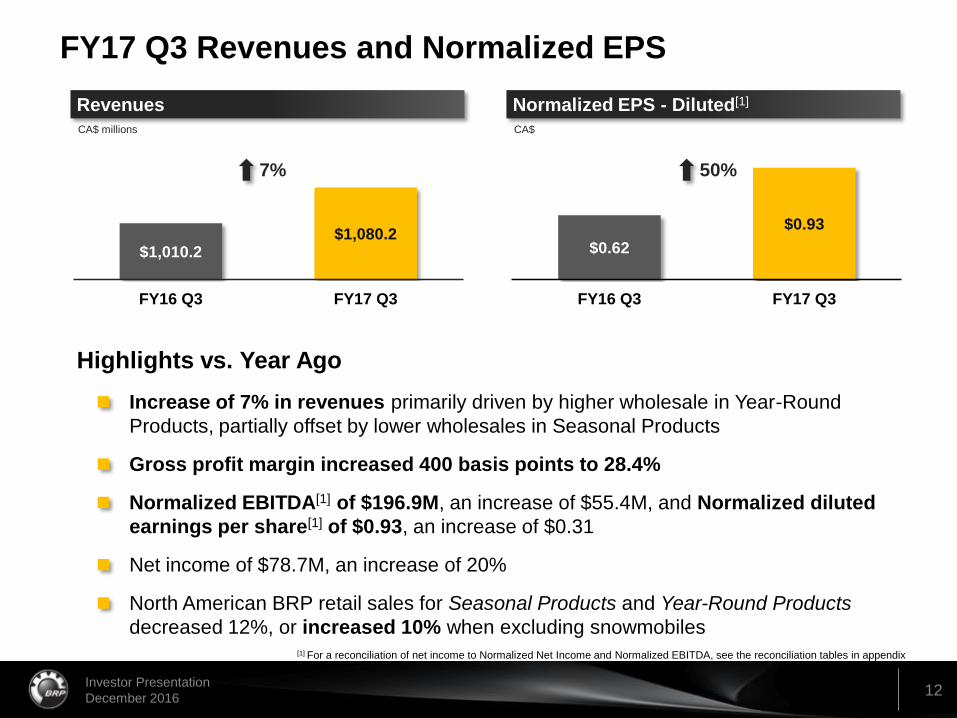
Increase of 7% in revenues primarily driven by higher wholesale in Year-Round
Products, partially offset by lower wholesales in Seasonal Products
Gross profit margin increased 400 basis points to 28.4%
Normalized EBITDA[1] of $196.9M, an increase of $55.4M, and Normalized diluted
earnings per share[1] of $0.93, an increase of $0.31
Net income of $78.7M, an increase of 20%
North American BRP retail sales for Seasonal Products and Year-Round Products
decreased 12%, or increased 10% when excluding snowmobiles
$0.62
$0.93
FY16 Q3 FY17 Q3
$1,010.2 $1,080.2
FY16 Q3 FY17 Q3
FY17 Q3 Revenues and Normalized EPS
Revenues
CA$ millions
Normalized EPS - Diluted[1]
CA$
50% 7%
[1] For a reconciliation of net income to Normalized Net Income and Normalized EBITDA, see the reconciliation tables in appendix
Highlights vs. Year Ago
13 Investor Presentation
December 2016
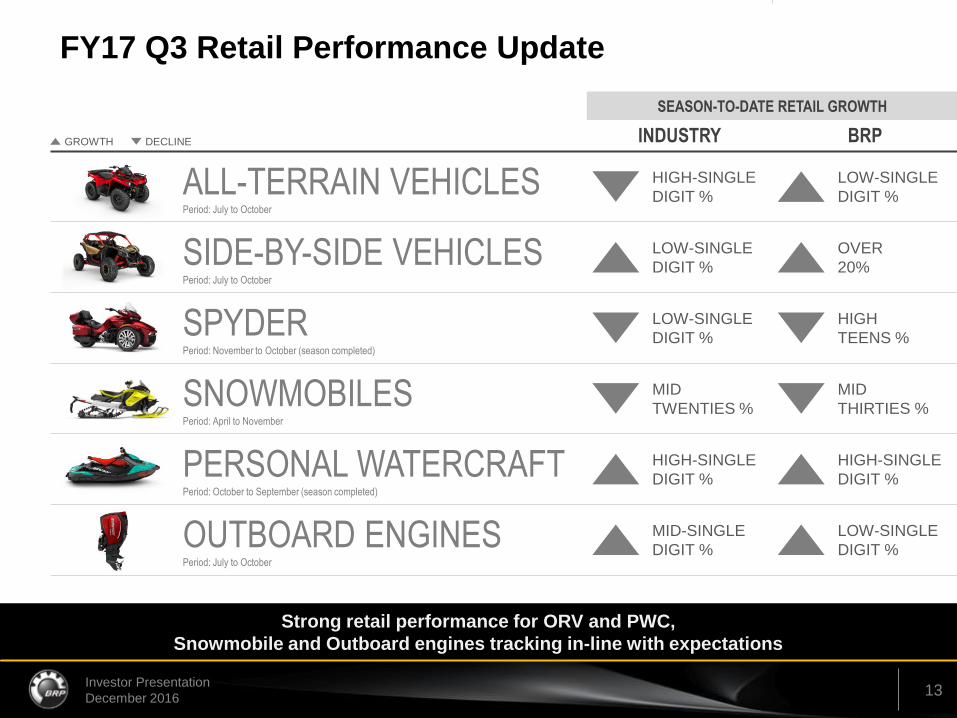
FY17 Q3 Retail Performance Update
Strong retail performance for ORV and PWC,
Snowmobile and Outboard engines tracking in-line with expectations
SEASON-TO-DATE RETAIL GROWTH
INDUSTRY BRP
ALL-TERRAIN VEHICLES Period: July to October
SIDE-BY-SIDE VEHICLES Period: July to October
SPYDER Period: November to October (season completed)
SNOWMOBILES Period: April to November
PERSONAL WATERCRAFT Period: October to September (season completed)
OUTBOARD ENGINES Period: July to October
GROWTH DECLINE
HIGH-SINGLE
DIGIT %
LOW-SINGLE
DIGIT %
LOW-SINGLE
DIGIT %
OVER
20%
LOW-SINGLE
DIGIT %
HIGH
TEENS %
MID
TWENTIES %
MID
THIRTIES %
HIGH-SINGLE
DIGIT %
HIGH-SINGLE
DIGIT %
MID-SINGLE
DIGIT %
LOW-SINGLE
DIGIT %
14 Investor Presentation
December 2016
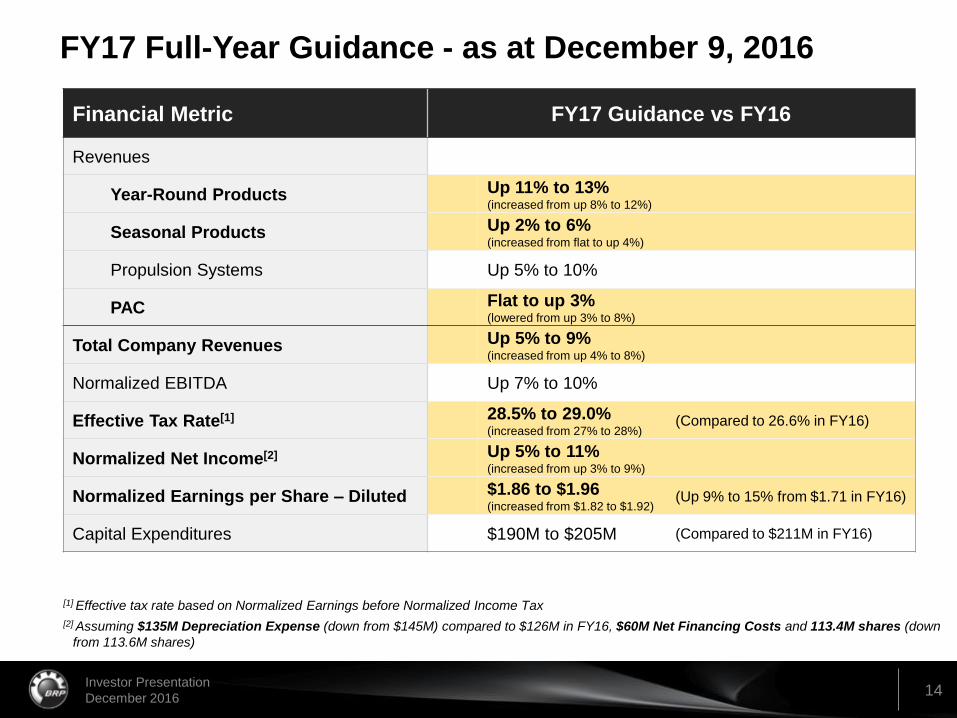
FY17 Full-Year Guidance - as at December 9, 2016
[1] Effective tax rate based on Normalized Earnings before Normalized Income Tax
[2] Assuming $135M Depreciation Expense (down from $145M) compared to $126M in FY16, $60M Net Financing Costs and 113.4M shares (down
from 113.6M shares)
Financial Metric FY17 Guidance vs FY16
Revenues
Year-Round Products Up 11% to 13% (increased from up 8% to 12%)
Seasonal Products Up 2% to 6% (increased from flat to up 4%)
Propulsion Systems Up 5% to 10%
PAC Flat to up 3% (lowered from up 3% to 8%)
Total Company Revenues Up 5% to 9% (increased from up 4% to 8%)
Normalized EBITDA Up 7% to 10%
Effective Tax Rate[1] 28.5% to 29.0% (increased from 27% to 28%)
Normalized Net Income[2] Up 5% to 11% (increased from up 3% to 9%)
Normalized Earnings per Share – Diluted $1.86 to $1.96 (increased from $1.82 to $1.92)
Capital Expenditures $190M to $205M (Compared to $211M in FY16)
(Up 9% to 15% from $1.71 in FY16)
(Compared to 26.6% in FY16)
15 Investor Presentation
December 2016
APPENDIX
DECEMBER 2016
INVESTOR PRESENTATION
16 Investor Presentation
December 2016
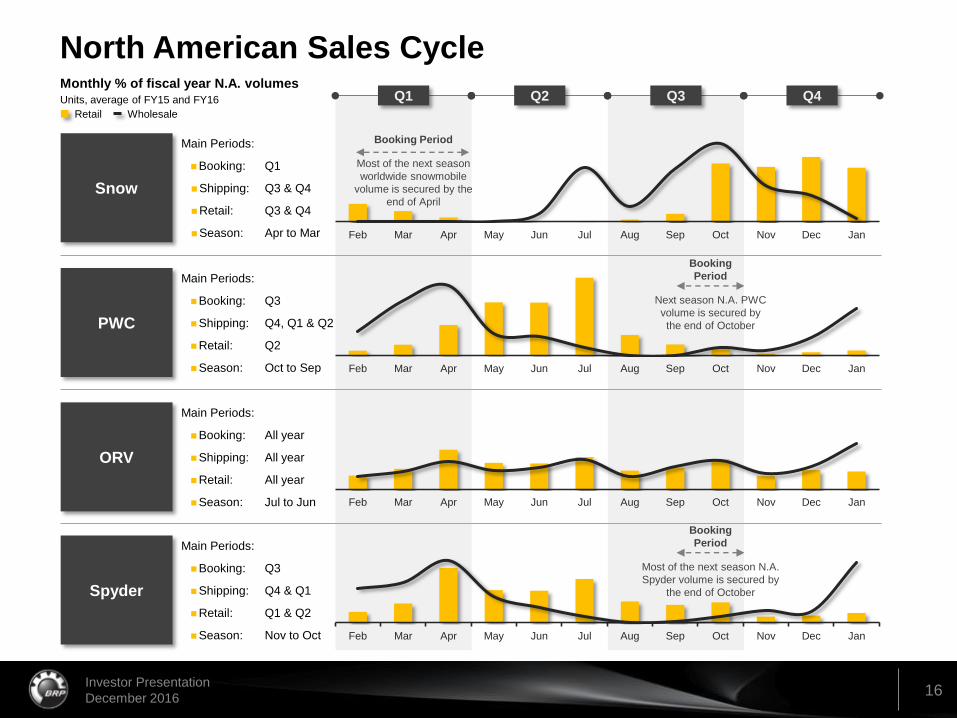
North American Sales Cycle
Feb Mar Apr May Jun Jul Aug Sep Oct Nov Dec Jan
Feb Mar Apr May Jun Jul Aug Sep Oct Nov Dec Jan
Feb Mar Apr May Jun Jul Aug Sep Oct Nov Dec Jan
Feb Mar Apr May Jun Jul Aug Sep Oct Nov Dec Jan
Q1 Q2 Q3 Q4
PWC
Main Periods:
Booking: Q3
Shipping: Q4, Q1 & Q2
Retail: Q2
Season: Oct to Sep
ORV
Main Periods:
Booking: All year
Shipping: All year
Retail: All year
Season: Jul to Jun
Snow
Main Periods:
Booking: Q1
Shipping: Q3 & Q4
Retail: Q3 & Q4
Season: Apr to Mar
Spyder
Main Periods:
Booking: Q3
Shipping: Q4 & Q1
Retail: Q1 & Q2
Season: Nov to Oct
Monthly % of fiscal year N.A. volumes Units, average of FY15 and FY16
Retail Wholesale
Booking Period
Most of the next season
worldwide snowmobile
volume is secured by the
end of April
Booking
Period
Next season N.A. PWC
volume is secured by
the end of October
Booking
Period
Most of the next season N.A.
Spyder volume is secured by
the end of October
17 Investor Presentation
December 2016
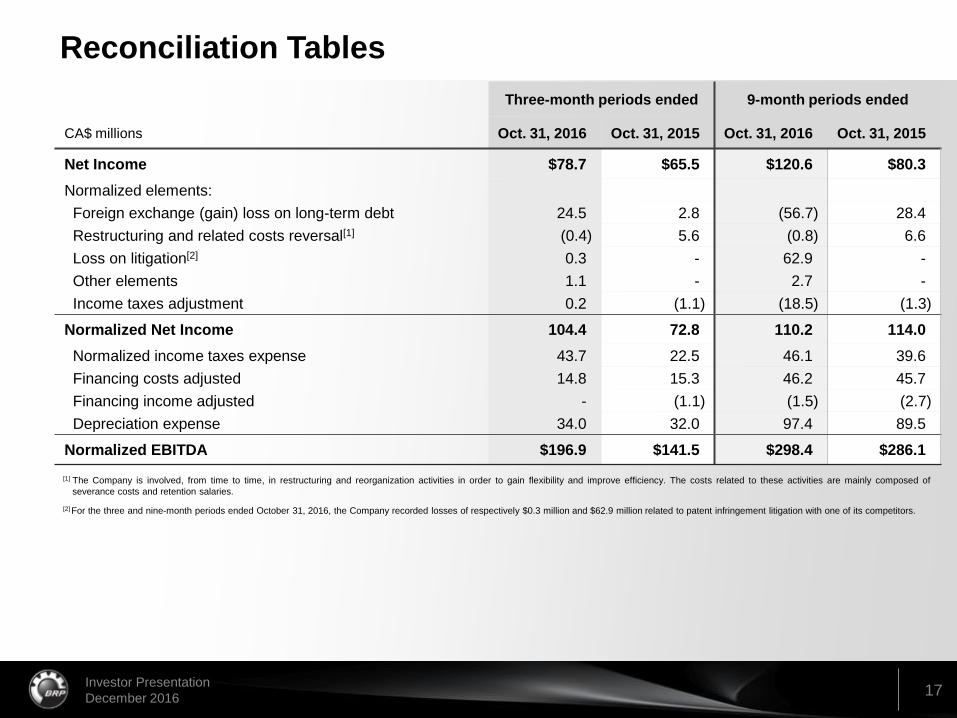
Reconciliation Tables
[1] The Company is involved, from time to time, in restructuring and reorganization activities in order to gain flexibility and improve efficiency. The costs related to these activities are mainly composed of
severance costs and retention salaries.
[2] For the three and nine-month periods ended October 31, 2016, the Company recorded losses of respectively $0.3 million and $62.9 million related to patent infringement litigation with one of its competitors.
Three-month periods ended 9-month periods ended
CA$ millions Oct. 31, 2016 Oct. 31, 2015 Oct. 31, 2016 Oct. 31, 2015
Net Income $78.7 $65.5 $120.6 $80.3
Normalized elements:
Foreign exchange (gain) loss on long-term debt 24.5 2.8 (56.7) 28.4
Restructuring and related costs reversal[1] (0.4) 5.6 (0.8) 6.6
Loss on litigation[2] 0.3 - 62.9 -
Other elements 1.1 - 2.7 -
Income taxes adjustment 0.2 (1.1) (18.5) (1.3)
Normalized Net Income 104.4 72.8 110.2 114.0
Normalized income taxes expense 43.7 22.5 46.1 39.6
Financing costs adjusted 14.8 15.3 46.2 45.7
Financing income adjusted - (1.1) (1.5) (2.7)
Depreciation expense 34.0 32.0 97.4 89.5
Normalized EBITDA $196.9 $141.5 $298.4 $286.1
18 Investor Presentation
December 2016
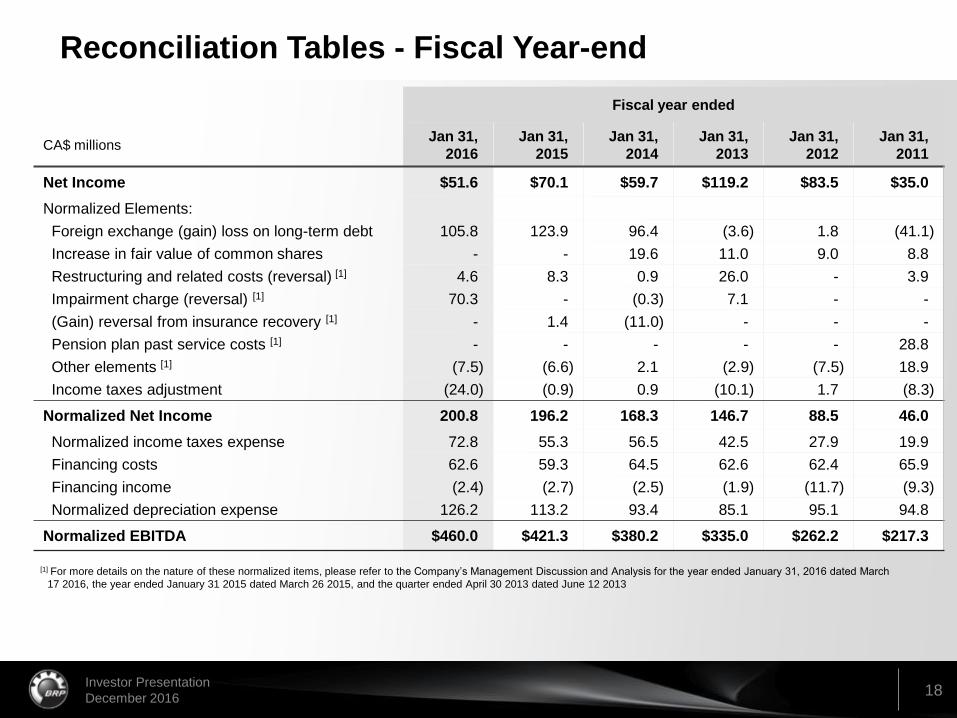
Reconciliation Tables - Fiscal Year-end
Fiscal year ended
CA$ millions Jan 31,
2016
Jan 31,
2015
Jan 31,
2014
Jan 31,
2013
Jan 31,
2012
Jan 31,
2011
Net Income $51.6 $70.1 $59.7 $119.2 $83.5 $35.0
Normalized Elements:
Foreign exchange (gain) loss on long-term debt 105.8 123.9 96.4 (3.6) 1.8 (41.1)
Increase in fair value of common shares - - 19.6 11.0 9.0 8.8
Restructuring and related costs (reversal) [1] 4.6 8.3 0.9 26.0 - 3.9
Impairment charge (reversal) [1] 70.3 - (0.3) 7.1 - -
(Gain) reversal from insurance recovery [1] - 1.4 (11.0) - - -
Pension plan past service costs [1] - - - - - 28.8
Other elements [1] (7.5) (6.6) 2.1 (2.9) (7.5) 18.9
Income taxes adjustment (24.0) (0.9) 0.9 (10.1) 1.7 (8.3)
Normalized Net Income 200.8 196.2 168.3 146.7 88.5 46.0
Normalized income taxes expense 72.8 55.3 56.5 42.5 27.9 19.9
Financing costs 62.6 59.3 64.5 62.6 62.4 65.9
Financing income (2.4) (2.7) (2.5) (1.9) (11.7) (9.3)
Normalized depreciation expense 126.2 113.2 93.4 85.1 95.1 94.8
Normalized EBITDA $460.0 $421.3 $380.2 $335.0 $262.2 $217.3
[1] For more details on the nature of these normalized items, please refer to the Company’s Management Discussion and Analysis for the year ended January 31, 2016 dated March
17 2016, the year ended January 31 2015 dated March 26 2015, and the quarter ended April 30 2013 dated June 12 2013

19 Investor Presentation
December 2016