Embed Size (px)
Citation preview
GDP Growth. Brunei’s GDP grew by 0.6 percent, year-on-year, in 2007. This represented a slow down from 4.4 percent growth in 2006. From expenditure side, the growth was driven by investment and government consumption, but pulled down by external demand. From the sectoral side, the sharp contraction in energy production cut down growth. However, strong growth of the non-energy sector assured the economy was in positive albeit modest growth. Public Finance. Brunei Darussalam continued to record another year of fiscal surplus, amounting to around BND 3 billion, from BND4.3 billion recorded in 2006. The lower surplus was due to a compression in export receipts amid higher import bills. External Demand. In 2007, Brunei enjoyed a trade surplus of around BND 8.4 billion. Of Brunei’s top ten trading partners, Japan and Indonesia have remained the dominant export markets and the biggest contribu-tors to Brunei’s foreign exchange earnings. Oil and gas contributes 96.2 percent of total exports, with 60 percent of the total going to Japan and Indonesia. Inflation rate in 2007 was 0.3 percent, year-on-year. Deflation in the first quarter of 2007 was offset by high inflation in the fourth quarter of the year. The increase in the prices of Miscellaneous Goods and Services, Food and Beverages, and Medical Health were offset by a decline in the prices of Communication, Clothing and Footwear, Housing and Utilities, and Recreation & Entertainment. Prices in other group of commodities remained broadly stable. Economic outlook. A higher level of capital spending driven by higher implementation rate of RKN pro-jects, continued progress in the methanol plant and Sungai Liang Industrial Park (SPARK) projects, and rela-tively buoyant construction activities are expected to drive growth in 2008. However, continued decline in oil production amidst higher cost in the energy sector are expected to slow down growth. However, the non-oil sector particularly the services and construction sectors are expected to keep up its current growth momen-tum. Overall, GDP growth in 2008 is expected to be between 0.5 to 1.0 percent. In 2008 there will be upward pressure in prices, in line with global inflation. Inflation is forecasted at between 1-2 percent, year-on-year. Brunei will continue to enjoy surplus in the current and the fiscal accounts.
Highlights in this issue
Brunei Economic Bulletin Editorial Team Editors • Director General, JPKE • Economic Expert, JPKE • Directors, JPKE • Assistant Directors, JPKE • Md Azry @Ben Hj Tahir
BRUNEI ECONOMIC BULLETIN
May 2008 Volume 5 - 2007 - Special Edition
Contents:
Real Sector and Output
2
Public Finance 6
Consumer Price Index
8
External trade 11
Oil and Gas 14
Outlook 16
Special Article: Long Term Development Plan
17
Special Article: Growth Decomposition Analysis
19
Special Article: Jobs in Demand
20
Writers / Contributors • Hjh Amimah OKSW Hj Abdullah • Dk Hjh Siti Nirmala Pg Hj Mohammad • Zureidah Hj Abit • Asnawi Faisal Hj Kamis • Pg Metussin Pg Hj Tuah • Md Munawir Shazali Hj Md Idris • Dk Norhanidah Pg Hj Masshor • Ruzanna Hj A Buntar
DEPARTMENT OF ECONOMIC PLANNING AND DEVELOPMENT
PRIME MINISTER'S OFFICE
BRUNEI DARUSSALAM ECONOMIC REVIEW OUTLOOK AND RECENT ECONOMIC DEVELOPMENTS
• Hjh Mariah Hj Yahya • Hj Alias Hj Mohamad • Awang Gemok Hj Ghani
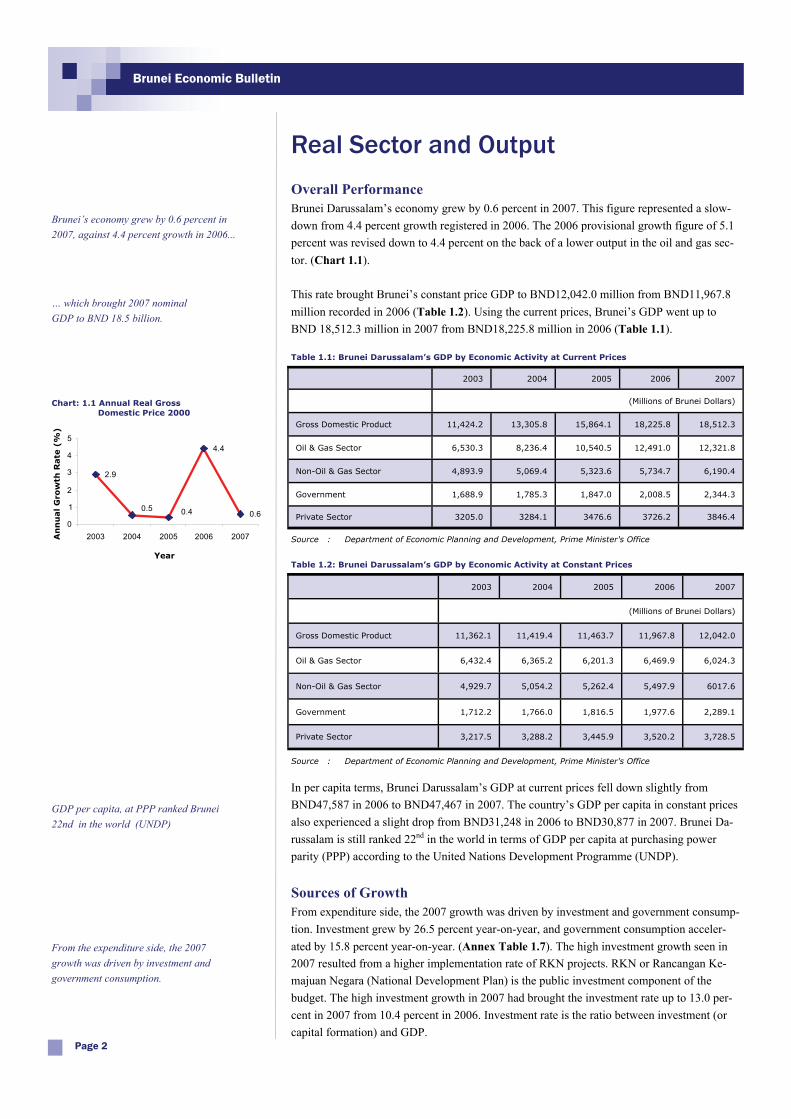
Overall Performance Brunei Darussalam’s economy grew by 0.6 percent in 2007. This figure represented a slow-down from 4.4 percent growth registered in 2006. The 2006 provisional growth figure of 5.1 percent was revised down to 4.4 percent on the back of a lower output in the oil and gas sec-tor. (Chart 1.1). This rate brought Brunei’s constant price GDP to BND12,042.0 million from BND11,967.8 million recorded in 2006 (Table 1.2). Using the current prices, Brunei’s GDP went up to BND 18,512.3 million in 2007 from BND18,225.8 million in 2006 (Table 1.1).
In per capita terms, Brunei Darussalam’s GDP at current prices fell down slightly from BND47,587 in 2006 to BND47,467 in 2007. The country’s GDP per capita in constant prices also experienced a slight drop from BND31,248 in 2006 to BND30,877 in 2007. Brunei Da-russalam is still ranked 22nd in the world in terms of GDP per capita at purchasing power parity (PPP) according to the United Nations Development Programme (UNDP).
Sources of Growth From expenditure side, the 2007 growth was driven by investment and government consump-tion. Investment grew by 26.5 percent year-on-year, and government consumption acceler-ated by 15.8 percent year-on-year. (Annex Table 1.7). The high investment growth seen in 2007 resulted from a higher implementation rate of RKN projects. RKN or Rancangan Ke-majuan Negara (National Development Plan) is the public investment component of the budget. The high investment growth in 2007 had brought the investment rate up to 13.0 per-cent in 2007 from 10.4 percent in 2006. Investment rate is the ratio between investment (or capital formation) and GDP.
Real Sector and Output
Page 2
Brunei’s economy grew by 0.6 percent in 2007, against 4.4 percent growth in 2006...
… which brought 2007 nominal GDP to BND 18.5 billion.
From the expenditure side, the 2007 growth was driven by investment and government consumption.
Brunei Economic Bulletin
2.9
4.4
0.60.40.5
0
1
2
3
4
5
2003 2004 2005 2006 2007
Chart: 1.1 Annual Real Gross Domestic Price 2000
An
nu
al G
row
th R
ate
(%
)
Year
2003 2004 2005 2006 2007
(Millions of Brunei Dollars)
Gross Domestic Product 11,362.1 11,419.4 11,463.7 11,967.8 12,042.0
Oil & Gas Sector 6,432.4 6,365.2 6,201.3 6,469.9 6,024.3
Non-Oil & Gas Sector 4,929.7 5,054.2 5,262.4 5,497.9 6017.6
Government 1,712.2 1,766.0 1,816.5 1,977.6 2,289.1
Private Sector 3,217.5 3,288.2 3,445.9 3,520.2 3,728.5
Source : Department of Economic Planning and Development, Prime Minister's Office
Table 1.2: Brunei Darussalam’s GDP by Economic Activity at Constant Prices
2003 2004 2005 2006 2007
(Millions of Brunei Dollars)
Gross Domestic Product 11,424.2 13,305.8 15,864.1 18,225.8 18,512.3
Oil & Gas Sector 6,530.3 8,236.4 10,540.5 12,491.0 12,321.8
Non-Oil & Gas Sector 4,893.9 5,069.4 5,323.6 5,734.7 6,190.4
Government 1,688.9 1,785.3 1,847.0 2,008.5 2,344.3
Private Sector 3205.0 3284.1 3476.6 3726.2 3846.4
Source : Department of Economic Planning and Development, Prime Minister's Office
Table 1.1: Brunei Darussalam’s GDP by Economic Activity at Current Prices
GDP per capita, at PPP ranked Brunei 22nd in the world (UNDP)
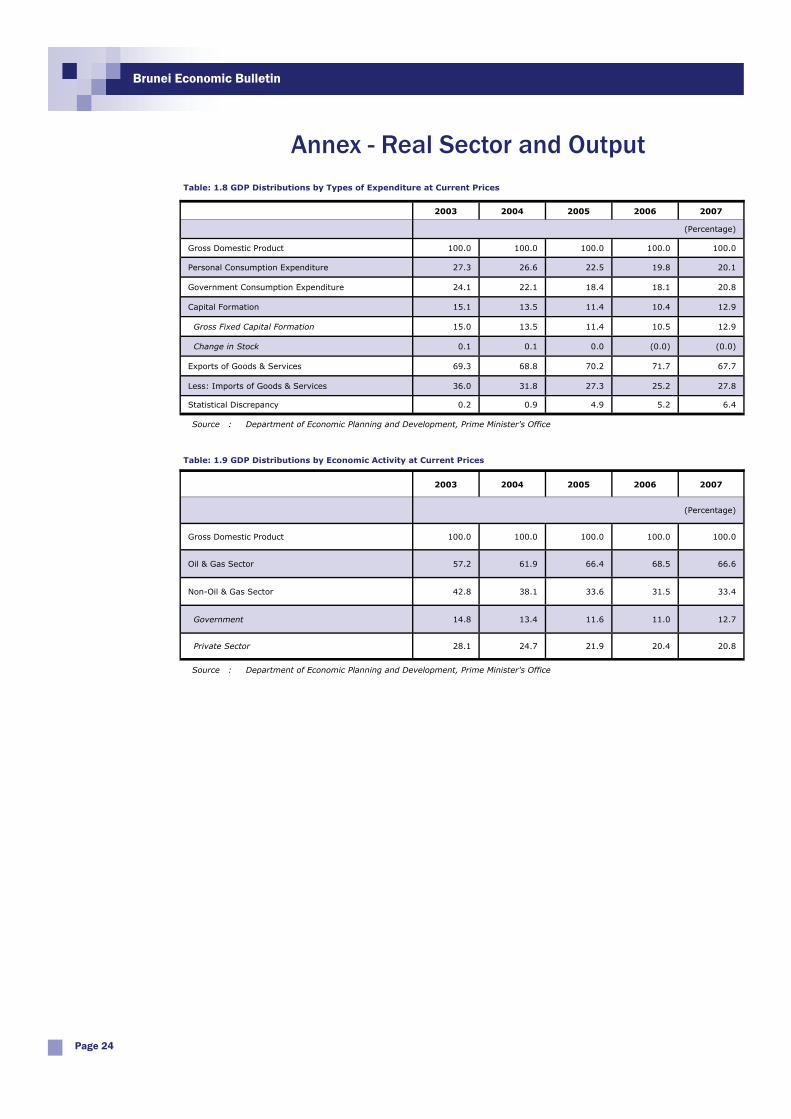
The increase in Government consumption, which accounted for 21 percent of the GDP, was attributed to a higher wages and salary on the back of the decision to move forward performance bonus to December from the usual payment date in January. (Annex Table 1.8). Personal consumption, accounted for 20 percent of nominal GDP, grew by 2.0 percent (Annex Table 1.7).It was external demand components that pulled down growth. Net ex-ports (which accounted for around 40 of the nominal GDP) contracted by 40.0 percent year-on-year due to the lower oil and gas production. (Annex Table 1.7).
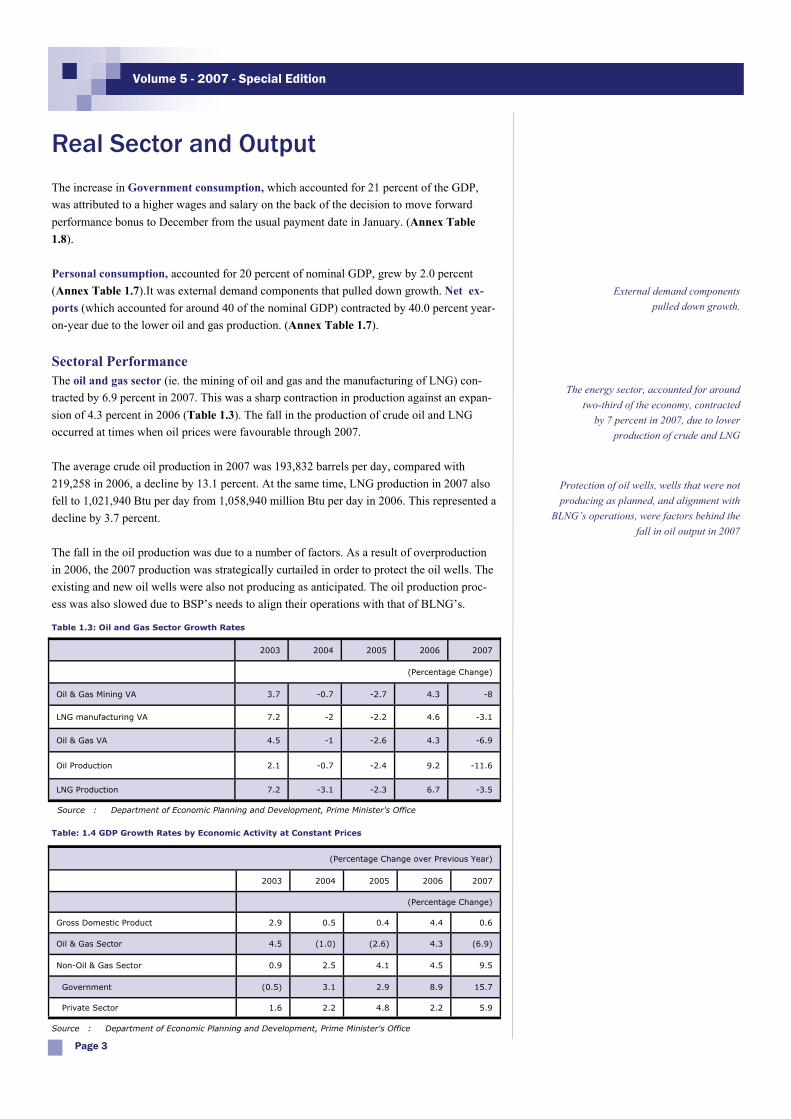
Sectoral Performance The oil and gas sector (ie. the mining of oil and gas and the manufacturing of LNG) con-tracted by 6.9 percent in 2007. This was a sharp contraction in production against an expan-sion of 4.3 percent in 2006 (Table 1.3). The fall in the production of crude oil and LNG occurred at times when oil prices were favourable through 2007. The average crude oil production in 2007 was 193,832 barrels per day, compared with 219,258 in 2006, a decline by 13.1 percent. At the same time, LNG production in 2007 also fell to 1,021,940 Btu per day from 1,058,940 million Btu per day in 2006. This represented a decline by 3.7 percent. The fall in the oil production was due to a number of factors. As a result of overproduction in 2006, the 2007 production was strategically curtailed in order to protect the oil wells. The existing and new oil wells were also not producing as anticipated. The oil production proc-ess was also slowed due to BSP’s needs to align their operations with that of BLNG’s.
Real Sector and Output
Page 3
Volume 5 - 2007 - Special Edition
External demand components pulled down growth.
The energy sector, accounted for around two-third of the economy, contracted
by 7 percent in 2007, due to lower production of crude and LNG
Protection of oil wells, wells that were not producing as planned, and alignment with
BLNG’s operations, were factors behind the fall in oil output in 2007
2003 2004 2005 2006 2007
(Percentage Change)
Oil & Gas Mining VA 3.7 -0.7 -2.7 4.3 -8
LNG manufacturing VA 7.2 -2 -2.2 4.6 -3.1
Oil & Gas VA 4.5 -1 -2.6 4.3 -6.9
Oil Production 2.1 -0.7 -2.4 9.2 -11.6
LNG Production 7.2 -3.1 -2.3 6.7 -3.5
Source : Department of Economic Planning and Development, Prime Minister's Office
Table 1.3: Oil and Gas Sector Growth Rates
(Percentage Change over Previous Year)
2003 2004 2005 2006 2007
(Percentage Change)
Gross Domestic Product 2.9 0.5 0.4 4.4 0.6
Oil & Gas Sector 4.5 (1.0) (2.6) 4.3 (6.9)
Non-Oil & Gas Sector 0.9 2.5 4.1 4.5 9.5
Government (0.5) 3.1 2.9 8.9 15.7
Private Sector 1.6 2.2 4.8 2.2 5.9
Source : Department of Economic Planning and Development, Prime Minister's Office
Table: 1.4 GDP Growth Rates by Economic Activity at Constant Prices
The oil and gas sector still contributed a high 66.6 percent of the GDP. The non-oil sector which comprise of the government and the private sector, contributed to 12.7 percent and 20.8 percent, respectively (Annex Table 1.9). The improved performance of the non-oil and gas sectors (particularly the private non-oil and gas and the government sector) had shielded the economy from contracting. The private non-oil sector continued to grow in 2007 rising by 5.9 percent year-on-year (Table 1.4), with the sources of growth occurred almost across the board. Vegetables, fruits & other agriculture production sector grew by 4.8 percent in 2007, a jump from the negative growth of 12.8 percent suffered in 2006 augmented by the increase in the production of cut flowers, fruits and ornamental horticultures. The Livestock and poultry sector also grew, albeit more mildly, by 3.0 percent in 2007, compared to the higher 12.6 percent growth recorded in 2006. The increase productions of cattle and broiler chicken were the main factors in that growth. The Forestry sector experienced a contraction of 8.5 percent in 2007, from a 1.0 percent growth in 2006. An increase in the production of timber (by around 9 percent) was offset by a sharp contraction in the production of bakau poles (by around 34 percent). The Fishery sector recorded negative growths in both 2006 and 2007. This sector contracted by 23.8 percent in 2006 and continued to decline by 16.0 percent in 2007. The small scale fishermen was the main contributing factor to the decline in 2007. In 2006, it was the aqua-culture industry, specifically fish in cages and fresh water fish, that contributed to growth. The non-oil and gas manufacturing activities continued to contract in 2007, albeit at a smaller negative growth rate of 2.9 percent, compared to a contraction of 19.0 percent in 2006. The poor performance in 2006 was mainly attributed to the reduction in the Manufacture of Wearing Apparel & Textile sector (by 22.2 percent). In 2007, this sector expanded by 1.5 percent. However, this growth was dragged down by a decline in the Other Manufacturing sector, which fell by 9.9 percent. Other Manufacturing sector included sub sectors such as Bakeries and Food Processing. Although there were some improvements from the 2006 negative growth of 13.3 percent, it was not enough for the Non-Oil and Gas Manufacturing related sector to record a positive growth. The Electricity & Water sector continued to improve in 2007. This sector grew by 2.7 per-cent, compared to a growth of 0.1 percent in 2006 mainly caused by the increase production and consumption of both electricity and water. The Construction sector grew by 10.9 percent in 2007 after shrinking by 3.7 percent in 2006 due to the rise in construction-related activities. The Wholesale & Retail sector continued to grow in 2007 recording 11.9 percent increase. This represented a jump from 2.6 percent growth in 2006. Since personal consumption growth was only 2.0 percent, the high output of the Wholesale & Retail sector might have been caused by the high increase in the government expenditure (Annex Table 1.7). The Transport and Communication related sectors expanded by 11.6 percent in 2007 mainly due to the growth generated by the Other Transport Services sector. This sector was the
Real Sector and Output
Page 4
Brunei Economic Bulletin
The non-energy sector, accounted for another one-third of GDP, and growing by 9.5 percent, shielded the economy from contracting in 2007
The broad Agricultural sector, consisting of Vegetables, Fruits, Livestock, Poultry, Forestry, Fishery, experienced a drop in output
Non-Oil and Gas Manufacturing sector contracted
Construction sector grew
Wholesale and Retail sector grew quite strongly ...
best performing sector in 2006 and 2007 with impressive growths of 67.9 and 60.7 percent respectively. The Water Transport sector also recorded two consecutive growths of 7.7 and 13.5 percent in 2006 and 2007 respectively. In contrast, the Air transport and Communi-cation sectors both recorded successive negative growths. The Air transport sector experi-enced negative growths of 26.7 percent and 0.8 percent in 2006 and 2007 respectively. This was due to the reduction in economic activities of the country’s air transport and travel re-lated companies. The Communication sector continued to contract in 2007, from a mar-ginal negative growth of 3.1 percent in 2006 to a negative growth of 3.3 percent in 2007. The Finance sector recorded a contraction of 1.2 percent in 2007, which was its first decline in five years, after generating a high growth of 14.0 percent in 2006. This was mainly attrib-uted to the drop in banking activities in 2007. The Real Estate and Ownership of Dwellings sector maintained its growth in 2007 with 2.3 percent after a marginal growth of 0.3 percent in 2006. After recording a 3.6 percent growth in 2006, the Hotels and Restaurants sector fell by 12.4 percent in 2007. The restaurant business did not experience a good year in 2007. The Business Services sector enjoyed two successive growths of 15.2 and 14.6 percent in 2006 and 2007 respectively. This was mainly driven by the growth generated by construc-tion-related companies such as architectural, engineering and consultant firms. The private services related sector experienced a decline of 7.6 percent in 2007 after gener-ating a growth of 3.7 percent in 2006. The double-digit contraction in the Private Health & Education sector (dropping by 20.4 percent), against a 1.9 percent expansion in 2006, being the main factor. In contrast, the Other Private Services sector grew by 13.0 percent in 2007, against 10.2 percent growth in 2006. Meanwhile, the Domestic Services sector regis-tered positive growths of 1.3 and 0.6 percent in 2006 and 2007, respectively. This sector was pulled down mainly by the Private Health sector.
Real Sector and Output
Page 5
Volume 5 - 2007 - Special Edition
… likewise the Transport and Communication related sectors
Finance sector, however, contracted
Hotels and Restaurants sector fell in 2007
Private Services related sectors also declined in 2007
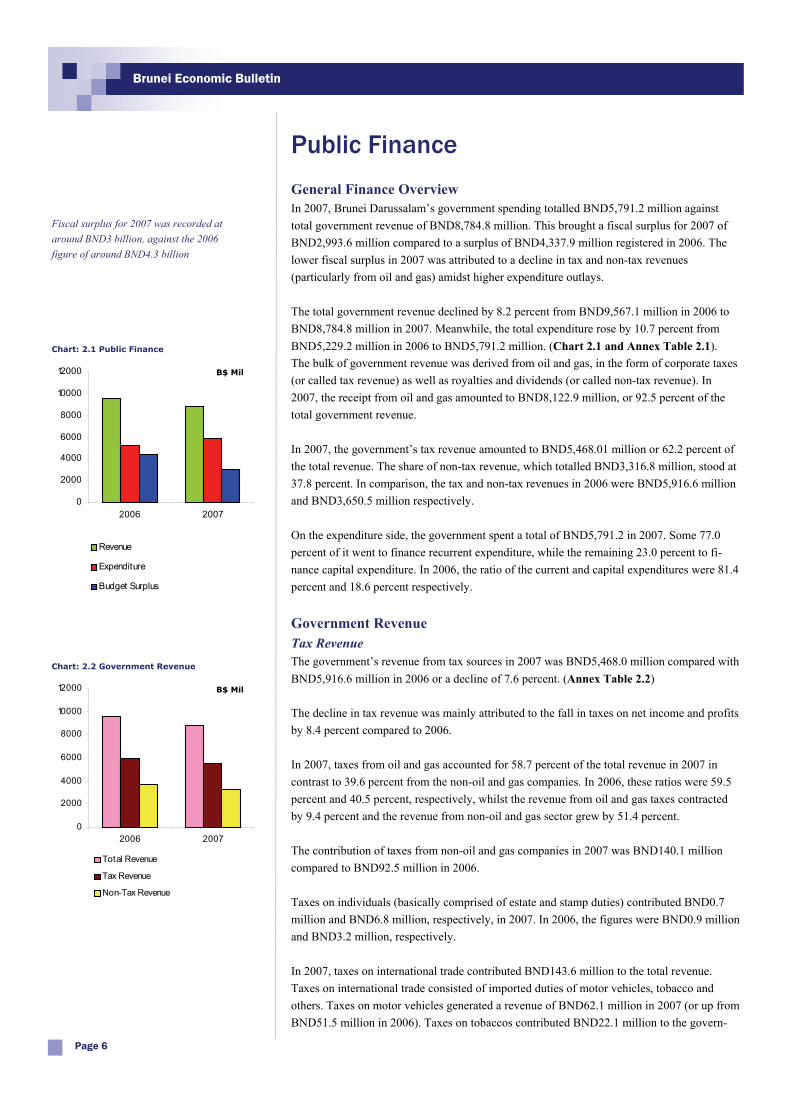
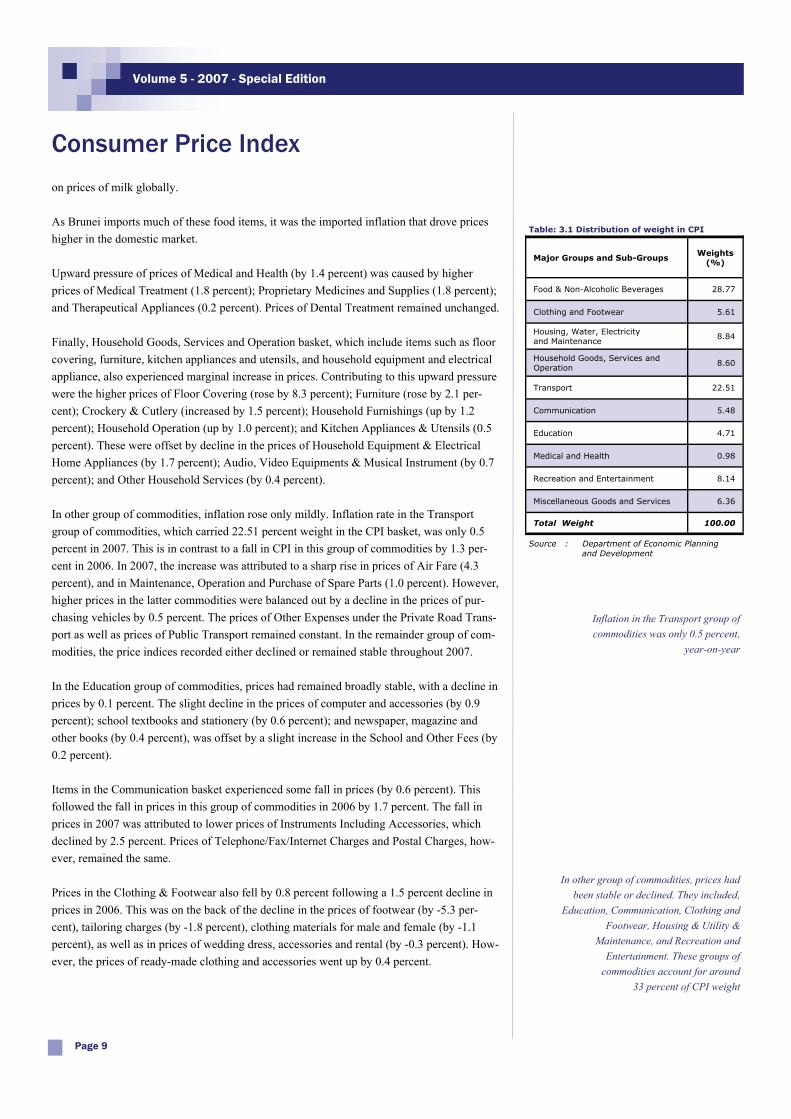
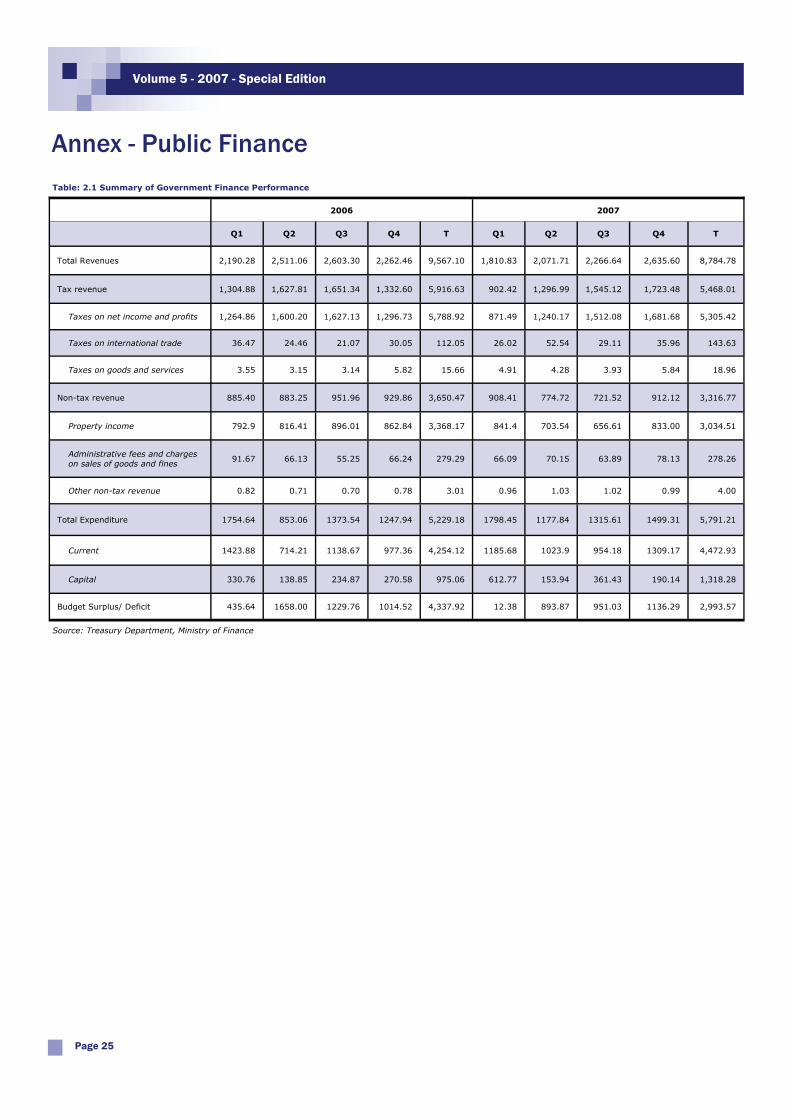
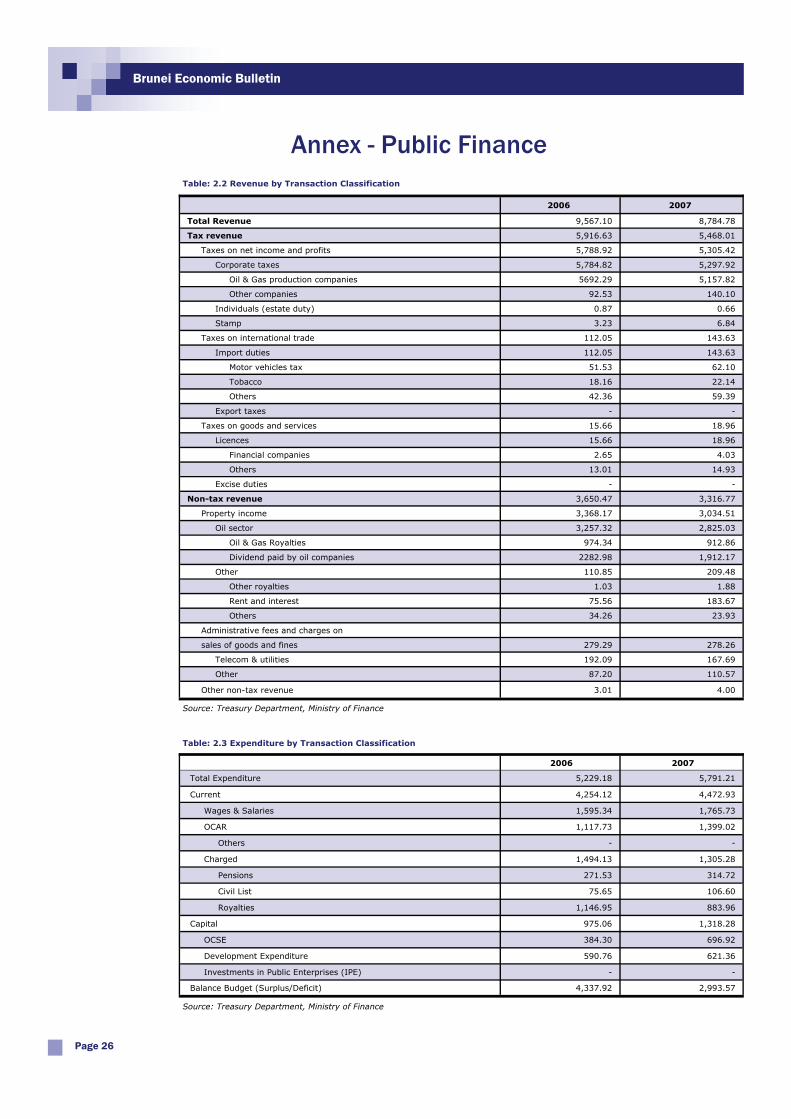
General Finance Overview In 2007, Brunei Darussalam’s government spending totalled BND5,791.2 million against total government revenue of BND8,784.8 million. This brought a fiscal surplus for 2007 of BND2,993.6 million compared to a surplus of BND4,337.9 million registered in 2006. The lower fiscal surplus in 2007 was attributed to a decline in tax and non-tax revenues (particularly from oil and gas) amidst higher expenditure outlays. The total government revenue declined by 8.2 percent from BND9,567.1 million in 2006 to BND8,784.8 million in 2007. Meanwhile, the total expenditure rose by 10.7 percent from BND5,229.2 million in 2006 to BND5,791.2 million. (Chart 2.1 and Annex Table 2.1). The bulk of government revenue was derived from oil and gas, in the form of corporate taxes (or called tax revenue) as well as royalties and dividends (or called non-tax revenue). In 2007, the receipt from oil and gas amounted to BND8,122.9 million, or 92.5 percent of the total government revenue. In 2007, the government’s tax revenue amounted to BND5,468.01 million or 62.2 percent of the total revenue. The share of non-tax revenue, which totalled BND3,316.8 million, stood at 37.8 percent. In comparison, the tax and non-tax revenues in 2006 were BND5,916.6 million and BND3,650.5 million respectively. On the expenditure side, the government spent a total of BND5,791.2 in 2007. Some 77.0 percent of it went to finance recurrent expenditure, while the remaining 23.0 percent to fi-nance capital expenditure. In 2006, the ratio of the current and capital expenditures were 81.4 percent and 18.6 percent respectively.
Government Revenue Tax Revenue The government’s revenue from tax sources in 2007 was BND5,468.0 million compared with BND5,916.6 million in 2006 or a decline of 7.6 percent. (Annex Table 2.2) The decline in tax revenue was mainly attributed to the fall in taxes on net income and profits by 8.4 percent compared to 2006. In 2007, taxes from oil and gas accounted for 58.7 percent of the total revenue in 2007 in contrast to 39.6 percent from the non-oil and gas companies. In 2006, these ratios were 59.5 percent and 40.5 percent, respectively, whilst the revenue from oil and gas taxes contracted by 9.4 percent and the revenue from non-oil and gas sector grew by 51.4 percent. The contribution of taxes from non-oil and gas companies in 2007 was BND140.1 million compared to BND92.5 million in 2006. Taxes on individuals (basically comprised of estate and stamp duties) contributed BND0.7 million and BND6.8 million, respectively, in 2007. In 2006, the figures were BND0.9 million and BND3.2 million, respectively. In 2007, taxes on international trade contributed BND143.6 million to the total revenue. Taxes on international trade consisted of imported duties of motor vehicles, tobacco and others. Taxes on motor vehicles generated a revenue of BND62.1 million in 2007 (or up from BND51.5 million in 2006). Taxes on tobaccos contributed BND22.1 million to the govern-
Public Finance
Page 6
Brunei Economic Bulletin
Fiscal surplus for 2007 was recorded at around BND3 billion, against the 2006 figure of around BND4.3 billion
0
2000
4000
6000
8000
10000
12000
2006 2007
Revenue
Expenditure
Budget Surplus
B$ Mil
Chart: 2.1 Public Finance
0
2000
4000
6000
8000
10000
12000
2006 2007
Total Revenue
Tax Revenue
Non-Tax Revenue
Chart: 2.2 Government Revenue
B$ Mil

ment coffers (compared with BND18.2 million in 2006). Meanwhile, revenue from interna-tional trade taxes imposed on other goods went up to BND59.4 million in 2007 from BND42.4 million in 2006. Taxes on Goods and Services, from the issuance of licences, contributed BND18.9 million to the total revenue. As of end 2007, Brunei’s tax ratio (which is the ratio between tax reve-nue and GDP) stood at 29.5 percent against 32.5 percent in 2006. (Chart 2.3)
Non-Tax Revenue The revenue from non-tax sources declined by 9.1 percent from BND3,605.5 million in 2006 to BND3,316.8 million in 2007. In 2007, the non-tax revenue accounted for almost 38 percent of the total revenue. The reve-nue came largely from property tax which in 2007 generated BND3,034.5 million, oil and gas-related property taxes generated BND2,825.0 million and the remainder BND23.9 mil-lion came from other property. The non-tax revenue from the administrative fees and charges on sales of goods and fines contributed BND278.3 million. Such fees and charges comprised of revenues from telecom-munications and utilities and others.
Total Expenditure Current Expenditure
In 2007, the current expenditure was BND4,472.9 million compared with the 2006 figure of BND4,254.1 million. The increase in the current expenditure was mainly brought about by an increase in wages and salaries. The Other Charges Annually Recurrent (OCAR) spending component also rose by 25.2 percent from BND1,117,7 million to BND1,399.0 million. However, Charged Expenditures component, which comprised of pensions, civil lists and royalties were down by 12.6 percent from BND1,494.1 million to BND1,305.3 million. Capital Expenditure The government’s capital expenditure, as a whole, rose by 35.2 percent in 2007 to BND1,318.3 million. Such an increase was attributed to the increase in the development expenditure which went up by 5.2 percent from BND590.8 million in 2006 to BND621.4 million in 2007. Other Current Special Expenditures (OCSE) spending component also rose significantly from BND384.3 million in 2006 to BND696.9 million in 2007.
Fiscal Balance 2003 - 2007 The continued fiscal surplus enjoyed by the government so far had brought the cumulative five years (2003 - 2007) surplus of BND14.2 billion.
Public Finance
Page 7
Volume 5 - 2007 - Special Edition
In 2007, Brunei tax ratio stood at 29.5 percent
Chart 2.3 Tax Ratio 32.6
31.3 30.531.6
19.6
30.932.5
29.5
0
5
10
15
20
25
30
35
2000 2001 2002 2003 2004 2005 2006 2007
perc
en
tag
e
The increase in capital expenditure was attributed to the rise in the implementation
of RKN projects as well as due to higher OCSE spending
Chart: 2.4 Expenditure
0
1000
2000
3000
4000
5000
6000
7000
2006 2007
Total Exp.
Current
Capital
B$ Mil
Cumulative 5 years fiscal surplus is recorded at around BND12.8 billion
100.3
101.2
102.3102.5
102.8
0.3
0.9
1.1
0.2
0.3
99.0
99.5
100.0
100.5
101.0
101.5
102.0
102.5
103.0
2003 2004 2005 2006 2007
Y ear
0.0
0.2
0.4
0.6
0.8
1.0
1.2
ConsumerPrice Index
Inf lat ion
Infl
ati
on
Rate
Consumer Price Index
Page 8
Brunei Economic Bulletin
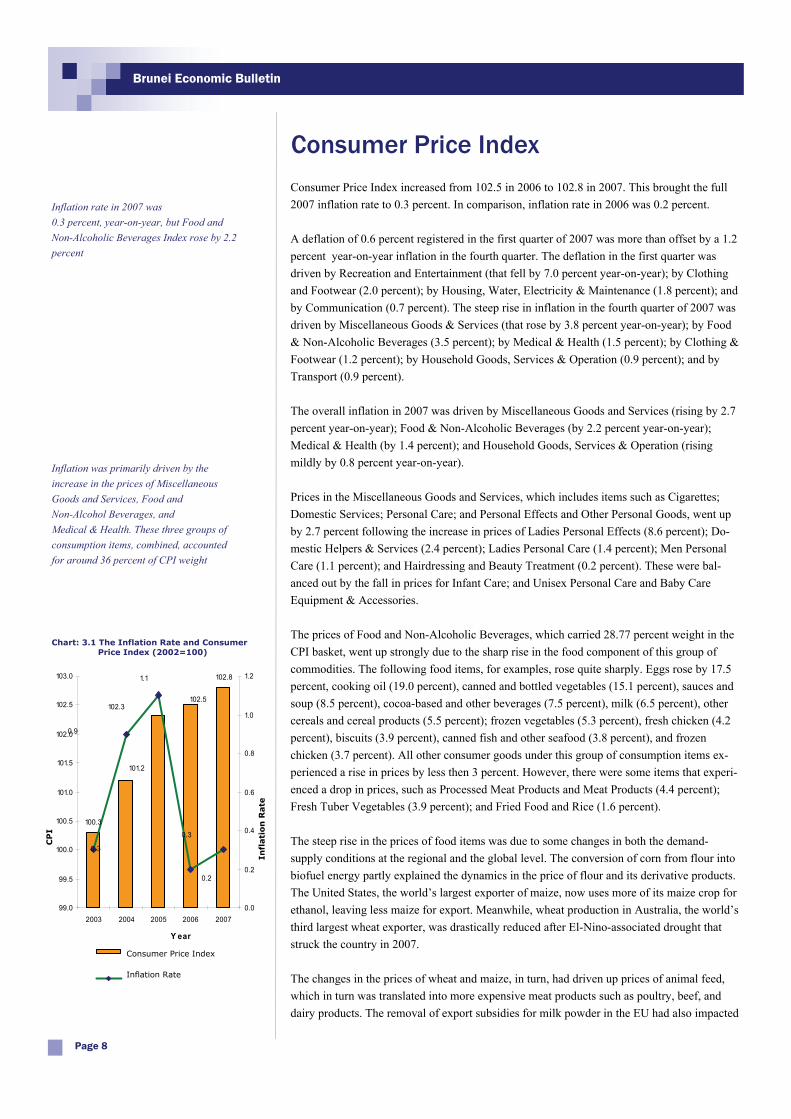
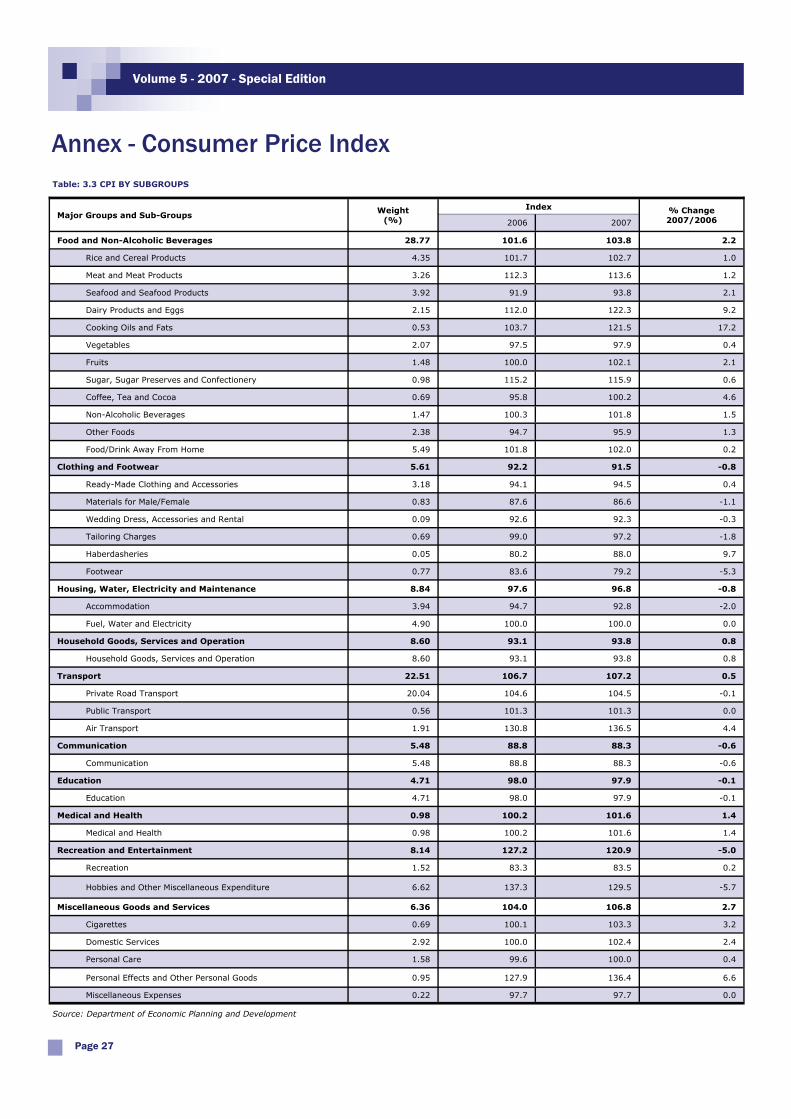
Consumer Price Index increased from 102.5 in 2006 to 102.8 in 2007. This brought the full 2007 inflation rate to 0.3 percent. In comparison, inflation rate in 2006 was 0.2 percent. A deflation of 0.6 percent registered in the first quarter of 2007 was more than offset by a 1.2 percent year-on-year inflation in the fourth quarter. The deflation in the first quarter was driven by Recreation and Entertainment (that fell by 7.0 percent year-on-year); by Clothing and Footwear (2.0 percent); by Housing, Water, Electricity & Maintenance (1.8 percent); and by Communication (0.7 percent). The steep rise in inflation in the fourth quarter of 2007 was driven by Miscellaneous Goods & Services (that rose by 3.8 percent year-on-year); by Food & Non-Alcoholic Beverages (3.5 percent); by Medical & Health (1.5 percent); by Clothing & Footwear (1.2 percent); by Household Goods, Services & Operation (0.9 percent); and by Transport (0.9 percent). The overall inflation in 2007 was driven by Miscellaneous Goods and Services (rising by 2.7 percent year-on-year); Food & Non-Alcoholic Beverages (by 2.2 percent year-on-year); Medical & Health (by 1.4 percent); and Household Goods, Services & Operation (rising mildly by 0.8 percent year-on-year). Prices in the Miscellaneous Goods and Services, which includes items such as Cigarettes; Domestic Services; Personal Care; and Personal Effects and Other Personal Goods, went up by 2.7 percent following the increase in prices of Ladies Personal Effects (8.6 percent); Do-mestic Helpers & Services (2.4 percent); Ladies Personal Care (1.4 percent); Men Personal Care (1.1 percent); and Hairdressing and Beauty Treatment (0.2 percent). These were bal-anced out by the fall in prices for Infant Care; and Unisex Personal Care and Baby Care Equipment & Accessories. The prices of Food and Non-Alcoholic Beverages, which carried 28.77 percent weight in the CPI basket, went up strongly due to the sharp rise in the food component of this group of commodities. The following food items, for examples, rose quite sharply. Eggs rose by 17.5 percent, cooking oil (19.0 percent), canned and bottled vegetables (15.1 percent), sauces and soup (8.5 percent), cocoa-based and other beverages (7.5 percent), milk (6.5 percent), other cereals and cereal products (5.5 percent); frozen vegetables (5.3 percent), fresh chicken (4.2 percent), biscuits (3.9 percent), canned fish and other seafood (3.8 percent), and frozen chicken (3.7 percent). All other consumer goods under this group of consumption items ex-perienced a rise in prices by less then 3 percent. However, there were some items that experi-enced a drop in prices, such as Processed Meat Products and Meat Products (4.4 percent); Fresh Tuber Vegetables (3.9 percent); and Fried Food and Rice (1.6 percent). The steep rise in the prices of food items was due to some changes in both the demand-supply conditions at the regional and the global level. The conversion of corn from flour into biofuel energy partly explained the dynamics in the price of flour and its derivative products. The United States, the world’s largest exporter of maize, now uses more of its maize crop for ethanol, leaving less maize for export. Meanwhile, wheat production in Australia, the world’s third largest wheat exporter, was drastically reduced after El-Nino-associated drought that struck the country in 2007. The changes in the prices of wheat and maize, in turn, had driven up prices of animal feed, which in turn was translated into more expensive meat products such as poultry, beef, and dairy products. The removal of export subsidies for milk powder in the EU had also impacted
Chart: 3.1 The Inflation Rate and Consumer Price Index (2002=100)
Inflation rate in 2007 was 0.3 percent, year-on-year, but Food and Non-Alcoholic Beverages Index rose by 2.2 percent
Inflation was primarily driven by the increase in the prices of Miscellaneous Goods and Services, Food and Non-Alcohol Beverages, and Medical & Health. These three groups of consumption items, combined, accounted for around 36 percent of CPI weight
CP
I
Consumer Price Index
Inflation Rate
Consumer Price Index
Page 9
Volume 5 - 2007 - Special Edition
on prices of milk globally. As Brunei imports much of these food items, it was the imported inflation that drove prices higher in the domestic market. Upward pressure of prices of Medical and Health (by 1.4 percent) was caused by higher prices of Medical Treatment (1.8 percent); Proprietary Medicines and Supplies (1.8 percent); and Therapeutical Appliances (0.2 percent). Prices of Dental Treatment remained unchanged. Finally, Household Goods, Services and Operation basket, which include items such as floor covering, furniture, kitchen appliances and utensils, and household equipment and electrical appliance, also experienced marginal increase in prices. Contributing to this upward pressure were the higher prices of Floor Covering (rose by 8.3 percent); Furniture (rose by 2.1 per-cent); Crockery & Cutlery (increased by 1.5 percent); Household Furnishings (up by 1.2 percent); Household Operation (up by 1.0 percent); and Kitchen Appliances & Utensils (0.5 percent). These were offset by decline in the prices of Household Equipment & Electrical Home Appliances (by 1.7 percent); Audio, Video Equipments & Musical Instrument (by 0.7 percent); and Other Household Services (by 0.4 percent). In other group of commodities, inflation rose only mildly. Inflation rate in the Transport group of commodities, which carried 22.51 percent weight in the CPI basket, was only 0.5 percent in 2007. This is in contrast to a fall in CPI in this group of commodities by 1.3 per-cent in 2006. In 2007, the increase was attributed to a sharp rise in prices of Air Fare (4.3 percent), and in Maintenance, Operation and Purchase of Spare Parts (1.0 percent). However, higher prices in the latter commodities were balanced out by a decline in the prices of pur-chasing vehicles by 0.5 percent. The prices of Other Expenses under the Private Road Trans-port as well as prices of Public Transport remained constant. In the remainder group of com-modities, the price indices recorded either declined or remained stable throughout 2007. In the Education group of commodities, prices had remained broadly stable, with a decline in prices by 0.1 percent. The slight decline in the prices of computer and accessories (by 0.9 percent); school textbooks and stationery (by 0.6 percent); and newspaper, magazine and other books (by 0.4 percent), was offset by a slight increase in the School and Other Fees (by 0.2 percent). Items in the Communication basket experienced some fall in prices (by 0.6 percent). This followed the fall in prices in this group of commodities in 2006 by 1.7 percent. The fall in prices in 2007 was attributed to lower prices of Instruments Including Accessories, which declined by 2.5 percent. Prices of Telephone/Fax/Internet Charges and Postal Charges, how-ever, remained the same. Prices in the Clothing & Footwear also fell by 0.8 percent following a 1.5 percent decline in prices in 2006. This was on the back of the decline in the prices of footwear (by -5.3 per-cent), tailoring charges (by -1.8 percent), clothing materials for male and female (by -1.1 percent), as well as in prices of wedding dress, accessories and rental (by -0.3 percent). How-ever, the prices of ready-made clothing and accessories went up by 0.4 percent.
Major Groups and Sub-Groups Weights
(%)
Clothing and Footwear 5.61
Housing, Water, Electricity and Maintenance
8.84
Household Goods, Services and Operation 8.60
Transport 22.51
Communication 5.48
Education 4.71
Medical and Health 0.98
Recreation and Entertainment 8.14
Miscellaneous Goods and Services 6.36
Total Weight 100.00
Food & Non-Alcoholic Beverages 28.77
Table: 3.1 Distribution of weight in CPI
Source : Department of Economic Planning and Development
Inflation in the Transport group of commodities was only 0.5 percent,
year-on-year
In other group of commodities, prices had been stable or declined. They included,
Education, Communication, Clothing and Footwear, Housing & Utility &
Maintenance, and Recreation and Entertainment. These groups of
commodities account for around 33 percent of CPI weight
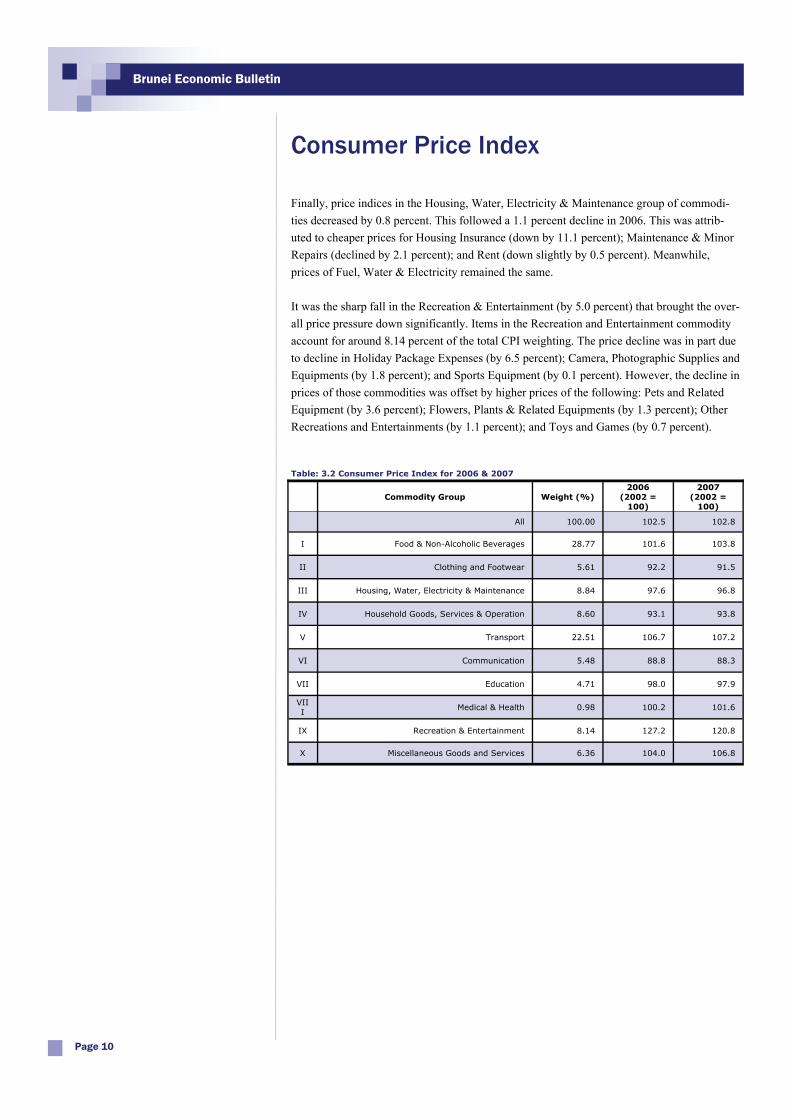
Finally, price indices in the Housing, Water, Electricity & Maintenance group of commodi-ties decreased by 0.8 percent. This followed a 1.1 percent decline in 2006. This was attrib-uted to cheaper prices for Housing Insurance (down by 11.1 percent); Maintenance & Minor Repairs (declined by 2.1 percent); and Rent (down slightly by 0.5 percent). Meanwhile, prices of Fuel, Water & Electricity remained the same. It was the sharp fall in the Recreation & Entertainment (by 5.0 percent) that brought the over-all price pressure down significantly. Items in the Recreation and Entertainment commodity account for around 8.14 percent of the total CPI weighting. The price decline was in part due to decline in Holiday Package Expenses (by 6.5 percent); Camera, Photographic Supplies and Equipments (by 1.8 percent); and Sports Equipment (by 0.1 percent). However, the decline in prices of those commodities was offset by higher prices of the following: Pets and Related Equipment (by 3.6 percent); Flowers, Plants & Related Equipments (by 1.3 percent); Other Recreations and Entertainments (by 1.1 percent); and Toys and Games (by 0.7 percent).
Commodity Group Weight (%) 2006
(2002 = 100)
2007 (2002 =
100)
All 100.00 102.5 102.8
I Food & Non-Alcoholic Beverages 28.77 101.6 103.8
II Clothing and Footwear 5.61 92.2 91.5
III Housing, Water, Electricity & Maintenance 8.84 97.6 96.8
IV Household Goods, Services & Operation 8.60 93.1 93.8
V Transport 22.51 106.7 107.2
VI Communication 5.48 88.8 88.3
VII Education 4.71 98.0 97.9
VIII
Medical & Health 0.98 100.2 101.6
IX Recreation & Entertainment 8.14 127.2 120.8
X Miscellaneous Goods and Services 6.36 104.0 106.8
Table: 3.2 Consumer Price Index for 2006 & 2007
Consumer Price Index
Page 10
Brunei Economic Bulletin
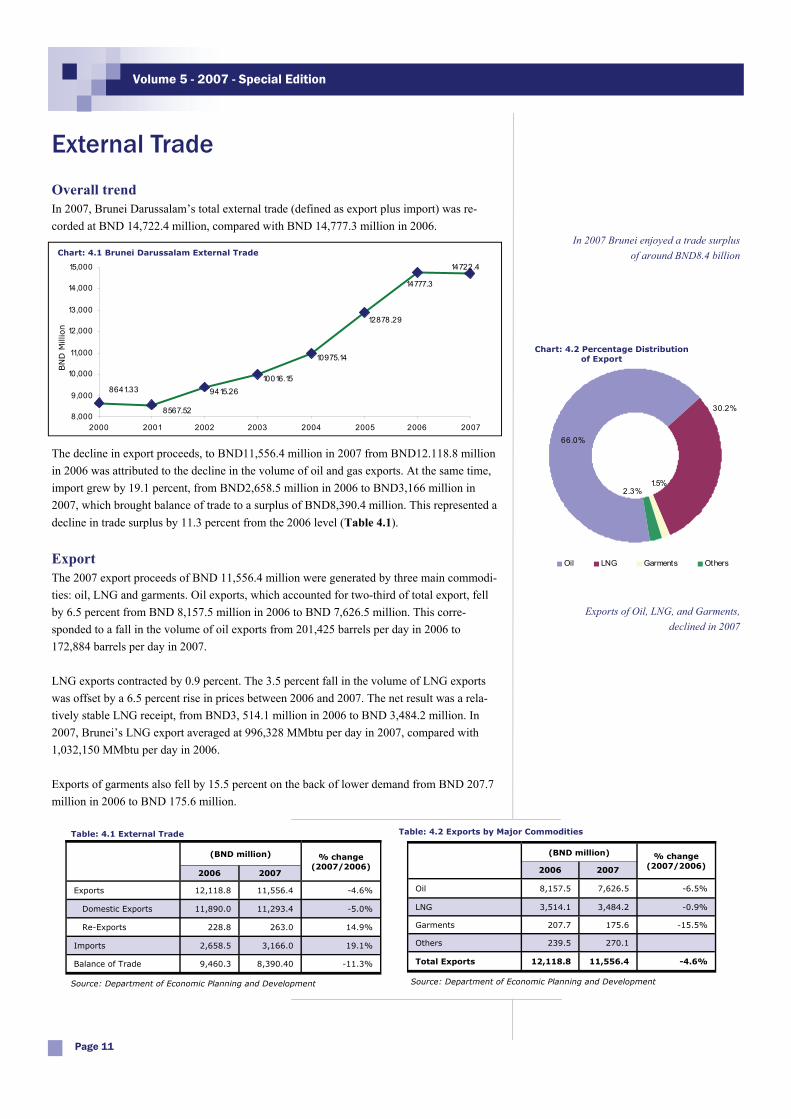
Overall trend In 2007, Brunei Darussalam’s total external trade (defined as export plus import) was re-corded at BND 14,722.4 million, compared with BND 14,777.3 million in 2006.
The decline in export proceeds, to BND11,556.4 million in 2007 from BND12.118.8 million in 2006 was attributed to the decline in the volume of oil and gas exports. At the same time, import grew by 19.1 percent, from BND2,658.5 million in 2006 to BND3,166 million in 2007, which brought balance of trade to a surplus of BND8,390.4 million. This represented a decline in trade surplus by 11.3 percent from the 2006 level (Table 4.1).
Export The 2007 export proceeds of BND 11,556.4 million were generated by three main commodi-ties: oil, LNG and garments. Oil exports, which accounted for two-third of total export, fell by 6.5 percent from BND 8,157.5 million in 2006 to BND 7,626.5 million. This corre-sponded to a fall in the volume of oil exports from 201,425 barrels per day in 2006 to 172,884 barrels per day in 2007. LNG exports contracted by 0.9 percent. The 3.5 percent fall in the volume of LNG exports was offset by a 6.5 percent rise in prices between 2006 and 2007. The net result was a rela-tively stable LNG receipt, from BND3, 514.1 million in 2006 to BND 3,484.2 million. In 2007, Brunei’s LNG export averaged at 996,328 MMbtu per day in 2007, compared with 1,032,150 MMbtu per day in 2006. Exports of garments also fell by 15.5 percent on the back of lower demand from BND 207.7 million in 2006 to BND 175.6 million.
External Trade
Page 11
Volume 5 - 2007 - Special Edition
In 2007 Brunei enjoyed a trade surplus of around BND8.4 billion
Exports of Oil, LNG, and Garments, declined in 2007
14722.4
14777.3
12878.29
10975.14
10016.159415.26
8567.52
8641.33
8,000
9,000
10,000
11,000
12,000
13,000
14,000
15,000
2000 2001 2002 2003 2004 2005 2006 2007
BN
D M
illio
n
Chart: 4.1 Brunei Darussalam External Trade
(BND million) % change (2007/2006)
2006 2007
Exports 12,118.8 11,556.4 -4.6%
Domestic Exports 11,890.0 11,293.4 -5.0%
Re-Exports 228.8 263.0 14.9%
Imports 2,658.5 3,166.0 19.1%
Balance of Trade 9,460.3 8,390.40 -11.3%
Table: 4.1 External Trade
(BND million) % change (2007/2006) 2006 2007
Oil 8,157.5 7,626.5 -6.5%
LNG 3,514.1 3,484.2 -0.9%
Garments 207.7 175.6 -15.5%
Others 239.5 270.1
Total Exports 12,118.8 11,556.4 -4.6%
Table: 4.2 Exports by Major Commodities
Source: Department of Economic Planning and Development Source: Department of Economic Planning and Development
1.5%2.3%
66.0%
30.2%
Oil LNG Garments Others
Chart: 4.2 Percentage Distribution of Export
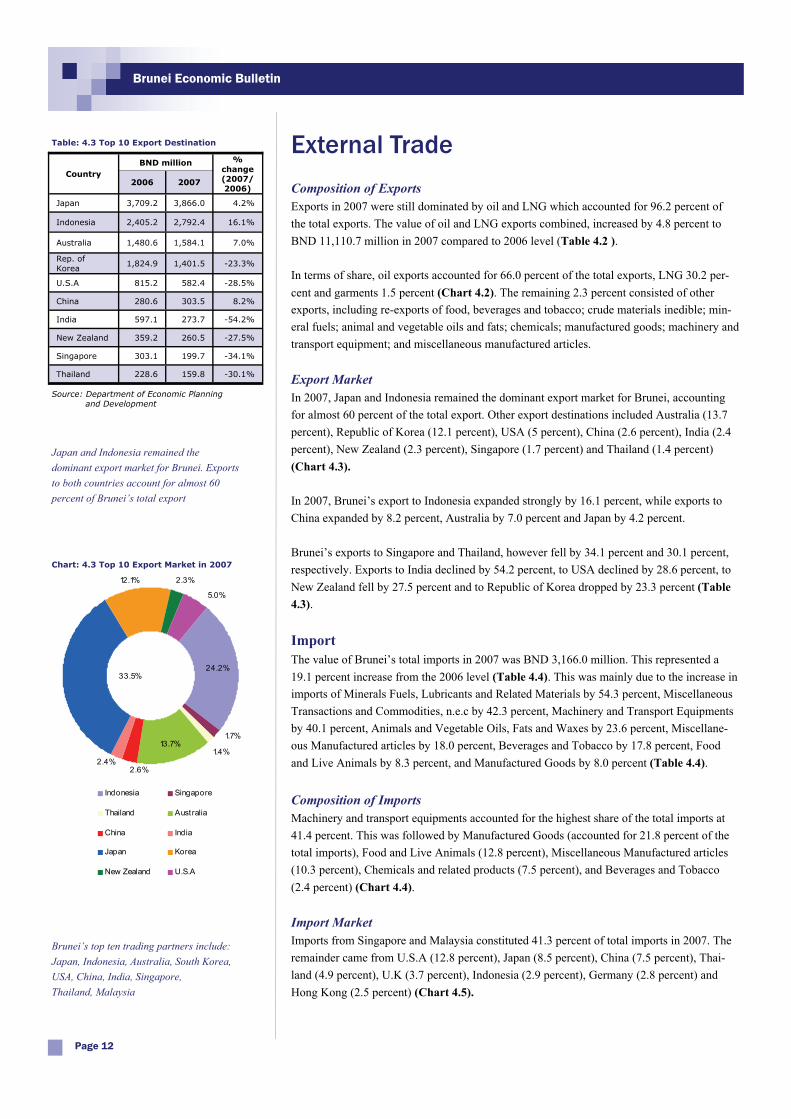
Composition of Exports Exports in 2007 were still dominated by oil and LNG which accounted for 96.2 percent of the total exports. The value of oil and LNG exports combined, increased by 4.8 percent to BND 11,110.7 million in 2007 compared to 2006 level (Table 4.2 ). In terms of share, oil exports accounted for 66.0 percent of the total exports, LNG 30.2 per-cent and garments 1.5 percent (Chart 4.2). The remaining 2.3 percent consisted of other exports, including re-exports of food, beverages and tobacco; crude materials inedible; min-eral fuels; animal and vegetable oils and fats; chemicals; manufactured goods; machinery and transport equipment; and miscellaneous manufactured articles. Export Market In 2007, Japan and Indonesia remained the dominant export market for Brunei, accounting for almost 60 percent of the total export. Other export destinations included Australia (13.7 percent), Republic of Korea (12.1 percent), USA (5 percent), China (2.6 percent), India (2.4 percent), New Zealand (2.3 percent), Singapore (1.7 percent) and Thailand (1.4 percent) (Chart 4.3). In 2007, Brunei’s export to Indonesia expanded strongly by 16.1 percent, while exports to China expanded by 8.2 percent, Australia by 7.0 percent and Japan by 4.2 percent. Brunei’s exports to Singapore and Thailand, however fell by 34.1 percent and 30.1 percent, respectively. Exports to India declined by 54.2 percent, to USA declined by 28.6 percent, to New Zealand fell by 27.5 percent and to Republic of Korea dropped by 23.3 percent (Table 4.3).
Import The value of Brunei’s total imports in 2007 was BND 3,166.0 million. This represented a 19.1 percent increase from the 2006 level (Table 4.4). This was mainly due to the increase in imports of Minerals Fuels, Lubricants and Related Materials by 54.3 percent, Miscellaneous Transactions and Commodities, n.e.c by 42.3 percent, Machinery and Transport Equipments by 40.1 percent, Animals and Vegetable Oils, Fats and Waxes by 23.6 percent, Miscellane-ous Manufactured articles by 18.0 percent, Beverages and Tobacco by 17.8 percent, Food and Live Animals by 8.3 percent, and Manufactured Goods by 8.0 percent (Table 4.4). Composition of Imports Machinery and transport equipments accounted for the highest share of the total imports at 41.4 percent. This was followed by Manufactured Goods (accounted for 21.8 percent of the total imports), Food and Live Animals (12.8 percent), Miscellaneous Manufactured articles (10.3 percent), Chemicals and related products (7.5 percent), and Beverages and Tobacco (2.4 percent) (Chart 4.4). Import Market Imports from Singapore and Malaysia constituted 41.3 percent of total imports in 2007. The remainder came from U.S.A (12.8 percent), Japan (8.5 percent), China (7.5 percent), Thai-land (4.9 percent), U.K (3.7 percent), Indonesia (2.9 percent), Germany (2.8 percent) and Hong Kong (2.5 percent) (Chart 4.5).
External Trade
Page 12
Brunei Economic Bulletin
Japan and Indonesia remained the dominant export market for Brunei. Exports to both countries account for almost 60 percent of Brunei’s total export
BND million % change (2007/ 2006)
2006 2007
Japan 3,709.2 3,866.0 4.2%
Indonesia 2,405.2 2,792.4 16.1%
Australia 1,480.6 1,584.1 7.0%
Rep. of Korea
1,824.9 1,401.5 -23.3%
U.S.A 815.2 582.4 -28.5%
China 280.6 303.5 8.2%
India 597.1 273.7 -54.2%
New Zealand 359.2 260.5 -27.5%
Singapore 303.1 199.7 -34.1%
Thailand 228.6 159.8 -30.1%
Country
Table: 4.3 Top 10 Export Destination
Source: Department of Economic Planning and Development
Chart: 4.3 Top 10 Export Market in 2007
24.2%33.5%
2.3%
5.0%
1.7%
1.4%13.7%
2.6%2.4%
12.1%
Indonesia Singapore
Thailand Australia
China India
Japan Korea
New Zealand U.S.A
Brunei’s top ten trading partners include: Japan, Indonesia, Australia, South Korea, USA, China, India, Singapore, Thailand, Malaysia
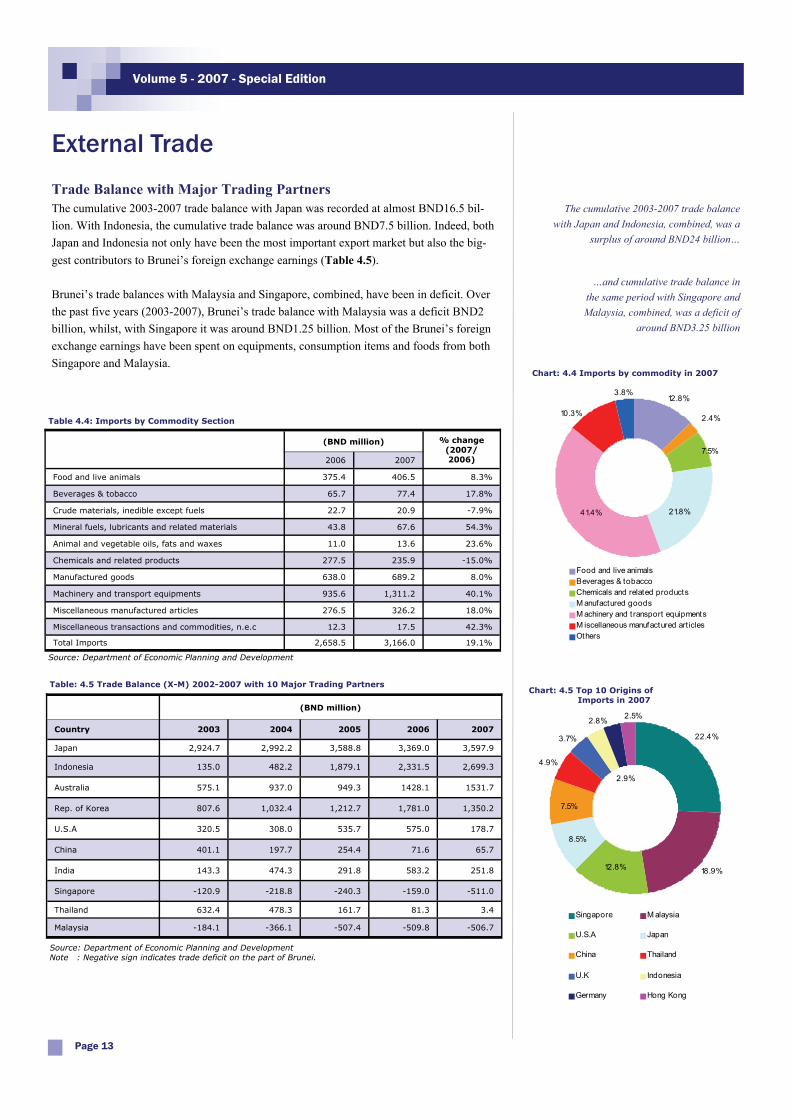
Trade Balance with Major Trading Partners The cumulative 2003-2007 trade balance with Japan was recorded at almost BND16.5 bil-lion. With Indonesia, the cumulative trade balance was around BND7.5 billion. Indeed, both Japan and Indonesia not only have been the most important export market but also the big-gest contributors to Brunei’s foreign exchange earnings (Table 4.5). Brunei’s trade balances with Malaysia and Singapore, combined, have been in deficit. Over the past five years (2003-2007), Brunei’s trade balance with Malaysia was a deficit BND2 billion, whilst, with Singapore it was around BND1.25 billion. Most of the Brunei’s foreign exchange earnings have been spent on equipments, consumption items and foods from both Singapore and Malaysia.
External Trade
Page 13
Volume 5 - 2007 - Special Edition
(BND million) % change (2007/ 2006) 2006 2007
Food and live animals 375.4 406.5 8.3% Beverages & tobacco 65.7 77.4 17.8% Crude materials, inedible except fuels 22.7 20.9 -7.9% Mineral fuels, lubricants and related materials 43.8 67.6 54.3% Animal and vegetable oils, fats and waxes 11.0 13.6 23.6% Chemicals and related products 277.5 235.9 -15.0% Manufactured goods 638.0 689.2 8.0% Machinery and transport equipments 935.6 1,311.2 40.1% Miscellaneous manufactured articles 276.5 326.2 18.0% Miscellaneous transactions and commodities, n.e.c 12.3 17.5 42.3% Total Imports 2,658.5 3,166.0 19.1%
Table 4.4: Imports by Commodity Section
Source: Department of Economic Planning and Development
(BND million) Country 2003 2004 2005 2006 2007 Japan 2,924.7 2,992.2 3,588.8 3,369.0 3,597.9 Indonesia 135.0 482.2 1,879.1 2,331.5 2,699.3 Australia 575.1 937.0 949.3 1428.1 1531.7 Rep. of Korea 807.6 1,032.4 1,212.7 1,781.0 1,350.2 U.S.A 320.5 308.0 535.7 575.0 178.7 China 401.1 197.7 254.4 71.6 65.7 India 143.3 474.3 291.8 583.2 251.8 Singapore -120.9 -218.8 -240.3 -159.0 -511.0 Thailand 632.4 478.3 161.7 81.3 3.4 Malaysia -184.1 -366.1 -507.4 -509.8 -506.7
Table: 4.5 Trade Balance (X-M) 2002-2007 with 10 Major Trading Partners
Source: Department of Economic Planning and Development Note : Negative sign indicates trade deficit on the part of Brunei.
The cumulative 2003-2007 trade balance with Japan and Indonesia, combined, was a
surplus of around BND24 billion…
…and cumulative trade balance in the same period with Singapore and Malaysia, combined, was a deficit of
around BND3.25 billion
Chart: 4.4 Imports by commodity in 2007
41.4%
10.3%
3.8%12.8%
21.8%
7.5%
2.4%
Food and live animalsBeverages & tobaccoChemicals and related productsM anufactured goodsM achinery and t ransport equipmentsM iscellaneous manufactured art iclesOthers
Chart: 4.5 Top 10 Origins of Imports in 2007
3.7%
2.9%
2.8% 2.5%
4.9%
7.5%
8.5%
18.9%
22.4%
12.8%
Singapore M alaysia
U.S.A Japan
China Thailand
U.K Indonesia
Germany Hong Kong
Crude Oil Price Brunei Darussalam’s Average Weighted Crude Oil Price Index (AWCOPI) for the year 2007 stood at 266.3 representing an increase of 13.8 percent from the 2006 level (of 234.0). Beginning with a low point in January 2007, crude oil prices started to rise steadily reaching the highest point since the construction of the index in 2000 (Chart 5.1 and Annex Table 5.1) In Q1 2007 the AWCOPI was recorded at 218.9. This was when the world average price of crude was US$48.2 per barrel (January 2007). The unusually warm weather in the Atlantic Basin and also a general downturn in the commodity markets caused the price of oil to de-press somewhat. However, in February, a cold snap occurred, helping the oil price to rebound to an average of US$60 per barrel. Other factors contributing to the rise include signs of tighter OPEC supply in response to the weaker crude market in January and increased geopolitical tensions in Nigeria. In March, OPEC production cutbacks despite peak seasonal refinery maintenance and several unplanned downstream outages had helped propel oil prices to rise above US$60 per barrel (with a quarter high of US$61.8 per barrel). Unfounded rumours of a clash be-tween Iranian and US troops also contributed to a the spike in crude prices. In Q2 2007’s AWCOPI increased further by 18.0 percent to 258.2 from the Q1 2007 level of 218.9. Prices traded sideways in April and early to mid May, supported by investor sentiment regarding the growing political tensions surrounding the Iran nuclear programme and a tight Atlantic Basin gasoline market. In late May, prices started to drop slightly to US$61.6 per barrel following a general trend in the commodity markets which reflected broader economic concerns. Markets tightened in June due to stronger demand from refineries preparing for the peak demand in summer. In Q3 2007, the AWCOPI rose slightly to 260.6 from 258.2 in the previous quarter (a 0.9 percent increase). Prices continued to rise in July backed by curbed OPEC supply despite strong summer refinery demand. Geopolitical tensions were less prominent in July. In Au-gust, prices fell sharply as the market corrected itself after the July run. However, price vola-tility had increased due to high crude prices and refinery runs. Syrian claims of an Israeli air strike increased tensions in the Middle East in September prompting average world prices to reach US$76.0 per barrel. The AWCOPI for Q4 2007 was recorded at 324.9, which represents a 24.7 percent increase over Q3 2007 level of 260.6. As crude stock draws in the US, Europe and Japan occurred in September with impending winter demand looming, prices rose. Strong fundamentals includ-ing lower crude stock, constrained supplies and new geopolitical tensions had helped crude prices to remain strong in November. December saw a slight weakening of crude prices as supplies from Iraq rose and the return of UAE fields from maintenance.
Oil and Gas
Page 14
Brunei Economic Bulletin
Brunei’s weighted crude price index rose by about 14 percent in 2007
The third quarter of 2007 marked the period when oil prices went above USD75 per barrel

Crude Oil Production Brunei Darussalam’s crude oil production fell from 219,258 barrels per day in 2006 to 193,832 barrels per day in 2007; or an 11.6 percent decrease. The decline in the overall level of production were, among other reasons, attributed to the closure of oil platforms longer than expected; lower than expected production levels of the new oil wells; and con-servation of the reserves after a robust production run in 2006. The crude oil production for Brunei Darussalam for Q1 2007 on a year-on-year basis de-creased by 8.5 percent (from 221,177 barrels per day to 202,441 barrels per day) whilst, Q2 2007 production figures indicated an overall drop of 12.0 percent (190,615 barrels per day in 2007 from 216,729 barrels per day in Q2 2006). In Q3 2007, production dropped by 13.8 percent to 190,570 barrels per day from 220,988 barrels per day. In Q4 2007, production also experienced a year-on year decrease; from 218,941 barrels per day to 191,853 barrels per day or a 10.0 percent (Annex table 5.2). Note: Data tables for oil price and production are available in the annex - Oil and Gas
Oil and Gas
Page 15
Volume 5 - 2007 - Special Edition
Brunei’s crude production in 2007 fell to 193,832 barrels per day or 11.3 percent
decline compared to 2006 level
Chart: 5.1 Brunei Darussalam and World Average Price of Crude Oil 2007
45
55
65
75
85
95
105
115
JAN FEB M AR APR M AY JUN JUL AUG SEP OCT NOV DEC
M onth
Average World Price Brunei Average Weighted Oil Price
US D
olla
rs p
er B
arre
l
Brunei Darussalam’s fiscal year started on 1 April 2008. For the fiscal year of 2008/2009, the government allocated a budget of BND4.78 billion. Around BND1 billion is allocated to development projects. The 2008/2009 budget focuses on the improvement of economic effi-ciency, national competitiveness and stimulation of domestic economic activities. The drive towards economic diversification will continue in 2008 with methanol projects continue to move forward. The construction of the Sungai Liang Industrial Park (SPARK) that began in 2007 should continue to underpin output in the construction sector in 2008. The development of other promoted sectors is expected to continue, and that will help improve the country's long-term economic prospects, particularly in the non-energy sector. The gov-ernment has also identified several reform areas whereby non-value added procedures will be eliminated in order to improve the country’s business climate, to attract foreign direct invest-ments, and to improve the implementation rate of RKN projects. Improvement in the implementation rate of RKN projects in 2006 and 2007 has resulted in the buoyancy of the non-energy sector. Higher implementation rate of RKN projects is ex-pected to continue in 2008, targeting at around 85 percent implementation rate, compared to around 66-75 percent in the past two years. A higher level of capital spending is expected to bring higher growth in the non-oil and gas sector in 2008. However, lower oil production in 2008 is expected to offset growth in the non-energy sector. Oil production is expected to remain subdued due to a confluence of several factors, namely the weaker global demand for oil and some production constraints facing the Brunei Shell Petroleum, and pre-determined level of oil and gas production. Taking all these factors into account, GDP growth for 2008 is forecast to be around 0.5 to 1 percent. On the inflation front, global inflationary pressure arising from the rise in commodity prices is expected to continue in 2008. A continued rise in the prices of non-controlled food items is expected. However, prices of other commodity groups are expected to remain stable. The domestic prices of gasoline, electricity, communication, car, education and entertainment are also expected to remain stable, therefore releasing some pressures off the inflationary mo-mentum. Subdued upward consumer price pressures will also continue to be underpinned by the maintenance of parity between the Brunei dollar and the Singapore dollar. Overall, Brunei’s inflation in 2008 is expected to be in the region of 1-2 percent, year-on-year. The volume of Brunei’s exports, which consists primarily of oil and gas, is expected to re-main at the level seen in 2007. This is given the expected lower level of production of crude oil and LNG. However, due to the expectation that global prices of oil will remain strong in 2008, Brunei will enjoy another year of “twin surplus”, both in the current account and in the fiscal account.
Outlook
Page 16
Brunei Economic Bulletin
The drive towards economic diversification will continue in 2008
Implementation rate of RKN projects is targeted to be around 85 percent in 2008
In 2008, GDP growth is forecast to be around 0.5 - 1 percent, inflation at around 1-2 percent, and the “twin surplus” (in the current and fiscal accounts) will continue
I. LONG-TERM DEVELOPMENT PLAN 2007-2035
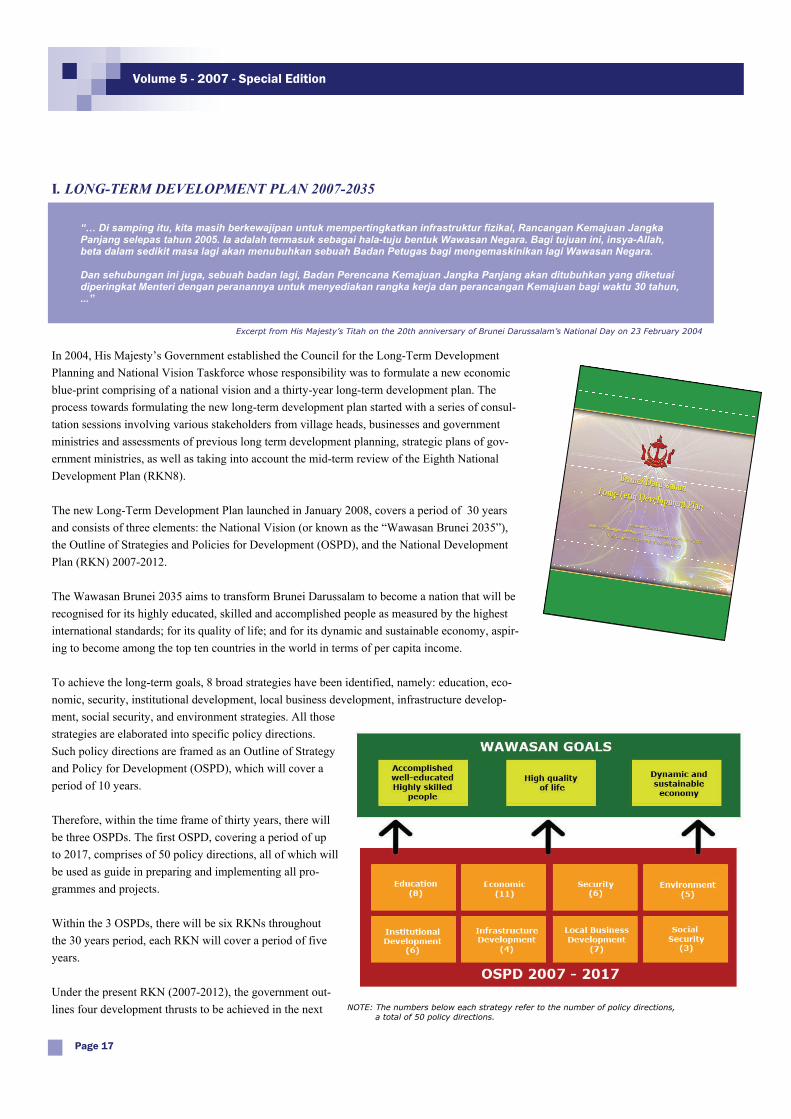
In 2004, His Majesty’s Government established the Council for the Long-Term Development Planning and National Vision Taskforce whose responsibility was to formulate a new economic blue-print comprising of a national vision and a thirty-year long-term development plan. The process towards formulating the new long-term development plan started with a series of consul-tation sessions involving various stakeholders from village heads, businesses and government ministries and assessments of previous long term development planning, strategic plans of gov-ernment ministries, as well as taking into account the mid-term review of the Eighth National Development Plan (RKN8). The new Long-Term Development Plan launched in January 2008, covers a period of 30 years and consists of three elements: the National Vision (or known as the “Wawasan Brunei 2035”), the Outline of Strategies and Policies for Development (OSPD), and the National Development Plan (RKN) 2007-2012. The Wawasan Brunei 2035 aims to transform Brunei Darussalam to become a nation that will be recognised for its highly educated, skilled and accomplished people as measured by the highest international standards; for its quality of life; and for its dynamic and sustainable economy, aspir-ing to become among the top ten countries in the world in terms of per capita income. To achieve the long-term goals, 8 broad strategies have been identified, namely: education, eco-nomic, security, institutional development, local business development, infrastructure develop-ment, social security, and environment strategies. All those strategies are elaborated into specific policy directions. Such policy directions are framed as an Outline of Strategy and Policy for Development (OSPD), which will cover a period of 10 years. Therefore, within the time frame of thirty years, there will be three OSPDs. The first OSPD, covering a period of up to 2017, comprises of 50 policy directions, all of which will be used as guide in preparing and implementing all pro-grammes and projects. Within the 3 OSPDs, there will be six RKNs throughout the 30 years period, each RKN will cover a period of five years. Under the present RKN (2007-2012), the government out-lines four development thrusts to be achieved in the next
Page 17
Volume 5 - 2007 - Special Edition
“… Di samping itu, kita masih berkewajipan untuk mempertingkatkan infrastruktur fizikal, Rancangan Kemajuan Jangka Panjang selepas tahun 2005. Ia adalah termasuk sebagai hala-tuju bentuk Wawasan Negara. Bagi tujuan ini, insya-Allah, beta dalam sedikit masa lagi akan menubuhkan sebuah Badan Petugas bagi mengemaskinikan lagi Wawasan Negara. Dan sehubungan ini juga, sebuah badan lagi, Badan Perencana Kemajuan Jangka Panjang akan ditubuhkan yang diketuai diperingkat Menteri dengan peranannya untuk menyediakan rangka kerja dan perancangan Kemajuan bagi waktu 30 tahun, ...”
Excerpt from His Majesty’s Titah on the 20th anniversary of Brunei Darussalam’s National Day on 23 February 2004
NOTE: The numbers below each strategy refer to the number of policy directions, a total of 50 policy directions.
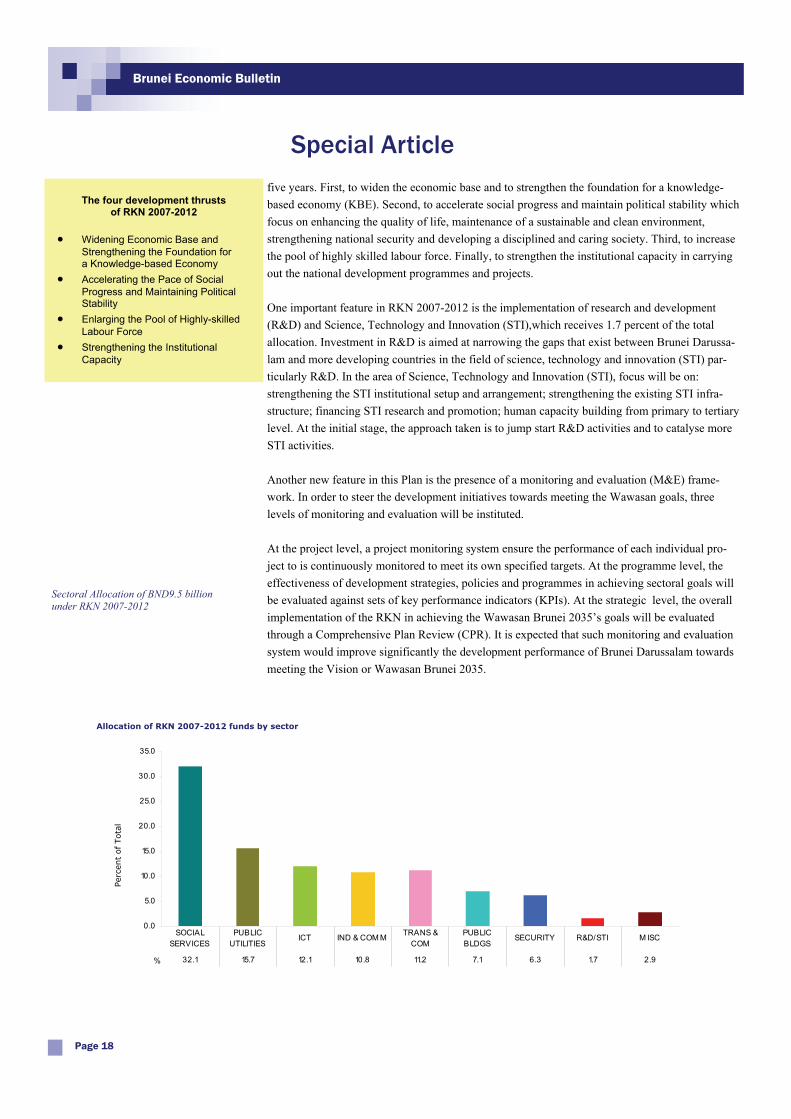
five years. First, to widen the economic base and to strengthen the foundation for a knowledge-based economy (KBE). Second, to accelerate social progress and maintain political stability which focus on enhancing the quality of life, maintenance of a sustainable and clean environment, strengthening national security and developing a disciplined and caring society. Third, to increase the pool of highly skilled labour force. Finally, to strengthen the institutional capacity in carrying out the national development programmes and projects. One important feature in RKN 2007-2012 is the implementation of research and development (R&D) and Science, Technology and Innovation (STI),which receives 1.7 percent of the total allocation. Investment in R&D is aimed at narrowing the gaps that exist between Brunei Darussa-lam and more developing countries in the field of science, technology and innovation (STI) par-ticularly R&D. In the area of Science, Technology and Innovation (STI), focus will be on: strengthening the STI institutional setup and arrangement; strengthening the existing STI infra-structure; financing STI research and promotion; human capacity building from primary to tertiary level. At the initial stage, the approach taken is to jump start R&D activities and to catalyse more STI activities. Another new feature in this Plan is the presence of a monitoring and evaluation (M&E) frame-work. In order to steer the development initiatives towards meeting the Wawasan goals, three levels of monitoring and evaluation will be instituted. At the project level, a project monitoring system ensure the performance of each individual pro-ject to is continuously monitored to meet its own specified targets. At the programme level, the effectiveness of development strategies, policies and programmes in achieving sectoral goals will be evaluated against sets of key performance indicators (KPIs). At the strategic level, the overall implementation of the RKN in achieving the Wawasan Brunei 2035’s goals will be evaluated through a Comprehensive Plan Review (CPR). It is expected that such monitoring and evaluation system would improve significantly the development performance of Brunei Darussalam towards meeting the Vision or Wawasan Brunei 2035.
Special Article
Page 18
Brunei Economic Bulletin
The four development thrusts
of RKN 2007-2012 • Widening Economic Base and
Strengthening the Foundation for a Knowledge-based Economy
• Accelerating the Pace of Social Progress and Maintaining Political Stability
• Enlarging the Pool of Highly-skilled Labour Force
• Strengthening the Institutional Capacity
Sectoral Allocation of BND9.5 billion under RKN 2007-2012
0.0
5.0
10.0
15.0
20.0
25.0
30.0
35.0
% 32.1 15.7 12.1 10.8 11.2 7.1 6.3 1.7 2.9
SOCIAL SERVICES
PUBLIC UTILITIES
ICT IND & COM M TRANS & COM
PUBLIC BLDGS
SECURITY R&D/STI M ISC
Perc
ent
of Tota
l
Allocation of RKN 2007-2012 funds by sector
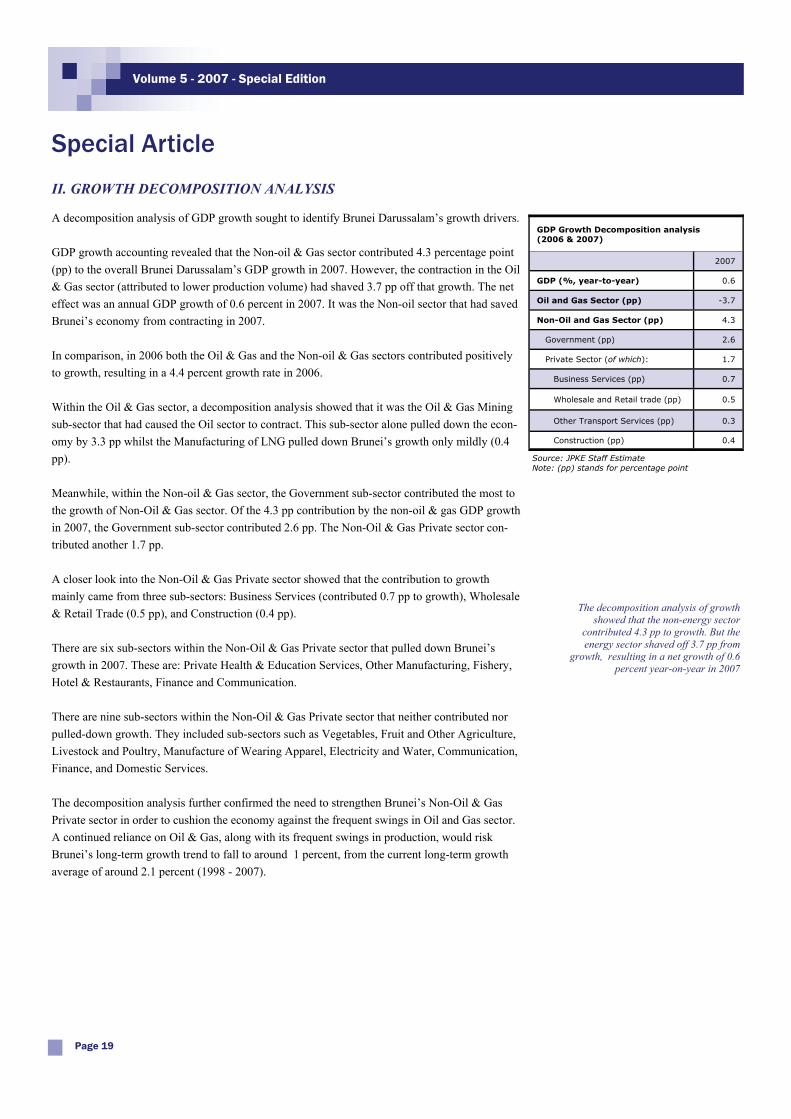
II. GROWTH DECOMPOSITION ANALYSIS A decomposition analysis of GDP growth sought to identify Brunei Darussalam’s growth drivers. GDP growth accounting revealed that the Non-oil & Gas sector contributed 4.3 percentage point (pp) to the overall Brunei Darussalam’s GDP growth in 2007. However, the contraction in the Oil & Gas sector (attributed to lower production volume) had shaved 3.7 pp off that growth. The net effect was an annual GDP growth of 0.6 percent in 2007. It was the Non-oil sector that had saved Brunei’s economy from contracting in 2007. In comparison, in 2006 both the Oil & Gas and the Non-oil & Gas sectors contributed positively to growth, resulting in a 4.4 percent growth rate in 2006. Within the Oil & Gas sector, a decomposition analysis showed that it was the Oil & Gas Mining sub-sector that had caused the Oil sector to contract. This sub-sector alone pulled down the econ-omy by 3.3 pp whilst the Manufacturing of LNG pulled down Brunei’s growth only mildly (0.4 pp). Meanwhile, within the Non-oil & Gas sector, the Government sub-sector contributed the most to the growth of Non-Oil & Gas sector. Of the 4.3 pp contribution by the non-oil & gas GDP growth in 2007, the Government sub-sector contributed 2.6 pp. The Non-Oil & Gas Private sector con-tributed another 1.7 pp. A closer look into the Non-Oil & Gas Private sector showed that the contribution to growth mainly came from three sub-sectors: Business Services (contributed 0.7 pp to growth), Wholesale & Retail Trade (0.5 pp), and Construction (0.4 pp). There are six sub-sectors within the Non-Oil & Gas Private sector that pulled down Brunei’s growth in 2007. These are: Private Health & Education Services, Other Manufacturing, Fishery, Hotel & Restaurants, Finance and Communication. There are nine sub-sectors within the Non-Oil & Gas Private sector that neither contributed nor pulled-down growth. They included sub-sectors such as Vegetables, Fruit and Other Agriculture, Livestock and Poultry, Manufacture of Wearing Apparel, Electricity and Water, Communication, Finance, and Domestic Services. The decomposition analysis further confirmed the need to strengthen Brunei’s Non-Oil & Gas Private sector in order to cushion the economy against the frequent swings in Oil and Gas sector. A continued reliance on Oil & Gas, along with its frequent swings in production, would risk Brunei’s long-term growth trend to fall to around 1 percent, from the current long-term growth average of around 2.1 percent (1998 - 2007).
Special Article
Page 19
Volume 5 - 2007 - Special Edition
GDP Growth Decomposition analysis (2006 & 2007)
GDP (%, year-to-year) 0.6
Oil and Gas Sector (pp) -3.7
Non-Oil and Gas Sector (pp) 4.3 Government (pp) 2.6 Private Sector (of which): 1.7 Business Services (pp) 0.7 Wholesale and Retail trade (pp) 0.5 Other Transport Services (pp) 0.3 Construction (pp) 0.4
2007
Source: JPKE Staff Estimate Note: (pp) stands for percentage point
The decomposition analysis of growth showed that the non-energy sector
contributed 4.3 pp to growth. But the energy sector shaved off 3.7 pp from
growth, resulting in a net growth of 0.6 percent year-on-year in 2007
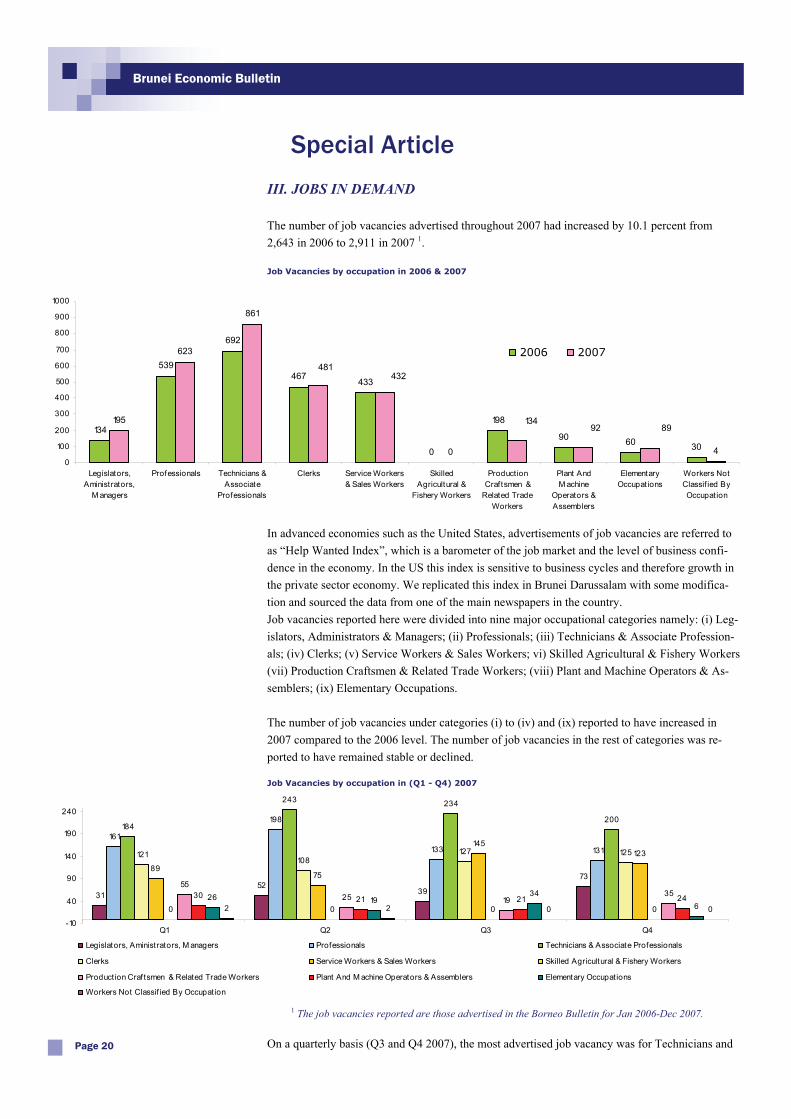
III. JOBS IN DEMAND The number of job vacancies advertised throughout 2007 had increased by 10.1 percent from 2,643 in 2006 to 2,911 in 2007 1.
In advanced economies such as the United States, advertisements of job vacancies are referred to as “Help Wanted Index”, which is a barometer of the job market and the level of business confi-dence in the economy. In the US this index is sensitive to business cycles and therefore growth in the private sector economy. We replicated this index in Brunei Darussalam with some modifica-tion and sourced the data from one of the main newspapers in the country. Job vacancies reported here were divided into nine major occupational categories namely: (i) Leg-islators, Administrators & Managers; (ii) Professionals; (iii) Technicians & Associate Profession-als; (iv) Clerks; (v) Service Workers & Sales Workers; vi) Skilled Agricultural & Fishery Workers (vii) Production Craftsmen & Related Trade Workers; (viii) Plant and Machine Operators & As-semblers; (ix) Elementary Occupations. The number of job vacancies under categories (i) to (iv) and (ix) reported to have increased in 2007 compared to the 2006 level. The number of job vacancies in the rest of categories was re-ported to have remained stable or declined.
On a quarterly basis (Q3 and Q4 2007), the most advertised job vacancy was for Technicians and
Special Article
Page 20
Brunei Economic Bulletin
Job Vacancies by occupation in 2006 & 2007
2006 2007
3152
39
73
161
198
133 131
184
243 234
200
121108
127 125
8975
145123
0 0 0 0
5525 19
3530 21 21 2426 1934
62 2 0 0
-10
40
90
140
190
240
Q1 Q2 Q3 Q4
Legislators, Aministrators, M anagers Professionals Technicians & Associate Professionals
Clerks Service Workers & Sales Workers Skilled Agricultural & Fishery Workers
Production Craf tsmen & Related Trade Workers Plant And M achine Operators & Assemblers Elementary Occupations
Workers Not Classif ied By Occupation
Job Vacancies by occupation in (Q1 - Q4) 2007
1 The job vacancies reported are those advertised in the Borneo Bulletin for Jan 2006-Dec 2007.
134
539
692
467433
0
198
90 60 30
195
623
861
0 4
8992134
432481
0
100
200
300
400
500
600
700
800
900
1000
Legislators,Aministrators,
M anagers
Professionals Technicians &Associate
Professionals
Clerks Service Workers& Sales Workers
SkilledAgricultural &
Fishery Workers
ProductionCraftsmen &
Related TradeWorkers
Plant AndM achine
Operators &Assemblers
ElementaryOccupations
Workers NotClassif ied ByOccupation
2006 2007
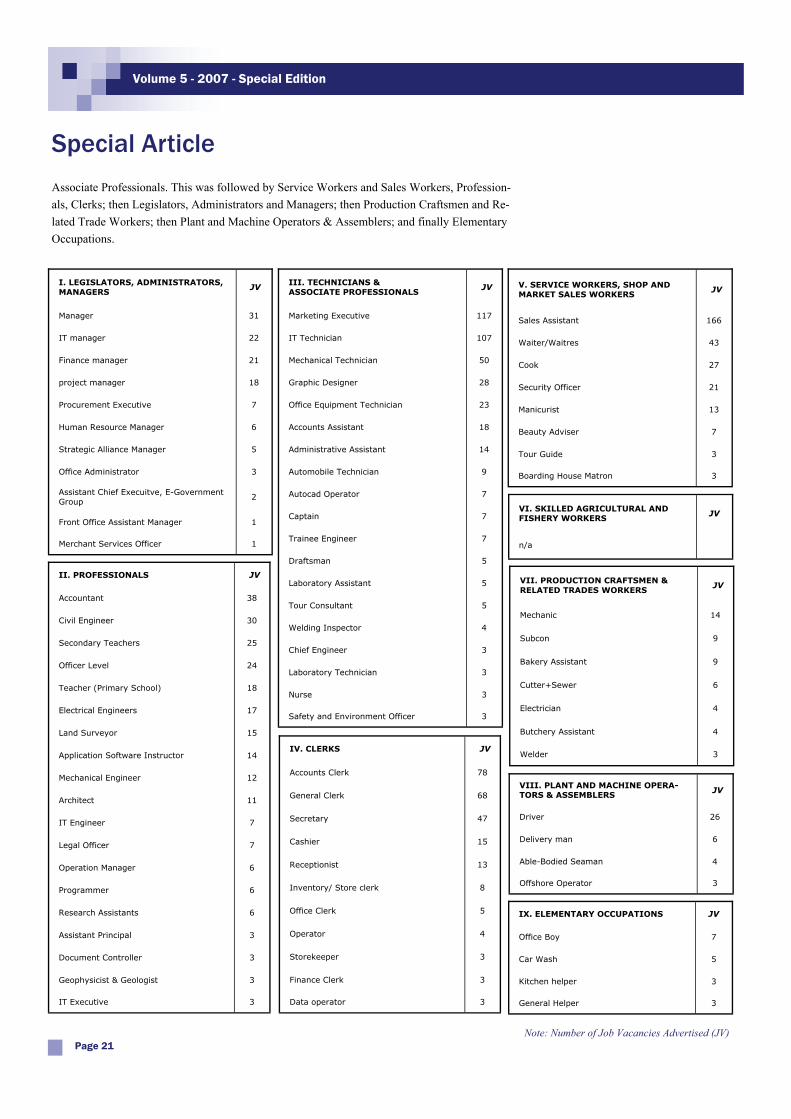
Associate Professionals. This was followed by Service Workers and Sales Workers, Profession-als, Clerks; then Legislators, Administrators and Managers; then Production Craftsmen and Re-lated Trade Workers; then Plant and Machine Operators & Assemblers; and finally Elementary Occupations.
Special Article
Page 21
Volume 5 - 2007 - Special Edition
Note: Number of Job Vacancies Advertised (JV)
I. LEGISLATORS, ADMINISTRATORS, MANAGERS
JV
Manager 31
IT manager 22
Finance manager 21
project manager 18
Procurement Executive 7
Human Resource Manager 6
Strategic Alliance Manager 5
Office Administrator 3
Assistant Chief Execuitve, E-Government Group 2
Front Office Assistant Manager 1
Merchant Services Officer 1
III. TECHNICIANS & ASSOCIATE PROFESSIONALS
JV
Marketing Executive 117
IT Technician 107
Mechanical Technician 50
Graphic Designer 28
Office Equipment Technician 23
Accounts Assistant 18
Administrative Assistant 14
Automobile Technician 9
Autocad Operator 7
Captain 7
Trainee Engineer 7
Draftsman 5
Laboratory Assistant 5
Tour Consultant 5
Welding Inspector 4
Chief Engineer 3
Laboratory Technician 3
Nurse 3
Safety and Environment Officer 3
V. SERVICE WORKERS, SHOP AND MARKET SALES WORKERS
JV
Sales Assistant 166
Waiter/Waitres 43
Cook 27
Security Officer 21
Manicurist 13
Beauty Adviser 7
Tour Guide 3
Boarding House Matron 3
II. PROFESSIONALS JV
Accountant 38
Civil Engineer 30
Secondary Teachers 25
Officer Level 24
Teacher (Primary School) 18
Electrical Engineers 17
Land Surveyor 15
Application Software Instructor 14
Mechanical Engineer 12
Architect 11
IT Engineer 7
Legal Officer 7
Operation Manager 6
Programmer 6
Research Assistants 6
Assistant Principal 3
Document Controller 3
Geophysicist & Geologist 3
IT Executive 3
IV. CLERKS JV
Accounts Clerk 78
General Clerk 68
Secretary 47
Cashier 15
Receptionist 13
Inventory/ Store clerk 8
Office Clerk 5
Operator 4
Storekeeper 3
Finance Clerk 3
Data operator 3
VIII. PLANT AND MACHINE OPERA-TORS & ASSEMBLERS JV
Driver 26
Delivery man 6
Able-Bodied Seaman 4
Offshore Operator 3
IX. ELEMENTARY OCCUPATIONS JV
Office Boy 7
Car Wash 5
Kitchen helper 3
General Helper 3
VII. PRODUCTION CRAFTSMEN & RELATED TRADES WORKERS
JV
Mechanic 14
Subcon 9
Bakery Assistant 9
Cutter+Sewer 6
Electrician 4
Butchery Assistant 4
Welder 3
VI. SKILLED AGRICULTURAL AND FISHERY WORKERS JV
n/a

Reader’s Note:
Page 22
Brunei Economic Bulletin
______________________________________________________________________________
______________________________________________________________________________
______________________________________________________________________________
______________________________________________________________________________
______________________________________________________________________________
______________________________________________________________________________
______________________________________________________________________________
______________________________________________________________________________
______________________________________________________________________________
______________________________________________________________________________
______________________________________________________________________________
______________________________________________________________________________
______________________________________________________________________________
______________________________________________________________________________
______________________________________________________________________________
______________________________________________________________________________
______________________________________________________________________________
______________________________________________________________________________
______________________________________________________________________________
______________________________________________________________________________
______________________________________________________________________________
______________________________________________________________________________
______________________________________________________________________________
______________________________________________________________________________
______________________________________________________________________________
______________________________________________________________________________
______________________________________________________________________________
______________________________________________________________________________
______________________________________________________________________________
______________________________________________________________________________
______________________________________________________________________________
______________________________________________________________________________
______________________________________________________________________________
______________________________________________________________________________
______________________________________________________________________________
______________________________________________________________________________
______________________________________________________________________________
______________________________________________________________________________
______________________________________________________________________________
______________________________________________________________________________
______________________________________________________________________________
______________________________________________________________________________
Remarks
Annex - Real Sector and Output
Page 23
Volume 5 - 2007 - Special Edition
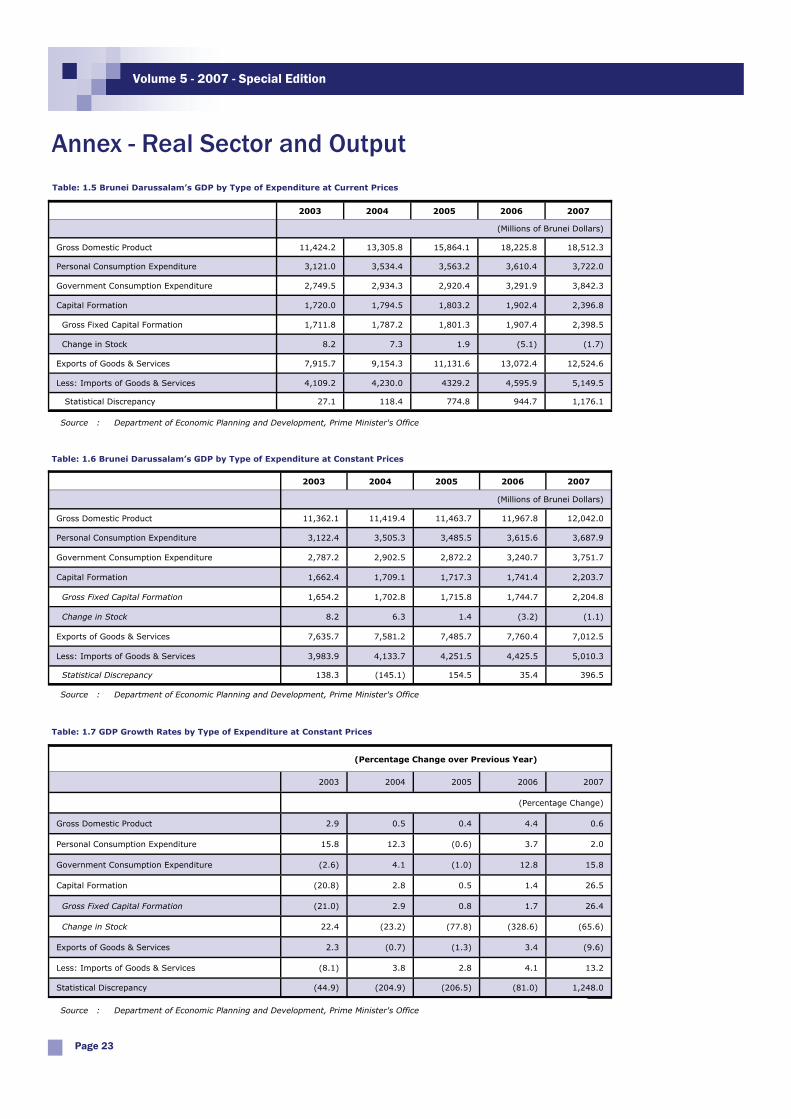
2003 2004 2005 2006 2007
(Millions of Brunei Dollars)
Gross Domestic Product 11,424.2 13,305.8 15,864.1 18,225.8 18,512.3
Personal Consumption Expenditure 3,121.0 3,534.4 3,563.2 3,610.4 3,722.0
Government Consumption Expenditure 2,749.5 2,934.3 2,920.4 3,291.9 3,842.3
Capital Formation 1,720.0 1,794.5 1,803.2 1,902.4 2,396.8
Gross Fixed Capital Formation 1,711.8 1,787.2 1,801.3 1,907.4 2,398.5
Change in Stock 8.2 7.3 1.9 (5.1) (1.7)
Exports of Goods & Services 7,915.7 9,154.3 11,131.6 13,072.4 12,524.6
Less: Imports of Goods & Services 4,109.2 4,230.0 4329.2 4,595.9 5,149.5
Statistical Discrepancy 27.1 118.4 774.8 944.7 1,176.1
Source : Department of Economic Planning and Development, Prime Minister's Office
Table: 1.5 Brunei Darussalam’s GDP by Type of Expenditure at Current Prices
Source : Department of Economic Planning and Development, Prime Minister's Office
2003 2004 2005 2006 2007
(Millions of Brunei Dollars)
Gross Domestic Product 11,362.1 11,419.4 11,463.7 11,967.8 12,042.0
Personal Consumption Expenditure 3,122.4 3,505.3 3,485.5 3,615.6 3,687.9
Government Consumption Expenditure 2,787.2 2,902.5 2,872.2 3,240.7 3,751.7
Capital Formation 1,662.4 1,709.1 1,717.3 1,741.4 2,203.7
Gross Fixed Capital Formation 1,654.2 1,702.8 1,715.8 1,744.7 2,204.8
Change in Stock 8.2 6.3 1.4 (3.2) (1.1)
Exports of Goods & Services 7,635.7 7,581.2 7,485.7 7,760.4 7,012.5
Less: Imports of Goods & Services 3,983.9 4,133.7 4,251.5 4,425.5 5,010.3
138.3 (145.1) 154.5 35.4 396.5 Statistical Discrepancy
Table: 1.6 Brunei Darussalam’s GDP by Type of Expenditure at Constant Prices
(Percentage Change over Previous Year)
2003 2004 2005 2006 2007
(Percentage Change)
Gross Domestic Product 2.9 0.5 0.4 4.4 0.6
Personal Consumption Expenditure 15.8 12.3 (0.6) 3.7 2.0
Government Consumption Expenditure (2.6) 4.1 (1.0) 12.8 15.8
Capital Formation (20.8) 2.8 0.5 1.4 26.5
(21.0) 2.9 0.8 1.7 26.4
Change in Stock 22.4 (23.2) (77.8) (328.6) (65.6)
Exports of Goods & Services 2.3 (0.7) (1.3) 3.4 (9.6)
Less: Imports of Goods & Services (8.1) 3.8 2.8 4.1 13.2
Statistical Discrepancy (44.9) (204.9) (206.5) (81.0) 1,248.0
Gross Fixed Capital Formation
Table: 1.7 GDP Growth Rates by Type of Expenditure at Constant Prices
Source : Department of Economic Planning and Development, Prime Minister's Office
Annex - Real Sector and Output
Page 24
Brunei Economic Bulletin
Source : Department of Economic Planning and Development, Prime Minister's Office
2003 2004 2005 2006 2007
(Percentage)
Gross Domestic Product 100.0 100.0 100.0 100.0 100.0
Personal Consumption Expenditure 27.3 26.6 22.5 19.8 20.1
Government Consumption Expenditure 24.1 22.1 18.4 18.1 20.8
Capital Formation 15.1 13.5 11.4 10.4 12.9
15.0 13.5 11.4 10.5 12.9
Change in Stock 0.1 0.1 0.0 (0.0) (0.0)
Exports of Goods & Services 69.3 68.8 70.2 71.7 67.7
Less: Imports of Goods & Services 36.0 31.8 27.3 25.2 27.8
Statistical Discrepancy 0.2 0.9 4.9 5.2 6.4
Gross Fixed Capital Formation
Table: 1.8 GDP Distributions by Types of Expenditure at Current Prices
2003 2004 2005 2006 2007
(Percentage)
Gross Domestic Product 100.0 100.0 100.0 100.0 100.0
Oil & Gas Sector 57.2 61.9 66.4 68.5 66.6
Non-Oil & Gas Sector 42.8 38.1 33.6 31.5 33.4
Government 14.8 13.4 11.6 11.0 12.7
28.1 24.7 21.9 20.4 20.8 Private Sector
Table: 1.9 GDP Distributions by Economic Activity at Current Prices
Source : Department of Economic Planning and Development, Prime Minister's Office
Annex - Public Finance
Page 25
Volume 5 - 2007 - Special Edition
2006 2007
Q1 Q2 Q3 Q4 T Q1 Q2 Q3 Q4 T
Total Revenues 2,190.28 2,511.06 2,603.30 2,262.46 9,567.10 1,810.83 2,071.71 2,266.64 2,635.60 8,784.78
Tax revenue 1,304.88 1,627.81 1,651.34 1,332.60 5,916.63 902.42 1,296.99 1,545.12 1,723.48 5,468.01
Taxes on net income and profits 1,264.86 1,600.20 1,627.13 1,296.73 5,788.92 871.49 1,240.17 1,512.08 1,681.68 5,305.42
Taxes on international trade 36.47 24.46 21.07 30.05 112.05 26.02 52.54 29.11 35.96 143.63
Taxes on goods and services 3.55 3.15 3.14 5.82 15.66 4.91 4.28 3.93 5.84 18.96
Non-tax revenue 885.40 883.25 951.96 929.86 3,650.47 908.41 774.72 721.52 912.12 3,316.77
Property income 792.9 816.41 896.01 862.84 3,368.17 841.4 703.54 656.61 833.00 3,034.51
Administrative fees and charges on sales of goods and fines
91.67 66.13 55.25 66.24 279.29 66.09 70.15 63.89 78.13 278.26
Other non-tax revenue 0.82 0.71 0.70 0.78 3.01 0.96 1.03 1.02 0.99 4.00
Total Expenditure 1754.64 853.06 1373.54 1247.94 5,229.18 1798.45 1177.84 1315.61 1499.31 5,791.21
Current 1423.88 714.21 1138.67 977.36 4,254.12 1185.68 1023.9 954.18 1309.17 4,472.93
Capital 330.76 138.85 234.87 270.58 975.06 612.77 153.94 361.43 190.14 1,318.28
Budget Surplus/ Deficit 435.64 1658.00 1229.76 1014.52 4,337.92 12.38 893.87 951.03 1136.29 2,993.57
Table: 2.1 Summary of Government Finance Performance
Source: Treasury Department, Ministry of Finance
Annex - Public Finance
Page 26
Brunei Economic Bulletin
2006 2007
Total Revenue 9,567.10 8,784.78
Tax revenue 5,916.63 5,468.01
Taxes on net income and profits 5,788.92 5,305.42
Corporate taxes 5,784.82 5,297.92
Oil & Gas production companies 5692.29 5,157.82
Other companies 92.53 140.10
Individuals (estate duty) 0.87 0.66
Stamp 3.23 6.84
Taxes on international trade 112.05 143.63
Import duties 112.05 143.63
Motor vehicles tax 51.53 62.10
Tobacco 18.16 22.14
Others 42.36 59.39
Export taxes - -
Taxes on goods and services 15.66 18.96
Licences 15.66 18.96
Financial companies 2.65 4.03
Others 13.01 14.93
Excise duties - -
Non-tax revenue 3,650.47 3,316.77
Property income 3,368.17 3,034.51
Oil sector 3,257.32 2,825.03
Oil & Gas Royalties 974.34 912.86
Dividend paid by oil companies 2282.98 1,912.17
Other 110.85 209.48
Other royalties 1.03 1.88
Rent and interest 75.56 183.67
Others 34.26 23.93
Administrative fees and charges on
sales of goods and fines 279.29 278.26
Telecom & utilities 192.09 167.69
Other 87.20 110.57
Other non-tax revenue 3.01 4.00
Table: 2.2 Revenue by Transaction Classification
Source: Treasury Department, Ministry of Finance
2006 2007
Total Expenditure 5,229.18 5,791.21
Current 4,254.12 4,472.93
Wages & Salaries 1,595.34 1,765.73
OCAR 1,117.73 1,399.02
Others - -
Charged 1,494.13 1,305.28
Pensions 271.53 314.72
Civil List 75.65 106.60
Royalties 1,146.95 883.96
Capital 975.06 1,318.28
OCSE 384.30 696.92
Development Expenditure 590.76 621.36
Investments in Public Enterprises (IPE) - -
Balance Budget (Surplus/Deficit) 4,337.92 2,993.57
Table: 2.3 Expenditure by Transaction Classification
Source: Treasury Department, Ministry of Finance
Annex - Consumer Price Index
Page 27
Volume 5 - 2007 - Special Edition
Major Groups and Sub-Groups Weight
(%)
Index % Change 2007/2006 2006 2007
Food and Non-Alcoholic Beverages 28.77 101.6 103.8 2.2
Rice and Cereal Products 4.35 101.7 102.7 1.0
Meat and Meat Products 3.26 112.3 113.6 1.2
Seafood and Seafood Products 3.92 91.9 93.8 2.1
Dairy Products and Eggs 2.15 112.0 122.3 9.2
Cooking Oils and Fats 0.53 103.7 121.5 17.2
Vegetables 2.07 97.5 97.9 0.4
Fruits 1.48 100.0 102.1 2.1
Sugar, Sugar Preserves and Confectionery 0.98 115.2 115.9 0.6
Coffee, Tea and Cocoa 0.69 95.8 100.2 4.6
Non-Alcoholic Beverages 1.47 100.3 101.8 1.5
Other Foods 2.38 94.7 95.9 1.3
Food/Drink Away From Home 5.49 101.8 102.0 0.2
Clothing and Footwear 5.61 92.2 91.5 -0.8
Ready-Made Clothing and Accessories 3.18 94.1 94.5 0.4
Materials for Male/Female 0.83 87.6 86.6 -1.1
Wedding Dress, Accessories and Rental 0.09 92.6 92.3 -0.3
Tailoring Charges 0.69 99.0 97.2 -1.8
Haberdasheries 0.05 80.2 88.0 9.7
Footwear 0.77 83.6 79.2 -5.3
Housing, Water, Electricity and Maintenance 8.84 97.6 96.8 -0.8
Accommodation 3.94 94.7 92.8 -2.0
Fuel, Water and Electricity 4.90 100.0 100.0 0.0
Household Goods, Services and Operation 8.60 93.1 93.8 0.8
Household Goods, Services and Operation 8.60 93.1 93.8 0.8
Transport 22.51 106.7 107.2 0.5
Private Road Transport 20.04 104.6 104.5 -0.1
Public Transport 0.56 101.3 101.3 0.0
Air Transport 1.91 130.8 136.5 4.4
Communication 5.48 88.8 88.3 -0.6
Communication 5.48 88.8 88.3 -0.6
Education 4.71 98.0 97.9 -0.1
Education 4.71 98.0 97.9 -0.1
Medical and Health 0.98 100.2 101.6 1.4
Medical and Health 0.98 100.2 101.6 1.4
Recreation and Entertainment 8.14 127.2 120.9 -5.0
Recreation 1.52 83.3 83.5 0.2
Hobbies and Other Miscellaneous Expenditure 6.62 137.3 129.5 -5.7
Miscellaneous Goods and Services 6.36 104.0 106.8 2.7
Cigarettes 0.69 100.1 103.3 3.2
Domestic Services 2.92 100.0 102.4 2.4
Personal Care 1.58 99.6 100.0 0.4
Personal Effects and Other Personal Goods 0.95 127.9 136.4 6.6
Miscellaneous Expenses 0.22 97.7 97.7 0.0
Source: Department of Economic Planning and Development
Table: 3.3 CPI BY SUBGROUPS
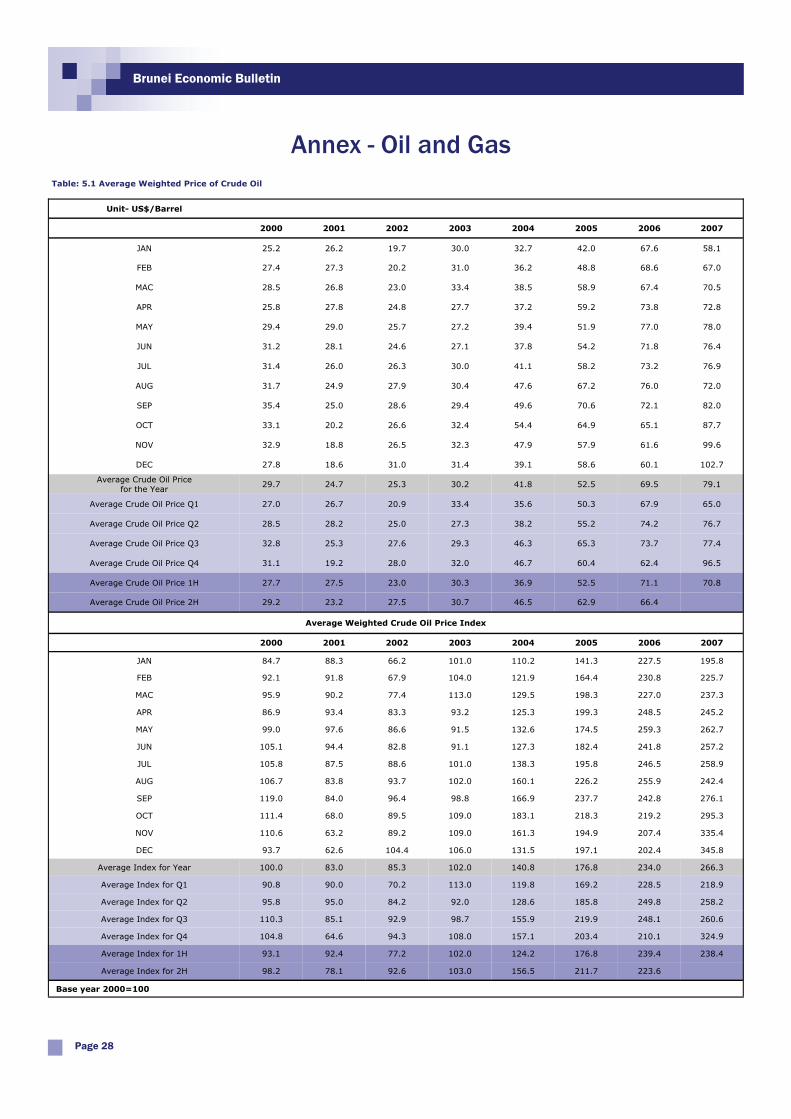
Annex - Oil and Gas
Page 28
Brunei Economic Bulletin
Unit- US$/Barrel
2000 2001 2002 2003 2004 2005 2006 2007
JAN 25.2 26.2 19.7 30.0 32.7 42.0 67.6 58.1
FEB 27.4 27.3 20.2 31.0 36.2 48.8 68.6 67.0
MAC 28.5 26.8 23.0 33.4 38.5 58.9 67.4 70.5
APR 25.8 27.8 24.8 27.7 37.2 59.2 73.8 72.8
MAY 29.4 29.0 25.7 27.2 39.4 51.9 77.0 78.0
JUN 31.2 28.1 24.6 27.1 37.8 54.2 71.8 76.4
JUL 31.4 26.0 26.3 30.0 41.1 58.2 73.2 76.9
AUG 31.7 24.9 27.9 30.4 47.6 67.2 76.0 72.0
SEP 35.4 25.0 28.6 29.4 49.6 70.6 72.1 82.0
OCT 33.1 20.2 26.6 32.4 54.4 64.9 65.1 87.7
NOV 32.9 18.8 26.5 32.3 47.9 57.9 61.6 99.6
DEC 27.8 18.6 31.0 31.4 39.1 58.6 60.1 102.7
Average Crude Oil Price for the Year
29.7 24.7 25.3 30.2 41.8 52.5 69.5 79.1
Average Crude Oil Price Q1 27.0 26.7 20.9 33.4 35.6 50.3 67.9 65.0
Average Crude Oil Price Q2 28.5 28.2 25.0 27.3 38.2 55.2 74.2 76.7
Average Crude Oil Price Q3 32.8 25.3 27.6 29.3 46.3 65.3 73.7 77.4
Average Crude Oil Price Q4 31.1 19.2 28.0 32.0 46.7 60.4 62.4 96.5
Average Crude Oil Price 1H 27.7 27.5 23.0 30.3 36.9 52.5 71.1 70.8
Average Crude Oil Price 2H 29.2 23.2 27.5 30.7 46.5 62.9 66.4
Average Weighted Crude Oil Price Index
2000 2001 2002 2003 2004 2005 2006 2007
JAN 84.7 88.3 66.2 101.0 110.2 141.3 227.5 195.8
FEB 92.1 91.8 67.9 104.0 121.9 164.4 230.8 225.7
MAC 95.9 90.2 77.4 113.0 129.5 198.3 227.0 237.3
APR 86.9 93.4 83.3 93.2 125.3 199.3 248.5 245.2
MAY 99.0 97.6 86.6 91.5 132.6 174.5 259.3 262.7
JUN 105.1 94.4 82.8 91.1 127.3 182.4 241.8 257.2
JUL 105.8 87.5 88.6 101.0 138.3 195.8 246.5 258.9
AUG 106.7 83.8 93.7 102.0 160.1 226.2 255.9 242.4
SEP 119.0 84.0 96.4 98.8 166.9 237.7 242.8 276.1
OCT 111.4 68.0 89.5 109.0 183.1 218.3 219.2 295.3
NOV 110.6 63.2 89.2 109.0 161.3 194.9 207.4 335.4
DEC 93.7 62.6 104.4 106.0 131.5 197.1 202.4 345.8
Average Index for Year 100.0 83.0 85.3 102.0 140.8 176.8 234.0 266.3
Average Index for Q1 90.8 90.0 70.2 113.0 119.8 169.2 228.5 218.9
Average Index for Q2 95.8 95.0 84.2 92.0 128.6 185.8 249.8 258.2
Average Index for Q3 110.3 85.1 92.9 98.7 155.9 219.9 248.1 260.6
Average Index for Q4 104.8 64.6 94.3 108.0 157.1 203.4 210.1 324.9
Average Index for 1H 93.1 92.4 77.2 102.0 124.2 176.8 239.4 238.4
Average Index for 2H 98.2 78.1 92.6 103.0 156.5 211.7 223.6
Base year 2000=100
Table: 5.1 Average Weighted Price of Crude Oil
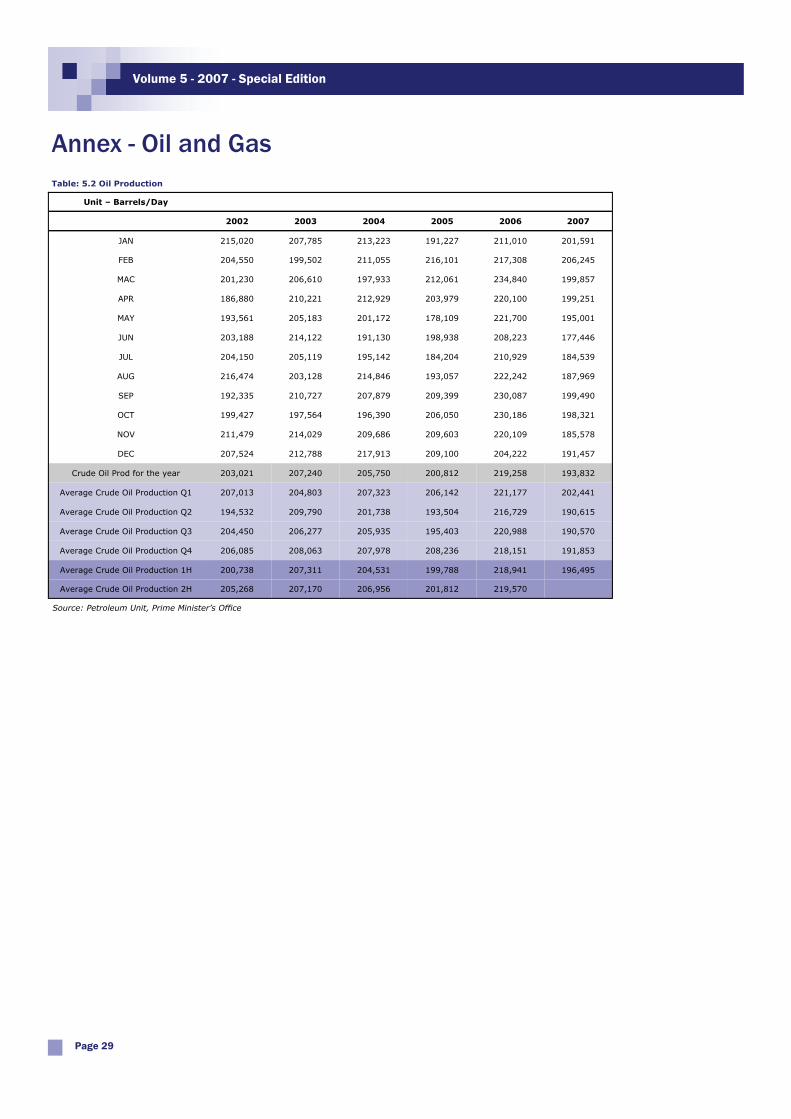
Annex - Oil and Gas
Page 29
Volume 5 - 2007 - Special Edition
Unit – Barrels/Day 2002 2003 2004 2005 2006 2007
JAN 215,020 207,785 213,223 191,227 211,010 201,591 FEB 204,550 199,502 211,055 216,101 217,308 206,245 MAC 201,230 206,610 197,933 212,061 234,840 199,857 APR 186,880 210,221 212,929 203,979 220,100 199,251 MAY 193,561 205,183 201,172 178,109 221,700 195,001 JUN 203,188 214,122 191,130 198,938 208,223 177,446 JUL 204,150 205,119 195,142 184,204 210,929 184,539 AUG 216,474 203,128 214,846 193,057 222,242 187,969 SEP 192,335 210,727 207,879 209,399 230,087 199,490 OCT 199,427 197,564 196,390 206,050 230,186 198,321 NOV 211,479 214,029 209,686 209,603 220,109 185,578 DEC 207,524 212,788 217,913 209,100 204,222 191,457
Crude Oil Prod for the year 203,021 207,240 205,750 200,812 219,258 193,832 Average Crude Oil Production Q1 207,013 204,803 207,323 206,142 221,177 202,441 Average Crude Oil Production Q2 194,532 209,790 201,738 193,504 216,729 190,615 Average Crude Oil Production Q3 204,450 206,277 205,935 195,403 220,988 190,570 Average Crude Oil Production Q4 206,085 208,063 207,978 208,236 218,151 191,853 Average Crude Oil Production 1H 200,738 207,311 204,531 199,788 218,941 196,495 Average Crude Oil Production 2H 205,268 207,170 206,956 201,812 219,570
Source: Petroleum Unit, Prime Minister’s Office
Table: 5.2 Oil Production
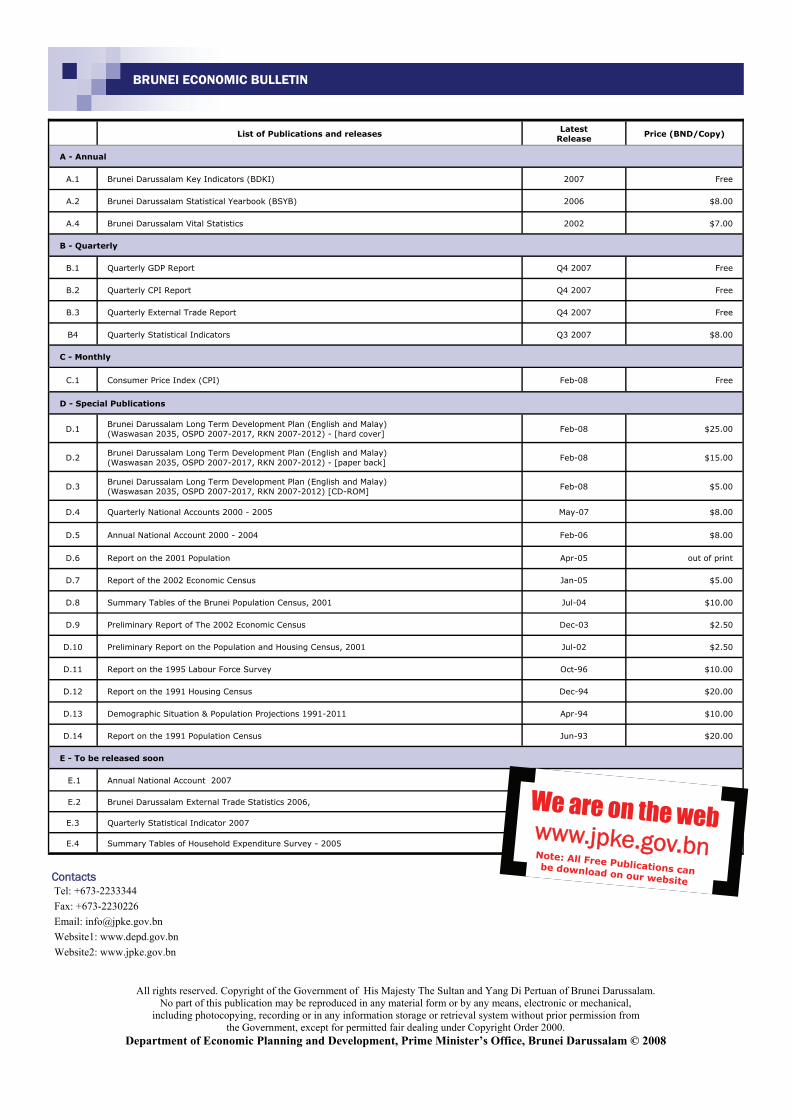
BRUNEI ECONOMIC BULLETIN
All rights reserved. Copyright of the Government of His Majesty The Sultan and Yang Di Pertuan of Brunei Darussalam. No part of this publication may be reproduced in any material form or by any means, electronic or mechanical,
including photocopying, recording or in any information storage or retrieval system without prior permission from the Government, except for permitted fair dealing under Copyright Order 2000.
Department of Economic Planning and Development, Prime Minister’s Office, Brunei Darussalam © 2008
Contacts Tel: +673-2233344 Fax: +673-2230226 Email: [email protected] Website1: www.depd.gov.bn Website2: www.jpke.gov.bn
List of Publications and releases
Latest Release
Price (BND/Copy)
A - Annual
A.1 Brunei Darussalam Key Indicators (BDKI) 2007 Free
A.2 Brunei Darussalam Statistical Yearbook (BSYB) 2006 $8.00
A.4 Brunei Darussalam Vital Statistics 2002 $7.00
B - Quarterly
B.1 Quarterly GDP Report Q4 2007 Free
B.2 Quarterly CPI Report Q4 2007 Free
B.3 Quarterly External Trade Report Q4 2007 Free
B4 Quarterly Statistical Indicators Q3 2007 $8.00
C - Monthly
C.1 Consumer Price Index (CPI) Feb-08 Free
D - Special Publications
D.1 Brunei Darussalam Long Term Development Plan (English and Malay) (Waswasan 2035, OSPD 2007-2017, RKN 2007-2012) - [hard cover]
Feb-08 $25.00
D.2 Brunei Darussalam Long Term Development Plan (English and Malay) (Waswasan 2035, OSPD 2007-2017, RKN 2007-2012) - [paper back]
Feb-08 $15.00
D.3 Brunei Darussalam Long Term Development Plan (English and Malay) (Waswasan 2035, OSPD 2007-2017, RKN 2007-2012) [CD-ROM]
Feb-08 $5.00
D.4 Quarterly National Accounts 2000 - 2005 May-07 $8.00
D.5 Annual National Account 2000 - 2004 Feb-06 $8.00
D.6 Report on the 2001 Population Apr-05 out of print
D.7 Report of the 2002 Economic Census Jan-05 $5.00
D.8 Summary Tables of the Brunei Population Census, 2001 Jul-04 $10.00
D.9 Preliminary Report of The 2002 Economic Census Dec-03 $2.50
D.10 Preliminary Report on the Population and Housing Census, 2001 Jul-02 $2.50
D.11 Report on the 1995 Labour Force Survey Oct-96 $10.00
D.12 Report on the 1991 Housing Census Dec-94 $20.00
D.13 Demographic Situation & Population Projections 1991-2011 Apr-94 $10.00
D.14 Report on the 1991 Population Census Jun-93 $20.00
E - To be released soon
E.1 Annual National Account 2007
E.2 Brunei Darussalam External Trade Statistics 2006,
E.3 Quarterly Statistical Indicator 2007
E.4 Summary Tables of Household Expenditure Survey - 2005
We are on the web www.jpke.gov.bn Note: All Free Publications can be download on our website