Embed Size (px)
Citation preview

Abstract
All gravity data acquired in Austria during the past 50 years by different institutions have been reprocessed and homogenized in
order to compile a new and accurate Bouguer gravity map of the Eastern Alps. Reprocessing was based on modern methods of
terrain correction procedures and a digital terrain model (DTM) with 50 m spacing in order to get accurate corrections even in rough
and mountainous areas. The DTM and digital cadastre also helped correcting the station coordinates that had been extracted from
topographic maps in some of the early surveys. The final data set consists of 54000 stations with an average station distance of
less than 3 km, even in the mountains. Commonly, the Bouguer gravity is based on orthometric rather than on ellipsoidal heights.
Based on the newest geoid models, the Bouguer anomaly for the new map was determined using ellipsoidal heights, and the geo-
physical indirect effect was estimated. Additionally, mass corrections were determined by applying a 2D density model in order to
investigate the errors introduced by assuming constant density in the standard processing. Finally, a stripped gravity map was de-
rived to enhance the effect of sources within the upper crust. The new homogenized gravity data set refers to the absolute gravity
datum and provides a much improved base for present and future Austrian Geoid solutions in Austria and neighbouring countries.
This paper covers collection and processing of gravity data in Austria and presents a new Bouguer gravity map. Results of geolo-
gical interpretation will be subject of future papers.
Alle in Österreich während der letzten 50 Jahre von verschiedenen Institutionen beobachteten Schweredaten wurden homogeni-
siert und einheitlich prozessiert, um eine neue und genaue Bouguerschwerekarte der Ostalpen zu erstellen. Das Reprozessing
stützt sich auf moderne Massenkorrekturverfahren und auf ein digitales Geländemodell (DTM) mit einer räumlichen Auflösung von
50 m, um auch in rauer alpiner Topographie genaue Korrekturen zu erhalten. DTM und digitales Kataster wurden zur Verbesserung
jener Stationskoordinaten eingesetzt, die in den frühen Vermessungsperioden aus den damals verfügbaren topographischen Karten
gewonnen wurden. Der Datensatz enthält gegenwärtig 54000 Stationen mit einem mittleren Stationsabstand von weniger als 3 km,
auch im Gebirge. Aus Gründen der Verfügbarkeit beruhen Bouguerschwerewerte meistens auf orthometrischen und nicht auf ellip-
soidischen Höhen. Auf der Grundlage neuester Geoidmodelle wurde die neue Bougueranomaliekarte erstmals unter Verwendung
von ellipsoidischen Höhen berechnet und der sogenannte geophysische indirekte Effekt abgeschätzt. Außerdem wurde bei den
Massenkorrekturen ein 2D Dichtemodell verwendet, um die Fehler des Standard-Prozessings zu untersuchen, bei dem eine kon-
stante mittlere Dichte angenommen wird. Zur Visualisierung der gravitativen Effekte von Quellen in der oberen Erdkruste erfolgte
schließlich ein gravimetrisches Abdeckverfahren auf der Basis von seismischen Modellen der Krusten-Manteldiskontinuität. Die
neue Schwerekarte im absoluten Schwereniveau dient als wesentlich verbesserte Basis für gegenwärtige und zukünftige Geoidbe-
rechnungen in Österreich und seinen Nachbarländern. Die vorliegende Arbeit beschreibt die Erhebung und das einheitliche Pro-
zessing der Schweredaten in Österreich und stellt die neue Bouguerschwerekarte vor. Die geologische Interpretation der Schwere-
verteilung wird Gegenstand zukünftiger Publikationen sein.
_________________________________________________________________
__________________________________________________________
KEYWORDS
geophysical indirect effectgravity map stripping
2D density modelBouguer anomaly
Eastern Alps
A new Bouguer gravity map of Austria
1)*) 2)Bruno MEURERS & Diethard RUESS
1) Institute of Meteorology and Geophysics, University of Vienna, Althanstraße 14, UZA II, A - 1090 Wien
2) Federal Office of Metrology and Surveying (BEV), Vienna, Austria
*) Corresponding author, [email protected]
Austrian Journal of Earth Sciences Vienna
1. Introduction and Earlier Gravity Map-
ping in Austria______________________________
_______________
______
____________________________________
Gravity data available in Austria have been acquired during
the past 50 years by following institutions:
Federal Office of Metrology and Surveying, Austria
Institute of Meteorology and Geophysics, University of Vi-
enna, Austria
Institute of Geophysics, Mining University of Leoben, Austria
Institute of Geophysics, Technical University of Clausthal,
Germany
OMV AG, Austria,
Institute of Geophysics, Technical University of Vienna, Aus-
tria
In the early days, gravity network design was motivated by
desire to establish an orthometric height system in Austria.
The first gravity map of Austria was an important by-product
(Senftl, 1965) of these efforts. Accordingly, the gravity stations
were mainly established on leveling lines and thus often along
Alpine valleys. In those cases, measurements often reflected
local anomalies caused by the gravity effect of sedimentary
valley fillings, for example. While each station’s vertical coor-
dinates were well determined, their horizontal coordinates are
less accurate because they were read from topographic maps
available at that time. Oil exploration companies built up the
first gravity networks of areal character. However, as the pur-
pose was the detection of hydrocarbon traps, surveying was
Volume 102 2009

confined to the Alpine Foreland, the Vienna Basin and to parts
of the Flysch Zone and the Northern Calcareous Alps of the
Eastern Alps (Zych, 1988). To reach a better understanding
of the crustal structure of the Alps, additional gravity profiles
were established across the Eastern Alps (Ehrismann et al.,
1969, 1973, 1976; Götze et al., 1978) during the late 1960s
and 1970s. In all these cases, vertical coordinates were deri-
ved from precise leveling methods while the horizontal ones
were just read from topographic maps. Moreover, stations
were scarce in rugged mountainous terrain due to limited ac-
cessibility.-2However, interpolation errors as high as 100 µms can occur
in the Bouguer anomaly pattern when stations are arranged
along profiles exclusively (Steinhauser et al., 1990). There-
fore, the first areal investigation including many stations even
at high up mountain flanks and tops has been done during
the late 1970s along the so called Gravimetric Alpine Traver-
se (Meurers et al., 1987). Since that time, both horizontal and
vertical coordinates were determined predominantly by clas-
sical geodetic surveying. The central part of the Eastern Alps
adjoining the Gravimetric Alpine Traverse was covered by
measurements of the Technical University Clausthal (Germa-
ny) (e.g. Götze et al., 1979; Schmidt, 1985). The westernmost
and the south-eastern part of Austria were surveyed by the
Mining University Leoben (Posch and Walach, 1989; Walach
and Winter, 1994). The entire Northern Calcareous Alps have
been investigated for OMV between 1981 and 1986, while
different research projects between 1983 and 1990 were fo-
cused on the Austrian part of the Bohemian Massif (Meurers,
1993; Aric et al., 1997). The gaps remaining especially along
the crest of the Eastern Alps have been filled since 1990 in
cooperation of the Institute of Meteorology and Geophysics
(University of Vienna), the Central Institute for Meteorology
and Geodynamics (Vienna) and the Department of Physical
Geodesy of TU Graz by applying GPS techniques and he-
licopter transportation in otherwise unaccessible mountainous
regions. Gravity data of southern Bavaria has been provided
by Bayerisches Landesvermessungsamt, Munich. Presently
the gravity map of Austria is supported by 54000 stations
(Fig. 1). The average station interval is less than 3 km even
in the high mountains resulting to an average station density 2of 1 station/9 km or higher.
During the past 50 years both data acquisition and proces-
sing methods have been dramatically improved. Depending
on the origin, the available gravity data refers to different da-
___________________________
2. Data processing
Bruno MEURERS & Diethard RUESS
Figure 1: Station distribution of gravity stations used for the new Bouguer anomaly map of Austria._____________________________________
Figure 2: Orthometric vs. ellipsoidal heights and relation to the
geoid undulation. h: ellipsoidal height, H: orthometric height, N: geoidal
height.
A new Bouguer gravity map of Austria
Figure 3: Bouguer anomaly of Austria (BA ) based on the ellipsoidal height system. Contour interval: 10 mGal.ell ___________________________
tum levels and exhibits variable quality and accuracy. There-
fore, data homogenization is required focussing on the gravity
datum and calibration as well as on coordinate determination
and mass correction.
The industrial data (OMV) was tied to a local gravity base
net. Compared to the Austrian gravity base net (AGBN), which
is supported by absolute gravity observations (Ruess and
Gold, 1996), the OMV base net exhibits a constant offset of -5 -2about 15.13 mGal (1 mGal = 10 ms ). Additionally, due to
limited calibration accuracy of the gravimeters used in that
time, all gravity differences between the OMV gravity stations
and the reference station of the OMV net are systematically
affected. Both the correction factor for gravity differences and
the offset have been determined by a common least squares
adjustment of numerous ties between the OMV base net and
AGBN (Meurers, 1992a). Based on these parameters, all gra-
vity data has been finally transformed to the absolute gravity
datum established by Ruess (2002).
Horizontal coordinates have been obtained in many cases by
topographic map digitization based on those maps which were
available when the stations have been established. Maps with
scale of 1:50000 have been used. Therefore, generally the
coordinate accuracy for those stations is estimated as ±25 m,
but even higher errors may occur occasionally. However, apart
from these random errors, low quality of some older maps cau-
ses systematic errors. In order to check gross coordinate er-
rors we compared the station heights with those obtained by
________________________________
____________________
2.1 Gravity datum and calibration
2.2 Correcting erroneous coordinates
interpolating a high resolution digital terrain model (50 m spa-
cing). This method works only well where interpolation does
not seriously smoothen-out the true topography. Erroneous co-
ordinates have been corrected by making use of modern topo-
graphic maps and by utilizing the digital cadastre (Meurers and
Ruess, 2007).
The gravity effect of topographic masses δg was calculated T
by applying a high accurate mass correction method. In the
close vicinity (< 1200 m) of the gravity stations the topogra-
phy is approximated by arbitrarily shaped (polyhedral) bodies
(Meurers et al., 2001) instead of flat topped prisms. The topo-
graphy was represented by a digital terrain model (DTM) with
50 m spacing (Graf, 1996). The gravity effect of polyhedral
bodies can be calculated exactly (e.g. Götze and Lahmeyer,
1988). Correction for major lakes has been applied additio-
nally. Taking the earth curvature into account, all mass cor-
rections have been calculated in spherical approximation up
to a distance of 167 km radius (Hayford zone O ) assuming 2
-3constant density of 2670 kgm . This value is close to the mean
surface rock density in the investigated area.
Commonly, height systems are based on orthometric or nor-
mal heights. However, ellipsoidal heights are required to allow
for a clear physical interpretation of Bouguer anomalies with
respect to their sources (e.g. Meurers, 1992b). Otherwise
Bouguer anomalies, which, in the sense of physical geodesy,
actually are gravity disturbances corrected for topographic
mass effects, are disturbed by the geophysical indirect effect
2.3 Mass correction
3. Bouguer anomaly determination
______________

(GIE, e.g. Hackney and Featherstone, 2003).
The gravity g observed at any arbitrary point P on topography is given in scalar appro-
ximation by equation (1):
(1)
where P is the projection of P down to the ellipsoid along the ellipsoid normal crossing E
P. N is the geoid height and H the orthometric height of the station P (see Fig. 2 for ex-
planation); γ represents the normal gravity; g (P) is the gravity effect of all density inho-S
mogeneities (represented by S in Fig.2) at P; δg denotes the gravity effect at P of all T
topographic masses located between ellipsoid and geoid (δg , ), between geoid and T 0 N
topography (δg , ) and between ellipsoid and topography (δg , ) respectively. If the T N→N+H T 0→ h
Bouguer anomaly BA is based on orthometric heights, then the following relation holds:
(2)
It differs from the gravity effect of all sources (density inhomogeneities) below topogra-
phy just by the GIE, which has no clear physical meaning in terms of sources. Only if
the Bouguer anomaly determination is based on ellipsoidal heights h, then it represents
exactly the gravity effect of any density inhomogeneity below topography and within the
ellipsoid at P:
___________________________________
___________________________________________________
_
____________________________________________________________
→
(3)
Bruno MEURERS & Diethard RUESS
Figure 4: Geophysical indirect effect (GIE) in Austria. Contour interval: 0.1 mGal.___________________________________________________
Pail et al. (2008) have recently cal-
culated a new geoid for Austria us-
ing the homogenized gravity data
presented in this paper as essen-
tial input as well as deflections of
the vertical, GPS and levelling data.
In addition, combining terrestrial da-
ta and a recent global gravity field
model derived from GRACE data
significantly improved representing
long to medium wavelengths. This
geoid model permits the transfor-
mation of orthometric into ellipsoi-
dal heights. Therefore, for the first
time, the Bouguer anomaly BA in ell
the ellipsoidal height system as
well as the GIE has been determi-
ned exactly. The European Geoid
EGG97 (Denker and Torge, 1998)
has been utilized for all areas be-
yond the Austrian territory. Based
on these geoid models both the or-
thometric heights of all gravity sta-
tions and the DTM could be trans-
formed into ellipsoidal heights. In-
stead of evaluating the integral in
equation (3) the normal gravity at
P was represented by a Taylor se-ndries truncated after 2 order terms
both in elevation and geometrical
flattening (Wenzel, 1985). All calcu-
A new Bouguer gravity map of Austria
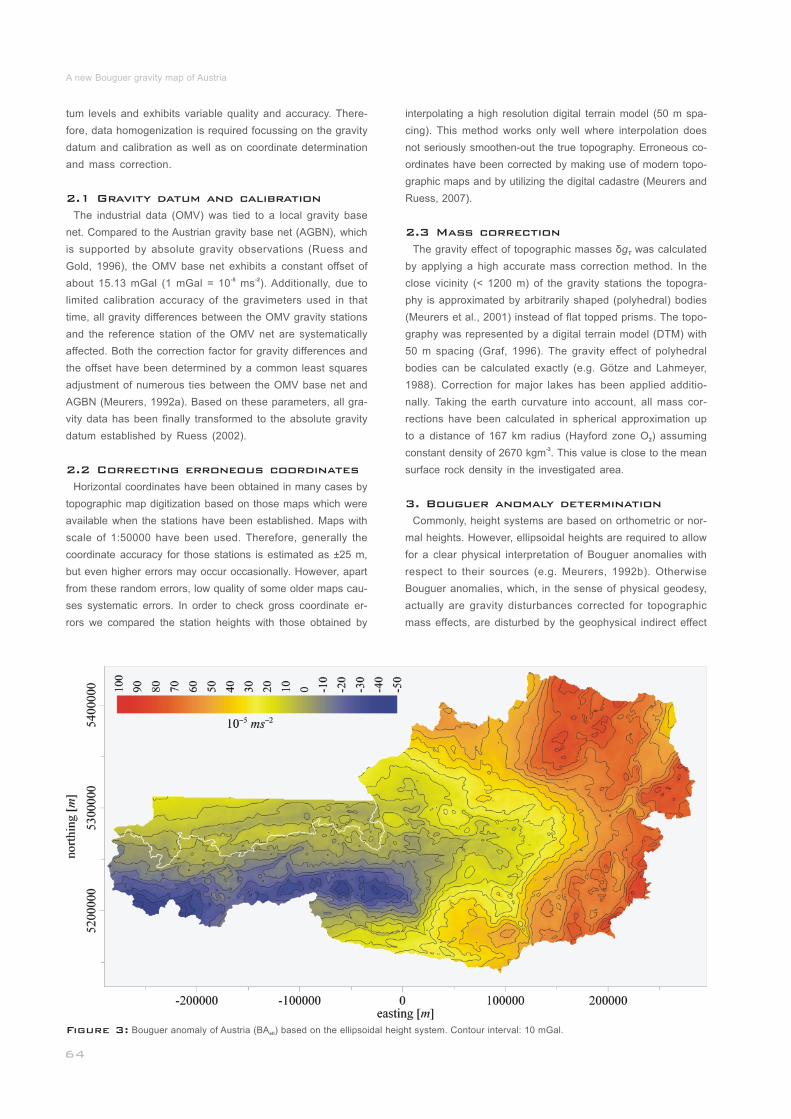
Figure 5: Top: Two dimensional density model of Austria. The black box indicates the section
displayed in Fig. 6. Middle: Bouguer anomaly of Austria (BA ) calculated by applying the 2D density ell
model for the topographic mass correction. Contour interval: 10 mGal. Bottom: Difference between
the Bouguer anomaly calculated by applying the 2D density model for the topographic mass correc--3tion (shown in Fig. 5, middle panel) and constant density of 2670 kgm (shown in Fig. 3) respectively.
Contour interval: 10 mGal.____________________________________________________________
lations were based on the Geodetic Reference System 1980
(Moritz, 1984). Additionally, atmospheric correction (Wenzel,
1985) has been applied for avoiding height dependant errors.
Figs. 3 and 4 show the Bouguer anomaly of Austria according
to equation (3) and the geophysical indirect effect (GIE) res-
pectively. The GIE consists of an average offset of about 9.3
mGal and varies between 8.4 mGal and 10.4 mGal within a re-
gion as small as Austria. Therefore,
knowledge of the GIE is important
for interpretation in terms of upper
mantle structures or isostatic balan-
cing. GIE is closely related to geoid
undulations. This allows deriving a
geoid admittance factor, which turns
out to be 0.197 mGal/m on average
as expected.
Many local anomalies appearing
in Fig. 3 are due to density inhomo-
geneities within topography. 3D mo-
dels for gravity interpretation on re-
gional scale commonly do not incor-
porate such sources. Otherwise mo-
dels of extremely high spatial reso-
lution would be required. However,
controlling such a huge amount of
geometrical parameters in interac-
tive modeling procedures is diffi-
cult. Therefore 2D surface density
models generally help to improve
the mass correction (e.g. Meurers
et al., 1990). Granser et al. (1983)
and Walach (1987), who evaluated
density information from rock sam-
ples and seismic velocities, develo-
ped a surface density model, which
is well suited for that purpose. It
has been improved essentially by
intensive rock sampling, especially
within the Northern Calcareous Alps
and within the southern Bohemian
Massif. Figure 5 presents the sur-
face density model (top panel), the
Bouguer anomaly (BA ) (middle ell
panel) derived by using this 2D de-
nsity model for the mass correction
instead of constant density and, in
the bottom panel, the difference be-
tween the 2D density (Fig. 5, mid-
dle panel) and standard (Fig. 3) ap-
proach. The low density sedimen-
tary filling of the Inn valley has not
__________________
__
4. Bouguer gravity det-
ermination by using a 2D
surface density model
been corrected for. Applying the 2D density model does not
only affect high frequency patterns but also long wavelength
anomalies and the regional trend. Figure 5 (bottom panel)
shows that the difference between both approaches exhibits
both local and regional features with amplitudes up to 20 mGal.
In 3D modeling based on the standard Bouguer gravity, those
long wavelength features would erroneously be interpreted as

Bruno MEURERS & Diethard RUESS
deep seated sources unless topo-
graphy and density distribution is
incorporated into the models in high
spatial resolution, which is common-
ly not the case. Thus, applying 2D
density models for the mass cor-
rection reduces drastically the com-
plexity regarding the model geome-
try in quantitative interpretation of
regional gravity fields. In order to
demonstrate the high frequency dis-
tortions, the Bouguer anomalies
(BA ) - constant density versus ho-ell
rizontally varying density - of the
western Tauern window (TW) area
are compared in Fig. 6. Many high
frequency features associated with
the gravity station pattern are clear-
ly visible in the map resulting from
standard processing (constant den--3sity of 2670 kgm , top panel of Fig.
6). If more realistic density assump-
tions are made (Fig. 6 bottom pa-
nel) by applying the 2D density mo-
del, such features disappear or are
strongly diminished like the amplitu-
de of the local gravity low following
the Ziller valley (Z)._____________
5. Stripped Bouguer anomaly
In order to enhance the image of upper crust structures the
gravity effect of the crust-mantle boundary has been subtrac-
ted from the Bouguer anomaly (BA , 2D density model ap-ell
plied). New Moho depth data derived from recent seismic ex-
periments in Austria (Behm et al., 2007) were merged with da-
ta extracted from a large scale Moho depth model of Europe
(Dezes and Ziegler, 2001). The gravity effect of the crust-
mantle interface was then calculated in flat approximation by
applying discrete Fourier techniques (Parker, 1972) and as--3suming a density contrast of -300 kgm at the crust-mantle
boundary. Fig. 7 reflects the Bavarian and Austrian Molasse
basement structures (MB) much better than Fig. 3. Other re-
markable local anomalies coincide with obviously deep rea-
ching metamorphic rock units of the southern Bohemian Mas-
sif (BM), the Vienna Basin (VB) or the Tauern Window (TW).
Strong positive anomalies characterize the Southern Alps.
This indicates either the Moho depth being overestimated in
that area or the presence of dense material in the crust. Eb-
bing (2004) proposed two different 3D density models along
the TRANSALP geotraverse covering the Tauern window (TW)
area, which both match the observed gravity field. Amongst
others, the models differ by the depth to the crust-mantle
boundary below the Adriatic plate and, consequently, by dif-
ferent densities for the lower crust. Constraints derived from
the TRANSALP seismic experiments favor high density sour-
ces within the crust as explanation (Ebbing, 2004; Ebbing et
al., 2006; Zanolla et al., 2006).
The new Bouguer gravity map of Austria is based on a ho-
mogeneous gravity data set. All data has been reprocessed
by means of mass correction methods, which are accurate
even in high mountainous areas, and high resolution digital
terrain models. Station coordinates of older data have been
essentially improved by utilizing information from DTMs, digi-
tal cadastre and modern topographic maps. The data set pre-
sently contains 54000 stations with an average station inter-
val of less than 3 km even in the mountains, and will be con-
tinuously updated. It refers to the absolute gravity datum and
provides the base for gravimetric geoid calculations as well
as for future crustal investigations. The 2D density model of
Austria permits the calculation of improved mass corrections
and the assessment of errors in the standard processing,
which are caused by assuming constant density. For the first
time, the Bouguer anomaly of Austria was calculated in the
ellipsoidal height system. This allows for exact estimates of
the geophysical indirect effect (GIE), which varies by about 2
mGal within Austria. Thus, eliminating this effect should be-
come a standard for investigations of sub-crustal sources or
isostatic balancing studies. A first attempt of applying new
crust-mantle boundary models derived from recent seismic
_________________________
6. Conclusion
Figure 6: Comparison of the Bouguer anomaly calculated by applying the 2D density model (bot--3tom) and a constant density of 2670 kgm (top) respectively for the topographic mass correction in the
Tauern window area. TW: Tauern window, Z: Ziller valley. Contour interval: 2 mGal._______________

A new Bouguer gravity map of Austria
Figure 7: Stripped Bouguer anomaly (BA , middle panel of Fig. 5) calculated by applying the 2D density model for the topographic mass correc-ell
tion and by subtracting the gravity effect of the crust-mantle boundary (Behm et al., 2007; Dezes and Ziegler, 2001). BM: southern Bohemian Massif,
MB: Molasse basin, TW: Tauern window, VB: Vienna Basin. Contour interval: 10 mGal.___________________________________________________
experiments has been performed to enhance the image of
structures in the upper crust.
Cooperation with following institutions is gratefully acknow-
ledged: Mining University of Leoben (G. Walach); Technical
University of Clausthal (H.J. Götze, now at University of Kiel),
Technical University of Graz (G. Kraiger†, H. Lichtenegger, R.
Pail); OMV AG (D. Zych†); Central Institute for Meteorology
and Geodynamics, Vienna; Austrian Army; Bayerisches Lan-
desvermessungsamt, Munich; Technical University of Vienna
(M. Behm, E. Brückl). Parts of this work were financially sup-
ported by the Austrian Science Foundation (FWF), grants S47/
11, P-9570-GEO, P12343-GEO, and by the Austrian Academy
of Sciences, Vienna. Thanks also to IfE (Hannover) and IAG
for providing the EGG97 geoid model and to reviewers Miro
Bielik, Ewald Brückl and Wolfgang Schollnberger for valuable
suggestions improving the paper.
Geophysical investigations in
the Southern Bohemian Massif. Jahrbuch der Geologischen
Bundesanstalt, 140, 9-28.
__________________________
_______________________
_____________________________
Acknowledgement
References
Aric, K., Gutdeutsch, R., Heinz, H., Meurers, B., Seiberl, W.,
Adam, A. and Smythe, D., 1997.
Behm, M., Brückl, E., Chwatal, W. and Thybo, H., 2007.
Denker, H. and Torge, W., 1998.
Dezes, P. and Ziegler, P.A., 2001.
Ebbing, J., 2004.
Ebbing, J., Braitenberg, C. and Götze, H.J., 2006.
Ehrismann, W., Rosenbach, O. and Steinhauser, P., 1969.
Appli-
cation of stacking and inversion techniques to three-dimen-
sional wide-angle reflection and refraction seismic data of the
Eastern Alps. Geophysical Journal International, doi: 10.1111/
j.1365-246X.2007.03393.x.
The European Gravimetric
Quasigeoid EGG97 - An IAG Supported Continental Enter-
prise. In: Forsberg, R., Feissel, M. and Dietrich, R. (eds.), Geo-
desy on the Move - Gravity, Geoid, Geodynamics and Antarc-
tica. IAG Symposium Volume 119, Springer Verlag, Berlin, Hei-
delberg, New York, pp. 249-254.
European Map of the Mo-ndhorovicic discontinuity. 2 EUCOR-URGENT Workshop (Up-
per Rhine Graben Evolution and Neotectonics), Mt. St. Odile,
France.
The crustal structure of the Eastern Alps from
a combination of 3D gravity modelling and isostatic investiga-
tions. Tectonophysics, 380, 89– 104.
The lithos-
pheric density structure of the Eastern Alps. Tectonophysics,
414, 145– 155.
Ver-
tikalgradient und Gesteinsdichte im Schlegeisgrund (Zillertaler
Alpen) auf Grund von Stollenmessungen. Sitzungsberichte der
Österreichischen Akademie der Wissenschaften, Mathematisch-
Naturwissenschaftliche. Klasse, Abteilung I, 178, 9-10.
____________________________
_________________________
_____________________
_______

Bruno MEURERS & Diethard RUESS
Ehrismann, W., Leppich, W., Lettau, O., Rosenbach, O. and
Steinhauser, P., 1973.
Ehrismann, W., Götze, H.J., Leppich, W., Lettau, O., Rosen-
bach, O., Schöler, W. and Steinhauser, P., 1976.
Götze, H.J. and Lahmeyer, B., 1988.
Götze, H.J., Rosenbach, O. and Schöler, W., 1978.
Götze, H.J., Rosenbach, O. and Schöler, W., 1979.
Graf, J., 1996.
Granser, H., Hösch, K., Steinhauser, P. and Zych, D., 1983.
Hackney, R.I. and Featherstone, W.E., 2003.
Meurers, B., 1992a.
Meurers, B., 1992b.
Meurers, B., 1993.
Meurers, B. and Ruess, D., 2007.
Gravimetrische Detail-Untersuchungen
in den westlichen Hohen Tauern. Zeitschrift für Geophysik, 39,
115-130.
Gravimetri-
sche Feldmessungen und Modellberechnungen im Gebiet des
Krimmler Ache Tales und Obersulzbachtales (Großvenediger
Gebiet/Österreich). Geologische Rundschau, 65, 767-778.
Application of three-di-
mensional interactive modeling in gravity and magnetics. Geo-
physics, 53, 1096-1108.
Gravimetric
measurements on three N-S profiles through the Eastern Alps -
Observational results and preliminary modeling. In: Alps, Apen-
nines, Hellenides. Inter-Union Commission on Geodynamics,
Scientific Report, 38, pp. 44-49, Stuttgart.
Gravime-
trische Untersuchungen in den östlichen Zentralalpen. Geolo-
gische Rundschau, 68, 61-82.
Das digitale Geländemodell für Geoidberech-thnungen und Schwerereduktionen in Österreich. Proc. 7 Int.
Meeting on Alpine Gravimetry, Vienna 1996, Österreichische
Beiträge zu Meteorologie und Geophysik, 14, 121-136.
Über das Dichtemodell in Österreich. - In: Geodätische Arbei-
ten Österreichs für die Internationale Erdmessung, Neue Fol-
ge, Band III, ISBN 3-7041-0113-3, pp. 159-182.
Geodetic versus
Geophysical Perspectives of the ‘Gravity Anomaly’. Geophysi-
cal Journal International, 154, 35-43.
Bearbeitung der Schweredaten der OMV-
AG. Unveröff. Firmenbericht. OMV-AG Wien.
Untersuchungen zur Bestimmung und Ana-
lyse des Schwerefeldes im Hochgebirge am Beispiel der Ost-
alpen. Österreichische Beiträge zu Meteorologie und Geophy-
sik, 6, 146.
Die Böhmische Masse Österreichs im
Schwerebild. 6. Int. Alpengrav. Koll., Leoben 1993, Österrei-
chische Beiträge zu Meteorologie und Geophysik, 8, 69-81.
Compilation of a new Bou-
guer gravity data base in Austria. In: Brunner, F., Kahmen, H.
and Schuh, H. (eds.), Austrian Contributions to IUGG 2007,
Perugia, Italy, Österreichische Zeitschrift für Vermessung und
Geoinformation, 95 (2), pp. 90–94, Wien.
__
_______________________________
_________________
_________________________
_____
__________
____________________
______________
_
________________
Meurers, B., Ruess, D. and Steinhauser, P., 1987.
Meurers, B., Steinhauser, P. and Zych, D., 1990.
Meurers, B., Ruess, D. and Graf J., 2001.
Moritz, H., 1984.
Pail, R., Kühtreiber, N., Wiesenhofer, B., Hofmann-Wellenhof,
B., Of, G., Steinbach, O., Höggerl, N., Imrek, E., Ruess, D.,
Ullrich, C., 2008.
Parker, R.L., 1972.
Posch, E. and Walach, G., 1989.
Ruess, D. and Gold, W., 1996.
Ruess, D., 2002.
Schmidt, S., 1985.
Senftl, E., 1965.
Steinhauser, P., Meurers, B. and Ruess, D., 1990.
Walach, G., 1987.
The Gra-
vimetric Alpine Traverse. In: Flügel, H.W. and Faupl, P. (eds.),
Geodynamics of the Eastern Alps. Ver¬lag Deuticke, Wien,
pp. 334-344.
Berechnung
der Bougueranomalie im Hochgebirge unter Anwendung ei-
nes geologischen Dichtemodells. Jahrbuch der Geologischen
Bundesanstalt, 133, 99-109.
A program system
for high precise Bouguer gravity gravity determination. Proc. th8 Int. Meeting on Alpine Gravimetry, Leoben 2000, Österrei-
chische Beiträge zu Meteorologie und Geophysik, 217-226.
Geodetic reference system 1980. Bulletin
Géodésique, 54, 395-405.
The Austrian Geoid 2007. Österreichische
Zeitschrift für Vermessung und Geoinformation, 96, 3-14.
The rapid calculation of potential anoma-
lies. Geophysical Journal International, 31, 447-455.
Das Bouguerschwerefeld in
Vorarlberg und im Bereich der Übergangszone zwischen West-
und Ostalpen. 5. Int. Alpengrav. Koll., Graz 1989, Österreichi-
sche Beiträge zu Meteorologie und Geophysik, 2, 147-151.
The Austrian Gravity Base Net
1995 stabilized by Absolute Gravity Measurements and Con-
nected to the European Network Adjustment. Österreichische
Zeitschrift für Vermessung und Geoinformation, 84, 275-283.
Der Beitrag Österreichs an UNIGRACE – Uni-
fication of Gravity Systems of Central and Eastern European
Countries. Österreichische Zeitschrift für Vermessung und Geo-
information, 90, 129-139.
Untersuchungen zum regionalen Verlauf des
Vertikalgradienten der Schwere im Hochgebirge. PhD Thesis,
Technical University Clausthal, Clausthal.
Schwerekarte von Österreich. 1:1000000. Bun-
desamt für Eich- und Vermessungswesen, Wien.
Gravity in-
vestigations in mountainous areas. Exploration Geophysics,
21, 161-168.
A digital model of surface rock densities of
Austria and the Alpine realm. In: Sünkel, H. (ed.), The gravity
field in Austria. Geodätische Arbeiten Österreichs für die Inter-
nationale Erdmessung, Neue Folge, Band IV, pp. 3-9, Graz.
___________________________
_
____________________________
___
_______
__
_
_______________________________
__________________
____________
_
A new Bouguer gravity map of Austria
Walach, G. and Winter, P., 1994.
Wenzel, F., 1985.
Zanolla, C., Braitenberg, C., Ebbing, J., Bernabini, M., Bram,
K., Gabriel, G., Götze, H.J.,Giammetti, S., Meurers, B., Nico-
lich, R., Calmieri, F., 2006.
Zych, D., 1988.
Bouguer Anomaly Map of Sty-
ria. In: Sünkel, M. and Marson, I. (eds.): „Gravity and Geoid“,
Joint Symposium of the International Gravity Commission and
the International Geoid Commission, Graz, Austria, Sep 11-17,
1994. Springer.
Hochauflösende Kugelfunktionsmodelle für
das Gravitationspotential der Erde. Wissenschaftliche Arbeiten
der Fachrichtung Vermes¬sungswesen der Universität Hanno-
ver, Nr. 137.
New gravity maps of the Eastern
Alps and significance for the crustal structures. Tectonophy-
sics, 414, 127-143.
30 Jahre Gravimetermessungen der ÖMV Ak-
tiengesellschaft in Österreich und ihre geologisch-geophysi-
kalische Interpretation. Archiv für Lagerstättenforschung der
Geologischen Bundesanstalt, 9, 155-175.________________
Received: 6. February 2009
Accepted: 11. May 2009
1)*) 2)Bruno MEURERS & Diethard RUESS1)
2)
*)
Institute of Meteorology and Geophysics, University of Vienna, Althan-
straße 14, UZA II, A - 1090 Wien
Federal Office of Metrology and Surveying (BEV), Vienna, Austria
Corresponding author, [email protected]
______________________________
__
______________