Embed Size (px)
Citation preview
8th International LS-DYNA Users Conference Simulation Technology (2)
7-39
Finite Element Modeling of Material Damage in Axially-Loaded Aluminum Tubes with Circular Hole Discontinuities
Bryan Arnold and William Altenhof
Department of Mechanical, Automotive, and Materials Engineering, University of Windsor, 410 Sunset Avenue, Windsor, N9B 3P4, Ontario Canada
Abstract Finite element simulations of the axial crushing of extruded aluminum tube structures were conducted using LS-DYNA in order to investigate their load management and energy absorption characteristics. The structures under consideration were made from aluminum alloy 6063-T5 and contained dual centrally located circular hole discontinuities. The results of the finite element simulations are compared to the results of quasi-static experimental crush tests conducted on structures of similar nominal geometry and material properties. Due to the presence of significant cracking and splitting in the crushing modes observed during the experimental crush testing, a material model employing damage mechanics was assigned to the structure models. This material model was calibrated using the experimental crush testing results as well as tensile tests conducted using specimens extracted from the extrusion stock material. A good correlation was observed between the results of the quasi-static crushing experimental results and the results of the finite element simulations. The experimental peak buckling loads of the structures were predicted to within 10% by the finite element simulations.
1. Introduction
Due to the importance of energy absorbing structural members to the crash performance of automobiles, a number of researchers have conducted experimental and numerical studies investigating the crashworthiness of various types of structures. Many researchers have focused their attention on the performance of axially loaded square tubes due to their manufacturability, common application in space frames, and energy absorption ability. This research focused on studying the effect of geometry on the energy absorbing properties of axially loaded extruded aluminum tubes using quasi-static axial crush testing and FE analysis. Dual, centrally located circular hole discontinuities were added to selected structures to study their effect on collapse mode, load/displacement characteristics, and energy absorption ability. It was expected that these discontinuities would act as crush initiators and improve the collapse mode and energy absoption performance of the structures. The effect of tube geometry on the energy absorption of the structures was investigated by considering tubes of varying length and circular hole discontinuity size. FE models of the energy absorbing structures with crush initiators were developed and validated using the results of the experimental testing. A material model was developed incorporating parameters associated with the damage mechanisms within the material. These parameters were developed using a calibration process based on the tensile and crushing experiments.

Simulation Technology (2) 8th International LS-DYNA Users Conference
7-40
2. Experimental Method
In order to ensure accurate material information was obtained, tensile testing was
conducted on dogbone specimens extracted from the tube stock material in the direction of the extrusion. The tensile test specimens were prepared in accordance with ASTM standard E8M [1] and the tensile testing method is described in detail in reference [2]. Twenty-four quasi-static axial crush tests were performed to evaluate the effect of varying geometry on the energy absorption abilities of aluminum extruded tube structures. The geometry of the tube specimens tested is illustrated in Figure 1 and detailed in Table 1. Specimens of common geometry are labeled as groups in Table 1 and will be referred to by group letter. All specimens had a nominal side width (C) of 38.1 mm. Centrally located circular holes with diameters of 14.2 mm and 7.1 mm were then drilled in selected specimens as detailed in Table 1. The quasi-static crush testing method used in this research is described in detail in reference [2].
3. Finite Element Modeling and Simulation Method
FE models were developed and the experimental quasi-static crushing process was numerically simulated for the experimental specimen groups that had circular hole discontinuities (Groups B, C, and E). FE analyses were not conducted on the specimen groups without intentional discontinuities due to the difficulty of discretizing their geometry. The buckling process of square tubes with no intentional discontinuities (or crush initiators) is difficult to numerically model because the collapse process is strongly dependant on small geometric and material discontinuities and imperfections throughout the structure. Although these discontinuities and imperfections also exist in the structures with circular hole discontinuities, their effect on the collapse process is very small compared to the effect of the intentional discontinuity.
3.1 Discretization of the Tubular Specimens
The discretization of the extrusion absorbers was carried out using the parametric mesh generation software Truegrid. The solid element mesh of the 200 mm long, thick walled absorber specimens with large hole discontinuities (group B) is shown in Figure 2. Due to the symmetry observed in the experimental quasi-static crushing process of these specimens, only one quarter of the absorber specimen was considered in these models. In order to accurately capture the stress distribution across the wall thickness of the models meshed with solid elements, four elements through the thickness of the tubes were utilized.
The solid elements used to model the extrusion absorber structures were selectively reduced hexahedral solid elements (solid element formulation # 2 in LS-DYNA). Shell elements (shell element formulation #2 in LS-DYNA) employing a rigid material model were used to model the crosshead (top plate) of the compressive testing machine, as shown in Figure 2. The mesh density used for these shell elements is similar to that of the aluminum alloy tube model.

8th International LS-DYNA Users Conference Simulation Technology (2)
7-41
t
L
C
D
Figure 1. Geometry of extrusion absorber specimens under consideration in the experimental crush testing program. L is the absorber length, D is the diameter of the hole, C is the width of the sidewalls and t is the nominal wall thickness of the specimen.
Table 1. Specimen geometry for AA6063-T5 specimens (all dimensions are in mm).
Group Specimen # Length (L) Wall Thickness (t) Hole Diameter (D) K=A 1-5 200 3.15 No hole L=B 6-10 200 3.15 14.2 M=C 11-14 200 3.15 7.1 N=D 14-19 300 3.15 No hole O=E 19-24 300 3.15 14.2
3.2 Modeling Contact
Contact was modeled between the rigid plate and the tube using a surface-to-surface contact algorithm available in LS-DYNA. Due to the nature of the collapse modes observed in the experimental testing, it was necessary to model contact between the walls of the tube. This was implemented using a single-surface contact algorithm available in LS-DYNA. Both contact algorithms used in the models are penalty based and there was no indication of excessive nodal penetrations during any of the simulations. Values for the coefficients of static and dynamic friction were specified as 0.40 and 0.30 respectively.
3.3 Application of boundary conditions
The axial crushing process of the absorber specimens was modeled by prescribing a constant velocity of 2 m/s to the rigid plate in the axial direction of the tube (the negative Z-direction in Figure 2). Jones [3] notes that crushing speeds in the order of 10 m/s or less may

Simulation Technology (2) 8th International LS-DYNA Users Conference
7-42
be considered quasi-static. This facilitates the comparison of the FE results to the experimental quasi-static crush testing results. The bottom plate of the compressive testing machine was modeled by defining a rigid wall in the X-Y plane directly underneath the absorber. In order to compare the results between models, each absorber model was crushed through a crosshead displacement of 100 mm. In order to ensure that the crushing plate only translated in the Z-direction, and did not experience any rotations, it was necessary to assign nodal constraints to the nodes of the plate. The nodes of the plate were constrained from translating in the X- and Y-directions and from rotating in the X-, Y- and Z-directions. Also, in order to ensure that the symmetry conditions were met, nodes lying in the symmetry planes at the boundaries of the quarter-structure model were constrained to move only within the symmetry planes (i.e. the X-Z and Y-Z planes) as illustrated in Figure 2.
Crosshead plate
Tube
Z
X Y
Figure 2. Discretization of group B specimen (L = 200 mm, D = 14.2 mm, t = 3.15 mm). The inset shows a detail of the mesh of the circular hole discontinuity region.
3.4 Development of Material Model
Hanssen, Hopperstad, Langseth and Ilstad [4] used material model 104 in LS-DYNA to
predict ductile failure during the axial crushing of square tubes. This model uses the von-Mises yield criterion and incorporates non-linear plasticity. Failure is modeled using a damage mechanics theory developed by Lemaitre [5]. The model employs an effective stress, σeff, which is defined in equation (1), where σt is the true stress and D is the damage variable.
Dt
eff −=
1
σσ )10( <≤ D (1)
Hanssen et al. describe the effective stress as accounting for the fact that the evolution of
microcracks and microcavities that occurs during inelastic loading causes a higher stress on the parts of the material that remain undamaged. The criteria for complete rupture is given by D =

8th International LS-DYNA Users Conference Simulation Technology (2)
7-43
Dc, where Dc is the critical damage value which depends on the material and loading conditions. Below the damage threshold, or the plastic strain at which microcracking first occurs (εpD), D remains zero, as illustrated in Figure 3. This plastic strain corresponds to the strain at which material softening first occurs, which corresponds to the ultimate stress.
Figure 3. Relationship between Dc and εpD in comparison to the engineering stress versus engineering strain curve for a typical material [5].
In damage theory, the stress is expressed as a function of damage accumulated plastic
strain, which is defined in equation (2). For strains below εpD, there is no appreciable damage and the value of D is taken as zero, and r is simply equal to εp.
pDr ε)1( −= (2)
The strain hardening model used in material model 104 is described in equation (3).
Here, Q1, Q2, c1, and c2 are parameters that define the isotropic hardening of the material and σv is a parameter governing the strain rate effects. Material hardening is modeled as purely isotropic. vy rcQrcQ σσσ +−−+−−+= ))exp(1())exp(1( 2211 (3)
Material model 104 requires an input of the hardening parameters Q1, Q2, c1, and c2 and
the damage parameters εpD, Dc, and S, which is a positive material parameter. Hanssen et al. used a process of inverse modeling of tensile test specimens in order to determine these parameters and calibrate the model. This involved an iterative process of comparing the results of numerically simulated tensile tests to those of experimental tensile tests. The constants were altered in the models used for each iteration until the numerically determined stress versus strain curve matched the experimentally determined curve closely. The most challenging aspect of this was to find the proper values of S and Dc, such that the region of the numerical stress versus strain curve beyond σu, the ultimate stress, correlated with the experimental curve.
The material parameter S is related to the slope of the damage (D) versus plastic strain (εpD) curve as shown in equation (4). Since σt and E vary through the material softening region of the curve, a singular value of S is not available and the best average value is used in the material model.

Simulation Technology (2) 8th International LS-DYNA Users Conference
7-44
p
t
d
dDDE
S
ε
σ2)1(2 −
= (4)
During the FE simulations, when the critical damage is reached in an element, that
element is deleted from the numerical model. Hanssen et al. found that the damage parameters are partially dependant on mesh density. Therefore they are not referred to as material properties.
3.4.1 Calibration of material model parameters Material model 105 in LS-DYNA was used to model the extrusion absorber materials considered in this research. This material model is similar to model 104 discussed in the previous section, but allows the direct input of the true stress versus true plastic strain data in the form of a piecewise linear curve, which was obtained using the results of the tensile testing in this research. During the simulation, LS-DYNA performs a curve fit of the data and determines the constants Q1, Q2, c1, and c2. Other properties required as input, σy and E, were also obtained from the experimental tensile test results. Poisson’s ratio (v) was defined as 0.35, a typical value for aluminum [6]. An iterative calibration process similar to the one used in reference [4] and described in the previous section was used to determine Dc and S for the four material models. The parameter εpD was input as 0.0, similar as to what was done in reference [4]. However, the calibration process in this research was done in two stages. The first stage involved iterative FE simulations of a tension test, similarly conducted by Hanssen et al., in order to find the parameters S and Dc. As noted in section 3.4, the parameters S and Dc are mesh-dependant. Due to the variations in mesh density between the tensile test FE models and the crush test FE models, it was necessary to further calibrate the material models for use in the absorber crushing simulations.
3.4.2 Numerical tensile test material model calibration process (Stage I) The FE model of the tensile test specimen used to numerically simulate the experimental tensile tests is illustrated in Figure 4. Plane stress shell elements were used for the specimen model. The nodes at one end of the specimen were constrained from motion and a prescribed displacement of 10 mm was assigned to the nodes at the other end. The numerical elongation time history data was obtained by recording the relative displacement of two nodes in the reduced section of the specimen that were 25.4 mm apart (the gauge length of the extensometer used for the experimental tensile testing). Numerical load time history data was obtained by recording the nodal forces in the x-direction in the nodes across the top of the specimen model. These data were analyzed to create an engineering stress versus engineering strain curve based on the material model used in the simulation. The stage one calibration process of the thick-walled AA6063-T5 material model involved fourteen iterations of the FE tensile test simulation. The parameters Dc and S were varied until the numerically determined engineering stress versus engineering strain curve matched closely with the experimentally determined engineering stress versus engineering strain curve. The values of Dc and S are shown in Table 2 for each iteration conducted for the thick-

8th International LS-DYNA Users Conference Simulation Technology (2)
7-45
walled AA6063-T5 model. The numerically determined tensile curves for selected iterations as well as the experimental tensile curve used to calibrate the material model are shown in Figure 5. The failure of the FE tensile model for iteration #14 (the final iteration) is illustrated in Figure 6.
x
y
Figure 4. Tensile test specimen model discretization.
Table 2. Stage I calibration data for each iterative tensile test simulation.
Iteration S (kPa) Dc Iteration S (kPa) Dc 1 1300 0.20 8 1600 0.10 2 1400 0.15 9 1500 0.10 3 1300 0.15 10 1900 0.12 4 1400 0.08 11 3000 0.12 5 1400 0.05 12 2200 0.12 6 1500 0.10 13 1500 0.12 7 1400 0.12 14 1400 0.14

Simulation Technology (2) 8th International LS-DYNA Users Conference
7-46
Figure 5. Comparison between the experimentally obtained engineering stress versus engineering strain curve and the numerically obtained engineering stress versus engineering strain curves of selected iterations.
(a) (b) (c) (d)
Figure 6. Figures (a), (b) and (c) illustrate the deformed geometry during the simulation of the gauge length section of the tensile specimen model for iteration #15 of the AA6063-T5 stage I calibration. Figures 6 (b) and 6 (c) show the deletion of elements that have reached critical damage (D = Dc) from the simulation. Figure (d) illustrates the experimental specimen failure region after testing.
0
50
100
150
200
250
300
0.00 0.05 0.10 0.15 0.20
True Strain (mm/mm)
Tru
e S
tres
s (M
Pa)
experimental 1
5
10
14
12
8th International LS-DYNA Users Conference Simulation Technology (2)
7-47
3.4.1.2 Numerical Crush Test Material Model Calibration Process (Stage II) The stage II calibration process involved running iterative FE absorber specimen crushing simulations in order to adjust Dc to the mesh density of the tube. The numerical deformed geometry plots were compared with experimental photos of the crushing process at matching crosshead displacements. If the simulated material damage (element deletion) for the tube model meshed with solid elements did not follow the experimentally observed material damage (cracking), the value of Dc used in the material model was altered for the next iteration. The 200 mm long specimen with the large hole (specimen group B) was used for this stage of calibration. This process was repeated until the experimentally observed material damage correlated with the FE deformed geometry plots.
The process used in the stage II calibration is illustrated below. The values of Dc and S are shown in Table 3 for each iteration conducted. Figure 7 illustrates experimental photographs of the group B specimen used to calibrate the model along with deformed geometry plots of the corresponding FE model for iteration #3 and #6. In comparing the deformed geometry plots of iteration #6 to the photographs of the experimental specimen, it is evident that the damage parameters used in the material model for iteration #6 correctly predict the initial phase of material damage. For this reason, the damage parameters used for iteration #6 (Dc = 0.45 and S =1400 kPa) were used in the FE models of all the thick walled AA6063-T5 specimens (groups G, H and I).
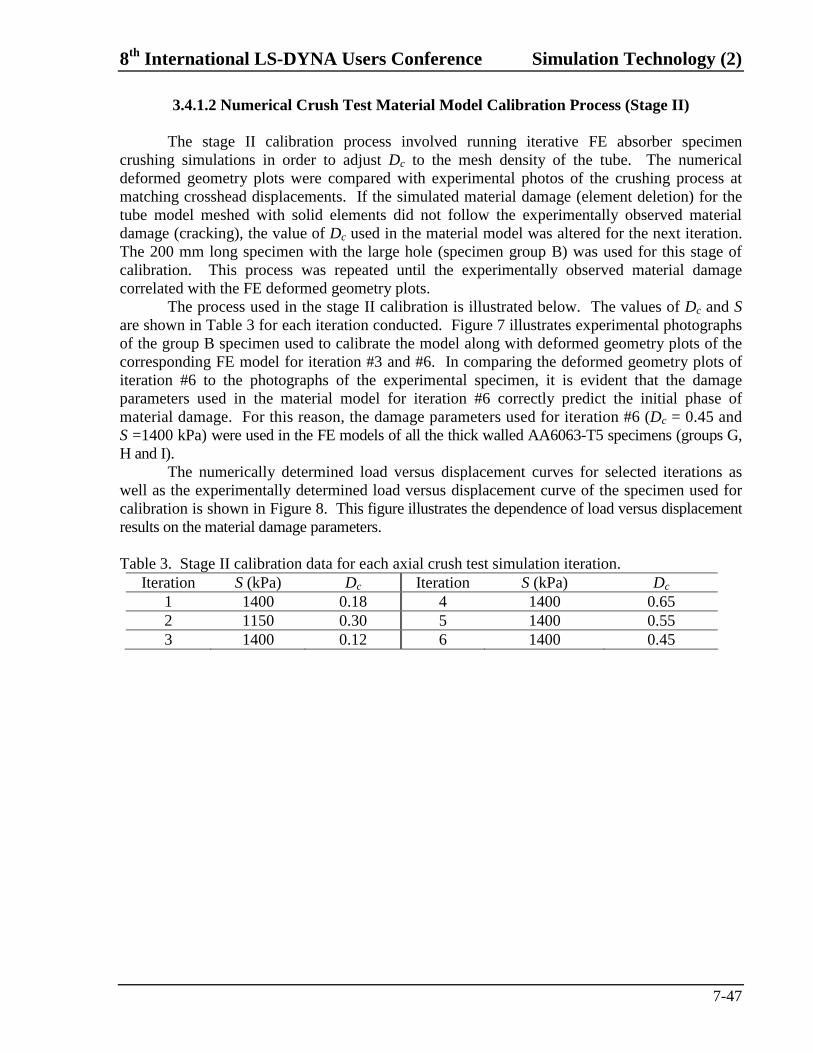
The numerically determined load versus displacement curves for selected iterations as well as the experimentally determined load versus displacement curve of the specimen used for calibration is shown in Figure 8. This figure illustrates the dependence of load versus displacement results on the material damage parameters. Table 3. Stage II calibration data for each axial crush test simulation iteration.
Iteration S (kPa) Dc Iteration S (kPa) Dc 1 1400 0.18 4 1400 0.65 2 1150 0.30 5 1400 0.55 3 1400 0.12 6 1400 0.45

Simulation Technology (2) 8th International LS-DYNA Users Conference
7-48
Experimental:
(a) δ = 0mm (b) δ = 4.5mm (c) δ = 10.0mm (d) δ = 14.0mm
Iteration #3:
(f) δ = 0mm (g) δ = 4.0mm (h) δ = 9.0mm (i) δ = 14.0mm
Iteration #6:
(j) δ = 0mm (k) δ = 4.0mm (l) δ = 9.0mm (m) δ = 14.0mm Figure 7. Comparison of the deformed geometry plots of the iteration #3 and #6 simulations and experimental photographs of the quasi-static crushing of group B specimen #6.

8th International LS-DYNA Users Conference Simulation Technology (2)
7-49
Figure 8. The experimentally obtained load versus displacement curve for experimental specimen #6 (group B) is shown with the numerical load versus displacement curves produced by stage II iterations 3, 5, and 6.
4. Finite Element Analysis Results and Discussion
The collapse modes of the structures considered here were greatly affected by tearing that occurred during the crushing process. After the peak buckling load was reached, the regions on either side of the hole began to crack. This initiated a lateral shift of the top half of the absorber relative to the bottom half, which lead to a splitting mode in which the top half of the absorber acted as a cutter that split the bottom half. The load supported by the structure during splitting was relatively constant and this load is referred to as the plateau load. The collapse modes occurring in all specimens are discussed in more detail in [2].
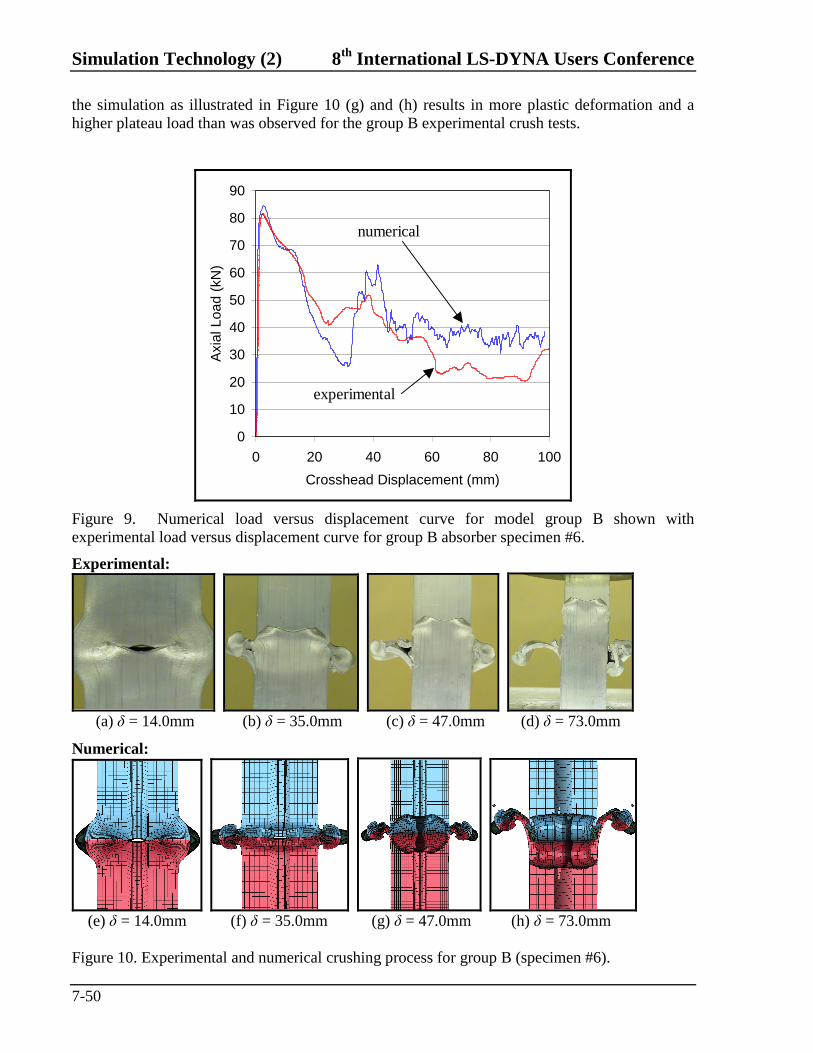
The numerical load versus displacement curve for model group B is shown in Figure 9 along with the experimental curve for group B specimen #6. It is evident from this Figure that the group B simulation predicted the peak buckling and plateau loads quite closely. The numerically predicted collapse mode of model group B is illustrated in Figure 10, which shows deformed geometry plots of the simulation along with pictures from the experimental crush test of group B specimen #6. Figures 10 (a) and (e) illustrate that before cracking occurs, the experimental and numerical collapse modes are nearly identical. However, beyond this point, the collapse modes diverge slightly as illustrated in Figures 10 (b) and (f). These Figures show that in both the experiment and the simulation, a fold forms in the sidewall without the discontinuity while cracking occurs in the sidewall containing the discontinuity. The experimental photos illustrate that the top side wall slides past the bottom side wall and into the tube, while the simulation predicts a fold forming in the sidewall containing the discontinuity at approximately δ = 35 mm. This fold resulted in a large folding point peak force in the simulation at around δ = 40 mm as illustrated in Figure 9. The subsequent rolling of the sidewall halves in
0
30
60
90
0 20 40 60 80 100
Crosshead Displacement (mm)
Axi
al L
oad
(kN
)
experimental
iteration #3
iteration #5
iteration #6
Simulation Technology (2) 8th International LS-DYNA Users Conference
7-50
the simulation as illustrated in Figure 10 (g) and (h) results in more plastic deformation and a higher plateau load than was observed for the group B experimental crush tests.
0
10
20
30
40
50
60
70
80
90
0 20 40 60 80 100
Crosshead Displacement (mm)
Axi
al L
oad
(kN
)
experimental
numerical
Figure 9. Numerical load versus displacement curve for model group B shown with experimental load versus displacement curve for group B absorber specimen #6.
Experimental:
(a) δ = 14.0mm (b) δ = 35.0mm (c) δ = 47.0mm (d) δ = 73.0mm
Numerical:
(e) δ = 14.0mm (f) δ = 35.0mm (g) δ = 47.0mm (h) δ = 73.0mm Figure 10. Experimental and numerical crushing process for group B (specimen #6).

8th International LS-DYNA Users Conference Simulation Technology (2)
7-51
The numerical load versus displacement curve for model E is illustrated in Figure 11 along with the experimentally determined curve for group E experimental specimen #21. Similarly to model B, the simulation of model E predicted a curling of the two halves of the sidewall containing the discontinuity, resulting in a large folding point and a larger plateau load peak in the numerical load versus displacement curve than was observed in the group E crush tests.
0
10
20
30
40
50
60
70
80
90
100
0 20 40 60 80 100
Crosshead Displacement (mm)
Axi
al L
oad
(kN
)
numerical
experimental
Figure 11. Numerical load versus displacement curve for model group E shown with experimental load versus displacement curve for group E absorber specimen #21.
5. Conclusions The experimental tests and numerical simulations conducted in this research have provided a significant amount of information regarding the energy absorption abilities and potential enhancements of square aluminum tubular structures with and without circular hole discontinuities. The following conclusions may be made based on the experiments and simulations conducted in this research:
1. A good correlation was observed between the results of FE simulations and the results of quasi-static crush testing of extrusion absorber structures. Material model 105 in LS-DYNA, which incorporates non-linear plasticity and employs damage mechanics theory, successfully predicted the cracking and complex splitting collapse modes that were observed in experimental testing of the tube specimens.
2. The crush force efficiency for energy absorbing structures with L/C and C/t ratios considered in this research made from extruded AA6063-T5 may be greatly improved by adding circular hole discontinuities at the midpoints of the structures.

Simulation Technology (2) 8th International LS-DYNA Users Conference
7-52
References 1. Annual Book of ASTM Standards (2002), ASTM International, Section 3, Vol. 3.01, Standard E8M, pp.
60-81.
2. B. Arnold, W. Altenhof (2003). Experimental observations on the crush characteristics of AA6061 T4 and T6 structural square tubes with and without circular discontinuities, International Journal of Crashworthiness Vol. 9, No. 1, pp. 73-87
3. N. Jones (1989). Structural Impact, Cambridge University Press.
4. A. Hanssen, O. Hopperstad, M. Langseth and H. Ilstad (2001). Validation of constitutive models
applicable to aluminum foams, International Journal of Mechanical Sciences, Vol. 44, pp. 359-406.
5. J. Lemaitre (1992), A course on damage mechanics, Springer.
6. J. Shigley and C. Mischke (1989), Mechanical Engineering Design, McGraw-Hill Inc., pp. 746, fifth edition.