Embed Size (px)
Citation preview

Fuel from the Savanna: the Social and Environmental Implications of the Charcoal Trade in
Sub-Saharan Africa
by
Robert Eric Bailis
B.S. (Pennsylvania State University) 1994
M.S. (Northwestern University) 1996
A dissertation submitted in partial satisfaction of the
requirements for the degree of
Doctor of Philosophy in
Energy and Resources
in the GRADUATE DIVISION of the UNIVERSITY OF CALIFORNIA, BERKELEY
Committee in charge:
Professor Daniel M. Kammen, Chair
Professor Isha Ray
Professor Louise Fortmann
Fall 2005

The dissertation of Robert Eric Bailis is approved:
Chair: Date
Date
Date
University of California, Berkeley
Fall 2005

Fuel from the Savanna: the Social and Environmental Implications of the Charcoal Trade in
Sub-Saharan Africa
Copyright (2005)
by
Robert Eric Bailis

1
Abstract
Fuel from the Savanna: the Social and Environmental Implications of the Charcoal Trade in
Sub-Saharan Africa
Robert Eric Bailis
Doctor of Philosophy in Energy and Resources
University of California, Berkeley
Professor Daniel M. Kammen, Chair
The heavy reliance on woodfuels that characterizes energy consumption in much of the
developing world is often cast as inherently damaging to the environment. However, a more
critical analysis reveals that the range of social and environmental implications of woodfuel
use are complex and contingent on a wide variety of factors. Moreover, the impacts of
woodfuel use are not necessarily negative for all groups of actors or under all circumstances.
Nor do they necessarily lead to permanent environmental change. In addition, outcomes are
driven as much by social as by environmental conditions. I explore these complexities using
multiple methodologies, including an in depth case study and several analytic models.
For the field-based case study, I conducted a commodity chain analysis of Kenya’s charcoal
trade. Used by nearly half the population and constituting roughly 40% of the country’s
primary energy supply, charcoal is a critical fuel in Kenya. Despite its importance, it is not
regulated by any overarching policy. The regulations that do exist are implemented through
ambiguous and selectively enforced district-level ordinances that local authorities can easily

2
apply to their own advantage. Although they are ostensibly meant to prevent environmental
damage from the charcoal trade, there is little ecological knowledge incorporated into the
design of existing regulations. Moreover, there is no consideration of the socioeconomic
context in which charcoal production occurs. As a result, the regulations, when they are
enforced, foster tension between local land managers and authorities, encourage corruption,
and do little to promote sustainable woodfuel production.
In spite of the popular discourse that portrays charcoal as an agent of environmental
destruction, there are a wide range of social benefits flowing from the country’s charcoal
trade. The trade constitutes an important source of income for tens, if not hundreds of
thousands of charcoal makers throughout Kenya. It also forms part of a land management
strategy for thousands of landowners who supply trees to the charcoal kilns. However,
understanding how and why benefits from the charcoal trade are distributed among different
groups of actors in the commodity chain requires an understanding of the local histories and
social relationships in which the trade is embedded.
For example, in Narok district, where field work was conducted for this research, gradual
reforms in land tenure over the past century, first from communal to corporate tenure and
then to individual freehold tenure, created the conditions in which the charcoal trade now
thrives, aided by an influx of migrants from neighboring districts who supply both their
technical knowledge and their labor to the industry. Simultaneously, conservation efforts in a
large and threatened area of forest that Narok shares with neighboring districts, but which,
ironically, supplies very little of the district’s charcoal, was used to justify authorities’ efforts

3
to clamp down on all trade in forest products, thereby criminalizing charcoal and creating the
space for rent-seeking behavior among corrupt local officials.
Analytically, it is possible to quantify a range of possible outcomes resulting from large-scale
commercial woodfuel exploitation. Outcomes depend strongly on social and political
decisions related to land management. For example, post-harvest decisions are critical in
determining the degree to which a plot of land exploited for woodfuel production is a net
source or sink of carbon. Finally, the availability and affordability of woodfuels, and the
technology with which they are utilized, has additional implications for health and social
welfare. All of these factors are explored below.
i
Table of Contents
List of figures........................................................................................................................... iv
List of tables............................................................................................................................ vii
Dedication page ....................................................................................................................... ix
Acknowledgements................................................................................................................... x
Abbreviations used in text ..................................................................................................... xiii
Chapter 1................................................................................................................................... 1 Introduction........................................................................................................................... 1
The link between woodfuels and deforestation................................................................. 3 Looking beyond deforestation: the social and economic aspects of woodfuels ............... 4 Regulating woodfuels ....................................................................................................... 8
Charcoal’s role in Kenya’s energy mix ................................................................................ 9 Research questions.............................................................................................................. 13
Chapter 2................................................................................................................................. 16 Introduction......................................................................................................................... 18 Narok district ...................................................................................................................... 20
The ecological context in Narok ..................................................................................... 28 Theoretical reflections on environmental change, population, and land tenure ................. 49 Research Methods............................................................................................................... 76
Chapter 3................................................................................................................................. 82 Introduction......................................................................................................................... 82 Demographic change in Narok ........................................................................................... 84 Land Tenure change in Maasailand .................................................................................... 91
Land tenure in Maasailand during colonial rule ............................................................. 91 Group ranch subdivision ............................................................................................... 106 Outcomes of subdivision: cultivation, leasing, and land sales...................................... 118
Charcoal and land-use change in Narok ........................................................................... 138 Conclusion .................................................................................................................... 155
Chapter 4............................................................................................................................... 158 Introduction....................................................................................................................... 158 Foundations of commodity chain analysis (CCA)............................................................ 165 Actors and practices in the charcoal commodity chain .................................................... 175
Landowners and charcoal producers............................................................................. 176 Selling charcoal: the role of brokers, buyers, and transporters..................................... 195 Brokers .......................................................................................................................... 196 Buyers and transporters................................................................................................. 197 Charcoal vendors .......................................................................................................... 207 Charcoal consumers ...................................................................................................... 214
Chapter 5............................................................................................................................... 225

ii
The vertical distribution of benefits from Narok’s charcoal trade.................................... 225 The landowner .............................................................................................................. 226 Charcoal makers............................................................................................................ 227 Between Narok and Nairobi: buyers, brokers, and bribery .......................................... 230 Vendors ......................................................................................................................... 234
Horizontal distribution of benefits and mechanisms of access......................................... 242 Production: landowners and charcoal makers............................................................... 242 Transportation ............................................................................................................... 249 Sales of charcoal in Nairobi .......................................................................................... 253
Regulating charcoal: a new era for Kenya’s energy economy?........................................ 256 Decriminalizing the charcoal trade ............................................................................... 260 Organization of the trade and decentralization of resource management..................... 266
Chapter 6............................................................................................................................... 268 Introduction....................................................................................................................... 268 Charcoal production systems ............................................................................................ 272 Land tenure and land management ................................................................................... 273 Charcoal production technology....................................................................................... 276 LCA models for charcoal and other household fuels ....................................................... 279
General background ...................................................................................................... 279 LCA for climate change from household energy use ................................................... 282
LCA for each household fuel............................................................................................ 288 Fuelwood and Charcoal ................................................................................................ 288 Summarizing the net emissions from wood and charcoal............................................. 303 LPG and Kerosene ........................................................................................................ 306 Summarizing the net emissions from LPG and Kerosene ............................................ 309
Discussion......................................................................................................................... 311
Chapter 7............................................................................................................................... 315 Introduction....................................................................................................................... 315 Methods ............................................................................................................................ 315
Greenhouse gases.......................................................................................................... 321 Results............................................................................................................................... 322 Sensitivity Analyses.......................................................................................................... 325 Discussion......................................................................................................................... 332
References............................................................................................................................. 335
Appendix 1............................................................................................................................ 358 Questions for charcoal producers on private/group land (English) .............................. 359 Nairobi Charcoal Vendors Survey ................................................................................ 365 Sampling frame for Nairobi Charcoal vendors survey ................................................. 367 Guiding questions for in-depth interviews with landowners ........................................ 369 Guiding questions for charcoal buyers and transporters............................................... 371
Appendix 2............................................................................................................................ 373 IGBP land cover classifications........................................................................................ 373
Appendix 3............................................................................................................................ 375

iii
Carrying capacity in Narok’s rangelands.......................................................................... 375
Appendix 4............................................................................................................................ 377 Revenue from different land management options........................................................... 377
Appendix 5............................................................................................................................ 379 Quantitative analysis of charcoal production in 10 kilns.................................................. 379
Appendix 6............................................................................................................................ 385 Trees encountered during field work ................................................................................ 385
Appendix 7............................................................................................................................ 387 Extracts from Kenya’s proposed Forest Bill and Wood Energy Policy ........................... 387

iv
List of figures
Figure 1: Per capita primary energy consumption by fuel source in top-20 energy-consuming countries in sub-Saharan Africa........................................................................................ 5
Figure 2: Charcoal and kerosene price comparison (6-month moving averages from 1998 to 2004) ................................................................................................................................. 8
Figure 3: Charcoal consumption trends: 1980-2000............................................................... 13
Figure 4: Maps showing Narok, Kenya with the location of the MMNR and the district’s main roads ....................................................................................................................... 19
Figure 5: Average annual rainfall measured at Narok meteorological station ....................... 30
Figure 6: Monthly rainfall between 1988 and 2004................................................................ 31
Figure 7: Narok Agro-ecological zones (from (Jaetzold and Schmidt, 1983))....................... 33
Figure 8: Factors that can increase (+) or decrease (-) woody biomass cover in savanna ecosystems ...................................................................................................................... 36
Figure 9: Area under commercial food crops in Narok District (1975-2003) ........................ 43
Figure 10: Population in Narok/Trans Mara Districts from official census data (1948-1999)89
Figure 11: Cumulative area of registered land in Maasai districts (1965-1990) .................. 103
Figure 12: Wheat production areas from 1975-2000 and major charcoal areas in Narok.... 120
Figure 13: Fragmentation (left) and change in median plot size (right) in Kajiado GRs (1980-1996) ............................................................................................................................. 134
Figure 14: Frequency distribution of years making charcoal in Narok based on responses in early 2004...................................................................................................................... 148
Figure 15: A single remaining tree provides shade for livestock ......................................... 154
Figure 16: Main actors in Narok’s charcoal commodity chain............................................. 175
Figure 17: Reason given by charcoal maker for coming to Narok ( “other” reasons are given in the inset).................................................................................................................... 177
Figure 18: Ethnicity reported among charcoal makers surveyed in Narok (n = 50)............. 181
Figure 19: Steps illustrating the sequence of charcoal production ....................................... 191
Figure 20: Means of local charcoal transport: donkeys with and without a donkey cart (mkokoteni). .................................................................................................................. 199
Figure 21: Distribution of main customers among charcoal makers surveyed in Narok...... 201

v
Figure 22: Frequency distribution of charcoal makers selling to different types of buyers disaggregated by sales volume per transaction............................................................. 201
Figure 23: Charcoal lorry leaving Narok District for Nairobi .............................................. 202
Figure 24: Nairobi charcoal vendors – monthly volume of sales (sacks of charcoal).......... 208
Figure 25: Nairobi charcoal vendors: frequency and average monthly sales by vending site....................................................................................................................................... 209
Figure 26: Nairobi charcoal vendors: frequency and average monthly sales by primary customers ...................................................................................................................... 209
Figure 27: Districts supplying charcoal to Nairobi............................................................... 211
Figure 28: Distribution of the means of charcoal transport to Nairobi charcoal vendors (n = 118) ............................................................................................................................... 213
Figure 29: Charcoal consumption in Nairobi (2001)............................................................ 216
Figure 30: Charcoal consumption among urban charcoal-using households stratified by income group ................................................................................................................ 218
Figure 31: Form of charcoal purchase by residential consumers in Nairobi stratified by income group ................................................................................................................ 219
Figure 32: Uses of charcoal among Nairobi households stratified by income group........... 221
Figure 33: List of police checkpoints at which bribes are paid to get charcoal from Narok to Nairobi .......................................................................................................................... 233
Figure 34: Vertical distribution of profits among actors in the Narok-Nairobi charcoal commodity chain........................................................................................................... 236
Figure 35: Large A. xanthophloea cut for charcoal on the banks of the Ewaso Ngiro River, Narok............................................................................................................................. 246
Figure 36: Box-plot of current selling price (Feb-March 2004) for Narok charcoal producers....................................................................................................................................... 247
Figure 37: Box plot of sales volume among Nairobi charcoal vendors disaggregated by sales location (top) and primary customer (bottom).............................................................. 255
Figure 38: Nationwide monthly production from charcoal makers working on different types of land ........................................................................................................................... 262
Figure 39: Kenya land cover showing predominant shrubland and woodland areas ........... 269
Figure 40: Land cover in Narok District and typical area of dense shrubland ..................... 280
Figure 41: LCA Models ........................................................................................................ 285
Figure 42: Land-use change model for estimating emissions from wood harvesting - adapted from (Nabuurs, Garza-Caligaris et al., 2001) ............................................................... 290
Figure 43: Stocks and flows of carbon in the soil module.................................................... 292
Figure 44a: Carbon dynamics in newly established stand of Tarchonanthus camphoratus. 294

vi
Figure 45: Carbon stocks in each stand of shrubs and eucalyptus*...................................... 297
Figure 46: Upstream GHG emissions of household fuels: charcoal production measured in three Earth-mound kilns in sub-Saharan Africa and an improved kiln in Brazil.......... 300
Figure 47: Empirical measurements of emission factors from the end-use of fuelwood and charcoal ......................................................................................................................... 302
Figure 48: Emission factors for the fuelwood and charcoal life-cycle (tC per toncharc in CO2 equivalent units)............................................................................................................ 305
Figure 49: GREET model estimations of raw material extraction and fuel production emissions for LPG and kerosene................................................................................... 308
Figure 50: Empirical measurements of emission factors from the LPG and Kerosene consumption (Smith, Uma et al., 2000). ....................................................................... 308
Figure 51: Net GWI for each stove-fuel combination on the basis of useful energy............ 311
Figure 52: Per capita woodfuel use in sub-Saharan Africa disaggregated by fuelwood and charcoal ......................................................................................................................... 318
Figure 53: GHG emissions from 2000 and 2050 from CO2, CH4, and N2O converted to CO2 equivalent units weighted by 100-year-GWP for each scenario of SSA household energy futures. .......................................................................................................................... 323
Figure 54: Cumulative emissions by fuel (2000-2050) ........................................................ 324
Figure 55: Cumulative emissions and additional impacts of CO and NMHCs (2000-2050)326
Figure 56: Cumulative emissions for both 100-yr and 20-yr GWPs (2000-2050) ............... 328
Figure 57: Cumulative emissions for 60%, 80%, and 100% sustainability in baseline firewood harvest (2000-2050)....................................................................................... 330
Figure 58: Cumulative emissions for 0%, 20%, and 40% sustainability in baseline charcoal harvest (2000-2050) ...................................................................................................... 331

vii
List of tables
Table 1: Major risk factors contributing to morbidity and mortality in SSA and globally in 2000................................................................................................................................... 6
Table 2: Energy consumption by fuel and sector in 2000 (x 1012 Joules) .............................. 10
Table 3: Changes in Kenyan Charcoal Consumption: 1980-2000.......................................... 12
Table 4: Estimates of change in forest cover in Narok District between 1987 and 2001/2.... 45
Table 5: Areas of cultivated crops and leased land among landowners interviewed in July-August, 2004 ................................................................................................................. 122
Table 6: Reported and ideal grain yields in Narok (measured in 90kg bags per acre) ......... 125
Table 7: Priority rankings of agricultural projects proposed in 2002-2008 Narok DDP...... 127
Table 8: Respondents leasing and reasons given for not leasing during the 2004 growing season............................................................................................................................ 131
Table 9: Stages in Friedland’s model of Commodity Systems Analysis (Friedland, 1984). 167
Table 10: Access mapping for commodity chain analysis.................................................... 172
Table 11: Terms of exchange between landowners and charcoal makers (n = 50) .............. 185
Table 12: Charcoal production systems observed in other Kenyan studies.......................... 193
Table 13: Shipping volumes per trip reported by long distance transporters surveyed by ESD-A.................................................................................................................................... 206
Table 14: Source of charcoal arriving in Nairobi charcoal in Feb-March 2004................... 210
Table 15: Charcoal sales among Nairobi vendors by primary customer .............................. 214
Table 16: Common units of sale for charcoal sold in Nairobi.............................................. 219
Table 17: Mix of fuels used by Nairobi households for cooking (2001).............................. 223
Table 18: Inputs revenues and profits for Narok charcoal makers ....................................... 229
Table 19: Costs to transport charcoal from Narok to Nairobi in a typical lorry carrying ~250 35kg bags ...................................................................................................................... 232
Table 20: Costs and profit margins among different groups of Nairobi charcoal vendors... 235
Table 21: Distribution of profits from Narok charcoal exported to Nairobi (~2,000,000 bags/yr) ......................................................................................................................... 239
Table 22: Land tenure system and management practices associated with charcoal production....................................................................................................................................... 275
Table 23: Baseline and alternative models of charcoal production ...................................... 278

viii
Table 24: Life cycle stages and environmental impacts (adapted from (Graedel, 1998)) .... 281
Table 25: Processes and impacts associated with life cycle stages of household energy options in Kenya a ......................................................................................................... 283
Table 26: Initial carbon stocks in stand of native vegetation (T. camphoratus)................... 295
Table 27: Changes in carbon in each production system based on average C-stocks over a 50-year period .................................................................................................................... 298
Table 28: Emission factors from wood extraction and pyrolysis (measured in tC/toncharc)301
Table 29: IPCC default emission factors for heavy duty diesel vehicles (in CO2 eq. units weighted by 100-yr GWPs) (IPCC, 1997b). ................................................................. 302
Table 30: Emission factors for wood and charcoal life cycles (tC per ton-fuel using only KP GHGs and 100 yr GWP) ............................................................................................... 304
Table 31: Emission factors for LPG and kerosene life cycles (tC per ton-fuel using only KP GHGs and 100 yr GWP) ............................................................................................... 309
Table 32: Calorific values, heat transfer efficiencies, and range of GWI for each form of household energy .......................................................................................................... 310
Table 33: Characteristics of the scenarios developed for this analysis................................. 319

ix
Dedication page
For Ben – you’re six weeks old as I type this, which means you missed out on most of the
fun and hard work that went into the pages that follow. Nevertheless, so much of the effort
that these pages represent was expended for you, your generation, and the planet you’ll
inherit from us.

x
Acknowledgements
This research effort would not have been possible without the support and assistance from
numerous people from Berkeley’s campus to Narok’s savanna. First and foremost I thank my
research advisors Professors Dan Kammen, Isha Ray and Louise Fortmann for providing
insight and guidance throughout the entire process. In addition, Professor Majid Ezzati has
been a great source of assistance and support in coauthoring a series of papers related to the
research described in these pages. I am also thankful for the support and assistance I received
from so many people in Kenya. Primarily, I wish to thank the charcoal makers, landowners,
transporters and local officials in Narok who shared their knowledge with me about the
district’s charcoal trade and the processes of land tenure reform that have made it possible.
I also received excellent help from three research assistants without whom my research
would not have been possible. Francis Kage did excellent work in helping me to collect data
from Nairobi charcoal vendors. David Mugambi ably assisted me with field work in Narok;
however, he proved less trustworthy when I asked to work under less supervision. Most
importantly, Florence Njeri was an excellent help over the course of a year assisting me with
a range of interviews and surveys, as well as supervising quantitative assessments of charcoal
production.
I also acknowledge receiving excellent guidance from Professor Evans Kituyi of the
University of Nairobi, and I thank the staff and researchers from the African Centre for
Technology Studies (ACTS) for hosting me during four separate trips to Kenya between

xi
summer 2003 and winter 2005. Particularly Dr. Judi Wakhungu, Benson Ochieng, Harrison
Maganga, Jeremy Lind, Chris Huggins, George Sikoyo, and Elvin Nyukiri, who all provided
excellent logistical support and answered innumerable questions about the environment, law,
and relationships between nature and society in Kenya.
I received further advice and assistance from Marc Hankins, Steve Mutimba and Murefu
Barasa of Energy for Sustainable Development-Africa (ESD-A). ESD-A conducted a
national study on Kenya’s charcoal trade concurrently with my own research and Steve was
kind enough to share their data and their findings with me, much of which helped me to build
a national view of the Kenyan charcoal trade although my own field work was limited to a
single district. Similarly, the staff of Kamfor Co. Ltd. and the Kenyan Central Bureau of
Statistics also shared data that I found invaluable in carrying out my own analysis.
In Kenya, I also received insights into my research from repeated conversations with a range
of experts in energy, forestry, and environmental issues including Dr. Fridah Mugo (Thuiya
Enterprises and unofficial leader of Kenya’s chief charcoal Mafioso), Dr. Chin Ong
(ICRAF), Professor Kingiri Senelwa (Moi University), Max Kinyanjui (Woodlands Trust),
Elsen Karsted and Matthew Owen (Chardust), and Nellie Odour (KEFRI). I also must
acknowledge the US Peace Corps, for introducing me to Kenya nearly ten years ago,
teaching me to speak Swahili at least as well as a Standard VI Kenyan student, and giving me
an opportunity to learn to live in, and love, the country and its people.
Back in Berkeley, in addition to my research advisors, I received indispensable help from
numerous faculty, staff, and students. Professor Kirk Smith and Dr. David Pennise provided
an excellent foundation on which to base my analyses of the climate implications of

xii
woodfuel utilization. Professor Ted Miguel provided guidance during my qualifying exams
and gave me insight into the economic aspects of the woodfuel trade. Within the Energy and
Resources Group, I have benefited a great deal from countless conversations with Arne
Jacobson, Rebecca Ghanadan, Tracy Osborne, Barbara Haya, and Chad White. I must also
acknowledge years of assistance from ERG’s administrative staff, particularly Lee
Borrowman, who worked magic on numerous occasions to see to it that I got reimbursed for
research expenses and paid a living wage in spite of Cal’s inexplicable bureaucracy.
I also acknowledge with thanks funding from a variety of sources including the UC
Berkeley’s Rocca fellowship, the Link Foundation energy fellowship, US EPA
Socioeconomic Drivers Project, and the Energy Foundation.
I must also acknowledge with supreme thanks the love and unswerving support of my family,
specifically my sister Karen and my parents Allen and Fern, who equipped me so well to
undertake this intellectual journey. Lastly, I am indebted to my amazing wife Julie. When we
first met in Naivasha nine years ago, we had no idea what a wild ride we were in for. She’s
seen me off for one, two, or three-month trips away from home more times than she thought
she could stand. She rarely hid her feelings about my travels, but always gave me the
unfaltering support I needed regardless of how much we missed one another while we were
apart. This thesis is as much hers as it is mine and I could not have done it without her.

xiii
Abbreviations used in text
CBS Central Bureau of Statistics (Kenya) CCA Commodity chain analysis COPD Chronic obstructive pulmonary disease dbh diameter at breast height DDP District Development Plan ENSO El Niño Southern Oscillation ESD-A Energy for Sustainable Development-Africa (an energy-focused research and
consulting organization based in Kenya) FAO (United Nations) Food and Agriculture Organization FD Forest department GoK Government of Kenya GHG(s) Greenhouse gas(es) GR Group Ranch (also used for specific place names, e.g. Ngoben GR) ICRAF International Centre for Research in Agroforestry IEA International Energy Agency KANU Kenya Africa National Union KFWG Kenya Forest Working Group KLDP Kenya Livestock Development Project KP Kyoto Protocol KSH Kenyan Shillings – in 2004, 75 KSH = 1 $US KWS Kenya Wildlife Service LCA Life cycle analysis LPG Liquefied Petroleum Gas LRI Lower respiratory infection LU Livestock Unit (see text for definition) LUC Land-use change m-asl meters above sea level MFI Micro-finance institution MMNR Maasai Mara National Reserve MoE Ministry of Energy (Kenya)

xiv
MP Member of parliament (Kenya) NCC Narok County Council NDVI Normalized Difference Vegetation Index NGO Non-governmental organization NTC Narok Town Council PPR Pressure of Population on Resources: see (Blackie and Brookfield, 1987) RELMA Regional Land Management Unit SIDA Swedish International Development Agency SME Serengeti-Mara Ecosystem tC Metric tons of carbon

1
Chapter 1
Social and environmental implications of woodfuel use in sub-Saharan Africa: an overview of the research questions
Wood is the preferred fuel not only of the rural poor but also of many of the urban poor…who use it principally in the form of charcoal. The large concentrated demands that
ensue have led to treeless wastes in peri-urban areas in many parts of Africa…with the areas affected often growing at frightening speed
FAO (1978)
To arrest deforestation one needs to halt the depredations caused by agriculture rather than by fuelwood consumption...Indeed, if all woodfuel use stopped tomorrow,
deforestation rates would hardly be altered.
Leach and Mearns (1988)
Introduction
Every day in Kenya, the equivalent of over forty thousand tons of wood is consumed in the
form of charcoal to serve the energy requirements of households and small businesses across
the country. A similar quantity of wood is used directly in the form of firewood.1 Of course,
1 These figures represent the current estimates used by the Kenyan government to quantify that country’s wood energy consumption (Ministry of Energy, 2002). I cite them here with the caveat that estimating wood energy supply is a highly uncertain process. Reasons for the uncertainty as well as estimates of Kenya’s wood energy consumption from other sources are described in more detail in this introductory chapter as are revisited in Chapter 7.
2
this pattern of energy usage is not unique to Kenya. Woodfuels2 are consumed in a similar
manner across Sub-Saharan Africa, albeit with important variations in proportion of
woodfuel that is processed into charcoal (discussed in Chapter 7) . Woodfuel production and
consumption on this scale has far-reaching implications for social and environmental
conditions in the region. However, not all of the impacts associated with charcoal are
negative. Although many people posit that woodfuel consumption is harmful to the
environment because of toll that it has on the region’s forests and woodlands as well as the
emissions that are associated with wood pyrolysis and combustion, the actual impact that
woodfuel consumption has on tree cover is neither well documented nor completely
understood.
Efforts to empirically measure (Brocard, Lacaux et al., 1996; Bertschi, Yokelson et al., 2003;
Pennise, 2003) and analytically model (Bailis, Ezzati et al., 2003; Bailis, Ezzati et al., 2005a)
the impact of emissions resulting from the region’s woodfuel consumption have revealed that
the overall impact is strongly dependent on the degree to which woodfuels are harvested
2 Throughout the text, I will follow the convention established by the United Nation Food and Agriculture Organization (FAO) in classifying different forms wood energy for the purposes of accounting for national wood supplies (FAO, 2000). Biomass energy refers to any form of energy derived from non-fossil organic matter including wood, non-woody plant matter, organic waste, and or any processed by-products thereof. Woodfuel indicates any form of woody biomass used for energy purposes. Woodfuel consists of both fuelwood and charcoal. Fuelwood is used to describe wood that is burned directly for energy purposes with no prior processing except perhaps cutting to a usable size. Firewood is often used synonymously with fuelwood. Charcoal is a processed woodfuel that is most derived from wood that has been carbonized by heating it in the absence of sufficient oxygen for full combustion to occur (a process that is described in more detail in Chapter 4). Charcoal can also be produced from non-woody raw materials. When this is the case, is should not be classified as woodfuel for national accounting purposes. Such processing is rare in and other countries of sub-Saharan Africa.

3
sustainably so that stocks of trees do not diminish in the long-term.3 However, these studies
have not yet been linked with empirical field work to describe the social-ecological processes
that occur when trees are harvested for fuel. This failure to connect local-level processes that
shape the micro-practices of woodfuel production to environmental outcomes resulting from
the trade strongly limits the scope of our understanding. My research integrates a field-based
study of woodfuel production with analytical modeling across a range of scales, from local
landscape to national and regional levels, in order to understand how social and
environmental factors shape each other in the context of large-scale wood energy utilization.
The link between woodfuels and deforestation
Past arguments, similar to those reflected in the opening quote to this chapter, held that
woodfuel utilization was wreaking havoc with Africa’s forests (Eckholm, 1975; FAO, 1978).
Such views were ill-constructed, if not completely incorrect (Eckholm, 1984; Leach and
Mearns, 1988; Foley, 2001). However, there are a range of trade-offs and benefits associated
with wood and charcoal.
Despite rhetoric to the contrary, reliance on wood energy is not inherently environmentally
destructive; woodlands in sub-Saharan Africa are resilient ecosystems that can support
repeated wood removals under a range of management practices (Chidumayo, 1993; Hosier,
3 The notion of sustainability with respect to wood harvesting can be complex. For example, in this context, I am simply referring to stocks of woody biomass, which are not diminished in the long-term . However, any disturbance can lead to irreversible changes in the ecosystem so that, while the quantity of wood may not be depleted with repeated harvests of fuel , other aspects of the ecosystem, such as biodiversity or hydrologic function, may be degraded. Throughout the text, I will specify exactly what is meant when the term is used.

4
1993; Foley, 2001). This is not to say that wood scarcity does not plague many communities
across sub-Saharan Africa: it surely does. However, when and where it exists, it is more
likely that woodfuel consumers are the victims of wood scarcity than the cause (Leach and
Mearns, 1988).
When deciding the fate of a patch of woodland, the competing costs and benefits of different
land uses are important determinants of the fate of tree cover (Hosier, 1988; Dewees, 1989).
Other factors, such as demand for agricultural land and expansion of infrastructure are
equally, if not more important factors in the long-term loss of tree cover (Geist and Lambin,
2002).
Looking beyond deforestation: the social and economic aspects of woodfuels
There are a range of additional trade-offs and benefits associated with the use of wood and
charcoal that go beyond the impact of woodfuel consumption on tree cover. For example, the
production and trade in woodfuels constitutes an important form of rural employment for
many of the region’s rural poor (discussed in detail in Chapters 3, 4, and 5). In addition, for
some rural landowners, charcoal production forms an important component of land
management, particularly after land reform created space for alternative land uses, as was
observed in this research.
Further, many countries in the region, including Kenya, lack other forms of domestic energy
resources. Even countries that have substantial domestic stocks of fossil fuels such as Gabon,
Angola, and Nigeria primarily sell their fossil fuels on international markets, leaving the
majority of the population to rely heavily on traditional energy resources. Hence woodfuels

5
provide critical energy services for the vast majority of the population in sub-Saharan
Africa’s, satisfying needs that would otherwise have to be filled by costly imports or simply
go unmet. This is illustrated in Figure 1, which shows per capita fuel consumption in the 20
largest energy-consuming countries of sub-Saharan Africa.4
Figure 1: Per capita primary energy consumption by fuel source in top-20 energy-consuming countries in sub-Saharan Africa
0
20
40
60
80
100
120
South
Africa
Gabon
Nigeria
Zimba
bwe
Angola
Kenya
Sudan
Camero
on
Tanz
ania
Mozam
bique
Côte d’
Ivoire
Ghana
DR Con
go
Ethiop
ia
Seneg
al
Zamb i
aBen
inTo
go
Congo
Namibi
a
per c
apita
ene
rgy
cons
umpt
ion
(GJ/
cap-
year
)
Woodfuels
Hydro
Nuclear fuels
Gaseous fuels
Liquid fuels
Coal
Source: (World Resources Institute, 2003, based on IEA data)
Moreover, as is discussed in Chapter 7, the choice of residential energy has important
implications for public health. Exposure to pollution from woodfuel combustion is one of the
4 Note, people in every country except South Africa use biomass fuels for the majority of their energy needs. South Africa is unique among countries in sub-Saharan Africa for many reasons, including the nature f its energy supply. However, although South Africa’s energy infrastructure rivals many industrialized countries, the per capita use of biomass still matches biomass use in many other countries in the region.

6
leading risk factors for morbidity and mortality in developing regions of the world, as is
shown in Table 1. Both the form of woodfuel and the manner in which it is utilized affect
levels of indoor air pollution. For example, households using charcoal have been shown to
have 90% lower concentrations particulate matter than households using fuelwood in open
fires (Ezzati, Kammen et al., 2000a; Ezzati and Kammen, 2002).5
Table 1: Major risk factors contributing to morbidity and mortality in SSA and globally in 2000 DALYs a Mortality Risk factor SSA World SSA World Malnutrition 29.5% 27.8% 11.0% 15.7% Unsafe sex 10.9% 20.7% 5.2% 6.9% Unsafe water 5.3% 5.8% 3.1% 3.7%
Indoor smoke from solid fuels 3.5% 3.8% 2.9% 2.6%
High blood pressure 1.3% 3.9% 12.8% 4.4% Drugs and alcohol 2.2% 2.2% 3.6% 4.8% High cholesterol 0.6% 1.7% 7.9% 3.4% Tobacco 0.7% 1.5% 8.8% 4.1% All other causes 46.1% 32.4% 44.8% 54.3% a The DALY or disability adjusted life-year is a quantitative measure of a population’s morbidity that
quantifies the severity of the illness and the time spent in each state of ill-health. Unlike mortality, DALYs are weighted, with a discount factor, for the age of the stricken individual. Hence, risk factors that result in death and disease concentrated among young people such as Malnutrition, Unsafe sex, and Indoor smoke from solid fuels contribute to a higher fraction of DALYs than they contribute to overall mortality (Murray and Lopez, 1996b).
Source: (WHO, 2003).
Thus, the social and environmental implications of woodfuel use extend well beyond the
commonly cited issue of forest cover. Focusing only on the negative attributes of particular
household fuels can lead to incoherent policies that are unlikely to succeed. This is evident in
5 Exposure to particulate matter is the causal mechanism leading to illness from woodfuel combustion (Smith, Mehta et al., 2004).

7
Kenya, where attempts to regulate the charcoal industry, one of the most important aspects of
the country’s woodfuel economy, have led to the widespread criminalization of the trade.
Charcoal is the principal woodfuel in urban areas of many less developed countries,
including Kenya.6 There are a number of reasons why people in dense urban settlements
favor charcoal over wood: it has a higher energy density, it burns more cleanly (which
reduces exposure to harmful pollutants), and it is easier to transport, handle, and store (FAO,
1983; van der Plas, 1995). Charcoal can be purchased in small amounts, making it flexible
and affordable even for the poorest households. Similarly, charcoal-burning stoves are quite
inexpensive, making it a more attractive fuel for the urban poor than other fuels available in
urban markets such as LPG and electricity. Kerosene, which is, to some extent, a substitute
fuel for charcoal, is subject to price volatility. In Kenya, charcoal has shown much more
price stability, as shown in Figure 2, which compares charcoal and kerosene prices over the
past seven years. Price stability is important an important aspect of fuel choice among the
urban poor. As the plot shows, the price of charcoal has declined in real terms since a
climate-induced price spike in 1997-8. By the end of 2004, charcoal was 20% cheaper than
kerosene in energy terms. Finally, many people favor charcoal because it is considered a
more modern fuel than wood, and is thus a kind of status symbol. In Kenya, all of these
factors play a role (Hosier, 1985; Ministry of Energy, 2002).
6 The problematic nature of the urban-rural dichotomy is addressed below. See the discussion of theory in Chapter 2, specifically footnote 40.

8
Figure 2: Charcoal and kerosene price comparison (6-month moving averages from 1998 to 2004)
0
10
20
30
40
50
Dec-97
Dec-98
Dec-99
Dec-00
Dec-01
Dec-02
Dec-03
Dec-04
KH
S/u
nit
6-month moving average: nominalKSH per kg charcoal6-month moving average: nominalKSH per liter kerosene
10
15
20
25
30
Dec-97
Dec-98
Dec-99
Dec-00
Dec-01
Dec-02
Dec-03
Dec-04
1997
US
$/G
J
Six-month moving average forcharcoal: 1997 US$ per GJ
Six-month moving average forkerosene: 1997 US$ per GJ
1997-98 ENSO
The plot on the left shows nominal prices per unit of sale (kilograms for charcoal and liters for kerosene). The plot on the right shows prices adjusted for inflation and converted to units of energy in order to make a direct comparison. The spike in charcoal prices from late 1997 to mid-1998 was the result of a severe El Niño (ENSO) event that brought very heavy rains, washing out roads and bridges and causing prices for all manner of goods produced in rural areas to increase dramatically. Source: data are nationwide 6-month moving averages from monthly data provided by the Kenyan Central Bureau of Statistics (CBS).
Regulating woodfuels
In Kenya, attempts to regulate the woodfuel trade have targeted different stages of the
charcoal commodity chain. For example, there is a ban on production in some areas, while
other areas, production is permitted. In some parts of the country, including areas where
production is officially permitted, producers suffer frequent harassment from local
authorities. Moving up the supply chain, transportation is legal only with a permit. However,
permits are difficult, if not impossible to obtain through proper legal channels, even when the
charcoal itself is legally produced. As a result, much of the charcoal that arrives at retail
markets in Kenya’s cities and towns is transported illegally. Such charcoal may have been

9
snuck through the numerous checkpoints that are found on all major roads in Kenya.
However, it is more likely that authorities manning the checkpoints were bribed in order to
allow the charcoal to pass.
Ironically, once charcoal reaches the market, no attempts are made to control it or restrict its
movement. It is completely legal for retailers to sell and for consumers to use in their homes
and businesses. This apparent contradiction leads to a great deal of confusion among
participants in the trade and sends mixed signals to consumers. Moreover, it creates space for
rent-seeking behavior among authorities charged with enforcing regulations, creating strong
incentives not to carry out enforcement (discussed in Chapter 4 and 5).
Charcoal’s role in Kenya’s energy mix
Kenya, like most countries in sub-Saharan Africa, derives the majority of its energy supply
from woodfuels and other forms of biomass energy (91%). In addition, as is common in
developing countries, the residential sector constitutes the largest consumer of energy (73%).
The breakdown of Kenya’s energy supply in 2000 is given in Table 2. From Table 2, it is
apparent that the wood used for charcoal production constitutes the largest single source of
Kenya’s energy supply. Recent studies estimate that Kenyans produce and consume 2-3
million tons of charcoal annually (Kituyi, Marufu et al., 2001; Ministry of Energy, 2002).7
7 Charcoal consumption is explored as the final stage in the charcoal commodity chain in Chapter 4.

10
Table 2: Energy consumption by fuel and sector in 2000 (x 1012 Joules)
Fuels Category Firewood Wood for Charcoal a
Wood Waste
Farm Residue
Fossil fuels
Elec Total % of total
Rural Households 225,040 121,999 2,183 36,835 6,819 336 393,212 57%
Urban Households 5,739 96,331 1,342 178 6,656 2,603 112,849 16%
Cottage Industries 20,900 45,774 0 0 401 1,273 68,349 10%
Agriculture 0 0 0 0 4,496 0 4,496 1%
Transport 0 0 0 0 45,678 0 45,678 7%
Commerce 0 0 0 0 60,910 5,622 68,280 10%
Total 251,680 264,104 3,525 37,013 124,960 9,834 692,863 100%
Percent of total 36% 38% 1% 5% 18% 1.4% 100% --
a Wood for charcoal is estimated from survey data of charcoal consumption by assuming a mass conversion efficiency of 15% air-dry wood to charcoal and an energy content of air-dry wood of 16 GJ/ton.
Kenya’s charcoal is produced almost entirely by manual laborers. Production is scattered
across thousands of locations, primarily in the country’s expansive woodlands and
shrublands, which constitute over two thirds of Kenya’s total land area.8 Rural and urban
households together accounted for over 80% of charcoal consumption. Commercial,
industrial, and institutional consumers account for the balance; this includes restaurants,
businesses, small-scale industries like metal workers, and schools.
As a result of rapid urbanization and changing patterns of rural consumption, in the past two
decades charcoal use has increased at a rate that far exceeds general population growth.
Unfortunately, household energy surveys at the national scale are infrequent and data is not
available to observe the pattern of growth in detail, only to mark two points in the past two
8 See the map of Kenya’s land cover given in Figure 39 of Chapter 6 (p. 269).
11
decades. The first such survey was performed by the Beijer Institute in 1980 with funding
from Dutch and Swedish development organizations (O'Keefe, Raskin et al., 1984; Hosier,
1985). A second survey was completed in 1997 (Kituyi, Marufu et al., 2001) and a third was
done more recently, in 2000, with the results released in late 2002 (Ministry of Energy, 2002,
described in more detail in the Methods section of Chapter 2). Despite the absence of interim
data, the surveys reveal some interesting trends in household energy demand.
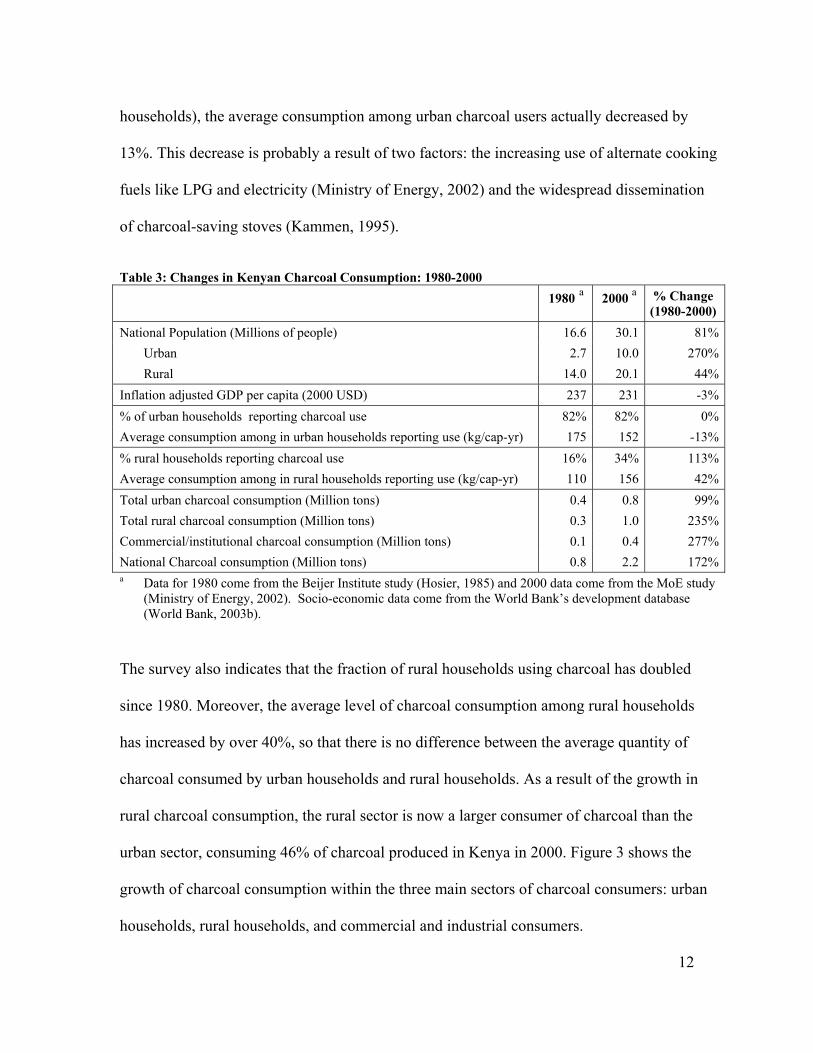
Table 3 is based on the results of the 1980 Beijer Institute survey and the 2000 Kenyan
Ministry of Energy (MoE) Survey.9 It shows how the patterns of charcoal consumption has
changed in the two decades between surveys. In addition, some key socioeconomic
indicators are included as points of reference. In the twenty years between the two surveys,
charcoal consumption increased by over 220% while the total population increased by only
81%. Charcoal is commonly considered an urban fuel, and it is possible that urban population
growth can explain the increase in consumption. Kenya, like most countries in sub-Saharan
Africa, has experienced very high rates of urban population growth.
Between 1980 and 2000, Kenya’s urban population increased nearly four-fold. At first
glance, it seems that the growth in urban population alone could explain the increase in
charcoal consumption. However, the results of the MoE survey tell a more interesting story.
First, while the fraction of urban households using charcoal has remained the same (82% of
9 The results of survey work by Kituyi et al. (Kituyi, Marufu et al., 2001) show patterns of charcoal consumption that are similar to the MoE results with some important differences. However this analysis focuses on the MoE results because they are presented in a form that makes them directly comparable to the results of the original Beijer Institute Survey.
12
households), the average consumption among urban charcoal users actually decreased by
13%. This decrease is probably a result of two factors: the increasing use of alternate cooking
fuels like LPG and electricity (Ministry of Energy, 2002) and the widespread dissemination
of charcoal-saving stoves (Kammen, 1995).
Table 3: Changes in Kenyan Charcoal Consumption: 1980-2000 1980 a 2000 a % Change
(1980-2000) National Population (Millions of people) 16.6 30.1 81% Urban 2.7 10.0 270% Rural 14.0 20.1 44%Inflation adjusted GDP per capita (2000 USD) 237 231 -3%% of urban households reporting charcoal use 82% 82% 0%Average consumption among in urban households reporting use (kg/cap-yr) 175 152 -13%% rural households reporting charcoal use 16% 34% 113%Average consumption among in rural households reporting use (kg/cap-yr) 110 156 42%Total urban charcoal consumption (Million tons) 0.4 0.8 99%Total rural charcoal consumption (Million tons) 0.3 1.0 235%Commercial/institutional charcoal consumption (Million tons) 0.1 0.4 277%National Charcoal consumption (Million tons) 0.8 2.2 172%a Data for 1980 come from the Beijer Institute study (Hosier, 1985) and 2000 data come from the MoE study
(Ministry of Energy, 2002). Socio-economic data come from the World Bank’s development database (World Bank, 2003b).
The survey also indicates that the fraction of rural households using charcoal has doubled
since 1980. Moreover, the average level of charcoal consumption among rural households
has increased by over 40%, so that there is no difference between the average quantity of
charcoal consumed by urban households and rural households. As a result of the growth in
rural charcoal consumption, the rural sector is now a larger consumer of charcoal than the
urban sector, consuming 46% of charcoal produced in Kenya in 2000. Figure 3 shows the
growth of charcoal consumption within the three main sectors of charcoal consumers: urban
households, rural households, and commercial and industrial consumers.

13
Figure 3: Charcoal consumption trends: 1980-2000
46%
37%
36%
50%
17%
13%
0.0
0.5
1.0
1.5
2.0
2.5
1980 2000
Mill
ion
tons
of c
harc
oal
Commercial & Industry
Urban Households
Rural Households
The numbers indicate the percentage that each sector contributes to total consumption for each year. Source: (Hosier, 1985; Ministry of Energy, 2003).
Research questions
As is clear from the discussion above, charcoal is a crucial source of energy for a large
number of Kenyans living in both urban and rural areas. This fact, combined, on the one
hand, with the popular discourse linking woodfuel consumption and deforestation, and, on
the other hand, the Kenyan state’s inconsistent and unsuccessful attempts to control the
charcoal trade, create fertile ground for research. Numerous questions can be raised about the
true impacts social and environmental of Kenya’s woodfuel industry and the efficacy of
current and future attempts to regulate or otherwise manage it for the national good.
Thus, I set out first to understand the ways in which charcoal production in Kenya impacts
both the people who participate and benefit from the trade and the environment in which
production occurs. Second, acknowledging that charcoal production not only has impacts on
people and landscapes, but is also affected by them, I set out to understand how the relations

14
of production and micro-practices of people taking part in the charcoal trade, are shaped by
specific social and environmental conditions.10
In the chapters that follow, I delineate how I accomplished this. In the first part of this thesis,
consisting of Chapters 2-5, I explore the interrelationships between social and environmental
conditions and the woodfuel trade in Narok District, which is the source of one of Kenya’s
largest charcoal commodity chains. I ask specifically:
What conditions permitted the charcoal trade to develop and thrive in Narok?
Who participates in the trade and how do they benefit from their activities?
How does Narok’s environment shape social relations of production?
In what ways is the charcoal trade altering Narok’s landscape?
In Chapter 2, I describe the ecological context in that district, provide an overview of the
theoretical foundations of my inquiry, and describe my research methods in detail. In Chapter
3, I trace the history of demographic change, land use and land tenure change in Narok,
arguing that inflows of migrants from other districts and successive changes in tenure
institutions have drastically altered land use and created conditions in which the district’s
charcoal trade can thrive. In Chapter 4, I explore the theoretical foundations of commodity
chain analysis (CCA) as a research tool and use it to delineate the groups of people who work
10 Kenya’s charcoal industry is highly dispersed. It consists of several distinct modes of production spread across dozens of independent commodity chains. In order to realistically bound my research, I explored the trade originating from single district, Narok, which I identified during preliminary research as one of the nation’s main charcoal production areas.
15
daily to transform Narok’s woodlands into charcoal and deliver it to distant markets. Finally,
in Chapter 5, I define the flows of benefits from the charcoal trade and explore policy options
have been proposed to more effectively regulate the industry.
In the second part of this thesis, consisting of Chapters 6 and 7, I explore the wider
environmental implications of large-scale charcoal production. Specifically, I ask:
What are the local and regional environmental consequences of large-scale woodfuel exploitation?
How do different systems of woodfuel production affect stocks and flows of carbon in the ecosystem?
In Chapter 6, I explore these questions on a local scale by modeling the stocks and flows of
carbon on a single hectare of typical woodland under different charcoal production systems.
In Chapter 7, I consider the broader question of carbon flows across the region by modeling
the long-term effects of wood energy consumption in a series of eight different forecasts. I
conclude that chapter with a discussion of the implications of these regional findings in light
of the local-level complexities of land management revealed in the previous part of the
thesis.

16
Chapter 2
The political-ecological context of the study area, theoretical reflections and research methods
[Boundaries] were brought here by the government, they were not here before…The country you moved to then became yours. So we never had boundaries on our land.
Maasai elder in Euaso Kedong, Kajiado, from an interview in Galaty ( 1992, p. 26)
…a land-tenure system is both a legal framework and a set of customary practices…
Galaty (1994, p. 198)
Commoditization, it is suggested, is central to how ‘people’ – and which people – interact with their environments…
Bernstein and Woodhouse (2001, p. 319)
Narok district is home to a roughly half of Kenya’s Maasai population, Though they
constitute less than two percent of the nation’s population, the Maasai are quite possibly the
country’s best known ethnic group. At the onset of colonial rule, they engendered both
respect and curiosity among the British. The first, because of the near mythological military
prowess – one very early description notes that the Maasai were “dreaded as warriors, laying
all waste with fire and sword,” (Sandford, 1919, p. 10) citing an earlier historical account

17
from (Krapf, 1860). The second, because of their “extreme…pastoral dependency on
livestock, having virtually no agricultural investment in land and a minimal reliance on non-
pastoral produce for their daily diet” (Galaty, 1980, p. 159). Lately however, the Maasai have
undergone significant socioeconomic transitions driven, in large part, by their incorporation
into the Kenya’s market economy. For example, land and livestock, the two mainstays of
Maasai culture and economy, have become very heavily commoditized (Kituyi, 1990; Zaal
and Dietz, 1999), a process which has introduced new relations of exchange and new
pathways for accumulation into the pastoral economy.
In addition, Narok is home to a rapidly growing number of agricultural communities, as well
as one of Kenya’s most important wildlife conservation areas. The latter is an extremely
lucrative tourist attraction. The confluence of forces brought to bear by tensions between
traditional pastoralism and sedentarization within the Maasai community, as well as rapid
agricultural expansion and tourist-driven wildlife conservation occurring in their midst, has
led to significant social and environmental change in the forty-plus years since Kenya’s
independence. These changes have transformed the landscape in much of the district and
given rise to a thriving trade in the district’s forest and woodland resources, including
charcoal. The charcoal trade itself is explored in detail in Chapter 4 and Chapter 5. The social
and historical context of the changes that gave rise to Narok’s charcoal trade will be explored
in this and the subsequent chapter.

18
Introduction
Despite an influx of migrants since independence, Narok district remains thinly populated
relative to other districts in Kenya.1 However, it hosts a large number of visitors from outside
the country because it is home to the Maasai Mara National Reserve (MMNR). “The Mara”,
as many people call the reserve, contains one of the highest concentrations of large
herbivores and predators in the world (Homewood and Rodgers, 1991; Waithaka, 2004;
Government of Kenya, Various years).2 The Reserve, and surrounding land, constitutes the
northern section of the Serengeti-Mara Ecosystem (SME). The Serengeti itself, perhaps even
better known than the Mara, spreads far south into Tanzania. Figure 4 shows the locations of
Kenya in Africa and Narok within Kenya. The MMNR is outlined on both the national and
district maps.
1 For example, the population density in Narok at the time of the last census was 27 people per km2. In neighboring Nakuru, the density is higher by a factor of 7. It is more than 20 times higher in nearby areas of Kisii (Government of Kenya, 2001). Both Nakuru and Kisii are significant sources of migration into Narok. This is discussed in more detail below in the context of landholdings in Chapter 3.
2 The Kenya Rangeland Ecological Management Unit (KREMU) regularly conducts aerial censuses of wildlife and livestock. At a district level, Narok ranks highest in the country in density of large mammalian wildlife, with more than double the density found in the next highest district. It is also just a three to four hour drive from the capital, Nairobi. Not surprisingly, in 2001 (the last year for which data is available, the MMNR had the second highest number of visitors among Kenya’s 25 game parks and reserves with over 200,000 ticketed entries (Government of Kenya, Various years). Since Kenya’s independence, MMNR has been administered by the Narok County Council (NCC). In 1995, Trans Mara District was created from the area of Narok west of the Mara River, which includes a portion of the reserve. Management of that part of the reserve was placed in the hands of a private consortium on behalf of the Trans Mara County Council (The Economist, 2001). Field work for this research was conducted within the current boundaries of Narok District; however, some historical data includes the Trans Mara area. This will be noted where relevant.

19
Figure 4: Maps showing Narok, Kenya with the location of the MMNR and the district’s main roads
#Y
#
Masai Mara National Reserve
#
Narok
20 0 20 40 Kilometers
Equator
#Y
#
Masai Mara National Reserve
#
Narok
20 0 20 40 Kilometers
EquatorEquator Kenya
Naroktown
#Y
#
Masai Mara National Reserve
#
Narok
20 0 20 40 Kilometers
Equator
#Y
#
Masai Mara National Reserve
#
Narok
20 0 20 40 Kilometers
EquatorEquator Kenya
Naroktown
In addition, the district has become home to a large number of migrants seeking wage labor
and/or land to cultivate. Linked both to the influx of non-Maasai into Narok and the Maasai’s
20
own socioeconomic transformation, the district has undergone dramatic shifts in land
management practices resulting in significant environmental change.
Another less visible outcome of these changes is the development of a vibrant charcoal trade
originating from Narok district and serving high-demand markets in and around Nairobi. In
this, and the following four chapters of my dissertation, I will explain why, at this particular
time, Narok has become a major charcoal production area. Changes in the conditions of
access to Narok’s forest and woodland resources, primarily through changes in local land
tenure institutions, have made it possible for thousands of people to benefit from the trade in
multiple ways.
Narok district
Most visitors to Narok District arrive via Nairobi. Leaving Nairobi for Narok, the road
descends a precipitous escarpment into the open expanse of the Great Rift Valley. It stretches
past stands of twisted Acacia drepanolobium (Maa: eluai)3 punctuated by an occasional dusty
row of shops. Two volcanic peaks, Olongonot and Suswa, loom to the north and south
respectively. Midway across the valley, the road enters Narok district, the administrative
home of MMNR. After a long stretch across the Valley, the road ascends the hills on the
western side and enters a landscape that alternates between dense shrubland, open pasture,
smallholder plots of maize and large fields of wheat (see the map of wheat production goven
3 Throughout the text, trees will be referred to by their scientific names. The first mention of the tree will give the full scientific name and the indigenous name in either Maa or Kikuyu. Subsequent references will use the standard abbreviation of the scientific name. See Appendix 6 for a full listing of both scientific and indigenous names of all trees used for charcoal in Narok District or otherwise mentioned in the text.

21
in Figure 12 on p. 120). Here, a keen observer might notice plumes of smoke rising from
small mounds of earth peppering newly cleared shrubland and see blackened sacks of
charcoal stacked for sale by the roadside. When the wind is right, s/he will also catch the
unmistakable scent of wood slowly baking into charcoal.
After a few hours bumping along the potholed tarmac, the road reaches Narok town, a small
but fast growing town with a distinctly frontier feel. The town is home to about 45,000
people (National Environment Management Authority, 2003), and houses the district
administrative offices as well as the Narok Town and County Councils (NCC and NTC
respectively).4 The town center is a marked by a T-junction of poorly paved roads filled with
businesses, butcheries, bars, petrol stations, and curio shops and the agglomeration of idle
men seeking wage employment that is common to all of Kenya’s cities and towns.
Just west of town, the road to the Mara branches south, while the main road continues toward
the towns of Western Kenya. Southward towards the Mara, the cultivated fields and
shrubland give way to grassy savanna. Approaching the arbitrarily defined boundaries of the
4 Kenya’s local government consists of both the District Administration, which is run by appointed officials headed by the District Commissioner (DC) and is directly linked to the national government. There is also a County Council, which is a local institution consisting of elected councilors. Typically, County Councils are fairly powerless, although this may change if Kenyans choose to adopt a new constitution, which is to be decided in an upcoming referendum (Government of Kenya, 2005). However, the Narok County Council (NCC), which controls the revenue generated by tourist visits to MMNR, is the wealthiest County Council in Kenya. It is quite influential and is frequently charged with corruption. Some recent examples of this include fraud, misallocation of lucrative hotel leases, and mismanagement of MMNR resources and diversion of funds (Kwayera, 2003a; Nation Correspondent, 2003; Loefler, 2004). One newspaper article notes, “Maasai Mara, which attracts 60 per cent of nature tourists who come to Kenya every year, earned $50 million in 1997, but…spent no more than $30,000 on infrastructure improvement, schools and health facilities.” (Kwayera, 2003a).

22
reserve, fewer people are visible: perhaps some scattered Maasai settlements, a few herders
with their goats and cattle, and increasing numbers of wildlife.
This snapshot portrays the landscape confronting outsiders visiting Narok, but it conveys
neither the dramatic changes in land use nor the social and environmental transformation that
have occurred in recent decades. Prior to Kenya’s independence in 1963, there was very little
agricultural production in Narok. With the exception of some scattered cultivation that
occurred adjacent to a few isolated administrative centers (Kituyi, 1990), the area was
entirely pastoral: a wide expanse of woody savanna and grassland supporting 100,000
Maasai, over half a million cattle, and twice as many goats and sheep. With the “Maasai
Moves” of 1904 and 1911 (Kituyi, 1990; Okoth-Ogendo, 1991; Kameri-Mbote, 2003) , the
land itself was declared “Crown Land”, and held in “trust” by the local government
authority.5 Although the colonial state controlled Maasai territory, the Maasai’s
organizational structure governing land management did not change much under British rule.
Management was effectively communal, with decisions made by elders at the local level.
Upon independence, the “trust” status remained; it was simply transferred to local
government authorities (Okoth-Ogendo, 1991).
5 The establishment of “Crown Lands” was predicated on the supposed non-utilization of large land areas and lack of a recognized government authority. This effectively dispossessed the indigenous Kenyan population of their land and allowed the colonial administration to dispose of that land as they saw fit (Okoth-Ogendo, 1991). The notion of lands held in “trust” by state authority relegated the indigenous occupants of “Crown Lands” to the status of beneficiaries of state largess, which were the conditions in which the colonial state established the Native Reserves (Sorrenson, 1968; Okoth-Ogendo, 1991).

23
Maasai social organization
Maasai leadership has traditionally been highly local in nature (Halderman, 1972; Jacobs,
1975). Rather than coming under the influence of an overarching “tribal” authority,
communities (Maa: enkutoto) were organized into relatively autonomous sections (Maa:
olosho; plural iloshon).6 Leadership rested in the hands of the senior male elders within a
given olosho. The ascension of traditional Maasai rulers was essentially gerontocratic in
nature, defined by a system of age-sets. Within this system, there are five age-grades, with
senior elders “the most influential group regarding public policy” (Kituyi, 1990, p. 117).
Access to resources in the Maasai community is determined by this organizational system.
Kituyi writes:
In the customary allocation of rights to resources and the spatial context of transhumance, this system of territorial location is central in determining where an individual may live, move with his animals during seasonal hardships, enter stock associateships and accede to production inputs such as water, pasture, and salt-licks. It is also the basis of organizational authority in the hands of age-set leaders, elders’ council and sectional leadership (1990, p. 9).
Since Kenya’s independence, the Maasai’s traditional organizational structure has
increasingly had to compete with alternate, at times competing authoritative forms. Again,
Kituyi (Kituyi, 1990) notes the Maasai are now:
6 Galaty defines the olosho as “the most encompassing level of coordinated political action in the Maasai segmentary territorial system”, ((Galaty, 1980), p. 159) and Spencer ascribes both social and ecological meaning to the olosho as an organizational unit (Spencer, 1988). Resource management decisions within the olosho are discussed further in Chapter 3.

24
…divided into sublocations, locations, constituencies and districts; they are part of a province through which they are thus territorially incorporated into the Kenyan system. Each of these levels also brings new leadership with varied relationships to traditional offices. There are the elected members of parliament whose campaigns for office contain a varied blend of claiming to know the needs of the Maasai and the tricks of a distinctly non-Maasai system. Constituencies may contain parts of an olosho or portions of different iloshon. Then there are sub-chiefs and chiefs who are local agents of government and often also products of traditional leadership offices. These are accountable to an often non-Maasai district officer at the division level, and a district commissioner as the supreme authority in the district (p. 9).
Land tenure and land use in Maasailand
Traditionally, the Maasai had very diffuse concepts of property in land based on flexibility
and opportunistic exploitation within the olosho and reciprocal rights of access to pasture
within neighboring iloshon (Halderman, 1972; Galaty, 1994). In the 40 years since Kenya’s
independence, much of Narok district has undergone a drastic transformation in land tenure,
which has enabled dramatic changes in the economy of the district as well as rapid
environmental change. Narok’s communally held pastoral lands were first transformed into
group ranches, a unique system of corporate tenure introduced in Kenya’s rangelands in
order to promote commercially oriented ranching (Galaty, 1980; Pasha, 1986; Kituyi, 1990;
Galaty, 1994). More recently, many group ranches have been subdivided into individual plots
of land and allocated to their former members. These transformations, which are described in
detail in Chapter 3, have allowed some Narok residents to diversify their productive activities
far more than they could under communal or corporate tenure. Many have branched from
pastoralism into small or large-scale agriculture, while others lease their land either to large-
scale commercial farmers or small-scale farmers from neighboring districts where population
densities are much higher. In the past thirty years, the district has become a grain production

25
zone, supplying between 40% and 60% of the country’s domestically grown wheat
(Government of Kenya, Various years).
Moreover, the area has experienced a rapid increase in the extraction of forest products,
including the development of an informal, but highly commercialized charcoal trade. This
has drawn the attention of a number of local and national government agencies that are
attempting, through various means, to limit the flow of commodities like charcoal, which are
widely associated with environmental degradation (Government of Kenya, 1980-2002;
Ecoforum, 2002; Okwemba, 2003).
The subdivision of rangelands and the changes in land management and land cover
associated with it have had an affect on the viability of pastoralism in many parts of the
district. They have also raised questions about the long-term viability of the region as a major
wildlife conservation area (Serneels and Lambin, 2001; Thompson and Homewood, 2002;
Lamprey and Reid, 2004). This research has revealed strong links between charcoal
production and the expansion of smallholder cultivation. Elsewhere in Kenya, charcoal is
produced on land under a range of management systems (Mugo, 1999; Mugo and Poulstrup,
2003; Mutimba and Barasa, 2005a).7 In Narok, however, charcoal is made exclusively from
land that is being opened for new agricultural production. Landowners who have benefited
from the recent subdivision of group ranches, rely on charcoal to finance the opening of new
7 Charcoal production systems in other parts of Kenya are discussed in Chapter 5.

26
agricultural land, an activity that many would not be willing or able to pay for through other
means as I demonstrate in Chapter 3.
Despite the strong link between charcoal and agricultural production in Narok, most
administrators perceive the two activities very differently. Agricultural production is
considered an ideal development path for a district that used to be dominated by pastoralism.
Small and large-scale agricultural activities are supported to varying degrees by government
and donor-funded projects (Government of Kenya, 1980-2002). In contrast, charcoal
production is viewed as a “menace” and steps are taken to restrict it, if not entirely stamp it
out (Government of Kenya, 1980-2002, 2002-2008 edition, p. 28).8 As a result, charcoal
making is the target of repeated, albeit inconsistent and highly corruptible restrictions in the
name of environmental conservation.
This approach to environmental regulation not only leads to criminalization of an important
land management practice that many district residents currently rely on as the first step in
developing their land for cultivation, it also criminalizes several stages in the supply chain of
one of the country’s most important energy industries.9 In addition, as most charcoal
production in Narok occurs on private land, the state’s attempts to restrict or prevent it
contradicts the very political economic principles that were used to justify the subdivision of
communal and corporate landholdings, permitting the introduction and expansion of
8 However, evidence form the field suggests that local authorities benefit a great deal by maintaining charcoal’s ambiguous legal status and enforcing it when it suits their interests. This is also discussed further in Chapter 5.
9 The role of charcoal in the Kenyan energy economy is discussed in Chapter 1.
27
agricultural in the first place: the superiority of private land ownership and the inviolability
of individual land rights.
Despite popular conceptions of charcoal production as a driver of environmental degradation,
my research indicates that charcoal is not the primary driver of environmental change in
Narok. Rather, ongoing processes of land use change (LUC) are rooted in the agricultural
expansion made possible by the transformation of land tenure and supported by cheap labor
from a steady flow of migrants – processes which have coevolved since the arrival of the
British in Kenya over 100 years ago. Both informants and text-based sources indicate that
LUC in Narok began well before commercial charcoal production was common in the
district, and it is likely to continue even if charcoal production were effectively halted.
Nevertheless, charcoal production does play a role in LUC in that, for reasons explained in
more detail in Chapter 3, it lowers the cost of opening new land. In effect, charcoal facilitates
(or quickens the pace of) clearance of recently subdivided land owned by people who
wouldn’t otherwise be able to mobilize sufficient labor to clear it.
However, targeting a single activity like charcoal production, which is deemed by some to be
undesirable for environmental reasons, ignores the complex interdigitation of land
management practices and land tenure that drives LUC in Narok. This strategy of
environmental management has alienated many land owners and forced the charcoal trade
underground where bribes and other corrupt practices are the norm. The effect has been to
28
raise charcoal prices for urban consumers while making it more difficult to promote
sustainable production in a region that meets ~30% of Nairobi’s charcoal demand.10
In the remainder of this chapter, I describe the political ecological context in Narok district. I
then explore some dimensions of social theory that I have found useful in guiding my
research on the social drivers of environmental change in this dynamic part of Kenya. I
include a number of examples of environmental change in Narok district that have been
brought to light by other researchers. I then close the chapter with a discussion of the
methods that I utilized in this portion of my research.
The ecological context in Narok
In this section, I review some of the ecological context in the district, and present evidence,
brought to light by other researchers, of environmental change that has occurred over the past
century. In addition, I review some of the more relevant political-ecological issues that have
arisen in the district, which, in some cases, have led to a recasting of human-environment
relationships and, in other cases, have resulted in violent conflict.
Land cover in Narok District is dominated by shrubland and savanna, interspersed with
isolated patches of riverine forest.11 The landscape has a varied topography, with well
10 The derivation of this figure is presented in Chapter 5.
11 See the Narok land cover map in See the map of Kenya’s land cover given in Figure 40 of Chapter 6 (p. 280). By most definitions, shrubland is a subset of savanna ecosystems, which include grassland, shrubland, woodlands, and thicket or forest savanna. The classification of tropical savanna and woodland ecosystems is subject to some confusion because arbitrary limits are used to divide categories such as percent canopy cover and/or stature of woody vegetation. However, a common trait to all savanna ecosystems is the seasonality and variability of rainfall. See (Scholes and Hall, 1996) for a full discussion

29
forested mountainous uplands rising over 3000m-asl in the northern part of the district. These
uplands descend to volcanic footslopes and a large central plateau with deep well-drained
soils (Jaetzold and Schmidt, 1983). South of the plateau lies a broad semi-arid plain that
drops below 1000m-asl before rising again with the Loita Hills towards the southeast and the
Serengeti plains towards the southwestern part of the district. The latter stretch south into
Tanzania.
The uplands receive reliable rainfall exceeding 1000 mm yr -1 in most years, while the plains
typically receive about half that amount. The plateau areas between the plains and the
uplands are the locus of both pastoral activity and, more recently, grain cultivation, while the
uplands have increasingly been placed under smallholder cultivation. Much of the central
plateau is covered by dense shrubland dominated by Tarchonanthus camphoratus (Maa: Ol-
leleshwa; Kikuyu: Muleleshwa; commonly shortened to leleshwa by both groups). This part
of Narok receives 700-800 mm of rain annually.12 Recent annual rainfall in Narok town,
which is situated in this transition zone between the plateau and the volcanic footslopes, is
shown in Figure 5.
of the characteristics of tropical savannas and woodlands. In this text, I use land cover categories defined by the International Geosphere-Biosphere Programme (IGBP) (International Geosphere-Biosphere Programme, 2004). This list are provided in Appendix 2.
12 These parts of Narok could be classified as humid savanna, a designation given to savanna receiving an average of at least 600 mm of rainfall per year or having a dry season lasting 5 months or less in typical years (House and Hall, 2003).

30
Figure 5: Average annual rainfall measured at Narok meteorological station
-
200
400
600
800
1,000
1,200
1988
1989
1990
1991
1992
1993
1994
1995
1996
1997
1998
1999
2000
2001
2002
2003
2004
mm
rain
fall
Annual average: 1988-200479-year average measured at Narok w eather station± 1 Std deviation of past 17-year average
Source: (Jaetzold and Schmidt, 1983; Narok Disrict Meteorological Office, 2005).
The figure shows long-term average rainfall of roughly 760 mm yr-1 based on 79 years of
observation (solid line) bracketed by one standard deviation of the past 17 year’s annual
rainfall (dashed lines). Narok shares the common trait of savanna zones throughout sub-
Saharan Africa, with highly variable rainfall from year to year.13 A second defining attribute
of savanna zones is a high degree of seasonality in the distribution of rainfall throughout the
year (Scholes and Hall, 1996; House and Hall, 2003). In Narok, this distribution follows a
weakly bimodal pattern with the majority of rainfall occurring during the period of “long
rains”, which fall between March and May, and a second, less reliable period of “short
13 The 62-year average of 759 mm yr-1 is based on measurements taken between 1917 and 1979 reported in (Jaetzold and Schmidt, 1983); however, no standard deviation is provided in that reference. This average was within 0.5% of the average obtained for the past 17 years (1988-2004) from the Narok meteorological station (Narok Disrict Meteorological Office, 2005). Note, the variability in annual rainfall is relatively high, showing a deviation from the mean by more than one standard deviation in seven of the past 17 years: three years had rainfall that was at least one standard deviation below the mean and four years had rainfall that was at least one standard deviation above the mean.

31
rains”, which occurs between November and January.14 However, this seasonal distribution
also shows a high degree of variability. Average and standard deviation of monthly rainfall in
Narok is shown in Figure 6.
Figure 6: Monthly rainfall between 1988 and 2004
0
40
80
120
160
200
Janu
ary
Februa
ryMarc
hApri
lMay
June Ju
ly
Augus
t
Septem
ber
Octobe
r
Novembe
r
Decembe
r
mm
rain
fall
Average monthly rainfall
95% CI from 17 yrs of data
Source: Narok meteorological station and (Jaetzold and Schmidt, 1983)
For agricultural production, the timing of rainfall is as important as the quantity that falls.
The variation in Narok’s monthly rainfall is relatively high. Thus, crop cultivation is a fairly
risky activity, both because of the variability in timing and quantity of rainfall and the
possibility of prolonged drought (Bernstein and Woodhouse, 2001).
14 A pattern of bimodal rainfall is observed through much of East Africa as a result of the seasonal north-south shift in the intertropical convergence zone (Serneels and Lambin, 2001), with long rains typically occurring from March-May and short rains typically occurring in October and November (Musembi, 1986). As is evident from Figure 6, the recent record shows that short rains have been arriving somewhat later and with greater variability in Narok than is generally observed elsewhere in Kenya. In many areas of Kenya this bimodal pattern of rainfall allows for two growing seasons per year. However, this is not possible in most parts of Narok due to the high degree of uncertainty in the timing and quantity of the short rains.
32
There are also longer term fluctuations of greater or lesser rainfall that may be driven by the
El Niño Southern Oscillation (ENSO), the Indian Ocean Dipole (IOD) cycles, or other
macro-climatic events (Bernstein and Woodhouse, 2001). For example, excessively wet or
dry periods can extend for up to a decade. The historical record of rainfall in Narok shows
that average annual rain the 10-year span between 1955 and 1965 exceeded the annual
average during the 35 years prior to that period by over 50%. This period of excessive
rainfall had important consequences on the region’s ecology, which is discussed in more
detail below (Lamprey and Reid, 2004). Importantly, traditional pastoralism is much more
adaptable to uncertainty in rainfall than either commercial ranching or rain-fed agriculture
because of inherent adaptability of the pastoral production system based on mobility of the
herd and reciprocity in access to grazing. Whereas catastrophic losses from drought in
agricultural are common, they only occur in pastoral systems of production as a result of the
most severe and prolonged drought conditions.
Despite the risk of drought, Narok is unique among pastoral areas in Kenya because roughly
one-third of the district receives sufficient rain and has suitable soils to support rain-fed
agriculture in most years.15 High potential land constituted over 50% of Narok district before
Trans Mara District was split from the rest of Narok. Most of Trans Mara District consists of
high potential land, as shown in Figure 7. However, even without the well-watered pastures
15 In this part of Narok, which constitutes the district’s “grain belt”, approximately six years out of ten receive sufficient rain for a viable crop of locally produced varieties of hybrid maize or wheat. These varieties require 250-300mm of cumulative rainfall during the growing season, which, in Narok, starts just prior to the long rains and runs until July or August (Kenya Seed Company Limited, 2005; Narok District Crops Officer, 2005).

33
of Trans Mara, Narok remains unusually well suited for agriculture relative to Kenya’s other
pastoral areas. For comparison, in Kajiado District, which was combined with Narok to
create the Maasai Reserve during colonial rule, less than 2% of the land area is suitable for
rain-fed agriculture (Sindiga, 1984).
Figure 7: Narok Agro-ecological zones (from (Jaetzold and Schmidt, 1983))
Codes in each zone refer to soil types; see original for full explanation (Jaetzold and Schmidt, 1983).
Trans Mara District (created in 1995)
Narok District (after 1995)
Maasai Mara National Reserve

34
In the past, this “high potential” land provided valuable pasture for both the Maasai and the
abundant population of herbivorous wildlife that migrates out of the SME. More recently
however, changing management practices in arable areas of Narok have brought pastoralists
and wildlife into conflict with agricultural producers. These dynamics are discussed in more
detail below.
The extent of rainfall directly and indirectly affects land cover. Direct effects arise from
water availability for plant growth. However, water availability is not simply a function of
rainfall, but is also dependent on other interrelated factors including potential evaporation,
soil quality, and existing vegetation cover (Scholes and Hall, 1996). Moreover, indirect
effects arise from the impact that precipitation has on human and/or wildlife behavior. For
example, in ecosystems dominated by grasses, abundant rains can lead to an increase in the
quantity and quality of pasture. This support higher concentrations of livestock and/or
herbivorous wildlife. Grazing animals can promote the growth of woody biomass by
removing the herbaceous layer, which competes for light and nutrients. Browsers, on the
other hand, can feed on young seedlings, preventing maturation, thereby maintaining the
herbaceous layer. Thus, herbivory, like rainfall, can have differential effects on vegetative
cover depending on other factors. Breman and Kessler (Breman and Kessler, 1995) explain
this complexity in the following way:
Woody plants vary in their response to gazing…On sandy soils or fluvial landscapes, intensive grazing may lead to an increase in canopy cover, but a strong reduction is also possible. On loamy soils especially in dry zones, canopy cover is reduced by intensive grazing because infiltration [of water] is reduced. However, the highest canopy covers occur on fallowlands and lands near natural or artificial water points (i.e. where grazing pressure is high). Higher rainfalls favor the more positive influences of grazing on woody plants (p. 45).

35
Rainfall and grazing also interact with fire. Fires in savanna ecosystems are inevitable, both
as natural and anthropogenic phenomena. The impacts of fire are numerous:
Fire leads to the loss of volatile compounds of nitrogen, carbon and sulfur. It tends to destroy woody seedlings and sensitive species, particularly those lacking seed adaptations, belowground reserves, and the capacity to sprout back. Rangeland systems…where fire has been a regular feature for centuries, have a correspondingly fire-adapted species composition. In such systems periodic burning enhances the production of good grazing ((Homewood and Rodgers, 1991), p. 103).
Herbivory also carries multiple impacts. These include defoliation, trampling and nutrient
cycling (Homewood and Rodgers, 1991) Rainfall and fire interact with grazing in potentially
complex ways. Under moderate grazing, rainfall increases the quantity of herbaceous
biomass. When the dry season arrives, there can be abnormally high levels of dry matter.
Under normal conditions, fires remove the herbaceous layer, but leave established trees and
shrubs standing and promote germination of dormant seeds, thereby reinforcing woody
biomass cover. However, after excess rain, high fuel loading from herbaceous dry matter
results in very intense burns, which can kill extant trees and destroy the bank of seeds in the
topsoil causing a shift from woody to herbaceous cover (Breman and Kessler, 1995; Lamprey
and Reid, 2004).
With these complex dynamics, both grasses and woody species can thrive in these
ecosystems, but there is a “competitive asymmetry” inherent in these systems such that either
can establish dominance. The outcome of this asymmetry depends on a range of competing
factors (House and Hall, 2003). For example:
…mature trees out-compete grasses for light, water and nutrients, yet grasses out-compete small shrubs and tree seedlings (reducing establishment) and they increase the likelihood of fires which kill small trees…[which can]…lead to structural

36
instability. Often some degree of tree clumping takes place adding further complexity with conditions often very different between the under-canopy and inter-canopy areas (House and Hall, 2003).
Some of these dynamics are illustrated in Figure 8.
Figure 8: Factors that can increase (+) or decrease (-) woody biomass cover in savanna ecosystems
Source: adapted from (Scholes and Hall, 1996) and (Breman and Kessler, 1995)
Such multiple influences render savanna ecosystems “inherently unstable” ((Scholes and
Hall, 1996), p. 69). However, savanna ecosystems are also quite resilient (Chidumayo, 1993;
Hosier, 1993). The apparent paradox of “resilient instablity” is summed up in a review by
Scholes and Archer:
The widespread and persistent occurrence of savannas suggests some form of stability. The phenomenon of bush-encroachment suggests meta-stability. The asymmetry of the competitive effect of trees on grass in relation to the effect of grass on trees implies instability. These viewpoints are not necessarily incompatible because they are based on observations at different scales in space and time…At the scale of a whole landscape, savannas can persist over periods of millennia, since the
Woody Biomass
Nutrients
Grazers
Fire Wood
harvest
Human Population
Air temperature Soil toxicities
Saturation
Clay content Soil depth
Water availability
Browsers
+ +
+ +
+ + + +
– –
–
–
– –
–
+ or –
–
+ or –
+ or –
Rainfall
+ +
Cultivation
+
–
+

37
landscape consists of many patches in different states of transition between a grassy dominance and a tree dominance. ((Scholes and Archer, 1997), p. 526-7).
From this discussion, it should be clear that the notion of such ecosystems evolving toward a
single type of climax vegetation, a notion that was quite common among colonial
administrators, is essentially meaningless (Behnke, Scoones et al., 1993b). Rather, multiple
stable states can exist (and coexist) with temporal and spatial variation and can persist as a
result of a range of natural and anthropogenic influences. Savanna ecosystems are thus best
understood as dynamic systems that are subject to change with or without human influence.
This is not to imply that human influence has not played a role in environmental change in
Narok. As in all East African savanna zones, Narok’s environment has been subject to human
influence through grazing and burning for millennia (Scholes and Archer, 1997). It has
supported pastoral production for much of that time despite intermittent drought and
infrequent, but severe crashes of the pastoral economy (Marshall, 1994). Moreover, as was
discussed above, environmental change, even anthropogenic change, should not be thought
of as inherently negative (Watts, 1985; Homewood, 2005). Socially and politically,
environmental change becomes a cause for concern, that is to say degradation, only if it
reduces “the capability of land to satisfy a particular use” for a particular set of land-users
((Blackie and Brookfield, 1987), p. 8). Thus, in Narok as elsewhere, we must understand
environmental change as an outcome that may or may not lead to degradation depending the
extent to which the productive capabilities of the land have changed (Watts, 1985).
38
Evidence of LUC in Narok
At the beginning of the 20th century, the SME consisted of a broad expanse of grassland with
few trees (primarily Acacia spp.) occurring individually or in small stands (Dublin, 1995).
There were very low densities of herbivores as a result of a disastrous rinderpest epidemic
that decimated ruminant wildlife and livestock, causing the pastoral population to disperse in
the closing years of the 19th century (Kituyi, 1990; Waller, 1999).16 In the early decades of
the 20th century, livestock numbers rebounded slightly, but remained low because of a series
of droughts that persisted though the 1930s. A district-wide livestock census conducted in
1939 revealed only 180,000 cattle (Lamprey and Reid, 2004), which is probably the lowest
stocking density that this region had seen since the creation of the Maasai Reserves
(described in Chapter 3) (Kenya Land Commission, 1933; Waller, 1999; Lamprey and Reid,
2004; Government of Kenya, Various years).
With little grazing pressure and low frequency of fire through the first half of the 20th
century, the region experienced rapid increase in woody vegetation. Dense woody cover
provided ideal habitat for the tsetse fly, which overtook much of the area, thereby reinforcing
low human and livestock populations.17 Dublin notes ironically that this densely thicketed
landscape of the mid-20th century became the focus of colonial conservation efforts; the
16 There is some historical evidence suggesting that the epidemic itself was anthropogenic in nature, as rinderpest was thought to have been introduced in East Africa by the Italian colonization of Ethiopia (Kituyi, 1990).
17 The tsetse fly, which is the main vector for transmission of trypanosomiasis, infested large areas of East Africa during the early years of colonial rule. It heavily restricted both pastoral activity and European settlement (Kenya Land Commission, 1933; Homewood and Rodgers, 1991).

39
colonial administration did not recognize that the same landscape was primarily open
grassland 50 years earlier.
By the late 1950s and early 1960s, the pastoral population had increased dramatically. Efforts
began to resettle formerly abandoned areas in the SME. The same period was characterized
by higher than average rainfall (mentioned above) leading to vigorous growth of herbaceous
vegetation. Consequently, fires that were set in the dry season to clear tsetse-infested areas
were fueled by very dense stocks of dry grass. These fires, which, under normal conditions,
would have thinned undergrowth leaving mature trees intact, burned with enough intensity to
destroy much of the tree cover. As a result of this clearance, the tsetse was largely removed
and livestock numbers increased. A livestock census in 1970 revealed 649,000 head of cattle
(Government of Kenya, Various years).
In the same time period, human-wildlife interactions also played a role in reducing tree
cover. Dublin refers to a Narok District Commissioner’s report from 1955 that cites
increasing human settlement as a factor that forced elephants to concentrate in areas that
were still unpopulated. Elephants can rapidly reduce standing stocks of woody biomass,
particularly when they concentrate in high densities (Homewood and Rodgers, 1991). Their
concentration in unoccupied parts of the SME led to additional woodland decline.
Overall, Dublin estimates that canopy coverage of Acacia woodlands in southern Narok
declined from roughly 30% in 1950 to near zero in 1980.18 Since this transition occurred in
18 Her analysis relied on aerial photographs. She writes, “These losses corresponded significantly to the period of unusually high rainfall, the subsequent fires, which occurred twice and sometimes three times per

40
the 1960s, the low density of woody biomass returned the land to the state that prevailed a
half-century earlier and permitted the expansion of pastoral production into parts of the
district that had been closed to it for decades. This condition has prevailed to the present as a
state of stable equilibrium in the southern half of Narok District.
The environmental changes that occurred in the MMNR and adjacent areas of southern
Narok through the middle of the last century were the result of both natural and
anthropogenic factors and were largely favorable for both pastoral production and large
ruminant wildlife. Further north, dense shrubland continued to dominate the landscape until
more recently when changes in land tenure, which are discussed in more detail in Chapter 3,
permitted the introduction of grain cultivation on a large scale.
In contrast to earlier factors – grazing, rainfall, fire, and wildlife – the introduction of
intensive cultivation in Narok has no historical precedent. Emphasis has changed from
livestock to land as the principle source of livelihood and economic value. During interviews
with landowners who have embraced these changes frequently, the notion of self-
determination and maendaleo, the Swahili word for development, were frequently invoked.
This discursive shift could be indicative of a significant shift in human-environment relations
among certain members of the Maasai community. One of the most significant material
manifestations of this shift is the widespread introduction of wheat farming and other
year, and increasing elephant densities throughout the Serengeti-Mara ecosystem.” ((Dublin, 1995), p. 75). Lamprey notes similar losses of woody cover resulting from high concentration of elephant populations. He cites a study conducted in the early 1960s that found 47-94% loss of tree cover in a series of study plots at Talek, along the northern end of the MMNR, and, although fires were particularly intense, he concludes, the losses were “due more to the actions of elephants than fire.” ((Lamprey and Reid, 2004), p. 1007).

41
commercially-oriented cultivation to this formerly pastoralist region, which is discussed
below.
Commercial grain cultivation
Within a decade of Kenya’s independence, commercial grain cultivation had taken hold in
parts of Narok, and accelerated rapidly over subsequent decades. In 1975, roughly 4,875 ha
was under wheat cultivation (Serneels, Said et al., 2001). By the 1990s, the area under wheat
had increased by a factor of ten (Government of Kenya, 1980-2002). Together with the
cultivation of other commercial food crops, specifically maize, barley, and potatoes, over
100,000 ha of arable land, nearly one fourth of the total arable land in the district, are
currently under cultivation (National Environment Management Authority, 2003). Figure 9
shows the expansion of commercial crop cultivation for major crops grown in the district.19
LUC has had effects on other aspects of Narok’s environment. Crop cultivation occurs in
wetter parts of the district. In the past, these wetter areas served as valuable wet season
grazing for large populations of migratory herds of ruminant wildlife (Homewood, Lambin et
al., 2001; Ottichilo, Leeuw et al., 2001; Serneels and Lambin, 2001). The cultivation of these
19 Data are from (Government of Kenya, 1980-2002; Serneels, Said et al., 2001; National Environment Management Authority, 2003). Missing years represent gaps in the available data. Importantly, this graph only shows crops grown on large farms for commercial production and omits cultivation by smallholders for home consumption, particularly maize. Thus, the total cultivated area in Narok is likely to be higher than the 103,000 ha indicated in the figure for 2003. In addition, prior to 1995, cultivation in the area that is currently Trans Mara District is included. After 1995, it is not included, thus the small drop between the peak year of 1994 and 2002/3 should not be interpreted as a decrease in cultivated area of present-day Narok. In reality, the total cropped area within Narok’s current boundaries may be higher than it was in the early-mid 1990s. However, there is an emerging analysis that may contradict the official district-level cultivation figures (Serneels, 2005).

42
areas has contributed to a 70% decline in the resident population of large herbivores.20 It has
also led to an increase in human-wildlife conflict, with crop raids by wildlife and reprisal
killings by farmers both increasing in frequency in the past 10-15 years (Kameri-Mbote,
2002; National Environment Management Authority, 2003).21 In some areas, wildlife
represent sufficient threat to farming such that people restrict their cultivation rather than
investing time and labor in crops only to lose them to wildlife before or after harvest. One
respondent in this research described the likelihood of a successful harvest as something only
God could control.22
By measuring changes in satellite images of vegetative cover,23 Serneels and colleagues
estimate that 8% of land area in the district, primarily areas that had been dense shrubland
prior to the expansion of commercial agriculture, experienced a reduction in vegetative cover
20 Recent research efforts show substantial reductions in wildlife. Since the late 1970s, resident wildlife populations have declined by 70% (Lamprey and Reid, 2004), with wildebeest specifically declining by ~80% (Ottichilo, Leeuw et al., 2001; Serneels and Lambin, 2001). This decline is blamed largely on the expansion of wheat cultivation. In support of the notion that the loss of wet season grazing contributed to this decline, the researchers indicate that the number of cattle has not changed during the same time period. Moreover, in the adjacent Serengeti ecosystem, with similar patterns of rainfall and wildlife migration, but where there is little cultivation, the number of wildebeest showed no appreciable change (Serneels and Lambin, 2001).
21 Although there is some degree of competition and disease transmission between cattle and ruminant wildlife, as well as some risk of predation by carnivorous wildlife, pastoralists generally coexist with wildlife and have done so for millennia (Homewood and Rodgers, 1991). However, by displacing pasture, agricultural production brings people into direct competition with both grazing and browsing wildlife by reducing habitat and blocking migration routes. Human-wildlife conflict is discussed further in Chapter 3 below.
22 The original quote, in Swahili, was “Ukivuna, ni mungu tu,” meaning “only god [can control] if you harvest [successfully]” - from an interview conducted on February 27, 2004 with a charcoal producer who also farms in the area.
23 In this study, the researchers measured changes in Normalized Difference Vegetation Index (NDVI). NDVI is derived from the reflected radiance in red and near infrared wavelengths, which have characteristic values for different types of vegetation (Singh, 1989). In this case, the researchers used monthly composites of wet season vegetation at 8km x 8km resolution.

43
between 1975 and 1995. Less than one percent of the district experienced an increase in
vegetation in the same period (Serneels, Said et al., 2001). In linking this decline in
vegetation to the expansion of wheat cultivation, these researchers found that roughly one-
third of the reduction in vegetation was observed on just three group ranches, which were
responsible for roughly 70% of the district’s wheat cultivation in 1995 (Government of
Kenya, 1980-2002; Serneels, Said et al., 2001; Serneels, 2005).24
Figure 9: Area under commercial food crops in Narok District (1975-2003)
-
20,000
40,000
60,000
80,000
100,000
120,000
1975
1977
1979
1981
1983
1985
1987
1989
1991
1993
1995
1997
1999
2001
2003
ha u
nder
cul
tivat
ion
PotatoesMaizeBarleyWheat
Source: (Government of Kenya, 1980-2002; Serneels, Said et al., 2001; National Environment Management Authority, 2003)
24 These ranches are Lemek, Ngorengore, and Ololunga. The latter was the focus of several interviews conducted for this research.

44
Loss of forest cover
While the introduction of large-scale commercial wheat cultivation led to extensive reduction
in the district’s coverage of shrubland and woody savanna, additional environmental change
has also occurred in upland forest areas. In those areas, the district has experienced declines
in forest cover as a result of an increase in smallholder agricultural activity. The northern part
of the district is occupied by the southern portion of the Mau Forest Complex. This forested
area is one of five major catchment areas in Kenya. It forms the largest area of highland
forest remaining in East Africa (Akotsi and Gachanja, 2004).25 Since independence, Narok’s
share of the Mau complex has been heavily settled by migrants from outside the district who
have introduced intensive small scale farming (Government of Kenya, 1980-2002). Table 4
shows changes in forest cover among Narok’s different forest areas, indicating roughly half
of the area has been cleared since the late 1980s.26
Environmental change and conflict in Narok
It should not be surprising that the environmental change occurring in Narok discussed in this
section has been heavily politicized and numerous conflicts have arisen. As was discussed
above, groups and individuals use various means to gain and maintain access to resources. In
situations where legal mechanisms are weak, ambiguous, or nonexistent, extra-legal
25 The 400,000 ha Mau Forest Complex extends into four different districts and constitutes the source for all but one of the major rivers that drain on the west side of Kenya’s Rift Valley. It is the source of several rivers draining into into Lake Victoria and it also serves as the main catchment for several of Kenya’s small, but economically important, Rift Valley lakes (Akotsi and Gachanja, 2004).
26 Most, but not all of the forest areas in Table 4 fall within the Mau Complex. One notable area that does not is the Loita Forest. This is a remote forest area that was the source of conflict between the Loita olosho, local government and an international NGO. For details, see (Karanja, Tessema et al., 2002; Nation Reporter, 2004). Also see footnote 58 in Chapter 3.

45
mechanisms, including coercion and violence come into play. In Narok, dramatic
transformations in socioeconomic relations, discussed in detail in Chapter 3, have become
bound to both environmental change and political power struggles. This is particularly acute
in Narok’s upland areas.
Table 4: Estimates of change in forest cover in Narok District between 1987 and 2001/2 Forest area in 1987 Remaining forest in
2001/2 a Percent change
Government forest reserves 72,354 52,238 -29% Transmara 36,948 16,832 -54% Olposimuru 35,270 34,457 -2% Southern Mau 136 128 -6%
County Council forests 48,000 34,000 -29% Maasai Mau 28,000 14,000 -50% Loita 20,000 20,000 0%
Private/GR forests 158,517 46,061 -71% Ilmutiok 18,139 0 -100% Ololunga 32,570 0 -100% Ngoben 12,370 10,000 -19% Ololorpil 24,816 16,627 -33% Nkareta 21,544 14,434 -33% Naiben-Ajijik 7,827 0 -100% Enoosupukia 10,772 0 -100% Naisoya 10,000 5,000 -50% Sinta Korara 8,740 0 -100% Olopiti/Oloimutai 11,739 0 -100%
Total 278,871 131,889 -53% a All estimates are from (National Environment Management Authority, 2003) except Olposimuru and
Southern Mau Forest Reserves, which are from (Akotsi and Gachanja, 2004).
In 1993, clashes erupted in Enoosupukia, a forested location at the northeastern edge of
Narok. The clashes, which saw dozens of migrant Kikuyu farmers killed and tens of
thousands displaced, were initiated because of tensions that had arisen over perceived
degradation of a water catchment area (Dietz, 1996). Though there was some evidence of

46
environmental change resulting from the occupation of upland areas, the underlying
motivation for driving out the Kikuyu was largely political.27 William Ole Ntimama, the MP
for Narok North constituency, perhaps the most outspoken of the Maasai leaders, justified the
clashes on environmental grounds:
Enoosupukia was a special case, the rivers were drying up because the settlers were destroying the water catchment areas. Water could no longer flow to the lower areas and something had to be done about it (quoted in (Tanui, 2000)).
Ironically, prior to the clashes, the Kikuyu presence in north Narok was largely supported by
the Narok County Council, which is entirely run by Maasai elites and was actually chaired by
Ntimama himself through the 1980s. As Dietz writes, the migrants:
…provided Narok Town with fresh produce, as well as casual laborers to work on large farms owned by Maasai leaders. In addition, the immigrants were the shop owners, the teachers, and the health workers, providing services that were regarded as valuable by Maasai around the market centers (Dietz, 1996, p. 8-9).
Unlike other parts of the uplands in northern Narok, this area was not designated a Forest
Reserve. Many of the immigrants had bought land legally from NCC and actually held title
deeds at the time of the clashes (Human Rights Watch, 1997).28 Tensions rose again in
Enoosupukia and Trans-Mara prior to the second multi-party elections in 1997 (Tanui, 2000).
27 At the time, most Kikuyu were opposition supporters. The clashes occurred in the wake of Kenya’s first multi-party elections. Powerful and entrenched Maasai politicians were allied with the ruling party KANU. Prior to the 1992 elections, Ole Ntimama warned non-Maasai in Narok to “lie down like envelopes or suffer the consequences” quoted in (Dietz, 1996, p. 9). In spite of the threats, the Kikuyu, the largest block of outsiders in Narok, largely voted for the opposition (Dietz, 1996, also see; Karbolo, 1999).
28 Recent steps that have been taken to mitigate the environmental problems associated with settlement in the upland forest areas are likely to spur further conflict Although much of the settlement in upland areas of Narok occurred with the consent of the NCC including many titled sales of land, it is currently being

47
Unfortunately, a recent change in leadership following the country’s third multiparty
elections late in 2002 did little to relieve ethnic/political tensions. As I was finishing field
work in early 2005, another series of clashes flared up, leading to still more deaths (Barasa,
2005; Mwangi, 2005c; Nation Reporter, 2005b; Nation Team, 2005b; Owour and Mwangi,
2005). This round of fighting started when a Kikuyu Councilor in a neighboring district
gained permission to divert a fraction of a perennial upland stream to irrigate his farm. The
stream also supplies water for Maasai cattle far downstream. However, competing
explanations offered by different groups for the heightened tension raise questions about the
degree to which the conflict actually centered on access to this particular water source, or
was driven by larger ethno-political issues.
On one hand, some Maasai hold that the clashes were an attempt to put a halt to what they
saw as the appropriation of their vital resources. A local newspaper reported it thus:
According to the Maasai pastoralists, who live downstream with thousands of cattle, goats and sheep, their counterparts upstream were out to deprive them of water. "Animals are our livelihood and it's better somebody touches something else even our own lives but not water," said Mzee Salau ole Kilusu, the Olongonot Maasai Community chairman…the Ewaso Kedong River waters had drastically reduced in volume since some farmers tapped the water upstream. The current drought, they say, had worsened the situation as the river was the only permanent one in the area (Barasa, 2005).
challenged by the national government in the name of environmental protection. The current government holds that this land was allocated illegally and that the catchment area was never meant to be adjudicated for settlement. Ironically, one of the more vocal proponents of this position is Ole Ntimama, still the MP for this constituency and himself a Minister in the former government (Nation Reporter, 2005c). In Spring 2005, a state-sponsored exercise was initiated to evict “squatters” from these catchment areas. Entire villages have been razed, including school buildings (Mwangi, 2005a). In a related development, a recent circular from the Kenyan Ministry of Lands and Housing encouraged any public or private institution to repossess land that was grabbed or otherwise misallocated (Muriuki, 2005).

48
But, the same article also reports that a white farmer had been extracting water from this
stream for years. In addition, the Councilor “was installing a two-and-half-inch pipe at the
intake…even if it had been installed, its abstraction capacity could have been insignificant.”
(Barasa, 2005). Finally, the Councilor had permission from the Ministry of Water to divert
the water since 1972, but had never chosen to do so until this year. Finally, the article noted,
“Most of the fighters were "strangers" from other districts, making it appear like a planned
attack”. Needless to say, local politicians were outspoken on the matter (Nation Team,
2005b). Not surprising, Ntimama held “that the clashes were about the sharing of water and
had nothing to do with politics,” but a local representative of the Kikuyu, an MP from
Naivasha, which borders Narok to the northeast:
…blamed the killings on politics. Secret meetings, she alleged, had been held to plan the clashes to displace ‘members of a particular community’ [the Kikuyu]. had been circulated in the town prior to the clashes, she said (Barasa, 2005).
Tensions quickly escalated, spreading into Narok District. By the time calm was restored,
over twenty people were dead including members of both the Maasai and the Kikuyu
communities. Several Maasai had actually been shot by police during a characteristically
heavy handed attempt to restore calm (Nation Team, 2005b). Also among the dead were
seven Kikuyu charcoal producers: a sad (and extreme) example of the vulnerable state in
which many charcoal producers find themselves while working in these circumstances
(Nation Team, 2005b).
To sum up, parts of Narok have undergone dramatic environmental change over the past
century: loss of forest cover in upland areas as well as reductions in vegetative cover in
shrubland and woody savanna areas. There have also been declines observed in wildlife

49
population. Several factors are thought to have contributed to these changes over and above
the natural variability that prevails in tropical savanna ecosystems. Most importantly, over
the past forty years, the demographic character and institutions governing land tenure in
Narok district have been profoundly transformed allowing for rapid expansion of large and
small-scale cultivation in the district. The district’s charcoal trade is inextricably tied to these
transformation. Chapter 3 explores these changes in more detail.
Theoretical reflections on environmental change, population, and
land tenure
As I outlined in Chapter 1, my research is driven by my desire to understand the social and
environmental implications of large-scale woodfuel utilization in sub-Saharan Africa.
Broadly conceived, this question relates to the nature of interactions between society and the
environment. In order to gain an understanding of these relationships, I have utilized a
political ecological methodology. I use political ecology, not as a coherent well-defined
theory, but rather as a set of theoretically grounded methodological tools for empirical
research. As Peet and Watts write, political ecology, is “grounded less in a coherent theory,
than in similar areas of inquiry,” (Peet and Watts, 1993, p. 239). These areas of inquiry
center on place-based explorations of interrelationships between society and the environment
in which people live and interact. Often, these analyses are focused in non-industrial
countries and are frequently centered on conflict over resources. However, more recently, the

50
political ecological approach has been successfully applied to human-environment
relationships and resource conflicts in industrialized societies.29
In this section, I will review the political ecological literature, focusing primarily on work
that has been conducted in areas of sub-Saharan Africa. I will then focus on the specific
theoretical approaches I found most useful in explaining the human-environment interactions
I observed during my field work: specifically, theories linking environmental degradation to
demographic change and land tenure institutions.
Political ecology and environmental change in sub-Saharan Africa
The privileging of social relations in analyses of environmental change evolved into a body
of work classified broadly as “political ecology”. This loosely defined field was popularized
in the 1980’s as a response, not only to simplistic and flawed explanations of African
agrarian crises, but also to earlier functionalist approaches to understanding human-
environment interactions within anthropology such as ecological anthropology and cultural
ecology (Peet and Watts, 1996).30
The seminal work of Piers Blaikie and his collaboration with Harold Brookfield (Blackie,
1985; Blackie and Brookfield, 1987) is exemplary of early political ecological analyses.
29 For a review of the Political Ecology approach in developing countries, see (Bryant and Bailey, 1997). For examples from the US, see McCarthy’s work on ranching in the western part of the country (McCarthy, 2001) and Kuletz’s contributions on the social and ecological fallout from nuclear testing in the US southwest (Kuletz, 1998). In addition, Mike Davis’ popular writing on urban eco-politics in the western US is exemplary of how these methods can yield fruitful results when applied to a range of applications (Davis, 1990; 1998; 2002).
30 Ecological anthropology and cultural ecology explore “the connections between an environment and the technology people use to exploit it, the patterns of behavior that result when particular technologies are used, and the effects, if any, these have on other cultural patterns,” (Porter, 2001) citing (Steward, 1955).

51
Their contribution represented a critical step by identifying the social and political context of
environmental change itself as an object of analysis. By contextualizing environmental
change in this way, the authors reveal “competing social definitions of degradation” (Blackie
and Brookfield, 1987, p. 16). Moreover, they recognized that human induced environmental
change does not lead, unambiguously, to negative outcomes for all actors.31 As Watts
stresses, “environmental change…can not be taken as synonymous with degradation”
(Watts, 1985, p. 18: author’s emphasis). Further, Blaikie and Brookfield stressed that any
changes must be seen in a context in which natural processes also have an influence.
Initially, political ecologists took a decidedly Marxist approach, focusing on the social
relations of production between smallholders and capital which are, “central, not only to
understanding the complexities of land-use decisions but also to broaching the paradox of
why – and for whom – the problem of environmental change arises at all,” (Watts, 1985, p.
23). Class-based analyses are vital to understanding the distributional effects of
environmental change as well as the impacts of efforts to mitigate any changes. As Blaikie
writes, “The groups or classes who tend to have access to and use the ‘state apparatus’ are
seldom adversely affected” by environmental degradation (Blackie, 1985, p. 6).
Class-based analyses brought much needed attention to the notion of marginality and poverty
in understanding anthropogenic environmental change. However, focusing too narrowly on
31 For clarity, the authors define environmental degradation as a decrease in “the capability of the land to satisfy a particular use” (Blackie and Brookfield, 1987, p. 6). In this conceptualization, processes of land use change, such as the clearing of wooded pastureland for grain cultivation, do not lead, inherently, to degradation. Only if “the degradation process under one system of production has reduced the initial capability of land in a successor system” will the degradation have been “carried across the allocation change,” (Blackie and Brookfield, 1987, p. 7).

52
poverty risks obscuring the potentially negative environmental effects of affluence and
capital (Peet and Watts, 1996). Moreover, as with many Marxist and neo-Marxist analyses,
privileging class as a unit of social differentiation risks overlooking other axes of conflict
over resources and causal mechanisms in environmental change including gender, ethnicity,
and the role of heterogeneous state institutions (Bernstein and Woodhouse, 2001).
More recently, many researchers within political ecology have turned to questions of
discourse and power in understanding the interactions between nature and society. Drawing
on poststructural theory and its hyper-attentiveness to discursive formation has led political
ecology in some fruitful directions. As Peet and Watts write:
…poststructural theory links with the causes of oppressed peoples, the geographical dimensions of power relations, and the relentless critique of everything, even notions usually considered emancipatory (p. 16).
Attention to discourse has also developed important critiques of the notion of Development
itself. Pitched largely as an international project created “in the context of decolonization and
the cold war,” ostensibly to raise standards of living in countries of Asia, Africa, and Latin
America (Hart, 2001, p. 650). Analysts have revealed the ways in which powerful interests
have constructed a modernist discourse by privileging certain notions of progress as the only
path toward improved standards of living (Esteva, 1992; Peet and Watts, 1993; Ferguson,
1994; Escobar, 1995). By defining the terms of discussion and closing off alternative ideas,

53
debates, and pathways of change, those in power establish political and economic
dominance, with important implications for environmental conditions.32
The post-structural turn in political ecology is not without critics. For example, the emphasis
within post-structuralism on subjective over absolute truth can easily be taken to an illogical
extreme in which material reality is wholly denied in favor of metaphorical imagery, signs,
and symbols (Hartwick, 2000). The danger in this, Hartwick argues, is that it limits the
potential for political action, reducing it to a kind of “armchair radicalism” (p. 1179) in
which little transformation or redress of injustice is possible.
Political ecology applied to environmental change in sub-Saharan Africa
Specifically in the context of sub-Saharan Africa, political ecological analysis has revealed
that conceptions of environmental change in that region have long been shaped by the
perceptions of outsiders (Watts, 1985; Fairhead and Leach, 1996; Leach and Mearns, 1996;
Cline-Cole, 2000). In the decades that passed between the early colonial encounters and the
creation of independent African states, two competing themes emerged. On the one hand, the
image of a savage and wild natural landscape populated by an uncivilized and equally savage
indigenous population of natives was popularized by the writing of early explorers. On the
other hand, the image of an Edenic and undisturbed nature rich with natural resources. In this
narrative, which was typically promulgated by early colonial administrators in order to
justify the appropriation of the resources in their newly acquired territory, nature’s bounty
was neglected or misused by natives who were characterized to varying degrees as lazy,
32 Dominant discourses do not, however, go uncontested. For example, see (Gramsci, 1971; Scott, 1985).

54
ignorant, risk-averse and/or excessively conservative in their exploitation of nature’s
bounty.33
The dominant discourse created during colonial rule was one in which poor land
management practices by local populations led at best, to slow degradation or, at worst, to
desertification and catastrophic famine. Prior to European contact, indigenous land
management was comprised largely of shifting cultivation and varying degrees of pastoral
transhumance. The “Colonial model” (Blackie, 1985) of land management questioned the
ability of local African populations to efficiently utilize their own resources. Conservation
became a guiding theme of land management, entering the discourse of colonial rule in the
1930s, under heavy influence of the “dustbowl” conditions in the US that prevailed at that
time (Scoones, 1997). Linking Western concepts of environmental degradation in sub-
Saharan Africa to environmental crises in the West itself constituted “a key moment in the
formation of applied environmental science as we know it today, and one that had many
international repercussions, including in colonial Africa” (Bernstein and Woodhouse, 2001,
p. 286).
33 This general argument is developed in (Blackie and Brookfield, 1987). In the case of Kenya, both views were put forth in the early decades of colonial rule. For example, the notion of a savage natural landscape comes through quite clearly in the tale of man-eating lions that plagued the construction of the Mombasa-Kampala railway at the turn of the 19th century (Patterson, 1907). The misuse-of-nature narrative, which was leveled at pastoralist communities in particular, can be seen in a 1925 report of the East African Commission to the British Parliament, in which the Commissioners refer to their “duty to humanity to develop the vast economic resources of a great continent” (The East Africa Commission, 1925, p. 22). The same report refers specifically to the Maasai in this way:
The quality of the cattle is inferior, and as they never castrate the bulls the stock is probably deteriorating. The customs of the tribes are primitive and barbaric in the extreme…(p. 27).

55
By framing the issue in this way, colonial authorities were able to justify a multitude of
interventions including, inter alia, forced destocking (Okoth-Ogendo, 1991; Scoones, 1996),
land appropriations, and population relocations,34 as well as an array of agricultural and
livestock policies that were implemented in order to modernize and, possibly, commercialize
indigenous systems of production.35
These early representations of systems of production in sub-Saharan Africa have been
repeatedly challenged by research that has showed, on the one hand, that worsening
environmental conditions have numerous causal factors that are quite independent of
indigenous land management systems and, on the other hand, a range of circumstances exist
in which environmental conditions have improved under indigenous systems of land
management. Among the revisionist literature contributing more refined understandings of
colonial and post-colonial land use in sub-Saharan Africa are Watts’ early work on the
political economy of famine in West Africa (Watts, 1983), which traces the political
34 In Eastern and Southern Africa, land appropriations and population relocations were often carried out to ensure that sufficient land was available for European settlement, which was critical to the economic viability of the colony. This is particularly true in Southern Rhodesia (Zimbabwe) and Kenya, where mineral wealth did not exist (Moyo, 1995). Concentration into Native Reserves led to higher densities of people and livestock than historical levels, leading to overgrazing and degradation, which was used to justify further interventions.
35 Commercialization was not always a goal. Under colonial rule in the Anglophone countries of Eastern and Southern Africa, many measures were implemented in order to protect European farmers by barring African farmers from certain lucrative markets. African farmers were prevented from growing most cash crops and faced distorted markets for grains and livestock. In Kenya a quarantine on indigenous cattle, which lasted through much of the colonial period, limited the extent to which indigenous stockholders could access urban markets. Ironically, such protective policies only exacerbated environmental problems. As the Kenya Land Commission wrote in 1934:
Most of the Native Reserves have been kept in a state of almost perpetual quarantine; the sale of cattle outside such Reserves, and the overstocking problem has, as a consequence, been accentuated. It is futile to tell the natives that they have too many cattle for the land and at the same time prohibit or hamper movement to the markets (Kenya Land Commission, 1933, p. 503, see also; Kitching, 1980).

56
economy of food production in northern Nigeria through several centuries before, during, and
after the region’s encounter with colonial rule. Also in Nigeria, Reginald Cline-Cole’s work
in fuelwood and forest product markets showed how colonial era forest management schemes
rather than domestic demand for forest products opened the region’s forests for exploitation
by outside interests, leading to unsustainable exploitation and rapid depletion of resources
(Cline-Cole, 1990; 2000). In Southern Africa, Beinart’s work on challenging the apartheid
state’s views on the causes of soil erosion (Beinart, 1984) and Peters’ work struggle over
meaning in defining and contesting rights to water resources in Botswana (Peters, 1987) are
exemplary.
Among the work demonstrating that indigenous management could indeed lead to improved
environmental conditions are Fairhead and Leach’s work on forest-savanna mosaic in Guinea
(Fairhead and Leach, 1996), which showed conclusive evidence of anthropogenic
afforestation of grassy savanna in direct contradiction to the French colonial perception of a
slowly degrading landscape. Similarly, Tiffen and colleagues’ work on population growth
and soil erosion in Eastern Kenya (Tiffen, Mortimore et al., 1994) showed an that higher
population densities were associated with greater investments in soil conservation and other
measures that mitigated environmental degradation.
Such challenges to the conventional wisdom are supported by ecological research that
reflects improved understandings of the African environment. Examples of this research
include Dublin’s work in the SME cited above (Dublin, 1995). Other notable work includes
the contributions to the edited volume by Behnke and colleagues (Behnke, Scoones et al.,
1993b). Also see Bremen and Kessler for a comprehensive overview of Sahelian woodland

57
ecology (Breman and Kessler, 1995), and the work of Homewood and Rodgers for an
exploration of ecology in East African pastoral systems using the Ngorongoro Conservation
Area in Tanzania as a case study (Homewood and Rodgers, 1991).
However, despite these challenges to the conventional wisdom created and passed down
from the colonial encounter, it persists in popular discourse (Bernstein and Woodhouse,
2001). As Leach and Mearns explain:
So self-evident do these phenomena appear that their prevalence is generally regarded as common knowledge among development professionals in African governments, international donor agencies, and non-governmental organizations. They have acquired the status of conventional wisdom: an integral part of the lexicon of development (1996, p. 1).
Many of the understandings of environmental change in sub-Saharan Africa was simply
flawed. It was often the product of simplistic generalizations applied with broad brushstrokes
to what are, in reality, complex and locally specific processes (Watts, 1985). As Blaikie
writes, “Aggregates tend to appeal to (comfortable) analysts,” (Blackie, 1985, p. 26). That
much of this received wisdom persists to this day this reflects a lack of understanding about
the ways in which African agricultural and pastoral systems of production have been adapted
to this potentially harsh environment. Watts cites a series of studies carried out in the 1970s
and 80s that identified a range of measures utilized by Sahelian agro-pastoralists including:
…herd mobility, species diversity, a sophisticated ethnoscientific understanding of local ranges – which reveal how herders cope with the vicissitudes of semi-arid ecosystems and adapt to changing environmental and economic pressures…[and an]

58
intense concern with the possibility of overgrazing and range deterioration (Watts, 1985, p. 20).36
Using a combination of systematic ecological research and detailed ethnographic work, a
number of studies present evidence of the resilience and effectiveness of African farming
practices (Dahl and Hjort, 1976; Raikes, 1981; Breman and Wit, 1983).37
To some, these results present a paradox. If indeed, indigenous systems of production appear
so resilient and adaptive, why, since the 1970s, have so many parts of rural sub-Saharan
Africa suffered recurrent crises that are, in large part, related to environmental conditions
(Watts, 1985; Berry, 1989b; Peters, 2002)?38 Over the years, an array of explanatory models
have been developed to explain Africa’s agrarian crises in which two recurrent themes
appear: problems arising from demographic change and problems related to land tenure and
property rights (Watts, 1985). The strength of a political ecological approach is that it situates
these factors within a broader sociopolitical and historical context, thereby making
allowances for major structural shifts such as the penetration of market-oriented capitalism or
36 Watts also demonstrates that not all colonial officials considered indigenous practices to be inappropriate. He cites one official who clearly understood the logic behind local practices, “The (African) farmer has already evolved a scheme for farming which can not be bettered in principle…(and) affords almost complete protection against soil erosion and loss of fertility (Watts, 1985, p. 19 citing Stamp, 1940). However, his was not a view shared by most colonial authorities.
37 Also see more recent work incorporating detailed social and ecological analyses on African pastoralists such as Turner’s work among West African pastoralists (Turner, 1999) and a series of analyses of human-environment interactions in various parts of the SME (Serneels and Lambin, 2001; Thompson and Homewood, 2002; Lamprey and Reid, 2004).
38 Care should be taken in considerations of crisis situations. To some extent, it is these “crisis narratives” that give weight to the false conceptions of indigenous land management systems. For example, see Roe’s polemical piece critiquing the notion of African exceptionalism in the context of social and ecological crises (Roe, 1995).

59
the increased influence of the state on local ways of living.39 Moreover, the approach permits
a degree of environmental agency without slipping into overly deterministic explanations.
This is in stark contrast to the models reflecting the conventional wisdom of colonial and
post-colonial officials and older generations of development practitioners, who tended to
favor mono-causal explanations for both environmental degradation and deteriorating living
conditions.
Both demographic change and shifts in land tenure have played very important roles in
driving social and environmental outcomes in the study area. I discuss some of the current
theoretical understandings of how each of these factors interrelate with environmental change
in the sections that follow.
Population pressure as a driver of environmental change
Wood energy utilization in Kenya initially drew my interest because of its frequent
association with environmental degradation, specifically deforestation, in discourses of
development and environmental change. This relationship, which is often linked to
demographic changes like population growth and urbanization,40 has been challenged by
39 For the impact of capitalism on local farming practices, see Watts analysis of Nigerian famines mentioned above (1983). For work specific to Kenya, see (Kitching, 1980; Bates, 1989). For an analysis of the impact on the imposition of socialist-oriented market policies by the state, see Scott’s analysis of the impacts of Nyerere’s Ujamaa policies in post-colonial Tanzania (Scott, 1998).
40 The concept of urbanization in Africa must be treated with care. While there is little doubt that Africa’s cities are among the fastest growing population centers in the world, with the number of urban dwellers in many African countries doubling roughly every 15 years (United Nations, 2004b), the notion of what constitutes urban and rural deserves more attention than it typically receives. For example, many of Kenya’s urban dwellers retain significant ties to their rural homes; they may travel home regularly, plant crops on their rural homestead, send cash remittances and/or goods that are only available in urban areas, and even participate in the local politics of their rural homes. In addition, many people in rural areas of Kenya have adopted ways of living that have traditionally been associated with urban life. For example, as

60
some analysts (Dewees, 1989; Hosier, 1993; Foley, 2001). Nevertheless, it persists in popular
discourse.
The logic behind this simple notion is that population growth results in more woodfuel
consumers and creates greater demand for farmland. Both lead to the loss of forested areas.
In addition, for reasons discussed in Chapter 1, migration to urban areas leads to more
charcoal consumption, which, according to the conventional wisdom, is an inefficient use of
wood resources (Ministry of Energy, 2003; Mutimba and Barasa, 2005a). Following this line
of reasoning, this results in an even larger toll on the region’s forests than population growth
in the absence of urban migration.
However, it is insufficient to simply state that population growth and/or urbanization leads to
increased deforestation among societies that are dependent on woodfuel. First, the posited
link may itself, be specious. Second, even if true, the oft-cited link between population and
woodfuel-induced environmental change offers no indication about why woodfuel
production is centered in a specific place at a particular time. Moreover, it offers no
indication of how land is managed before, during and after trees are harvested for fuel. No
allowance is made either for variation in land management practices or for human responses
to changes in woodfuel supply.
was discussed in Chapter 1, nearly one third of households classified by Kenya’s CBS as rural, report that they use charcoal, which is generally considered an urban fuel, for some of their households energy needs. Similarly, roughly 5% of rural homes in Kenya use a solar photovoltaic panel, which provides a level of connectivity through radio, television, and, more recently, mobile phones, previously unavailable to the rural population (Jacobson, 2004).

61
Woodfuel, by all accounts, is a “conditionally renewable resource” (Openshaw, 1982). In
other words, under certain conditions, woodfuel utilization can proceed without causing a
long-term depletion of resources or degradation of environmental conditions (Young and
Francombe, 1991; Chidumayo, 1993; Hosier, 1993). This is particularly true in Africa’s
dryland forests, which can be quite resilient to disturbances, as was discussed above. In
reality, some of the woodfuel exploitation in sub-Saharan Africa does contribute to long-term
environmental change. Nevertheless, woodfuel use is rarely the sole cause of degradation.41
Moreover, the extent of long-term depends on both biophysical and socioeconomic factors
(Leach and Mearns, 1988).
This question extends beyond wood energy and deforestation. More generally, population
pressure, both human and livestock, has been proposed as a driver of environmental change
of all sorts: soil erosion, desertification, loss of biodiversity among others. This Malthusian
approach had a great deal of support in the 1970s with alarmist publications like the
Population Bomb (Ehrlich, 1968). Blaikie and Brookfield, pioneers of the political ecological
approach, treat such arguments with care. The authors admit that they ally themselves with
those who think that population growth in the “less-developed countries” is a “cause for
serious concern” (Blackie and Brookfield, 1987, p. 28). They use the term the Pressure of
41 Geist and Lambin conducted an analysis of prior studies looking at proximate and underlying causes of deforestation in different regions of the world. Extraction of wood for fuel was rarely the sole factor identified. In sub-Saharan Africa, ten out of 19 cases identified fuel extraction as a contributor to forest loss. However, the authors found that land conversion to permanent or shifting agricultural cultivation and road expansion contribute to forest loss with roughly the same frequency as fuel extraction. Moreover, in two-thirds of the cases analyzed, two or more factors in addition to fuel extraction were identified as important co-contributors to forest loss (Geist and Lambin, 2002).

62
Population on Resources (PPR) to define the impact that growing populations can have on
environmental conditions. However, they also note that both analyses of population-
environment interactions, which are often based on static conceptions of carrying capacity,
are “based on inadequately measured and understood current trends” and “carry a degree of
unreality” (p. 28-29). They also note that deteriorating environmental conditions can occur in
situations where PPR is declining or has never been an issue. They write:
…we adopt an open approach to the relation of population pressure to land degradation. Degradation can occur under rising PPR, under declining PPR, and without PPR. We do not accept that population pressure leads inevitably to land degradation, even though it may almost inevitably lead to extreme poverty when it occurs in underdeveloped, mainly rural, countries (p. 34).
In one example directly related to this research, when colonial administrators initially
glimpsed the East African savannas in the late 19th and early 20th centuries, they found vast
grasslands with very sparse numbers of people and livestock. The dearth of people and
animals, which was the result of a devastating series of droughts, famine and disease
outbreaks, which occurred in the latter two decades of the 19th century, led colonial officials
to believe that later population growth would cause overgrazing and environmental
degradation.42 In reality, the population was simply returning to historic levels and the
landscape was also reverting to a condition that it had previously been in (Waller, 1985;
Brockington and Homewood, 1996).
42 The late 19th Century population crash is discussed in discussed in further detail in Chapter 3. Also see the discussion of quarantines and overstocking in note 35 above.

63
A few studies present concrete evidence of population pressure leading to improving rather
than declining environmental conditions, such as Tiffen and colleagues’ work in Eastern
Kenya (Tiffen, Mortimore et al., 1994) as well as Boserup’s well-known contention that
population pressure can lead to higher rates of technical innovation and gains in agricultural
productivity (Boserup, 1981).43 Such work urges us to question the conditions in which
demographic change can lead to beneficial changes, rather than degradation, of
environmental conditions.
Attention to demographic change is critical, not for the neo-Malthusian explanations of
population-driven environmental degradation. Rather, a better understanding of the
environmental implications of demographic change requires that we consider the social and
historical context in which the changes occur. We must inquire more of whom, where, doing
what and for how long, in addition to asking why (Ferguson, 1986; McDonald, 1999; Warren,
Batterbury et al., 2001). Urbanization, the introduction and penetration of wage labor into the
rural economy, and resulting labor migration are all processes that will only be revealed by
going beyond simple population growth.
In my field work, I have found that demographic change is an important contributor to
environmental change in Narok. The area has experienced rapid population growth as a result
of an increase in the number of Maasai, who are the native residents of the district, as well as
an influx of migrants from predominantly agricultural neighboring districts. These changes in
43 Also see Roe’s polemical contribution bemoaning the lack of effective counter-narratives to shift the focus away from a neo-Malthusian discourse centered only on the negative aspects of Africa’s population growth (Roe, 1995).

64
population have affected environmental conditions in several ways. First, the growth in
population has created demand for cultivable land, which has led to increased frequency of
leasing as well as land sales. Population growth has also increased demand for agricultural
goods in the district’s main town, the population of which has grown by a factor of 20 since
Kenya’s independence (Government of Kenya, 1980-2002). Finally, it has created a large
pool of labor in the district, which not only facilitates agricultural production, but also makes
it possible to for the district’s charcoal trade to thrive.44 Significantly, both agricultural
expansion and the charcoal trade, themselves intimately connected, are only possible because
of recent changes in land tenure, which are addressed in the next section.
Property rights, land tenure, and environmental change
A second explanation common for the recurrent crises in African agriculture and human-
induced environmental change is centered on land tenure and the communal nature of many
systems of land management in sub-Saharan Africa (Bassett, 1993). Conventional wisdom
rooted in the “colonial fixation with ‘communal’ forms of landholding” (Peters, 2002, p. 45)
holds that communal range management leads inevitably to overgrazing. This kind of
understanding was boosted by Garrett Hardin’s infamous ‘tragedy of the commons’
argument (Hardin, 1968), which cast both communally managed systems of production as
“open access” systems in which no controls or sanctions exist to mediate their exploitation.
Obviously, such systems are easily subject to overexploitation and degradation. Using
pastoralism as an example of an open access system, Hardin wrote:
44 The links between labor migration and the charcoal trade are fully developed in Chapter 3.

65
…the rational herdsman concludes that the only sensible course for him to pursue is to add another animal to his herd. And another; and another…But this is the conclusion reached by each and every rational herdsman sharing a commons. Therein lies the tragedy. Each man is locked into a system that compels him to increase his herd without limit – in a world that is limited. Freedom in a commons brings ruin to all (Hardin, 1968, p. 162).45
Of course, very little productive land in sub-Saharan Africa is characterized by such freedom.
Access to the benefits from land, or productive resources more generally, is mediated by a
range of factors, such as social identity and social networks (Berry, 1989b), legal
mechanisms,46 and technical capacity, as well as the introduction and penetration of markets
(Bernstein and Woodhouse, 2001).47 Moreover, access is contingent and maintaining it
requires significant investment in social institutions (Berry, 1989b), particularly under
changing political economic conditions and/or shifting patterns of land tenure. As Sara Berry
states in the Kenyan context:
The proliferation of strategies and channels of access to the state after independence has also affected patterns of access to productive resources not controlled by the state…although Kenya’s land reform ‘superimposed a new de jure system of consolidated holdings and individually registered freehold titles, de facto fragmentation, borrowing, lending, and even some communal grazing on individually owned land persist (Berry, 1989b, p. 45 quoting Haugerud).
45 Admittedly, Hardin’s herdsmen and their stock were allegorical stand-ins for a fecund third world population and their offspring (McKay and Acheson, 1996). Despite ostensibly writing about the global population, Hardin’s argument was applied uncritically to analyses of common property resources in developing countries , effectively lending support to post-colonial arguments against continuation of communal land tenure in many agro-pastoral areas of sub-Saharan Africa (Leach and Mearns, 1996). Also see Roe (Roe, 1991), for an exploration of the ways in which Hardin’s argument has been incorporated into development discourse more generally.
46 Legal mechanisms of resource access and control can themselves be fluid in circumstances in which pluralistic legal codes apply. See, for example, (Moore, 1973; Merry, 1988).
47 Ribot and Peluso (Ribot and Peluso, 2003) refer to the collective sum of these factors as “mechanisms of access”. These are discussed in more detail in Chapter 4 in the context of the charcoal commodity chain.

66
In addition, despite late colonial and post-independence efforts to introduce individual land
tenure in many African states, existing understandings of property clashed with newly
introduced Western property institutions. Historically, African rights to and control over
specific resources are viewed largely as separable from the land on which they are found. As
Okoth-Ogendo writes:
…there always was a clear separation in African thought and law between the solum48 and any manifestation, such as crops, trees and buildings, which symbolises human interaction with it…(Okoth-Ogendo, 1989, p. 8).
Moreover, though outsiders thought of traditional African tenure systems as no more
complicated than open access systems, extant systems of communal land management
practiced in many African contexts did allow for the exclusion of outsiders as well as the
censure of community members who broke rules of access. Again, drawing on Okoth-
Ogendo:
…in any given production unit a number of persons could each hold an allocation of power or combinations thereof expressing a specific range or variety of functions – e.g. cultivation, grazing, transit, energy, etc. Each one of these would attract varying degrees of control exercised at different levels of socio-political organization…The primary obligation of those in whom the power of control is vested being to guarantee access to present members and to preserve the land resources of the unit for the benefit of future generations, the outright disposal of land to persons external to a given unit of production is therefore alien to African land law (Okoth-Ogendo, 1989, p. 10).
48 Okoth-Ogendo uses solum, the Latin word for “ground”, to refer to a parcel of land and the entire collectivity of physical attributes to which it is connected. He contrasts African notions of ownership to the concept of property in land in English jurisprudence, stemming from Roman Law, that fused “the solum with water and air in a compact, recording the claims of individual rather than social labor upon it,” (Okoth-Ogendo, 1989, p. 8).
67
The separability between the solum and human interaction with it, about which Okoth-
Ogendo writes, is particularly relevant for the exploitation of forest and woodland resources
in sub-Saharan Africa. As Fortmann and Bruce write:
…like minerals and water, trees can be a form of property separable from the land on which they are located…Failure to recognize the relationships between property in trees and property in land has led to bad policy, failed projects and projects with unanticipated consequences…(Fortmann and Bruce, 1988, p. 11)
Viewing property as a bundle of rights,49 access to trees and forest products can be viewed as
comprising of four bundles, each with several components (Fortmann, 1985): the right to
own or inherit trees, the right to plant trees, the right to use trees, and the right to dispose of
trees (sell, destroy, lease mortgage or pledge). These rights must be seen as contingent,
depending on a range of factors including the type of tree and its location, as well as the
intended end use. For example, in Kenya’s state-owned forests, it is legal to collect fuelwood
for household use, but not for commercial sale (Government of Kenya, 1992). Rights also
change seasonally, and can vary by gender (Chavangi, Engelhard et al., 1988). Nevertheless,
even in communal tenure systems, tree tenure can be quite well defined, with restrictions on
use and disposal. However, when land tenure changes from communal to private tenure, the
rights to use and dispose of trees may also shift to the individual. Such is the case in Narok,
where the use and disposal of trees has become the right of each male head of household
receiving a plot of former communal land. Very little evidence then, supports the contention
49 The “bundle of rights” metaphor can be traced back to the 19th century(Maine, 1864) (cited in both (Fortmann and Bruce, 1988) and (Ribot, 1998)). Others have raised the notion of power in shaping property relations. This is raised extensively by Okoth-Ogendo (1989). In a clever twist on Maine’s “bundle of rights” metaphor, Ashraf Ghani refers to property as a “bundle or powers” (cited by Ribot (1998)).

68
that communal systems of tenure themselves lead to negative environmental change, even
under increasing population pressure.50 In the study area, the opposite appears to be true.
When the rangelands of Narok were managed communally, they were maintained within the
bounds of natural variation expected in such dynamic ecosystems (discussed above). It is
only after the rangeland was subdivided and privatized that it experienced more drastic
change quite outside the bounds of historically observed variation.
In addition to “tragedy of the commons” arguments dating back to colonial rule and revived
by Hardin and those who followed him, a second linkage between environmental degradation
and land tenure is often made based on the assumption that certain forms of customary tenure
lead to a lack of tenure security among individual land managers. Lack of security, it is
argued, affects farmers’ and pastoralists’ ability and/or willingness to invest in either
improved production or environmental conservation measures (Bruce and Migot-Adholla,
1994; Peters, 2002).
Peters (2002) traces the roots of this argument back to colonial administrators’ conflation of
“African ritual heads, whose authority concerned rainmaking or fertility of the land, with
political leaders who exercised authority at different scales (e.g. lineage, clan, chiefdom) over
their people: all tended to be glossed as ‘chiefs’.” Similarly, “sets of claims over land and its
products were glossed by the category, ‘communal tenure’, which became incorporated into
50 In her classic monograph, Ostrom elucidates several conditions, or “design principles” that are often present in successful long-term common property management regimes. These include clearly defined boundaries, collective choice arrangements and rights to organize, effective monitoring and mechanisms for sanctions (that are proportional to the seriousness of the infraction) and effective mechanisms for conflict resolution (Ostrom, 1990, see especially p. 90-102).

69
the body of ‘customary law’” (p. 49). Drawing on Chanock, Peters also notes that some
Africans themselves defended the colonial constructions of ‘customary tenure’ in order to
fend off later attempts by the state to appropriate more land (Chanock, 1991).51
Many analysts have directed critiques at the notion that customary forms of land tenure are
insecure, inhibit investment in agricultural productivity, or cause environmental degradation
(Bruce, 1993). Polly Hill’s study of entrepreneurial farmers development of a thriving cocoa
industry in the communally owned forests of Ghana is a classic example (Hill, 1963). In
addition, forms of communal tenure in Africa show that both families and individuals can
hold “separable claims, rights and responsibilities” (Peters, 2002, p. 50). This holds for
tenure systems in pastoral communities as well as in agricultural communities. Pastoralists
can also have exclusive and hereditary rights to specific grazing areas.52
Finally, as in any social group, a certain moral economy53 existed among pastoral
communities, leading to social cohesion and security in the access to resources enjoyed by
community members. As Horowitz and Little write:
51 However, as Mamdani demonstrated with his discussion of the “full-blown village-based despot”, (Mamdani, 1996, p. 43), there were additional motivations for some Africans to support the colonial construction of customary rule as they stood to gain power and influence well beyond what was accorded traditional chieftaincies (also see (Bernstein and Woodhouse, 2001)). For a specific example from Kenya, see the discussion of the Chief’s Act in Chapter 4.
52 This is discussed in the case of the Maasai in Chapter 3.
53 Moral economy is a concept that many analysts have applied to peasant societies in which systems of production are dominated by a “subsistence ethic” that runs through both economic exchanges and social relations (Scott, 1976). Actors within these systems are characterized by risk-aversion, reciprocity, and collective, rather than individual rationality in decision making (Hyden, 2001). The roots of the idea lie in the analyses of historians like E. P. Thompson (Thompson, 1975) and Karl Polanyi (Polanyi, 1957).

70
Pastoralists, no less than anyone else, live in communities, and these communities have moral bases which do not allow for unchecked personal aggrandizement at the expense of one’s fellows (Horowitz and Little, 1987, p. 67).
In other words, a system of social checks and balances exists, which permits most pastoral
societies to manage grazing areas, water resources, and other vital inputs to their economy
communally, with minimal degradation and little social conflict. However, external pressures
can put stress on traditional systems of land management and threaten the basis of traditional
economic relations. For example, the penetration of market forces and subsequent
commoditization of productive resources can change the calculus of decision making within
peasant and pastoralist communities. It was these processes of commoditization that marked
the end of what Bernstein terms the “natural economy” of peasant communities in sub-
Saharan Africa (Bernstein, 1979, p. 432).54
Polanyi, for example, views the subsistence ethic as a critical factor differentiating pre-capitalist and capitalist modes of production:
It is the absence of the threat of individual starvation which makes primitive society, in a sense, more human than market economy, and at the same time, less economic (Polanyi, 1957, p. 163-4, cited in Scott, 1976).
54 Bernstein’s “natural economy” has certain analogies to the idea of “moral economy” developed by Thompson and adopted by Scott, Watts, and others. However, it is not couched in terms of Scott’s subsistence ethic. Rather, Bernstein uses traditional Marxist terminology, so that the “natural economy” is one in which labor was concentrated in the production of “use-value”. In introducing the term “natural economy”, Bernstein is careful not to oversimplify or essentialize pre-colonial systems of production in Africa. Rather, he notes that the term is simply a “useful abstraction” to demarcate the period prior to the penetration of modern capitalism, while noting that, historically, there were extensive exchange relations, labor differentiation and class structures existing prior to the colonial encounter. He is also careful to note that processes of commoditization were by no means uniform, linear, or, in most instances, complete. Rather, the “striking feature of the commoditization of the African peasant economy…is its extremely uneven character both between social formations and within them,” (Bernstein, 1979, p. 424). Also see his more recent contribution with Philip Woodhouse exploring the linkage between commoditization and environmental change in sub-Saharan Africa in more detail (Bernstein and Woodhouse, 2001).

71
Commoditization, largely a result of the colonial encounter, severely altered the reproductive
cycle of rural peasant and pastoral households by appropriating labor from the “natural
economy” and monetizing many of the vital material elements of household reproduction.
Bernstein writes:
…the destruction of the reproduction cycle of natural economy gives way to a different process of social reproduction in which the reproduction of households takes place increasingly on an individual basis through the relations of commodity production and exchange. The relations between individual households, whether at the village level or at the level of the regional, national, or international division of labor, are increasingly mediated through the place each household occupies in the total nexus of relations of commodity production and exchange (Bernstein, 1979, p. 424-5, author’s emphasis).
A series of policies implemented by the colonial state in order to meet its own needs: inter
alia funding the colonial administration; feeding the urban population; and supplying raw
materials to the home country, set these processes in motion. The imposition of taxes, forced
labor, and, later, the forced sales of commodities through monopsonistic marketing boards all
placed additional pressure on the population of colonial subjects. As a result, over a series of
decades and through varying degrees of coercion and choice, people internalized these
production relations so that commodity production became “an economic necessity for the
peasantry” (Bernstein, 1979, p. 425-6).55
55 The process was typically slower among pastoral communities. In Kenya, regions dominated by pastoral production continue to lag behind agricultural areas in the degree to which they are integrated into Kenyan society as well as in many development indicators such as the incidence of poverty, school attendance, and measures of public health (Munene, 2003). This is true in some parts of the study area, and will be discussed in more detail below.

72
The implications of this process of commoditization on environmental change emerge from
Bernstein’s notion of the “simple reproduction squeeze” (Bernstein, 1979, p. 427), see also
(Watts, 1985). Once commoditization has taken hold and petty commodity production has
become a critical element of survival for rural African producers, they are sensitive and
responsive to the vagaries of external markets. As Watts writes:
…a deterioration in the terms of trade between commodities produced for the market and items of necessary domestic consumption acquired through the marketplace, is transmitted to the household economy in terms of reduction in consumption, an intensification of commodity production, or both…Such perturbations in the price mechanism can result, then, in a sort of super-exploitation in of land and labor; working harder, consuming less, and squeezing more from the land in order to remain at the same level (Watts, 1985, p. 24).
Deteriorating terms of trade do not affect all land managers equally. As Bernstein contends,
the degree of sensitivity to deteriorating terms of trade, and the decisions made in response to
such deterioration, depend on several factors including the wealth of the individual or
household prior to onset of commoditization and the extent to which the household depends
on cash crops relative to food crops. This holds among pastoral communities as well as
cultivators. In a recent study in two pastoral areas of Kenya, including one Maasai area
adjacent to the area studied in this research, Zaal and Dietz found:
Poor households…generally use the market as a means of survival, to be turned to in times of trouble. Wealthier households, better capitalized and more secure in their production, are able to exploit market opportunities in a more structured way. For these pastoralists, increasing commoditization tends to draw them toward commercial livestock production and all that implies. Commoditization can therefore be seen to sharpen the differences between rich and poor in the most fundamental way (Zaal and Dietz, 1999, p. 15).

73
Zaal and Dietz’s findings indicate that initial endowments influence individuals’ responses to
the commoditization of productive resources. This contention is supported by evidence from
my research, as will be discussed in Chapter 3.
Thus, processes of social differentiation, set in motion or intensified by the commoditization
of productive resources, become critical in understanding social aspects of environmental
change. In the study area, the commoditization of productive resources, beginning with
livestock and the development of markets for meat and milk during the early years of
colonial rule (Kitching, 1980; Kituyi, 1990), shifting later to land itself as vast areas of
Maasai territory were privatized and subdivided, had profound but varied impacts on a
population that was already differentiated by varying levels of wealth in livestock. This
population has approached the commoditization of productive resources very differently.
Those with access to capital through livestock sales, credit markets, and/or socio-political ties
are able to benefit a great deal more than those whose access to capital is limited. Impacts on
the local environment – woodland and forest resources, wildlife, and water – also vary
according to the actions of these socially differentiated individuals.
The solution to the problems of land tenure insecurity, inefficiency, and environmental
degradation arising from communal tenure, as suggested by Hardin, is to reform land tenure
institutions in order to bring about private land ownership.56 Setting aside the arguments,
described above, that communal land management in pastoral societies is not necessarily an
insecure form of tenure, nor is it inevitably degrading to the environment, there are two
56 Another path is to relegate ownership to the state. See, for example (Ostrom, 1990).

74
critical faults with the fundamental assumptions that privatization is the solution to problems
arising from communal tenure.
First, the proponents of privatization assume that, although management practices may
change under privatization, the system of production itself remains unchanged. In other
words, it is tacitly assumed that pastoralists under communal tenure become ranchers under
freehold tenure. A subsidiary assumption to this is that individual production units resulting
from privatization are actually viable for ranching. This set of assumptions fails to
acknowledge two important points. One point is that land tenure change may render the old
production system unviable for some individuals some of the time, particularly in
environments characterized by a high degree of climatic variability – a standard feature in
most pastoral regions. Two, systems of production in agro-pastoral communities under any
circumstance, are defined and constrained not only by agro-ecological factors, but also by
social convention. A shift from communal to freehold tenure is a potentially disruptive social
change. Though it is not inevitable, it is quite likely that the range of socially acceptable land
management options will expand when the power to make land management decisions shifts
from the community to the individual. As a result, alternative land uses come into play.
However, as was discussed above in the context of commoditization, alternative land
management strategies are not equally open to all members of the (formerly) pastoral
community: initial endowments are critically important in determining who can do what with
their privatized piece of land.
A second complication, linked to the first, is that privatization is frequently called for in
response to a single, negatively perceived environmental outcome such as overgrazing. The

75
assumption is that overgrazing will be checked, but no other problems will arise. However,
after rangelands are subdivided, management practices may change. The change may be
minor: e.g. a shift from communal grazing to private ranching; or they may significant: e.g. a
shift from pastoral production to commercial grain cultivation. In any case, with an
expansion in land use comes an expansion in the potential range and spatial distribution of
negative environmental outcomes. For example, in addition to overgrazing from pastoral
production, additional land management practices introduce additional environmental insults:
e.g. deforestation, soil erosion, and a proliferation of herbicides and pesticides resulting from
market-oriented agriculture.
Hence, when exploring the social and environmental reasons for, and ramifications of, land
tenure change, we must accommodate more complexity both in our understanding of
individual land management decisions and in the range of environmental outcomes that we
expect to see. For example, subdivision and privatization of communal grazing land was
adopted in Narok District over the course of several decades. Reasons given for subdivision
of these areas ranged from the state and international development agencies’ claims that it
would lead to more efficient use of Kenya’s expansive rangelands to the Maasai’s own
desire for more security of tenure. Ironically, the lack of tenure security that plagued Kenya’s
Maasai was not a result of flaws in that community’s traditional land management
institutions. Rather, their insecurity resulted from a succession of external pressures,
beginning with British colonial land appropriations in the early 20th century, continuing with
state policies that carved huge wildlife conservation areas from traditional Maasai territory,
and continuing with a frenzy of land speculation arising from land reform elsewhere in the

76
country and bolstered by progressive and elite members of the Maasai community, who
understand the stakes involved in land privatization and wish to profit from it.
The gradual privatization of vast areas of pastoral rangeland created conditions amenable to
both smallholder agriculture and large-scale commercial grain cultivation, which many
residents have begun to practice, while others are hoping to do so. Either form of cultivation
can be implemented only after the clearing of massive areas of woodland and shrubland. This
clearance, which is ongoing, has given rise to a large, albeit temporary charcoal industry and
initiated a process of environmental change that will have important ramifications for this
area of Kenya. All of these processes are discussed in full detail in Chapter 3.
Research Methods
This analysis relies on a range of research methods. Between July 2004 and March 2005 I
conducted four research trips to Kenya lasting roughly two months each. During these
months of field work, I spent the majority of the time in Narok District, with occasional time
in Nairobi.
I was assisted in my field work by Kenyan research assistants. Two of the assistants hold
Bachelors degrees in Environmental Studies and Wildlife Management respectively and one
holds a Masters degree in Environmental Sciences. One assistant, the specialist in Wildlife
Management, was a woman. All were fluent in both English and Swahili. In addition, two
were native speakers of Kikuyu, which was indispensable because, though all of the
informants in this study were able to communicate in Swahili and many were also able to
communicate in English, many charcoal producers and traders are members of the Kikuyu

77
ethnic group. This “Kikuyu connection” was vital, particularly in Kenya’s ethnically charged
political environment. Many of the activities associated with the charcoal trade have an
ambiguous legal status while others are completely illegal. Many of our respondents were
justifiably suspicious when first approached, but their trust was fairly easy to gain when my
assistants were able to communicate with them in their mother tongue.
In order to understand the nature of the charcoal commodity chain I conducted a series of
interviews and surveys of participants in the trade. This included semi-structured surveys of
charcoal burners (n = 50), in-depth interviews of charcoal transporters (n = 15), and
structured surveys of charcoal vendors in Nairobi (n = 30). English and Swahili versions of
the questionnaires and list of guiding questions used in interviews are included in Appendix
1. The questions were drafted first in English and translated by the author into Swahili. The
Swahili versions were then back-translated to English by the research assistants and cross-
checked with the English originals to ensure the translation was fully comprehensible.
In addition, because charcoal in Narok is linked strongly to changing land management
practices, I conducted a series of in-depth interviews with landowners in Narok where
charcoal production is occurring (n = 23). Most landowners do not participate directly in the
charcoal trade; however, their role is critical in that their management decisions make the
trade possible. Of these landowners, 22 were ethnic Maasai who received a plot of land when
the group ranch they had lived on was subdivided; the other was an migrant from a
neighboring district on the western edge of Narok who bought land in the study area.
A randomized sampling frame was not possible. The nature of the charcoal trade is such that
no records of production and sales exist. Production is carried out intermittently and

78
unpredictably by a population of largely transient circular migrants. The ambiguous legal
status of the trade makes all those involved suspicious of outsiders and very difficult to
interview. Hence, for both producers and transporters, an opportunistic sampling pattern was
employed and augmented by “snowball” sampling; after we gained the trust of one
respondent or a small group of respondents, they introduced us to others. Interviews with
landowners were carried out in a similar way: we first spoke with landowners of plots where
we interviewed charcoal producers in order to match and compare the responses of
informants who directly relate to one another. However, some of the landowners of plots on
which we observed charcoal production and interviewed producers were either unavailable or
unwilling to talk with us. In such cases, we talked to neighboring landowners.
Charcoal vendors in Nairobi were easier to approach. Their activity is legal and they are not
as mobile as producers or transporters. Surveys of vendors in Nairobi followed a randomized
sampling frame stratified by the wealth of the neighborhood they serve as defined by a recent
poverty analysis at the level of the administrative sub-division. The sampling frame for this
group is described in Appendix 1.
Further insight into the charcoal commodity chain was provided by raw data generated from
two nationwide surveys that were conducted in separate research projects. One was a
nationally representative survey of energy use by households (n = 2,300) and small
enterprises (n = 400) carried out early in 2001.57 This study provides a number of insights
57 This survey was conducted by, Kamfor Company Ltd., a private consulting firm on behalf of Kenya’s Central Bureau of Statistics (CBS) and Ministry of Energy (MoE). My research draws on both the final

79
about the demand for woodfuels in Kenya, and is particularly useful in understanding
patterns of consumption in Nairobi. The study is referred to throughout this text as the “MoE
study”.
The second study was a nationwide survey of Kenya’s charcoal trade that was carried out
simultaneously with my own research by a renewable energy advocacy and consulting firm,
Energy for Sustainable Development – Africa (ESD-A) with funding from the British
Department for International Development (DfID). The study will be referred to throughout
this text as the ESD-A study. This survey work was conducted in early 2004. The ESD-A
team surveyed charcoal producers (n = 1,527), transporters (n = 859) and vendors (n = 1,914)
in 24 of 69 Kenya’s districts. The sampling frame was a clustered randomized design in
which the number of respondents from each district was determined by the district’s
proportional contribution to the national population.58 The respondents surveyed in the study
were to be selected at random; however, given the illicit nature of the charcoal trade and the
lack of prior data available about the total population of charcoal producers, transporters and
traders, it is unlikely that the selection was actually randomized.59 Nevertheless, it is the only
comprehensive source of data available for Kenya’s charcoal trade and represents a very
report written by consultants (Ministry of Energy, 2003) and the raw data that was by the survey generated, which the consultants were kind enough to share.
58 There is no empirical support to the assertion that the number of participants in the charcoal trade is proportional to population at any administrative level. In fact, there is some evidence to the contrary, in that relatively thinly populated districts, which have lower agricultural potential than heavily populated areas, host a disproportionate quantity of charcoal production. Nevertheless, the ESD-A study was extremely useful in identifying the ubiquity of small-scale charcoal production in districts not traditionally thought of as charcoal production areas.
59 In this sense, a selection that is truly randomized would give each member of the population an equal probability of being selected for participation in the survey(Deaton, 1997).

80
good start towards understanding the nature of the trade. I am grateful to the ESD-A team for
making their raw data available to me for this research.
In addition, in order to understand how charcoal fits into the country’s policy environment,
including issues like land-use, energy, and environmental management both within Narok
district and at the national level, I conducted a series of in-depth interviews with state
officials, researchers and members of civil society. The subjects of these interviews included
the following government officials: the Narok District Commissioner (DC), the Narok
District Agriculture Officer (DAO), the Narok District Crops Officer, the Narok District
Forest Officer (DFO) and Assistant DFO, the Narok Supervisor of Forest Guards, the Narok
County Council (NCC) Chief Forester, and the Narok Chief Registrar of Lands. In addition, I
conducted interviews with individuals active in environmental and energy policy advocacy
including academic researchers from the University of Nairobi and Kenyatta University, as
well as representatives from the following institutions: the African Centre for Technology
Studies (ACTS), the East African Wildlife Society (EAWLS), Kenya Forest Working Group
(KFWG), Environmental Liaison Centre International (ELCI), Energy for Sustainable
Development-Africa (ESD-A), African Energy Policy Research Network (AFREPREN), and
Forest Action Network (FAN). I also spoke with a number of individuals who are active in
promoting private sector participation in the charcoal trade, including the author of Kenya’s
Draft Wood Energy Policy Paper (Ministry of Energy, 2003), which marks the country’s first
attempt to formally develop a policy for the country’s traditional energy sector.
Finally, I supplemented these primary sources of data with an extensive review of archival
and secondary sources. These include district-level agricultural reports, district

81
environmental reports, district development plans (DDPs), court records and district
administrative communications as well as national statistical abstracts and national census
data.

82
Chapter 3
“This is not a forest”: land tenure, charcoal production, and land use change in Narok, Kenya
Only by the cultivation of the soil as against its use for grazing can permanent economic advance be obtained.
Report of the East Africa Commission, 1925, p. 32.
…the Maasai of Kenya are today a people besieged by agriculture.
Kituyi, 1990, p. 85.
Kila mtu ataanza kupata moyo ya kulima, tumeona nuru…kidogo
[Everyone will start to get an appreciation of farming, we have seen the light…a little].
Maasai farmer interviewed in Narok, 07 September, 2004
Introduction
In this chapter, I will link the broad theoretical understandings of the social drivers of
environmental change and the specific environmental changes observed in Narok over the
past century discussed in Chapter 2 to the charcoal trade that has developed in this part of
Kenya. I will do this by examining the ways in which socioeconomic change created
conditions amenable to agricultural expansion and the creation of the district’s thriving
charcoal trade.

83
I will focus primarily on two sources of social transformation in Narok, demographic change
and changes in land tenure. Of course, other pressures were also brought to bear on Narok’s
political-ecological landscape, both from within and outside the district. These include the
rapid commoditization of productive resources in pastoral areas – primarily land and cattle –
and an increasingly divisive political system grounded in ethnic difference. In addition, as the
Maasai farmer quoted on the opening page of this chapter attests, increasing numbers of
people in the Maasai community are accepting, if not actually seeking out, ways of living
that are very different from those of their forebears including relying more heavily on
cultivation than in the past. This represents an extreme shift from traditional Maasai
ideology, in which cultivating the soil was considered “sacrilege to the earth”, “destructive”,
and “demeaning” (Homewood, Lambin et al., 2001, p. 7); also see (Galaty, 1992).
To a large extent, Maasai living in Narok’s grain producing areas have accepted the notion of
development and a package of ideas associated with it, including individual economic self-
sufficiency, private landholding, and full engagement with the cash economy.1 In the
discussion that follows, I examine how these pressures contribute to environmental change
within the specific context of changing demographics and tenure reform in Narok.
1 The Maasai have been described as fiercely, famously, self-reliant – descriptions which largely agree with their own historical self-representation (Broch-Due and Anderson, 1999). However, this description typically applied as much to the olosho as to the individual. Now it appears that more emphasis is placed on the individual. In addition, past self-reliance and independence were based entirely on pastoral production. Now, the emphasis for many Maasai is on land, rather than livestock. However, this doesn’t mean that the Maasai have embraced the specific paths of development envisioned by western development agencies or the central Kenyan government. There are many ways that subjects of development, as individuals or groups, selectively adopt, discard, and transform particular policies, ideas, and meanings to suit their needs and interests.

84
This chapter proceeds as follows: first I offer a discussion of migration into Narok, showing
how the demographic character of the district has changed since the beginning of colonial
rule. I then discuss the evolution of land tenure in the district: first from communal to
corporate ownership and then to individual freehold tenure. Following that, I explore some of
the outcomes of subdivision: specifically the expansion of cultivation, leasing and sales of
land. Finally, I bring the discussion back to charcoal and discuss how charcoal production
and land use change are strongly bound together as a result of land privatization and the
notion of economic self-determination through private land ownership.
Demographic change in Narok
The vast majority of charcoal makers in Narok are either temporary or permanent migrants
from neighboring districts. Migration has changed the face of Narok District in the 40 years
since Kenya’s independence. Since arriving in the region 4-500 years ago, the Maasai were
never completely insulated from neighboring ethnic groups: migration into, and out of
Maasai territory predates the arrival of the British. British rule did, however, fundamentally
alter the relationship that the Maasai had with migrants into their territory. As with many
changes brought about during colonial rule, these altered relationships carried through to the
post-colonial era.
Migration in Maasailand was historically linked to trade. The Maasai maintained trade
relations with several groups in order to gain access to goods that they could not obtain
through pastoral production such as skins and horns, bows and arrows, and honey (Berntsen,
1976; Kituyi, 1990). In addition, as a survival strategy during times of drought, when pastoral
production was not sufficient to sustain the population, Maasai frequently traded agricultural

85
produce with non-pastoral neighbors (Galaty, 1982; Kituyi, 1990; Waller, 1999).2 These pre-
colonial exchange relations included a flux of people into and out of the ranks of the Maasai
population. Individual Maasai families who could not sustain themselves through pastoralism
because of drought, disease, or personal misfortune would often leave and be absorbed into
neighboring hunter-gatherer or agricultural groups.3 Similarly, formerly “failed pastoralists”
who managed to accumulate sufficient stock to sustain a pastoral lifestyle could be
reintegrated into Maasai iloshon.
Other migrants into Maasailand included women marrying into the group. Intermarriage was
common, with the Kikuyu constituting the most popular source of non-Maasai wives (Kituyi,
1990).4 Typically, in-migrants were integrated into Maasai society and adopted pastoralism
as a primary means of social reproduction. As Kituyi writes, “Maasai traditionally ‘digested’
migrants and reproduced them in the pastoral image.” (Kituyi, 1990, p. 50).5 However, the
Maasai also tolerated small numbers of non-pastoralists in their territory without necessarily
trying to absorb them. These groups migrated to the wetter margins of Maasai territory,
possibly as a result of drought or dispossession in their own home areas. As mentioned
2 In addition to trade with neighboring groups, the Maasai maintained exchange relations with long-distance traders including Swahili merchants and Boran cattle traders (Kitching, 1980; Waller, 1985; Kituyi, 1990).
3 Historians note that the Maasai have traditionally had few social safety nets for people who lost their stock, which led to the out-migration of “failed” pastoralists. This notion that “The poor are not us”, is explored at length in Anderson and Broch-Due’s edited volume of the same title (Anderson and Broch-Due, 1999). See also (Galaty, 1982; Iliffe, 1987; Kituyi, 1990).
4 One key informant in this study was a Kikuyu woman who married a Maasai man from Narok. She noted how her husband did not support her so she turned to charcoal making with several of her grown children. She was one of two women we encountered in Narok participating in charcoal production.
5 As evidence of this integration, historians have noted the existence of elaborate rules by which a non-Maasai may be “converted” to become Maasai (Sankan, 1971).

86
above, such groups provided a vital source of subsistence produce when pastoral production
dropped to levels that could not sustain household needs.6 They also provided what Salzman
(Salzman, 1980b) calls “institutionalized alternatives” for impoverished Maasai, who could
join their ranks as a socially acceptable exit route when pastoral production systems failed for
those individuals.
The situation changed significantly with the introduction of colonial rule and the drafting of
the treaties that defined the Maasai Reserves. The Maasai Agreements of 1904 and 1911
effectively closed the Maasai Reserves to settlement by non-Maasai: settlers and native
Kenyans alike (Kenya Land Commission, 1933). Despite this closure, there was still a slow
flux of people into Maasai territory during British rule (East Africa High Commission, 1953;
Government of Kenya, 1966). Ironically, it was colonial policies in other parts of the country
that put pressure on cultivators in neighboring districts and forced them to seek livelihoods in
Maasailand. Kituyi notes that pressure came from agricultural communities on opposite sides
of the Reserve. In the east and central parts of the district:
By 1920, the [British colonial] government reported groups of [coastal] Swahili and Kikuyu migrants occupying agricultural plots around Narok town; there were Kikuyu ‘squatters’ around Irage Engare7 and Ewaso Ngiro…
6 Though the Maasai tolerated small incursions of agricultural populations, they did not tolerate agriculturalists whose cultivation significantly reduced access to pasture. This is particularly true at the height of their military strength in the early to mid-19th century. One of the bloodiest conflicts recorded in pre-colonial Kenyan territory arose as a result of one olosho, the Laikipiak Maasai, adopting long-term agriculture. Other Maasai iloshon retaliated against this perceived threat to their collective economy by attacking the Laikipiak and effectively wiping out that Maasai section (Kituyi, 1990).
7 This is an alternative spelling of the town currently known as Niaregie Ngare, a small commercial center about 20 km east of Narok town.
87
In addition, on the western side of the district, ill-defined colonial boundaries led to…
…pressure from Kipsigis agro-pastoralists in the Soit and Kilgoris area…The introduction of colonial tea estates in Kericho in the 1920s displaced the local Kipsigis and led to the emergence of wage labour. Some of the more marginalised [migrants] moved into Narok in pursuit of wage employment around colonial establishments (Kituyi, 1990 p. 49).
Though the absolute numbers of non-Maasai living in Narok remained relatively low up to
the end of the colonial era, the rate of growth in the colonial years was extremely high. In just
fourteen years, between 1948 and 1962, the non-Maasai population in Narok District
increased by a factor of fourteen. Maasai population growth was fairly high in the same time
period, increasing by nearly a factor of three.8
The Maasai’s ability to “digest” migrants and minimize threats to their pastoral economy was
largely curtailed by British rule. The British effectively “demilitarized” the Maasai (Kituyi,
1990, p. 50) (also see (Kenya Land Commission, 1933)), which left migrants free to pursue
their own livelihood strategies. Thus, this influx of migrants during the colonial era marked
the beginning of a slow shift of agricultural production from the fringes of the territory to the
very heart of Maasailand, which greatly accelerated after Kenya’s independence. This is
discussed in more detail below.
Figure 10 shows the population in Narok District reported in these two colonial-era censuses
as well as the four national censuses that have been conducted by the Kenyan government
8 This increase of the Maasai population is too high to be the result of natural fecundity and may indicate poor enumeration in the earlier (1948) census.

88
since independence (Amman and Duraiappah, 2001; Coast, 2002; Lamprey and Reid, 2004).9
Clearly, migration intensified with the end of colonial rule in 1963. Just prior to
independence, the district had roughly 110,000 residents, 95% of whom were ethnic Maasai.
The post-colonial government lifted laws restricting the general population’s movement and
settlement. As a result of this freedom, the non-Maasai population grew rapidly, increasing
by a factor of three in the first seven years after independence and by a factor of five in the
subsequent decade. This influx came primarily from areas adjacent to Narok, which have
better agricultural land, but have far higher population densities and land values. In
comparison to the crowded and expensive plots in these neighboring districts, parts of Narok
presented an opportunity for much more affordable access to land for cultivation. The
changes in land tenure in Maasai territory, which are discussed in more detail below,
facilitated the spread of agricultural communities from the fringes to the heart of Maasailand.
By 1989, the last census to publish data on ethnicity, the non-Maasai population had
increased by nearly a factor of 40 relative to the non-Maasai population before
independence.10 The number of Maasai did not quite double in the same period. As a result of
9 Care should be taken with census data, particularly concerning polygamous pastoral populations like the Maasai. The rules that CBS applied to polygamous households have changed between 1979 and 1989 censuses (Government of Kenya, 2001) and Lamprey notes that they seem to have been applied less strictly in 1989 than 1999 (Lamprey and Reid, 2004). Nevertheless, the data indicating growth of the non-Maasai population relative to the number of Maasai in the district should be reliable within reasonable margins of error and is corroborated by local government documents that remark on the number of migrants settling in the district. See, for example, the District Development Plans covering the periods from 1994-6 and 1997-2001 (Government of Kenya, 1980-2002).
10 Internal migration was common throughout Kenya in this period; however, Narok was unique in some sense because of the degree of its isolation and ethnic homogeneity prior to this influx. In addition, census data reveal that the proportional increase of the in-migrant population between 1979 and 1989 in Narok was the largest of any district in Kenya (Government of Kenya, 1994).

89
this rapid influx, by the end of the 1980s, there were more non-Maasai than Maasai living in
Narok, a region which had been controlled by the Maasai since the 17th century (Sindiga,
1984; Pasha, 1986).11
Figure 10: Population in Narok/Trans Mara Districts from official census data (1948-1999)
0
100,000
200,000
300,000
400,000
500,000
600,000
1947 1960 1973 1986 19991948 1962 1969 1979 1989 1999
Non-Maasai (census data)
Maasai (census data)
Non-Maasai (projected)
Maasai (projected)
Source: originally from census data; adapted from (Amman and Duraiappah, 2001).
This massive influx of migrants had a significant impact on the pastoral economy. Many
migrants were agriculturalists from adjacent districts looking for land to cultivate. Galaty
notes that in pastoral areas of Kenya:
11 Census data for 1989 and earlier includes areas that were split in 1995 to form Trans Mara District. To make a more direct comparison, the 1999 population in Figure 10 includes both Trans Mara and Narok. The population in Narok alone was 365,750 in 1999. In addition, the ethnic breakdown for 1999 is shown as shaded rather than solid bars because the actual division is unavailable. The graph shows an estimation based on the historical trend. Census questionnaires included a question on ethnicity; however, the government has yet to publish these data (Government of Kenya, 2001). As is evident from the figure, in-migration exceeded out-migration by a significant margin. From 1979-89 in-migration exceeded out-migration by a factor of 6 – one of the highest of all districts in Kenya. From 1989-99 the ratio dipped was ~3 (Government of Kenya, 1994; 2001). Unfortunately, migration data are not disaggregated by ethnicity so it is impossible to say if those people leaving Narok are Maasai or non-Maasai.

90
…farmers have moved into pockets of higher potential swampland, highland forest or riverine woodland, turning scarce and valuable dry season grazing into cultivated fields…marginal dryland agriculture has spread in many areas once exclusively given over to herding economies (Galaty, 1994, p. 187-8).
Migration into Narok must also be seen as an important factor contributing labor to the post-
subdivision Maasai economy. This is true of those who permanently migrated into the
district, as well as a large number of circular migrants, who are generally not captured in
official statistics. Circular migrants are typically individual male laborers who cycle between
Narok and their home areas. They work for a short period of time and carry cash back to their
families, who remain at home. Circular migrants dominate the charcoal labor pool. Of the 50
charcoal makers surveyed in this study, 41 are non-Maasai. Among these, only three consider
Narok district their home area.12 A further eight have moved with their family to Narok, but
they do not consider it their to be their home area. The remaining 30 are true circular
migrants; they come to Narok alone, their families remain in their home districts, and they
travel there periodically to work on their own land, deliver earnings from charcoal, and/or
pursue other economic interests. The migration status of Narok’s charcoal makers is
discussed further in Chapter 5.
The full impacts of migration into Narok District must be seen in the context of changing
land tenure as well as demographic change. Both migration and the transformation of land
12 Kenyans use the Swahili word nyumbani, which is the same word used for both ‘house’ and ‘home’, to describe their home area. The notion of “home area” extends beyond simply where an individual is raised. It is associated with their ancestral home and, importantly among many ethnic groups, the burial of their forebears. This is particularly evident in talking to urban Kenyans, who may have been born and raised in Nairobi, but still talk of their rural home.

91
tenure contributed to environmental change in Narok as well as to its role as a major charcoal
production area. Land tenure is discussed in the following section.
Land Tenure change in Maasailand
Land tenure in Maasailand during colonial rule
Prior to the arrival of the British, Maasai territory extended to the highlands on either side of
Kenya’s Rift Valley and ran from Lake Baringo in west-central Kenya to the south into
northern Tanzania (Homewood, 1995). At the height of their political dominance in the early
19th century, the Maasai were known to move their cattle well beyond this range, with
Maasai herds grazing from the Indian Ocean to Lake Victoria (Sindiga, 1984).
As was mentioned earlier, the arrival of the British at the close of the 19th century coincided
with a time of extreme hardship for the Maasai. A series of internal feuds, disease outbreaks,
drought, and famine had reduced their population by half (Sindiga, 1984) and their livestock
by as much as 90% (Homewood and Rodgers, 1991). Within the first 20 years of British
Rule, two agreements were struck between the colonial state and the Maasai leadership that
saw their expansive territory, with its historically fluid boundaries, mapped, bounded, and
reduced by about 80%.13
13 This is based on N. Leys’ estimate that, after the first Maasai treaty, in 1904, Maasai territory was reduced by 90% in comparison to its pre-colonial area (Kituyi, 1990, p. 45) citing (Leys, 1925). The second treaty, in 1911, saw the Maasai reserve increase by roughly 60% in size relative to the 1904 agreement (Kenya Land Commission, 1933).

92
In this greatly reduced territory, the Maasai sections attempted to continue with their
traditional pastoral production as before. However, they were subject to many unfamiliar
pressures that their traditional pastoral economy was not adapted to deal with. Much of their
traditional dry season grazing lands had been expropriated as a result of the early treaties. Cut
off from much of that territory, the Maasai made do with the resources in the Reserve, which,
by the 1930s and 40s, was suffering from extensive degradation of pasture (Sindiga, 1984;
Kameri-Mbote, 2003).14
Through this period, land management and land tenure institutions remained more or less
unchanged. Historically, the land management in Maasai society was governed by a system
of communal tenure. Each olosho (see discussion in Chapter 2, note 6 above) constituted a
viable independent economic and ecological unit under typical climatic conditions, with
sufficient water and both wet and dry season pasture to allow for the viability of pastoral
production in most years (Galaty, 1980; Spencer, 1988; Homewood, 1995; Kameri-Mbote,
2003). As in many pastoral societies, access to grazing land was based largely on social
identity or membership within a particular community (Helland, 1977; Galaty, 1994). Among
the Maasai, this identity was defined primarily at the level of the olosho. Jacobs writes:
14 Campbell notes that much of the perceived overgrazing was likely due to drought rather than overstocking, citing the coincidence of official range assessments in 1934, 1945, 1954, and 1960-1 with major drought events (Campbell, 1993).

93
…individual families secured rights to communal resources only by common residence within the same locality over long periods of time and by regular participation, involving specific obligations, in local age-set activities.15
Thus, within the olosho, access to grazing was open to all members, although the leaders
could exercise seasonal closures of certain grazing areas in order to ensure regeneration of
pasture (Galaty, 1980).
Among the Maasai, cattle, which historically formed the primary means of exchange in
socioeconomic relations, have traditionally been considered the private property of
individuals: typically the male household head.16 Although cattle are privately owned,
pasture within the olosho could not be claimed exclusively by any individual member of the
section; rather, it was collectively owned and managed (Helland, 1977; Galaty, 1980).
However, there were several institutionalized exceptions allowing de facto exclusive rights to
land. For example, individuals were permitted to enclose, and claim exclusive rights to, small
parcels or grazing land (Maa: oloposhi) close to newly established homesteads in order to
graze weak or newborn animals without having to travel long distances with them. Similarly,
households had exclusive rights to the grass immediately outside the manyatta gate (Maa:
15 From (Jacobs, 1975), as cited in (Helland, 1977).
16 Nevertheless, there were customary restrictions concerning the rights of other family members, that limited the ways in which household heads could dispose of cattle (Helland, 1977).

94
olkeri) (Kituyi, 1990) 17. In addition, Galaty notes that families could acquire preferential
access to certain areas of good grazing, but never exclusive rights:
Through routine and negotiation, certain families acquire the right to return to certain dry-season grazing areas or exploit certain wet-season areas of good grass. But these rights are never exclusive ones, for in times of environmental pressure, herds are moved freely to any region within the olosho with accessible pasture, if not across olosho boundaries, to exploit grazing available elsewhere. The obverse is also true, that pastoralists might gain the right to use, but not dispose of the resources of a given area, of the land itself (Karbolo, 1999, p. 187).
Generally however, iloshon were treated as independent social groupings (Jacobs, 1975).
Only under extraordinary conditions like severe drought could members of one section graze
their cattle in neighboring iloshon and never without first obtaining permission (Jacobs,
1975; Homewood and Rodgers, 1991).
Post-colonial changes in land tenure: the Group Ranch
Although they were greatly limited in their territory, the Maasai enjoyed relative security of
tenure during the middle and later years of colonial rule (Kituyi, 1990). However, by the time
the country gained independence in 1963, the Maasai were faced with increasing threats to
their tenurial security from a range of sources. In the 1950s, the colonial state embarked on
an ambitious land reform initiative meant to create a class of bourgeoisie farmers with titled
landholdings.18 In addition, large tracts of Maasai territory had been alienated for
17 Interestingly, Kituyi notes that these cultural precedents were used by elite Maasai who later sought exclusive rights to pasture in the form of private commercial ranches, which they argued should be regarded as large olpolosi (Kituyi, 1990, p. 68).
18 This plan, dubbed the Swynnerton Plan, after its main architect, was based on conventional understandings of private property and the assumption that the introduction of freehold tenure would “cultivate an African middle class with a stake and means to sustain free market policies in agriculture after independence”

95
conservation purposes. Incidentally, the state’s power to alienate land for conservation
purposes originated under colonial rule with the National Parks Ordinance of 1945. In 1946,
Nairobi National Park was established on the northern edge of Kajiado District, the other part
of the Maasai Reserve. In the same year, Tsavo, on the far eastern edge of Kajiado, was
designated a game reserve; two years later, it was upgraded to national park status precluding
human settlement and exploitation. In 1961 the MMNR, which formally comprised only the
‘Mara Triangle’, an area west of the Mara River, was re-declared a ‘District Council Game
Reserve’, and enlarged to take in the plains east of the River similar to its current boundaries.
Soon after, Amboseli (1968) and Chyulu Hills were designated reserves (also in Kajiado).
Thus, by the mid-1970s, over 7,000 square miles (1.8 million ha) of rangelands, including
watering sources, salt licks, and seasonal pastures “tumbled out of Maasai control into game
reserves and parks” (Sindiga, 1984; Kituyi, 1990, p. 46 also see).
Moreover, with Kenya’s independence came a shift in national priorities. One of the primary
causes of unrest among the Kenyan populace prior to independence, was the lack of
sufficient agricultural land, particularly among the Kikuyu in Central Kenya. This was the
underlying reason for the Mau Mau insurrection of the early 1950s (Kanogo, 1987). Mau
Mau was largely fought by the Kikuyu and it was they who took the reins of power when the
British departed. This lead to fears among the Maasai “that an African Kenyan Government
(Kituyi, 1990, p. 69). Titled landholdings would ease access to credit, facilitating improvements in traditional farming systems: farmers would take loans using land as collateral. It was also thought that freehold title would promote the consolidation of fragmented landholdings and initiate a market for land. A secondary effect of land consolidation would be the creation of a land-poor class of wage laborers. The plan states this in a surprisingly blunt manner, ‘able, energetic or rich Africans will be able to acquire more land and bad or poor farmers less, creating an landed and a landless class. This is a normal step in the evolution of a country.” (Swynnerton, 1955, p. 10) also see (Haugerud, 1983).
96
might not respect the integrity of the Maasai Reserve established by the [colonial]
government,” (Galaty, 1980, p. 160). This sense of insecurity was exacerbated by the
“cultural contrast” between the ruling elite and the Maasai. As Galaty notes:
The historical Maasai pride in custom and appearance began to assume a note of ambivalence, in light of the perception of their “backwardness” by surrounding peoples (Galaty, 1980, p. 160).19
Additional insecurity came from within the Maasai community. Some early “pioneers”
among the Maasai elite had taken advantage of land registration and secured freehold title to
areas of trustland within the former Maasai Reserve. In Kajiado, within two years of
Independence, over 50,000 ha, roughly two percent of the district, had been subdivided into
82 private ranches (Mission on Land Consolidation and Registration in Kenya, 1966). In
addition, some very scarce high potential land had been lost in Ngong, at the northern edge of
Kajiado, where some better off Maasai had gained title to land as part of the post-colonial
land registration exercise. They promptly sold their holdings to Kikuyu farmers, thereby
transferring that land out of Maasai hands “probably for ever” (Mission on Land
Consolidation and Registration in Kenya, 1966, p. 25, para. 87). Finally, between 1959 and
19 Galaty and other authors have written on the problematic notion of “Maasai” as an ethnic identity, particularly in the context of conflict over resources (see, for example, Spear and Waller's edited volume (Spear and Waller, 1993); see also (Galaty, 1982; Kituyi, 1990; Broch-Due and Anderson, 1999)). Though threats to the security of Maasai were conventionally attributed to outsiders, most frequently Kikuyu agriculturalists, this obscures both the frequent interchange between Maasai and Kikuyu as well as the role that certain Maasai elites had in reducing land security among their kinfolk.

97
1961 the Maasai had suffered huge losses from a particularly severe drought, which cost
them over half of their cattle holdings.20
In 1965, the newly independent Kenya government requested that the British send a
commission to examine the progress of the land registration and consolidation exercise that
the colonial state had initiated over a decade earlier (Mission on Land Consolidation and
Registration in Kenya, 1966; Leys, 1975). Both the Maasai leadership and the new Kenyan
administration agreed that changes were necessary in Maasailand if they were to survive
Kenya’s post-colonial transition.21 Though this commission was primarily concerned with
land registration and consolidation in high potential agricultural areas, their
recommendations had particularly profound implications for land tenure in Kenya’s pastoral
regions.22 The commission recommended that pastoral areas undergo an alternative form of
land registration. Specifically:
A suggestion has been put forward that in Maasai districts land should be registered in the name of a particular Maasai section (or part of a section) to enable all members of the section to have exclusive grazing and watering rights within their registered
20 Several scholars point to this drought as a particularly important event in the evolution of the Maasai’s pastoralist ideology and their relationship with the newly forming Kenyan state and its embrace of capitalism (Halderman, 1972; Fumagalli, 1978; Galaty, 1980; Kituyi, 1990).
21 The extent to which this sentiment was shared among the majority of the Maasai population is unclear. In their report, the commissioners admitted that they “were not able to assess the attitude to these proposals of the Maasai cattle owners directly concerned” (Mission on Land Consolidation and Registration in Kenya, 1966, p. 25). Nevertheless, in support of their recommendations, they note that a development plan assembled by a set of committees in 1964 consisting of “politicians, other representative Maasai and Government Officers” stated that the Maasai “now wish to progressively give up their nomadic way of life and settle down to a static existence” (p. 30). There is no evidence that this opinion was shared by anyone outside the exclusive circles of people given a voice in the planning process.
22 See Leys for an excellent discussion of issues raised by the report concerning Kenya’s agricultural areas (Leys, 1975).

98
area to the exclusion of members of other sections…On the face of it…it would appear that registration of land to a social group (in this case the section) would in such circumstances be justified on economic grounds. (Mission on Land Consolidation and Registration in Kenya, 1966, p. 25).23
With this recommendation, which was adopted by the new government in 1968, the
commission proposed to settle groups of Maasai in land units called Group Ranches (GRs)
that were smaller than the olosho but large enough to be ecologically viable for cattle
production. Moreover, the new land units would consist of a social group “small enough to
allow central control, and large enough to provide economic viability,” (Galaty, 1980, p.
165).
Day to day affairs of the group ranch were governed by the Group Ranch Committee.
Members of the committee, which consists of a chairman, secretary, treasurer and several
other members, are elected by the membership. Ranches also had a number of
“Representatives” who act as legal trustees of the Ranch as a corporate entity.
Representatives “have powers to sue and be sued in the corporate name, acquire hold charge
and dispose of property of any kind and borrow money with or without security. They have a
duty to hold the property and exercise their powers on behalf and for the collective benefit of
all the group members and fully and effectively consult group members in performing their
roles,” (Kameri-Mbote, 2002, p. 71). These are also elected and may or may not overlap with
the committee. Finally, there was a General Assembly, which consisted of all group ranch
23 The original suggestion for the group ranch concept is attributed to a suggestion from the East African Royal Commission of 1953-1955. However, the concept did not receive serious consideration until after this Commission’s report (Kameri-Mbote, 2002).

99
members (adult male heads of household). Assemblies were supposed to meet at least every
15 months and hold regular elections for both Representatives and Committee membership
(Helland, 1977). In some cases Assemblies met regularly, while in others they rarely or never
met. In addition, they lacked the both power and incentives to enforce potentially unpopular
management decisions such as restrictions on herd size among individual members (Helland,
1977).
The recommendation from the Land Commission was justified on the basis of two
underlying claims. First, that granting group tenure would improve land security and prevent
landlessness among the Maasai. Landlessness was a considered a definite threat as a result of
the frenzy of private land registration, which was underway at the time. The commission’s
report notes that the average size of the individual ranches that were allocated prior to their
work in 1965, was eight times the area that would have been allocated under an equitable
distribution of land among all of the district’s household heads (Mission on Land
Consolidation and Registration in Kenya, 1966).
The imbalance was still more egregious than these numbers imply because the land given
that was out in these early allocations was located in the better-watered areas. The
commission was very explicit about the threat to non-elite Maasai, noting that “if the
‘approval’ of individual ranches continues at this rate and on this scale a dangerous land
shortage will soon be created for those not fortunate enough to obtain individual grants.”
(Mission on Land Consolidation and Registration in Kenya, 1966, p. 31).

100
These early individual ranches and others that followed were created with the hope that
“progressive” ranchers would serve as models for group ranchers. Galaty points out that this
may have actually undermined the functioning of group ranches:
…when members of group ranches should have dedicated their efforts to developing institutions appropriate for managing their holdings, those with seniority, influence, business acumen, and/or education sought instead to demarcate individual portions of land within the group domain and to acquire individualized private title (Galaty, 1994, p. 190-1).
The second underlying claim that was used to justify the creation of group ranches was the
notion that, as with individual freehold tenure, the commission proposed that assigning
freehold title to groups would lead to “improved” range management, primarily by
facilitating access to credit.24 Group titles could be used as collateral for loans, which would
finance the construction of cattle dips and fencing as well as the purchase of improved
breeding stock and commercial veterinary products (Mission on Land Consolidation and
Registration in Kenya, 1966; Galaty, 1980; Kimani and Pickard, 1998). Through these
improvements, it was thought that that Maasai pastoral production would become “more
responsive to market forces” (Kameri-Mbote, 2003, p. 14) by increasing off-take, decreasing
24 Interestingly, the Mission’s report also raises doubts about whether land registration was a necessary step to securing loans. Ostensibly, providing title to land allows creditors to use the land as collateral in the event that the defaults on the loan. However, in reality banks were highly unlikely to foreclose on large areas of rangeland. Moreover, in the event that they did foreclose on Maasailand, they would have had a great deal of difficulty disposing of such areas and dispossessing the inhabitants. However, commission members were convinced otherwise, “after discussions with representatives of the World Bank, that registration of GRs is a prerequisite to the loan of money for development purposes. Without the certainty of ownership and the clear right of the group to exclude others, which is provided by registration, no agency would be prepared to lend money for range development.” (Mission on Land Consolidation and Registration in Kenya, 1966, p. 31). The World Bank was particularly influential in this process because they were the agency providing funding for the Kenya Livestock Development Project (KLDP), which was implemented in 1968 as the first phase of group ranch registration and range development (Sadera, 1986). Also see C. Leys’ discussion in (Leys, 1975, p. 66-73).

101
herd size, and otherwise managing their herds as profit generating enterprises (Helland, 1977;
Galaty, 1980; Sadera, 1986; Kimani and Pickard, 1998; Kameri-Mbote, 2003).
In addition, the state had further motivations for promoting this change in land tenure.
Historically, state relations with pastoral or nomadic people have been uneasy at best.25
There is little doubt that Kenyan Government wished to wean the Maasai from their
dependency on pastoral production and incorporate them more into Kenyan society
particularly because they occupied an area with good agricultural potential.26 Voicing this
policy explicitly, the Narok District Development Plan drafted for the 1979-1983 planning
period predicted an end to pastoralism within a four-year time span:
Maasai people are turning to individual and group ranching...with the advance of the present land adjudication process these…areas will also become individual ranch areas. The range planning team has an aim of planning an average of ten group ranches per year, so that by the year 1983 there will be very little pastoralism left in this district" ((Government of Kenya, 1980-2002), 1979, p. 15).
However, the same report claims that this change in land tenure does not represent too large a
break from the past.
…the government has encouraged the group registration of lands on the assumptions that this reflects traditional land tenure practices. To this end, most groups represent extended families ((Government of Kenya, 1980-2002), 1979, p. 16).
25 Specifically, relations are characterized by tensions between pastoral societies and sedentary agrarian states whose needs and priorities are often at odds with each other. In the case of powerful states, this can lead to dispossession of rangelands and/or forced sedentarization of pastoral groups; with weak states, it can lead to neglect and underdevelopment of pastoral areas, as is the case in Kenya’s northern districts (Salzman, 1980a; Fratkin, 1997).
26 More state resources were devoted to tenure reform in Maasai areas than Kenya’s other pastoral areas largely because of their proximity to Nairobi and because they were in possession of arable land, access to which could relieve pressure from the overcrowded farming areas in neighboring districts.

102
As will be discussed below, the latter statement was not true in most instances.
The new Kenyan government institutionalized the concept of group tenure in the Land
(Group Representatives Act) of 1968. In the context of this Act, a “Group” is defined as:
…a “tribe, clan, family or other group of persons, whose land under recognized customary law belongs communally to the persons who are for the time being the members of the group, together with any person of whose land the group is determined to be the owner" where such person has, under recognized customary law exercised rights in or over land which should be recognized as ownership. (Kameri-Mbote, 2003, p. 27, quoting from the Land (Group Representatives Act) of 1968: Chapter 287 of the Laws of Kenya).
In Kajiado, the registration of GRs actually began several years prior to the passage of the
Group Representatives Act, and proceeded rapidly after its passage through the 1970s. GR
registration got a slower start in Narok, but eventually accelerated there as well.27 By the mid
1980s, roughly 700,000 ha had been registered in Narok and 1.7 million ha in Kajiado.
Figure 11 shows the cumulative area registered in each Maasai district between 1965 and
1990.28
By the mid-1980s, it was apparent that the group ranches were not functioning completely as
intended. Group tenure did, for a time, provide the Maasai with a greater degree of security
27 There are two reasons for the different paces of land reform in the two districts. The first is proximity to Nairobi. High potential areas of Kajiado District are extremely close to Nairobi. The Ngong Hills, made famour by Karen Blixen in Out of Africa, are directly adjacent to the affluent Nairobi suburb that bears her name. The second reason is Kajiado’s proximity to major transportation infrastructure like the Mombasa-Kampala railway line and, later, the main Mombasa-Nairobi highway. This infrastructure made it much easier to bring cattle to market, which made commercial ranching in Kajiado an attractive investment. The city’s main slaughterhouse was established in Mbagathi, on the outskirts of Nairobi bordering Kajiado district (Kitching, 1980).
28 The graph shows total land registered, which includes both private and group ranches. However, in both districts the majority of registered land area was registered as group ranches.

103
in land tenure and prevent landlessness for many (Pasha, 1986), thereby satisfying the first
claim used to justify the tenurial policy. However, group tenure did not bring about a
commercialization of livestock production in the way that policy makers envisioned.29
Figure 11: Cumulative area of registered land in Maasai districts (1965-1990)
-
500
1,000
1,500
2,000
2,500
1964
1966
1968
1970
1972
1974
1976
1978
1980
1982
1984
1986
1988
1990
103 h
ecta
res Registered land in Kajiado
Registered land in Narok
Total area of NarokTotal area of Kajiado
Passage of the Land (Group Representatives) Act
Source: (Mission on Land Consolidation and Registration in Kenya, 1966; Government of Kenya, Various years)
Several reasons are offered to explain why group ranches did not function in this capacity.
First, the establishment of group ranches did not follow recognized social groupings. Helland
notes that many ranch boundaries were established in territories defined by temporary cattle
camps, rather than the more socially cohesive and ecologically robust enkutoto (Halderman,
29 Galaty argues convincingly that the majority of the Maasai accepted the group ranch arrangement without any expectation of economic development or significant changes to their pastoral production systems. Rather the attraction of the group ranch system was the political security that it offered (Galaty, 1980). A World Bank report on the KLDP admitted this was largely the case, bluntly stating that group ranches themselves were “much more a concept than a working proposition…and more an exercise in acquiring title to land than an effective means of commercializing beef production” (Pasha, 1986, p. 304) citing (International Bank of Reconstruction and Development, 1977).

104
1972; Helland, 1977).30 Second, despite the stated intent of the policy, many group ranches
were not ecologically viable for pastoralism.31
Thirdly, the problem of ecologic viability was exacerbated because few Maasai downsized
their herds or adopted more commercially-oriented management after ranches were
established. After shifting to the group ranch, most individual Maasai continued the common
pastoral management strategy of herd maximization so that, by 1990, the number of cattle in
Narok had increased by 30% relative to 1970 despite suffering large losses from severe
droughts in the early 1970s and early 1980s (Government of Kenya, 1980-2002). In 1984, the
Narok District administration noted that there had been little change in livestock management
in spite of the change in tenure:
Although group ranches have been established all over the district, the grazing pattern of the Maasai people is uncontrolled. Cattle from one group ranch can graze unabated on other group ranches (Government of Kenya, 1980-2002, 1984-1989 plan, p. 29).
In addition, the same report noted that herd mobility was starting to be affected by increasing
agricultural production:
30 The enkutoto is defined in Chapter 2 above. Halderman, who has studied the division of Kajiado GRs extensively, admits that the basis by which GRs were established remains a “riddle” that he was “unable to solve” (Halderman, 1972, p. 17). However, his 1972 report goes into detail about the demarcation of individual GRs in Kajiado and the personalities involved in defining both ranch boundaries and membership.
31 Halderman notes that only 6 of the 14 GRs implemented in the initial phase of the KLDP contained both wet and dry season pasture (Halderman, 1972, cited in; Kimani and Pickard, 1998). In addition, even ranches with the most favorable pasture were forced beyond their boundaries by drought conditions in the early 1970s (Fumagalli, 1978). As long as herd maximization was practiced, mobility, the greatest advantage of traditional pastoral production, could not be curtailed by group ranch demarcation (provided, of course, that ranches were not physically enclosed). The variability of climate in these areas is simply too great to confine economically sized herds in a fixed area – even an area that is more than sufficient in most years.

105
Livestock migration between low and higher altitude areas following rainfall patterns is now restricted because of expanding crop hectarage in higher altitudes. Overgrazing is rampant in the lower altitude because of these ecological changes.
As was discussed above, in the late 1970’s several group ranches in Narok’s central plateau
had begun leasing land for grain cultivation. By the mid-1980s, roughly 50,000 ha of well-
watered land was occupied by commercial crops and effectively removed from the
communal grazing lands. In addition, in spite of earlier policies that favored the development
of commercial ranching, by this time the state turned toward agriculture as a preferable
option for development in Narok.
For example, in 1979, The Narok Agricultural Development Project called for 320,000 ha of
arable land to be brought under commercial agricultural production (Sindiga, 1984). This
represented over 70% of the arable land in the district – all critical dry season pasture.
Clearly, this degree of land use change has not occurred. If it had, Narok’s pastoral economy
would have been rendered completely unviable. However, a substantial fraction of arable
land, roughly 25%, has gone into crop production since this plan was proposed. In addition,
local extension services began to favor agriculture over production. For example, in the
1989-1993 5-year planning period, state agricultural extension services reached 620 farmers
and over 27,000 farmers attended “field days” at which new farming techniques and
technologies are demonstrated. During the same period, only 499 livestock producers were
reached with livestock-related extension services and no field days were conducted
(Government of Kenya, 1980-2002).
Although not affected by the same extent of agricultural production, ranches in Kajiado
District were faring no better than in Narok. By 1984, over half of the ranches in Kajiado

106
voted for subdivision (Sadera, 1986). As with group ranch establishment, the group ranch
subdivision in Narok lagged behind Kajiado. Ranches began to subdivide in 1986, although
through the end of the 1980s and early 1990s, additional group ranches were still being
established (Government of Kenya, 1980-2002). Nevertheless, by 1990, the state officially
adopted the policy that group ranches should subdivide with members receiving title to
individual plots (Government of Kenya, 1980-2002).32
Group ranch subdivision
Initially, the government was opposed to subdivision because of the fear that it would result
in units of land that were not viable for livestock production (Kimani and Pickard, 1998).
However, as was mentioned above, subdivision soon became state policy, although the
problem of ecological viability was never effectively addressed. The subdivision of group
ranches represents the culmination of Maasai integration into Kenya’s market economy.33
The introduction of private tenure changed this by making land a fungible commodity. Pasha
puts it very succinctly in the context of changing land tenure institutions in Maasailand: “land
32 Within a few years, the issue of subdivision became politicized at the highest level of government, receiving attention from the President himself, who advised ranches to subdivide so that each member, “gets his title deed to avoid differences in the future,” (Galaty, 1992, citing an article that appeared in the April 15, 1989 edition of the Kenya Times, which was a state-run newspaper at that time).
33 According to the 2002-2008 DDP, which was drafted in late 2001, 66 group ranches had already divided with title deeds issued, 27 were in the process of subdividing, and 46 were “awaiting subdivision” (Government of Kenya, 1980-2002). The last description is dubious one, because it denies the existence of group ranches that do not intend to subdivide despite the official state policy.

107
has replaced livestock as the dominant resource defining socioeconomic status,” (Pasha,
1986, p. 306).34
This transformation is manifest in the growing market for land in the two Maasai districts,
including both leases and sales. Migration, discussed above, is an important driver of the land
market. A second factor related to the changing role of land among the Maasai is the
expansion of agriculture in the district. Agricultural expansion was discussed in Chapter 2 in
the context of LUC associated with commercial grain cultivation. However, smallholder
agriculture is an equally important transformation in Narok land management. As one
respondent stated while reflecting on the contrast between life before and after group ranch
subdivision, “Now we know that there is food here…we have been walking on food”.35
This respondent was speaking quite literally and actually gestured to the soil of the 1 acre
plot of maize that he soon planned to harvest. His crop from the previous year fed his family
for 9 months.36 However, the respondent may also have been speaking for other Narok
34 For the majority of Kenyan society, Kitching (Kitching, 1980) notes that by the early 1950s, “livestock production had already been subordinated to agricultural production…expressed in the replacement of livestock as a means of exchange with coins and notes, and with its replacement as a measure of wealth by calculation in money terms,” [p. 239]. Linking this transformation to changing land use, he adds that the shift was brought on by “the expansion of the cultivated area at the expense of grazing…motivated by the desire to obtain the new money form,” which was needed to pay taxes and buy increasingly available commercial goods [p. 240]. The Maasai were also affected by this transformation, as is reflected in their dealings with colonial authorities and other ethnic groups; however, their internal social relations remained predominantly focused on cattle as a means of exchange, with little value assigned to land itself, until much more recently (Kituyi, 1990).
35 The respondent, a Maasai who received a 42 ac plot when his group ranch divided, said in Swahili, “Sasa tumejua hapa ni chakula...tumekuwa tunakanyaga chakula” (from an interview conducted on August 9, 2004).
36 This probably represents a yield between seven and eight 90kg bags of maize, which is about half of the expected yields using the recommended combination of land husbandry techniques and agrochemical
108
residents in a less literal sense. Not only do the small plots of land where he and neighbors
have trod for generations, to which they now has exclusive rights, yield food when planted
with seeds. The land can also be leased to provide food or other household needs.37
The returns per unit area of land from leasing to outsiders are far greater than the returns that
are derived from livestock; however, leasing provides fewer returns than cultivating for
oneself. Nevertheless, self-cultivation requires the mobilization of significant amounts of
capital, which many of Narok’s new landowners can not afford.38 Thus, leasing to outside
cultivators is an easier way for new landowners to utilize areas of land that would otherwise
remain idle. However, before landowners can either lease land to outsiders or farm it for
themselves, they must clear it of the dense bush that covers much of the central part of the
district. This necessity creates the link between LUC in Narok and the charcoal trade,
because charcoal plays a critical role in land clearance for many new landowners.
The process of group ranch subdivision
By late 1970s, most group ranch members in both Kajiado and Narok favored subdivision
over retaining the group ranch structure . Pressure came particularly from the younger
applications, however, it is close to the average for commercial farms in the district (Government of Kenya, 1980-2002; Kenya Seed Company Limited, 2005).
37 Of course, land can also be sold for cash, but few landowners rely on this as a source of income for household subsistence needs. Land sales are discussed in more detail below.
38 Thompson and Homewood calculated returns from different land use options among group ranch residents in Narok’s wheat growing areas and found that leasing to large scale cultivators can yield nearly five times the returns that landowners can derive from livestock. However, leasing only yields about half of the returns that the landowner can get from commercial farming for himself (Thompson and Homewood, 2002). An analysis comparing Thompson and Homewood’s analysis with data collected from this study of the potential returns from different land management options in Narok is presented in Appendix 4.

109
generation, who were not registered as members when the group ranches were created 10-20
years earlier (Pasha, 1986; Campbell, 1993). This cohort of Maasai agitated for subdivision
in order to ensure that they had access to land as they were coming of age.39 In addition,
many group ranch members felt that they were not benefiting from the committees’
management. Moreover, because some better-off individuals had already been allocated large
portions of group ranches, other members saw these allocations as a threat to their own
livelihood and considered full subdivision an obvious solution in spite of the risks associated
with it (Pasha, 1986; Galaty, 1992; Kimani and Pickard, 1998).40
One informant from my field work, living in what is now a prime wheat growing area,
described how his family benefited from this kind of early land allocation. Years ago his
grandfather had become a police officer for the British colonial government and traveled
widely outside of his home area. The respondent’s father was also influenced by the
grandfather’s experiences. He described both his father and grandfather as “wise” and
“enlightened” relative to their neighbors.41 Soon after the group ranch was created around
1970, the father requested a private plot of land from the ranch in order to begin farming. The
39 For Pasha, this intergenerational tension was “the single most important factor that has triggered subdivision of group ranches…young men in the second generation believe that it is their birthright to have access to water and grazing resources in their respective areas of birth. On the other hand, elders believe that this birthright has been superseded by the incorporation of the group ranches,” ((Pasha, 1986, p. 306) also see (Kimani and Pickard, 1998). This intergenerational tension over land tenure is not unique to the Maasai; see, for example, (Gulbrandsen, 1984).
40 Galaty (Galaty, 1992) cites an interview that he conducted in which a respondent admits that subdivision is not an ideal solution, but the only option under the circumstances: “It’s no good but we still accept it…cattle numbers will decrease. There will be isolation…With demarcation, there will be limits [placed on movement]. Well, it’s been done and its not good.” [p. 191-2].
41 He said “Walikuwa warevu kidogo (Swahili: they were a bit wise)” and also used the English word “enlightened” while describing his elder relations.

110
respondent described his father as a “generous person”42 who was well-liked in the
community. He also noted how his father increased the likelihood that his request would be
granted by treating the transaction like a marriage arrangement.43 He gave the elders on the
committee blankets and beer44 as he would do if was negotiating to wed one of their
daughters. The father was successful and was allocated 172 ac (70 ha) of land from the group
ranch. Several other group ranch members followed suit and received early allocations as
well.
Years later, when the balance of the group ranch was subdivided, it became apparent that the
early allocations were made to a few progressive minded residents without consideration of
equitable partitioning among all group ranch members. The remaining land was divided
equally among the remaining members, who formed the majority of the ranch’s population.
At that time, each member received only 28 acres (11 ha), less than one sixth of the
respondent’s father’s original allocation. Upon the death of their father, the respondent and
his brother split the original allocation so that they both now own 86 acres (35 ha) of prime
agricultural land – over three times the area that other community members received.
The way that this respondent’s father secured such a large plot of land many years prior to
subdivision demonstrates how access to resources can be secured through social standing and
42 From the Swahili: mkarimu.
43 As the informant related it, “Ilikuwa kama mapenzi…kuoza msichana (Swahili: it was like love…arranging to marry a girl)”.
44 The respondent used the words shuka, the characteristic red plaid Maasai blanket, and pombe a generic Swahili word used for both commercial beer and several types of traditional fermented brews.

111
investment in customary institutions like the community gerontocracy to which the father
presented blankets and beer. However, this transaction was particularly significant because in
the past, negotiations for access to particular resources – land, labor, grazing rights, etc. –
were not typically negotiations in which the beneficiary desired exclusive control (Berry,
1989b; Okoth-Ogendo, 1989). In this case, the respondent’s father requested, and received,
the right to exclude other members of the community in perpetuity, which will benefit his
descendants for generations to come.
Although it was an unfair allocation in the sense that one group ranch member received more
land than other members, the respondent’s father’s negotiations were within the bounds of
socially acceptable behavior. There was no deception or corruption involved. Years later,
when group ranches across the district began to fully subdivide, this was not always the case
(Galaty, 1992; Homewood, Lambin et al., 2001).
Unlike the allocations that occurred earlier, subdivision was supposed to have been an
equitable process, with all group ranch members receiving equal land areas.45 Nevertheless,
some group ranch subdivisions were extremely controversial (Galaty, 1992; Thompson and
Homewood, 2002). The actual process of allocation varied from ranch to ranch. Some used a
45 It should be noted that equal land sizes do not necessarily make equal allocations. Some group ranches spread across several agro-ecological zones. 100 ac of semiarid pasture is not equivalent to 100 ac of land in a wheat growing area. One respondent, from Ewaso Ngiro (Olkiriane) GR found himself in this situation. Though his 28,000 ha group ranch hosted over 10,000 ha of wheat production in 1995 (Serneels, 2005), when it was subdivided in 1996, he received 40 ha of undeveloped arid shrubland on the southern fringe of the ranch. Despite the wheat cultivation occurring a day’s walk from his plot of land, this respondent’s land can not be farmed without irrigation, which is prohibitively expensive. With very few livestock of his own, he now earns his livelihood making charcoal and leasing pasture to wealthier neighbors while wheat production continues further north.

112
lottery system while others were simply decided by the group ranch committee. In any case,
the committee members and other elites to whom they were allied were in a position to
influence plot allocations in their favor and many did so.
Committees controlled group ranch registries, wherein all members had to be listed in order
to receive plots during allocations.46 There are instances of membership roles being inflated
prior to subdivision by including “newly initiated boys” (Galaty, 1994, p. 192) or even
younger uninitiated children (Thompson and Homewood, 2002) so that parents could claim
multiple allocations, as well as cases where legitimate group ranch members were excluded
from official lists of ranch membership in order to ensure larger allocations for other
members (Galaty, 1994). On ranches with wheat-growing potential, such as Lemek GR,
which falls in Ololunga Division, these and other manipulations helped elites to ensure that
their allocations fell on contiguous plots within prime wheat production zones (Thompson
and Homewood, 2002). In addition, plot sizes simply did not come out equally. As
Thompson and Homewood write concerning Lemek, “Plot sizes have varied from
approximately 60 acres up to 200 acres, invariably the plots of above average size have been
allocated to influential people and have been located on the wheat belt.” (Thompson and
Homewood, 2002, p. 118).
Incongruities in plot sizes were also observed in this field work. During interviews,
landowners described how sizes of plots that they and fellow group ranch members were
46 Galaty notes how the number of members in one group ranch in Kajiado nearly doubled between 1984 and 1989 (Galaty, 1994).

113
allocated varied by up to 10% from the agreed upon area. One respondent expressed how this
outcome baffled him and his fellow group ranch members,47 while another reflected a sense
of resignation that was characteristic of many people when asked about the machinations of
the elite, saying “that’s the committee’s business…it squeezes one person and saves
another”.48
The latter statement carries still more weight considering that on at least two of the group
ranches visited, committee members were allocated plots that were double the size that the
regular membership received.49 When asked if there were any challenges to the allocations,
respondents explained that there were typically no channels to air grievances.50 Some who
raised questions were threatened with removal from the roles. In other cases, unfair
allocations did not come to light until the recipient of a plot received his title deed, which
47 The respondent said, “Hiyo mambo ndiyo tumeshindwa,” (Swahili: That matter totally defeated us), meaning that they really didn’t know why it came out that way (from an interview conducted in Ngairamiran, Narok on August 9, 2004).
48 “Hiyo ni mambo ya committee…inafinya huyu, inaokoa huyo”, (from an interview conducted in Ngairamiran, Narok on August 11, 2004).
49 Confirmed through interviews with former residents of Ngairamiran and Olopito GRs including a member of the Olopito GR committee.
50 As one respondent noted when asked about recourse for grievances, “Hakuna sheria” (Swahili: there is no law). Ironically, this same respondent actually won a victory in the courts when an uncle challenged the respondent’s right to inherit his father’s subdivided plot upon his father’s death. However, using the courts to challenge the claims of a non-elite uncle is quite a different matter than taking on the group ranch committee and their powerful allies. Notably, this foray into the courts in which he successfully defended his rightful inheritance cost him a little over 20% of his father’s land, which he had to sell to pay for court fees and legal counsel (from an interview conducted in Ngairamiran, Narok on August 9, 2004).

114
often did not occur until several years after subdivision was complete. One respondent put it
bluntly, by that time, “mambo ilipita (matters were closed)”.51
In addition, group ranch members had to pay the committee considerable fees during the
subdivision process.52 This fee did not go to the land surveyors, but rather to the committee
members themselves. Group ranch members then had to pay a second fee to the district land
survey office in order to receive their title deed. This fee depends on the size of the plot, and
typically ranges from 4,000-10,000 KSH. Several landowners interviewed during this field
work have not yet obtained title deeds for their allocations, which leaves them in an less
secure position should someone challenge their claims to that land.53
Plot sizes and the persistence of pastoral production
Depending on the location within the district, subdivision of Narok’s group ranches among
the male household heads who constituted the corpus of group ranch members created plots
of land ranging from as little as 20 ac to as much as and 200 ac (between 8 and 80 ha).54 The
51 From an interview conducted in Ngairamiran, Narok on August 14, 2004.
52 Group ranch members typically paid 4-5000 KSH to the committee to cover the costs the committee incurred during subdivision – this was roughly equivalent to $US 70-90 in the mid-1990s.
53 There is no statute of limitations on obtaining a title deed for a plot that was allocated as a result of GR subdivision, thus there is no risk of these respondents’ ownership expiring. Nevertheless, without a title deed in their possession, the only record of a landowners’ right to a particular plot of land lie in the district land registrars’ office. Local officials are easily bribed and files often “go missing” from government offices, which leaves landowners without title deeds in a vulnerable position.
54 The original area of group ranches varied a great deal. The average area of the 139 group ranches created in Narok was 3,700 ac (1,500 ha); however, some ranches in the semi-arid rangelands exceeded 150,000 ac (60,000 ha). Areas that are more agriculturally productive are more densely populated. GRs established in those areas were typically smaller. Hence, when they were subdivided, the smaller group ranches were divided into smaller individual plots. Ranches in the semiarid plains had much lower population densities and at the time of subdivision were divided into larger individual plots. As a result, individual plots are typically 20-50 acres (13-20 ha) in high potential zones and 100-200 acres (40-80 ha) in low potential

115
productivity of subdivided plots depends primarily on the location in the district. In areas
where farming and or wildlife tourism are possible, the process of subdivision significantly
expanded the livelihood choices of many former group ranch residents. While living on
group ranches, people were largely dependent on pastoral production with limited
opportunities to cultivate. With the introduction of freehold title, “individual residents can
engage in any or all of herding, small-scale farming, mechanized commercial farming, and
wildlife tourism enterprises; only hunting is forbidden (Homewood, Lambin et al., 2001, p.
12544).55
This is not to imply that there was no farming prior to group ranch subdivision. Roughly 35%
of the landowners interviewed in this study admitted that they planted crops while living on
the group ranch.56 However, farming on the group ranch often required permission from the
zones. Nevertheless, as was discussed above, even the lower end of this range represents a much larger landholding than the average smallholder in neighboring districts. For example, estimates of “farm area per household reported in the 1997-2001 DDPs, the average size of smallholder plots in Nakuru, which borders Narok to the north is 5.4 ac. In Kisii, which borders Narok to the west, it is only 1.5 ac (Government of Kenya, 1980-2002; 1997b; a). The average holding among landowners interviewed in this study is 89 ac.
55 Access to benefits from wildlife tourism is possible through two pathways. The first pathway is by employment in tourist facilities owned by outside investors. This path is open to many residents of the district, although this type of employment may be more accessible to residents of former ranches directly adjacent to the MMNR than in outlying areas. Nevertheless, two landowners interviewed in this study, worked as drivers for safari companies despite living quite far from tourist areas. The second pathway is by hosting tourist facilities and wildlife viewing directly on group or individual land. This is limited to a few specific areas adjacent to the MMNR. See (Homewood, Lambin et al., 2001; Thompson and Homewood, 2002) for a full discussion of differential access to these livelihood options.
56 In these interviews, I did not specifically identify which household member planted crops. Prior to subdivision. As I primarily spoke with male heads of household and often it is women who do the planting, it is possible that a higher proportion of households cultivated than are reported here. In addition, as the sample of households interviewed in this study was focused on landowners currently engaged in supplying trees for charcoal, this is not representative of all former group ranch residents. In a study of group ranch areas in the buffer zone around the MMNR, Thompson and Homewood found a higher proportion, roughly 53%, of respondents had cultivated in the past ten years, with the proportion much higher among families that did not benefit from wildlife revenues (Thompson and Homewood, 2002).

116
ranch leadership. Moreover, enclosures were generally not permitted on group ranch land,
which left cultivated areas constantly under threat from wildlife and from neighbors’ cattle.
As a result of these constraints, farming by individual households on group ranches was very
limited in scale, rarely exceeding a single acre. Now, former group ranch residents can
enclose and cultivate as much of their land as they are able given the limits they face in
mobilizing capital and labor. Among the 22 Maasai landowners interviewed in this study, all
but four respondents have farmed since group ranch subdivision.57 Further analysis of
farming on respondents’ land is given below.
In contrast, residents of ranches in the rangelands, where farming is less viable, see little
change in livelihood options after group ranch subdivision. This is reflected in the
observation that residents of some group ranches in the rangelands have decided not to
subdivide their land.58
Regardless of the tenure situation, residents of these areas are largely restricted to pastoral
production. Nevertheless, even in purely pastoral areas, subdivision could have significant
social implications if boundaries of individual plots are recognized and enforced. In pastoral
57 Of the four landowners who are not currently farming, one is a minor who inherited land on the death of his father. His land, which is still covered in dense shrubby vegetation, is held in trust by an uncle. Clearing by charcoal producers had just begun at the time of this study. His uncle reported that the boy will start to cultivate on it when he is finished his schooling. The second non-farmer is currently clearing and intends to begin cultivation next year (2006). The third, recently finished secondary school and is in the process of clearing his own plot of land. Finally, the fourth owns a plot of land beyond the southern fringe of Narok’s arable zone and thus could not cultivate. Despite falling outside the arable zone, there are trees available for charcoal making because there is a seasonal riverbed that bisects the respondent’s land.
58 These group ranches have not subdivided because there are few obvious benefits from doing so. Several communities never registered as group ranches, preferring to maintain “trust” status. See the case of the Loita Maasai, for example (Karbolo, 1999; Karanja, Tessema et al., 2002).

117
areas, individual boundaries could have an effect on the distribution of wealth and control of
resources within the community because pasture would, in theory, be privatized and equally
distributed among household heads. Prior to group ranch subdivision, Maasai communities
had open access to grazing within the olosho. However, most communities are characterized
by unequal distribution of wealth in livestock, meaning that open access to pasture did not
benefit all community members equally – the wealthy benefited more from open access to
pasture simply because they owned more cattle.59
With the privatization of pastureland, wealthy residents with large herds may have to
negotiate access to grazing land from less well-off neighbors. Observations from the field
indicate that access to pasture is occurring through both market and non-market mechanisms.
A few landowners with more cattle than can be supported on their private plots buy grazing
rights in the rangelands from less well-off landowners who have pasture to spare. However,
the majority of landowners interviewed in this research still gain access to pasture by relying
on traditional non-market transactions. A few respondents take their cattle into the highlands,
where they graze in the NCC forest reserves, but many respondents graze their cattle on
pasture that is owned by, or accessible to, friends and relatives in other parts of the district,
including areas that have subdivided but not introduced cultivation as well as areas that have
59 Most Maasai communities show historical patterns of social differentiation at least back to the arrival of the British. Waller notes that, in perhaps the first livestock census conducted on a section of the Maasai during the forced move of the Purko olosho from the Laikipia Reserve to present day Narok district, the wealthiest 20% of households owned roughly 55% of the cattle, while the poorest 25% of households owned only 4% of the cattle (Waller, 1999). Similarly, several recent studies show that skewed distributions of wealth persist in Maasai communities (see, for example, (Zaal and Dietz, 1999) for a study of Olkarkar GR in Kajiado and (Lamprey and Reid, 2004) for aerial census data from Koyake GR in Narok). See Appendix 3 for a discussion of stocking densities and carrying capacities.

118
yet to fully subdivide. From this we can infer that the reciprocity that was characteristic of
Maasai social relations prior to group ranch subdivision persists for some residents. This
shows interesting congruity with Haugerud’s observations among the Embu in Central Kenya
over twenty years earlier, where, as in Narok, land reform “superimposed a new de jure
system of consolidated holdings and individually registered freehold titles,” nevertheless “de
facto fragmentation, borrowing, lending, and even some communal grazing on individually
owned land persist.” (Haugerud, 1983, p. 45; Berry, 1989b, citing).
Despite the persistence of opportunities for access to pasture through non-market channels,
subdivision and growth of cultivation complicate the process. One respondent, who lost 40
cattle in the drought of 1999-2000, mentioned that keeping cattle had become more risky
since moving to his private plot because the mobility of his stock had become restricted and
making it more difficult to ensure that he had access to adequate grazing during times of
drought.60
Outcomes of subdivision: cultivation, leasing, and land sales
Cultivation
As discussed above, farming has been common in parts of Narok since well before group
ranch subdivision. Outsiders have been farming in Narok under a range of usufructuary
arrangements for many years, including large-scale commercial farmers and small-scale
cultivators. The former typically leased very large areas of land, initially from group ranch
committees and later, after subdivision, from landowners on contiguous plots of private land.
60 Interview conducted on August 14, 2004 on former Ngairamiran GR, Narok.

119
Small-scale cultivators, on the other hand, have historically settled on the margins of
Maasailand, where they were generally tolerated, though they enjoyed no effective security
of tenure. Since independence, they have moved from the fringes of Maasai territory and
more recently, some have even purchased their own plots from the NCC. Others lease small
plots from recipients of subdivided GRs, and still others have squatted illegally within the
NCC’s trust lands.61
Another recent development of significance has resulted from GR subdivision: Maasai
smallholder farming. As GRs subdivided, nearly every Maasai household head in Narok’s
arable areas gained control of a plot of land. This process shifted control over land from the
group ranch committees, which generally represented the interests of the elite, to individual
household heads. This devolution of control, which is ongoing, leads to a different kind of
cultivation than the commercial grain cultivation discussed above. Commercial grain
cultivation was initiated by partnerships between elite members of group ranches and outside
capital. As Thompson and Homewood note, “group ranch committees negotiated concessions
with outside commercial farming entrepreneurs on behalf of the wider group ranch
membership. Local and District-level elites were well placed to facilitate the leasing of land
to outside entrepreneurs” (2002, p. 122). The benefits from these arrangements should have
61 These squatters have historically been tolerated. However, recently the state has acted to remove them, with the justification that they are settled in sensitive watershed areas and their presence leads to environmental degradation (Kemei, 2005; Kimutai, 2005; Mwangi, 2005a; b; Nation Team, 2005a). However, in addition to the explicit environmental justification given for expelling squatters from these sensitive areas, it is also likely that some of the more vociferous Maasai politicians are using their influence with Kenya’s shaky ruling coalition to target and expel squatters. Squatters are entirely non-Maasai and, by expelling them from the district, these politicians can strengthen their political position among their Maasai constituency. See the discussion of Narok’s history of ethnic clashes in Chapter 2.

120
flowed to all ranch members; however, in many cases, the ranch management used their
position to capture a disproportionate share of the benefits themselves. As is noted in Narok’s
1994-96 DDP, “it is arguable that earnings from both wheat and barley are concentrated in
very few hands,” (Government of Kenya, 1980-2002, p. 56).
Figure 12: Wheat production areas from 1975-2000 and major charcoal areas in Narok
#Y
#
Masai Mara National Reserve
#
Narok
20 0 20 40 Kilometers
#Y
Legend
Grain cultivation from 1975-1995
Grain cultivation from 1995-2000
Active charcoal production areas
Roads10 0 20 km
#Y
#
Masai Mara National Reserve
#
Narok
20 0 20 40 Kilometers
#Y
Legend
Grain cultivation from 1975-1995
Grain cultivation from 1995-2000
Active charcoal production areas
Roads10 0 20 km10 0 20 km
Source: field work and (Serneels, Said et al., 2001; Serneels, 2005)
Figure 12 shows areas of major wheat production and charcoal production in Narok.
Commercial wheat cultivation was, and remains, concentrated in a few specific areas in
central Narok District. Upon subdivision in those areas, many former group ranch members
simply leased their newly privatized land to the same outside entrepreneurs who cultivated

121
wheat there prior to subdivision.62 In areas where wheat has not been introduced, the
subdivision of group ranches created greater opportunities for non-elite residents.63 They
pursue cultivation for themselves and/or lease to small non-commercial cultivators from
neighboring districts without having to defer to ranch management.
The landowners interviewed in this research pursued exactly this mix of livelihood strategies.
As mentioned above, the vast majority were actively cultivating for themselves on a wide
range of cropped areas. In the 2004 cropping season, most respondents cultivated a mix of
maize and beans, which are the most common crops for smallholders throughout the Kenyan
highlands. A few also cultivated potatoes and one respondent, who lived near a permanent
river, cultivated irrigated vegetables.64 Wheat is a more capital intensive crop and requires
economies of scale to be cultivated profitably.65 Nevertheless, three out of 23 landowners
62 An emerging analysis shows that commercial wheat farming may be declining on certain group ranches. Though the analysis is not yet complete, one reason proposed to explain this decline is that individuation has raised transaction costs for lessees (Serneels, 2005).
63 Wheat is not suitable for all of Narok’s arable areas. Some of the upland areas are too wet for wheat, other areas have unsuitable topography, and still other areas lack the access roads that are needed for large combine harvesters to reach remote fields. Nevertheless, agro-ecologically, there is still room for significant expansion of wheat production. However, there are some indications that Narok’s wheat cultivation has reached a plateau. Figure 9 on page 43 shows that the area under wheat has not expanded significantly since the early 1990s. Similarly, wheat production (not shown) has also reached a plateau (Government of Kenya, 1980-2002; National Environment Management Authority, 2003). This evidence is supported by the opinion of one key informant, a European commercial farmer who has been cultivating wheat in Narok since the mid-1970s. This informant indicated that the ranks of new investors looking to plant wheat in Narok has thinned considerably and lamented the fact that many Maasai landowners are clearing their land with the hopes of leasing to investors who are no longer interested in investing.
64 Irrigated agriculture is in its infancy in Narok. There are few perennial rivers in the district and both boreholes and motorized pumps are prohibitively expensive. Roughly 3,100 ac (1250 ha) were under horticultural crops like tomatoes, cabbage, kale and onions in 2003, the latest year that data are available (National Environment Management Authority, 2003).
65 I review the costs of inputs and expected returns from wheat cultivation in Appendix 4

122
interviewed did grow their own wheat for commercial sale during the 2004 growing season
in addition to maize for home consumption. The total areas planted by respondents range
from 1 to 36 acres (0.4 – 15 ha). Eight respondents (~24%) also leased land to other
cultivators during the 2004 planting season. Leased areas range from 4 to 33 acres (1.6 – 13
ha). In total, cultivated areas constitute from as little as 1% to as much as 42% of subdivided
plots. The details of respondent’s cultivation, including areas of crops planted and areas
leased to outsiders, are given in Table 5. Leasing is discussed further below.
Table 5: Areas of cultivated crops and leased land among landowners interviewed in July-August, 2004
Self-planting (ac) b Leasing to outsiders (ac)
Total plot size (ac) a
wheat maize other c total wheat maize other d total
Total land cultivated
(ac)
% of plot cultivated
(n=19) (n=3) (n=18) (n=7) (n=18) (n=5) (n=4) (n=1) (n=9) (n=15) (n=13)%
Mean 89 16 5 2 8 12 14 4 13 16 20%
Min 32 10 1 0.3 1 4 5 - 4 1 1%
Max 200 28 11 8 36 22 33 - 33 36 42%
a Responses for specific crop areas refer to the 2004 planting season. Three informants professed to not know the size of their plots and one knew, but did not wish to reveal during the interview.
b 19 out of 23 respondents cultivated crops in 2004; however, only 18 are represented here. The missing respondent cultivated 2 ½ ac of maize on someone else’s land, but has yet to cultivate on his own land, thus he was not tabulated.
c The five respondents who planted crops other than maize and wheat all planted beans, however two also planted potatoes
d The lessee planting crops other than maize and wheat planted 4ac of beans.
Constraints to farming in recently subdivided plots
Not all of the plots that were created when a given group ranch was subdivided are equally
suitable for cultivation. Group ranches typically spread across several agro-ecological

123
zones.66 In addition to variable agricultural potential, soil fertility varies a great deal from site
to site (Jaetzold and Schmidt, 1983). This variability is compounded by the threat of wildlife
damage to crops, which has increased as additional land has come under cultivation.
Increasing cultivation reduces wildlife habitat and alters or constricts migration corridors.
Crop losses resulting from wildlife are increasingly common as plots on former group
ranches are opened for cultivation. As was mentioned in Chapter 2, the frequency of crop
raiding increased by nearly 400% between 1993 and 2002 (National Environment
Management Authority, 2003). 67
As a result of these factors, maize yields in Narok are generally low in comparison to yields
achieved elsewhere in Kenya. Wheat yields, on the other hand, are comparable to yields in
other wheat-growing areas of Kenya. Table 6 shows the range of yields reported by
66 Recall that group ranches were created with the intent of creating ecologically viable units for pastoral production containing both wet and dry season grazing. By definition, this should include areas of different agricultural potential. As an example, Ololunga GR actually overlaps with eight separate agro-ecological zones, as defined in (Jaetzold and Schmidt, 1983).
67 Reprisal killings of wildlife also increased five-fold in roughly the same time period (National Environment Management Authority, 2003). Local residents have become increasingly frustrated with the threats posed by wildlife. There are compensation schemes in place for crop damage as well as injury or death, but they are tremendously outdated. For example, the surviving family members of a Kenyan killed by wildlife receive 30,000 KSH in “compensation” (roughly $US 400). This amount was set in the early 1960s and has never been adjusted for inflation. Adjusted for inflation, it would be over 2 million KSH today (nearly 30,000 $US), which is much closer to the 20-30 years of lost income that a family would suffer from the death of a middle-aged adult. There is some talk of adjusting compensation so that it more closely approximates the economic losses suffered by victims of wildlife attack and some heavily affected communities are agitating for as much as 4 million KSH (nearly 60,000 $US) (Kwayera, 2003b).

124
respondents interviewed in this research compared to yields reported at the district and
national level and ideal yields reported by Kenya’s principle seed producer.68
From Table 6, it is apparent that there is close agreement between the district’s wheat yields
and the national average. Both fall below the ideal yields reported by Kenya’s primary seed
producer. Interestingly, the wheat yields from the small sample of landowners growing their
own wheat are higher than the both the district and national averages. This may be the result
of favorable patterns of rainfall in that year, which saw above-average precipitation in the
early months of the growing season and dryer-than-average conditions in the latter part of the
growing season, conditions which are favorable to wheat production.69
In contrast, the average maize yield reported by individual landowners interviewed in this
study is slightly lower than the district average and both are quite a bit lower than the 30-year
national average. There are two comments to make concerning these observations. First, the
landowner average in Table 6 includes two “outliers”, which brings down the overall
average. One outlier is a partial crop failure resulting from a wildlife incursion (yield=4.7
bags/ac) and one is a near total crop failure resulting from late planting (yield=0.8 bags/ac).
The late-planting farmer missed the heavy rains that occurred early in the growing season.
Removing the two outliers by looking at the interquartile range among landowners
68 Most farmers in Narok purchase hybrid seeds from local distributors of large commercial seed companies rather than reserving their own stock from the previous harvest.
69 Too much rain towards the end of the growing season hampers the ripening process and leads to losses (Narok District Crops Officer, 2005).

125
interviewed (6-15 bags/ac) shows that yields achieved by most landowners bracket the
district average for large farmers.
Table 6: Reported and ideal grain yields in Narok (measured in 90kg bags per acre) Wheat Maize Source a Average yield from landowner interviews b 13 9 [1] Long time commercial wheat farmer in Ololunga, Narok in 2004 b 16 NA [1] Official District Statistics (only includes commercial farms) c 9 12 [2]
Long-term national average yields (1961-1993) d 9 30 [3] Kenya Seed Company (fast maturing dryland varieties) 12-17 11-13 [4] Kenya Seed Company (high yield upland varieties) NA 38-52 [4] a Sources: [1] Interviews from this field work; [2] (National Environment Management Authority, 2003); [3]
(Government of Kenya, Various years); [4] (Kenya Seed Company Limited, 2005) b Landowner and commercial wheat farmer yields are based on the 2004 growing seasons. Maize yields are
based on a combination of 2003 and 2004 growing seasons. The entry in the table is in response to a direct question concerning yield in bags of grain per cultivated acre. Bags are standard 90kg (108 lb) sacks. Not all respondents reported yields. For maize, the average is based on eight responses, which is less than half of the respondents who reported growing their own maize. Most people grow maize for home consumption, so many households do not record their yields. For wheat, the average is based on only three responses, but this includes all of the landowners who reported growing wheat for themselves. In addition, cultivated areas are rarely measured with precision. Thus, yields should be treated as approximate, rather than exact values.
b District averages are limited to large-scale farms. As with much of the district-level data from Narok, several years of grain yield data were missing. Yields reported here for both maize and wheat at the district level are based on the District Agricultural Officer’s reports cited in (National Environment Management Authority, 2003) for 2002 and 2003 as well as seven years of available data cited in the Narok DDPs between 1993 and 1977 (Government of Kenya, 1980-2002).
c National averages are derived from the ratio of marketed grain to cultivated area of large-scale farms and hence may overestimate yields if a significant portion of maize sold to grain marketing boards is produced by small-scale farmers as reported in Kenya’s National Statistical abstracts dating back to 1961. However, this is not likely to be the case. See (Government of Kenya, Various years) for detailed notes on sources. Records of cultivated areas stopped appearing in the Abstracts after 1993, thus the calculation of grain yields only extends to that year.
Second, though the two landowners who suffered crop failures are “outliers” in the statistical
sense, their travails are illustrative of the problems facing many former pastoralists as they
struggle to incorporate cultivation into their livelihood strategy. Few members of the Maasai
community have experience cultivating on the scale that is now being attempted by many
former group ranch residents. This inexperience was evident in many interviews. One
respondent, who planted for the first time in the 2002 growing season, described the loss of

126
his first bean crop to insect attack. When asked if he used any insecticides or other means to
prevent the loss, he said that he wasn’t aware of such things at the time, but that now he
knows better.70
Lack of knowledge about land and crop husbandry increases the risk of farming in an area
where it is already inherently risky. Superficially, the state has put policies in place to
address this issue through agricultural extension services. For example, the 1997-2001 DDP
states that its agricultural policy objectives included the following goals:
[Provide] education to the farming community and extension messages that promote crop production, soil and water conservation and efficient land use (p. 80)
Encourage farmers to expand hectarage on the food crops (p. 81)
However, very little has been done to assist recent recipients of subdivided plots. Rather, far
more effort and funds are expended providing extension services to large-scale grain farmers
and market-oriented crop production than novice cultivators. During interviews of
landowners, only 2 out of 23 respondents said that they had ever been visited or advised by
agricultural extension officers in the decade or so since subdivision. Each of the respondents
visited by extension officers were allocated plots that border perennial rivers and practice
small-scale irrigated horticulture. They both confirmed that the officers’ visits were
concerning water withdrawals and proper land husbandry in riparian zones. Though the
sample is very small, their experience supports the contention that extension services focus
70 From an interview conducted with the same Maasai landowner referred to in note 35 above.

127
more on high value market-oriented crop production than on smallholder grain production
either for commercial sale or for domestic use.
This contention is also supported by data from the most recent DDP (2002-08), which
assigns ranked priorities to new projects that are proposed to be implemented during the six-
year planning period. The proposed projects in the agricultural sector are shown in ranked
order in Table 7.
Table 7: Priority rankings of agricultural projects proposed in 2002-2008 Narok DDP Priority Ranking
Project description
1 Establishment of district-wide sericulture (silk worm rearing) 2 Establishment of district-wide floriculture 3 Promotion of oil crops (primarily sunflowers) for home use and commercial sale 4 Promotion of high-value fruits to improve household nutritional status and farm income 5 Water harvesting for crop production 6 Crop protection against migratory birds a
- Development of animal traction district-wide as an alternative to mechanized crop husbandry b
a This is specifically meant to address large losses suffered by commercial wheat farmers as a result of invasions by the quelea bird, which is notorious for damaging wheat while it is ripening in the field (Quelea quelea) (National Environment Management Authority, 2003).
b The last entry was unranked in the original source.
According to district planners, sericulture, “the production of raw silk and the rearing of
silkworms” is the top priority for the six-year planning period that began in 2002. Only the
last proposed project, development of animal traction, targets smallholder food crop
production. However, past experiences indicate that low ranked projects are rarely

128
implemented.71 Moreover, this last proposal only calls for the introduction of 20 pair of oxen
over a six year period, which will have a negligible impact on the thousands of new
smallholders created by GR subdivision.
In addition, extension offices are poorly equipped and understaffed. Ololunga division is
exemplary of this. In Kenya, agricultural extension services are offered at the Divisional
level.72 At the time of the last census, Ololunga had nearly 11,300 households (Government
of Kenya, 2001), most of whom are Maasai.73 The division hosts roughly half of Narok’s
wheat production, making wheat one of the largest generators of income in the division.74
Despite hosting this large source of revenue, 51% of the population in Ololunga lives below
the poverty line.75
Group ranches within this division have all subdivided, so that, in addition to large areas of
wheat, there are a growing number of households starting to cultivate at a small-scale. The
division extends across eight different agro-ecological zones and has area of 1,511 km2.
71 Only 20% of the projects proposed in the 1997-2001 DDP were implemented by the time the 2002-2008 DDP was drafted (Government of Kenya, 1980-2002).
72 The ‘Division’ is the administrative unit immediately below the district. Narok consists of eight divisions.
73 Most migrants who have settled in Narok reside around Narok town and in the upland areas, thus, even without ethnic data from the recent census, it is safe to assume that the majority of the population in Ololunga are Maasai (Government of Kenya, 1980-2002).
74 Based on wholesale wheat prices reported in interviews and recent annual wheat production reported in (National Environment Management Authority, 2003), wheat is the second largest revenue generator in Narok after the MMNR (Ojanji, 2001).
75 This poverty count is based on data from (Central Bureau of Statistics, 2003), originally derived from (Ministry of Planning and National Development, 1998). The most recent DDP cites a higher figure of 66%, but it is not clear how poverty was defined to arrive at that number (Government of Kenya, 1980-2002).
129
Roughly 15% of this land area was under cultivation in 2000.76 The entire division is served
by only three agricultural extension officers, only one of whom specializes in crop cultivation
(the others specialize in livestock and soil conservation respectively). The three officers share
a single motorbike to cover the entire division, which, according to monthly reports that the
officers make to the District Agriculture Office, is in constant need of repair (Divisional
Agricultural Officers, 2002-2004). Under these conditions, it is extremely difficult to
disseminate good crop husbandry techniques regardless of whether there is an active policy
to reach small farmers or not.
Technical knowledge and access to extension services are critically important in determining
the degree to which a newly acquired plot of land from a subdivided group ranch will
contribute to household production. Agricultural potential, market access, and threats from
wildlife also contribute to the potential revenue that can be generated from a given plot of
land. In addition, the majority of landowners who have the knowledge to cultivate
successfully can neither afford the inputs nor mobilize the labor required to exploit more than
a few acres of land.
These limitations have led many to turn to leasing in order to earn rents on a portion of their
land that would otherwise lie idle. Though leasing offers fewer returns per unit land area, it
requires less capital to exploit large land areas. In addition, leasing shifts the risk of farming
from the landowner to the lessor. Another means for a landowner to generate revenue from
76 Based on unpublished data provided by Serneels (Serneels, 2005).

130
land is to sell a portions of it. However, sales are typically made for different reasons than
leasing. Both are discussed in the following sections.
Leasing
As was mentioned above, over one-third of respondents lease land to outside cultivators.
Among these lessors, four lease to commercial wheat growers, three lease to small-scale
maize cultivators, one leases to both wheat and maize growers, and one, whose plot borders a
perennial river, leases to a small-scale farmer from a neighboring district who uses a
mechanized pump to irrigate 4 ac of assorted vegetable crops. In addition, four respondents
who are not currently leasing have either leased in the past and/or hope to lease in the future
after their land is sufficiently cleared to permit farming. Thus, over half of the respondents
have leased land or plan to do so in the future. In addition, a further three respondents do not
lease because they have the ability to farm for themselves on a large scale and can therefore
capture higher returns possible by practicing self-cultivation.77 Table 8 shows the number of
respondents leasing to different cultivators during the 2004 growing season as well as
reasons by landowners who did not lease during the 2004 growing season.
Terms of leasing vary depending on individual landowners, the lessee, and the intended crop.
Smallholder lessees arrive at a leasing agreement every growing season and pay from 1,000-
1,500 KSH per ac. When leasing to commercial wheat farmers, landowners offer 1-3 year
leases and receive higher rents (1,500-2,000 KSH/ac). In addition, although there was only a
single case of leasing irrigable land and the findings can not be generalized, it appears as if
77 See Appendix 4 for an analysis of the returns from different land-use options.

131
that land commands significantly higher rents, which is not surprising in light of its scarcity
and the high value of vegetables relative to grain crops.
Table 8: Respondents leasing and reasons given for not leasing during the 2004 growing season Leasing status for 2004 growing season No.
responding Average rent
(KSH/ac) Currently leasing a 9 1,670
Leasing wheat 5 1,700 Leasing maize 4 1,375 Leasing other crops (irrigated vegetables) 1 2,700
Not currently leasing 14 Has leased in the past b 1 Plans to lease in future (land not fully prepped or lessee not found) 3 Don't lease because they have the ability to farm on a large scale 3 Rain-fed agriculture not possible 1 Threat of wildlife is too great 2 Considers leasing “too risky” c 1 Did not say 3
a Numbers do not sum because they include one landowner who leases land to both wheat and maize farmers.
b This respondent used to lease a 50 ac plot in its entirety to a partnership of two commercial wheat growers from Nairobi. The partnership recently dissolved, leaving this respondent with a large plot of idle land. He informed us that several landowners were affected by this break-up (from an interview conducted in Ngareta, Narok on July 26, 2004).
c This respondent was extremely risk averse. Most analysts would conclude that the risk from leasing land would be far lower than farming for oneself, which this respondent does on a small scale (2 ac). Nevertheless, he stressed that he has no plans to lease and specifically mentioned that he feared being held liable if his livestock entered the lessee’s fields and caused damage. This fear, though largely unfounded, represents an extreme shift from traditional Maasai ideology mentioned in the introduction to this chapter.
In addition to straightforward leasing agreements described in Table 8, several other leasing
arrangements were observed both in the cohort of landowners interviewed as well as among
the charcoal producers surveyed in a prior phase of fieldwork. Enclosure is an important
symbolic step in the transformation of communal to private land. Of course, it also provides
important services, particularly in areas that are affected by wildlife. One landowner used

132
fencing to create leasing terms, offering a lessee the right to cultivate 8 ac of maize on his
land for one year if the lessee provided fencing for the 8 ac plot.78
In addition, 33% of the charcoal makers surveyed in February and March 2004 who were
working on other people’s land79 reported receiving favorable leasing terms from the
landowners. These landowners offered one or two years of free cultivation on areas of their
land that the charcoal producers have cleared.80 In a tight labor market, this kind of patron-
client relationship is one way that cash-poor landowners attract charcoal producers to work
on their land and motivate them to clear the land completely (beyond what is necessary for
charcoal production) without offering them a cash wage. It also shifts the cost of initial
plowing to the charcoal producer. Initial plowing of “virgin land” typically costs 50% more
than plowing land that was cultivated in previous years.81
Sales of subdivided land
As was mentioned earlier, one of the stated aims of early land reform in Kenya initiated by
the Swynnerton Plan (Swynnerton, 1955) was to create a market for land in Kenya’s prime
78 According to local prices of barbed wire and posts, the cost of fencing an 8ac plot is roughly 12,000 KSH or 1,500 KSH/ac, which is the market rate for leasing land in this area, as Table 8 indicates. However, the deal worked to the advantage of the landowner in this case because the lessee also provided the labor for building the fence (from an interview conducted in Ngairamiran, Narok, on August 11, 2004).
79 This excludes the eight charcoal producers surveyed who were ethnic Maasai from Narok and making charcoal on their own land.
80 Others are are offered access to small plots from the owners of the land on which they make charcoal for regular market rates (1200-2000 KSH/ac depending on the area). Interestingly, not all of the charcoal makers who receive offers of one or two years of free cultivation accept them. This and other relationships between the landowners and charcoal makers are discussed in more detail in Chapter 5.
81 This was reported by two respondents during interviews of landowners. The costs cited were 1,200 KSH/ac for virgin land and 7-800 KSH/ac for subsequent plowing during the 2004 growing season (from interviews conducted on August 6 and 9, 2004).

133
agricultural areas (primarily Central Kenya and the highlands around the Rift Valley).
Although it is “seldom stated and then only in low tones,” (Galaty, 1992, p. 27) in the official
discourse, this was also one of the state’s aims in promoting first the creation and then the
subdivision of group ranches in Narok and Kajiado, particularly considering the proximity of
both districts to Nairobi and to the densely occupied agricultural communities immediately
north and west of the capital.82
The extent to which a market for land developed as a result of first corporate and then
individual privatization varied across the two districts. Kajiado, which experienced both
group ranch incorporation and dissolution earlier than Narok, has been studied in more detail.
A study of land sales and plot fragmentation on 10 Kajiado group ranches following
subdivision shows that many plots of land have been undergone fragmentation, leading to a
decrease in median plot size. The observed number of plots actually increased exponentially
with the number of years since subdivision (r2 = 0.88). Similarly, the median plot size
decreased linearly with time (r2 = 0.79). Both relationships are shown in Figure 13.83
82 A quick glance through the real estate classifieds in any recent Nairobi newspaper will show that the city’s fastest growing “exurbs” are in the northwest fringe of Kajiado: Ngong; Ongata Rongai; Athi River; Kitengela; etc. All are parts of former Maasai territory that were lost to Maasai control soon after land reforms were implemented.
83 The figure on the left plots the log10 of the percentage increase in the number of plots as a function of the number of years since subdivision. A logarithmic transformation was used to depict the exponential growth in plots over time. For example, the two entries at 9 years since subdivision both show that the log (% increase in the number of plots) ≈ 2, which corresponds to a 100% increase or doubling of the number of plots in nine years. The logarithmic curve fit omits one group ranch from Kimani and Pickard’s analysis because it had recently subdivided and the number of plots had not yet changed so that it could not be included in a logarithmic curve fit. A linear curve was used for the plot on the right because the percent decrease in plot size is bounded between 0 and 100%. The percent increase in the number of plots is not bounded and ranged from 5 – 1,000%.

134
Figure 13: Fragmentation (left) and change in median plot size (right) in Kajiado GRs (1980-1996)
y = 0.14 x + 0.71r2 = 0.89
0
1
2
3
4
0 4 8 12 16years since subdivision
log
% in
crea
se in
no.
of p
lots
y = -6.9x + 2.8r2 = 0.79
-100
-75
-50
-25
0
0 4 8 12 16years since subdivision
% c
hang
e in
med
ian
plot
siz
e
Source: Adapted from (Kimani and Pickard, 1998)
Although the data from Kajiado are suggestive of a temporal relationship, they can not
simply be generalized to Narok. Unfortunately, data concerning land sales and fragmentation
was not available from Narok so that a similar analysis is not possible at this time.84
Nevertheless, the interviews that were conducted with landowners in Narok suggest that land
sales are occurring. Respondents from 13 different group ranches were interviewed. Of these,
only two reported selling land themselves; however, respondents on 10 of the 13 group
84 Land is always a contentious issue in Kenya; however, in Narok it seems more contentious than elsewhere (Human Rights Watch, 1997; Tanui, 2000; Muriuki, 2005; Mwangi, 2005a; Nation Reporter, 2005c). Despite my having official permission to do research from the Ministry of Education and the official sanction of the District Commissioner (the highest authority at the district level), multiple requests for data concerning land registration, sales, and fragmentation of plots from group ranches at either the district or the national office of the Ministry of Lands and Housing were repeatedly denied. The land register’s office was the only government office that refused to share data during the course of this field work. Other offices, including the district offices of forestry, agriculture, statistics, and environment, as well as the district office of surveys and mapping, which is also part of Ministry of Lands and Housing, were helpful and readily accessible.

135
ranches reported that land sales had occurred among other former group ranch members in
the years since subdivision had occurred to a mix of outsiders and local buyers.
Ironically, among the interviewees, one of the two instances of land-sales was precipitated by
the need to pay for court costs incurred as a result of a dispute over land (as described above
in footnote 50). This respondent related how he sold land for only 35,000 KSH/ac, but at the
time he and his neighbors didn’t know the value of land. He bitterly regrets that decision,
because now land sells for 150-180,000 KSH/ac.85
The question of who sells land and who doesn’t is an interesting one, which can give an
indication of the extent of differentiation that may occur as a result of land individuation.
Working on two different group ranches in Kajiado, Galaty found that land sales were
frequently observed in cases of indebtedness, which he notes is common “in an unstable
animal-based economy in a highly unpredictable semiarid environment.” (Galaty, 1994, p.
196). Similarly, debt was the reason for the case of land sales described above. Galaty also
found alcoholism associated with sales of land. In addition, he found that education and
employment were negatively correlated with land sales on one of the ranches, while there
was no such relation on the other. He explains this difference by noting that on the ranch
characterized by land sales that varied with education and employment, “the process of rural
differentiation and class formation is advanced,” in comparison to the other ranch (Galaty,
1992, p. 32). In noting this, he implies that advances in education and employment are only
85 35,000 KSH is US$ 450-580 depending on the year that the sale occurred. 150-180,000 is currently US$ 2-3,000.
136
effective predictors of land sales if other processes of social differentiation: inter alia,
commercial ranching, non-pastoral entrepreneurship, and political engagement, are also
present. Also see (Galaty, 1994).
In this research, an additional factor contributed to land sales on one group ranch.
Ololoipangi GR is located in an inaccessible high potential area towards the northern fringe
of Ololunga Division in the forested uplands at the edge of the Mau Complex. There, no
respondents reported that they sold land themselves, however, several interviewees discussed
how tendencies to sell land fell cleanly along ethnic lines. This group ranch, unlike others
further south on Narok’s plateau and semiarid plains, included non-Maasai among its
members. Roughly half of the membership were from the Ogiek ethnic group.86 The ranch
had 140 members in total and when it was subdivided in 1997, all members, including the
Ogiek, received 50-60 acre plots.
Very few Maasai have sold any land since subdivision. In contrast, nearly all of the Ogiek
decided to sell their plots in small parcels of just a few acres each. Buyers were almost
entirely Kipsigis, an agro-pastoral ethnic group that has historically occupied territory to the
northwest of Narok. Along the one passable dirt road that runs through the former group
ranch, the effect of land sales is dramatic. As I drove with several informants from the areas
that were allocated to the Maasai into areas that were allocated to the Ogiek, the landscape
86 The Ogiek, who are traditionally forest-dwelling hunter-gatherers, are also known as Iltorobo (or, more commonly, Ndorobo), which is derived from a Maa term used interchangeably for ‘poor people’ and ‘people who hunt’. The Maa usage arises because the Maasai consider people lacking cattle to be poor. They also considered hunting to be an undignified pursuit (Galaty, 1982). Not surprisingly, among the Ogiek, the terms Iltorobo/Ndorobo are considered pejorative.

137
abruptly shifted from a hilly mosaic of open pasture, fragments of indigenous forest and
unfenced fields of maize to a series of tightly packed and fenced smallholdings each of which
is planted with maize, edged with fodder grass, and bordered with lines of exotic trees such
as cypress and pine.87
Among the landowners interviewed, sales of land were generally perceived as negative.
Despite the negative connotations associated with land sales and the small number of sellers
encountered in this study, land sales are occurring in Narok. The individuation of Narok’s
group ranches put vast amounts of rangeland – marginal agricultural land – on the market.
Neighboring agricultural areas to the north and west are extremely crowded and many people
are priced out of land markets in their home areas, thus migrants come to Narok looking for
an opportunity to buy land, although ethnic clashes and tenurial uncertainty, even, in some
circumstances, when title deeds have been issued, may suppress demand for land among
outsiders.88 However, the wealthier among the ranks of former group ranch members create
another source of demand for newly subdivided land. One respondent among the landowners
interviewed augmented his allocation by 30% through the purchase of neighboring land.
Interestingly, this respondent was from the ranks of the elite on Olopito GR, just north of
Narok town. He was a member of the group ranch committee. At subdivision, the committee
members were allocated double the area of the remaining group ranch members. He was able
87 From direct observations and an interview with one landowner, in which four others joined, including a member of the former group ranch committee (interview conducted in Olishapani, Narok on August 15, 2004).
88 See the discussion in Chapter 2 about ethnic clashes and tensions over migrants living in environmentally sensitive upland areas (specifically the citations listed in footnotes 27 and 28).

138
to use this land to accumulate sufficient capital to buy an additional 24 acres from a
contiguous plot.89 The consequences of competing demands for land by local elites and
outside migrants within Narok’s divisive political environment remains poorly characterized.
Experiences from Kajiado suggest that land is often sold for less than market value and that
the revenue from sales are not often invested for the welfare of the household (Galaty, 1992).
Women and children, who have no input in decisions concerning land disposal may be
especially vulnerable to land sales and fragmentation. However, restricted access to
information by local authorities render analysis difficult. Nevertheless, the topic deserves
future attention from researchers.
Charcoal and land-use change in Narok
As was mentioned above, charcoal currently plays a specific role in land management for
recipients of recently subdivided land on Narok’s central plateau. For wealthy and poor alike,
charcoal production represents the least-cost means to clear newly acquired land. The
question of why landowners are motivated to clear is an important one. Landowners face
several motivations to clear their newly acquired land, each of which will be explored in this
section. In addition, not only do landowners have multiple reasons to clear land, subdivision
made it far more easy to do so. Upon subdivision, former group ranch members became titled
landowners. Each household head is now the sole decision-maker in charge of land
management. All landowners, even ones who felt cheated by the subdivision process, are
now managing a plot of land that is quite large in comparison to smallholder agricultural
89 From an interview conducted in Olopito, Narok, on August 6, 2004.

139
households elsewhere in Kenya,90 but quite small in comparison to the rangelands on which
they used to depend for grazing. The range of potential land uses, once limited by social
norms designed for the benefit of the communally-based pastoral economy, no longer face
such limits.91
The need to clear land for farming activities or leasing to outside cultivators is obvious;
cultivation can not proceed until woody vegetation is removed. However, even if the
landowner only plans to cultivate or lease a small plot, or perhaps plant nothing at all, there
are two additional reasons that land managers may wish to clear large area of dense
shrubland. The first reason to clear concerned livestock and their grazing. Although many
landowners aspire to retain their livestock, the individuation of land is forcing them to
rethink their grazing strategies, including reducing both herd size and mobility. A divisional
monthly agriculture report noted that Ololunga division was experiencing:
…diminishing pasture lands due to subdivision of group ranches and changing mode of living of the [sic] natives from pastoralism to [a] sedentary form of living. (Divisional Agricultural Officers, 2002-2004, p. 7 July, 2003 report).
As increasing areas are occupied and/or go under cultivation, each landowners’ mobility is
reduced, which forces them to rely on uncultivated areas on their own land for grazing during
90 Farm sizes in Narok and neighboring districts were discussed in footnote 54.
91 This is not to imply that the pastoral economy has dissolved completely or social pressures no longer exist regarding the disposition of one’s land. Both wealthy and poor landowners interviewed in this study still rely on cattle for some portion of their livelihood. In more remote areas such as Loita, where even the group ranch “idea” was resisted, pastoralism is still the primary economic activity and social pressures to maintain the pastoral lifestyle are quite strong (Karbolo, 1999; Karanja, Tessema et al., 2002). However, in areas where cultivation has caught on and large scale land clearance is occurring, such as Ngareta and Ngoben Group Ranches, landowners with sizable herds graze their stock elsewhere, choosing or intending to turn their own land over to cultivation.

140
certain times of the year.92 As was explained in Chapter 2, there is a competitive asymmetry
between herbaceous and woody biomass. In dense shrubland, which is unsuitable for heavy
grazing, woody biomass has a competitive edge. The balance can be tipped toward grasses if
trees and shrubs are removed, thereby improving grazing, at least in the short term.
The second reason that landowners clear land concerns wildlife. Dense vegetation is removed
because it reduces wildlife habitat. Changes in land tenure have contributed to much more
dispersed patterns of human settlement in Narok. Prior to the creation of group ranches,
Maasai lived in extended households typically consisting of several families “bound together
by age-set or clan relationships,” (Lamprey and Reid, 2004, p. 1002).93 These settlements
were occupied for 4-5 years, at which time new settlement was built nearby and the old one
was abandoned due to prevent too great a buildup of dung and parasites.
Since group ranch subdivision, many individual family units have split from the boma to
occupy their private plots. In parts of Koyaki, Aitong, and Lemek GRs, which are south of
this study area, Lamprey and Waller note that between 1950 and 1999 the mean number of
households per boma decreased by 30%, from 11 to 7.8, while the overall number of
92 It is possible to graze livestock on crop residues, and this was observed in a number of occasions during field work. However, the availability of crop residues is entirely dependent on crop cycles and do not necessarily coincide with the time of year that livestock are in need of alternative grazing resources. In addition, few landowners plant sufficient acreage to provide sufficient residues to feed their entire herds for any appreciable length of time. Moreover, no instances of silage were observed.
93 This settlement is referred to as a boma. Individual households within the boma are enkang. The boma is often erroneously referred to as a manyatta, which has become so common that it is used by Maasai themselves referring to these type of settlements. However, traditionally, manyatta refers to an unfenced settlement of young warriors (moran) (Lamprey and Reid, 2004). Those settlements have always been widely dispersed through Maasai territory, but they were, by definition, temporary. It is only recently that permanent residences have dispersed in these patterns.

141
settlements increased by a factor of 40 (Lamprey and Reid, 2004). Among the 22 Maasai
landowners interviewed in this study, all are currently living with individual or extended
families on their own plot or a plot owned by a member of the extended family. Half of these
respondents reported living in a boma with multiple family units prior to occupying their
individual plots.
This dispersal of settlement, combined with increasing population, have led to the permanent
occupation of much more wildlife habitat than occurred during and prior to the group ranch
era. As a result, people are exposed to greater risk of encountering wildlife than in the past.
This affects not only their ability to farm (discussed above) but also puts them and their
livestock at risk of attack. One strategy that people have adopted to reduce that risk is to clear
the dense vegetation around their settlements. As one respondent related:
Before group ranch subdivision this land was useless bush – parents had to escort kids to school. Now we are very secure.94
Another landowner related a popular sentiment of many former group ranch residents,
reflecting the tension between the government and proponents of conservation on the one
hand, and local residents on the other. The latter bear the risks of living in close proximity to
wildlife, but receive no benefits:
Our country is full of wildlife. They aren’t our wildlife. We don’t raise wildlife [like we raise cattle]. The wildlife are the government’s and the government has a place for them. Let [the charcoal makers] clear the land so that the animals leave here…95
94 In Swahili, “Kabla ya kugawanya ‘group ranch’ ilikuwa msitu tupu – wazazi walipeleka watoto shuleni. Sasa tumepata usalama mno.” From an interview conducted in Ngoben, Narok on September 7, 2004.

142
Thus, in addition to cultivation and leasing, other pressures including the need for pasture
and a desire to reduce the likelihood of encountering wildlife, influence landowners to clear
part or all of their newly acquired plots.
Land clearing and labor requirements
Clearing dense bush land requires that landowners mobilize significant amounts of labor.
Prior to clearance, shrubland or woodland may support between 20 and 100 tons of dry
woody biomass per ha (IPCC, 1997b).96 Clearance is nearly always done manually and can
be quite an arduous task, requiring roughly 40 person-days of labor to clear each acre.97 In
the absence of charcoal makers, landowners must either rely on household labor, hire casual
laborers to do this work, leave their land idle. Hiring labor to clear land in this way is
prohibitively expensive for most residents. The current rate to hire casual laborers to clear
land is 6,000 KSH/ac (about US$ 80). Depending on the type of vegetative cover, laborers
may also charge landowners per tree: 30 KSH for small stems of T. camphoratus and up to
150 KSH to remove bigger trees like O. Africana (up to 6-8m in height in this area).
95 In Swahili, “Nchi yetu ni nchi iko wanyama. Wanyama sio yetu, hapana fuga wanyama sisi, wanyama ni ya serikali na serikali iko mahali yao…[Wachomaji] wasafishe ili wanyama wakatoka.” From an interview conducted in Ngoben, Narok on July 31, 2004.
96 In 10 charcoal production runs analyzed in more detail in Appendix 5, I estimate the woody biomass removed from the 10 plots to be 62 ± 29 dry-ton/ha (mean ± 95% confidence interval) including a fraction of below ground biomass roughly 50cm in depth. In all of these cases, the biomass was distributed over a large number of thin stemmed trees and shrubs. The stems removed from these 10 plots had a mean diameter at breast height (DBH) of 10.6 ± 0.5 cm (mean ± 95% CI) and a stem count of 828 ± 326 stems/ha (mean ± 95% CI) – the stems include individual trees as well as clumps of multi-stemmed T. camphoratus, which occurred in clumps of up to 6 stems from a single mass of roots. The methods used to derive these estimations and additional details are described in Appendix 5.
97 Of course the actual time required depends strongly on the density and structure of woody biomass. Based on observations in the field, clearing and uprooting trees took 42 ± 22 person-days per ac (mean ± 95% CI). Details for this derivation are provided in Appendix 5. Clearing involves manually cutting trees and uprooting stumps so that the rootmass is removed to roughly 0.5m depth.

143
In the absence of other options, landowners must sell stock to cover these costs. 6,000 KSH
represents 3-4 goats or sheep for every acre or one bull for every 2-3 acres depending on the
market price of stock at the time.98 Median livestock ownership among landowners
interviewed in this study was only 32 livestock units (LU), which is below the level most
pastoral experts consider sufficient for subsistence in pure pastoral production systems.99
Thus, although few families rely purely on livestock for subsistence, many are unwilling to
destock to a level that would threaten their subsistence. Thus clearing a few acres represents
a substantial investment that many are unwilling or unable to make, despite their apparent
“wealth” in cattle.
An additional option to raise cash is to take a loan using the titled land as credit. As was
discussed above, this was one of the stated intentions of land reform in Narok. None of the
landowners interviewed has ever taken a loan. Several do not yet have their title deeds. The
remainder know little about credit markets, but are well aware of the risks of cultivation. In
addition, agricultural credit facilities are not designed to finance the clearance of a few acres,
which only requires the equivalent of a few hundred dollars in loans.100
98 Markets for livestock in Narok fluctuate seasonally. In a normal year, prices vary by as much as 50% typically peaking around holidays (from an interview with a landowner conducted in Ngoben, Narok on July 31, 2004).
99 See the discussion in Appendix 3.
100 This is more the domain of micro-finance institutions (MFIs), which are active in the study area. However, none of the landowners interviewed reported utilizing MFIs to finance clearance or any other aspect of cultivation.

144
It is possible to clear these areas using bulldozers and tractors, but this was not observed
among any of the plots visited during this research. One landowner related a story of a
neighbor who took a loan to hire this type of heavy machinery because he wished to clear a
large area of his land for wheat farming. The interviewee considered his neighbor’s choice
greedy (Sawhili: tamaa) because he considers heavy machinery inappropriate for clearing
land. In the interviewee’s opinion, the neighbor suffered for his greed. The bulldozer stripped
all of the vegetation off the land, which sits at a slight gradient. The plot, which he showed us
during a walking tour of his shamba, was left completely exposed and is now heavily eroded
with nearly no vegetative cover.101
It is possible to rely on family labor to do clearing a plot for farming; however, this was only
observed in a few cases. Admittedly, the population of landowners I interviewed were
selected because there was charcoal being produced on their land. My selection would have
omitted any Maasai landowners who were clearing their land using only household labor and
not making charcoal. However, during the interviews, respondents were asked about their
land clearance practices prior to the arrival of large numbers of charcoal makers. 74%
admitted that they cleared no land immediately on settlement although they hoped to begin
clearing upon settling in their new plots. Among the six respondents who did clear a sizable
portion of their land prior to the arrival of charcoal makers, only two relied solely household
101 From an interview conducted on August 8, 2004.

145
labor – others hired laborers to clear.102 For the majority of landowners interviewed, the
inability to mobilize labor represents a significant barrier to clearing land.
Charcoal as a means to mobilize labor
The presence of charcoal makers in Narok substantially lowers the cost to landowners of
clearing land. Based on multiple sources of information, charcoal producers began to arrive
in Narok in large numbers in the late 1990s. 18 of the 23 landowners recounted that they had
only seen charcoal making in Narok since group ranch subdivision began in the mid 1990s.
The remaining five recall seeing charcoal in the district prior to group ranch subdivision,
several as long ago as the 1970s. However, they admit that in earlier decades it was largely
confined to areas East of Narok town or in upland forest zones rather than on the west side of
town in Narok’s wheat belt, where it is currently concentrated. Moreover, earlier charcoal
making was not at the scale that it is now occurring, which all agree is a recent phenomenon.
One landowner interviewed cleared 1 ½ ac of dense shrubland on his own in 1996, but did
not burn the wood. He recounted how the trees that he cut sat for six years until charcoal
makers arrived in 2002 and made charcoal from the wood, which had decomposed very little
102 In a study of group ranches in the buffer zone to the south of the study area, Thompson and Homewood note that “Maasai households can organize the labor necessary for small-scale cultivation,” and “In-migrant workers’ involvement in small-scale cultivation, leasing, and purchasing is limited by antagonism from Maasai residents,” (Thompson and Homewood, 2002, p. 121). However, there may not be a direct contradiction between their observations and mine for several reasons. First, they do not refer to land clearance, only to cultivation; it is not clear who performed the initial land clearance in their study area. In addition, the buffer areas around MMNR generally have less dense woody biomass cover than the areas further north for reasons discussed in Chapter 2. Therefore less labor was required to prepare land for cultivation in those areas and it is quite possible that family labor is sufficient to complete the task.

146
in Narok’s relatively dry climate. Since charcoal makers have arrived, he has utilized their
labor to clear an additional 18 ac.103
Similarly, administrative reports also support the view that large scale charcoal production is
coincident with group ranch subdivision and settlement on individual plots. One report
drafted in the late 1970s reports charcoal activity in the district, but it only receives passing
mention in the context of revenue generation for rural households:
…a family might receive revenue from burning charcoal, lease land for wheat cultivation, milk of cattle or goats and finally sale of one or two head of cattle, goats, or sheep every now and then (Government of Kenya, 1980-2002, cited in the 1980 edition).
Charcoal is not mentioned at all in DDPs through the 1980s and 90s. However, it appears
again in 2002-3 in a much more negative light. In an annual environmental report drafted at
the end of 2003, authorities note with concern the production of “millions of sacks of
charcoal” each year with little or no replacement of harvested trees (National Environment
Management Authority, 2003, p. 38).104 Similarly, the most recent DDP describes the current
level of charcoal production as a “menace” that needs to be effectively controlled
(Government of Kenya, 1980-2002, also cited above).
103 From an interview conducted in Ngoben, Narok on July 31, 2004.
104 “Million of bags” is not hyperbole. Based on conversations with charcoal transporters, an analysis of energy consumption data from Nairobi, and surveys of charcoal transporter, somewhere between 1.5 and 2.5 million bags of charcoal were produced annually during several years before the current crackdown. Assumptions underlying this estimate and the crackdown itself are discussed in more detail in Chapter 4.

147
Data from charcoal makers themselves also support the contention that large-scale charcoal
production in Narok is a recent phenomenon. 80% of the charcoal makers surveyed reported
that they arrived in Narok more recently than 1997, which is the median year that landowners
interviewed began to leave the boma and settle on private plots. Figure 14 shows the
frequency distribution of the years that charcoal makers surveyed in early 2004 have been
working in Narok. 1997, the median year that landowners began settling on their plots, is
marked by a vertical line. The distribution is skewed such that the mean length of time that
charcoal makers have worked in Narok is five years, but the median response is just 3 years.
Thus, half of those interviewed began to burn charcoal in Narok in 2001 or later. In addition,
a charcoal transporter verified that large-scale charcoal production began in the area of Narok
district west of Narok town, where this research was conducted, around 1997 or 1998. Prior
to that time, charcoal production in Narok was restricted to the eastern part of the district,
much of which had been subdivided and put under agriculture earlier in the 1990s.105
Several landowners were quite explicit in the role that charcoal makers have played in
clearing their land. One interviewee spoke as he pointed to the cleared bush in front of us:
This farm was a ‘forest’. There were elephants, there were lions. Our farms are ‘forests’, so let us use those people [referring to charcoal makers] to clear land…it is just development…I have no capital to clear those trees myself.106
105 From an interview with a charcoal transporter conducted on February 3, 2005.
106 In Swahili, “Hii shamba ilikuwa forest. Iko ndovu, iko simba…Shamba yetu ni forest, wacha tuingishe wale watu wafyeke [referring to charcoal makers]…ni maendeleo tu…sina capital ya kung'oa hii visiki,” (from an interview conducted in Ngoben, Narok, on July 27, 2004).

148
Figure 14: Frequency distribution of years making charcoal in Narok based on responses in early 2004
0
10
20
< 1 year 1 - 2 yrs 2 - 5 yrs 5 - 10 yrs 10 - 20 yrs 20 - 30 yrs
frequ
ency
(%)
Frequency of response mean: 5 yrs ago median: 3 yrs ago
median year of landow ners' settlement on private plots
Source: responses from survey of 50 charcoal makers – see Appendix 1 for the full questionnaire.
The respondent’s use of the word “development” (Swa: maendeleo) is significant. The word,
which figures prominently in state discourse about modernization, formal education, and
poverty reduction, was invoked by this respondent and several other landowners in reference
to land clearance, enclosures, and crop cultivation, demonstrating that a cognizant link has
been forged between those activities and modernism, progressiveness, and development.
Thus, the presence of charcoal makers facilitates land clearance for those landowners who
cleared very little, or none at all, prior charcoal makers’ arrival in this part of Narok. Under
the current situation, landowners “sell” trees to charcoal makers and grant them usufructuary
rights to make charcoal on their land rather than selling highly valued livestock to a third
party to pay hired laborers. The evolution of these terms of exchange has implications for
both of the groups involved as well as for land cover in the district. I will explain each of
these implications briefly.

149
For landowners, the exchange of trees and shrubs for labor is far more preferable than selling
stock. Particularly because, while livestock retains its high material and symbolic value
among these semi-sedentarized Maasai, the majority of trees and shrubs on their land hold
very little value to them; they intend to clear them anyway.
The value of trees, both symbolic and material, can vary between and within households. The
point of view described here is that of the male head of household and chief land manager. It
is quite possible that women would feel differently about the value of trees vis a vis cleared
land. Materially, women rely on the trees and shrubs for fuelwood and traditional medicines.
Though a formal assessment was not carried out as part of this field work, for the time being,
sufficient fuelwood appears to be available in the areas visited during this field work. In
addition, the majority of the landowners interviewed said that they planned to leave some
portion of their allocations under native vegetation in order to ensure a stock of firewood and
traditional medicines remain available to the household. In addition, many of the trees that
are valued for their medicinal applications are specifically not removed during land
clearance.107 However, that may change as successive generations divide plots further, more
areas are cleared for cultivation, and the population continues to grow.
For the charcoal makers, the arrangement is also favorable to working as casual laborers
simply clearing land. The daily returns that they can earn from making and selling charcoal
107 The selection of trees for removal is discussed further below.
150
are slightly higher.108 In addition, in most of the cases that I explored, they have much more
self-determination and control over their conditions of labor than they would have as simple
casual workers. An agreement to make charcoal on someone’s land is looked upon quite
differently than being employed by that person as a casual laborer. Working as a casual
laborer to clear a plot of land subjects the worker to a power imbalance that is no different
from any employer-employee relationship in rural Kenya (Ortiz, 2002). The worker is paid
from the employer’s pocket and is thus subject to the wages and conditions that are defined
by the employer. In contrast, most charcoal makers consider themselves self-employed. Their
income comes from charcoal brokers and/or transporters who have no alliance with the
Maasai landowners who supply the raw materials. Charcoal makers set their own hours and,
for the majority that are circular migrants, they return home to their families whenever they
wish. There are, however, myriad variations on the relationship between landowners and
charcoal makers. These are explored in more detail in Chapter 4.
Some environmental consequences of trading trees for labor
There are numerous environmental implications arising from the terms of exchange that have
evolved between landowners and charcoal makers in Narok. Land clearance occurred quite
rapidly in the decades after Kenya’s independence as large-scale wheat farms were opened,
but this was the result of management decisions made by a few individuals, who reaped the
majority of the resulting benefits. In addition, clearing that occurred in that period was
108 Earnings from land clearance are roughly 6,000 KSH ÷ 42 person/days = 143 KSH/person-day. Returns from charcoal production are ~165 KSH/person-day. A full description of the earnings from charcoal production are given in Chapter 4.

151
largely mechanized, with no involvement of charcoal makers. Evidence suggests that wheat
cultivation has reached a plateau (also indicated in Figure 9). In fact, as was discussed in
footnote 62 of this chapter, a recent but still unpublished GIS analyses indicates that
commercial crop cultivation in Narok may actually be declining (Serneels, 2005).
Small scale cultivation, on the other hand, is increasing in many areas visited in this study.109
Given the slow pace of land clearance among these particular landowners prior to the arrival
of large numbers of charcoal makers, it is quite likely that the presence of charcoal
production has accelerated the removal of Narok’s woody savanna and shrubland. Although
landowners wished to clear their plots immediately upon occupying them, many were unable
to do so, or only able to do so very slowly, without the “assistance” of charcoal makers. As
one landowner from Ngoben GR recounted, between the subdivision of his group ranch in
1995 and 2002, he cleared about 1.5 acres of his 100 ac plot of land. In 2002, a group of
charcoal makers approached him and requested to work on his land. In just two years, they
have cleared an additional 17 acres at no cost to the landowner.
In addition to accelerating the pace of land clearance on subdivided plots, charcoal
production affects the cycling of nutrients and carbon on the plot of land being cleared. For
example, prior to charcoal production, when land was cleared for cultivation, the standing
109 Preliminary data based on unpublished GIS analyses from Serneels indicate that small-scale cultivation on areas that were formerly parts of Ololunga GR increased by 430% between 1995 and 2003. In the same time period, small-scale cultivation increased by 153% in plots that were formerly part of Nkareta GR and between 1995 and 2000, the area under small-scale cultivation increased by 111% in plots that were formerly part of Ngoben GR (Serneels, 2005). Together, these areas host much of Narok’s current charcoal production.

152
biomass was simply burned in situ or piled up and allowed to slowly decay.110 The carbon
bound up in woody biomass follows quite a different fate if it is left in the ground, allowed to
decay, burned in situ, or baked into charcoal and sent to Nairobi. I will discuss the
implications of this on the atmospheric carbon balance on a local scale in Chapter 6 and on a
regional scale in Chapter 7.
Moreover, charcoal production has important implications on biodiversity and stand structure
for the woodlands and shrublands that remain. When landowners clear a portion of land, they
usually allow some trees to remain. This was verified by charcoal producers; 76% of those
surveyed reported that they were instructed to leave specific trees. The trees that are allowed
to remain are valuable for a number of services they provide: Olea africana (Kik: mutamayu;
Maa: olorien) is a valuable source of fodder during drought and Warburgia ugandensis
(Maa: olsogonoi) is a well-known medicinal plant that helps alleviate a host of ills including
cold symptoms, chest pains, and malaria.111 However, the dominant woody vegetation in
much of the central plateau consists of T. camphoratus and Acacia spp. Largely because of
its ubiquity, the former is not valued by landowners and is often completely removed.112
110 No doubt some of the thinner stems and branches would have been used for household fuel and fencing. However, the 20-100 tons of woody biomass covering a typical acre, half of which consists of heavy stemwood, would have largely gone to waste. Large logs are rarely used for household fuel because of the labor required to split them with hand tools.
111 Data concerning the uses of trees found in Narok’s charcoal production areas was obtained during interviews with charcoal producers and landowners in February and March, 2004. Descriptions of all of the trees encountered during field work are included in Appendix 6.
112 Stressing its uselessness, one respondent disparagingly referred to T. camphoratus as “Maasai toilet paper” (from an interview conducted on February 18, 2004). Interestingly, this respondent is among the better off landowners that were interviewed. His family lives in permanent mud-walled houses with galvanized iron sheet roofing built in the “modern” style. Timber used for framing in such homes consists of planks cut

153
The Acacia spp. encountered in this area consist of many different species. The most
common are A. tortilis (Maa: oltepsi), A. drepanolobium (Maa: eluai), and A. xanthophloea
(Maa: olerai). Each species of acacia has several medicinal uses. However, A. Xanthophloea
is locally thought to attract elephants, and, despite its usefulness, it is often removed.113
Finally, when clearing woodlands, landowners typically ask that one or two trees remain to
provide shade for grazing animals as in Figure 15. A few landowners plan to leave behind
large patches of woodland on their plots in order to maintain some remnant of the landscape.
One landowner plans to leave as much as half of his parcel untouched, saying:
Even trees carry meaning, I should let them stay.
Another plans to leave a sizable portion of his parcel for wildlife, provided that they do not
damage his crops:
from pine, cedar, or other softwoods that are typically purchased rather than harvested by family members. In contrast, traditional Maasai dwellings are temporary structures built low to the ground. They rely on locally available wood collected by household labor. Women are typically responsible for constructing the domicile and mature T. camphoratus is a common source for framing and supporting these dwellings. Hence, among the families who have not embraced modern building styles, T. camphoratus is likely quite a bit more valuable than toilet paper. Moreover, One source in the literature notes that the young shoots and leaves of T. camphoratus are browsed by cattle and ground up mature branches can be used as “fattening feed” (World Agroforestry Center (ICRAF), 2004), while another source holds that it is unpalatable to animals, “including browsers with broad tolerances” (Young and Francombe, 1991, p. 311) see also (Lamprey and Reid, 2004). Still other sources indicate that the essential oil from its leaves and shoots makes an effective insecticide and germicide (World Agroforestry Center (ICRAF), 2004). There was no indication during field work that it is utilized by livestock in the study area under any circumstances.
113 This issue was raised by several interviewees. A review of the literature indicates that elephants are known to browse various acacia spp. including A. xanthophloea; however, there is no evidence supporting the contention that they favor xanthophloea over other members of the genus. One study, conducted in the Seronera Valley of Serengetti National Park in Tanzania, observed the frequency of elephant-damage to trees in the valley and found substantial damage in A. tortilis, xanthophloea and senegal, but that only A. senegal was significantly preferred over other trees (Ruess and Halter, 1990). See also (Kabigumila, 1990).

154
A bird is God’s creation. They also need a place to live. Let the animals stay inside (the bush) and we can stay together.114
Figure 15: A single remaining tree provides shade for livestock
An example of T. camphoratus that was left behind after a plot was cleared for cultivation. The tree provides relief from the sun for a group of small stock. Note the large wheat fields both in the immediate and distant background, divided by a row of natural vegetation left to define the boundary between two plots. Source: Author, taken in Narok in September, 2004.
However, this conservation ethic was not a common sentiment among most respondents.
Others who plan to leave some woodlands on their parcels report doing so for utilitarian
114 The first quote is taken from an interview conducted in Nkairamiran, Narok, on August 11, 2004. The respondent said, in Swahili, Hata miti ni kitu ya maana sana…ikae. The second quote is taken from an interview conducted in Olololunga, Narok on August 8, 2004. The respondent said, in Swahili, Ndege ni maumbile ya mungu…pia hawa wanahitaji mahali ya kukaa. Wacha wanyama wakae nadani, tukae pamoja.
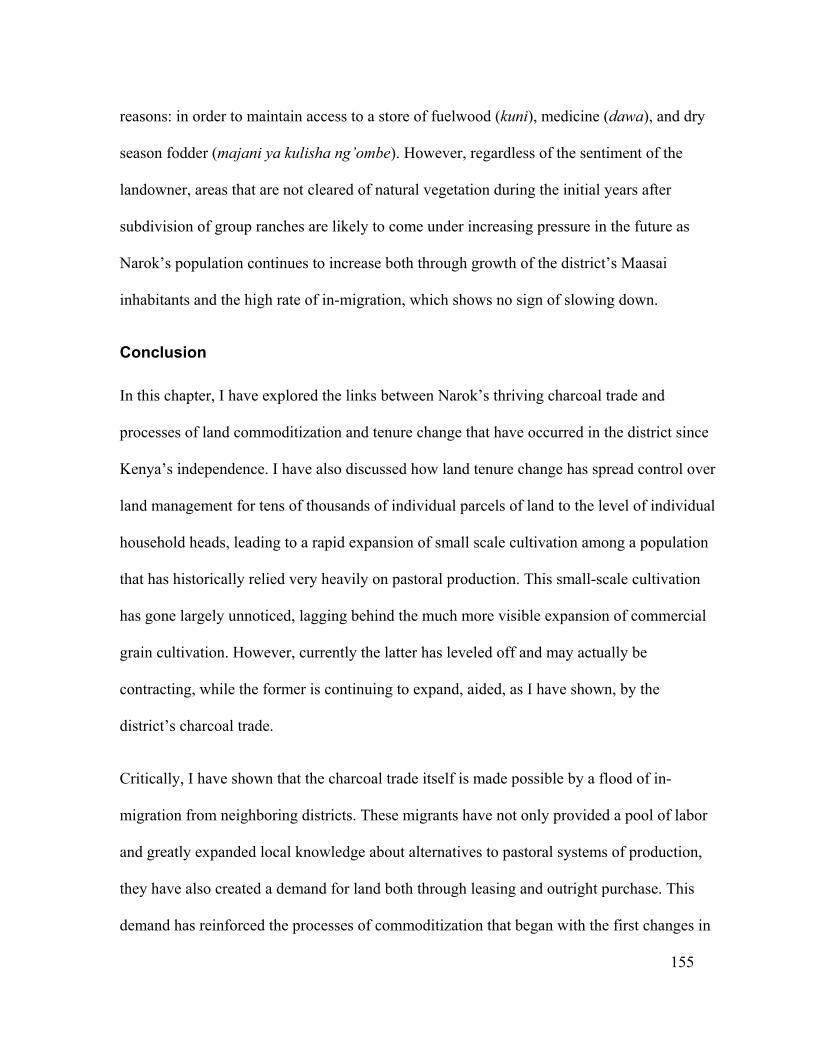
155
reasons: in order to maintain access to a store of fuelwood (kuni), medicine (dawa), and dry
season fodder (majani ya kulisha ng’ombe). However, regardless of the sentiment of the
landowner, areas that are not cleared of natural vegetation during the initial years after
subdivision of group ranches are likely to come under increasing pressure in the future as
Narok’s population continues to increase both through growth of the district’s Maasai
inhabitants and the high rate of in-migration, which shows no sign of slowing down.
Conclusion
In this chapter, I have explored the links between Narok’s thriving charcoal trade and
processes of land commoditization and tenure change that have occurred in the district since
Kenya’s independence. I have also discussed how land tenure change has spread control over
land management for tens of thousands of individual parcels of land to the level of individual
household heads, leading to a rapid expansion of small scale cultivation among a population
that has historically relied very heavily on pastoral production. This small-scale cultivation
has gone largely unnoticed, lagging behind the much more visible expansion of commercial
grain cultivation. However, currently the latter has leveled off and may actually be
contracting, while the former is continuing to expand, aided, as I have shown, by the
district’s charcoal trade.
Critically, I have shown that the charcoal trade itself is made possible by a flood of in-
migration from neighboring districts. These migrants have not only provided a pool of labor
and greatly expanded local knowledge about alternatives to pastoral systems of production,
they have also created a demand for land both through leasing and outright purchase. This
demand has reinforced the processes of commoditization that began with the first changes in

156
land tenure years ago. At the same time, in-migration has fueled ethnic tensions, which, in
Kenya, are inseparable from politics. These tensions have, at times, exploded in outbreaks of
violence that are often linked to environmental conflict. As was mentioned above, one recent
conflict claimed the lives of seven charcoal makers earlier this year.
There are additional social impacts of these processes. As was explored in detail by
Thompson and Homewood (Thompson and Homewood, 2002), group ranch subdivision is
leading to social differentiation, particularly in areas where large-scale commercial wheat
cultivation has become entrenched. Nevertheless, all landowners interviewed in this research,
regardless of wealth or status, considered life to have improved after group ranch subdivision
largely as a result of the self-determination and security of tenure that it provided. This was
true even on those group ranches where non-elite group ranch members felt that the ranch
leadership had cheated them in order to maximize their allotments at the expense of the
majority of ranch membership.
I have also explored some of the environmental consequences of these processes. Narok is
undergoing land use change on a grand scale, which is leading to the reduction of tree cover
both in upland forest areas and in the district’s expansive plateau, which is largely covered by
woodland and shrubland. This outcome should be contrasted with Hardin’s infamous thought
experiment, discussed in Chapter 2, in which pastoralists sharing a common pool grazing
area maximize their stock at the expense of society. In Narok, we have a situation in which
pastoralists have privatized their rangeland just as Hardin prescribes (Hardin, 1968). This
privatization has led some to scramble in order to clear their plot of trees and capture
investments from a limited number of commercial wheat growers. Others, perhaps less

157
ambitiously, are still motivated to clear land for myriad reasons ranging from their own
small-scale cultivation, to leasing to small-holders from the overcrowded neighboring
districts of Kisii or Narok, to the reduction of habitat for wildlife, which nearly all view as a
threat to life and property. Thus, privatization has led to rapid environmental change, which
arguably would not have occurred if the land had remained as a common pool range.115
As I will discuss extensively in the next chapter, forest destruction in the upland areas has
generated vigorous attempts among local and national authorities to restrict the movement of
forest products, including charcoal. However, Narok’s charcoal originates largely, if not
entirely, from the woodland and shrublands of the plateau. Forest destruction is occurring for
other reasons, as was discussed in Chapter 2. The replacement of native tree cover in
woodland and shrubland areas with large-scale grain cultivation and small-scale farming is
resulting in decreasing numbers of ruminant wildlife as well as a loss of plant biodiversity.
As was also mentioned in Chapter 2, the recent history of this area shows rapid transitions
from grassland to woodland and back again; Narok’s savanna is thought to be quite resilient
to change. However, this area has never been subject to permanent cultivation on this scale.
The net ecological impacts remain to be seen.
115 Granted, one of the critical elements in effective management of common pool resources is the ability to exclude others. This ability was eroded heavily as, on the one hand, the Maasai came under the influence of the Kenyan state and lost land to a series of National Parks, while on the other hand, Maasai elites saw land reform occurring elsewhere in Kenya and used their political power to carve off sections of the commons for their own private use.

158
Chapter 4
Charcoal and livelihoods: an analysis of Kenya’s charcoal commodity chain - 1
Due to high levels of poverty…charcoal burning has been developed as a source of livelihood for the Narok community. For effective control of this menace, the poor
charcoal burners must be given alternatives…
From Narok District Development Plan, 2002-2008 (2001)
Hakuna kazi mbaya kama makaa…(No work is as bad as making charcoal)
Charcoal maker in Narok District (August, 2004)
Introduction
In this chapter, I use commodity chain analysis (CCA) to explore how resources and profits
flow between participants in the production and trade of charcoal from Narok district of
southwest Kenya. CCA is a methodological tool that is useful for revealing both the flow of
benefits and power relationships within systems of commodity provision. As was discussed
in Chapter 3, Narok’s charcoal trade is driven by widespread land changes in land tenure in
which large areas of woodland and shrubland that were formerly designated group ranches

159
have been privatized. Over the past 10-15 years, the group ranches have been subdivided,
with individual plots allocated to the former ranch members.1
As was discussed in Chapter 1 charcoal is a favored fuel among Africa’s rapidly growing
urban population. In spite of the dominant role that charcoal plays in Kenya’s energy
economy and the potentially negative environmental toll that overexploitation of forest and
woodland resources can have, the Kenyan charcoal trade is not regulated by any overarching
policy (Kituyi, 2002; Mutimba and Matiru, 2002). To the extent that regulation exists at all, it
is largely through ambiguous, inconsistent, and easily avoided district or provincial-level
ordinances. For example, during my field work in Narok between January 2004 and February
2005, charcoal transportation in the district was officially banned and land clearing for
charcoal production occasionally required permits that were difficult and costly to obtain.
However, enforcement of these ruled varied such that actual shipments to Nairobi fluctuated
from near zero to over 20 truckloads per day.2
The ban on charcoal transport is part of a wider ban on the movement of forest products in
effect in Narok and several neighboring districts, which is meant to stem the rapid
destruction of forests in the area.3 Ironically, most of Narok’s charcoal does not originate
1 Ranch membership was typically extended to all of the adult male household heads among the families of the ranch at the time of subdivision. As was discussed in Chapter 3, at the time of subdivision on many group ranches, the definition of membership was one method by which elite group ranch members manipulated the allocation process to capture a disproportionately large allocation of land for themselves and/or exclude others from the allocation process.
2 Estimates of the flow of charcoal from Narok are based on interviews conducted with charcoal transporters in January and February of 2005, which are explained in more detail below.
3 Specifically, the Mau Forest Complex, discussed in Chapter 2.

160
from the forest areas that the ban is meant to protect. Rather, it is produced from private land
that is being cleared on the recently subdivided group ranches, a process that was discussed
in detail in Chapter 3. District-level officials recognize this incongruity. Nevertheless they
continue to pursue a policy of restricting charcoal transport, which they justify by noting that
the existing woodland and shrubland, which is being cleared by charcoal production,
performs important environmental services and should be conserved. This is problematic for
several reasons. First, the means by which authorities attempt to restrict charcoal production
are, at the very least, misrepresented and at worst, illegal. Second, there has been a long-term
state-sponsored trend toward individuation of land in the district, which creates far greater
incentives to clear land than existed under previous forms of land tenure. Further, while some
local authorities pursue policies that seek to conserve the landscape in its current form, others
promote the expansion of commercial farming, which is only possible through widespread
land clearance and thus directly contradicts attempts at conservation.
This research indicates that the underlying motivation for local authorities to restrict charcoal
production and transport may not match their stated goal of conserving the district’s forests,
woodlands, and shrublands. Rather, they may be motivated by the large flow of revenues
generated when charcoal transporters pay bribes in return for allowing charcoal to flow in
spite of the misdirected ban.
In addition to the ban on transport, local authorities attempt to control charcoal production on
individual plots of land. This is also problematic because the legality of restricting charcoal
production on private land is questionable. Kenya’s laws governing the use of forest land
such as the Forests Act of 1992 and the Environmental Management and Co-Ordination Act
161
of 1999 do not apply to private land unless a case can be made that land use practices are
causing harm to a third party (Government of Kenya, 1992; 1999).4 The only legal basis that
authorities have to control land management practices on freehold land is vested in the
Chief’s Act, colonial era legislation that current MP Koigi Wamwere calls “the worst
colonial legacy we inherited” (Awori, 2005). This draconian act allows authorities at the
Provincial or District level free-ranging powers to control nearly any aspect of life at the
community level. It was originally created as a product of Britain’s policy of indirect rule to
vest sufficient power in Chief’s, themselves a colonial creation, in order to collect head and
hut taxes as well as, “force the ‘native’ to sell his labor, contain dissent and generally secure
compliance,” during the early years of colonial rule (Berry, 1989b; Mamdani, 1996; Awori,
2005 also see). Though the law itself has been altered since independence, it retains the spirit
of the colonial era law insofar as upper level administrators are able to implement a wide
range of rules and regulations applicable to all aspects of private and local affairs through
Chiefs.5
In Narok, the FD and Provincial Administration have used the Chief’s Act to implement a
rule requiring that landowners obtain a permit prior to clearing vegetation from any
uncultivated land. In theory, permits would only be granted if the applicant could prove to
the Forest Department that the land being cleared would be put to productive use and that
4 Such as might occur if an individual’s actions lead to emissions of toxic pollutants or destruction of vital watersheds.
5 Chief’s are appointed by the DC who is also an appointed official. Downward accountability is minimal. It would threaten the Chief’s position if he or she acted in opposition of rules implemented by the district administration through the Chief’s Act.

162
steps would be taken to avoid soil erosion and other land degradation. Ironically, only a small
number of landowners interviewed were aware of the need to obtain a permit to clear their
land. Few who were aware of it actually bothered to obtain one, and those who did paid
“something small” to get their permit without undergoing any environmental assessment to
determine if their proposed clearing would lead to environmental damage.6 Ironically, the
very officers who are using the Chief’s Act are uncertain of whether their use of it is legal in
this context.7
Although they are ostensibly meant to prevent environmental damage from the exploitation
of forests and woodlands in Narok, including the charcoal trade, there is no ecological basis
to the regulations that are in place. Moreover, they show little understanding of the
socioeconomic context in which charcoal production occurs. As a result, such policies do
little to promote sustainable management practices.
The regulations restricting charcoal classify it as a “forest product” and stem from efforts
aimed at conserving the Mau Forest Complex (discussed in Chapter 2). Although it is true
6 “Something small’ is a direct translation from the Swahili euphemism Kenyans use to describe the petty bribes that they regularly pay to grease the wheels of the country’s bureaucracy. See the discussion below in footnote 22 of Chapter 5.
7 An officer from the Narok office of the FD explained his agency’s use of the Chief’s Act to restrict charcoal production on private land admitted during an interview. He admitted that he did not think it was a legal application of the Act and expressed fear that he would eventually get into trouble (from an interview with the FD officer in charge of Narok Forest Guards, conducted in Narok town on July 20, 2004). Ironically, this official was implicated by name in several interviews with charcoal makers and transporters as a tremendously corrupt official. Later discussions with an expert in Kenya’s environmental law noted that this application is probably a legal application of the Act, although a series of revisions to the Act have left people extremely unclear on its status (Ochieng, 2005). Reflecting the uncertainty and inconsistency with which local environmental regulations are enacted, the requirement that landowners obtain a clearing permit was no longer in effect by the time this field work was concluded in early 2005.

163
that large quantities of illegal timber are poached from Mau Forest, most of that poaching is
for rough-cut lumber rather than charcoal.8
In addition to misclassifying charcoal as a “forest product”, a larger problem plagues
charcoal regulation in Narok. However misguided their policies, at some level of the district,
provincial, and/or national administrations, there may be top officials who genuinely want to
stop charcoal production in Narok. However, the actual work of enforcing restrictions fall on
the junior officers and forest guards who staff the numerous traffic checkpoints along the 140
km route between Narok and Nairobi. Those officers have little interest in enforcing the
regulations banning charcoal. Rather, it is in their interest to allow charcoal to pass, and, in
the process, extract as much from the charcoal transporters as they are willing to pay in order
to get the commodity to market.9 As will be discussed below, when high-level authorities
increase restrictions on charcoal, the bribes extracted by low-level agents increase. There is
some price response on the part of the transporters; the flow of charcoal decreases as the
demand for bribes goes up. Never the less, even as net revenues diverted to bribery for each
bag transported to Nairobi have exceeded the farm-gate price of the bag, the flow of charcoal
continues.
8 This was evident from numerous hauls of confiscated lumber that where kept outside of the FD’s offices in Narok. The tree most commonly targeted for illegal lumber is Podocarpus spp.
9 The question of whether bribes paid to petty authorities are shared with senior officers and the extent that the cash flows up the hierarchy of the various security agencies remain unexplored. During interviews with charcoal producers and transporters, several indicated that the bribes are distributed up the ranks, but this is purely speculation on their part. See the discussion in the section on the horizontal distribution of benefits in Chapter 5 for more details.

164
This situation may change if/when the proposed Forest and Energy Acts are passed, although
it is not clear who will gain and who will lose from the new regulations. Change may be
helped along if Kenyans choose to accept a new constitution.10 The new constitution has
provisions for devolution of powers to district level councils which should increase
downward accountability of local officials – something that has been lacking in Kenya’s
highly centralized political machinery (Government of Kenya, 2005).11 I will explore these
questions in further detail in the remaining sections of this and the following chapter.
The remainder of this chapter will be largely descriptive. I will review some of the theoretical
underpinnings of CCA and examine the ways in which it has been applied to instances of
resource exploitation in other parts of the developing world. I will then offer a descriptive
analysis of the commodity chain, including the groups of actors and their practices, the
organization that exists within each group, and the relationships that exist between groups.
Many of the practices of each group of actors in the Narok charcoal commodity chain and
their interrelationships are unique to Narok. In order to understand the contrasts between
Narok and other systems of charcoal provision in Kenya, I will make references at each stage
of the chain to other recent studies on charcoal production in different parts of Kenya.
10 Both the Kenyan state and civil society have spent several years developing a new constitution. The draft version that was completed at the time of writing this dissertation calls for a much more decentralized system of government than currently exists. This version was soundly defeated in a national referendum in November 2005. Despite the outcome of the referendum, the general sentiment among the population is not necessarily opposed to decentralization.
11 Kenya’s proposed constitution calls for the dissolution of the current structure of Provincial and District Administration, which currently are appointed by the Executive Branch of the national government in favor of elected District Councils (Government of Kenya, 2005, chapter 14).

165
Foundations of commodity chain analysis (CCA)
CCA is a methodological tool that enables a researcher to explore the flow of materials and
profits as different groups of actors transform raw materials into consumer goods. It provides
insight into the formation of prices as value is added to a commodity by various points of the
chain.12 In addition, it can be an useful tool in policy analyses by allowing analysts to map
the flow of resources and benefits along a given chain and delineate the impacts of particular
policy interventions.
Further, the analysis can be extended beyond a focus on material goods and financial benefits
in order to better understand the cultural significance of different productive and
consumptive activities. As Leslie and Reimer write, commodity chain analysis traces “the
reworking of meaning along different sites in the chain” and provides, “a means of thinking
more precisely about the specific practices which shape the flow of goods,” (Leslie and
Reimer, 1999, p. 402).
In this section, I trace some of the genealogy of commodity chain analysis, discuss some of
its theoretical foundations, and explore its relevance for policy design. Much of the work in
which CCA has been used has focused on agricultural commodities and food systems. The
12 The “chain” is a useful metaphor for a system of commodity provision; however, it is important to acknowledge that materials and benefits within systems of commodity provision more often travel through networks or webs of actors rather than along a linear chain. Some authors have raised the notion of circuits or webs in which commodities circulate as cultural artifacts (Leslie and Reimer, 1999; Hartwick, 2001). Nevertheless, I retain the chain metaphor both because it is in common usage and because it acknowledges that commodities, like chains, have a beginning and end to their life cycles. Moreover, it allows the researcher to pinpoint instances of exploitation, concentration of benefits, or environmental impacts at particular points along the chain and bound their analysis in a reasonable way.

166
foundations of this work can be traced to early attempts by rural sociologists in the US to
explain the decline of the family farm and growth of Fordist agricultural production in the
1970s (Friedland, 1984; Dixon, 1999). Friedland (Friedland, 1984) called his approach
“Commodity Systems Analysis” and used it in the comparative analysis of different
agricultural products to develop a “sociology of agriculture” [p. 221]. Later, Friedland’s
model was applied to the development of international, largely periphery-core, trade in “non-
traditional” or “counter-seasonal” agricultural commodities that experienced a rapid
expansion in the 1980s (Goldfrank, 1994; Raynolds, 1994; Freidberg, 1997).
A second strand of CCA originates in the French filière method of economic analysis
(Goodman and Watts, 1992; Ribot, 1998). The filière approach was used it “to investigate
the various stages – and their interconnections – in the journeys of food commodities from
farmers field to consumer’s plate” (Bernstein, 1994, p. 122). However, it was originally a
purely economic endeavor, concerned with the ways in which value was added to a
commodity as it moved. Emphasis was primarily on price formation through the physical
transformation of material goods. Several researchers built on this foundation by integrating
political economic analyses of the “social relations and institutions that structure economic
life and markets,” (Bernstein, 1994, p. 122) also see (Ribot, 1990; Goldfrank, 1994). In
addition, analyses were extended beyond food to include other commodities like clothing and

167
furniture.13 More recently, scholars have utilized CCA to explore the “cultural economy” of
commodity systems (Dixon, 1999; Leslie and Reimer, 1999).
Table 9: Stages in Friedland’s model of Commodity Systems Analysis (Friedland, 1984) Production Includes both the way in which production is organized and the problems confronted
during the production cycle in order to gain insight into the social organization of the commodity system.
Grower/producer organization
Includes how the producers manage financial resources, capital and labor, in addition to any organization among groups of producers.
Labor Includes an investigation of how labor is made available to produce the commodity and how it is managed and/or organized.
Scientific production and application
This area concerns the “relationships between commodity organizations and research and development units; specific mechanisms determining agendas of research units and personnel; funding sources; the types of problems that get researched and those that are ignored; patron-client relations between private producers and public research and development units” (Friedland, 1984, p. 226).
Marketing and Distribution
As Friedland conceived it, this area concerns the ways in which the commodity is physically brought to the consumer. However, it can also be expanded to explore the ways in which consumer tastes are socially and culturally constructed, which is described in more detail below.
Friedland delineates five foci of CCA stressing that dividing the chain in this way should not
be interpreted as an indication that any of the foci operates independently. Rather, each level
of the commodity chain can exercise an influence over any other in ways that are specific to
a given commodity or market. The focal points of Friedland’s CSA are given in Table 9
below.
13 See the edited volume by Gereffi and Korzeniewicz (Gereffi and Korzeniewicz, 1994). Also see Goodman and Watts (Goodman and Watts, 1992) for an argument about agricultural exceptionalism within the context of agrarian and industrial restructuring and Fordist/post-Fordist debates. They hold that parallels between industry and agriculture drawn by Friedland and other early proponents commodity systems analysis were “radically overdrawn” and that “agriculture is not simply derivative of industry,” [p. 5] but rather, it has “been on the forefront of new labor processes and institutional innovations in the social division of labor,” [p. 40].

168
Within this approach, Friedland advocates a pluralistic methodology utilizing “historical,
institutional, quantitative, and qualitative analyses” (Friedland, 1984, p. 223). In addition, he
admits that the efficacy of the analysis rests on the assumption that the system in question
can be “delineated as a discrete commodity system” (Friedland, 1984, p. 223). The extent to
which actual commodities exist within totally discrete spaces of provision varies. Hence, care
must be taken to ensure that the analyst is aware when and under what circumstances
commodity systems interact and/or intersect.
Dixon expands Freidland’s methodological approach by exploring cultural economy. She
Dixon borrows the term from Watts, who uses it in order to “identify the distinctive spatial,
natural, personal and social production conditions which help shape the matrix of
accumulation within the food system.” For Dixon, this approach helps to build on standard
political economic analyses of market relations by incorporating aspects of culture. As she
explains it, “If political economy focuses on the interrelationship between the economy,
social class, and politics, a cultural economy perspective adopts the key interrelationship as
that between the economy, social identity, and politics,” (Dixon, 1999, p. 157).
Including cultural aspects of commodity systems, brings consumption to the forefront of the
analysis. Citing the role of consumption as a means through which people in modern society
identify themselves, Dixon questions the current applicability of the traditional Marxist
notion that production and consumption are simply two sides of the same coin linked through
the wage relation (Dixon, 1999). In incorporating consumption, she draws on ideas
developed by several Marxist or neo-Marxist scholars (Appadurai, 1986) who have focused
on consumption as a process “separate from, but mutually constitutive of, production,”
169
(Dixon, 1999, p. 155). Leslie and Reimer also stress the importance of incorporating
consumption in commodity systems analyses in order to avoid what they call the
“productionist pitfall” (p. 406) – an overemphasis on production as “the locus of reality”
(Leslie and Reimer, 1999, p. 405-6).
However, simply appending “consumption” at the end of an analysis of commodity chains
risks creating an oversimplified binary opposition between consumption and production.
Such dichotomies obscure the “nature of the mechanisms articulating and mediating
production and consumption (Dixon, 1999, p. 153).14 Dixon suggests that this can be avoided
by turning to a “new retail geography”, in which retailers or other actors linking producers
and consumers are viewed as increasingly important players in mediating the relationship
between those who produce and those who consume (Dixon, 1999, p. 153).15 Similarly,
Hartwick describes a “more complex model” of CCA that moves beyond a simple conception
of commodity movement from node to node. She looks at CCA as “a way of tying together
material and signified realities, consumption and production, and activities separated by
space, providing a fuller interpretation of the material world and the real, human actors who
live in it,” (Hartwick, 2001, p. 2278). Bringing consumption into the CCA specifically in
14 Hart presents a useful critique of such binary oppositions, demonstrating their gendered character, within the context of globalization and Development. For Hart, gendered dichotomies such as global/local, active/passive, dynamic /static, and economic/cultural are representative of “disabling discourses” (Hart, 2001, p. 655). Such either-or discourses “shape possibilities for thought and action” (Briggs, 2001, p. 3732) in a way that limits debate and prevents more nuanced understandings of complex social phenomena. Similarly, the binary oppositions of production/consumption, formal/informal, and subsistence producers vs. market oriented producers affect conceptualizations of commodity chains.
15 In western markets, large fast food and grocery retailers have become increasingly important agents in shaping production practices (Dixon, 1999). In quite a different way, patron (merchants) who act as middlemen in Senegal’s charcoal trade help to shape production practices by influencing where and under what conditions producers work (Ribot, 1998).

170
context of commodity provision in developing countries, Hartwick notes,
“Underdevelopment, unequal exchange, profit flows and power differences, vastly different
conditions of life, must be hidden behind the image of the commodity to give the impression
that consumption is effortless and has no negative side effects,” (Hartwick, 2001, p. 2278).
Another aspect of current trends in commodity chain analysis is the transformative politics
that such analyses can engender (Hartwick, 2001).16 Leslie and Reimer note that by
privileging the spatial nature of the commodity chain, there is an explicit potential for
“political action by reconnecting producers and consumers,” [p. 402], groups at opposite
ends of the commodity chain that are increasingly distant from each other both physically
and psychologically.
While many approaches to CCA have focused on the vertical nature of the chain, Leslie and
Reimer stress that both vertical and horizontal factors should be analyzed with equal rigor.17
Approaching commodity chains as objects of geographic analysis across a range of scales,
they argue, both the vertical and horizontal character of the chain is more readily revealed.
They write, “the role of space in mediating relationships across the chain provides a means of
combining horizontal and vertical analyses without losing the analytical rigor of systems of
16 This may be reflected in many current phenomena involving what Goodman calls “reflexive consumers” (Goodman, 2004, p. 891) including the “Fair Trade” movement, green labeling, “dolphin-safe” tuna, and even McDonald’s consideration of more “humane” methods to slaughter chicken (Körber, 1998; Goodman, 2004; Reuters News Service, 2004; Giovannuccia and Ponteb, 2005; Loureiro and Lotade, 2005). Of course, the role of civil society, typically environmentally active NGOs, is critical in informing the consumer.
17 Vertical analyses focus primarily on the relationship between different nodes of the commodity chain. Horizontal analyses investigate relationships within a given node. Such analyses can be conducted not only through class relations as in traditional Marxist analysis, but also through race, gender, ethnicity and place in order to understand symbolic and material relations within that node.

171
provision approaches,” [p. 410]. Further detailing the analytic power of spatializing the
commodity chain, they write:
While most commodities span numerous scales from the body to the home, community, city, region, nation and globe, individual commodities relate differently to these scales. Some goods articulate closely with the body (i.e., clothes, food), while others relate to the space of the home (i.e., furniture). It is important to reflect upon both the unique spatialities of products and also the geographies of chains, which are by no means linear, and involve complex webs of relationships between spaces. A consideration of the spatiality of commodity chains has important consequences for both policy and politics [p. 411].
The literature addressed thus far has primarily focused on analyses of food and agriculture
commodity chains originating in, or destined for, western markets. However, the lens of
commodity chain analysis has also effectively been focused on questions of resource access
and production-consumption relations within developing countries, including systems of food
provision (Bernstein, 1994), woodfuels (Ribot, 1990; Boberg, 1993; Ribot, 1993; 1998),
small-scale mining (Kambani, et al., 2003; Werthmann, 2003) and the trade in bushmeat
(Bowen-Jones, Brown et al., 2003; Brashares, Arcese et al., 2004; Cowlishaw, Mendelson et
al., 2005; Wilkie, Starkey et al., 2005). The latter three are particularly relevant for this
research because they deal with illicit or informal markets for commodities, which are
frequently associated with environmental degradation.
Environmental impacts, whether real or perceived, often generate attempts by the state to
regulate or control such markets. However, these are often subverted by poor enforcement,
corruption, and/or a failure to incorporate local knowledge and institutions in regulatory
design (Dove, 1992; Ribot, 1999; 2004). In addition, their illicit and informal nature makes
these markets opaque to outsiders. In many cases no records of production and sales are kept

172
while in other cases, records are deliberately misrepresented. Moreover, as with charcoal in
Kenya, these commodities are linked strongly to the livelihoods of poor rural populations as
well as a concentration of benefits in the hands of a few powerful players.
The benefits that people obtain by playing a role in these commodity chains are mediated
through the degree of access that they possess and maintain. Ribot prescribes a method of
“access mapping”, which clarifies the roles that actors play in complex systems of provision.
It also permits the quantification of benefits flowing between and within different groups of
actors. An outline of access mapping is shown in Table 10.
Table 10: Access mapping for commodity chain analysis 1. Identify the actors at each stage of the commodity chain. Explore the ways in which they are organized
(Friedland, 1984) and the ways in which they relate to one another 2. Evaluate vertical distribution of benefits, which include profits realized by actors at each stage of the
commodity chain as well as other non-cash benefits that may accrue in the process of bringing the resource to the consumer.
3. Evaluate the horizontal distribution of profits within each stage of the commodity chain. 4. Analyzing how access is maintained and controlled. This includes actions taken by actors within a given
stage of the commodity chain as well as external factors such as policies and regulations that enable or restrict access for particular actors.
Adapted from (Ribot, 1998) with inputs from (Friedland, 1984)
The degree of access to one or more stage in any system of provision strongly depends on
what Ribot and Peluso term the “mechanisms of access” (Ribot and Peluso, 2003). These are
identified in step 4 of Table 10. These mechanisms consist of both the legal and illegal means
through which individuals and groups access resources, as well as an array of “structural and

173
relational” factors that include technical capacity, markets for land, labor and capital, as well
as social identity and social relations (Ribot and Peluso, 2003, p. 61). 18
Importantly, these factors actively shape a commodity system that is distributed over space
changing over time (Leslie and Reimer, 1999). For example, the charcoal commodity chain
originating in Narok District is subject to rules that constantly shift, with concentrations of
power and regulatory intensity materializing and dissolving as local authorities are reposted,
a frequent occurrence in Kenyan government appointments.
The question of who benefits from charcoal production in Kenya was only recently raised by
policy makers. A recent survey estimates that roughly 200,000 people across the nation rely
on charcoal production for some aspect of their livelihood. A similar number are thought to
participate in upstream activities like transport, trade, and retail sales (Mutimba and Barasa,
2005b).19 Charcoal from Narok alone, which constitutes roughly 30% of Nairobi’s annual
supply, includes ~1,400 producers, 150 brokers or middlemen, and ~90 traders. Across
Kenya there are several distinct models of charcoal production. Depending on the production
system in place, others actors not directly associated with producing or moving the
commodity may also benefit from the trade in some way. For example, in Narok, some
18 For conditions of access in other rural resource commodity chains, see (Chibnik., 2000; Bowen-Jones, Brown et al., 2003; Bush, 2004; Cowlishaw, Mendelson et al., 2005). For a discussion of the ways in which access to resources is gained and maintained through identity and social relations, see (Berry, 1989a; Okoth-Ogendo, 1989; Li, 2000; Ribot and Peluso, 2003).
19 Based on the average productivity of charcoal makers determined both through surveys and quantitative assessments of 10 charcoal kilns (see Appendix 5), Kenya’s net charcoal production would require between 100,000 and 150,000 people working six days per week, 50 weeks per year. Thus, if a large fraction of charcoal makers only work part time, as ESD-A’s work indicates, a figure of 200,000 charcoal makers is quite plausible.

174
charcoal producers pay landowners in order to harvest trees for charcoal. In addition, when
authorities in Narok tighten the restrictions on charcoal, transporters pay bribes to police and
other authorities manning a string of 10-15 roadblocks between Narok and Nairobi.
Understanding the flow of benefits from a commodity not only has theoretical importance. It
is also has critical policy relevance. Many development interventions attempt to improve
rural livelihoods and environmental outcomes by changing the mechanisms of access for
certain groups or actors. A lack of understanding of the practices within and between groups
of actors who define the commodity chain renders such interventions likely to fail.
Alternatively, interventions may not fail completely, but may still have unintended,
potentially negative environmental impacts and/or negative outcomes for less powerful
economic players.20 In fact, in some instances in which influential players gain at the expense
of the less powerful, it may be unclear if the divergence of outcomes from those that were
officially stated was unintentional at all. If policy interventions are to affect the distribution
of benefits and/or environmental outcomes resulting from the provision of a particular
commodity, these practices must be better understood and followed through the course of the
policy intervention.
20 Schroeder describes the impact of one such intervention in The Gambia in which tree planting initiatives, introduced to stabilize what outsiders perceived as a precarious environmental situation, actually put serious strains on an emerging market garden economy run almost entirely by women. He writes, “developers at all levels had pinned their hopes, indeed staked their very legitimacy in some cases, on the continued mobilization of unpaid female labor,” suggesting, “that developers have a blind spot with respect to the fundamentally exploitative nature of many of the work processes into which women are being incorporated across the continent” (Schroeder, 1993, p. 362).

175
Actors and practices in the charcoal commodity chain
The question of who benefits from charcoal in Narok is a particularly interesting one.
Delineating the beneficiaries of Narok’s charcoal trade requires that all of the participants in
the commodity chain be identified. These participants range from highly visible charcoal
producers, marked from miles away by plumes of smoke and the unmistakable smell of
pyrolizing wood, to far less visible brokers and lorry-loaders, who each take a small fraction
of the price of each bag in return for linking buyers and sellers and heaving the 80 lb bags
into place for its journey to the city. The range of actors in Narok’s charcoal commodity
chain as well as the flow of money and materials are shown in Figure 16.
Figure 16: Main actors in Narok’s charcoal commodity chain
As was discussed above, commodity chains are not typically characterized by purely linear
exchanges, and thus this figure is a simplification. Some actors can play more than one role,
while others may be bypassed in any given transaction. This is particularly true in Narok,
where vacillating restrictions force brokers, buyers and transporters to constantly shift tactics
in order to move the product from its point of production to the market. The complexity of
Landowners
Charcoal makers
Brokers in Narok
Buyers and Transporters Vendors
Brokers in Nairobi
Consumers
Authorities at traffic
checkpointsFlows of money
Flows of wood and charcoal
(trees)

176
these exchanges is described in more detail below. First, in this section, I will describe each
group of actors and their role in the commodity chain.
Landowners and charcoal producers
The role of landowners was explained in detail in Chapter 3 and will only be reviewed here
briefly. Landowners are included in this section, because, although few of them actually
participate in charcoal production, it is their decisions that allow charcoal production to
proceed. Their main motivation for permitting charcoal production to take place on their land
is to clear it of vegetation. They do this primarily in order to open land for cultivation
through leasing to outsiders or planting for themselves. However, other motivations also
exist, such as clearing for pasture and reducing wildlife habitat.
Charcoal makers themselves are largely migrants from neighboring districts where
population pressure and demand for cultivable land has reduced family landholding and
increased land prices so that many people in those areas can not meet their family needs
through cultivation alone.21 Many of these migrants have followed informal networks of
producers who come from the same home area.22 They typically work in loose collaboration
with one another, though occasionally they team up in full partnership. Sixty percent of those
21 Average farm sizes in Nakuru and Kisii are discussed in note 54 of Chapter 3.
22 There is a cost inherent in any kind of migration, but that cost is not homogeneous among perspective migrants. In the economic literature, people choose to migrate in search of work if the expected income in the new labor market exceeds the wage in their home areas (Harris and Todaro, 1970). The expected income is a product of the new wage rate and the probability of finding a job. Prospective migrants who have social ties with earlier migrants probably consider their likelihood of finding a job better than those with no such ties. Thus the cost of moving is mitigated by investing in social networks (Berry, 1989b) and will depend on the presence of early migrants, who create a positive externality “by easing the transition of later migrants” (Bardhan and Udry, 1999, p. 58).

177
interviewed are circular migrants. Their families remain in their home areas, to which they
return periodically carrying cash remittances.
Figure 17: Reason given by charcoal maker for coming to Narok ( “other” reasons are given in the inset)
46%
38%
16%
0% 20% 40% 60%
Respondent came tomake charcoal
Respondent came forreason other thanmaking charcoal
Respondent was born inNarok (Maasai) 30%
17%
13%
35%
0% 20% 40%
Work (non-farm)
Work (farm)
Family
School/other
Among the migrants surveyed, just over half came to Narok specifically to make charcoal.
The remainder turned to charcoal after failing to find other work or realizing that profits from
charcoal were potentially higher than money they could make engaging in casual labor.
Figure 17 shows the reasons that charcoal producers gave for coming to Narok. The inset
graph shows the breakdown of charcoal makers who did not come to Narok with the intent of
making charcoal. The majority of these respondents were seeking wage labor, with off-farm
labor just edging out on-farm labor. Much of the off-farm labor market in Narok is driven by
tourism. The district is home to a thriving tourist industry that draws many job-seekers. In

178
addition, Narok town has grown extremely quickly in recent years, and has attracted many
people seeking employment linked to the growth of the town itself.23
Ethnicity among charcoal producers
The migrants making charcoal in Narok represent several of the ethnic groups that neighbor
the district as well as a few from further a field. Not surprisingly, most charcoal makers in
Narok are Kikuyu (56% of respondents). The Kikuyu are the most populous ethnic group in
the country, constituting 22% of the total population.24 In addition, Narok is bordered to the
north and northeast by Nakuru and Kiambu, which are predominantly Kikuyu districts.25 In
addition, charcoal production has occurred for many years throughout traditional Kikuyu
areas as well as in regions where they have settled both before and after Kenya’s
Independence. It is a trade with which many Kikuyu are familiar.26 This linkage is not lost on
23 The population of Narok township has increased by a factor of 20 since 1989 (Government of Kenya, 1994).
24 This and subsequent data on ethnicity in Kenya should be treated with care. As was explained in Chapter 3, ethnic identity in Kenya is highly politicized. These data come from the US CIA’s “World Factbook”, which does not list its source of information (US CIA, 2005). The data match closely, but not exactly to the data presented in Kenya’s 1989 census (Government of Kenya, 1994).
25 Kiambu, doesn’t actually border Narok, but is separated from it by a 15-20 mile strip of Nakuru and Kajiado districts. However, the main road linking Nairobi and Narok transects Kiambu, making an easy and well-traveled link between the districts.
26 Predominantly Kikuyu areas of Central Province are home to the forests around Mt. Kenya and the Aberdare Range which used to host a great deal of charcoal production. In addition, during colonial rule, the Kikuyu were the ethnic group that was most affected by, and integrated into, the colonial economy. They were the fastest to begin formal schooling and were quite successful entering market oriented trade activities. As Leys writes, “the new African ‘auxiliary bourgeoisie’ was predominantly Kikuyu in composition,” (Leys, 1975, p. 202). Moreover, the Kikuyu were among the most mobile ethnic groups, settling in many areas outside their traditional homelands. This settlement increased after independence, when it was predominantly the Kikuyu in control of the government. Many of the large European-owned farms in the highlands around the Rift Valley were bought and divided among Kikuyu (Leys, 1975). In subsequent years, these areas, which include inter alia Nakuru, Naivasha, Nyandarua, and Laikipia, have served as major charcoal production areas. Thus, though it is by no means strictly a “Kikuyu profession”,

179
local residents and authorities. One landowner, a non-Kikuyu migrant from a district to the
west, specifically linked the takeoff of Narok’s charcoal trade with an influx of Kikuyu
migrants.
They started to burn [charcoal] when these Mungiki came here.27
There is a strong association between charcoal burning and the Kikuyu among certain local
authorities as well. An official with the NCC, which consists entirely of local Maasai
politicians and support staff, linked Narok’s charcoal trade not only to the presence of
Kikuyu in the district, but also to a former Kikuyu DC who was in office when the trade took
off, as well as to the National Conservator of Forests, another Kikuyu. The latter connection
was made in the context of negative environmental impacts of large-scale charcoal in Narok,
which is a topic of particular sensitivity because, as was discussed in Chapter 2, politicians
have used environmental degradation to justify ethnic clashes that occurred in Narok in past
years.
The second most frequent ethnic group among the 50 charcoal makers surveyed were Maasai
themselves (18%). As was discussed in Chapter 3, the majority of landowners do not clear
land through their own labor; nor do they make charcoal. However, a small number choose to
do so because it provides access to revenue from charcoal sales. These producers can be
there is a long tradition of charcoal production in areas of Kikuyu settlement. In contrast, large-scale charcoal productions is quite new to Narok.
27 Swahili: Walianza kuchoma [makaa] wakati hawa Mungiki walikuja hapa . The word Mungiki refers to a radical Kikuyu religious sect that became politically active prior to the general elections in 2002. The respondent’s use of the term to refer to the Kikuyu charcoal makers was meant to be ironic and slightly derogatory (from an interview conducted in Ngoben, Narok on July 26, 2004).

180
categorized in two groups. One group consists of some of the poorest and/or youngest
landowners. This group owns few livestock and must subsist on the proceeds that they can
derive from their land. This is particularly vital in the early years of occupying their own
land, before they are able to open a plot to farm.28 The second group consists of a minority of
better off landowners who can mobilize household or wage labor to clear trees from their
land and make their own charcoal. Unlike the majority of landowners, this group of Maasai
considers the charcoal that is produced on their land to belong to them.29
In addition to Kikuyu and Maasai, several ethnic groups from districts to the west of Narok
were also represented. Figure 18 shows the ethnicity reported by charcoal producers that
were surveyed. For comparison, the fraction that each ethnic group contributes to the overall
population is also shown along the x-axis.30
This distribution of ethnic groups among the ranks of charcoal makers raises the question of
the role that ethnicity plays in the charcoal trade. Ethnicity has always played an important
role in Kenyan life. Since the introduction of multiparty politics, ethnic tensions have
28 In addition, as was discussed in Chapter 3, farming is a fairly new activity for many Maasai residents. During the first few seasons, yields can be low. Without livestock to fall back on, other sources of income are critical.
29 In addition, one of the Maasai charcoal makers surveyed was himself a migrant to Narok. This respondent came from Trans Mara district, which was officially part of Narok until 1995. This respondent was making charcoal in Narok because he had lost all of his cattle during a severe drought and had no alternative means to provide for his family.
30 The national ethnicity data in Figure 18 are based on the 1989 census (Government of Kenya, 1994). The respondents surveyed included 2 people of mixed Maasai-Kikuyu descent. This is quite common; however, there are no official statistics of the number of people with mixed ethnicity in the Kenyan population. As was explained in Chapter 2, there is a long history of intermarriage between the Kikuyu and Maasai. However, in the past, incoming wives were quickly assimilated and considered Maasai. More recently, there appears to be a greater retention of Kikuyu identity within intermarriages.

181
periodically flared into violent conflict, which has affected Narok and surrounding areas.31
As was discussed above in Chapter 2, non-Maasai residing in Narok have little security in
land, even when they hold a legal title. In addition, both residents and itinerant migrants
come under occasional threats of physical harm.
Figure 18: Ethnicity reported among charcoal makers surveyed in Narok (n = 50).
4%4%6%12%
18%
56%
0%
25%
50%
75%
KalenjinKikuyu-Maasai
LuhyiaKisiiMaasaiKikuyu
12%?14%6%1-2%22%% national population
Source: surveys conducted in February and March, 2004
These threats occur when there is large scale mobilization of sentiment against outsiders as
occurred in Enoosupukia in 1993 and Mai Mahiu in 2005 (Dietz, 1996; Nation Reporter,
2005b; Owour and Mwangi, 2005). However, there are also less intense, but more frequent
threats arising from the Maasai Morani – the young “warriors” whose role in the traditional
Maasai gerontocracy is to defend the Maasai olosho. Migrant charcoal makers who live in
the bush in temporary shelters during long production runs told of frequent demands for food
and money from Morani accompanied by threats of violence.
31 In addition to conflict in Narok, affected areas include Trans Mara, Nakuru, and Kajiado districts. See the discussion in Chapter 2.

182
There is also a possibility of ethnic tension occurring within the ranks of charcoal makers;
however, such tensions was not observed. During interviews, charcoal makers stressed that
relations among them were congenial. In addition, though there were instances in which
producers were working in ethnically homogeneous groups, several occasions were also
observed in which charcoal makers of different ethnicity were working adjacent to one
another, sharing both living space and reciprocal labor agreements. Moreover, the producers
themselves repeatedly stressed that all common ethnic groups were represented among their
ranks.
Thus, while the Kikuyu appear to dominate the ranks of charcoal makers in Narok, it does
not appear that ethnicity is a factor preventing non-Kikuyu from participating in charcoal
production. Nevertheless, ethnicity does play a role in the occasional violence that is both
threatened and carried out against non-Maasai in Narok. Although this is not directed
specifically at charcoal makers, they are particularly vulnerable to it because they work in
highly visible locations marked by smoking mounds of earth and cleared patches of trees.
Moreover, their vulnerability is increased because of the rhetoric of environmental
degradation that has accompanied recent conflicts (see above). Charcoal makers are
commonly portrayed by the media and the state as agents of environmental destruction.
Reflecting this rhetoric quite explicitly, one NCC official interviewed during this field work
placed blame for the environmental change currently occurring in Narok squarely on the
shoulders of outsiders – specifically Kikuyu. I pressed him on this issue by observing that
most of the environmental change, particularly change associated with charcoal making, is
occurring on land that is privately owned by indigenous Maasai residents of the district and

183
that it could not proceed without their consent. He countered this observation by noting that
past district-level officials including District Forest Officers, Agriculture Officers and
Commissioners have all been outsiders.
He contends, since subdivision of group ranches began in the late 1990s, district officials
have intentionally misadvised local landowners in order to promote widespread land use
change and capture the benefits of the charcoal trade resulting from land clearance.32
Although its quite clear that current and recently departed members of the district
administration are benefiting from the combination of a ban on charcoal transport and
widespread land clearance through very hefty bribes described in more detail below, it is
impossible to verify that these benefits were an intended outcome of the policy that advised
landowners to open their land for cultivation.33 The specific officials to whom he was
referring have been transferred out of the district in a series of relocations among the civil
service. In one of the more publicized shake-ups, every forest officer in the nation was
reposted because of allegations of rampant corruption in the Forest Department (Nation
Correspondent, 2004). Thus, it was difficult to get a balanced assessments of the NCC
officer’s allegations.
32 From an interview conducted with the NCC’s Chief Forest Officer in the NCC offices on September 6, 2004.
33 This conversation reflects a fundamental tension that exists between the District Administration, which is appointed by the national government and has little accountability to local constituents, and the County Council, which is locally elected, but notoriously corrupt.

184
Exchange relations and production practices between landowners and charcoal makers
As was described in Chapter 3, many Maasai landowners rely on charcoal production to
finance the clearing of woody vegetation from their land. Though the decision to clear land
via charcoal production is the landowner’s, it is typically the charcoal maker who initiates the
transaction. Seventy percent of the Maasai landowners interviewed were approached by
charcoal makers seeking to make charcoal on their land. The remainder sought out people to
clear their land or did the clearing themselves. Once permission is granted by the landowner
to cut trees and make charcoal, the landowner usually indicates a specific area or specific
trees to for the charcoal maker to clear. It is also common for a landowner to specify that
certain trees be left behind as was discussed in Chapter 3.
In addition to the specific work to be done, the two parties arrive at terms of exchange, which
can vary quite a bit. Roughly half of the landowners demand payment for access to their trees
and the right to make charcoal on their land. Interestingly, among the landowners that do not
request payment, some seemed unaware that this is done, while others are aware of the
practice, but choose not to do it because they consider it greedy to demand such payments.34
34 They call this payment “cess”, the English word used by Kenyan officials to describe a tax levied on a specific commodity by county and town councils for goods transiting their constituencies. For example, when it is legal to transport, charcoal transporters are charged a “cess” of 25 KSH per bag by the NCC upon leaving the district.

185
Table 11: Terms of exchange between landowners and charcoal makers (n = 50) Type of exchange Payment Frequency Comments No exchange NA 50% According to charcoal makers, the number of landowners
who do not charge appears to be decreasing as landowners realize that charcoal makers are willing to pay for access to trees.
Payment per bag of charcoal produced
10-20 KSH/bag
28% This was the most common form of transfer between charcoal makers and landowners.
Payment for individual trees
500-1500 KSH/tree
12% This only occurred when large trees were prevalent. For example, on plots containing riparian zones or plots located in the upland areas. A. xanthophloea was the most common purchased tree.
Payment for access to an area of land
1000 for ¼ ac 2% This exchange was only observed in one case among the surveyed population, although it was seen on a few other instances (e.g. during the pilot survey period). Here, the charcoal maker pays the landowner for the rights to cut a specific area. The landowner claims that ¼ ac yields roughly 100 bags, which seems high, but within the range measured in the sample of kilns tested quantitatively. At this level of productivity, the rate of payment is roughly 10 KSH/bag and falls within the range of cess charged by other landowners.
Charcoal makers are paid for an area that they clear
3000 per ½ ac 2% This was also observed in only one case. Here the exchange flowed in the opposite direction as the cases described above. The landowner pays charcoal makers to clear a specific amount of land and make charcoal from the trees that they cut. The charcoal belongs to the landowner. He claims that ½ ac yields roughly 30 bags, which seems lower than other yields, though his land may have less dense tree cover than other areas. At this rate of productivity, the charcoal makers’ returns are roughly equivalent to the returns they would receive from making and selling their own charcoal (100 KSH/bag).
Among those that do charge, some charge for a given area of land while others charge a fixed
price per bag produced.35 In addition, the few landowners who have large trees on their land
35 There is agreement between the results of the charcoal maker surveys and interviews with landowners: both show 50% of landowners demanding payment. In addition, demand for payment appears to be increasing over time, as does the amount that they charge. This may reflect a growing awareness of the value of the trees and shrubs on their land. However, there are still many landowners who do not charge or are not aware that charcoal makers are willing to pay for access rights. Hence, landowners who attempt to squeeze too much out of charcoal makers risk losing them to others. The demand for cleared land is such that

186
may charge charcoal makers for individual trees.36 These exchange relations are summarized
in Table 11.
Landowners rarely exercise close supervision of charcoal makers and interviews with
charcoal makers revealed that it was not uncommon for them to mislead landowners about
the number of bags they produce, in order to decrease the amount of “cess” that they pay.
Similarly, instances were observed in which charcoal makers cut trees that landowners
specifically requested they not touch because those trees make better charcoal.37 In some
cases, landowners name one charcoal maker as a “manager” and give him more favorable
terms in exchange for his vigilance in supervising the other charcoal makers working on a
patch of land; however, given the social ties that may exist between charcoal makers, the
allegiance of the “manager” to the landowner is not guaranteed.
In addition to stipulating the area of land or trees that are to be removed, the terms of
exchange between charcoal makers and landowners also stipulate that stumps of trees must
be removed.38 This is a critical step in clearing land for cultivation. Plowing can not proceed
conditions on the ground still favor charcoal makers in the sense that they can “vote with their feet” in order to find the best arrangement. Some landowners get around this tension by offering additional “benefits” to charcoal makers such as favorable leasing terms to cultivate on plots of land that they clear, favorable housing arrangements, and, possibly, protection from Morani or other threats.
36 Large trees occur in riparian areas or floodplains. Roughly 15% of the landowners interviewed reported selling individual trees in this way, typically A. xanthophloea, which grow quite large (25m height and 1-2m dbh) (Beentje, 1994).
37 O. Africana, was frequently subject to this kind of “poaching”. It is a slow growing tree with extremely heavy wood, valued by the Maasai as a source of dry season fodder, but also an excellent source of charcoal.
38 This holds in every case except when large trees are purchased on an individual basis.

187
until stumps and a good portion of the root mass are removed.39 In addition, most trees
occurring in Narok’s shrubland, including T. camphoratus, the dominant tree cover, coppice
readily. Thus, stumps must be removed in order to preclude future competition between trees
and crops.40
Removal of stumps is not something that charcoal makers would do if it were not required of
them. All felling and splitting of trees is done with manual tools and is extremely labor
intensive. However, uprooting stumps is more so. While it does provide additional wood to
input to the kilns, the marginal gains in production are not worth the added labor.
Charcoal makers often work in loose partnerships of 2-4 people clearing a plot of land from a
particular landowner. Groups such as this may share a common home area or some other
social ties. They often share specific tasks like opening the kiln after it has been fired.
However, the kilns are nearly always considered individual ventures and the charcoal
produced is considered the product of one individual.
Charcoal makers in Narok typically make charcoal in batches of 20-50 bags per kiln.41 With
the exception of large trees purchased individually, all clearance is done with manual tools:
39 Charcoal makers typically remove the root mass to a depth of ~0.5m. Taproots of trees in semiarid or drought prone areas can descend 5m or more, but typically the majority of the root mass (55-85%) is found within 0.5m of ground level (Breman and Kessler, 1995).
40 T. camphoratus sprouts vigorously. Removing stumps to a depth of 0.5m does not prevent sprouting of the remaining root system if land is not plowed over soon after.
41 Kiln size is determined by the quantity and distribution of biomass on the plots of land being cleared. Where vegetation is primarily dense shrubland and evenly distributed over a wide area, smaller kilns are more common. In open woodland with clusters of larger trees, fewer larger kilns are more common. For example, a large A. xanthophloea would likely be carbonized in a single kiln and can yield 100-200 bags of charcoal. 20-50 is the interquartile range of production reported by charcoal makers surveyed in February

188
typically an axe (Swahili: shoka) and a machete (Swahili: panga).42 In areas of dense shrub,
charcoal makers clear about 0.1 ac (400m2) for each kiln. An area typically contains between
9 and 15 trees.43 Cutting trees and uprooting stumps takes roughly 5 person-days.
After cutting and splitting is complete, charcoal makers arrange the kiln. Kiln arrangement
varies in different charcoal producing areas (International Labour Organization, 1985; Foley,
1986). In Narok, kilns are arranged aboveground and are rectangular in shape. The charcoal
maker lays a few well-spaced logs of uniform length to make a foundation for the kiln. These
logs support the additional layers of wood and allow for air and hot gases to circulate
underneath the wood, which is arranged on top. Large logs are then laid perpendicular to the
bottom layer. The kiln is subsequently built up vertically with layers of logs laid parallel to
the second layer. Narrow branches and sticks are used to fill in the gaps so that all layers
except for the foundation are very tightly packed with wood. A typical kiln built in this way
ends up appearing like a trapezoidal prism with a “footprint” of ~10m2 and a height of 1-1.5
m. The average stacked volume of wood in uncovered kilns measured during quantitative
analysis of 10 charcoal kilns was 11.5 m3 ± 4.1 m3 (mean and 95% CI). This sequence of
and March, 2004, which relied solely on recall data from the respondents. The charcoal production that was analyzed quantitatively in March and April, 2005 had a smaller range of 10-23 bags, but the sample size was quite small: only 10 kilns divided among 3 charcoal producers. The wider range is more representative of charcoal production in the area. This and all other data describing quantitative aspects of charcoal production are based on these analyses and are described in full detail in Appendix 5.
42 Power tools are very scarce in the district. When making charcoal from large trees, charcoal makers hire specialized tree cutters with petrol-powered chain saws to cut and split large trees and pay the power saw owners per tank of petrol (gasoline) consumed.
43 This is counting all trees with DBH of 3cm or more. Average DBH of harvested trees was 10.6cm. T. camphoratus typically has multiple stems, so that each tree may have 2 or 3 stems > 3cm DBH. See Appendix 5.

189
steps is shown in Figure 19a-d. Note the entire mass of roots from this sample of T.
camphoratus has been dug up in Figure 19a.
After the wood is arranged, the charcoal maker surrounds it on all four sides by tightly
packed chunks of solid topsoil cut from the ground with a jembe.44 The rows of earth are
built up in layers to the top of the stacked wood, so that all four sides are encased in earthen
walls approximately 0.5 m thick. The charcoal maker then covers the top of the kin with a
layer of thin twigs and leaves set aside from the harvested trees. The leaves and twigs are
covered with sand or soil that is taken from areas where the topsoil has been removed. In all,
arranging and covering the kiln takes roughly 4 person-days to complete. This process is
shown nearly completed in Figure 19e.
Once the kiln is covered, the charcoal maker starts a small fire in a space that was left in the
bottom layer of the earthen covering. This fire is allowed to burn until the charcoal maker is
satisfied that the temperature has increased enough to sustain the carbonization process.
Initially, the kiln emits dense white or grayish-white smoke, which indicates that the
moisture in the wood is being driven off.45 Thick white smoke eventually transitions into
44 This is a very common short-handled hoe with a broad blade that is used for hand tilling across East Africa.
45 Wood is typically not dried prior to firing in the kiln. However, fresh cut wood in a semiarid region tends to have less moisture than wood in temperate or humid areas. Measurements of wood moisture revealed an average moisture content of 24% ± 3% (wet basis: mean ± 95% CI). See Appendix 5.

190
bluish-gray smoke, which indicates that carbonization process is underway. This is
accompanied by a pungent odor of pyrolysis products.46
At this stage the inlet is sealed off. Outside air is no longer needed because the pyrolysis
process is exothermic and self-sustaining (Antal, Mochidzuki et al., 2003). This process
continues, but requires frequent monitoring to ensure the earthen covering remains intact. If
large cracks develop, air can enter the kiln and cause the wood and char within it to fully
combust. Cracks are common because carbonization caused the wood within the kiln to
contract in volume by about 50%, hence the kiln itself collapsed as wood carbonizes. In
addition, the charcoal maker must monitor to ensure that carbonization is proceeding evenly
within the kiln. If he notes a cool spot on the surface of the kiln, he may open an air hole to
direct hot gases to an area that was not carbonizing. Nevertheless, monitoring the kiln does
not require the charcoal maker’s full attention and typically he works on other kilns while
one or more are being fired. Figure 19f shows a charcoal maker tending to a kiln that has
recently been lit. It is clear the kiln is in the early stages of firing because the smoke is
whitish and the shape of the kiln shows no signs of collapse.
When all visible smoke ceases, the wood is fully carbonized. At this time, the charcoal maker
closes any remaining holes in the earthen covering. He may also climb atop the kiln and
tramp down the soil to ensure that the process halts completely because there is still a risk
that the hot char can combust on contact with air.
46 These emissions are volatile compounds driven off of the wood and vented to the atmosphere. This is discussed further in Chapter 5.

191
Figure 19: Steps illustrating the sequence of charcoal production
Source: The author (photos taken during field work, various dates 2004-5)
a b
c d
e f
g h

192
He allows it to cool for approximately one day and then opens it in order to package the
charcoal. The time required to complete the firing process depends on the size of the kiln as
well as the weather.47 The kilns examined in this study, which typically were charged with
~3 tons of wood, took an average of 6-7 days, including the time required for cooling.
After the charcoal cools, the charcoal maker opens the soil covering and separates the
charcoal from the soil using a long handled metal fork (Swahili: uma). This process is often
done with assistance from fellow charcoal makers. Upon bagging, the charcoal is ready for
sale. Figure 19g shows charcoal makers raking the charcoal from a newly opened kiln into
separate piles and Figure 19h shows bags of charcoal ready for pick-up. Often sales
arrangements are settled with brokers or buyers in the early stages of production although
very few charcoal makers consistently sell to the same buyers.48
Other charcoal production systems
In their nationwide study of the charcoal trade, ESD-A (Mutimba and Barasa, 2005b)
categorized charcoal production into four different methods. A second study, which was
limited to several districts of Eastern Kenya, found similar categories of charcoal production
(Mugo and Poulstrup, 2003). The results of both studies are summarized in Table 12.
47 The weather is a factor because carbonization proceeds quite differently under hot dry conditions in comparison to moist rainy conditions. Moist soil creates a better seal around the kiln, which both slows the carbonization process and results in better charcoal yields.
48 The survey of 50 charcoal makers revealed that 18% usually sell to the same buyers while 74% usually or always sell to different buyers (8% did not reply).
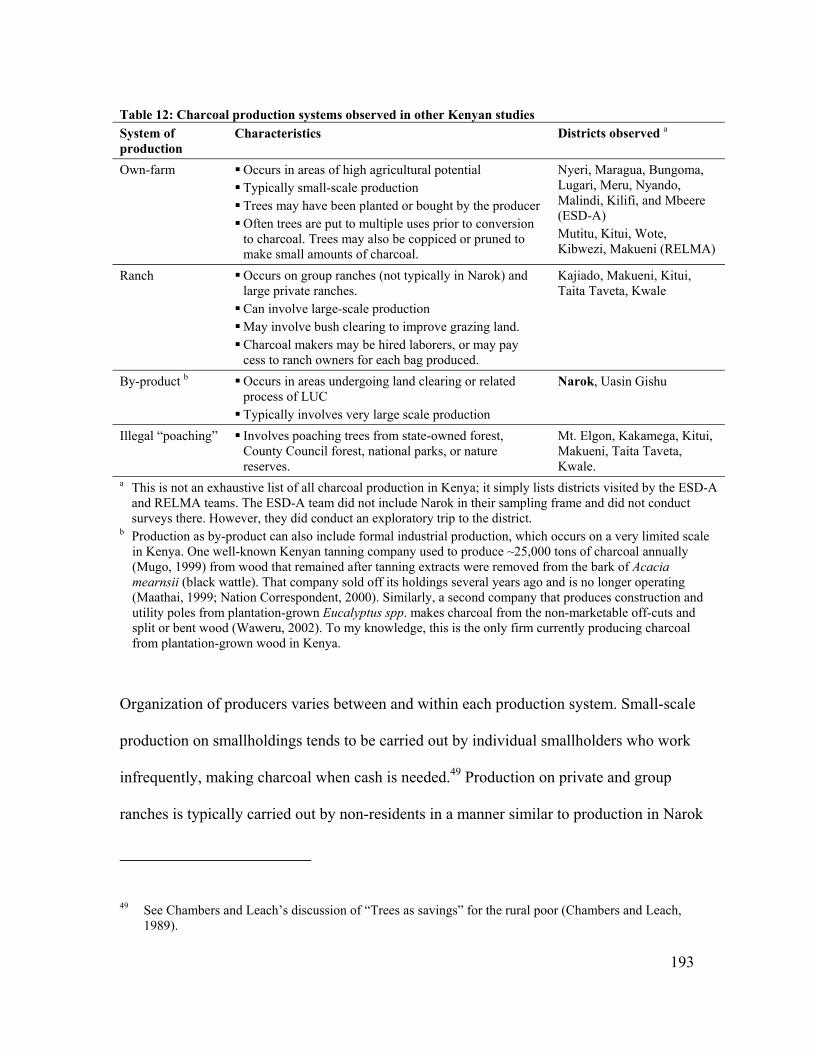
193
Table 12: Charcoal production systems observed in other Kenyan studies System of production
Characteristics Districts observed a
Own-farm Occurs in areas of high agricultural potential Typically small-scale production Trees may have been planted or bought by the producer Often trees are put to multiple uses prior to conversion to charcoal. Trees may also be coppiced or pruned to make small amounts of charcoal.
Nyeri, Maragua, Bungoma, Lugari, Meru, Nyando, Malindi, Kilifi, and Mbeere (ESD-A) Mutitu, Kitui, Wote, Kibwezi, Makueni (RELMA)
Ranch Occurs on group ranches (not typically in Narok) and large private ranches. Can involve large-scale production May involve bush clearing to improve grazing land. Charcoal makers may be hired laborers, or may pay cess to ranch owners for each bag produced.
Kajiado, Makueni, Kitui, Taita Taveta, Kwale
By-product b Occurs in areas undergoing land clearing or related process of LUC Typically involves very large scale production
Narok, Uasin Gishu
Illegal “poaching” Involves poaching trees from state-owned forest, County Council forest, national parks, or nature reserves.
Mt. Elgon, Kakamega, Kitui, Makueni, Taita Taveta, Kwale.
a This is not an exhaustive list of all charcoal production in Kenya; it simply lists districts visited by the ESD-A and RELMA teams. The ESD-A team did not include Narok in their sampling frame and did not conduct surveys there. However, they did conduct an exploratory trip to the district.
b Production as by-product can also include formal industrial production, which occurs on a very limited scale in Kenya. One well-known Kenyan tanning company used to produce ~25,000 tons of charcoal annually (Mugo, 1999) from wood that remained after tanning extracts were removed from the bark of Acacia mearnsii (black wattle). That company sold off its holdings several years ago and is no longer operating (Maathai, 1999; Nation Correspondent, 2000). Similarly, a second company that produces construction and utility poles from plantation-grown Eucalyptus spp. makes charcoal from the non-marketable off-cuts and split or bent wood (Waweru, 2002). To my knowledge, this is the only firm currently producing charcoal from plantation-grown wood in Kenya.
Organization of producers varies between and within each production system. Small-scale
production on smallholdings tends to be carried out by individual smallholders who work
infrequently, making charcoal when cash is needed.49 Production on private and group
ranches is typically carried out by non-residents in a manner similar to production in Narok
49 See Chambers and Leach’s discussion of “Trees as savings” for the rural poor (Chambers and Leach, 1989).

194
described above, although the RELMA report notes that more recently locals are also getting
involved. According to the study, charcoal makers work in groups that either purchase trees
or offer to clear land in order to open areas up for cultivation and/or improved pasture. The
groups consist of 10-20 members who share the labor of clearing trees but assemble kilns
individually. They did not observe any formal organization of producers beyond the
occasional sharing of labor.
Ranch management may take different levels of interest in the charcoal makers that they
host. The RELMA study visited four ranches. In one case, the management monitored
production closely and directed charcoal makers to clear in specific areas. In other cases,
little oversight was evident (Mugo and Poulstrup, 2003).
The by-product production model, which is the model that is most prevalent in Narok, is
typically associated with very large-scale production. This model was also observed in Uasin
Gishu district, a high-potential agricultural area that forms part of Kenya’s “breadbasket”.
The average production volume of individual charcoal makers in Uasin Gishu actually
exceeded that of Narok. Production in Uasin Gishu, which, like Narok, has a great deal of in-
migration, is highly commercialized. 90% of charcoal producers in Uasin Gishu hire
additional labor to work on their kilns and the top producing quartile makes 90 bags or more
per month.50
50 Based on my analysis of ESD-A data. The study surveyed 105 producers in Uasin Gishu.

195
The recent studies also reveal some details about nature of charcoal sales elsewhere in
Kenya. According to the ESD-A study, nearly 40% of charcoal makers have direct access to
consumers.51 The remainder sell to charcoal buyers or traders: a ratio that is quite different
than in Narok, where very few producers have direct access to consumers.
Selling charcoal: the role of brokers, buyers, and transporters
After charcoal is made, a series of other actors enter the commodity chain in order to bring
the product to market. There are four distinct sets of actors involved in bringing charcoal to
consumers: brokers, buyers, transporters, and vendors.52 Each role is described in more detail
below. Similarly, there are three distinct modes of sale for Narok’s charcoal:
1) Direct sale to consumers by the charcoal producer.
2) Sale to buyers who transfer the charcoal locally either through roadside sales or short distance transport to Narok town, where it is transferred to vendors and sold to consumers.
3) Sale for long-range transport through which charcoal is brought to major consumption centers like Nairobi and sold it to vendors who then sell it to consumers.
51 Consumers consist of households (23%), food businesses (13%), social institutions like schools or prisons (2%), and other businesses (2%).
52 During discussions in the field, respondents actually used the English word “broker” to describe that role. The term “buyer” and the term “transporter” are each translations of several different terms that respondents used for these roles. In Swahili, a “buyer” is referred to either as mwenye makaa (the owner of the charcoal) or mnunuzi (literally, one who buys). A “transporter” is referred to either as mwenye lorry (the owner of the truck) or dereva (driver). A “vendor” is muuzaji (person who sells) or mwenye depot (owner of the charcoal depot). The two terms for transporter may reflect two different sets of actors. In some cases, trucks are driven by hired drivers, while in other cases, they are driven by the actual owner of the lorry. Adding additional complexity, the charcoal buyer may be the owner of the lorry. If that is the case he may use a hired driver or drive the lorry himself. Alternatively, if he does not own a lorry, he will hire one from a third party.

196
In detailing the people acting in each particular transfer of charcoal from producer to
consumer, it is notable that several roles may be absent or certain individuals may assume
more than one role. In addition, an individual’s role may change from day to day, or it may
evolve over time, e.g. as the charcoal maker works through the ranks from production to
broker, buyer, and/or vendor.
It is also notable that the third mode of sale represents the largest volume of sales and is the
only means through which charcoal reaches Nairobi. Each mode of sale carries some
importance. Sale for long-distance transport is the primary mode of sale for Narok’s charcoal
makers. However, it is frequently the target of crackdowns by local authorities. Thus,
charcoal producers may fall back on other modes of sale when large-scale commercial
transport is restricted. Each sales method is discussed below, but first, I offer a discussion of
the individual roles people play.
Brokers
Brokers are middlemen who link charcoal makers with buyers. Typically they are most active
in the third mode of sale, although some respondents participating in the second mode also
labeled themselves as brokers. Like the charcoal makers, many brokers are migrants from
outside of Narok and the majority are from the Kikuyu ethnic group. There is also some flux
between the ranks of brokers and charcoal makers. Brokers are closely allied to charcoal
makers and stay well informed of the exact location and timing of charcoal production. This
knowledge is difficult for out of town buyers to obtain because kilns are small and typical
production runs take only 1-2 weeks. In addition, most charcoal makers travel home fairly

197
frequently to carry cash back to their families. Thus, quickly finding charcoal that is ready
for sale is a specialized skill that buyers are willing to pay for.
Buyers and transporters
The distinction between buyers and transporters is not always clear. Buyers purchase
charcoal in Narok and sell it either to retail vendors or directly to consumers. They are
involved in either the second or third mode of sale. Transporters may be involved in buying
and selling charcoal, or they may be third parties simply hired to carry the commodity from
the point of production to the point of sale. In addition, both buyers and transporters should
be disaggregated into those who operate locally and those that buy and/or transport charcoal
long distances. Local buyers and transporters operate at a small-scale, typically buying fewer
than 10 bags per transaction and relying on bicycles, donkeys and pushcarts to transport
charcoal from the point of production to the point of sale. In contrast, long-distance buyers
and transporters use trucks that carry several tons of charcoal. The roles of each group will be
elucidated further in the discussion of modes of sale below. Those who participate in local
sales are consist of a mix of local Maasai and migrants who have settled permanently in the
area, including many former charcoal makers. In contrast, long-distance buyers and
transporters come from out of town. They are typically wealthier businessmen who either
own large vehicles or can afford the outlay of cash to hire them, in addition to the farm-gate
price of 2-300 bags of charcoal as well as the bribes that are necessary to move large
amounts of charcoal through numerous roadblocks between Narok and Nairobi. The actual
costs of these outlays are discussed in detail below.

198
Modes of sale
The first mode of sale is essentially a vertically integrated supply chain, albeit a very short
one. Selling directly to the consumer allows the producer to avoid dealing with middlemen
like brokers and buyers and obtain maximum returns for his charcoal. However, this is not
common in Kenya because such exchanges require that producers have direct access to
consumers, which they rarely have. Charcoal consumers live primarily in urban areas or in
specific rural areas where charcoal markets have developed (Ministry of Energy, 2002).
Charcoal consumers throughout Kenya can only be reached through roadside sales in
charcoal producing areas or in retail markets in urban and peri-urban centers. Therefore, in
Narok, only those charcoal makers who have access either to land along Narok’s three main
transportation routes, retail markets in Narok town, or long distance urban markets are able to
reach consumers directly.
No cases of direct access to long distance urban markets or markets in Narok town were
observed. Thus, direct sales to consumers only occurred where the charcoal maker was a
Maasai producing charcoal on family land adjacent to a main road. Of the 50 charcoal
makers surveyed, 3 satisfied these conditions: 6% of the total sample. A fourth Maasai
landowner brought his own charcoal to Narok town, where he sold it to retailers. The
remainder, who do not have direct access to consumers, go through intermediaries, which is
discussed further below.

199
Figure 20: Means of local charcoal transport: donkeys with and without a donkey cart (mkokoteni).
Source: Author’s photos taken in August/September 2004

200
The second mode of sale is somewhat more common. 24% of charcoal makers surveyed in
early 2004 reported that they sell to buyers who resell charcoal locally.53 In this mode,
charcoal makers sell to local buyers who have access to consumers either through roadside
sales or in Narok town. These buyers either rely on their own transport or hire transporters.
Mechanized transport is rarely used for local sales. Charcoal is carried from the point of
production by bicycle or donkey, thus sales are limited to a fixed distance from Narok town
and the few paved roads in the district. Donkeys are limited to about 5 km of off-road travel
(using dirt tracks and rough footpaths) and/or 15km of travel on paved roads carrying 2 bags
of charcoal (a total load of 70-80kg). Bicycles have the same limitations with about half that
load. Donkey carts (Swahili: mkokoteni) are also used for local sales. In these carts, a single
donkey can haul up to 12 bags of charcoal (more than 400-500kg), but some of the rougher
terrain that individual donkeys can easily pass through is impassable by donkey carts.
Typically, buyers reserve charcoal from a charcoal maker before the kiln is fully complete.
Sales volumes are rarely more than a the contents of a single kiln. This is in contrast to the
third mode of sale, in which producers may sell the contents of several kilns to a single
buyer. Figure 21 shows the distribution each main customers or modes of sale and Figure 22
shows the volume per exchange reported by charcoal makers practicing each mode of sale.
53 Although a second survey was not conducted, a follow up visit in early 2005 indicated that this proportion had probably increased due to the heavy restrictions on long-distance transport.

201
Figure 21: Distribution of main customers among charcoal makers surveyed in Narok
0%
20%
40%
60%
80%
Direct sales toconsumers
Buyers who selllocally
Buyers who sell inanother place
Buyers who selllocally and in another
place
Figure 22: Frequency distribution of charcoal makers selling to different types of buyers disaggregated by sales volume per transaction
80
60
40
20
0They sell locally and
in another placen = 2
Buyers who sell in another place
n = 32
Buyers who sell locally
n = 9
Household consumers
n = 3
Perc
ent
resp
ondi
ng
No. of bags
1-2
5-10
10-20
>20
80
60
40
20
0They sell locally and
in another placen = 2
Buyers who sell in another place
n = 32
Buyers who sell locally
n = 9
Household consumers
n = 3
Perc
ent
resp
ondi
ng
No. of bags
1-2
5-10
10-20
>20

202
From these figures it is evident that the third mode of sale is the most common and is
associated with the highest volume of sales among the charcoal makers surveyed. In this
mode, charcoal makers sell large volumes of charcoal to buyers for long distance transport to
high-demand markets like Nairobi. Buyers for long-distance transport rely heavily on the
local knowledge of brokers to link them with producers. Transport is done by large trucks or
lorries, one of which carries between 200 and 350 bags of charcoal depending on the size.
Figure 23 shows a typical lorry that has just been loaded. This vehicle is carries about 250
bags.54
Figure 23: Charcoal lorry leaving Narok District for Nairobi
Source: the author (March, 2004)
54 This type of lorry, called a “Fighter” by people in the charcoal trade, is the most common means of long distance transport. Notice the tarp that the workers are pulling over the lorry from the back. This is meant to hide the load so that the lorry is indistinguishable from vehicles carrying less controversial commodities. Reasons for this are discussed in more detail below.

203
Brokers seek out large concentrations of charcoal production, where several charcoal makers
are working adjacent to each other. Brokers bring buyers and/or transporters to these sites
where they typically buy the charcoal from the entire group of producers. This may total 100-
200 bags from a single production run. Buyers purchase the charcoal and pay the brokers a
fixed price for their services. This is typically 2000-2500 KSH for a full lorry-load of
charcoal and includes payment for additional laborers who are brought along to load the
charcoal. These additional laborers may be charcoal makers or other brokers who are idle for
the day. They are paid 3 KSH per bag loaded. In total, the cost of loading comes to about 750
KSH, which is drawn from the money paid to the broker.
Transport from Narok to Nairobi
Once the lorry is loaded, the charcoal is ready for transport. Nairobi is the most common
destination of Narok’s charcoal. At the height of Narok’s charcoal activity, when no
restrictions on transport are in place, as many as 20 lorries per day make the run between
Narok and Nairobi. When restrictions are heavily enforced, the number of lorries can drop to
fewer than five. In addition, when authorities crack down, buyers change tactics and rely on
other sources of transportation. Several buyers told how they rely on small fully enclosed
trucks commonly used to transport bread, flour, or similar commodities. These Nairobi-based
vehicles make their deliveries to Narok town or other towns further along the main road
through Narok district. They are vehicles owned by any number of firms in Nairobi with a
hired driver who is supposed to make a delivery and return to Nairobi with an empty truck.
Charcoal buyers approach drivers of these types of vehicles in Narok town, which, as the
only town for several hours in either direction, is a popular stopping point. They make deals

204
with the drivers of these vehicles to carry charcoal to a point on the edge of Nairobi.
Although they carry fewer bags, these company vehicles have an advantage because they
truly hide their cargo. Transporters indicated that authorities manning traffic checkpoints are
not fooled by covered lorries like the one shown in Figure 23 and insist on checking inside
them. However, they often allow bread trucks and similar vehicles to pass without checking
inside.55
Their position at traffic checkpoints allows certain authorities to capture substantial benefits
from the charcoal trade. Between Narok and Nairobi, a distance of about 140 km, there are
10-15 traffic checkpoints manned by a range of different national and local authorities. The
nature and magnitude of the benefits that they capture depend on whether there is a ban on
charcoal transport in effect and, when it is in effect, the degree to which authorities are
enforcing the ban. These complexities will be described in detail in the following chapter,
which explores the distribution of benefits along the commodity chain.
Supply chains originating from other charcoal producing areas in Kenya
The ESD-A study explored the role of charcoal buyers and transporters in charcoal supply
chains elsewhere in Kenya. The team surveyed all types of transporters from small-scale
55 However, unmolested passage is not guaranteed and the drivers take a risk by accepting to transport charcoal, particularly because the owner of the truck, typically a Nairobi-based firm, is not aware of the drivers’ activities. He could easily lose his job if he is caught. Similarly the truck can be impounded. There are two different terms of exchange that are worked out between these drivers and charcoal buyers. In one, the buyer pays the driver 50-60 KSH per bag that is transported and the buyer deals with any bribes that need to be paid to authorities at checkpoints. In the second variation, the buyer pays the driver 100 KSH per bag and the driver is responsible for dealing with authorities (this particular choice of exchanges with illicitly hired vehicles was described in interviews conducted in Narok January 25, 2005 and August 15, 2003).

205
operators using bicycles and wheelbarrows to large-scale long-distance lorry operators. This
discussion will focus only on their findings concerning long-distance transporters using
trucks or lorries.56 Among the transporters who ship charcoal by lorry, the average volume
per trip is 138 bags. Those who ship primarily to Nairobi ship a higher volume, with an
average of 170 bags. Interestingly, transporters from Narok and Uasin Gishu, the two source
areas that ESD-A identifies with charcoal production as a by-product of land clearance (see
Table 12), report significantly higher shipping volumes than transporters shipping from the
rest of the areas surveyed (p < 0.05), with the average volume per lorry exceeding 200
bags.57 Shipping for all lorry transporters, transporters supplying Nairobi and transporters
shipping from a selection of districts are shown in Table 13.
Additional characteristics of transporters revealed by the ESD-A survey relate to business
relationships such as vehicle ownership and charcoal ownership. These will be discussed
further in Chapter 5, where the distribution of benefits is delineated in more detail.
56 The ESD-A survey conducted 859 surveys of charcoal transporters. Of these, 180 were lorry operators and 54 of these were shipping charcoal to Nairobi. Note, these proportions should not be seen as representative of the overall population of charcoal transporters, which remains largely conjecture. As was discussed in the methods section of Chapter 2, the ESD-A team could only guess at the number of charcoal transporters nationally, thus they designed a clustered sampling frame based on district-level population figures from the latest census (Government of Kenya, 2001). Moreover, by their own admission, the ESD-A team found lorry operators difficult to survey and may have oversampled small-scale transporters relative to large-scale ones (Mutimba, 2005).
57 These areas are also associated with higher monthly shipping volumes. This indicates that transporters in other areas do not compensate smaller shipping volumes with more frequent trips. This is also consistent with producer data, which shows that average production in these areas is higher than other areas.

206
Table 13: Shipping volumes per trip reported by long distance transporters surveyed by ESD-A Area No. surveyed Mean no. of bags Median no. of bags All transporters 146 137 100
Transporters shipping to Nairobi a 46 170 150 Transporters shipping from Kitui 34 137 105 Transporters shipping from Narok 15 221 200 Transporters shipping from Uasin Gishu 13 221 200 Transporters shipping from all districts except Narok and Uasin Gishu
114 118 100
a Transporters shipping to Nairobi include all of the transporters from Narok as well as transporters from other areas (see Table 14). Notably, none of the Uasin Gishu transporters surveyed serve Nairobi (although there is anecdotal evidence of some charcoal from that area reaching the capital. According to survey data, charcoal from Uasin Gishu is supplied to Eldoret, which lies in that district and is the 5th largest city in Kenya, as well as other Western Kenyan towns like Bungoma and Kakamega (based on the author’s analysis of ESD-A survey data).
The RELMA study in Eastern Kenya also describes some characteristics of the supply chains
that bring charcoal produced in those districts to markets in Nairobi or Mombasa.58 As in
Narok, charcoal can pass through several groups of actors before it reaches the point of
consumption. In some instances brokers are used, while in other instances charcoal makers
themselves are able to market their own product to retailers. Production at larger scales in
Eastern Kenya mirror production in Narok in that the charcoal is typically sold at the site of
production to long-distance transporters. The charcoal makers receive a lower price, but are
able to move larger volumes (Mugo and Poulstrup, 2003).
58 Mombasa, Kenya’s second largest city, lies on the coast and, like Nairobi, represents a major source of demand for charcoal. Two of the four districts covered by the RELMA study lie between Nairobi and the coast. They have supply chains that run in both directions, but favor Nairobi. Two other districts are closer to Mombasa, which is the destination of the majority of the charcoal produced there (Mugo and Poulstrup, 2003).

207
Charcoal vendors
Upon reaching Nairobi, a second set of brokers are often engaged by the charcoal
transporters in order to link them to retail vendors. As in Narok, brokers in Nairobi maintain
a store of local knowledge about which charcoal retailers are in need of charcoal. Nairobi is a
sprawling city of over two million people with dozens of residential “estates”.59 Charcoal
arrives in the city from three or four different directions, making it difficult to know which
markets have demand on any given day.60 Charcoal is sold in every corner of Nairobi; some
of the very high density slum areas like Kibera and Kangemi may have dozens of vendors.
The buyers and transporters interviewed in this study note that they often return to the same
few estates, but that they will sell in any area where demand exists. Similarly, about two-
thirds of Nairobi charcoal vendors report buying from a few regular suppliers.61
Charcoal vendors in Nairobi can be classified in a number of ways.
Volume of sales: ranges from a few bags to several hundred bags per month.
59 The latest census, conducted in 1999, enumerated 2.14 million people (Government of Kenya, 2001). However, this figure was much disputed at the time as too low. All classes of Nairobi’s residential areas are called “estates” regardless of their living standards.
60 A survey of charcoal vendors conducted as part of this research in early 2004 indicated that Nairobi’s charcoal is supplied from Ukambani in the East, Kajiado in the southeast, Narok in the West and Laikipia and Nyahururu in the northwest. These areas are served by three main roads running into Nairobi: the Mombasa Road which runs into town from the northwest and southeast and the Thika Road enters the north end of town and serves central Kenya. In addition, there are a series of lesser traveled roads that charcoal transporters may use such as the Magadi Road that runs directly south into a remote part of Kajiado district.
61 This and other data concerning charcoal vending in Nairobi are based on the results of the ESD-A study The results discussed here reflect responses from surveys carried out in Nairobi, where 118 vendors were surveyed in two of Nairobi’s 8 divisions containing roughly 25% of the city’s population. See (Mutimba and Barasa, 2005b) for a summary of the national results.

208
Location of the vending site: varies from dedicated charcoal yards (often called
“stores” or “depots”) to multi-purpose markets, small shops (Swahili: duka), and
roadside hawkers.
Main customers: includes households, small businesses, and other charcoal vendors.
The distribution of charcoal vendors and their average sales volume is shown in Figure 24-
Figure 26 below.62 Figure 24 shows the frequency distribution of sales volume among the
entire sample of vendors surveyed by the ESD-A team. Figure 25 shows the distribution of
vendors disaggregated by the type of vending site from which they operate as well as the
average sales volume of each group. Figure 26 shows the same data disaggregated by
primary customers.
Figure 24: Nairobi charcoal vendors – monthly volume of sales (sacks of charcoal)
0
10
20
30
40
50
0-24 25-49 50-74 75-99 100-124 125-149 150-174 175-199 200 ormoreBags of charcoal per month
Freq
uenc
y of
resp
onse
Source: based on author’s analysis of data provided by ESD-A
62 Not all vendors sell charcoal strictly by the sack. Many divide sacks into tins of various sizes. The data in this figure are derived from the sales volume of different sizes of tins that have been converted to “sack equivalents” based on empirical measurements conducted as part of the ESD study (Mutimba and Barasa, 2005b). In addition, these plots may include some double counting, because they does not differentiate charcoal makers who buy charcoal bags from other vendors, divide it into smaller units of sale and resell it. Thus, they should not be considered an indication of total sales.
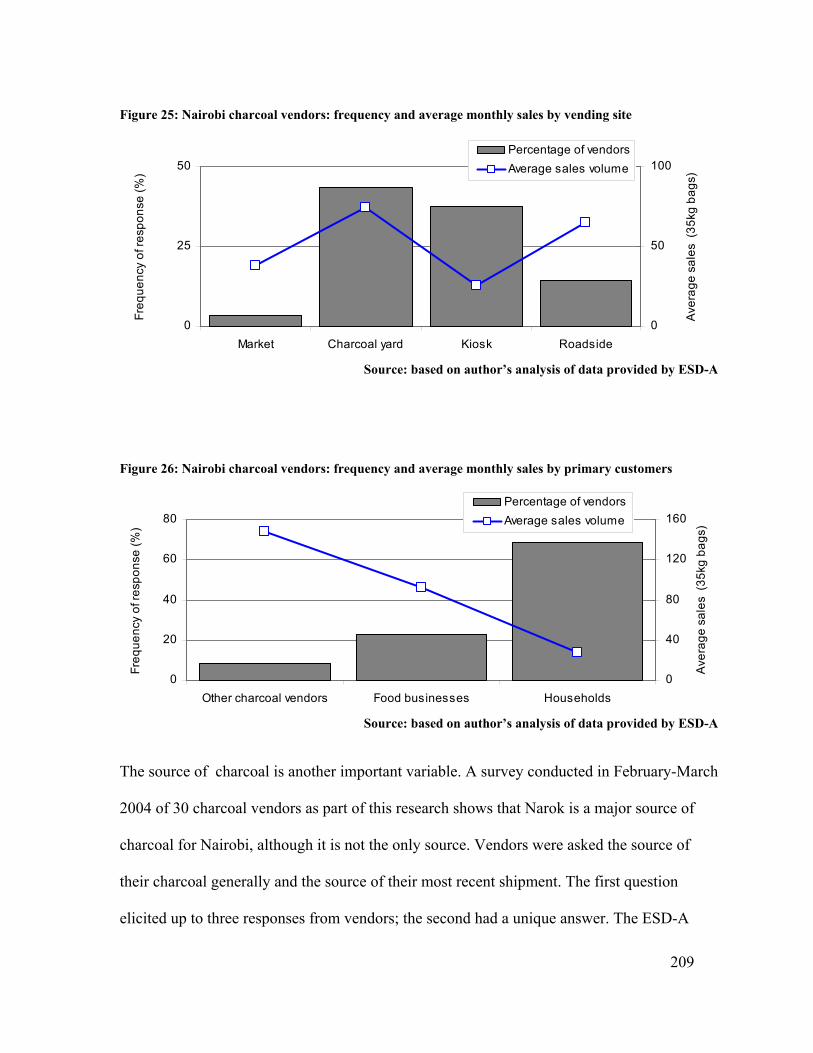
209
Figure 25: Nairobi charcoal vendors: frequency and average monthly sales by vending site
0
25
50
Market Charcoal yard Kiosk Roadside
Freq
uenc
y of
resp
onse
(%)
0
50
100
Ave
rage
sal
es (
35kg
bag
s)
Percentage of vendorsAverage sales volume
Source: based on author’s analysis of data provided by ESD-A
Figure 26: Nairobi charcoal vendors: frequency and average monthly sales by primary customers
0
20
40
60
80
Other charcoal vendors Food businesses Households
Freq
uenc
y of
resp
onse
(%)
0
40
80
120
160
Ave
rage
sal
es (
35kg
bag
s)
Percentage of vendorsAverage sales volume
Source: based on author’s analysis of data provided by ESD-A
The source of charcoal is another important variable. A survey conducted in February-March
2004 of 30 charcoal vendors as part of this research shows that Narok is a major source of
charcoal for Nairobi, although it is not the only source. Vendors were asked the source of
their charcoal generally and the source of their most recent shipment. The first question
elicited up to three responses from vendors; the second had a unique answer. The ESD-A

210
team did not pose these questions to vendors; however, they did pose a similar set of
questions to transporters making deliveries in Nairobi during the same two-month time
period. The results of both surveys are shown in Table 14.
Table 14: Source of charcoal arriving in Nairobi charcoal in Feb-March 2004
Author’s survey of charcoal vendors
ESD-A survey of charcoal transporters Area of origin
General source of charcoal
n=29 (up to 3 responses)
Source of most recent shipment
n=27 (single response)
Primary source of charcoal n=49 (single
response)
Secondary sources of charcoal
n=38 (up to 3 responses)
Source of current
shipment n=51 (single
response)
Narok 44% 70% 33% 17% 31%
Kitui 35% 22% 35%
Makueni 6% 13% 4%
Machakos 8% 7% 8%
Mwingi 8% 19% 10%
Ukambani a 38% 22% 57% 61% 57%
Kajiado 5% 4% 2% 13% 4%
Laikipia 10% 0% -- -- --
Other b 4% 4% 8% 10% 8% a Ukambani is a large area in Eastern Kenya and encompasses the four districts listed above it. The author’s
study did not distinguish among the four districts. b In the author’s survey, “Other” includes Nakuru and Taita Taveta districts. In the ESD-A survey, “Other”
includes Nakuru, Nandi, Mombasa and Thika districts.
The results of the ESD-A survey differ from the results of the survey conducted as part of
this field work. However, data was collected from different groups of actors in the
commodity chain, so the results should not be compared directly. Nevertheless, some
generalizations can be drawn from both sets of data. Each agree that, in early 2004, Nairobi’s
charcoal came primarily from two areas. The ESD-A data show that the majority of
transporters supply charcoal from Ukambani – a large area in Eastern Kenya encompassing

211
four districts. Ukambani was the second most frequently cited supply area from the vendors’
survey carried out as part of this research. Narok is the second most frequently cited source
in ESD-A study and the most frequently cited area in the vendors study. The map in Figure
27 shows the location of districts supplying charcoal to Nairobi. The circles show distance
from the city center in 50 km intervals.
Figure 27: Districts supplying charcoal to Nairobi
#
Narok and Trans Mara
#
Kajiado
#
Laikipia
#
Kitui and Mwingi (Ukambani)
TaitaTaveta
#
NairobiCity Centre
100 0 100 200 Kilometers
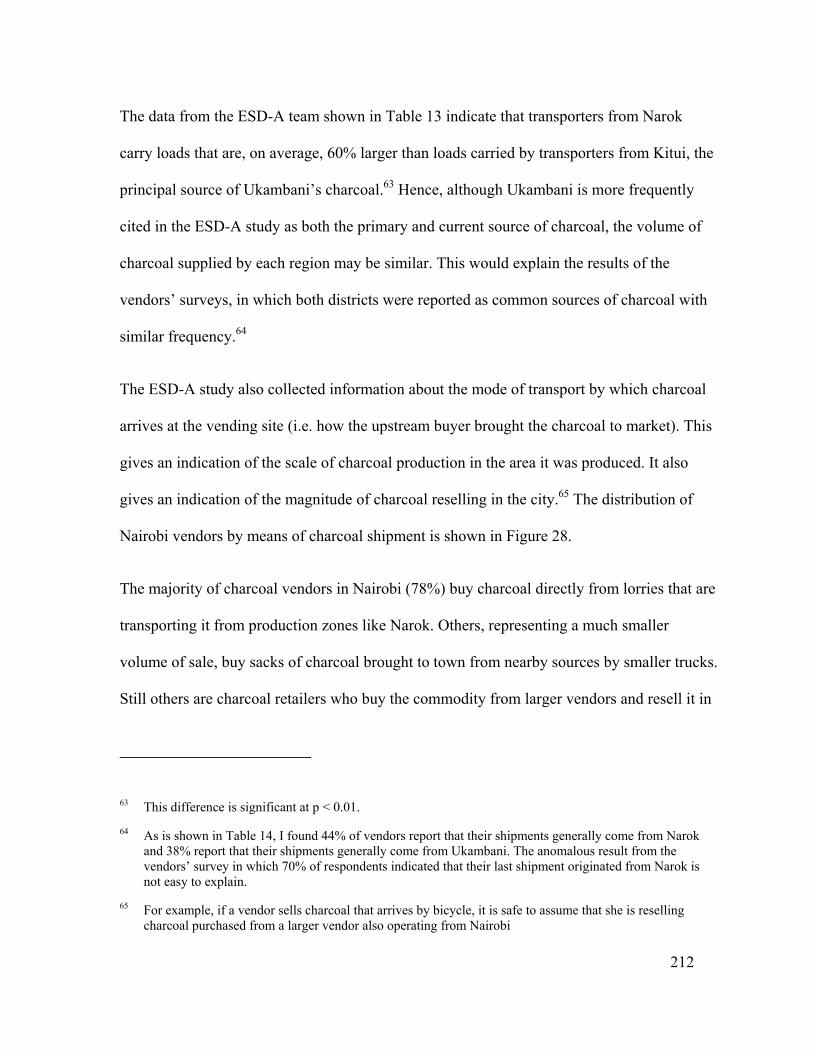
212
The data from the ESD-A team shown in Table 13 indicate that transporters from Narok
carry loads that are, on average, 60% larger than loads carried by transporters from Kitui, the
principal source of Ukambani’s charcoal.63 Hence, although Ukambani is more frequently
cited in the ESD-A study as both the primary and current source of charcoal, the volume of
charcoal supplied by each region may be similar. This would explain the results of the
vendors’ surveys, in which both districts were reported as common sources of charcoal with
similar frequency.64
The ESD-A study also collected information about the mode of transport by which charcoal
arrives at the vending site (i.e. how the upstream buyer brought the charcoal to market). This
gives an indication of the scale of charcoal production in the area it was produced. It also
gives an indication of the magnitude of charcoal reselling in the city.65 The distribution of
Nairobi vendors by means of charcoal shipment is shown in Figure 28.
The majority of charcoal vendors in Nairobi (78%) buy charcoal directly from lorries that are
transporting it from production zones like Narok. Others, representing a much smaller
volume of sale, buy sacks of charcoal brought to town from nearby sources by smaller trucks.
Still others are charcoal retailers who buy the commodity from larger vendors and resell it in
63 This difference is significant at p < 0.01.
64 As is shown in Table 14, I found 44% of vendors report that their shipments generally come from Narok and 38% report that their shipments generally come from Ukambani. The anomalous result from the vendors’ survey in which 70% of respondents indicated that their last shipment originated from Narok is not easy to explain.
65 For example, if a vendor sells charcoal that arrives by bicycle, it is safe to assume that she is reselling charcoal purchased from a larger vendor also operating from Nairobi

213
smaller units of sale.66 The practice of breaking down charcoal for sale in this way will be
explained further in the section that explores the distribution of benefits from the trade.
Figure 28: Distribution of the means of charcoal transport to Nairobi charcoal vendors (n = 118)
0
20
40
60
80
100
lorry pickup public wheelbarrow bicycle
Freq
uenc
y of
resp
onse
Source: based on author’s analysis of data provided by ESD-A
Charcoal buyer-transporters from Narok do not typically return to the same retail vendors
every time they arrive in town because most vendors’ sales are fairly low in volume relative
to the amount of charcoal carried by a single lorry. Considering for a moment only the
vendors who buy charcoal from lorries, 66% report that they buy it on a weekly basis. An
additional 22% buy it less frequently than that. On average, these vendors purchase 19 bags
per transaction and sell roughly 50 bags per month.67 However, there are a small number
(4%) who claim to purchase 100 or more bags with every transaction. Similarly, roughly
66 A small number of Nairobi vendors (~3%) surveyed by the ESD-A team report that they supply their own charcoal for sale. This was also reported by one of the 30 vendors surveyed as part of this study.
67 In many cases, the amount that vendors purchase on a monthly basis does not balance with the amount that they sell. The survey was designed in such a way that questions were posed generally, rather than for a specific time period, which may account for some of the discrepancy. In addition, 81% of vendors buying directly from transporters report that they store some charcoal, which might also account for the imbalance.

214
10% sell over 100 bags per month. The majority of charcoal vendors selling 100 bags or
more per month are those who act as distributors by reselling charcoal to other vendors as
well as those who sell primarily to food businesses. Table 15 shows how sales breakdown
among charcoal vendors with different primary customers.
Table 15: Charcoal sales among Nairobi vendors by primary customer Main customer Count Median monthly
sales (35 kg bags) Mean monthly
sales (35 kg bags) Percent of vendors
selling over 100 bags per month
Households 81 24 32 1% Other charcoal vendors 10 70 136 20% Food businesses 27 28 75 11%
All vendors 118 27 49 1%
Among Nairobi charcoal vendors, those vendors who act as distributors selling to smaller
scale retailers have the highest volume of sales. The sales volume of vendors selling
primarily to food businesses is also higher than the average. Importantly, all of the groupings
are right-skewed distributions, indicating that there are a small fraction of vendors in each
category who sell disproportionately larger quantities of charcoal than the average vendor.
This has implications for the horizontal distribution of benefits within each group of actors in
the commodity chain, which is discussed in further detail in Chapter 5.
Charcoal consumers
As is illustrated in Figure 26 above, vendors in Nairobi sell to a range of customers. Among
all vendors, residential consumers are the most common source of sales, followed by food
businesses. Vendors who sell to other charcoal vendors constitute the smallest group,
although they sell higher volumes of charcoal than the other groups. These categorizations

215
are not mutually exclusive; i.e. vendors who sell primarily to food businesses also very likely
sell to household consumers. Thus, the data presented thus far do not indicate the quantity of
charcoal sold to any particular group of consumers. Nor do they indicate any explicit details
about consumption.
Fortunately, energy consumption in households and small enterprises was the subject of a
recent study conducted by the Kenyan Ministry of Energy (MoE) and Central Bureau of
Statistics (CBS) (Ministry of Energy, 2002). The results of the MoE study were made
available for this research and provide important insights into the nature of charcoal
consumption in Nairobi, to which Narok is an important contributor.68
Figure 29 shows the breakdown of charcoal consumption among different groups of
consumers in Nairobi in 2001. According to the MoE study, nearly 90% of the 266,000 tons
of charcoal consumed in 2001 was consumed by the residential sector. The remainder was
consumed by “cottage industries”, which are essentially the same as the “food businesses”
68 The study, which was described briefly in Chapter 2, was a national survey of energy demand among households and cottage industries conducted in early 2001 (Ministry of Energy, 2002). As was discussed in Chapter 1, conventional wisdom holds that charcoal is an “urban fuel”. While it is certainly true that charcoal is a popular urban fuel (82% of urban households nationwide regularly use charcoal) it is increasingly used in certain rural areas as well. The use of charcoal in rural areas reflects a larger blurring of what constitutes urban space in sub-Saharan Africa. In many contexts, the rural-urban dichotomy is weak. Rural practices are not constant and, over time, many so-called urban practices, including charcoal use for household energy needs, become rural practices as well. In 2001, over one-third of Kenya’s rural population used charcoal in quantities that, on average, match their urban countrymen. Acknowledging this important caveat, the analysis of consumption in this study will focus specifically on Nairobi, which is the terminus for the majority of charcoal made in Narok. The MoE study surveyed 170 households in 17 clusters as well as 89 businesses within Nairobi and this subset of their surveys forms the basis for most of this section.

216
referred to in the ESD-A study.69 In addition, the results of the MoE study can be
disaggregated by income strata, which is also shown Figure 29.
Figure 29: Charcoal consumption in Nairobi (2001)
14%
62%
24%
High IncomeMedium IncomeLow Income
Households only235,000 tons
12% 88%
Cottage IndustryHouseholds
Households and Cottage Industry 266,000 tons
Source: author’s analysis of data from the MoE study (Ministry of Energy, 2002)
Charcoal is used by all income strata in Nairobi, which has important implications for the
country’s energy policy. The conventional wisdom that households move up the “energy
ladder” as they become more wealthy, foregoing solid fuels in favor of liquid and gaseous
fuels or electricity, which are thought to be preferable because they burn more cleanly, is not
necessarily supported by empirical evidence.70
69 The MoE study was national in scope, and defined “cottage industries” more broadly to include grain millers, tobacco curing, brick making, milk processing, fish processing, small-scale sugar processing, bakeries, and restaurants. The majority of these industries are based in rural areas or, if they are based in Nairobi, use electricity as a primary source of energy (e.g. grain milling and milk processing in the city). Only the latter two are relevant for charcoal consumption in Nairobi. Thus, in this context, the MoE’s “cottage industries” are essentially the same as the “food businesses” referred to in the ESD-A study.
70 See (Leach, 1992) for an early treatment of the energy ladder hypothesis. See (Masera, Saatkamp et al., 2000) for a recent critique of the simplified way in which the model has been applied in policy analyses.

217
The majority of charcoal is consumed by households in the lowest income group, which
constitutes 66% of households in the city.71 In addition to being a critical fuel for the poor,
charcoal is also a fuel used by middle class and wealthy households. A simple cross-sectional
analysis of per household charcoal consumption reveals that consumers treat charcoal as a
“normal good”, consuming more at higher levels of income.72 This is illustrated in Figure 30,
which shows average charcoal consumption among households that use charcoal
disaggregated by income groups. The graph shows data from Nairobi together with data from
all urban areas.73 In both cases, average household consumption increases with higher
income. In addition, the data show that each income group in Nairobi consumes more than
average consumption countrywide.74
71 The income stratifications defined by the MoE study do not match other categorizations of wealth used in Kenya. For example, at the poverty level defined by the GoK, the incidence of poverty in Nairobi is 44% (Central Bureau of Statistics, 2003). In contrast, the MoE study defines low-income households as those with an monthly income of less than KSh 24,000, which captures 66% of households surveyed in Nairobi. The middle income group was defined by households with an monthly income between KSh 24,000 and 96,000 and accounts for 26% of Nairobi households. The higher income group earns over KSh 96,000 monthly and includes 8% of urban households.
72 Other research also confirms that charcoal is treated by Kenyan consumers as a normal, if not a luxury good. For example, using 1995 cross-sectional survey data, Nyang categorized households by fuel mix and found that expenditure elasticity of demand for charcoal ranges from 0.92 to 1.36 depending on the mix of fuels used in conjunction with charcoal. Results in three out of four groups were significant with 99% confidence (Nyang, 1999).
73 Urban areas covered in the MoE survey include the five largest cities in Kenya: Nairobi, Mombasa, Eldoret, Nakuru, and Kisumu.
74 The analysis of Nairobi data (n=170) excluded 16 outlying households in which daily per capita charcoal consumption exceeded 10 kg based on the MoE’s raw data. Consumption at such a level is extremely unlikely, particularly among poor households for whom it would constitute 40-50% of monthly income.

218
Figure 30: Charcoal consumption among urban charcoal-using households stratified by income group
-
600
1,200
Low Income Medium Income High Income
kg c
harc
oal p
er h
h-ye
arNairobi
All urban
Source: author’s analysis of data from the MoE study (Ministry of Energy, 2002)
Despite consuming larger quantities, wealthier households typically pay lower unit prices for
charcoal because they buy it in larger units of sale.75 Charcoal vendors sell charcoal in units
of sale that range from the 35kg sacks to large tins roughly 7 or 8 kg in mass (called debe in
Swahili) and smaller tins 1-2 kg in mass (called mikebe as well as other names that vary
locally). Figure 31 shows the different units of sale commonly purchased by households of
different income strata with a clear tendency for better-off households to purchase larger
units of sale.
Smaller units of sale have higher markups so that the cost to the consumer per unit of
charcoal increases in inverse proportion to the size of the sales unit. Poor households are at a
disadvantage because they tend to buy charcoal in the smallest quantities available. It is
75 This patterns holds for most household energy products with the exception of electricity, which is priced at a “lifeline tariff” so that the initial 50 kWh per month are cheaper than units consumed over 50kWh (Ministry of Energy, 2002).

219
common for low income households to buy a single tin of charcoal for 20 KSH every day
because they can not afford the large outlay of cash required for a full sack. The unit price for
a small tin is over 20% higher than the unit price of charcoal when it is bought by the sack.
Table 16 shows the mass, price, and unit price for each common unit of sale as well as the
markup for smaller units relative to the retail cost of the charcoal bag.
Figure 31: Form of charcoal purchase by residential consumers in Nairobi stratified by income group
0%
50%
100%
low middle high
SackDebeTin
Source: author’s analysis of data from the MoE study (Ministry of Energy, 2002)
Table 16: Common units of sale for charcoal sold in Nairobi Unit of sale Approximate mass
(kg) Price per unit
(KSH) Price per kg
(KSH) Markup relative to
sack of charcoal (%) a
Tin 1.8 24 14.1 23% Large tin 7 90 12.9 13% Sack 35 399 11.4 NA
a The markup does not include the price of additional packing because in any sale, consumers are expected to provide their own means to carry the charcoal from the vending site. When bought by the sack, an empty sack is often brought in exchange, or the consumer pays an additional 30 KSH. For smaller units of sale, plastic bags are common,, but these too must be purchased at extra cost to the consumer.
The MoE study also provides some insight into how charcoal is used within the household.
Although it is primarily considered a cooking fuel, charcoal is put to a range of uses, most of
which fall within the sphere of domestic production carried out by women (Johnson, 2004).

220
In addition, though charcoal use is uniformly high among all income groupings, the end-uses
to which charcoal is put vary considerably between income groups. This variation is likely a
result of the degree to which households within each group have access to substitute
technologies. Figure 32 shows the fraction of charcoal-using households within each income
group using the fuel for a range of domestic energy applications. As the figure indicates,
cooking is an important use of charcoal for all groups.76 However, the use of charcoal falls
off considerably among better off households for all other applications. Thus it appears that
other sources of energy are substituted for charcoal, leading to a reduction in reliance on
charcoal for non-cooking activities as household income increases. It is possible that cooking
is slower to receive an energy “upgrade”. This contention is supported by sociological studies
of household energy resource allocation, which show that cooking is relegated a minimal
amount of resources in comparison to other sectors of household production (Annecke, 2000;
Wamukonya, 2004). One study conducted in a small Kikuyu town in Central Kenya put it
very succinctly:
Women explained that while a man will be interested in building a house, he would not be concerned with buying what goes inside it. While some men expect those things to be there even though they will never buy them, others will not care…(Johnson, 2004, p. 1369).
76 Note, this does not imply that these households use charcoal exclusively. Moreover, the MoE survey made no attempts to disaggregate fuel consumption among different end uses.
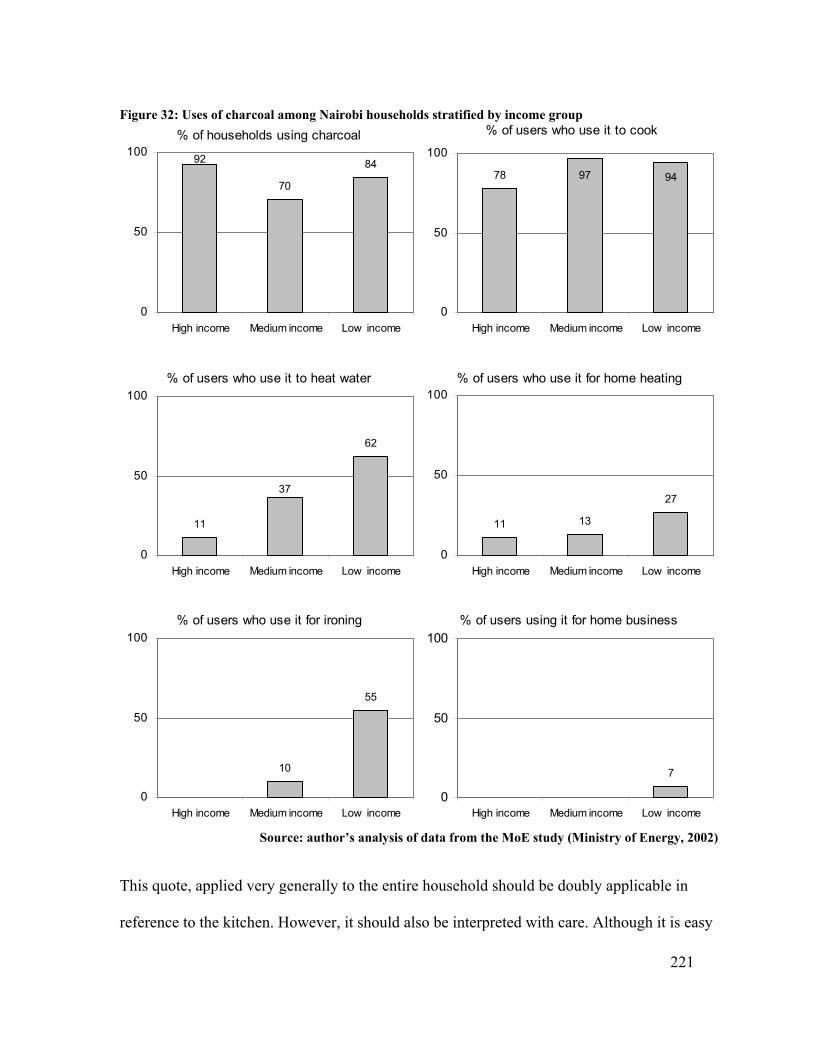
221
Figure 32: Uses of charcoal among Nairobi households stratified by income group % of households using charcoal
70
8492
0
50
100
High income Medium income Low income
% of users who use it to cook
78 9497
0
50
100
High income Medium income Low income
% of users who use it to heat water
11
62
37
0
50
100
High income Medium income Low income
% of users who use it for home heating
11 13
27
0
50
100
High income Medium income Low income
% of users who use it for ironing
10
55
0
50
100
High income Medium income Low income
% of users using it for home business
7
0
50
100
High income Medium income Low income
Source: author’s analysis of data from the MoE study (Ministry of Energy, 2002)
This quote, applied very generally to the entire household should be doubly applicable in
reference to the kitchen. However, it should also be interpreted with care. Although it is easy

222
to view the African man’s lack of attention to household matters simply as representative of
patriarchical household relations, a more nuanced understanding is called for. In some
African cultures, the kitchen is seen as woman’s sanctuary and place of power. It may be
culturally inappropriate for a man to touch anything within, or even enter, the space of the
kitchen.77
Another possible explanation exists for the persistence of charcoal as a cooking fuel among
wealthier households; simply that people prefer using it for certain cooking tasks. It is not
uncommon for households to diversify their fuel use if they become wealthier rather than
completely substitute one fuel for another (Masera, Saatkamp et al., 2000). Evidence from
the MoE surveys suggests that wealthier households do this with their cooking fuel options;
however, many retain charcoal in the mix of fuels. This is apparent in Table 17, which shows
the mix of fuels used by households in each income group. The fuels used include LPG,
electricity, charcoal, kerosene, and fuelwood. In total, 18 distinct mixes of cooking fuels
were identified among 170 households. Half of the mixes include charcoal. The nine mixes in
which charcoal is included are used by 68% of the total population sampled. Among the
poorer households, only seven different fuel mixes are reported with a highly skewed
distribution such that 90% of the sample are concentrated within only three mixes, which
supports the notion that wealthier households use a wider range of fuels.
77 For example, the Barabaig of Tanzania mobilize a council of elder women to retaliate against men who committed an offence against a woman of the community including men who “transgressed those parts of the homestead, such as her cooking stones, which are metaphoric of her bodily integrity,” (Udvardy, 1998, p. 1753).
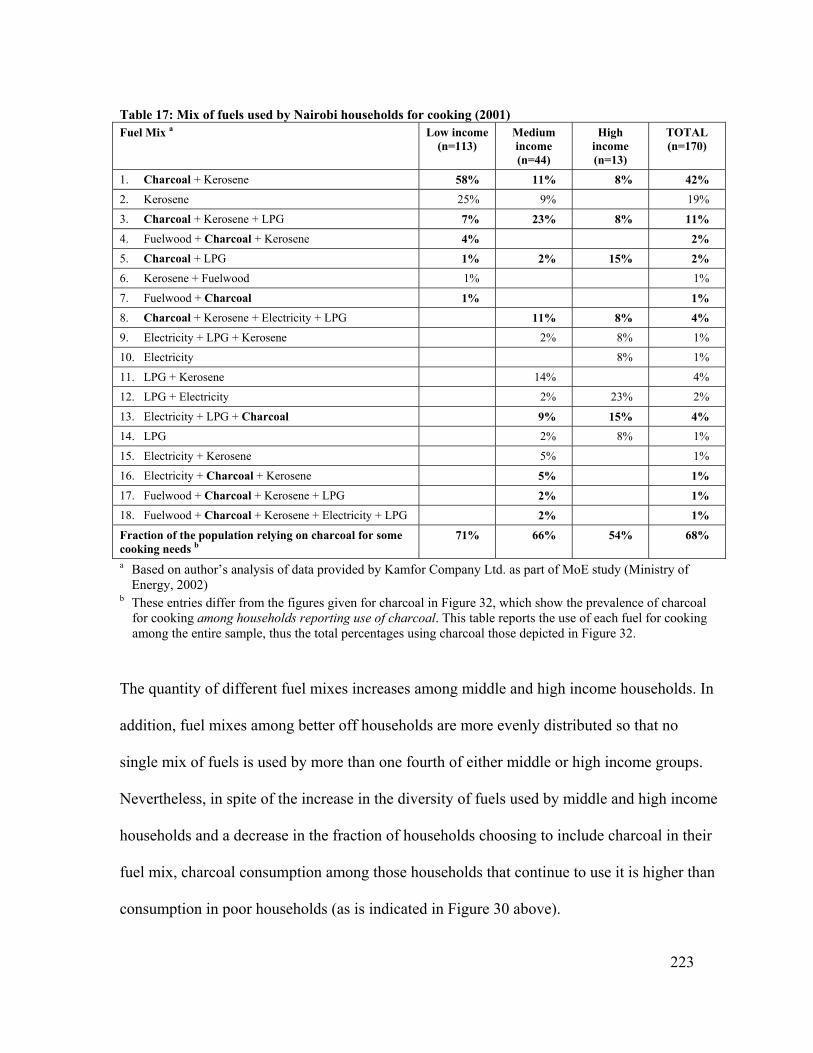
223
Table 17: Mix of fuels used by Nairobi households for cooking (2001) Fuel Mix a Low income
(n=113) Medium income (n=44)
High income (n=13)
TOTAL (n=170)
1. Charcoal + Kerosene 58% 11% 8% 42% 2. Kerosene 25% 9% 19%
3. Charcoal + Kerosene + LPG 7% 23% 8% 11% 4. Fuelwood + Charcoal + Kerosene 4% 2% 5. Charcoal + LPG 1% 2% 15% 2% 6. Kerosene + Fuelwood 1% 1%
7. Fuelwood + Charcoal 1% 1% 8. Charcoal + Kerosene + Electricity + LPG 11% 8% 4% 9. Electricity + LPG + Kerosene 2% 8% 1%
10. Electricity 8% 1%
11. LPG + Kerosene 14% 4%
12. LPG + Electricity 2% 23% 2%
13. Electricity + LPG + Charcoal 9% 15% 4% 14. LPG 2% 8% 1%
15. Electricity + Kerosene 5% 1%
16. Electricity + Charcoal + Kerosene 5% 1% 17. Fuelwood + Charcoal + Kerosene + LPG 2% 1% 18. Fuelwood + Charcoal + Kerosene + Electricity + LPG 2% 1%
Fraction of the population relying on charcoal for some cooking needs b
71% 66% 54% 68%
a Based on author’s analysis of data provided by Kamfor Company Ltd. as part of MoE study (Ministry of Energy, 2002)
b These entries differ from the figures given for charcoal in Figure 32, which show the prevalence of charcoal for cooking among households reporting use of charcoal. This table reports the use of each fuel for cooking among the entire sample, thus the total percentages using charcoal those depicted in Figure 32.
The quantity of different fuel mixes increases among middle and high income households. In
addition, fuel mixes among better off households are more evenly distributed so that no
single mix of fuels is used by more than one fourth of either middle or high income groups.
Nevertheless, in spite of the increase in the diversity of fuels used by middle and high income
households and a decrease in the fraction of households choosing to include charcoal in their
fuel mix, charcoal consumption among those households that continue to use it is higher than
consumption in poor households (as is indicated in Figure 30 above).

224
Consumer benefits
It is difficult to speak of the distribution of benefits among consumers because consumers
rely on charcoal for its use value rather than for exchange as other groups of actors along the
commodity chain use it. Nevertheless, from the discussion above about the ways in which
charcoal is used among different groups of consumers it is clear that charcoal is used
differently by different segments of Kenyan society. That charcoal is used for different tasks
and in combination with different fuels indicates that it very likely carries different meaning
for different consumers. Though consumers have little understanding of charcoal commodity
chain, they are certainly affected by the interactions along the chain. Similarly, they will be
affected by any regulation that comes in to effect. This completes the description of actors
participating in the various stages of Narok’s charcoal commodity chain. In the following
chapter, I will delineate the flow of benefits between and within these groups.

225
Chapter 5
Charcoal and livelihoods: an analysis of Kenya’s charcoal commodity chain - 2
Once a product can be sold, the producer can be bought
C. Meillassoux, quoted in (Kituyi, 1990, p. 71).
Banning charcoal…was the first step in eroding the government’s control over the industry. How do you regulate a trade that you have officially outlawed?
P. Kantai, in EcoForum, Kenya’s first popular environmental journal (2002, p. 20)
The vertical distribution of benefits from Narok’s charcoal trade
In this section, I explore the distribution of benefits among groups of actors along Narok’s
charcoal commodity chain. The focus of this exercise will be on charcoal that is made in
Narok and transported to long-distance markets like Nairobi, which accounts for the majority
of charcoal produced in Narok. The flow of benefits along this chain is distinct from charcoal
sold in local markets. In addition, the way in which we perceive benefit flows depends on the
unit of analysis that is used. The perspective one gains by considering a single bag of
charcoal is quite different that the understanding obtained from looking at bags produced or
traded by various actors on an annual basis. Both analyses will be explored.
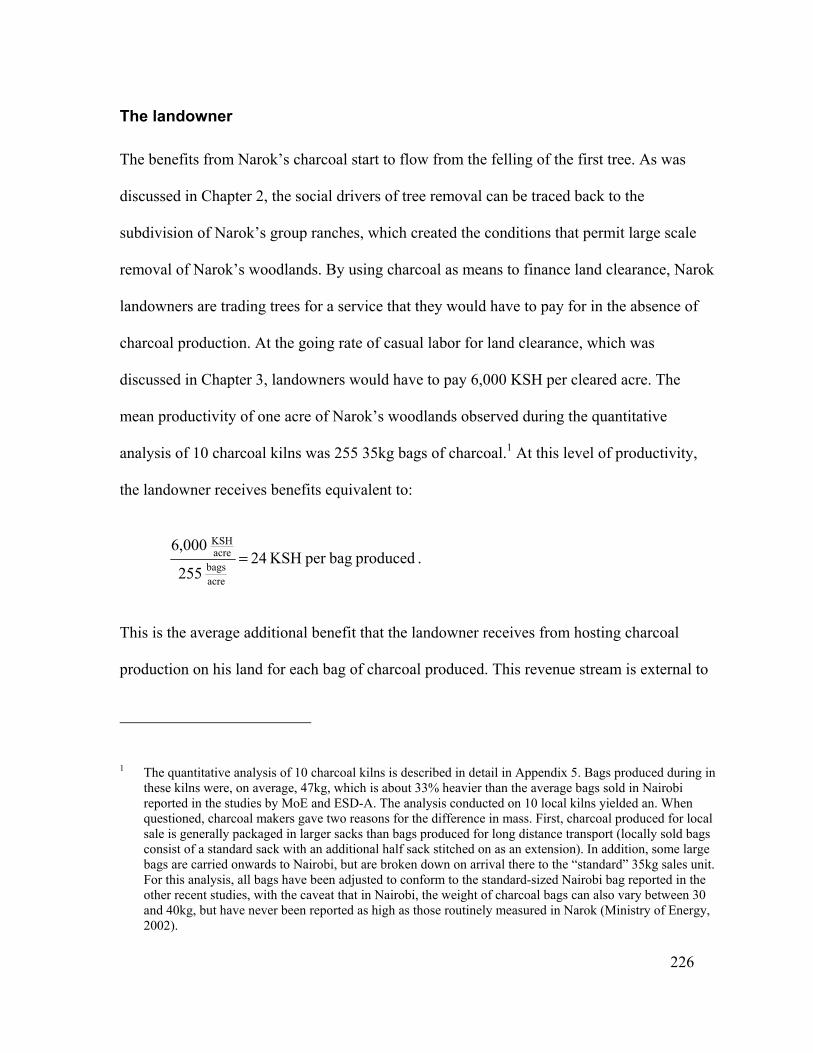
226
The landowner
The benefits from Narok’s charcoal start to flow from the felling of the first tree. As was
discussed in Chapter 2, the social drivers of tree removal can be traced back to the
subdivision of Narok’s group ranches, which created the conditions that permit large scale
removal of Narok’s woodlands. By using charcoal as means to finance land clearance, Narok
landowners are trading trees for a service that they would have to pay for in the absence of
charcoal production. At the going rate of casual labor for land clearance, which was
discussed in Chapter 3, landowners would have to pay 6,000 KSH per cleared acre. The
mean productivity of one acre of Narok’s woodlands observed during the quantitative
analysis of 10 charcoal kilns was 255 35kg bags of charcoal.1 At this level of productivity,
the landowner receives benefits equivalent to:
produced bagper KSH 24 255
6,000
acrebags
acreKSH
= .
This is the average additional benefit that the landowner receives from hosting charcoal
production on his land for each bag of charcoal produced. This revenue stream is external to
1 The quantitative analysis of 10 charcoal kilns is described in detail in Appendix 5. Bags produced during in these kilns were, on average, 47kg, which is about 33% heavier than the average bags sold in Nairobi reported in the studies by MoE and ESD-A. The analysis conducted on 10 local kilns yielded an. When questioned, charcoal makers gave two reasons for the difference in mass. First, charcoal produced for local sale is generally packaged in larger sacks than bags produced for long distance transport (locally sold bags consist of a standard sack with an additional half sack stitched on as an extension). In addition, some large bags are carried onwards to Nairobi, but are broken down on arrival there to the “standard” 35kg sales unit. For this analysis, all bags have been adjusted to conform to the standard-sized Nairobi bag reported in the other recent studies, with the caveat that in Nairobi, the weight of charcoal bags can also vary between 30 and 40kg, but have never been reported as high as those routinely measured in Narok (Ministry of Energy, 2002).

227
price formation for the commodity and is not passed on to the consumer. Nevertheless, it is
an important benefit to the landowner.
In addition, roughly 50% of Narok charcoal makers surveyed pay “cess” to the owner of the
land on which they produce charcoal ranging from 10-20 KSH per bag. However, all
charcoal makers are price takers and those who pay cess do not receive a higher “farm-gate”
price for their charcoal than those who are not charged by the landowner. Thus, charging cess
does not contribute to the price formation of the final product. Nevertheless, it is an
additional way that roughly half of the landowners interviewed derive benefits from the
trade.
Summing up, in the most common charcoal production system, landowners receive the
equivalent of 24-44 KSH per bag in cash and cleared land depending on whether or not they
charge cess. All of this can be considered profit since the landowner has no costs associated
with this activity.2
Charcoal makers
The farm-gate prices paid to charcoal makers vary seasonally from a low of 70 KSH per bag
during the dry season to 140 KSH per bag during the rainy season. These price variations are
responses to shifts in both supply and demand. During the dry season there is little on-farm
2 This assumes the trees themselves have no value, which ignores the environmental services that they provide. In an analysis in which the full social costs of the trees are accounted for, the loss of environmental services would need to be considered. Such an analysis is beyond the current scope of this research. However, see Luoga and colleagues’ cost-benefit analysis of charcoal production in miombo woodlands of eastern Tanzania, in which those researchers found that charcoal-related activities incur a net cost on society when certain opportunity costs of tree removal are accounted for (Luoga, Witkowski et al., 2000).

228
activity and many people turn to charcoal production for extra income, making supplies
plentiful. In addition, roads are easily passable so that supply zones are more easily
accessible. During the rainy season, the situation is reversed. Those charcoal makers who
have access to cultivable land either through ownership or leasing devote time to farming so
that production drops. In addition, many roads become impassable, which further restricts
supply. Finally, demand increases because of cooler weather.3 All of these factors contribute
to higher prices for producers. For this analysis, I will use 108 KSH per bag, which is the
average price recorded in the producer surveys conducted in February and March 2004, a
period that falls in the middle of the range of seasonal variation.
However, the entire farm-gate price should not all be considered profit, because there are
costs associated with charcoal production. These costs include the costs of tools as well as
the costs of housing. As was demonstrated in Chapter 3, the majority of charcoal makers in
Narok are migrants from outside of the district. Most of these migrants build temporary
shelters and others rent rooms while they are working in the area.4 In addition, roughly half
of the charcoal makers surveyed pay cess to landowners, further reducing their net profit. A
breakdown of the average costs of these inputs are given in Table 18. The table also shows
3 People cook with charcoal throughout the year. However, as was illustrated in Figure 32, roughly 20% of households report using charcoal for space heating, demand for which is concentrated during the cool rainy season. (Ministry of Energy, 2002).
4 Nearly 60% of the respondents live in temporary shelters made from sticks and plastic sheeting adjacent to the production area while they produce charcoal. Charcoal makers buy the plastic sheeting locally to make these shelters. Some also pay a small rent to the landowner for the privilege of “camping out” on their land. Others live in rented rooms in and around Narok town and commute on foot or by bicycle to their worksite each day.

229
the interquartile range of input costs to convey a sense of the variation in the experiences of
individual charcoal makers.
Table 18: Inputs revenues and profits for Narok charcoal makers Units Mean Interquartile
range
Monthly costs of tools a KSH/month 53 27 – 64
Monthly rent or approximate cost to build temporary shelter b " 266 54 – 325
Monthly production Bags/month 57 30 – 70
Monthly inputs per bag produced KSH/month 7.5 1 – 10
Amount paid to landowner as cess: average among those charged
average among all respondents c
KSH/bag
"
15
4.5
10
0
–
–
20
10
Farm-gate charcoal price KSH/bag 110 100 – 120
Profit per bag of charcoal d " 98 77 – 114
Source: author’s surveys of charcoal makers in Narok conducted in February and March, 2004. a Tools include hoes (jembe), machetes (panga), axes (shoka), spades (kijiko), and rakes (uma), as well as files (tupa) to
hone the other tools. Tools typically last many months or years. The figure here is the monthly average of each respondent’s tool annual costs based on the price and the respondent’s estimate of the lifetime of the tools that they use.
b The costs of building a shelter are prorated on a monthly basis using the assumption that a shelter made from polythene sheets lasts about three months.
c The average among the charcoal makers that pay cess is 15 KSH per bag. However, not all pay cess. If those that do not pay are also included in the average, then the average drops to 5 KSH per bag. Similarly, the IQR among those paying cess is 10-20, while the IQR among all respondents is between is 1-10.
d Average profit is calculated as the difference of average revenue (110 KSH/bag) and the sum of all inputs, which include costs of tools and rent (~7.5 KSH/bag) as well as cess paid to the landowner (~4.5 KSH/bag): 110 – (12) = 98 KSH/bag.
Thus, Narok’s charcoal makers are paid, on average, 108 KSH per bag. After accounting for
monthly rent, tool costs and cess paid to landowners, their average profits are 98 KSH per
bag. Unit profits among Narok’s charcoal makers are fairly low in comparison to other parts
of Kenya. The ESD-A national charcoal study found that the average farm-gate price per bag
was 252 KSH and the average profit margin of 127 KSH per bag.5 Despite this, charcoal
5 These figures were calculated from raw data provided by ESD-A and conflict with the figure that they give in their final report, which was a farm-gate price of 201 KSH per bag. Some of the producers surveyed sell charcoal in other units including smaller bags (approximately 27kg) and tins or debe (approximately 8kg)

230
makers in Narok produce nearly twice as many bags as the average producer in the ESD-A
study so that, on a monthly basis, the average charcoal maker in Narok earns higher income.
Between Narok and Nairobi: buyers, brokers, and bribery
As was discussed in Chapter 4, the next stage in the commodity chain consists of several
groups of overlapping actors including local charcoal brokers, buyers and transporters as well
as several different groups of local and national officials. Using brokers as intermediaries,
charcoal buyers purchase charcoal from producers. They then use either their own
transportation or hired transport to convey the charcoal to markets in and around Nairobi.
Brokers are paid by buyers between 2000-2500 KSH for a full lorry-load of charcoal. This
includes payment for additional laborers who are brought along to load the charcoal onto the
lorry and totals roughly 10 KSH per bag.
Long distance transport is either carried out by buyer-transporters who have their own means
of transportation, or buyers who hire transportation in vehicles owned by a third party. In
either case, the buying price in Narok and selling price in Nairobi are not affected. However,
the revenue earned by these actors, which is defined by the difference between the wholesale
and these figures account for this by adjusting to standard bag equivalents. In addition, the average farm-gate price and profit margin are reported by each producer’s annual production. The larger difference between farm-gate price and profit among charcoal makers outside of Narok is attributable to the costs of inputs, primarily trees and labor. Over 40% of charcoal makers surveyed outside of Narok purchase trees at an average cost of 423 per tree or 42 KSH per bag. Moreover, while most Narok charcoal makers work alone or have reciprocal work-sharing arrangements, roughly half of the charcoal makers surveyed outside of Narok have substantial labor costs, averaging 30 KSH per bag.
.

231
price at which vendors buy charcoal from transporters and the farm-gate price paid to
producers, is divided among more people when a third party transporter is hired.
In early 2005, charcoal was sold to vendors in Nairobi at 350 per bag, a 224% markup on the
average farm-gate price.6 The revenue generated from this markup is distributed among a
range of actors. This distribution is shown in Table 19 for two cases: one in which the buyer
hires a transporter and another in which the buyer owns the means of transport.7
From Table 19, it is clear that the best opportunity to profit from the trade arises when the
buyer owns the means of transport. Under those circumstances, he earns 54 KSH per bag or
roughly 18% return on his investment (assuming his total costs are 296 KSH per bag). Those
buyers who hire a third-party transporter have higher costs (328 KSH per bag) and earn only
22 KSH per bag or 7% return on their investment.
6 The average price of charcoal paid by Nairobi vendors buying from long distance transporters in the ESD-A survey was 318 KSH. However, transporters from Narok interviewed in this research consistently gave their selling price as 350 KSH, which was the 75th percentile of wholesale prices reported in the ESD-A survey. The discrepancy may be because charcoal from Narok fetches a higher price than charcoal from other areas as several informants attested, or it may reflect an increase in prices in the 10 months that passed between their survey and my own interviews with transporters.
7 According to informants in Narok, there are roughly 20 buyer-owned lorries transporting charcoal to Nairobi that operate in the areas of Narok where field work was conducted. In addition, informants estimate there are roughly 10 additional charcoal buyers regularly working in the same area who do not own their own vehicles, but hire lorries to transport charcoal (based on interviews with charcoal transporters conducted in Narok town on February 3 and 4, 2005). To account for parts of the district not covered in field work, I using the MoE’s survey of energy consumption by households and small enterprises and ESD-A’s survey of charcoal transporters. The MoE data estimates in Nairobi’s charcoal consumption to be roughly 266,000 tons/yr or (~7.6 million bags). Other expert estimates are considerably lower. For example, the Kenya Forest Working Group (KFWG) estimates annual consumption in Nairobi to be roughly 146,000 tons per year (~4.2 million bags) (Kenya Forests Working Group, 2003). Splitting the difference between the MoE study and the KFWG estimate I will assume Nairobi uses roughly 6,000,000 bags/year. Evidence from the ESD-A transporters survey and from surveys of Nairobi charcoal vendors carried out as part of this research indicate that 30-40% of Nairobi’s charcoal originates from Narok (explained further below). Hence, Narok’s annual contribution to Nairobi’s supply of charcoal is ~2,000,000 bags.

232
Table 19: Costs to transport charcoal from Narok to Nairobi in a typical lorry carrying ~250 35kg bags Buyer hires transport Buyer owns transport
KSH per lorry a
KSH per bag
KSH per lorry a
KSH per bag
Charcoal (at 108 KSH per bag) 27,000 108 27,000 108 Broker in Narok (includes labor to load lorry) 2,500 10 2,500 10
Diesel (~130 liters) 7,500 30 7,500 30 Driver 2,000 8 2,000 8 Driver’s assistant 1,000 4 1,000 4 Maintenance (oil, spare parts, etc) 1,000 4 1,000 4 Manager/dispatcher (in Nairobi) 500 2 500 2 Profit to lorry owner b 8,000 32
Total costs of lorry 20,000 80 12,000 48 Bribes paid at Narok – Nairobi traffic checkpoints c 30,000 120 30,000 120 Broker in Nairobi (includes labor to unload lorry) 2,500 10 2,500 10 Total costs 82,000 328 74,000 296 Sales to Nairobi vendors 87,500 350 87,500 350 Profit to charcoal buyer a 5,500 22 13,500 54 Source: Interviews with charcoal transporters conducted in January and February, 2005. a Assuming one lorry carries ~250 bags of charcoal b “Profit” does not account for the capital cost of the lorry, which may include loan payments. c A full description of the bribery that occurs along the transport route is given below and in Figure 33.
It is also clear that the largest single expense that buyers face are the bribes that are paid to
the authorities manning the string of traffic checkpoints along the road between Narok and
Nairobi. The net outlay in bribes usually exceeds the farm-gate price of the charcoal itself.
As was discussed above, this outlay does not occur as a single lump sum payment, but is
spread across 10-15 separate checkpoints as is shown in Figure 33. The exact amount paid
out in bribes varies depending on the institution that mans the checkpoint. The institutions
include the NCC, NTC, and Forest Department as well as several law enforcement agencies
such as the Kenya Police, Administrative Police, General Service Units (GSUs) and the
Criminal Investigations Department (CID).

233
Figure 33: List of police checkpoints at which bribes are paid to get charcoal from Narok to Nairobi
In addition, some checkpoints are permanently manned while others are less regularly
staffed. Moreover, informants explained that bribes paid during the day are typically higher
Narok 4,000 paid to officers from the Forest Department a; 1,000 paid to the NCC
Nairobi Occasional petty bribes (~200 KSH) paid to police in town
Seyabei 3,000 paid at police checkpoint
Eor Ekule 1,000 paid at police checkpoint
Ntulele 2,000 paid at police checkpoint
Niaregie Ngare 2,000 paid at police checkpoint
Duka Moja 4,000 paid to Administrative Police b
Suswa 3,000 paid to NCC (this marks the border of Narok and Kajiado Districts)
Suswa Ndogo 2,000 paid at police checkpoint
Mai Mahiu 1,000 paid to police at weigh station
Muthigiti 1,000 paid at police checkpoint
Mutarakwa 1,000 paid at police checkpoint
Tigoni 2,000 paid at police checkpoint
Kiambaa 1,000 paid at police checkpoint
Escarpment 2,000-6000 paid to CID officers in unmarked Land-rovers c
Total 30,000-34,000
Source: compiled from interviews with charcoal buyers and transporters conducted in Narok between January and February, 2005. a The Forest Department officer in charge of the district’s forest guards – armed paramilitary personnel – was
mentioned by name during interviews with charcoal buyers as an official who demands very high bribes. In addition, his name appears first on a list of “notorious timber and charcoal permit peddlers” that was published by a local community group.
b One set of Informants explained that Administrative Police (APs) were the most feared of the authorities. c The CID is the Kenyan equivalent of the FBI. Their periodic presence on the road that ascends the
escarpment between Mai Mahiu and Limuru was confirmed by several informants. The reason for their presence is unclear.

234
than those paid at night.8 In addition to these factors, another factor determines the demand
for bribes among the petty officials manning the roadblocks: the strength of the restrictions
put in place on charcoal transport. For example, during this field study, which extended over
a 12 month period, the degree to which high-level authorities enforced the restriction on
charcoal transport increased significantly. As a result, the quantity paid out in bribes for an
average-sized shipment of 250 bags increased by roughly 50%, from 20,000 to 30,0000
KSH.
In that same time period, the number of transporters operating in the district decreased by
about half. Many opted out rather than pay the additional bribes and/or risk having their
vehicles impounded. In addition, the number of buyers using smaller enclosed trucks
increased (discussed above on page 203), as did the use of passenger buses and other non-
traditional means of charcoal conveyance. Thus, the overall outlay for bribes fluctuates and
the values given here should not be considered to apply at all times.
Vendors
Charcoal sold to vendors in Nairobi for 350 KSH per bag is subsequently resold either in
whole bags or divided and resold in smaller units of sale. Whole bags are sold for 400-450
KSH per bag. As was discussed above, charcoal sold in smaller units of sale is typically
marked up so that it costs 20-25% more per unit weight of charcoal. Selling in smaller units
8 According to informants, bribes are lower at night for two reasons. First, fewer checkpoints are manned and second, the officers manning the checkpoints charge a premium for allowing passage during daylight hours because there is greater likelihood that their superiors will be on patrol. If their superior officers encounter a charcoal truck that has obviously been allowed to pass their checkpoint, they will be held accountable.

235
of sale adds to the vendor’s profit margin. Of course, as with any business, charcoal vendors
also have costs associated with doing business, including wages, rent, and licenses. These
costs vary depending on the location and scale of charcoal sales.
Table 20: Costs and profit margins among different groups of Nairobi charcoal vendors
Location of charcoal sales Units
Market Yard Kiosk Roadside
All vendors
No. of vendors responding Vendors 4 56 48 19 128
Average sales volume Bags/month 42 59 26 45 54
Price paid per bag of charcoal a KSH/bag 358 298 347 354 350
Other inputs: 0 0 0 0 0
Rent KSH/month 633 1281 1935 0 1467
Wages KSH/month 413 1344 471 161 807
Transport KSH/month 0 590 141 40 318
Other costs KSH/month 881 1026 590 550 786
Net cost of inputs b KSH/month 1293 4076 1687 751 2586
Costs of inputs per bag KSH/bag 34 76 72 19 53
Total costs per bag KSH/bag 392 373 418 373 397
Revenue per bag c KSH/bag 429 444 484 481 470
Profit per bag KSH/bag 37 70 66 108 67 a The average costs per bag found by the ESD-A study diverged from the average cost reported by Narok
transporters for reasons, as discussed above in footnote 6. They have been “normalized” in this table to give an average of 350 per bag in order to reflect the wholesale price of Narok charcoal at the time of this study.
b Rent was not included in the total for those vendors selling other goods in addition to charcoal because they would likely be paying rent on their business premises in the absence of charcoal sales.
c The average revenue per bag sold was calculated by taking the weighted average of revenue generated by different units of sale (tins, debe, and full bags) in order to account for the markup that vendors put on smaller units of sale.
Table 20 shows the costs associated with charcoal vending both in monthly terms and in
terms of bags sold for different groups of Nairobi vendors. Not surprisingly, vendors selling
by the roadside have the lowest input costs and enjoy the highest profit margin. They pay no

236
rent, the rarely pay licensing fees, and employ few laborers. However, they are subject to
frequent harassment by city authorities (Kinyungu, 2005). In contrast, other groups of
vendors pay higher rents and licensing fees. Vendors selling from dedicated charcoal yards
and kiosks enjoy the next highest profit margin. Vendors selling from markets appear to
enjoy the lowest margin, but the sample size is quite small.
Figure 34: Vertical distribution of profits among actors in the Narok-Nairobi charcoal commodity chain
With the costs and margins of vendors delineated, the distribution of profits from each bag of
charcoal brought to Nairobi from Narok among all of the actors in the supply chain can be
Farm-gate price: 108 KSH
Increment added by transport: 242 KSH
Increment added by retail sales: 120 KSH
108 KSH Farm-gate price (23%)
10 KSH Broker in Narok 2%
a Solid arrows indicate profits that flow directly to individual actors; dashed arrows indicate flows of revenue that leave the commodity chain and enter into circulation in the economy. This assumes that the average 35kg bag of Narok charcoal is sold for 470 KSH in Nairobi, which accounts for the ~20% markup charged when charcoal bags are broken down into smaller units of sale.
b Percentages do not add to 100% because of rounding errors. c Recall that the landowner also receives benefits roughly equivalent to 24 KSH per bag (5% of the retail
price) in the form of cleared land, but this is omitted from the figure because it is not monetized and does not contribute to charcoal’s price formation.
5 KSH: production costs (tools/shelter) 1% 98 KSH: charcoal maker’s profits 21%
102 KSH Vehicle transport (22%)
120 KSH Police, NCC and FD “profits” 26%
14 KSH: transport personnel 3% 54 KSH: buyer/vehicle owner profits 11%
34 KSH: fuel and vehicle maintenance 7%
10 KSH Brokers in Nairobi 2%
120 KSH wholesale to retail markup (26%)
53 KSH: vendors costs 11%
67 KSH: vendor’s profits 14%
5 KSH: landowner’s cess c 1%
Stage in the commodity chain
Distribution of benefits a
Percentage of retail price b
237
summarized. This is shown in Figure 34. It is possible to discern nodes of concentration
among certain groups of actors in the supply chain. For example, for every bag produced and
brought to market charcoal makers are able to capture one fifth of the retail cost of the
commodity.9 The only group of actors that is able to capture a larger share of the benefits are
police and other rent-seeking authorities. They capture roughly one quarter of the retail price
of each bag of charcoal produced transported to Nairobi. However, the money flowing to
those authorities from each bag of charcoal is spread among dozens of personnel. Thus, the
charcoal maker captures the largest individual share of profits from each bag of charcoal.
Still, it is worth noting that the farm-gate prices paid to charcoal makers in Narok are lower
than other areas in the country. In addition, their share of profits is being eroded as more
landowners demand cess for each bag of charcoal produced on their land (see discussion in
footnote 35). When the landowner demands 20 KSH per bag, which was observed in 12% of
cases surveyed, the charcoal maker’s profit drops nearly 20% relative to the average given in
Figure 34.
9 Some interesting comparisons can be drawn between charcoal and common agricultural commodities. For example, Kenyan sugar cane farmers get 28% of the retail price of their commodity (based on a farm-gate price of 2000 KSH/ton, sugar yield of 110 kg per ton cane and retail price of 65 KSH per kg) (Yuko, 2004; Amadala and Otieno, 2005, and observations from field work). However, this is gross revenue rather than profit. The cost of inputs for cane growers are a higher portion of revenues than the cost of inputs for charcoal makers. Of course, cane growers have much more security in their livelihoods than Narok charcoal makers. Coffee, formerly one of Kenya’s most important exports, doesn’t perform nearly as well. Growers receive between 1 and 5 KSH per kg of clean coffee (Karanja and Nyoro, 2002). Kenya’s best grade of green coffee sells for the equivalent of 200-300 KSH per kg on the international market (of course, export revenues are received in hard currency) (Standard correspondent, 2005). Similarly, the best grade of roasted coffee sells for ~350 per kg in Nairobi’s retail supermarkets. Thus, growers receive between 0.3 and 3% of the local price of coffee.

238
From each bag that is produced, the remaining beneficiaries include the buyers and
transporters as well as the vendors of the commodity. Each of these actors captures profits
equivalent to roughly 11% of the retail price of the commodity. If buyers do not have access
to their own means of transport, they hire it from a third party and their portion of the profit
is split roughly 40:60 with the owner of the vehicle. Finally, the brokers, petty laborers and
transport workers who participate in the commodity chain should not be overlooked. In sum,
they capture roughly 7% of the retail price of each bag of charcoal.
The distribution of profits from a single bag presents an incomplete picture because it
conveys neither a sense of the number of actors within each group nor the volume of bags
from which those actors are able to benefit. Consider instead the total production of charcoal
from Narok that is shipped to Nairobi, which is ~2,000,000 bags per year.10 Table 21 shows
the distribution of benefits from the district’s total annual production. The table also shows a
relative comparison of the profits earned by charcoal makers and other actors.
From this analysis, it is clear that the concentration of benefits arise not only because of the
share of revenue an actor can access from an individual bag of charcoal, but also from the
volume of production to which actors have access. Where bottlenecks exist, as in the
transportation stage of the chain, benefits are concentrated. This is evident from buyers who
own the means of transport.
10 See the discussion in footnote 7 of this chapter.

239
Table 21: Distribution of profits from Narok charcoal exported to Nairobi (~2,000,000 bags/yr)
Average individual profits Stage in the chain
Actors Estimated no. of actors
Profits per bag (KSH)
Total profits for group (106 KSH) (KHS) relative to
producer (%)
Production Landowners a 1,600 29 58 36,000 53%
Producers a 2,900 98 196 68,000 100%
Transport Brokers in Narok b 250 10 20 80,000 120%
Buyers owning transport c
40 54 108 2,700,000 4,000%
Buyers hiring transport c
50 22 44 880,000 1,300%
Vehicle owners 50 32 64 1,280,000 1,900%
Other transport workers d
270 14 28 104,000 150%
Police and other officials e
230 120 240 1,043,000 1,500%
Sales Brokers in Nairobi f 250 10 20 80,000 120%
Vendors f 3,400 53 106 32,000 48%
a The number of producers is derived from the average monthly production based on survey data. The number of landowners is based on an average productivity of 255 35kg bags per acre derived from the quantitative analysis of 10 charcoal kilns and the assumption that landowners clear, on average, 5 acres per year. Landowners profits include cash from cess collection (9 KSH per bag) and in-kind benefits of land clearance (24 KSH per bag).
b Based on interviews with several brokers, it appears that there are 100-150 brokers working around Narok town. I added an additional 100 to account for those working in other parts of the district.
c The number of transporters shipping to Nairobi is derived from Narok’s total production (explained in footnote 7) and information from interviews with Narok transporters. According to informants, transporters make a trip from Nairobi from Narok roughly every four days (~90 trips per year). If ~250 bags are carried on each trip, roughly 90 buyers/transporters are probably working in the district. The ESD-A survey also established that the ratio among charcoal transporters whose main source of charcoal is Narok owning the means of transport to those that do not is roughly 4:5. Thus, I estimate that there are approximately 40 buyers who own their own means of transport and 50 who hire it.
d Other transport workers include drivers, assistants and dispatchers. I assume that there are 3 individuals working with every lorry in addition to the owner. Drivers receive the largest share of these profits.
e Assuming the 15 checkpoints described in Figure 33 are manned by 5 people per shift in 3 shifts per day. However, this may overestimate individual “profits” of these actors because it does not capture the extent to which bribes are shared in the hierarchy of the institutions involved (also discussed in footnote 9).
f These are the estimated number of brokers and vendors selling charcoal from Narok based on average sales volume from the ESD-A study. They represent a fraction of the total brokers and vendors in the city.

240
This group, which probably consists of about 40 individuals, captures, on average, nearly
3,000,000 KSH per person each year: about 40 times the profits earned by the average
charcoal maker. When buyers hire transportation, that quantity is split, with roughly 60%
going to the owner of the lorry. In any case, the relatively small number of both groups of
actors ensures that their returns exceed the profits earned by all other players combined.
Among the remaining actors, brokers earn profits that are roughly equal to profits earned by
charcoal makers. This was confirmed through interviews with brokers, many of whom have
worked in both roles. Several brokers noted that their earnings are comparable to charcoal
makers but listed other advantages to working as a broker, including work that is both less
physically demanding and associated with fewer risks.
The risks are reduced because charcoal is occasionally confiscated by authorities at the kiln
site or roadside prior to its initial sale. If this happens, the charcoal makers suffer the loss.
For them, a kiln of charcoal represents an investment of 1-2 weeks of labor, an investment
that they lose completely if authorities confiscate it before it is sold. In contrast, brokers
never own charcoal – they are simply intermediaries. Thus, if charcoal is confiscated at any
point in the commodity chain, they lose nothing. Of course, charcoal making also has
advantages relative to work as a broker. Charcoal makers retain more control over their
income. If they need additional cash, they can work harder to produce more charcoal. In
addition, they have several outlets through which to sell their product: long distance
transporters, local buyers, roadside sales, etc. In contrast, brokers rely on several other parties
to earn their living.
241
Other actors in the transport sector (drivers, drivers’ assistants, etc.) earn slightly greater
profits from the trade than producers.11 Finally, the landowners receive the smallest share of
profit from Narok’s charcoal trade. In terms of cash income, they receive just 10% of the
profits earned by charcoal makers. However, the in-kind benefits that they receive in the
form of cleared land add, on average, an additional 30,000 KSH from charcoal production (5
acres cleared at 6,000 KSH per acre). Thus, including the benefits of cleared land, the
average benefits that landowners receive in return for providing raw materials and hosting
charcoal production are roughly equivalent to half the profits earned by charcoal makers, and
they expand very little effort in accessing these benefits.
The vertical distribution of profits depicted in Figure 34 and Table 21 show that for each bag
of charcoal produced, the average charcoal maker retains the largest individual share of
profit: roughly 20% of the retail price. However, when the net benefits from all production
are aggregated, it is clear that each individual producer captures very little in comparison to
other actors. We can achieve further understanding by exploring how benefits are distributed
within each group and the mechanisms that various actors employ to maintain their access,
particularly when the distribution is skewed in their favor. This is explored in the next
section.
11 The quantity shown in Table 21 is the average of all of these actors. Assuming each lorry has one driver, one driver’s assistant and one manager/dispatcher, the earnings from the trade are divided roughly 6:3:1 respectively among each actor.

242
Horizontal distribution of benefits and mechanisms of access
The distribution of benefits within some groups of actors are relatively homogeneous while
the distribution in other groups is skewed in favor of a privileged minority. In this section, I
will explore the distribution through each stage of the commodity chain in more detail.
Production: landowners and charcoal makers
Among Narok landowners, benefits only flow to those who wish to clear their newly
acquired plot of land. Among these individuals, the distribution of benefits depends largely
on the link that landowners establish with charcoal makers. To maximize such benefits,
landowners could actively seek out charcoal makers to work on their land. However, only
12% of the charcoal makers surveyed reported they were approached by landowners to work
on their land. The majority of landowners do not take such an active role. Rather, they are
approached by charcoal makers looking for access to trees.
The few cases in which landowners actually sought out charcoal makers were landowners
who took a visibly proactive role in the management of their land.12 For the remainder, the
passive approach to managing their land may be a reflection of some ambivalence toward
their new status as titled landholders. During interviews, most landowners admitted that they
had intended to lease, cultivate, or otherwise derive some new type of benefits from their
12 Evidence of a proactive approach to land management included fencing their plots and cultivating commercial crops for themselves rather than leasing to outside interests. This group included a former group ranch committee member who has expanded his original allotment by buying a portion of a neighboring farm. In addition, this individual considers the charcoal made on his land to be his. This is the landowner described in the final case of Table 11.
243
land immediately upon allocation. However, the majority took several years to clear land and
begin cultivation during which time the landowners continued to live as they did prior to
subdivision, relying largely on their livestock.
Recruitment and retention of charcoal makers ensures a flow of benefits to landowners. In
addition, a number of land owners have tapped into another stream of benefits by levying a
charge of 10-20 KSH per bag of charcoal produced on their land. While this increases the
profit they gain from charcoal production, and is the only means to obtain cash in addition to
the in-kind benefit of land clearance, this strategy can work against landowners. Charcoal
makers who feel as if the cess is unfair can opt out and find another landowner to work for.
In some cases, landowners charging cess seek to retain charcoal makers by offering them
other benefits such as favorable leasing arrangements to farm for one or two seasons and/or
access to a small plot to build a temporary shelter in which to stay while working. In
addition, powerful landowners who are respected in the community have an advantage in
retaining charcoal makers because they are able to offer intangible benefits like security from
harassment from moran.13
Despite these variations, in the long-run, the distribution of benefits among landowners is not
likely be heavily skewed in favor of any individuals. No one is attempting to host charcoal
production on a continual basis; rather, it is a one-time activity. Eventually the land
13 As was discussed in Chapter 3, Maasai moran frequently harass outsiders, demanding money or food. A charcoal maker working on the land of a poor or disrespected landowner may not be charged any cess, but he is also a target for harassment. A charcoal maker working – and possibly residing – on the land of a powerful landowner will probably pay some cess, but is less likely to be harrassed.

244
belonging to individuals who attract and retain charcoal makers will be cleared and the
charcoal makers will move on. Nevertheless, there are significant advantages to clearing
sooner rather than later, as large benefits can flow to those who clear their land earlier. This
is particularly true for individuals in Narok’s wheat belt who hope to lease land to
commercial grain farmers. Commercial grain farmers are limited in number. Landowners
who prepare their land early are much more likely to capture the benefits associated with
leasing, which far exceed the profits derived from charcoal itself (see Appendix 5). Thus, the
direct benefits to landowners from Narok’s charcoal trade may well be homogeneous when
spread over time. However, the potential to derive indirect benefits from activities that are, in
some sense, enabled by temporarily hosting charcoal production on one’s land are time-
dependent; those who capture the benefits of hosting charcoal production early stand to gain
a great deal.14
The distribution of benefits from the charcoal trade is also fairly homogeneous among
charcoal makers. For most, the net benefits they receive are a function of the arrangement
that they have struck with the landowner as well as their own productivity.15 Productivity
depends largely on the individual, but it is also a function of the trees that the charcoal maker
has access to. Charcoal makers can choose landowners based on the quality of the trees that
14 The direction that wheat farming in Narok might take is unclear. It is possible that those landowners currently clearing their land via charcoal production may have missed out on the best opportunities to lease to commercial wheat farmers. As was explained in Chapter 3 commercial wheat production exploded in Narok in the 1970s and 80s after which the expansion leveled off, and may actually have experienced a contraction in recent years (Serneels, 2005). Nevertheless, there is evidence of newly formed lease agreements observed among the sample of interviewees during this field work.
15 Productivity can be defined as person-days of labor required to produce a ton of charcoal.

245
they have on their land. However, most of the area is dense shrubland dominated by T.
camphoratus. Although it is interspersed with other tree species that are also suitable for
charcoal production, such as Acacia spp. and O. Africana,16 landowners attach more value to
those other species and many stipulate that only T. camphoratus may be cut. Less prevalent
species are not to be touched or, in the case of large A. xanthophloea, must be purchased.
Prices for purchased trees ranged from 500-1000 KSH depending on the size of the tree. Due
to their size, trees that are purchased also require the charcoal maker to hire a person with a
power saw to cut the tree into manageable pieces. Nevertheless, the yield justifies the cost. A
fully grown A. xanthophloea can reach a height of 25 m with dbh of 1m or more. Figure 35
shows my field assistant David, who is roughly 1.6 m tall (5’ 5”), standing atop the stump
that was remaining after a large A. xanthophloea was cut. The picture on the right was taken
five months later after the tree had been made into charcoal. The tree sat within a few meters
of the Ewaso Ngiro River on land that was formerly part of Ngoben GR. The tree was cut
over two meters above ground level because the power saw that was used was not long
enough to cut through the trunk closer to the ground. The tree yielded well over 200 bags of
charcoal.
16 See the discussion in Chapter 3.

246
Figure 35: Large A. xanthophloea cut for charcoal on the banks of the Ewaso Ngiro River, Narok
Source: Author
One additional factor that affects the distribution of benefits among charcoal makers is the
price that they are able to get for their product. As was explained above, the majority of
charcoal makers in Narok sell charcoal directly to lorries for long-distance transport, an
exchange in which charcoal makers are price-takers. A small minority of charcoal makers
have direct access to local consumers and can therefore sell their charcoal at a higher price.
Roadside prices are ~50% higher than prices at the farm-gate. Figure 36 shows a comparison
of price distributions among charcoal makers selling primarily at the kiln site, at the roadside,
or in some combination of the two options. Those selling direct to customers along the side
of the road receive higher prices than other charcoal makers.

247
Figure 36: Box-plot of current selling price (Feb-March 2004) for Narok charcoal producers
Maintaining access among landowners and charcoal makers
For most charcoal makers, maintaining access to the benefits of charcoal production is matter
of maintaining good relations with the landowners on whose land they produce charcoal. In
order to produce charcoal on someone’s land, charcoal makers seek verbal permission from
the landowner. Some landowners expressed frustration that they occasionally found more
charcoal makers working on their land than they had granted permission to. Similarly,
charcoal makers expressed frustration that landowners have started to ask for increasing
amounts of cess on each bag they produce.
In addition, each group occasionally displayed disdain for the other in a way that was
reflective of common tensions between Kenya’s varied ethnic groups. For example, some of
the Kikuyu charcoal makers surveyed joked with my research assistant, who was also
2 5437 N =
Other
Roadside and kiln
Only roadside
Only kiln
Cur
rent
sel
ling
pric
e (K
SH
/bag
)
220
200
180
160
140
120
100
80
60
Max *
Min
Median
75th percentile
25th percentile

248
Kikuyu, about the Maasai’s backwardness and their poor farming abilities. Several also noted
how they cheated the landowners by cutting trees that they were instructed not to cut in order
to increase the quality and quantity of the charcoal they produce. Not surprisingly, some of
the Maasai landowners expressed distrust of the Kikuyu working on their land because they
felt that they were not honest in business and are preoccupied with money.17 However, in
most discussions, each group acknowledged the interdependent relationship that exists
between them and reported few serious problems.18 As one landowner optimistically noted:
Problems [with charcoal makers] led us to greater understanding…19
The question of exploitation arose in conversations with charcoal makers, but it was in the
context of relations with charcoal buyers and transporters rather than in the context of the
relations with landowner. Several charcoal makers expressed frustration at the low prices
they were offered by buyers who are frequently from the same ethnic group, but typically
from a different economic class. This will be discussed below in the context of the
mechanisms through which those actors maintain access to the benefits they enjoy. First we
will discuss the distribution of benefits among those actors.
17 The “backwardness” of the Maasai and the unscrupulous business practices of the Kikuyu are both common Kenyan stereotypes.
18 As was discussed above, there are tensions in Narok between Maasai and other ethnic groups including Kikuyu that have flared up into violent conflict. These tensions must have some effect on relationships between landowners and charcoal makers. However, interviewees never raised the issue explicitly during interviews in which they were asked specifically about relationships between landowners and charcoal makers.
19 In Swahili, “shida na shida ilileta uhusiano bora” (from an interview conducted in Ngoben, Narok on September 7, 2004).

249
Transportation
There are several groups involved in bringing charcoal to market from Narok. Within each of
these groups, the horizontal distribution of benefits varies from skewed to relatively
homogenous. The distribution is very likely homogeneous among brokers and transport
workers, but among charcoal buyers the distribution of profits favors those who own their
own means of transportation. These buyers number approximately 40 individuals in the
district. There are an additional 50 individuals who buy charcoal in large quantities, but do
not own their own means of transportation. For them, roughly 60% of the profits must be
shared with the vehicle’s owner. Interestingly, the ratio charcoal buyers who own the means
of transport is higher among Narok’s transporters than among transporters working in other
areas.
Within each subgroup of buyers, there appears to be a homogeneous distribution of profits.
None of the 6 buyer/transporters who were interviewed during field work indicated that there
was an appreciable degree of concentration in the sector. This is supported by data from
ESD-A’s survey of charcoal transporters. Their national survey included 16 large-scale
transporters in Nairobi who ship charcoal primarily from Narok. Of these, seven owned their
own means of transport and nine did not. All of those who owned their own means of
transport owned only one vehicle, which lends support to the contention that the distribution
of benefits, though heavily skewed to this group of actors relative to other groups, is fairly
homogenous within this group. Of those who did not own the means of transport, 6 had hired
vehicles and the remaining three were driving vehicles owned by a third party. Assuming this

250
sample was representative of transporters supplying charcoal from Narok, there seems to be
little concentration within this population.
The police and other authorities manning the traffic checkpoints are the other group of actors
at this stage of the commodity chain who capture a large portion of the benefits from the
trade. As was discussed above, it is impossible to assess the true distribution of benefits that
flow to this group of actors because bribes exchanged between charcoal transporters and
police or other authorities simply can not be traced.
The burning question is, how far up the ranks of the agencies involved does this money
reach? During the course of interviews with charcoal makers, buyers, and transporters, many
of the respondents speculated that the bribery reaches upper levels of government agencies,
noting it is unlikely that senior officers in the police, Forest Department, and the NCC are
unaware that their subordinates allow charcoal to pass in contravention of their stated
policies. Through this logic, it is also very likely that substantial revenues flowing to petty
officials and police officers are distributed among superior officers.
Lending further support to this contention is the fact that officials from the Forest
Department post their roadblocks along primary roads to control the flow of charcoal rather
than patrolling the forests themselves. The FD’s ban on charcoal transport is ostensibly to
conserve forest resources. Several respondents pointed out that forest conservation is better
conducted in the forest where the damage can be stopped before it occurs, rather than on the
highway after the trees have already been baked into carbon. Further, on the roads, it is
impossible to distinguish charcoal produced legally on private farms and charcoal produced
illegally in “protected” forests. However, if the FD’s interests are in profiting from the trade

251
rather than halting it, then their decision to place checkpoints on the roadside appears more
logical. Needless to say, this speculation raised by frustrated charcoal makers and traders is
not sufficient evidence to implicate higher ranking officers in the corruption that is occurring.
Additional research is needed to determine the extent to which revenues from charcoal-
related bribes are spread among the authorities charged with regulating its flow.
Maintaining access among charcoal transporters
Access to the benefits derived from long-distance charcoal transport are maintained through
several mechanisms. The primary mechanism is the extremely high barrier to entry that lorry
ownership presents. In addition, though it is far lower than purchasing a lorry, the initial costs
of hiring a lorry and buying 250 bags of charcoal are also out of reach for most Kenyans. It
costs roughly 80,000 KSH to finance a single trip from Narok to Nairobi, which is over twice
double Kenya’s average annual per capita income.20 Moreover, although credit facilities exist
in Kenya, the charcoal trade is not an attractive investment for creditors because of its
ambiguous legal status and high risk. Thus, investing in vehicle ownership specifically for
the charcoal business, or simply hiring a lorry and buying sufficient charcoal to fill it for a
single trip, are not likely to be attractive investments among Kenya’s financial institutions.
Finally, there is speculation among charcoal makers and brokers that these natural barriers to
entry are strengthened by collusion between authorities and existing buyers and transporters
who work to keep new players from transporting charcoal. The assertion is that transporters
pay massive bribes not only to gain passage to Nairobi in spite of the ban on charcoal
20 In 2004, Kenya’s GNI was 1.225 trillion KSH or roughly 38,000 KSH per person (World Bank, 2003b).

252
transport, but also to protect their position as privileged buyers in an extremely lucrative
market.21
However, no evidence of this type of collusion was evident. Such collusion would require a
level of coordination among the ~90 buyers and transporters operating in the district that
does not appear to exist. Still, while outright collusion does not appear evident, new entrants
in Narok’s large-scale charcoal transportation market would face barriers in negotiating
passage for their charcoal. Officials at traffic checkpoints are certainly not welcoming to
newcomers. Several informants noted that low and mid-level law enforcement officers
currently find themselves in a difficult, even confused, position. Since the post-KANU
regime has come to power, the risk involved in accepting bribes has increased. The new
government was elected on an anti-corruption platform and instituted a number of reforms
including a requirement that all levels of civil servants must submit declarations of their
personal wealth (Mulama, 2005; Njeru, 2005). There have been shakeups in several state
agencies, including the Forest Department (Nation Correspondent, 2004).22 Thus, corruption
21 The question arose during a group interview with charcoal makers and brokers in Narok. When asked if they have considered pooling their resources and hiring a lorry to transport their charcoal to Nairobi, they contended that police would not allow them to pass with charcoal because of collusion between police and transporters (from an interview conducted in Ngoben, Narok on January 20, 2004). Such cooperation among charcoal brokers might be facilitated if the policies currently under consideration are implemented.
22 Despite this and other outwards steps, there is little evidence that things have changed for the better. As one charcoal broker stated, “hiyo tumbo bado iko” (Swahili: that stomach is still there): a reference to the need for those in power to satisfy their large appetites by taking bribes (from an interview in Narok conducted on January 22, 2005). Others noted that things are now worse, joking that the slang term “TKK”, which has been used for years to describe the small bribes paid to avoid baseless harassment from police has shifted meaning. It used to stand for toa kitu kidogo or “give something small”, but now means toa kitu kikubwa or “give something big”. At the national level, several prominent members of the new regime have been embroiled in corruption allegations that are as egregious as those carried out by members of the former regime (Transparency International - Kenya, 2005). Such examples from the top do little to dissuade lower level civil servants from continuing to demand their TKK.

253
is now associated with increased risk. However, in addition to – perhaps instead of – acting
as a deterrent, the additional risk has increased cost of bribes.
Finally, new entrants to charcoal transport lack familiarity with what is inherently a very
opaque system. This opacity extends to upstream stages of the commodity chain as well.
Finding buyers for charcoal in Nairobi requires knowledge that is difficult for outsiders to
acquire. Thus, although collusion between transporters, police and other authorities does not
appear to exist, there are still an array of factors that present new entrants with significant
barriers to entry and protect the privileged position enjoyed by the current cadre of buyers
and transporters.
Sales of charcoal in Nairobi
When charcoal from Narok enters Nairobi’s markets, it enters a market in which it is
indistinguishable from charcoal produced elsewhere in the country.23 Hence, the analysis in
this section should be interpreted as applying to all charcoal sales, rather than something that
applies only to Narok’s charcoal commodity chain. Nevertheless, based on the average
number of bags that are sold by Nairobi charcoal vendors according to ESD-A survey data,
we can estimate the number of vendors selling charcoal from Narok in Nairobi (as was done
in Table 21). The number is roughly the same order of magnitude as the number of people
23 During interviews with transporters and charcoal makers, there were anecdotal tales of charcoal from Narok being favored, and possibly fetching a higher price among vendors because of its quality. However, this was neither observed in discussions with vendors, nor is it apparent from data obtained from the ESD-A study.

254
producing charcoal in Narok. The large number of players introduces a fair amount of
competition in the market, which keeps profit margins fairly low.
Nevertheless, certain actors are able to benefit more than others by controlling large volumes
of charcoal coming into the city. This is demonstrated in Figure 37, which shows the
distribution of sales volumes among Nairobi charcoal vendors surveyed by ESD-A. The
vendors’ sales are adjusted so that tins and debe are converted to standard 35kg bags. In
addition, the vendors have been disaggregated according to their sales location (top) and
according to their primary customer (bottom).24 In the plot showing differences among
vendors by sales location, none of the observed differences in the mean sales volume are
statistically significant. However, it is apparent that certain vendors are able to capture
disproportionate shares of the market by selling very high volumes. In the plot showing
differences among vendors by main customer, both vendors selling primarily to food
businesses (p < 0.1) and vendors selling primarily to other charcoal sellers (p < 0.01) do sell
significantly higher volumes of charcoal than those vendors who sell primarily to residential
customers. The characteristics of charcoal vendors described in this section are not unique to
charcoal of a particular area. In fact, little can be said about the origin of charcoal sold by
vendors in Nairobi.25 Once the product reaches the retail stage of the commodity chain, it is
very difficult to determine its region of origin. Vendors themselves may not even know.
24 Although 118 vendors in Nairobi were surveyed in the ESD-A study, only 61 of the respondents provided enough data to enable an estimate of monthly sales volume. The missing data were distributed evenly among all categories of vendors and should not introduce any bias into the analysis.
25 The ESD-A survey did not ask vendors about the origin of their charcoal.

255
Figure 37: Box plot of sales volume among Nairobi charcoal vendors disaggregated by sales location (top) and primary customer (bottom)
530242N = roadsidekioskcharcoal yardmarket
Estim
ate
of m
onth
ly s
ales
(35k
g ba
gs) 600
500
400
300
200
100
0
534
383
117 146
80
203
Max*
Min*
Median75th percentile
25th percentile
N =
Estim
ate
of m
onth
ly s
ales
(35k
g ba
gs) 600
500
400
300
200
100
0
534
383
117
* The minima and maxima defined by the lines do not include outliers shown by open circles. Extreme values are defined by stars. Outliers are those data points that are more than 1.5 IQR above (or below) the IQR of the data. Extreme values are those data points that are more than 3 IQR above (or below) the IQR of the data, The numbers given next to each outlier/extreme is the monthly number sales of 35 kg bags or equivalent units.
9475Food businessesHouseholdsCharcoal vendors
Sales location
Main customer

256
This presents a challenge for policy makers who are sensitive to the critical role that charcoal
plays in the Kenyan energy economy and wish to regulate it in order to promote its
sustainable production. In addition, it calls into question the potentially transformative nature
of commodity chain analysis discussed at length both by Leslie and Reimer as well as
Hartwick (Leslie and Reimer, 1999; Hartwick, 2001). How can the symbolic distance
between consumers and producers be decreased if the material position of producers is
uncertain? In the final section of this chapter I will revisit the suite of newly proposed
regulations for Kenya’s woodfuel sector in order to delineate some of the consequences that
they may have on participants and practices in Narok’s charcoal commodity chain.
Regulating charcoal: a new era for Kenya’s energy economy?
In this section, I will discuss some of the implications of what the preceding analysis reveals
about Narok’s charcoal commodity chain in light of proposed changes in Kenya’s forestry
and energy policies. Current land management practices in Narok are the product of two sets
of policies: one set is directed at land tenure institutions and the other concerns forest
management and conservation. The changes in land tenure, some of which were encoded in
law and other of which were tacitly pursued in response to those laws, appear to have had the
most influential effect on land management, as was discussed in Chapter 3. As a result, land
use practices, such as clearing bush for cultivation, fencing, and the construction of
permanent settlements, which were both difficult to implement and unpopular among the
majority of community members under communal conditions became commonplace.
The second set of policies that have had a substantial affect on land management in Narok
concern forest management. Through the 1980s and 90s, as the aforementioned processes of

257
land tenure change were unfolding, concerns about the environmental impacts of woodfuel
demand and the exploitation of other forest products throughout the country led to the
criminalization of many charcoal-related activities, including bans on transportation enacted
at the provincial level in many provinces as well as piecemeal bans on charcoal production in
certain localities. However, restrictions on charcoal vary from district to district and have
rarely been fully enforced in any area (Kantai, 2002). In addition, there are half a dozen
different state and local authorities (as outlined in Figure 33 above) claiming some rights to
enforce these regulations, which creates a complex and constantly shifting terrain for
charcoal producers and traders to negotiate. Ironically, as was explained in Chapter 4,
Narok’s charcoal does not originate from the type of forested landscape that these restrictions
were intended to protect.26
Though this situation is unique to Narok, the influence of land and forest management
policies are felt in other systems of wood energy provision throughout the country. Policies
concerning energy constitute a third critical sector that could, in an alternative policy
environment, influence the charcoal commodity chain. However, current energy policies
have no influence on actual practices. Thus, the wood energy component of Kenya’s energy
sector, which constitutes roughly 80% of the nation’s total supply (Ministry of Energy, 2002;
IEA, 2003a), is de facto managed by forestry and land-use policies that are not designed with
26 This is not to say that the shrubland and woodland areas where Narok’s charcoal is produced are not worthy of conservation. It merely stresses that the restrictions on charcoal production in Narok in the name of forest conservation are largely misdirected.

258
energy specifically in mind, rather than by policies specifically designed to meet the energy
needs of the Kenyan people.
Certain groups within the Kenyan government and non-governmental experts working on
policy matters are aware that the current approach to regulating and managing the nation’s
woodfuel economy is seriously flawed (Kituyi, 2002; Mutimba and Matiru, 2002; Ministry of
Energy, 2003; Mugo and Ong, 2003; Mutimba and Barasa, 2005b). A new set of policies are
under consideration, which, if implemented, could radically alter the ways in which
woodfuels are produced and brought to market. Two different legislative acts have been
drafted, the Forest Bill of 2004 (Government of Kenya, 2005) which was passed into law just
weeks before this thesis was submitted,27 and the MoE’s Wood Energy Policy, which has yet
to be tabled before Parliament (Ministry of Energy, 2003). These policies have provisions for
woodfuel production, proposing inter alia that:
1. Forests in the drylands will be sustainably managed and conserved for the production of gums and resins, charcoal and timber (Government of Kenya, 2004, p. 6).
2. Sustainable commercial production of fast growing trees for firewood and charcoal on private farms, medium and large-scale plantations, county council land and group ranches will be promoted (Government of Kenya, 2004, p. 13).
3. Firewood and charcoal producers, transporters and traders shall be required to form legal associations with by-laws for self regulation (Ministry of Energy, 2003, p. 5).
27 Environmental governance in Kenya has become extremely politicized. The new Forest Bill was actually defeated once in a Parliamentary vote for reasons unrelated to its actual content. It was recently tabled and passed, though it is still referred to as “controversial” by the media (Nation Team, 2004; Nation Correspondent, 2005; Nation Reporter, 2005a).

259
4. …regulation of the [woodfuels] industry shall be decentralized. Wood energy management responsibilities shall be devolved down to lower administrative units like district, division, location and even sub-location in order to increase efficiency and effectiveness (Ministry of Energy, 2003, p. 5). 28
Each of these proposals represents a significant break from past approaches to energy
planning and forest management in Kenya. To date, the country’s energy policies have been
heavily biased toward urban and industrial development, concentrating almost entirely on
petroleum and grid-based electric power (Karekezi, 2002; Kituyi, 2004a). Little effort has
been directed to dedicated tree planting for woodfuel production.29 In addition, Kenya’s
forest management has historically focused largely on two very limited aspects of the
nation’s forested landscape: conservation of the few remaining areas of closed indigenous
forest and management of silvicultural plantations for either timber or pulp and paper
production (Ongugo and Njuguna, 2004).30 Woodfuel, charcoal in particular, has been either
ignored or criminalized by the state.
28 The proposed wood energy policy makes additional suggestions, including the formation of an independent Wood Energy Board to provide oversight to the trade of fuelwood and charcoal. The board will be financed by taxes levied on woodfuels. In addition, certificates of origin will be issued for charcoal to ensure that it was derived from sustainable sources. The policy also proposes standards for the weight of units of charcoal for sale as well as the quality of the charcoal itself. More of the text from both the Forest Bill and the proposed Wood Energy Policy that is relevant to wood energy provision is provided in Appendix 7.
29 A notable exception may be the famed “Green Belt Movement” of Wangari Wa Maathai, who was awarded the 2004 Noble Peace Prize in recognition of her environmental and gender activism.
30 It is also worth mentioning Kenya’s attempt at formalized state-sponsored Community Forestry. Dubbed the shamba system, this was a variation of the well-known taungya system (Menzies, 1988; Nair, 1991; Bryant, 1993). The system had very limited success and, in some areas, was used simply as an excuse to allocate forest land for political patronage. Its future has became point of contention among members of the new regime, with Nobel laureate Waangari Wa Maathai advocating its abolishment (Maathai, 1999; Nation Reporter, 2005d). The issue has yet to be resolved.

260
Decriminalizing the charcoal trade
To the extent that they specifically affect the charcoal trade, the first two policy proposals,
which are from the newly adopted Forest Bill, largely center on the trade’s legitimacy.
Charcoal production must be seen as a legitimate income-generating enterprise if any attempt
to rationalize the regulation of the trade will be successful (Mutimba and Matiru, 2002).
Charcoal has become criminalized because it is thought to cause deforestation. There are
fears among many policy makers, including members of Kenya’s environmental community,
that removing restrictions on the trade will lead to excessive harvesting in sensitive and/or
protected areas (Okwemba, 2003). These fears are not unfounded. Though the proposed
Forest Bill holds that indigenous forests on public lands shall retain their protected status
(Government of Kenya, 2004), recent experience in Kenya shows that de jure protection does
not, by itself, prevent over-exploitation (Gathaara, 1999; Lambrechts, Woodley et al., 2003).
Nevertheless, a concern for Kenya’s poorly protected forest areas should not be allowed to
paralyze the development of a more rational set of policies for woodfuel utilization. ESD-A’s
survey work indicates that only a small fraction of Kenya’s charcoal is extracted from state-
owned forests. In four of the 18 districts visited, 20% or more of the producers surveyed
report making charcoal in government forests. Notably, each of these districts contains or
borders a prominent Forest Reserve, which most likely serve as the source of charcoal.31
31 The reserves are: Kakamega Forest National Reserve (Kakamega); the Mau Forest Complex (Nakuru); Aberdare Forest Reserve (Nyeri); and Mt. Elgon Forest Reserve (Trans Nzoia) (Akotsi and Gachanja, 2004).

261
However, the assumption that charcoal in ll areas originates from illegally harvested trees
from government-owned forest areas is not supported by evidence.
One could also argue that charcoal from state-owned forests is a significant source of the
nation’s supply because, although the number of producers is lower, the volume that they
produce high is higher. However, this is not supported by evidence either. Data from the
ESD-A survey indicates that the volume of charcoal production among charcoal makers
producing charcoal in state-owned forests is not significantly different from charcoal makers
working on their own private land or on private land owned by others. The distribution of
production volume among charcoal makers producing charcoal on different types of land is
shown in a box plot in Figure 38 (data from respondents who reported making charcoal in
government forests is shaded). The mean monthly production among charcoal makers in
Narok surveyed in this field work is shown by the dashed horizontal line, which is well
above the 75th percentile of all production.32
32 Outliers are defined as in Figure 37, but extreme values have been omitted from the graph for clarity. One-way ANOVA (including outliers and extreme values) indicates that average production differs significantly (p < 0.05) only between charcoal makers working on their own private land and charcoal makers working on other private land. The latter, which characterizes the major mode of production in Narok and Uasin Gishu districts, has highest level of production volume. Average production volume of charcoal makers making charcoal illegally in state-owned forests is not significantly different from any other category at the 5% level.

262
Figure 38: Nationwide monthly production from charcoal makers working on different types of land
If, under current conditions in which charcoal of any origin is discouraged if not completely
criminalized by the state, charcoal production in protected areas is not significantly greater
than charcoal production in other areas, there is no evidence suggesting that degradation of
protected forest areas would accelerate should charcoal production be decriminalized and
encouraged on private, communal, or county council land, while remaining illegal in state-
owned forest areas. In fact, if officials charged with protecting forest areas devoted their
energy to preventing charcoal production and other banned activities within the boundaries
of protected areas rather than patrolling tarmac roads far from the forest boundaries, large-
scale illegal charcoal production could probably be prevented. In addition, experience has
91784532634 N =
Location of charcoal production
Other land
County council land
Communal landOther private land
Own land
Mon
thly
pro
duct
ion
(35
kg b
ags)
150
100
50
0
Max *
Min
Median 75th percentile
25th percentile
143
Gov't land
Mean monthly production among Narok’s charcoal
makers
* The minima and maxima defined by the lines do not include outliers shown by open circles. Outliers are those data points that are more than 1.5 IQR above (or below) the IQR of the data.

263
shown, when there is political support to protect sensitive forest areas in Kenya, it can be
done effectively through a variety of means.33 Once the protection of sensitive areas is
assured, the business of charcoal making should can proceed in other areas.
The question then arises of how to promote charcoal production as a legitimate business
activity? In order for the charcoal trade to be recognized not only as a legitimate business, but
as a viable and thriving sustainable trade, it will require substantial R&D efforts. The policies
suggest charcoal production be promoted both through sustainable harvesting of native
vegetation in dryland areas and commercially-oriented plantations.34 Native vegetation is
currently the primary source of trees for charcoal.35 Fewer than 10% of respondents in the
ESD-A study report using exotic tree species for charcoal. In Narok, no respondents reported
using exotic species for charcoal.
There is little doubt that many native species are suitable for charcoal production. However,
the extent to which they are used sustainably for this purpose remains an open question.
Several studies conducted in Kenya and in other Eastern and Southern African countries with
33 Political will is critical. Much of the loss of Kenya’s forest cover in the past decade has resulted from the allocation of land in forest areas for political patronage (Wangwe, 2005). Nevertheless, there have been successful cases of protection. Two models that have seen some success at curbing incursions into protected forest areas are the fencing of the Aberdare Forest Reserve (Lambrechts, Woodley et al., 2003) and the transfer of control of the Mt. Kenya Forest Reserve from the FD to KWS (Vanleeuwe, Woodley et al., 2003). The socioeconomic impacts of restricting access to forest resources has not been studied in either case.
34 They are, however, silent on charcoal production as a by-product of land clearance like that taking place in Narok.
35 Only two of the ten types of tree used most frequently by charcoal makers surveyed in the ESD-A study was an exotic species (Eucalyptus spp. and Mangifera indica: the latter, which is the tree of the mango fruit, has become naturalized in Kenya).

264
similar agro-ecological conditions have shown that it is possible to manage stands of native
vegetation for charcoal production, it simply hasn’t been attempted commercially in Kenya.
This issue will be pursued further in Chapter 6.
There are a wide range of number of indigenous and exotic species suitable for charcoal
production. Finding appropriate species is not a great challenge. A much more challenging
aspect of transforming the trade lies in developing appropriate institutional arrangements to
provide seeds, training, and market access to ensure sustainable and profitable production.
Such systems must be sensitive to existing production relations. For example, in Narok,
charcoal production finances land clearance so that recent beneficiaries of group ranch
subdivision can cultivate their land without the need raise large amounts of capital. Under
current conditions, landowners are not interested in pursuing charcoal production in the long-
run. It is simply one step in the process of changing land management from primarily
pastoral to primarily agricultural production. If charcoal were clearly and openly legitimated
under a different regulatory regime, charcoal production itself might be an economically
attractive land use option rather than a one-time activity.
However, since the first government bans on charcoal production and transport went into
effect in the late 1970s, the trade has been driven underground and become, in effect,
illegible to the state. As one popular environmental author has written, “Banning
charcoal…was the first step in eroding the government’s control over the industry. How do
you regulate a trade that you have officially outlawed?” (Kantai, 2002, p. 20).
Given the stake that many local authorities have in maintaining charcoal’s current legal
ambiguity, the transition promises to be rocky indeed. It would, however, be greatly

265
facilitated if the national government unambiguously decriminalized charcoal that is
produced outside of state-owned forests. Such decriminalization will reduce the power that
local authorities have to extract bribes from charcoal buyers and transporters. It will also
lower the barriers to entry that currently prevent new actors, including coalitions of charcoal
producers, from entering the transport business. New entries into the transport stage of the
commodity chain could decrease the disproportionately large profit margins that large-scale
buyers and transporters are able to capture and potentially improve producer prices by
introducing competition into what has been, essentially, an oligopsonistic market.
The feasibility of these changes rests on weakening the culture of corruption that pervades
much of Kenya’s governing institutions. If one adopts that cynical view that individuals,
including government officials, will act in their own self-interest in the absence of sufficient
censure to behave otherwise, then policies need to be designed in such a way that minimizes
the opportunities for those in positions of authority to capture benefits of forest exploitation.
One possible approach to this would be to build downward accountability and community
participation into the design and implementation of resource management schemes.36 Civic
education would be helpful in order to ensure that people are aware of, and fully understand
their rights under the newly introduced laws.
36 Both community and private sector participation are included in Kenya’s the newly adopted Forest Bill (Government of Kenya, 2004). Of course, participation in resource management guarantees neither equitable not sustainable outcomes (Mohan and Stokke, 2000; Ribot, 2004). Nevertheless, encoding the rights of individuals and communities to participate in forest management into law creates opportunities that did not previously exist.

266
Organization of the trade and decentralization of resource management
The other two policy proposals described above originate from an MoE Draft Wood Energy
policy that has yet to be tables before Parliament.37 The suggestion that woodfuel producers,
transporters and traders form self-regulating associations is perhaps the largest departure
from the status quo and is particularly relevant for this research. Both the feasibility and the
efficacy of this proposal are highly dependent on local circumstances. In an area like Narok,
where charcoal production is highly commercialized and dominated by specialized charcoal
makers producing trees on other people’s land, such a policy would possibly be welcomed by
producers.38 However, in areas where charcoal production is minimally commercialized and
primarily carried out by small-scale producers who are only weakly tied to one another, it is
unlikely to be a welcome requirement. As a result, those producers will continue to produce
at the margins of legality or be driven out of business, thereby losing a small but potentially
critical source of cash income.
Buyers and traders also stand to lose from organization of charcoal producers because when
producers are organized, they will likely get a better farm-gate price and cut, possibly deeply,
into the trader’s profit margins.
37 The individual who drafted the Policy stated in an interview that she and other proponents of the policy were waiting until the Forest Bill passed before introducing the Wood Energy Policy as a Bill because many of the provisions within the energy bill were contingent on the passage of the Forest Bill (Mugo, 2004).
38 In fact, one informant described an attempt to organize and officially register a charcoal producers’ association in Narok. Their attempt was foiled when the district Registrar of community groups refused to register them due to charcoal’s questionable status (from an interview .

267
Lastly, The devolution of forest management to local administrative units is a novel approach
given Kenya’s past history of highly centralized resource management. However, as this
research indicates, certain local authorities already are the de facto managers of Narok’s
woodlands and forest areas through bans on the movement of forest products and occasional
deployment of the Chief’s Act to restrict tree clearance on private land. Through these
machinations, key individuals within district administration, forest department and law
enforcement institutions capture a large portion of the benefits that flow as a result of
charcoal production in the district. Hence, they have an immense stake in maintaining the
status quo. Any shift in the management of Narok’s woodland resources toward sustainable
woodfuel production is likely to be manipulated by the very individuals that the policy
suggests should be granted more management responsibility. Without the downward
accountability discussed above, this creates a barrier to effective and sustainable management
of woodfuel production that might quite possibly be insurmountable.

268
Chapter 6
From Commodity Chain Analysis to Life Cycle Analysis: quantifying the environmental impact of charcoal in Narok
Introduction
This chapter will focus primarily on the life cycle impacts of charcoal; however, in order to
understand how these impacts compare to other household fuels, the life-cycle impacts of
fuelwood and common fossil fuels will also be discussed. As was mentioned above, Kenya is
one of the world’s leading consumers of charcoal. To satisfy Kenya’s daily charcoal demand,
tens of thousands of thousand cubic meters of woody biomass are carbonized each day.
Wood for Kenya’s charcoal is harvested primarily from woody savannah and range lands that
constitute over two thirds of the country’s land mass as shown in Figure 39.
Relative to other common household fuels, charcoal is associated with particularly high
greenhouse gas (GHG) emissions because of the nature the charcoal life-cycle and the
physical properties of charcoal as a fuel (Pennise, 2003; Bailis, Pennise et al., 2004).
Through a life-cycle assessment (LCA) approach, this paper estimates the emissions from the
charcoal life-cycle under several different charcoal production systems and compares these

269
emissions to those associated with the life cycle of other common household fuels including
fuelwood,1 charcoal, kerosene, LPG, and electricity.2
Figure 39: Kenya land cover showing predominant shrubland and woodland areas
Source: Landsat data from Japan International Co-operation Agency, Nat’l Water Master Plan, Kenya
1 Following definitions used by the UN Food and Agriculture Organization (FAO), I use the term fuelwood to describe wood that is combusted directly for fuel (also commonly referred to as firewood). This is to distinguish fuelwood from wood that is carbonized to make charcoal, or processed in some other way before it is used as fuel. In contrast, the FAO uses woodfuel to describe any wood that is used for energy, including both fuelwood and wood that is transformed into charcoal before final use.
2 Electricity is an important source of household energy, however few people have access to it. Moreover, there is evidence showing that when people in Africa do have access to electricity, they rarely use it for the bulk of their cooking needs, preferring to use it for lighting and running small appliances while using cheaper, low quality fuels for cooking and heating. In Kenya, roughly 15% of the population has access to electricity, but only 4% of the population use it for any cooking task, and less than 1% consider it their “main” cooking fuel (World Bank, 2000; Bailis, Ezzati et al., 2005a). Thus, in this analysis electricity will only be included in qualitative discussions, and will not be included in the quantitative comparisons of household fuel choice.
Plantations and commercial agriculture
Woodland Shrubland (dense) Shrubland (sparse) Forest Water
Barren land
Grassland Agriculture (sparse) Agriculture (dense)
100 0 100 Kilometers

270
As with any forest product, the life cycle of charcoal and other wood-based fuels
incorporates both biological components and industrial or market-oriented components. Each
component of the life cycle is linked to one another by the land-management decisions
associated the woodfuel production system (Schlamadinger and Marland, 1996;
Schlamadinger, Apps et al., 1997). While charcoal is generally more GHG intensive than
other household fuels, including petroleum-based fuels (Brocard, Lacaux et al., 1996; Smith,
Uma et al., 2000; Bertschi, Yokelson et al., 2003; Pennise, 2003; Bailis, Ezzati et al., 2005b),
I will demonstrate that the net emissions that result from its use depend strongly on the
production system that is in place.
This work has important implications for Kenya and for many countries in sub-Saharan
Africa, where the use of charcoal is widespread (Bailis, Ezzati et al., 2005a). In Kenya, there
is currently debate at the highest level of government over the role of the country’s forest
areas for both economic development and environmental conservation as well as more
specific policy questions concerning wood, charcoal and other forms of energy (Okwemba,
2003). The stakes in these debates have increased since late last year, when the Nobel Peace
Prize was awarded to Prof. Wangari Wa Maathai, a famous Kenyan environmentalist. Dr.
Maathai is one of the most vocal supporters of Kenya’s forests and an outspoken critic of the
country’s heavy reliance on woodfuels (Bosire, 2003).
The issue extends beyond Kenya. Charcoal is a popular household fuel throughout sub-
Saharan Africa. Across the region, roughly 25 million tons of charcoal will be consumed in
2005 (Bailis, Ezzati et al., 2005b). Few countries have mechanisms in place to ensure that
production occurs on a sustainable basis. Kenya exemplifies this situation - charcoal exists at

271
the margins of the law. Harassment of producers and traders is common including arrests,
fines, and confiscations, as well as demands for bribes that can total as much as 30% of the
charcoal’s retail price.3 Charcoal represents a massive transfer of resources from rural to
urban and peri-urban areas, with very little reinvested in the areas where charcoal originates.
By estimating the GHG balances associated with different charcoal production systems, I
hope to draw attention to this very common, but neglected sector of the rural economy
throughout sub-Saharan Africa and demonstrate that charcoal production represents an
opportunity for investments in GHG mitigation that is linked very strongly to rural
livelihoods.
The remainder of this chapter is divided into 4 remaining sections. First, I will describe the
charcoal production systems currently used in Kenya as well as several alternatives to these
current systems, which have the potential to improve the livelihoods that people derive from
charcoal production as well as reduce the Global Warming Impact (GWI) of charcoal-related
activities. Following that, I will introduce the life cycle assessment models that I use to
determine GWI from different charcoal production systems as well as briefly describe the
models used to assess fossil fuel production systems. Then, I will present the results of these
assessments in which I compare several charcoal production systems to other common
household fuels. In the final section I will discuss the policy implications of these results and
suggest some possible paths for future research.
3 This figure is derived from fieldwork conducted by the author. An explanation of the revenue streams associated with the charcoal commodity chain is given in a thesis chapter that is currently in progress.

272
Charcoal production systems
The process of transforming wood into charcoal adds value to roughly cut wood, a very basic
raw material. Charcoal is made by heating wood in an oxygen-deficient environment. The
process, called pyrolysis, drives off the moisture and most of the volatile compounds in the
wood, leaving behind mostly fixed carbon (Foley, 1986). The end-product is lighter and
volumetrically smaller than the original wood with a higher calorific value, which makes it
more economical to transport. In addition to its favorable transport characteristics, charcoal is
favored by consumers for several reasons. When used for cooking, charcoal requires less
attention than a wood fire and produces less smoke.4 In addition, it can be purchased in small
quantities, stored indefinitely, and is cheaper to cook with than other fuels (Bailis, 2004).
Charcoal can be made from nearly any form of biomass, including many types of agricultural
residue and timber processing waste (Bailis, 2004). However, nearly all charcoal consumed
in Kenya and elsewhere in SSA is made from local tree species (Mugo, 1999; Ministry of
Energy, 2002). Certain trees are preferred for charcoal, while others are known to produce an
inferior product (Odour and Wekesa, 2003). For example, in Kenya several species of Acacia
4 The smoke produced by charcoal is lower than that produced by typical wood fires, however charcoal fires produce more carbon monoxide (CO) than wood per unit of fuel burned (Smith, Uma et al., 2000; Bhattacharya, Albina et al., 2002b). This can lead to dangerous concentrations of CO in households using charcoal, although empirical measurements of pollution concentrations in households using wood and charcoal showed no significant difference in CO between the two groups of households (Ezzati, Kammen et al., 2000a).

273
are favored, although the use of over 200 different tree species has been recorded (Mutimba
and Barasa, 2005a).5
There are several important factors that define systems of charcoal production. These include
the type of land tenure arrangements, land management practices, and the production
technology that is used. I will discuss each of these aspects briefly.
Land tenure and land management
In Kenya, the trees harvested for charcoal typically originate from one of three types of land
tenure systems: private land, trust land and state-owned land.6 Within each land tenure
system, there are several types of land management practices with which charcoal is
associated. On private land, charcoal is typically made from naturally occurring woody
vegetation, when newly opened or fallow land is opened for cultivation. In addition, in some
areas where farms are small but long-established, charcoal production also occurs when
landowners harvest trees they have planted themselves. Usually these trees were planted for
other purposes - for example, to provide fruit, building materials, or shade - but are used for
charcoal when their original purpose has been met or in the event that the of a cash
emergency (Chambers and Leach, 1989; Mutimba and Barasa, 2005a). Table 22 describes
some of the management practices associated with different types of private land as well as
other tenure systems in which charcoal is made.
5 See Appendix 6 for a list of tree species used for charcoal in the study area.
6 Trust land is land that is occupied by rural communities, but administered by local government institutions (Okoth-Ogendo, 1991). This should be distinguished from Group Ranches (see Table 22), which are essentially private lands held communally (Galaty, 1980).

274
In this analysis, I will focus on charcoal production from private lands, which is the most
common form of production in Kenya (Mugo and Ong, 2003; Mutimba and Barasa, 2005a).
This production system is often associated with land clearance for cultivation, pastoralism, or
ranching. In the case of clearance for cultivation, charcoal is a by-product of land use change
(LUC). In these cases, charcoal is useful in that its sale helps to offset the cost of clearing
land. When this occurs, LUC is likely to be long-lasting or permanent.
In the case of charcoal production associated with ranching or pastoral land management,
trees are usually selectively harvested. Trees of a specific species or size class are chosen
while others are left behind (Mugo and Poulstrup, 2003). These systems are subject to
minimal silvicultural management and are left to regenerate naturally. Depending on the
intensity and frequency of harvest as well as the occurrence of post-harvest practices such as
burning or grazing, land cover may be restored over time. However, even in the absence of
any land management, stand structure and species composition may be permanently altered.7
As Table 22 indicates, charcoal can be produced on private land under other management
systems than clearance for cultivation or single tree harvest. For example, trees can be
planted specifically for charcoal and harvested on a fixed rotation. This can occur on a range
7 In Kenya, there have been few systematic studies of stand-level impacts of charcoal production. One anecdotal account suggests that species distributions are impacted as a result of selective harvesting (Dodson, 2002). Another study suggests that impacts are minimal if harvesting rotations are sufficiently long to allow for regeneration (Okello, O'Connor et al., 2001). Elsewhere in South and East Africa, several studies have been conducted that suggest the impacts of charcoal production are minimal if stands are well-managed (Chidumayo, 1988; Chidumayo, 1993; Hosier, 1993).

275
of scales from individual farmland to commercial plantations. Though technically feasible,
this is extremely rare in Kenya.8
Table 22: Land tenure system and management practices associated with charcoal production Land tenure system Management practices associated with charcoal production Private land:
Small farms (shambas) Trees planted for various purposes may be used for charcoal after those purposes are met or in response to cash emergency (common in some areas). Opening new land or clearing fallow land for cultivation (common in some areas). Trees planted specifically for charcoal (very rare).
Commercial farms Opening new land or clearing fallow land for cultivation (common in some areas). Tree plantations Silvicultural management – trees planted commercially for charcoal (rare) or
planted for another purpose (timber, fruit, tannin extraction) with non-merchantable portion used for charcoal.
Private or Group ranches
Ranching and pastoral land management – landowners (individual or communal) can permit charcoal burners to cut trees and make charcoal, possibly for a fee (legal). Occasionally, charcoal makers may also “poach” trees from ranches (illegal).
Trust land: Trees may be poached (illegal) or charcoal makers may seek permission from local governing body.
State-owned land: State Forests and National Parks
Trees are poached specifically for charcoal or for timber with non-merchantable portion made into charcoal (illegal). “Squatting” – forest area is cleared for cultivation and/or settlement; charcoal is made from slash (illegal).
The lack of tree planting is largely a result of charcoal’s ambiguous legal status. In the
current policy environment, there is no guarantee that trees planted for charcoal will be
allowed to reach a market. However, as mentioned above, there are ongoing debates among
policy makers that may lead to substantial changes in the way that charcoal is regulated. If
8 At the time of writing, there is one commercial firm in Kenya making charcoal on a large scale from Eucalyptus spp. using off-cuts and rejects from their production of utility poles (Mutimba and Matiru, 2002). A second firm that used to extract tannins from plantation-managed Acacia mearnsii (black wattle) used to make charcoal from the remaining trees after the bark had been stripped. However, this company closed its operations and sold off its plantations several years ago (Nation Correspondent, 1999; 2000).

276
such changes are implemented, it will enable individual farmers and commercial firms to
invest in commercial charcoal production.9, 10
A second alternative to current practices is to integrate charcoal production into small-scale
agricultural production. This could include many combinations of practices. For example,
charcoal tree-crops can be grown concurrently with fruit tree crops or other cultivars in a
multi-story agroforestry system. Alternatively, charcoal tree-crops could be used as part of an
improved fallow system in which fallow fields are sown with nitrogen-fixing trees that can
be harvested for fuelwood or charcoal after 3-4 years (Sanchez, 1999).
Charcoal production technology
Charcoal production systems are also characterized by the production technology that is
used. Charcoal can be produced by a range of methods, from simple earth kilns to brick or
metal kilns. In more industrialized settings, retorts can be used to capture condensable
compounds, which can be redirected into the kiln and burned to generate needed for the
charcoal-making process. In addition, some of the condensable compounds have value in
other markets and can be extracted and sold (FAO, 1983; 1985; Foley, 1986). The earth kiln
is the most common method of making charcoal in Kenya, as well as in the rest of sub-
Saharan Africa. These may be associated with low yields and large emissions of pollutants
9 There is currently a new Forest Policy (Government of Kenya, 2004) on the table that failed to pass a parliamentary vote in June, 2004, because of widely recognized political wrangling (Nation Team, 2004). Although it is expected to eventually pass, it has yet to be brought up for a second vote.
10 There are currently several pilot projects meant to demonstrate the feasibility of charcoal production from dedicated tree plantations for small, medium and large-scale farmers.

277
like carbon monoxide (CO) and unburned hydrocarbons.11 These emissions result in
substantial climate impacts from charcoal relative to other forms of household fuel. This is
described in more detail below.
Improved charcoal production technologies have been introduced in order to increase
production efficiency and reduce the emissions of potentially harmful pollutants. However,
the use of these technologies remains very low because of limited awareness, weak technical
capacity, and high risks to investment. If investment in carbon emissions mitigation were
directed to the charcoal sector it would facilitate the introduction of this technology, as I will
demonstrate below.
Various production technologies can be combined with any one of the land management
systems described above. Each integrated system has different implications for the fate of
carbon in the ecosystem. In this paper, I compare the GHG emissions associated with
Kenya’s current predominant charcoal production systems, which are characterized by land
clearance for crop cultivation or itinerant charcoal production on rangeland using earthen
kilns to two groups of alternative models, which include land management practices
specifically for charcoal production as well as the integration of improved kilns into
production systems.
In Kenya’s Narok district, one of Kenya’s most important charcoal production areas and the
focal area of my research, charcoal is produced on land that is being cleared for cultivation.
11 The yields from earth kilns are highly variable. Appendix 5, which describes lists charcoal yields from a range of previous studies as well as results from field work by the author.
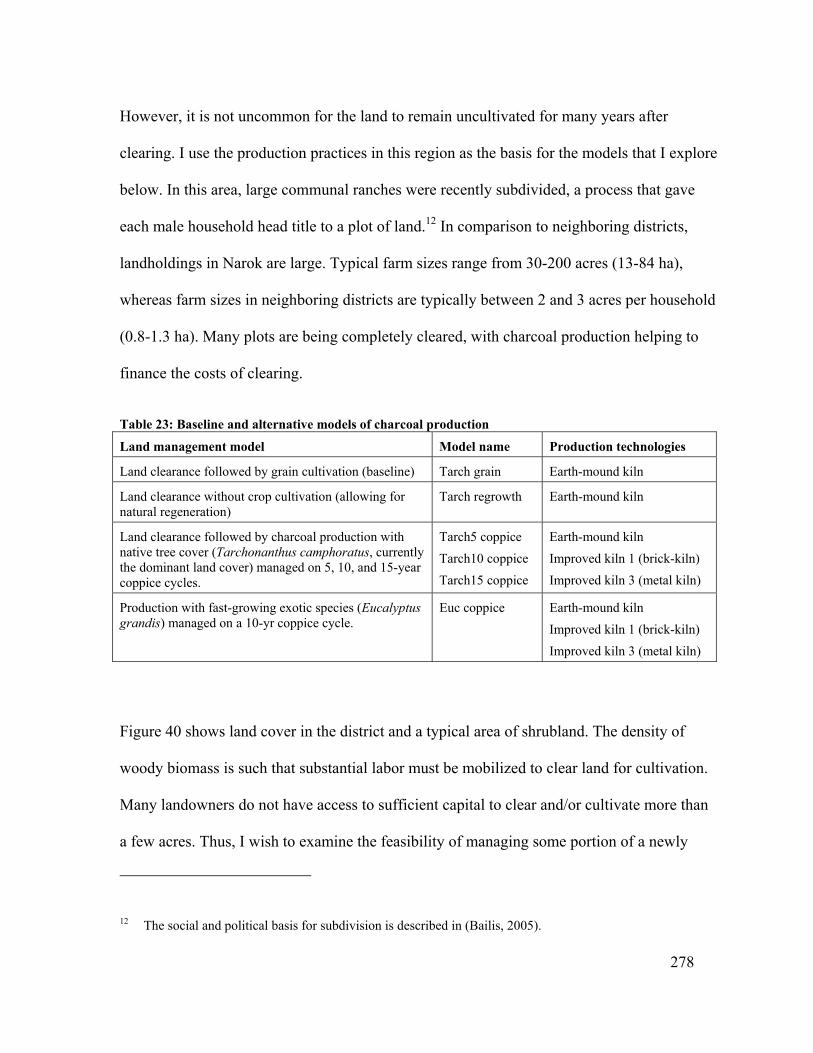
278
However, it is not uncommon for the land to remain uncultivated for many years after
clearing. I use the production practices in this region as the basis for the models that I explore
below. In this area, large communal ranches were recently subdivided, a process that gave
each male household head title to a plot of land.12 In comparison to neighboring districts,
landholdings in Narok are large. Typical farm sizes range from 30-200 acres (13-84 ha),
whereas farm sizes in neighboring districts are typically between 2 and 3 acres per household
(0.8-1.3 ha). Many plots are being completely cleared, with charcoal production helping to
finance the costs of clearing.
Table 23: Baseline and alternative models of charcoal production
Land management model Model name Production technologies
Land clearance followed by grain cultivation (baseline) Tarch grain Earth-mound kiln
Land clearance without crop cultivation (allowing for natural regeneration)
Tarch regrowth Earth-mound kiln
Land clearance followed by charcoal production with native tree cover (Tarchonanthus camphoratus, currently the dominant land cover) managed on 5, 10, and 15-year coppice cycles.
Tarch5 coppice Tarch10 coppice Tarch15 coppice
Earth-mound kiln Improved kiln 1 (brick-kiln) Improved kiln 3 (metal kiln)
Production with fast-growing exotic species (Eucalyptus grandis) managed on a 10-yr coppice cycle.
Euc coppice Earth-mound kiln Improved kiln 1 (brick-kiln) Improved kiln 3 (metal kiln)
Figure 40 shows land cover in the district and a typical area of shrubland. The density of
woody biomass is such that substantial labor must be mobilized to clear land for cultivation.
Many landowners do not have access to sufficient capital to clear and/or cultivate more than
a few acres. Thus, I wish to examine the feasibility of managing some portion of a newly
12 The social and political basis for subdivision is described in (Bailis, 2005).

279
subdivided plot for charcoal production using native vegetation (Tarchonanthus
camphoratus). This requires minimal inputs and could yield more benefits to the land owner
than simply relying on charcoal as a one-time activity to open land. In addition, I will
compare this option to a second model that allows for clearance of natural vegetation,
followed by the planting of fast growing exotic tree species (Eucalyptus grandis) for charcoal
production. These options are explained in Table 23 and form the basis for the models I
explore below.
LCA models for charcoal and other household fuels
General background
Life cycle assessment (LCA) is a means to evaluate the environmental burdens associated
with particular goods (and services) by identifying and, if possible, quantifying energy and
material usage and releases of pollution or other forms of waste associated with the
production, consumption and disposal of the good (or the provision of the service). LCA also
estimates the environmental impact of the energy and material flows. Finally, if possible,
LCA attempts to evaluate options that may result in reductions of those impacts (Graedel,
1998). A general approach to LCA for a given activity can be summarized in a matrix that
places processes on one axis and impacts on another as in Table 24.

280
Figure 40: Land cover in Narok District and typical area of dense shrubland
#
#
#
#
##
#
#
#
#
#
#
#
#
##
#
#
#
#
#
#
#
#
#
##
#
# ##
##
# # ##
#
#
#
##
#
##
###
##
#
#
####
#
##
####
###
## ####
##
#
#
#####
#
##
####
#
#
#
###
### ##
#
##
##
#
#
#
#
##
###
#
#
#
#
##
#
#
#
# ###
#
#
##
#
###
#
#
#
#
##
#
###
#
##
#
#
##
#
#
#
#
#
##
#
#
#
#
#
## #
#
#
##
#
#
#
#
###
Plantations and commercial agriculture
Woodland Shrubland (dense) Shrubland (sparse) Forest Water
Barren land
Grassland Agriculture (sparse) Agriculture (dense)

281
Table 24: Life cycle stages and environmental impacts (adapted from (Graedel, 1998)) Raw
material extraction
Production Distribution Utilization Disposal
Specific processes or material flows
Solid wastes
Water contamination
Airborne pollutants
Energy requirements
Land use change
Broad environmental concerns
Climate change
Biodiversity loss
Ozone depletion
Air quality
Resource depletion
Water quality
As Table 24 indicates, impacts can be described as either broad environmental concerns or
specific processes or material flows that affect those concerns. Broad environmental concerns
include, inter alia, climate change, biodiversity loss, ozone depletion, water quality, resource
depletion, and air quality.13 Specific processes include the generation of solid wastes, water
contaminants, and airborne pollutants, as well as energy requirements. These categories can
be broken down further to their constituent parts as will be done for airborne pollutants in
this analysis. In developing the LCA, each cell of the matrix can be assessed quantitatively
13 This list is not meant to be exhaustive. See (Graedel, 1998) for a more detailed description. Also, note that most of these “broad” environmental concerns overlap with one another in some way – for example, resource depletion and climate change.

282
with continuous or discrete variables. They can also be assessed qualitatively as better,
worse, or the same as some reference or baseline process (Graedel, 1998).
LCA for climate change from household energy use
This LCA, which is specifically designed to assess the impacts of household energy
consumption on climate change, is focused primarily on the emission of greenhouse gases
(GHGs) associated with the production, distribution and final consumption of common
household fuels. In addition, land use change (LUC), leading to an additional flux of GHGs,
is an important component of the analysis. This is particularly important because the
principal activity under consideration is biomass-based energy production (IPCC, 2000b;
Matthews, 2001; Lettens, Muys et al., 2003); however, LUC can also play a role in the
climate impact of other forms of energy provision (Pacca and Horvath, 2002).
As mentioned above, LCA typically analyzes five life cycle stages: Raw material extraction;
Production; Distribution; Consumption; and Disposal. Each of these stages can have climate-
related impacts associated with it, although some stages have larger impacts than others.
Table 25 describes the processes and impacts that are associated with each stage for different
household energy systems.
As Table 25 illustrates, most fuels are associated with some climate impacts at each stage of
the life cycle with the exception of disposal. In the remainder of this section, I will describe
the methods utilized to estimate climate impacts of each life cycle stage for each household
fuel.

283
Table 25: Processes and impacts associated with life cycle stages of household energy options in Kenya a Household Fuel Source
Life cycle stage Fuelwood Charcoal Kerosene and LPG Electricity b
Raw materials extraction
Wood growth and harvest: CO2 sequestration, possible long-term LUC
Wood growth and harvest: CO2 sequestration, possible long-term LUC
Petroleum Exploration, drilling, and extraction: GHGs, possible LUC
Hydro
Dam building: long-term LUC, GHGs
Thermal
Petroleum Exploration, drilling, and extraction: GHGs, possible LUC
Geothermal
Plant construction: GHGs and possible LUC
Production No post-harvest production processes
Wood carbonization: greenhouse gases, LUC
Refining: GHGs Hydro
Power generation: no impact
Thermal
Power generation: GHGs
Geothermal
Power generation: no impact
Distribution Transport (usually minimal distance carried by animate power): no impact
Transport (usually medium distance (100-300 km) by mechanized vehicles): GHGs
Transport (usually medium to long distance (500-1000 km) by ship, pipeline, and mechanized vehicles): GHGs
Transmission: No impact
Utilization Household use: GHGs
Household use: GHGs
Household use: GHGs Household use: No impact
Disposal Ash disposal: no impact
Ash disposal: no impact
No waste generated: no impact
No waste generated: no impact
a Note this analysis only accounts for the life cycle stages of the each fuel (or electricity). It does not account for the possible impacts associated with the life-cycle of the stoves that are utilized with each fuel.
b Kenya’s installed power generation capacity includes a mix of domestic and imported hydroelectric (61%), petroleum-based thermal (34%), and geothermal (5%) power generation (AFREPREN, 2004).
There is no single model that estimates the flows of matter and energy associated with the
production and use of household fuels in developing countries. In order to make these
estimations I use a several different models, some of which are available to the general public
and some of which I have developed based on empirical measurements of emissions from
household fuel combustion. Each model targets one or more of the life cycle stages for each

284
fuel and develops an emissions factor (EF). This factor defines a ratio of GHG emissions to
the quantity of fuel produced or consumed in each life-cycle stage. The results are then
aggregated to give a net emissions factor for each fuel.14
The life cycles of both wood and charcoal incorporate biological as well as non-biological
components, but neither is heavily industrialized. Fuelwood is typically harvested by manual
labor and transported only short distances. People collect fallen wood and dead branches
rather than cut live trees and, with the exception of cutting the wood to a useful size and
tying it with vines or rope, the wood is not processed or packaged in any way (Leach and
Mearns, 1988). Wood for charcoal is usually harvested manually also, though occasionally
gasoline powered tools are used. It is carbonized and packaged for transport on-site and may
be transported long distances to retail points before it is sold to the final consumer (Kituyi,
2004b). In contrast to woodfuels, the life cycles of fossil fuels are fully industrialized with
complex life cycles. Schematic models representing the life cycle of each fuel are shown in
Figure 41a-c. The methods used to assess climate impact of each life cycle stage are
discussed in detail below.
14 See (Smith, Uma et al., 2000) and (Bailis, Ezzati et al., 2003) for more detailed explanation of the derivation of emission factors.

285
Figure 41: LCA Models a: fuelwood
Land input
Process
Energy input
Waste energy
Material input
“Waste” output
Recycled material flow Material flow Recycled CO2 flow
Useful Energy output Land-use component
Land
Solar energy
H2O
Energy
Energy
Energy
Biomass production
Atmospheric Carbon
Wood extraction Solid wastes (slash and unused
timber)
Emissions from wood
decomposition (CO2, CH4)
Transportation Fuel combustion
emissions (CO2, CH4, NOx, VOCs, CO, PM)
Fuel end-use
Heat
Combustion emissions (CO2, CH4, NOx, VOCs,
CO, PM)
Useful Heat
Stove materials

286
Figure 41b: Charcoal
Land input
Process
Energy input
Waste energy
Material input
“Waste” output
Recycled material flow Material flow Recycled CO2 flow
Useful Energy output Land-use component
L d
Solar energy
H2O
Energy
Energy
Energy
Energy
Biomass production
Atmospheric Carbon
Wood extraction Solid wastes (slash and unused
timber)
Emissions from wood
decomposition (CO2, CH4)
Carbonization
Heat (from harvested
wood)
Heat
Pyrolysis emissions (CO2, CH4, NOx,
VOCs, CO, PM, tars)
Solid wastes (brands, charcoal fines, dust, ash) Packaging
Packaging materials
Packaging materials
Transportation Fuel combustion emissions (CO2, CH4, NOx, VOCs,
CO, PM)
Fuel end-use
Heat
Combustion emissions
(CO2, CH4, NOx, VOCs, CO, PM)
Useful Heat
Stove materials
Land

287
Figure 41c: Fossil Fuels
Land input
Process
Energy input
Waste energy
Material input
“Waste” output
Recycled material flow Material flow Recycled CO2 flow
Useful Energy output Land-use component
Land
H2O
Energy
Energy
Energy
Energy
Extraction
Atmospheric Carbon
Solid and liquid wastes
Emissions (CO2, CH4, NOx, VOCs,
CO, PM)
Transformation Emissions (CO2, CH4, NOx, VOCs,
CO, PM)
Storage
Transportation and Distribution
Fuel combustion emissions (CO2, CH4, NOx, VOCs, CO, PM)
Fuel end-use Combustion emissions
(CO2, CH4, NOx, VOCs, CO, PM)
Useful Heat
Stove materials
Land
Energy
Solid and liquid wastes
Emissions (CH4, VOCs)
Packaging materials
Solid waste (fuel containers)
Heat

288
LCA for each household fuel
Fuelwood and Charcoal
In this section, the GHG emissions from each stage of the fuelwood and charcoal life cycle
are quantified. The emissions from production and end-use of woodfuels have been described
elsewhere (Smith, Pennise et al., 1999; Smith, Uma et al., 2000; Pennise, Smith et al., 2001;
Bhattacharya, Albina et al., 2002a; Bailis, Ezzati et al., 2003; Pennise, 2003; Bailis, Ezzati et
al., 2005b; a), however researchers have yet to fully integrate the impacts of LUC associated
with woodfuel production into analyses of these systems. Thus, emphasis is placed on the
emissions resulting from LUC at the raw material extraction stage. Other stages of the
woodfuel life cycle are also described briefly.
Fuelwood is also included in this section; however, as explained in Table 25, it is not closely
associated with LUC and undergoes no real processing. Moreover, it is typically consumed
close to the point of harvest. In contrast, charcoal undergoes substantial processing and it
may be transported several hundred kilometers from the point of harvest and production to
the point of consumption. Thus, most of the analysis in this section is focused on charcoal,
though fuelwood will be discussed where relevant. For example, there are end-use emissions
associated with the consumption of both fuelwood and charcoal.
Raw material extraction and fuel production
The impacts of fuelwood and charcoal production depend on the method and intensity of
wood harvesting as well as the post-harvest land management practices. For fuelwood, this
analysis models current behavior of fuelwood users in Kenya. Wood is harvested manually
from fallen branches, dead wood, or parts of trees that have been cut for other purposes, so
289
that are no emissions associated with the harvest. Nor are there emissions resulting from
long-term land use change. Charcoal production also begins with manual wood extraction.
However, as discussed above, charcoal production can lead to long-term changes in land
cover because of it involves the harvest of entire trees or stands of trees and because it is
often associated with changes in land-use.
Thus, for all charcoal production systems, this life-cycle stage is associated with changes in
terrestrial carbon resulting from long-term LUC. These changes can be quantified by
modeling stocks and fluxes of carbon at the stand level, which is the approach used in this
analysis.
The model that was used is CO2FIX (Version 3.1) (Nabuurs, Garza-Caligaris et al., 2001;
Masera, Garza-Caligaris et al., 2003).15 In this model, the total stock of carbon stored in a
stand of trees at any time is modeled as the sum of three carbon stocks:
CTt = Cbt + Cst + Cpt (tC ha−1) [1]
Where t is the time period under consideration, CTt is the total stock of carbon, Cbt is the total
carbon stored in living biomass, which includes both above-ground (AG) and below-ground
(BG) biomass, Cst is the carbon stored in soil organic matter (SOM), and Cpt is the carbon
stored in wood products (in this case wood that is harvested and subsequently converted to
15 This model simulates stocks and fluxes of carbon in trees, soil, and products, as well as the financial costs, revenues and carbon credits that can be earned under different accounting systems. All outputs are simulated at the hectare scale with time steps of one year. In addition to the references listed, see http://www2.efi.fi/projects/casfor/ for a full description of the model, presentations, and examples of how the model has been applied.
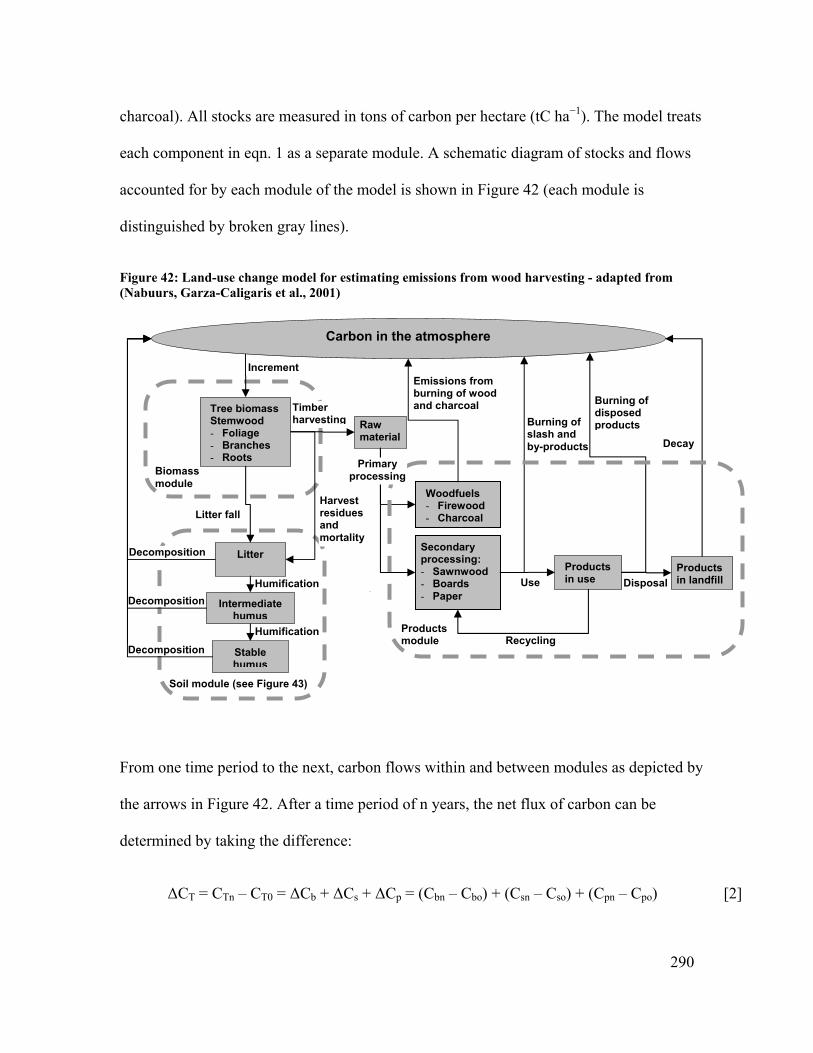
290
charcoal). All stocks are measured in tons of carbon per hectare (tC ha−1). The model treats
each component in eqn. 1 as a separate module. A schematic diagram of stocks and flows
accounted for by each module of the model is shown in Figure 42 (each module is
distinguished by broken gray lines).
Figure 42: Land-use change model for estimating emissions from wood harvesting - adapted from (Nabuurs, Garza-Caligaris et al., 2001)
From one time period to the next, carbon flows within and between modules as depicted by
the arrows in Figure 42. After a time period of n years, the net flux of carbon can be
determined by taking the difference:
ΔCT = CTn – CT0 = ΔCb + ΔCs + ΔCp = (Cbn – Cbo) + (Csn – Cso) + (Cpn – Cpo) [2]
Secondary processing: - Sawnwood - Boards - Paper
Raw material
Stable humus
Litter Products in use
Products in landfillHumification
Emissions from burning of wood and charcoal
Increment
Decay
DisposalUse
Recycling
Litter fall
Tree biomass Stemwood - Foliage - Branches - Roots
Intermediate humus
Humification
Harvest residues and mortality
Woodfuels - Firewood - Charcoal
Burning of disposed products Burning of
slash and by-products
Decomposition
Decomposition
Decomposition
Timber harvesting
Soil module (see Figure 43)
Biomass module
Productsmodule
Carbon in the atmosphere
Primary processing

291
In some circumstances, for example, in coppice systems, CTn is cyclic and it is more
appropriate to calculate a time average carbon stocking level, where, for period of n years:
∑=−
=n
0iTi
0nT C
tt1C [3]
In order to accurately simulate carbon dynamics for a given stand of trees, each module must
be parameterized according to the physical properties of that stand. The biomass module is
parameterized by inputting biomass growth and turnover, wood density and carbon content,
factors accounting for competition among and between cohorts of trees, natural mortality
(senescence), and harvest-induced losses. In addition, thinning and harvesting schedules are
input.
The soil module incorporates a dynamic soil carbon model that has been shown to robustly
estimate decomposition rates for different types of litter across a range of climatic conditions
(Liski, Nissinen et al., 2003). The model assumes carbon is input to the soil via litter as
depicted in Figure 42. The litter is divided into three compartments: coarse woody litter
consisting of stemwood, fine woody litter consisting of branches and coarse roots, and non-
woody litter consisting of foliage and fine roots. The rate of carbon input into each litter
compartment is determined by the growth and turnover rates, as well as inputs arising from
mortality and harvest wastes (slash) defined in the biomass module. Depending on its
chemical composition, the litter is partitioned into one of three subsequent compartments:
soluble compounds, holocellulose, and lignin-like compounds. The rate of this partitioning
depends on temperature and water availability. In addition to these compartments, which
constitute the labile pool of soil carbon, there are two humus compartments. Each

292
compartment (denoted here by the subscript i) has a specific decomposition rate (ki). The
soluble compounds and holocellulose compartments send a fraction of their carbon (psol,cel) to
the lignin-like compartment; the remainder (1-psol,cel) leaves the system. Similarly, lignin-like
compounds are transformed at a rate defined by klig. A fraction (plig) undergoes humification
and enters the first humus compartment, while the remainder (1-plig) leaves the system.
Carbon leaves the first humus compartment each period in a similar way, with a fraction
(phum1) transferred to the second (recalcitrant) humus compartment, and the remainder (1 –
phum1) leaving the system. Lastly, the remaining carbon slowly leaves the soil system entirely,
returning to the atmosphere at a rate defined by khum2. The entire process is depicted in Figure
43.
Figure 43: Stocks and flows of carbon in the soil module
Source: Adapted from (Nabuurs, Garza-Caligaris et al., 2001)
Finally, there is the product module. This part of the model tracks the carbon in the harvested
wood. If the forest stand is being exploited for long-lived products, the product module can
Branches and coarse roots
Non-woody Litter
Fine woody Litter
Coarse woody Litter
Soluble compounds
Holocellulose
Lignin-like compounds
Humus 1
Humus 2
Foliage and fine roots
Stemwood
CO2
CO2
CO2
CO2
CO2
psol
pcel
plig
phum1
ksol
kcel
klig
khum1
khum2
293
be an important sink for harvested carbon. However, in the case of stands that are managed
strictly for energy, there are no long-lived products and all of the carbon in wood harvested
in a given period is released to the atmosphere in that period. These emissions are discussed
further in the consumption stage below.
This model was not designed to calculate carbon stocks and flows for stands under a coppice
management system. The model assumes that all biomass, including belowground
components, enter either the pool of products or the pool of litter upon harvest. However, in a
coppice system, the belowground biomass remains in the pool of living biomass for the next
coppice cycle. Moreover, because of a well-established root mass, the rate of stem growth in
subsequent generations of coppice is typically faster than stem growth in trees planted from
seed or seedlings.
This problem was overcome by linking together a series of cohorts within a single model to
represent each generation of coppice. Thus, at the end of the nth coppice cycle, all of the
aboveground biomass components are removed and used for charcoal production. However,
the belowground biomass and soil carbon that has accumulated during the nth cycle is used
to define the initial root mass and soil carbon for the (n+1)th cycle. The plot in Figure 44a and
b show the estimated carbon stocks in above-ground (AG) and below-ground (BG) biomass
as well as soil carbon in a stand of native shrubs. Figure 44a shows a hypothetical
undisturbed stand. Figure 44b shows the same stand harvested at year 30 and subsequently
managed on a 10 year coppice cycle.

294
Figure 44a: Carbon dynamics in newly established stand of Tarchonanthus camphoratus
0
10
20
30
40
50
60
70
0 10 20 30 40 50Years
tC p
er h
ecta
re
AG carbonBG carbonSoil carbonTotal carbon
Figure 44b: Carbon dynamics in stand of Tarchonanthus camphoratus that is coppiced after 30 years
0
10
20
30
40
50
60
70
0 10 20 30 40 50Years
tC p
er h
ecta
re
AG carbonBG carbonSoil carbonTotal carbon
In total, six land management schemes were analyzed. Each scheme started with an identical
stand of woody shrubland (consisting primarily of T. camphoratus, the dominant tree cover
in the study area, which is shown in the photo in Figure 40). In order to reflect a mature stand
of native vegetation, the initial conditions were defined by the conditions in year-30 of
Figure 44a, which had the following stocking levels:
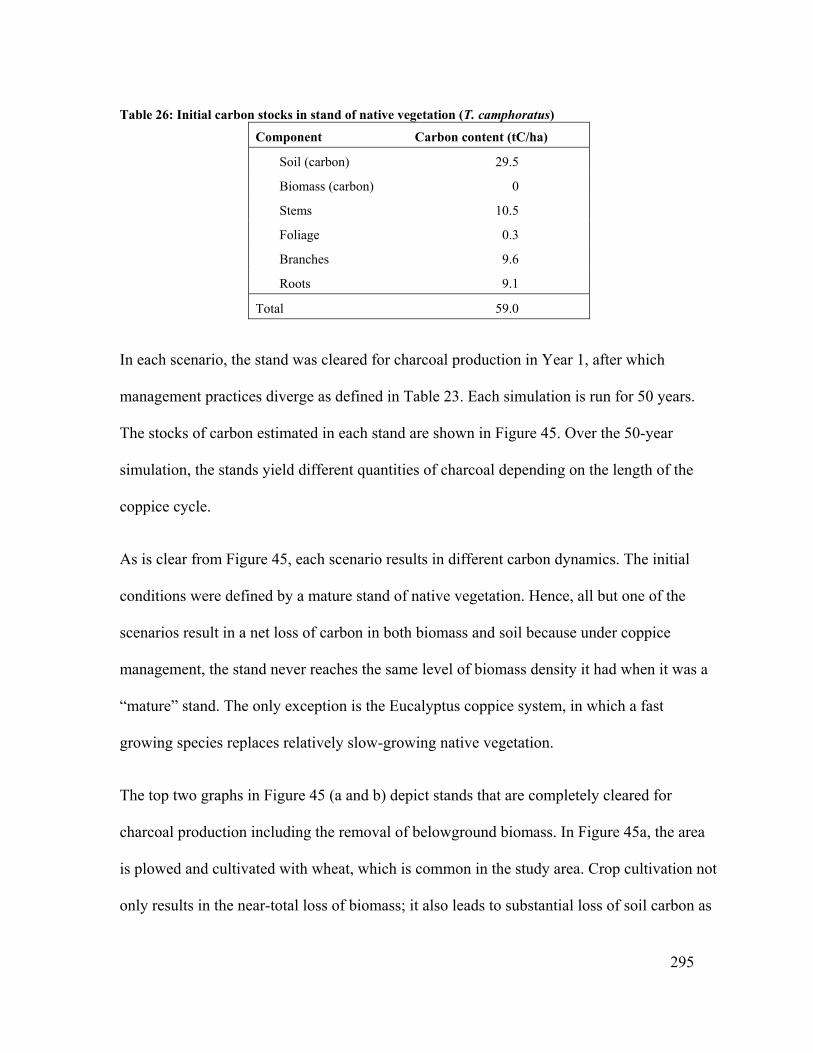
295
Table 26: Initial carbon stocks in stand of native vegetation (T. camphoratus)
Component Carbon content (tC/ha)
Soil (carbon) 29.5
Biomass (carbon) 0
Stems 10.5
Foliage 0.3
Branches 9.6
Roots 9.1
Total 59.0
In each scenario, the stand was cleared for charcoal production in Year 1, after which
management practices diverge as defined in Table 23. Each simulation is run for 50 years.
The stocks of carbon estimated in each stand are shown in Figure 45. Over the 50-year
simulation, the stands yield different quantities of charcoal depending on the length of the
coppice cycle.
As is clear from Figure 45, each scenario results in different carbon dynamics. The initial
conditions were defined by a mature stand of native vegetation. Hence, all but one of the
scenarios result in a net loss of carbon in both biomass and soil because under coppice
management, the stand never reaches the same level of biomass density it had when it was a
“mature” stand. The only exception is the Eucalyptus coppice system, in which a fast
growing species replaces relatively slow-growing native vegetation.
The top two graphs in Figure 45 (a and b) depict stands that are completely cleared for
charcoal production including the removal of belowground biomass. In Figure 45a, the area
is plowed and cultivated with wheat, which is common in the study area. Crop cultivation not
only results in the near-total loss of biomass; it also leads to substantial loss of soil carbon as

296
a result of reduced litterfall and root turnover, minimal organic inputs, and repeated annual
tillage.16 In Figure 45b, the area is allowed to regenerate naturally after clearance, which also
occurs in the study area, though to a lesser extent. After roughly 50 years, both biomass and
soil carbon have recovered their original levels.
Figure 45c-f show different types of coppice systems. Assessing changes in C in coppice
systems should be approached carefully (Schlamadinger and Marland, 1996). Rather than
choosing a fixed time at which to assess net C-stocks, it is more appropriate to use a time
average. A fixed time horizon only provides a snapshot into what is, in reality, a dynamic
system; a time average provides a more accurate sense of the long-term implications of each
management option. Average C-stocks are also sensitive to the choice of time horizon;
however, the sensitivity is not as extreme as in the snapshot approach provided that sufficient
coppice cycles are included. The results are presented in Table 27 with a 50-year time
horizon.
Assessing the flux of carbon at this stage, prior to charcoal production, yields carbon
emission factors that are solely dependent on land-use change. Summing the gain or loss in
biomass carbon, soil carbon, and the net quantity of wood harvested as in equation 2, gives
the total atmospheric flux of the system prior to the conversion of wood to charcoal. Taking
the ratio of this quantity to the amount of charcoal produced from the harvested wood ΔCp
with efficiency ε gives an emission factor for land-use change (EFLUC).
16 The assumptions used to quantify losses of soil-C in this scenario are derived from IPCC’s Good Practice Guidelines (IPCC, 2003).

297
⎟⎟⎠
⎞⎜⎜⎝
⎛ ++−=
p
psbLUC ΔC ε
ΔCΔCΔCEF [4]
Figure 45: Carbon stocks in each stand of shrubs and eucalyptus*
*AG = above-ground; BG = below-ground
Fifty years after the initial clearance in the grain cultivation scenario there is a net flux to the
atmosphere of 16.7 tC/ha. However, in each of the other scenarios, the combination of
changes in biomass and soil carbon, together with harvested wood, result in a net sink of
a) Native vegetation - grain cultivation
0
30
60
0 25 50
tC p
er h
ecta
re
c) Native vegetation - 10 year coppice
0
30
60
0 25 50
tC p
er h
ecta
re
b) Native vegetation - full regrow th
0
30
60
0 25 50
tC p
er h
ecta
re
d) Native vegetation - 15 year coppice
0
30
60
0 25 50
tC p
er h
ecta
re
f ) Eucalyptus - 10 year coppice
0
100
200
0 25 50
Years
tC p
er h
ecta
re
e) Native vegetation - 5 year coppice
0
30
60
0 25 50
Years
tC p
er h
ecta
re
AG carbon BG carbonSoil Total carbon
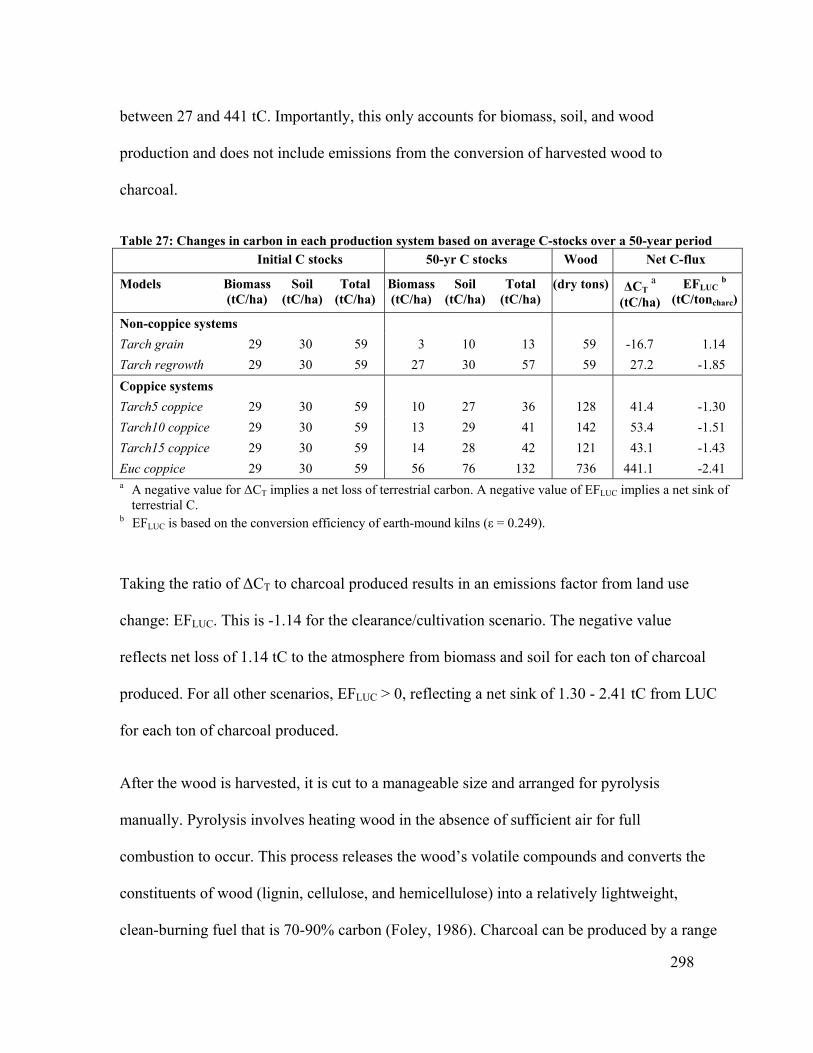
298
between 27 and 441 tC. Importantly, this only accounts for biomass, soil, and wood
production and does not include emissions from the conversion of harvested wood to
charcoal.
Table 27: Changes in carbon in each production system based on average C-stocks over a 50-year period Initial C stocks 50-yr C stocks Wood Net C-flux
Models Biomass (tC/ha)
Soil (tC/ha)
Total (tC/ha)
Biomass (tC/ha)
Soil (tC/ha)
Total (tC/ha)
(dry tons) ΔCT a (tC/ha)
EFLUC b (tC/toncharc)
Non-coppice systems Tarch grain 29 30 59 3 10 13 59 -16.7 1.14 Tarch regrowth 29 30 59 27 30 57 59 27.2 -1.85 Coppice systems Tarch5 coppice 29 30 59 10 27 36 128 41.4 -1.30 Tarch10 coppice 29 30 59 13 29 41 142 53.4 -1.51 Tarch15 coppice 29 30 59 14 28 42 121 43.1 -1.43 Euc coppice 29 30 59 56 76 132 736 441.1 -2.41 a A negative value for ΔCT implies a net loss of terrestrial carbon. A negative value of EFLUC implies a net sink of
terrestrial C. b EFLUC is based on the conversion efficiency of earth-mound kilns (ε = 0.249).
Taking the ratio of ΔCT to charcoal produced results in an emissions factor from land use
change: EFLUC. This is -1.14 for the clearance/cultivation scenario. The negative value
reflects net loss of 1.14 tC to the atmosphere from biomass and soil for each ton of charcoal
produced. For all other scenarios, EFLUC > 0, reflecting a net sink of 1.30 - 2.41 tC from LUC
for each ton of charcoal produced.
After the wood is harvested, it is cut to a manageable size and arranged for pyrolysis
manually. Pyrolysis involves heating wood in the absence of sufficient air for full
combustion to occur. This process releases the wood’s volatile compounds and converts the
constituents of wood (lignin, cellulose, and hemicellulose) into a relatively lightweight,
clean-burning fuel that is 70-90% carbon (Foley, 1986). Charcoal can be produced by a range

299
of methods, from simple earth kilns to brick or metal kilns as well as retorts that capture
volatile compounds either for extraction or to use them as an additional source of heat to
drive the charcoal-making process (FAO, 1983; 1985; Foley, 1986).
Earth-mound kilns are the most common method of making charcoal throughout sub-Saharan
Africa. A wide range of conversion efficiencies can be obtained from earth-mound kilns:
between four and ten tons of dry wood may be required to make 1 ton of charcoal, which is a
mass-based conversion efficiency of 10-25%. At these conversion rates, 60-85% of the
wood’s energy is lost in the production process. Using improved kilns or retorts can improve
conversion efficiency and reduce energy losses to only 30 or 40%. Improved kilns also result
in lower GHG emissions. Figure 47 shows empirical measurements of emissions from
different charcoal production technologies measured in several studies of earth-mound kilns
in sub-Saharan Africa and improved technologies that are in use in Brazil. For the analysis in
this study, emission factors from Kenyan earth-mound charcoal production were used to
represent the traditional charcoal. Note, this plot only includes GHGs that are targeted for
reductions in the Kyoto Protocol (KP) (IPCC, 1997a).17
Combining the emissions from LUC described in Table 27 with the emissions from charcoal
production illustrated in Figure 47 gives the net emissions from both raw material extraction
17 These gases are CO2, CH4, and N2O. Other pollutants released by biomass pyrolysis and combustion also have an effect on the atmosphere’s energy balance, including CO, NMHCs and PM. In addition, Figure 47 shows each GHG weighted by a 100-year global warming potential (GWP). The exclusion of non-KP gases and the choice of GWP affect the analysis.

300
and fuel production. These are given in Table 28 for both traditional (Kenyan earth-mound)
and improved (Brazilian metal) kilns.
Figure 46: Upstream GHG emissions of household fuels: charcoal production measured in three Earth-mound kilns in sub-Saharan Africa and an improved kiln in Brazil.
0
200
400
600
800
1000
Zambia W. Africa Kenya EM Brazil: metal
Traditional kilns Improved kilngC in
CO
2 eq
uiva
lent
uni
ts (1
00-y
r GW
P)
per k
g ch
arco
al p
rodu
ced
CO2 CH4 N2O
Source: Zambia (Bertschi, Yokelson et al., 2003); W. Africa (Brocard, Lacaux et al., 1996); Kenya and Brazilian improved kilns (Pennise, Smith et al., 2001; Pennise, 2003)
In the baseline (Tarch grain) case, charcoal made in both traditional and improved kilns
result in net GHG emissions (1.9 and 1.1 tC per toncharc respectively). However, in every
alternate case, the regeneration of wood and retention of soil C cause the combined
extraction and production stage to be a net sink.18
18 This result stands if either non-KP GHGs are included or if 20-yr GWP is used. However, it does not stand if both non-KP GHGs are included and 20-yr GWPs are used.

301
Table 28: Emission factors from wood extraction and pyrolysis (measured in tC/toncharc)
EFProd EFLUC + EFProd
Models EFLUC Kenya EM Brazil: metal Traditional kiln (Kenyan)
Improved kiln (Brazil: metal)
Tarch grain 1.14 0.79 0.36 1.93 1.14
Tarch regrowth -1.85 0.79 0.36 -1.06 -0.90
Tarch5 coppice -1.30 0.79 0.36 -0.50 -0.53
Tarch10 coppice -1.51 0.79 0.36 -0.71 -0.67
Tarch15 coppice -1.43 0.79 0.36 -0.62 -0.62
Euc coppice -2.41 0.79 0.36 -1.61 -1.29
Transmission/Distribution of wood and charcoal
In comparison to emissions from other stages of the charcoal life-cycle, emissions from
transportation are fairly low. These were estimated using emission factors from the IPCC’s
Guidelines for National Greenhouse Gas Inventories (IPCC, 1997b). The IPCC offers a range
of default emission factors reflecting different levels of emissions controls and fuel economy.
The emissions factors used in this analysis assume the worst case scenario of no emissions
controls and poor fuel economy (2.2 km/liter), which should accurately reflect the
performance of vehicles used to transport fuels in Kenya.
Summing the middle row of Table 29 yields a result that can be directly compared to the
results from the previous stage of the charcoal life cycle. This indicates that transportation of
charcoal from production site to market releases roughly 0.011 tC per ton of charcoal
transported, which ranges from 1-3% of the various emission factors in Table 28. In any case,
transportation plays a small role in charcoal’s climate impact.

302
Table 29: IPCC default emission factors for heavy duty diesel vehicles (in CO2 eq. units weighted by 100-yr GWPs) (IPCC, 1997b).
Quantity Units CO2 CO CH4 NMHC (gC)
N2O
Default pollutant emissions per unit distance gC/km 299 3.9 0.3 4.5 9.3
Carbon emissions per ton of charcoal transported a tC/ton 0.01 1 E-4 1 E-5 2 E-4 3 E-4
Carbon emissions per ton of LPG or kerosene transported b tC/ton 0.04 3 E-4 3 E-5 4 E-4 7 E-4 a Each trip for charcoal covers a total distance of 300 km and carries 250 standard (35kg) bags of charcoal. b Each trip for LPG or kerosene covers a total distance of 1000 km and carries 12,500 liters (10,000 kg) of fuel.
Figure 47: Empirical measurements of emission factors from the end-use of fuelwood and charcoal
0
200
400
600
800
1000
Zambia W. Africa India Zambia W. Africa India
Firewood CharcoalgC in
CO
2 eq
uiva
lent
uni
ts (1
00-y
r GW
P)
per k
g fu
el c
onsu
med
CO2 CH4 N2O
Source: (Brocard, Lacaux et al., 1996; Smith, Uma et al., 2000; Bertschi, Yokelson et al., 2003)
Consumption of wood and charcoal
Both wood and charcoal release GHGs when they are consumed in the household. Empirical
studies show that between 4 and 15% of the fuel’s carbon may be released as products of
incomplete combustion (Brocard, Lacaux et al., 1996; Smith, Uma et al., 2000; Bertschi,
Yokelson et al., 2003). Charcoal tends to be at the higher end of this range and fuelwood
tends to be at the lower end. Figure 48 shows a range of empirical measurements of emission
factors from the end-use of fuelwood and charcoal. As with production emissions, only KP
GHGs are shown. Charcoal emission factors are systematically larger because they are
303
defined per unit mass of fuel and charcoal has a higher carbon content than unprocessed
fuelwood. For the remaining analysis in this paper, the EFs from Zambian study are used
because they represent the median value among the three studies reported and no data on
emissions from Kenyan charcoal end-use are available.
Summarizing the net emissions from wood and charcoal
Taking all of the emissions from the previous three sections together, permits an estimation
of the net GWI for fuelwood and charcoal. These results are shown in Table 30. The table
shows that the net emission factors for the charcoal life-cycle are highly dependent on the
land management regime that is in place. For the baseline scenario, in which native
vegetation is replaced by grain cultivation and charcoal is produced in a traditional earth-
mound kiln, one ton of charcoal results in the release of over 2.7 tC over its entire life-cycle.
However, if the cleared area is allowed to fully regenerate as in Tarch regrowth, the new
growth of biomass more than compensates for the emissions from wood pyrolysis and fuel
combustion, effectively sequestering ~0.26 tons of carbon after 50 years. If coppice
management is practiced rather than allowing full regeneration, the overall system acts as a
net source of carbon, but the emission factors are far smaller than that which results from full
clearance, ranging from 0.08-0.29 tC per toncharc depending on the length of the coppice
cycle. If natural vegetation is replaced by fast growing exotic species like Eucalyptus
grandis, the increase in biomass that results acts as a sink of carbon, such that after 50 years
of coppice management, roughly 0.8 tC are sequestered for every ton of charcoal produced.

304
Table 30: Emission factors for wood and charcoal life cycles (tC per ton-fuel using only KP GHGs and 100 yr GWP)
Raw material extraction
EFLUC
Fuel production EFPROD
Net impact EFTOTAL
trad kiln
imp kiln
trad kiln
imp kiln
Transport EFTRANS
End-use EFCONS
trad kiln
imp kiln
Fuelwood -- -- -- -- -- 0.06 0.06 --
Baseline
Tarch grain 1.14 -- 0.79 -- 0.01 0.77 2.72 --
Alternates
Tarch regrowth -1.85 -- 0.79 -- 0.01 0.77 -0.26 --
Tarch5 coppice -1.30 -1.03 0.79 0.36 0.01 0.77 0.29 0.26
Tarch10 coppice -1.51 -0.98 0.79 0.36 0.01 0.77 0.08 0.11
Tarch15 coppice -1.43 -1.65 0.79 0.36 0.01 0.77 0.15 0.17
Euc coppice -2.41 -0.89 0.79 0.36 0.01 0.77 -0.82 -0.50
Using an improved kiln changes these results. An improved kiln is only feasible in the
coppicing scenarios because, the charcoal is only made once on a given plot of land in the
non-coppice scenarios, making investment in an improved kiln highly unlikely. When an
improved kiln is used in the coppicing scenarios, it has a mixed set of effects. In the coppice
systems LUC acts as a net sink (EFLUC < 0). Thus, the use of the improved kiln actually
raises EFLUC because it raises the yield of charcoal from a given area of land. In addition, the
improved kiln has lower EFPROD than the traditional kiln, but EFTRANS and EFCONS are the
same. The overall effect can either raise or lower the net emission factor, depending on the
relative changes in EFLUC and EFPROD. The result is that EFTOT for charcoal made from

305
coppiced natural vegetation ranges from 0.11-0.26 tC per toncharc and EFTOT from coppiced E.
grandis still reflects a net sink of -0.50 tC per toncharc.
Figure 48: Emission factors for the fuelwood and charcoal life-cycle (tC per toncharc in CO2 equivalent units)
Wood is also included in Table 30. As discussed above, the only emissions considered for
wood arise from end-use. The value of EFCONS used here, 0.06 tC per tonwood is derived from
the non-CO2 gases illustrated in Figure 47. CO2 is omitted because it is assumed the wood is
harvested sustainably so that CO2 emissions are sequestered by new tree growth.
These results are illustrated in Figure 48. The figure shows the large difference in total
emissions per unit of charcoal produced between land clearance for crop cultivation and land
management for continual charcoal production. This concludes the analysis of GHG
-1.0
-0.5
0.0
0.5
1.0
1.5
2.0
2.5
3.0
Fuelwood Tarch grain Tarchregrowth
Tarch5coppice
Tarch10coppice
Tarch15coppice
Euc coppice
Baselines Alternate scenarios
Total LC EF Total LC EF using
tC (C
O2 eq
uiva
lent
s un
it) p
er to
n fue
l

306
emissions from the fuelwood and charcoal life cycles. The next section will discuss the same
for fossil fuels.
LPG and Kerosene
Raw material extraction and fuel production
Upstream activities resulting in GHG emissions in this stage of the fossil fuel life cycle
include exploration, extraction, and refining as well as fuel transportation and storage. For
this analysis, I used a software package was that estimates the sum of these emissions based
on user inputs of refining efficiency, national electricity mix, transmission losses, as well as
fuel transport methods and distances. The GREET model (Greenhouse gases, Regulated
Emissions, and Energy use in Transportation) was developed by Argonne National
Laboratory as a tool to evaluate the climate impacts of the life cycle of transportation fuels in
the US (Center of Transportation Research, 2001).19 As it was designed to evaluate
transportation fuels, this model estimates “wells to wheels” emissions: i.e. from extraction to
final consumption in a given vehicle. However, it is useful for this analysis because it
disaggregates output into “wells to pump” and “pump to wheels”, thus it provides estimates
of emissions for the raw material extraction and fuel production stage of the fossil fuel life
cycle. The model’s output of “pump to wheels” emissions was simply discarded.
In addition, kerosene is not included as a fuel in the GREET model, as it is not used in
vehicles. However, diesel fuel is part of the model. This analysis used diesel as a proxy for
19 The author thanks David Pennise for directing him to this useful tool. Pennise was the first to use GREET in an analysis of life-cycle emissions from household fuels (Pennise, 2003).

307
kerosene because it is a similar petroleum distillate, associated with similar upstream
emissions (Pennise, 2003). The model calculates emissions from LPG based on different
sources of feedstock: crude oil or natural gas. Our model assumes LPG in sub-Saharan Africa
originates from 100% crude oil.
Although it is designed to be used specifically for conditions in the United States, the model
can be tailored to conditions in other places. For example, this analysis assumed that all of
Kenya’s LPG and kerosene are derived from imported crude oil. The oil is of Middle Eastern
origin and is shipped entirely by oil tankers an average distance of 3,000 miles. The crude oil
arrives at the port in Mombasa, where it is processed with 89% efficiency for diesel and 94%
efficiency for LPG. The model is also tailored to Kenya’s electricity mix, which was
described in note b of Table 25. Figure 49 shows the emissions from raw material extraction
and fuel production estimated by the GREET model.
Transmission/Distribution of LPG and Kerosene
After refining, the fuels are then transported to Nairobi (~500 km each way) by tanker trucks
that hold roughly 12,500 liters (10,000 kg) of fuel. The result of these assumptions is shown
in Table 29 above. Summing the relevant row of Table 29 shows that transportation of LPG
and kerosene from Kenya’s refinery in Mombasa to consumer markets in Nairobi releases
roughly 0.025 tC per ton of fuel transported: roughly 20% of the emissions from raw material
extraction and fuel production.

308
Figure 49: GREET model estimations of raw material extraction and fuel production emissions for LPG and kerosene.
0
50
100
150
200
LPG production Kerosene productiongC in
CO
2 eq
uiva
lent
uni
ts (1
00-y
r GW
P)
per k
g fu
el p
rodu
ced
CO2 CH4 N2O
Figure 50: Empirical measurements of emission factors from the LPG and Kerosene consumption (Smith, Uma et al., 2000).
0
200
400
600
800
1000
LPG end-use Kerosene end-usegC in
CO
2 eq
uiva
lent
uni
ts (1
00-y
r GW
P)
per k
g fu
el c
onsu
med
CO2 CH4 N2O
Consumption of LPG and Kerosene
Unlike solid fuels such as wood and charcoal, liquid and gaseous fuels are relatively easy to
combust at the household scale. Thus, there are fewer products of incomplete combustion
released by the end-use of LPG and kerosene. Figure 50 shows the emissions per unit mass
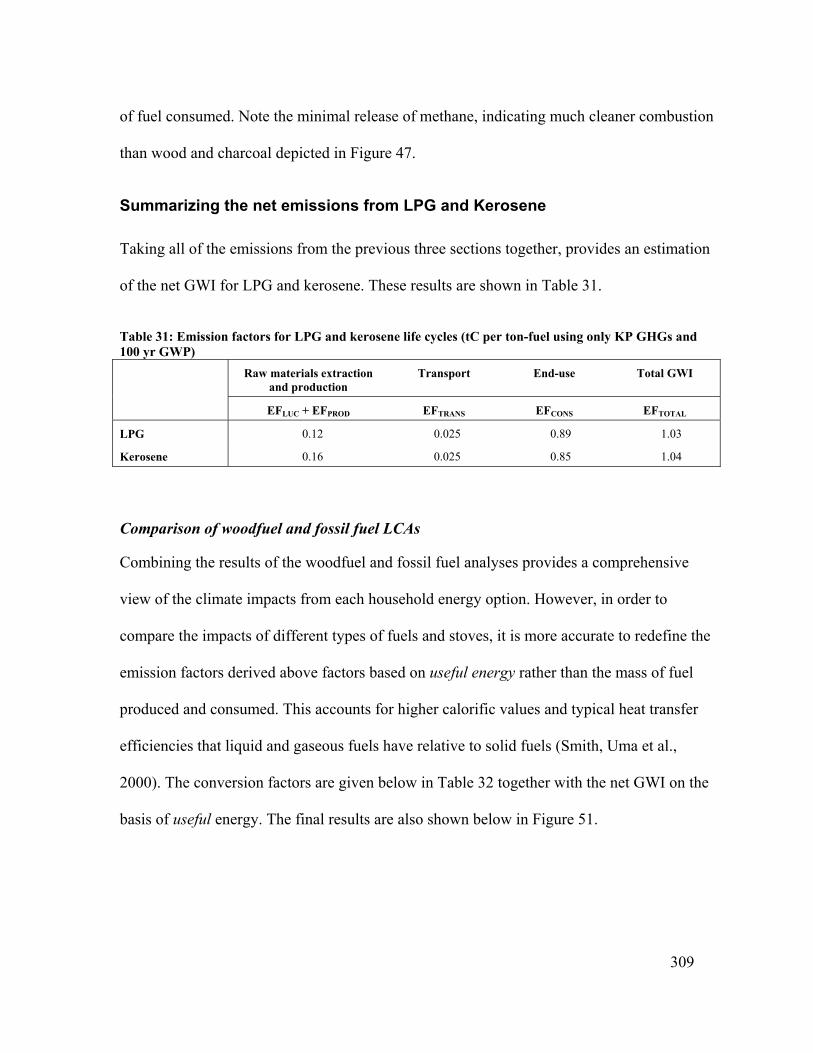
309
of fuel consumed. Note the minimal release of methane, indicating much cleaner combustion
than wood and charcoal depicted in Figure 47.
Summarizing the net emissions from LPG and Kerosene
Taking all of the emissions from the previous three sections together, provides an estimation
of the net GWI for LPG and kerosene. These results are shown in Table 31.
Table 31: Emission factors for LPG and kerosene life cycles (tC per ton-fuel using only KP GHGs and 100 yr GWP) Raw materials extraction
and production Transport End-use Total GWI
EFLUC + EFPROD EFTRANS EFCONS EFTOTAL
LPG 0.12 0.025 0.89 1.03
Kerosene 0.16 0.025 0.85 1.04
Comparison of woodfuel and fossil fuel LCAs
Combining the results of the woodfuel and fossil fuel analyses provides a comprehensive
view of the climate impacts from each household energy option. However, in order to
compare the impacts of different types of fuels and stoves, it is more accurate to redefine the
emission factors derived above factors based on useful energy rather than the mass of fuel
produced and consumed. This accounts for higher calorific values and typical heat transfer
efficiencies that liquid and gaseous fuels have relative to solid fuels (Smith, Uma et al.,
2000). The conversion factors are given below in Table 32 together with the net GWI on the
basis of useful energy. The final results are also shown below in Figure 51.

310
Table 32: Calorific values, heat transfer efficiencies, and range of GWI for each form of household energy
Fuel Calorific value (Q) a
Heat transfer efficiency (η) b
EFTOTAL-MASS b
(tC/tonfuel) EFTOTAL-ENERGY
(gC per useful MJ) c
Wood 16 15% 0.06 25
Charcoal – Tarch grain 31 25% 2.72 351
Charcoal – Tarch regrowth 31 25% (0.26) (34)
Charcoal – Tarch coppice (all) 31 25% 0.08 – 0.29 10-37
Charcoal – Euc coppice 31 25% (0.82) – (0.50) (106) – (65)
LPG 43 50% 1.03 48
Kerosene 46 54% 1.04 42
a All data except charcoal are from the analysis in (Smith, Uma et al., 2000). The calorific value of charcoal is based on Kenyan charcoal analyzed in (Pennise, Smith et al., 2001) and the heat transfer efficiency of charcoal stoves is based on unpublished personal observations of Kenyan charcoal stoves.
b Negative values of net emissions represent net sinks and are given in parentheses ( ). Ranges for coppice systems include high and low values for the length of coppice and the type of kiln utilized.
c EFTOTAL-ENERGY = 1000 · EFTOTAL-MASS · (Q · η)-1
Figure 51 shows, on the basis of useful energy available to the end-user, the GWI of charcoal
production accompanied by grain cultivation is nearly an order of magnitude larger than
other household energy options explored here. In addition, because of higher calorific values
and favorable heat transfer efficiency, the GWI of fossil fuels are within the same order of
magnitude as the GWI from charcoal produced from native vegetation managed on 5, 10, or
15-year coppice cycles. It should also be noted that several options act as net sinks of carbon
in this estimation.20
20 It may be counter-intuitive that the Tarch regrowth management scheme acts as a net sink considering that 50 years after the initial harvest there is no increase in the stock of terrestrial carbon. However, in conducting a strict accounting of carbon stock and flows, it is apparent that a substantial amount of the carbon initially harvested does not enter the GWI calculus and is thus “sequestered” for the purposes of this exercise. For example, 1 (dry) ton of harvested wood contains ~0.48 tC. Converting this quantity of wood

311
Figure 51: Net GWI for each stove-fuel combination on the basis of useful energy
Discussion
From these results, it is apparent that the net climate impacts of household energy use in
Kenya and elsewhere in sub-Saharan Africa are strongly dependent on the management
decisions that are made concerning the area in which charcoal is produced. The conversion of
an area of woody savannah to grain cultivation results in the loss of roughly 40 tC per ha.
into charcoal in an earth-mound kiln yields roughly 0.24 tons of charcoal containing 0.20 tC with the remaining carbon released in a mix of solid, liquid and gaseous by-products. When the charcoal is then used for cooking, the emissions from final combustion combine with the by-products from pyrolysis. Based on empirical studies (Bertschi, Yokelson et al., 2003; Pennise, 2003), the overall stream carbon in the by-products of the charcoal life cycle roughly consists of the following: 0.34 tC as CO2, 0.05 tC as CO, 0.01 tC as CH4, 0.02 tC as NMHCs, 0.02 tC as partially carbonized wood, 0.02 tC as condensable tars, and 0.02 tC as particulate matter. When only KP-gases are considered, only CO2 and CH4 are accounted for, leaving ~0.13 tC, over one quarter of the initial carbon quantity, seemingly “sequestered”. Of course, much of this carbon is not effectively sequestered and some of the uncounted emissions, like CO and NMHCs, actually directly contribute to climate change. The “sink” observed here disappears if these gases are included.
-100 0 100 200 300 400
Fuelwood
Tarch grain
Tarch regrowth
Tarch5 coppice
Tarch10 coppice
Tarch15 coppice
Euc coppice
Tarch5 coppice
Tarch10 coppice
Tarch15 coppice
Euc coppice
LPG
Kerosene
gC per useful MJ (in CO2 equivalent units) C
harc
oal -
trad
ition
al
kiln
C
harc
oal -
im
prov
ed k
iln
Foss
il fu
els
Woo
d

312
Managing the same area of land by coppicing native vegetation on 5, 10, or 15 year cycles
results in a net release of only 3-9 tC per ha with 30-35 tons of charcoal produced over a 50
year period. Replacing the area with a fast growing exotic species like Eucalyptus grandis
can result in a sink of up to 150 tC per ha and over 180 tons of charcoal produced over a 50
year period.
There are many variables that affect land use in this region of Kenya, including
socioeconomic factors like the demand for grain in rapidly changing food markets and
changes in land tenure that enable areas formerly under communal tenure and managed for
pastoral production to be converted to farmland. In addition, land owners experience both
threats and benefits from living in close proximity to wildlife, which are, importantly,
distributed unevenly among the population (Thompson and Homewood, 2002). Finally, the
degree of access that the landowner has to capital and markets for agricultural produce also
plays an important role. Not surprisingly, managing land for environmental services like
carbon sequestration plays no role in land current management decisions. In Kenya there is
pressure to expand crop cultivation as a result of growing and changing demand for food. Not
surprisingly, this takes precedence over managing land for carbon sequestration. However,
crop cultivation need not lead to the level of carbon loss that this analysis estimates is
occurring in the study area. There are cultivation methods that are not currently practiced,
which can reduce the loss of soil carbon (IPCC, 1997b). In the Tarch grain production
system, changes in soil-C were responsible for about 50% of the net C reductions.
If issues of food security and political economy of land use decisions are both set aside for a
moment in order to consider only the carbon dynamics and energy production of the land-use

313
system, then, at a glance, it appears that the Euc coppice system is the best option for energy
production. It is a large sink of carbon and yields the largest quantity of charcoal. However,
several additional factors should be considered including the high costs of establishing a
plantation and the high risk of failure for an exotic species. Eucalyptus spp. are susceptible to
attack from termites and other local pests as well as sensitive to drought, which is a great
concern in a semiarid area like the region under study.21 In addition, even if it is
commercially viable and risk can be properly managed, there are environmental
considerations that may outweigh the benefits of carbon sequestration and increased charcoal
production. One such consideration is the hydrological impacts of replacing native vegetation
with fast-growing tree species. In particular, Eucalyptus spp. have been maligned for their
effects on local hydrological function. The degree of impact has been correlated with soil
depth and water availability. Importantly, water use increases when plants are coppiced
(Bruijnzeel, 2004).
A second consideration is the effect that replacing natural vegetation has on biodiversity.
While not as rich as tropical rain forest, woody savannah supports a range of flora and fauna.
This region of Kenya is located adjacent to one of the largest concentrations of large
herbivores in the world. It is less than 100 km north of the Maasai Mara National Reserve,
which is itself contiguous with the Serengeti Plains in Tanzania. The area constitutes
21 As was discussed in Chapter 2, Narok suffers drought roughly one out of every seven years. There is currently a pilot plot of Eucalyptus spp. that was established in the study area with donor support. It has just passed one year since planting and appears to be thriving with minimal management, however, it was established close to a perennial water source and requires occasional irrigation. It remains to be seen if this kind of activity will be possible without either access to reliable water supplies and lavish donor support.

314
important grazing for wildlife that migrates north during the wet season in order to allow dry
season pasture in the Serengeti-Mara Ecosystem to regenerate (Serneels and Lambin, 2001).
Since the mid-1970s, when grain cultivation was first introduced in the area, wildebeest
populations have declined by 75%. If large areas are converted to fast growing plantations, it
is likely to exacerbate this effect.
Managing natural woodland vegetation for continuous charcoal production is unlikely to
have any negative impacts on hydrological function and is the land management option here
that is most compatible with wildlife. In addition, there are no establishment costs for
“natural plantations” and this option is effectively risk-free because natural vegetation is
drought-tolerant and resistant to local pests. A landowner could manage 10 ha on a 10-year
coppice cycle and earn an annual income that is competitive with the landowner who seeks to
lease out the same land area for grain cultivation. The economics of the coppice management
option become more favorable if land owners can be compensated for the carbon that would
be released if they convert their land to grain cultivation. The economics of coppice
management becomes still more favorable if land owners can be compensated for
conservation, for example, through tourism revenue that flows to the local or national
government, as well as for their carbon savings. This analysis represents an initial
investigation into alternative charcoal production systems in Kenya, where charcoal
production to date has been closely associated with LUC and related negative environmental
impacts. The economics of these systems remains to be fully explored, including possible
revenue streams from carbon emissions reductions and conservation value in an area that is
very close to highly valued wildlife habitat.

315
Chapter 7
From the local to the global: GHG implications of woodfuel use in sub-Saharan Africa now and in the future
Introduction
Biomass fuels (wood, charcoal, dung, and agricultural residues) are vital to basic welfare and
economic activity in developing nations, especially in sub-Saharan Africa (SSA), where they
meet more than 90% of household energy needs in many nations. Combustion of biofuels
emit pollutants that currently cause over 1.6 million annual deaths globally (400,000 in SSA)
(Ezzati and Kammen, 2001). Because most of these deaths are among children and women,
biomass use is directly or indirectly related to multiple Millennium Development Goals
(MDGs), including environmental sustainability, reducing child mortality, and gender equity.
In this chapter, I explore the ramifications of widespread woodfuel usage across the entire
region of sub-Saharan Africa.
Methods
To explore these impacts, I developed a database of current fuel use and a range of scenarios
of household energy futures up to 2050 in SSA. Current national-level energy production and
consumption were estimated from the United Nations Food and Agriculture Organization’s
(FAO) forest products database and the International Energy Agency’s (IEA) statistical
316
database of non-OECD countries (IEA, 2003b; FAOSTAT data, 2004). FAO records
woodfuel (defined as wood, or wood transformed into charcoal) production and trade from
41 countries in SSA, including separate estimates for charcoal. Charcoal is widely used in
Africa, even in countries with large endowments of fossil fuels, such as Gabon, Angola, and
Nigeria (IEA, 2003b). IEA maintains information on biomass and fossil fuels used in the
residential sector from 20 countries in the region, and an aggregate estimate for the
remaining 21 nations. Data were analyzed for (i) consistency for each fuel type between FAO
and IEA; and (ii) consistency across fuel types from IEA. I estimated that in 2000,
households in SSA consumed nearly 470 million tons of woodfuels (0.72 tons/capita) in the
form of wood and charcoal. By comparison, the FAO estimates that India and China, with a
combined population nearly 3.5 times larger, used 340 million tons of woodfuels in the same
year.1
The fraction of households using each fuel was derived from nationally-representative
household welfare surveys conducted in the 1990s and compiled by the World Bank for 20
countries (World Bank, 2000; 2004). These nations covered 47% of the region’s urban
population and 63% of its rural population. For countries not surveyed, I applied population-
weighted estimates from surveyed nations, separately for rural and urban populations. South
Africa was excluded from the weighted averages, because it has a distinct pattern of
1 This estimate for China and India applies to woodfuels only. Households in China and India use more solid fuels than in SSA, but in forms other than woody biomass. In China, crop residues are common fuels in rural areas and in India crop residues and dung are each used by roughly 10% of households. Charcoal can be made from many forms of biomass including agricultural and timber processing residues. There are some attempts to market such products in several countries in SSA, but market penetration is currently very low. Also important for health and GHG impacts, many households in China and India use coal as their primary fuel (Smith, Mehta et al., 2004).

317
household fuel consumption. These extrapolations are consistent with the observed low
variability of fuel use patterns across the 20 countries with data, especially for rural areas
which form 64% of SSA’s population (excluding South Africa, the fraction of households
using woodfuels varied from 86%-99% in rural areas and from 26%-96% in urban areas in
the 20 countries with data) (World Bank, 2000; 2004). Overall, 94% of the African rural
population and 73% of the urban population use woodfuels as their primary source of energy,
mainly in the form of wood in rural areas and an equal split of wood and charcoal in urban
centers. Woodfuel consumption across the region is shown in Figure 52, which formed the
baseline for all scenarios. The gradations of color in the figure indicate total wood fuel
consumption and the small pie charts show the fraction of wood that is used for charcoal
based on multiple sources. FAO biomass estimates (including charcoal) (FAOSTAT data,
2004) were roughly consistent with IEA estimates and used for all countries except Angola,
Kenya, South Africa, Sudan, and Zambia (20% of the region’s population). For these
countries FAO biomass estimates would have been too low to meet minimal household
energy needs, when considered with energy use from fossil fuels and other energy sources
reported by IEA (IEA, 2004). In all of these countries except Kenya, IEA estimates were
used; for Kenya, data from The MoE study was used (Ministry of Energy, 2002).
The scenarios for future household energy sources are described in Table 33. All scenarios
begin from the same 2000 baseline. In 2000, 64% of population lived in rural areas. 41%,
34%, 13%, 8% and 4% of urban households used wood or crop residues, charcoal, kerosene,
LPG and electricity as their primary source of household energy, respectively; 94%, 4%, and
2% of rural households used wood or crop residues, charcoal, and kerosene. Future

318
population and urbanization estimates were from the United Nations Population Division
(United Nations, 2004a). Future household energy use and production scenarios examine the
role of two factors: household fuel choice and biomass harvesting and charcoal production
techniques. The rate of adoption of alternative fuels and sustainability practices were also
examined (gradual versus rapid scenarios).
Figure 52: Per capita woodfuel use in sub-Saharan Africa disaggregated by fuelwood and charcoal
0.2 – 0.4 tons per capita 0.4 – 0.5 tons per capita 0.5 – 0.8 tons per capita 0.8 – 1.0 tons per capita 1.0 – 1.5 tons per capita > 1.5 tons per capita
Wood used for charcoal production
Not in region No data 0 – 0.2 tons per capita
Wood used directly as firewood

319
Table 33: Characteristics of the scenarios developed for this analysis Scenario Definitions
Group 1: Business as usual scenarios (little change from current patterns in rural and urban areas)
Business-as-usual (BAU)
The proportion of people in rural and urban areas using each fuel remains unchanged from the baseline year. However, differential rates of population growth and urbanization among different countries in the region result in regional changes in household fuel choice during the period of analysis. No changes occur in woodfuel harvesting practices or in charcoal production techniques, in which 20% of trees removed for charcoal and 80% of those removed for wood regenerate.
Sustainable BAU (BAU-S)
Identical fuel consumption as in BAU, but there is a gradual linear increase in the proportion of trees harvested sustainably as well as in the use of improved (high-efficiency) charcoal kilns. By 2050, tree regeneration reaches 80% for charcoal harvesting and 100% for firewood harvesting. Also by 2050, 100% of charcoal production takes place in high-efficiency kilns.
Group 2: Charcoal intensive scenarios (large shift from wood to charcoal with minimal use of fossil fuels)
Charcoal (C) Between 2000 and 2050, there is a gradual linear transition from wood to charcoal in both urban and rural areas By 2050, the fraction of households using wood decreases by 40% in rural areas and 100% in urban areas, with both groups shifting to charcoal. As a result, in 2050 approximately 80% of urban households and 40% of rural households are using charcoal (61% of the total population). There are no changes in woodfuel harvest practices or in charcoal production methods.
Sustainable charcoal (C-S)
Identical trend in fuel consumption as in C, but there is a simultaneous shift in the fraction of harvested trees allowed to regenerate as well as in the use of improved (high-efficiency) charcoal kilns. By 2050, tree regeneration reaches 80% for charcoal production and 100% for firewood harvest; 100% of charcoal production takes place in high-efficiency kilns.
Rapid charcoal (RC)
As in scenario C, the fraction of firewood users decreases by 40% in rural areas and by 100% in urban areas in as a result of a shift to charcoal. However, the switch occurs much more rapidly so that it is complete by 2010. In 2010, 40% of rural households and 75% of urban households use charcoal (52% of the total population). The rural and urban fractions remain constant through the rest of the analysis, but the total fraction of charcoal users continues to increase because of a demographic shift to urban areas. By 2050, the fraction of the total population using charcoal increases to 64%.
Rapid sustainable charcoal (RC-S)
Identical fuel consumption patterns as in RC, but there is also a rapid increase in the proportion of harvested trees allowed to regenerate as well as the use of improved (high-efficiency) charcoal kiln. The increase in tree re-generation and improved kilns is driven by a policy of aggressive dissemination of improved kiln technologies and dissemination improved land management. By 2010, tree regeneration reaches 80% for charcoal production and 100% for firewood harvest; 100% of charcoal production takes place in high-efficiency kilns.
Group 3: Fossil fuel intensive scenarios (large shift from wood and charcoal to petroleum-based fossil fuels)
Fossil-fuel (F) Firewood and charcoal users in both urban and rural areas switch gradually to LPG and kerosene. By 2050, the proportion of households using wood or charcoal decreases by 40% in rural areas and 80% in urban areas. In rural areas, the shift is primarily to kerosene; in urban areas, the shift is to both kerosene and LPG. As a result, in 2050, 30% of households in rural areas use kerosene and 10% use LPG. In urban areas, 30% use kerosene and 50% use LPG. In total, 63% of the population uses fossil fuels.
Rapid fossil-fuel (RF)
RF follows a similar pattern as scenario F, but at an accelerated pace. By 2010, approximately 40% of the rural population and 80% of the urban population (54% of total population) use fossil fuels. The rural and urban fractions remain constant up to 2050, but the total fraction of fossil fuel users continues to increase because of a demographic shift to urban areas. By 2050, the total fraction of people using fossil fuels increases from 54% to 63%.

320
Each scenario examines the role of two factors: (i) household fuel choice and (ii)
sustainability of biomass harvesting and charcoal production techniques. Economic growth
and energy infrastructure development have lagged in SSA relative to other world regions,
limiting a large-scale shift to commercial sources of energy in the residential sector
(Karekezi, 2002). This situation is represented in the business-as-usual scenario (BAU).
Further, economic growth and infrastructure expansion do not automatically create a parallel
and simultaneous shift to commercial energy for household needs. Even in China, where
rapid economic growth and infrastructure expansion have contributed to near-universal
access to electricity (IEA, 2002), solid fuel use for cooking and heating among households
has persisted; 80% of Chinese households continue to rely on biomass (mainly crop residues)
and/or coal as their primary cooking and heating fuels (Smith, Mehta et al., 2004).
In addition to the secular BAU trends, in which population growth and urbanization are the
main drivers of change in household fuel choice, I defined two additional categories of
scenarios for household fuel use. The first group examines a systematic shift from wood to
charcoal (C and RC). As mentioned above, charcoal is a popular fuel in in SSA because it is
relatively clean, safe, affordable and storable, and requires no expensive equipment to use.
The second group of scenarios envisions large-scale adoption of petroleum-based fossil fuels
(kerosene and LPG), which are currently commercial alternatives to biomass fuels in many
mid- and high-income nations (F and RF) (Smith, 2002). Like charcoal, kerosene can be
purchased in small quantities and can be used with relatively inexpensive equipment. It has a
reasonably well-developed supply chain and is used throughout the region for lighting, as
well as for cooking in urban areas. In contrast, LPG must be purchased in relatively large
321
quantities and requires much more expensive stoves, both creating barriers to the urban poor
and rural households. With the exception of Senegal, where there have been substantial
efforts to promote LPG, its use is currently limited to wealthier urban families in a small
number of countries (World Bank, 2000; IEA, 2002; World Bank, 2004). These
characteristics were the basis for defining distinct household fuel use patterns for rural and
urban areas.
Greenhouse gases
For each biomass-based scenario, I estimated the impacts of sustainably-harvested biomass
and charcoal production technology on GHG emissions (BAU-S, C-S, and RC-S). Nearly all
charcoal in SSA currently is produced in traditional kilns with sub-optimal conversion
efficiency and no emission controls, as was discussed in Chapter 4. Technological shifts in
the charcoal production would include indigenous or exotic multipurpose tree crops,
alternative inputs like biomass waste products, and efficient kilns with emission controls. For
each scenario, I estimated emissions of CO2 and non-CO2 GHGs from both production and
consumption of all fuels. As was demonstrated in Chapter 6, both charcoal and fossil fuels
are associated with significant “upstream” (production) emissions. In contrast, wood has
negligible upstream emissions. Both upstream and end-use emissions were converted into
CO2 equivalent units using 100-year Global Warming Potential (GWP) to account for the
differential warming effect (radiative forcing) of each emitted GHG (IPCC, 2001; Bailis,
Ezzati et al., 2003; Bond, Venkataraman et al., 2004).

322
Results
The net GHG emissions from residential energy use in SSA in 2000 were 79 MtC (61% from
wood; 35% from charcoal; 3% from kerosene; and 1% from LPG). In the absence of
systematic changes in fuel use patterns and in production and harvesting techniques (BAU
scenario), cumulative emissions between 2000 and 2050 will be an estimated 6.7 GtC. If the
BAU scenario includes improved wood harvesting and charcoal production (BAU-S),
cumulative emissions drop to 4.5 GtC, the lowest of all the scenarios. These results are
shown in Figure 53 and Figure 54. The former shows the evolution of annual emissions
through the course of the analysis and the latter shows cumulative GHG emissions from 2000
and 2050 from CO2, CH4, and N2O converted to CO2 equivalent units, weighted by 100-year-
GWP for each scenario of SSA household energy futures.
In both figures, emissions are disaggregated by fuel. Figure 54 also shows cumulative
emissions as fractions of total regional and global cumulative emissions from all sectors,
which are estimated to be 118 GtC and 917 GtC respectively, based on the median emissions
scenario reported in the Special Report on Emissions Scenarios (SRES) to inform policy
makers during the IPCC’s Third Assessment period (IPCC, 2000a).

323
Figure 53: GHG emissions from 2000 and 2050 from CO2, CH4, and N2O converted to CO2 equivalent units weighted by 100-year-GWP for each scenario of SSA household energy futures.
BAU-S
-
100
200
300
400
500
2000 2010 2020 2030 2040 2050
Mto
n-C
in C
O2
equi
vale
nt u
nits
(100
-yr G
WP)
Firew ood CharcoalKerosene LPG
C-S
-
100
200
300
400
500
2000 2010 2020 2030 2040 2050
Mto
n-C
in C
O2
equi
vale
nt u
nits
(100
-yr G
WP)
Firew ood CharcoalKerosene LPG
RC-S
-
100
200
300
400
500
2000 2010 2020 2030 2040 2050
Mto
n-C
in C
O2
equi
vale
nt u
nits
(100
-yr G
WP)
Firew ood CharcoalKerosene LPG
RF
-
100
200
300
400
500
2000 2010 2020 2030 2040 2050
Mto
n-C
in C
O2
equi
vale
nt u
nits
(100
-yr G
WP)
Firew ood CharcoalKerosene LPG
BAU
-
100
200
300
400
500
2000 2010 2020 2030 2040 2050
Firew ood CharcoalKerosene LPG
MtC
in C
O 2 equ
ival
ent u
nits
(1
00-y
r GW
P)
C
-
100
200
300
400
500
2000 2010 2020 2030 2040 2050
Firew ood CharcoalKerosene LPG
MtC
in C
O 2 equ
ival
ent u
nits
(1
00-y
r GW
P)
RC
-
100
200
300
400
500
2000 2010 2020 2030 2040 2050
Firew ood CharcoalKerosene LPG
MtC
in C
O 2 equ
ival
ent u
nits
(1
00-y
r GW
P)
F
-
100
200
300
400
500
2000 2010 2020 2030 2040 2050
Firew ood CharcoalKerosene LPG
MtC
in C
O 2 equ
ival
ent u
nits
(1
00-y
r GW
P)

324
Both figures present the sum of emissions of GHGs targeted by the Kyoto Protocol (KP):
CO2, CH4, and N2O. This omits warming effects of carbon monoxide (CO), non-methane
hydrocarbons (NMHCs), and aerosols or particulate matter (PM). These non-KP GHGs were
included in sensitivity analysis below along with analysis based on a 20-year GWP
Figure 54: Cumulative emissions by fuel (2000-2050)
-
5
10
15
20
BAU BAU-S C C-S RC RC-S F RF0%
5%
10%
15%
20%
Frac
tion
of re
gion
al a
nd g
loba
l em
issi
ons
Firewood CharcoalKerosene LPGFraction of cumulative global emissions Fraction of cumulative SSA emissions
GtC
in C
O2
equi
vale
nt u
nits
(100
-yr
GW
P)
The two fossil fuel-intensive scenarios (F and RF) have the second and third lowest
cumulative emissions. The highest estimated cumulative emissions were from two charcoal-
intensive scenarios with unsustainable biomass harvesting and traditional, inefficient
charcoal production (C and RC). However, if these household fuel scenarios are
accompanied with sustainable harvesting and a transition to cleaner and higher efficiency

325
charcoal production technologies (C-S and RC-S), emissions will be reduced by 45% and
66% for gradual and rapid transitions.
Sensitivity Analyses
Sensitivity analysis 1: Non-Kyoto Protocol GHGs
Combustion of both biofuels and fossil fuels releases hundreds of chemical species including
long-lived greenhouse gases like CO2, CH4 and N2O. Many short-lived chemical species are
also released like carbon monoxide (CO), volatile organic compounds (VOCs), and aerosols.
Long lived compounds mix fully in the atmosphere and their climate impact is well
understood. Short-lived species do not mix evenly and their impact on the climate is much
less certain. Nevertheless, estimates of GWPs for CO and VOCs have been calculated (IPCC,
1990; 1996; Smith, Samet et al., 2000; Bond, Venkataraman et al., 2004; Bond, Streets et al.,
2004), and I used these values in the comparison. The effect of aerosols is still more complex
as combustion processes release both black carbon (BC) and organic carbon (OC) aerosols.
The former have a net warming effect and the latter have a net cooling effect (Hansen, Sato
et al., 2000; IPCC, 2001). Bond and colleagues have estimated a GWP for both BC and OC
aerosols (Bond, Venkataraman et al., 2004). Nevertheless, I limited sensitivity analysis to CO
and NMHCs and did not include aerosols for three reasons: (i) high degree of uncertainty in
estimates of GWP for aerosols; (ii) other unknown factors such as the ratio of BC to OC
released by household fuel combustion; and (iii) the degree to which these aerosols are
deposited indoors rather than released to the atmosphere.

326
Figure 55: Cumulative emissions and additional impacts of CO and NMHCs (2000-2050)
-
8
16
24
32
RF RC F C BAU C-S RC-S BAU-S
Gt-C
in C
O2
equi
vale
nt u
nits
(1
00-y
r GW
P)
0%
40%
80%
120%
160%
% c
hang
e
Additional impact if non-KP GHGs are included Impact from KP GHGs only% increase in impact from adding CO and NMHCs
If climate impacts are assessed for CO and NMHCs , the net impact of each scenario
increases between 42 and 106%, with the additional impact smallest for fossil fuel intensive
scenarios (F and RF) and the unsustainable woodfuel scenarios (BAU, C, and RC) (42 - 58%
increase over KP GHGs). In these cases, CO2 remains the most influential gas and including
non-KP gases only has a moderate effect. However, in sustainable woodfuel cases (BAU-S,
C-S, and RC-S) where CO2 plays a minor role and the majority of the climate impact results
from non-CO2 gases, the additional impact of non-KP gases like CO and NMHCs is larger,
resulting in a 75 - 106% increase in climate impact over KP GHGs. These effects are shown
in Figure 55.
The relative impact of non-KP GHGs is then largest in the sustainable woodfuel scenarios
(C-S, RC-S, and BAU-S), in which CO2 is absorbed during regeneration and plays a
relatively small role; in these scenarios GHG impacts are driven by products of incomplete

327
combustion and give a larger relative role to non-CO2 greenhouse gases. Note that the
largest absolute increase in warming impact from non-KP GHGs continues to occur in those
scenarios C and RC, despite lower relative increases.
Sensitivity analysis 2: 20-year GWPs
A second sensitivity analysis was performed to assess the effect of using different global
warming potentials (GWPs), which are time-dependent ratios of each GHG’s radiative
forcing relative to the radiative forcing of CO2 (Hansen, Sato et al., 2000; IPCC, 2001). The
principle analysis was done using 100-year GWPs, which matches most closely the 50-year
time-scale of the projections. Using 20-year GWP rather than 100-year GWP increases the
impact of short-lived GHGs like CH4, which is the most prevalent GHG after CO2 because, it
has much greater radiative forcing than CO2, but it exits the atmosphere faster. Thus, if the
analysis is done using KP-GHGs with 20-year GWPs, net emissions increase across all
scenarios due to the larger influence of CH4, without changing the ranking of scenarios.
The relative increases of emissions resulting from using 20 rather than 100-year GWPs range
from 38 to 117 percent, with the largest relative increase occurring in the sustainable wood
and/or charcoal scenarios (C-S, BAU-S, and RC-S). This is because sensitivity to the choice
of GWP arises from the same mechanism as sensitivity to non-KP GHGs: incomplete
combustion, which releases large quantities of heat-trapping greenhouse gases. Figure 56
shows the cumulative emissions that result from using either 100-year or 20-year GWPs.

328
Figure 56: Cumulative emissions for both 100-yr and 20-yr GWPs (2000-2050)
-
8
16
24
32
RF RC F C BAU C-S RC-S BAU-S
Gt-C
in C
O2
equi
vale
nt u
nits
(20
and
100-
yr G
WP)
0%
40%
80%
120%
160%
% c
hang
e
Impact using 20-yr GWPImpact using 100-yr GWP% increase by changing from 100 to 20-yr GWP
Sensitivity analysis 3: baseline firewood regeneration rates (sustainability)
In the baseline year, 91% of rural and 39% of urban dwellers (76% of the total population)
used firewood as their primary source of household fuel. In the BAU scenario, this fraction
decreases over time, but remains significant in some scenarios, especially for scenarios C and
F, with slower rates of household energy transitions.
The extent to which firewood is harvested on a sustainable basis, particularly in sub-Saharan
Africa, is uncertain. Early assessments of wood consumption in the region posited a
“fuelwood crisis” that largely blamed loss of forest cover on household wood-energy
consumption (Eckholm, 1975; FAO, 1978). However, later analyses revealed that, in most
cases, rural firewood consumers were not the main drivers of deforestation although they are
impacted by it. Rather, permanent loss of tree cover in sub-Saharan Africa is usually caused
by other factors such as timber production, expansion of agricultural land, and expansion of

329
infrastructure like road networks. Moreover, when demand for firewood is a contributing
factor, it usually acts in combination with one or more of these other factors (Eckholm, 1984;
Leach and Mearns, 1988; Arnold, Kohlin et al., 2001; Foley, 2001; Geist and Lambin, 2002;
World Resources Institute, 2003). As discussed above, the MoE study (Ministry of Energy,
2002) quantified household consumption of wood and charcoal in Kenya. That study
estimated the productivity of woody biomass in areas accessible to the rural population to
estimate that 80% of firewood and 20% of wood for charcoal is currently harvested
sustainably. Our sensitivity analysis finds that shifting the sustainability of the firewood
harvest up to 100% sustainability (or down to 60%) results in decreased (increased)
emissions ranging from 2-32% in relative terms or an additional 0.1-2.1 Gt-C in absolute
emissions. Figure Figure 57 shows the largest relative change occurred in scenarios where
firewood plays a more prominent role than charcoal in future household fuel choice (BAU,
BAU-S, F and RF). The scenarios that envisage charcoal in a more prominent role were
relatively unaffected by the changes in sustainability of the firewood harvest (C, RC, C-S,
and RC-S).

330
Figure 57: Cumulative emissions for 60%, 80%, and 100% sustainability in baseline firewood harvest (2000-2050)
-
8
16
24
32
RF RC F C BAU C-S RC-S BAU-S
Gt-C
in C
O2
equi
vale
nt u
nits
(1
00-y
r GW
P)
0%
20%
40%
60%
80%
% c
hang
e
Net emissions: baseline f irew ood harvestis 60% sustainableNet emissions: baseline f irew ood harvestis 80% sustainableNet emissions: baseline f irew ood harvestis 100% sustainable% change due to 20% increase/decreasein sustainability of f irew ood harvest
Similarly, I examined the sensitivity of outcomes to our baseline assumption that charcoal
harvest occurs with a 20% rate of regeneration. I examined outcomes with baseline
sustainability of charcoal production decreased to 0% (and increased to 40%) replacement of
harvested trees, which increased (decreased) cumulative emissions by 1-17% in relative
terms or 0.07-3.28 Gt-C in absolute terms. Figure 58 shows the smallest change is observed
in the scenario with a fast transition to sustainable charcoal (RC-S). In this model, charcoal
production shifts to 80% sustainability within only 10 years and the choice of the baseline
has little impact. Other scenarios showing little sensitivity are those in which charcoal plays a
small role (F and RF). In addition, BAU-S has little sensitivity to these changes because,
although charcoal gains in importance as a household fuel in this scenario (see Fig 2 in main
text), tree regeneration increases as charcoal gains in popularity. The largest sensitivity to

331
±20% changes in baseline regeneration of trees harvested for charcoal occurs in charcoal
intensive scenarios with no transition to sustainable production (C and RC).
Figure 58: Cumulative emissions for 0%, 20%, and 40% sustainability in baseline charcoal harvest (2000-2050)
-
8
16
24
32
RF RC F C BAU C-S RC-S BAU-S
Gt-C
in C
O2
equi
vale
nt u
nits
(1
00-y
r GW
P)
0%
20%
40%
% c
hang
e
Net emissions: baseline charcoal harvestcompletely unsustainableNet emissions: baseline charcoal harvest20% sustainableNet emissions: baseline charcoal harvest40% sustainable% change due to 20% increase/decreasein sustainability of f irew ood harvest
As a benchmark, note that the proportional changes in cumulative emissions resulting from
the ±20% change in baseline regeneration of trees harvested for charcoal are all smaller than
those resulting from the ±20% changes in baseline firewood regeneration. This is because the
relative contribution of CO2 to net life-cycle emissions of charcoal is smaller than the relative
contribution of CO2 to net life-cycle emissions of firewood. However, the range and
magnitude of absolute changes in cumulative emissions resulting from ±20% changes in
baseline regeneration of trees harvested for charcoal is larger. This is because the scenarios
with the largest absolute emissions (C and RC) are heavily charcoal-dependent and have no
forecast changes in the fraction of trees harvested for charcoal production allowed to

332
regenerate in later years so that they are sensitive to assumptions concerning baseline tree
regeneration.
Discussion
This integrated assessment of GHG emissions of the household fuel use in sub-Saharan
Africa, the world’s poorest region with the lowest per-capita energy consumption and worst
health status, reflects the substantial GHG consequences, if current land and energy
management practices continue. A shift to sustainable biomass harvesting without a shift in
household fuel use patterns can reduce GHG emissions by 36%. Transition to petroleum-
based fuels provides the next largest climate change benefits with substantial improvements
in childhood and adult female mortality (Smith, 2002). This transition is already underway
among wealthier urban households in some countries of the region. However, in the absence
of heavy subsidies, this will not be a feasible option for most people in the region over the
next 2-3 decades. Obstacles include high capital costs for fuel processing and delivery
infrastructure, as well as volatility in both price and supply as a consequence of national
energy policies and international markets.
The sustainable charcoal scenarios presented here define alternatives with numerous local
benefits in SSA, while addressing regional and global environmental issues. A shift from
firewood to either charcoal or fossil fuels can reduce indoor air pollution by 90% or more.2
2 Reductions refer to particulate matter, the pollutant consistently associated with the most substantial negative health impacts. Carbon monoxide (CO) is also a harmful pollutant associated with biomass fuels. In measurement in Kenya, CO concentrations from charcoal were not significantly different than those from wood stoves (Ezzati, Kammen et al., 2000b).

333
Charcoal can capture much of the benefits of fossil-fuel use, without the economic burden
and infrastructure requirements. In Kenya, the initial cost of a charcoal stove lasting 1-2
years is only $3-5; LPG stoves and gas tanks cost $30-50. In urban centers, where charcoal
markets are well-developed and firewood must be purchased, the operating cost of charcoal
stoves per unit of useful energy delivered is similar to wood, and substantially cheaper than
fossil fuels.3 Therefore, shift to charcoal among sub-Saharan African households can be
equally or more cost-effective than some of the commonly cited health interventions in
developing countries (WHO, 2002).4 Arguably more important, charcoal is already a
preferred fuel among many consumers and has a well-established production and marketing
network in place in many countries. Therefore, charcoal resolves the important concern about
“intervention scaling-up” in sustainable development.
Widespread charcoal use in Africa presents major policy and research challenges and
opportunities. Widespread use of charcoal without changes in technology and land
3 The cost of cooking with wood is highly variable because wood can be obtained for free, though in urban areas this not usually the case. Market prices for split fuel wood (Ministry of Energy, 2002) indicate that annual cooking costs would be at least $200 if all wood were purchased. For comparison, using a combination of field observations and fuel prices reported in (Ministry of Energy, 2002), we estimate a range of annual cooking costs for charcoal ($116-271), kerosene ($149-273), LPG ($274-374) and electricity ($230-467). The range in costs is a function of fuel prices, which depend on the quantity purchased, the cost of the stove amortized over its expected lifetime using a 12% discount rate, and stove efficiencies reported, for example, in (Smith, Uma et al., 2000).
4 Estimates of child deaths that could have been avoided worldwide in 2000 if the coverage of a number of nutritional, environmental, and treatment interventions were increased to 99% of children at-need show that various interventions ranged between 1% and > 10% (Jones, Steketee et al., 2001). Interventions with particularly large benefits include oral rehydration therapy, insecticide-treated bednets, clean water and sanitation, antibiotics for pneumonia, micronutrient supplementation, and exclusive breastfeeding (Jones, Steketee et al., 2001). If the same assumption of 99% coverage is applied, in 2000, charcoal (99% of current wood users switching to charcoal) would save 250,000 childhood LRI deaths (6% of all SSA child deaths) and petroleum-based fossil fuels (99% of all biomass users) 350,000 childhood LRI deaths (8% of all SSA child deaths). The benefits would be smaller in most other world regions because a smaller proportion of the population uses wood.

334
managements will lead to substantially higher GHG emissions – and has large, though poorly
characterized, impacts on forest cover, soil fertility and biodiversity. Currently-feasible
sustainable practices, similar to past efforts in Thailand and Brazil (Smith, Pennise et al.,
1999; Ferreira, 2000), can substantially reduce these emissions. A real opportunity also exists
to develop new harvesting and production methods, possibly with even less environmental
impacts than those in the sustainable scenarios considered here (e.g. charcoal production
from alternative feedstock,5 but this requires investment in technology R&D, and technology
transfer and dissemination within and between countries. In addition to technological needs,
the barriers to sustainable charcoal production are rooted in lack of coherent energy policies
specifically addressing residential energy needs and biases toward industrial energy
resources, as well as outdated forest policies that put control of forest resources in the hands
of centralized agencies, which rarely recognize energy as an important forest product. If
these technological, funding and institutional challenges are met, transitioning to sustainable
charcoal would create domestic jobs, boost rural economies, lessen the need for imported
fossil fuels and save foreign exchange. This analysis of energy and resource technologies and
policies offers an opportunity to reduce child mortality, achieve gender equality, and promote
environmental sustainability.
5 Charcoal can be made from many forms of biomass including agricultural and timber processing residues. There are some attempts to market such products in several countries in SSA, but market penetration is currently very low.

335
References
AFREPREN (2004). African Energy Data and Terminology Handbook Year 2003 - 2004. Nairobi, African Energy Policy Research Network.
Akotsi, E. and M. Gachanja (2004). Changes in forest cover in Kenya’s five “water towers”: 2000-2003. Nairobi, Kenya Forests Working Group with support from the Royal Netherlands Embassy: 56.
Amadala, B. and E. Otieno (2005). Farmers to Cut Deal With Sugar Miller. The Nation. Nairobi.
Amman, H. M. and A. K. Duraiappah (2001). Land Tenure and Conflict Resolution: A Game Theoretic Approach in the Narok District in Kenya. London, International Institute for Environment and Development, London, and Institute for Environmental Studies, Amsterdam: 28.
Anderson, D. M. and V. Broch-Due, Eds. (1999). The Poor Are Not Us: Poverty and Pastoralism in East Africa. Athens, Ohio, Ohio University Press.
Annecke, W. J. (2000). "Women and energy in South Africa." Energy for Sustainable Development 4 (4): 44-47.
Antal, M., K. Mochidzuki, et al. (2003). "Flash carbonization of biomass." INDUSTRIAL & ENGINEERING CHEMISTRY RESEARCH 42 (16): 3690-3699.
Appadurai, A. (1986). Introduction: Commodities and the Politics of Value. The Social Life of Things: Commodities in Cultural Perspective. A. Appadurai. Cambridge, UK, Cambridge University Press: 3-63.
Arnold, M., G. Kohlin, et al. (2001). Fuelwood Revisited: What has Changed in the Last Decade? Bogor, Indonesia, CIFOR: 37.
Awori, F. (2005). The last of village tyrants? The Daily Nation. Nairobi. Bailis, R. (2004). Wood in Household Energy Use. Encyclopedia of Energy. C. J. Cleveland.
New York, Elsevier Science Inc.: 509-526. Bailis, R. (2005). Fuel from the savannah: social and environmental implications of
commercial charcoal production. Energy and Resources Group. Berkeley, CA, University of California: 250.
Bailis, R., M. Ezzati, et al. (2003). "Greenhouse Gas Implications of Household Energy Technologies in Kenya." Environmental Science and Technology 37 (10): 2051-2059.
Bailis, R., M. Ezzati, et al. (2005a). "Mortality and Greenhouse Gas Impacts of Biomass and Petroleum Energy Futures in Africa." Science 308 (5718): 98-103.
Bailis, R., M. Ezzati, et al. (2005b). "The Role of Technology Management in the Dynamics of Greenhouse Gas Emissions from Household Energy Use in Sub-Saharan Africa." Journal of Environment & Development 14 (1): 149-174.
Bailis, R., D. Pennise, et al. (2004). Impacts of Greenhouse Gas and Particulate Emissions from Woodfuel Production and End-use in Sub-Saharan Africa. 2nd World

336
Conference and Technology Exhibition on Biomass for Energy, Industry and Climate Protection, Rome, Italy.
Barasa, L. (2005). Blood-letting in tussle over water and feud between clans. The Daily Nation. Nairobi.
Bardhan, P. and C. Udry (1999). Development Microeconomics. Oxford, UK, Oxford University Press.
Bassett, T. J. (1993). Introduction: The Land Question and Agricultural Transformation in Sub-Saharan Africa. Land in African Agrarian Systems. T. J. Bassett and D. E. Crummey. Madison, WI, University of Wisconsin Press: 3-31.
Bates, R. (1989). Beyond the Miracle of the Market: The Political Economy of Agrarian Development in Kenya. Cambridge, Cambridge University Press.
Beentje, H. (1994). Kenya Trees Shrubs and Lianas. Nairobi, National Museums of Kenya. Behnke, R. H., I. Scoones, et al., Eds. (1993a). Range ecology at disequilibrium. London,
Overseas Development Institute. Behnke, R. H., I. Scoones, et al., Eds. (1993b). Range ecology at disequilibrium: new models
of natural variability and pastoral adaptation in African savannas. London, Overseas Development Institute.
Beinart, W. (1984). "Soil Erosion, Conservationism, and Ideas About Development: A Southern African Exploration, 1900-1960." Journal of Southern African Studies XI (1): 52-83.
Bernstein, H. (1979). "African Peasantries: A Theoretical Framework." Journal of Peasant Studies 6 (4): 420-444.
Bernstein, H. (1994). "The Political Economy of the Maize Filière." Journal of Peasant Studies 23 (2/3): 120-145.
Bernstein, H. and P. Woodhouse (2001). "Telling Environmental Change Like It Is? Reflections on a Study in Sub-Saharan Africa." J Agrarian Change 1 (2): 283-324.
Berntsen, J. L. (1976). "The Maasai and Their Neighbors: Variables of Interaction." African Economic History 2: 1-21.
Berry, S. (1989a). "Access, Control and Use of Resources in African Agriculture: An Introduction." Africa 59 (1): 1-5.
Berry, S. (1989b). "Social Institutions and Access to Resources." Africa 59 (1): 41-55. Bertschi, I. T., R. J. Yokelson, et al. (2003). "Trace gas emissions from the production and
use of domestic biofuels in Zambia measured by open-path Fourier transform infrared spectroscopy." Journal of Geophysical Research-Atmosphere 108 (D13): 5-1, 5-13.
Bhattacharya, S. C., D. O. Albina, et al. (2002a). "Emission factors of wood and charcoal-fired cookstoves." Biomass and Bioenergy 23 (6): 453-469.
Bhattacharya, S. C., D. O. Albina, et al. (2002b). "Effects of selected parameters on performance and emission of biomass-fired cookstoves." Biomass and Bioenergy 23 (5): 387-395.

337
Blackie, P. (1985). The Political Economy of Soil Erosion. London, Longman. Blackie, P. and H. Brookfield (1987). Land Degradation and Society. Suffolk, Richard Clay
Ltd. Boberg, J. (1993). "Competition in Tanzanian Woodfuel Markets." Energy Policy 21 (5):
474-490. Bond, T., C. Venkataraman, et al. (2004). "Global atmospheric impacts of residential fuels."
Energy for Sustainable Development 8 (3): 20-32. Bond, T. C., D. G. Streets, et al. (2004). "A technology-based global inventory of black and
organic carbon emissions from combustion." Journal of Geophysical Research-Atmosphere 109: 14203-
14246. Boserup, E. (1981). Population and technological change : a study of long-term trends.
Chicago, University of Chicago Press. Bosire, J. (2003). Amnesty Call for Looters of Public Funds. The Daily Nation. Nairobi. Bowen-Jones, E., D. Brown, et al. (2003). "Economic commodity or environmental crisis?
An interdisciplinary approach to analysing the bushmeat trade in central and west Africa." Area 35 (4): 390-402.
Boy, E., N. Bruce, et al. (2002). "Birth weight and exposure to kitchen wood smoke during pregnancy in rural Guatemala." Environmental Health Perspectives 110 (1): 109-114.
Brashares, J. S., P. Arcese, et al. (2004). "Bushmeat Hunting, Wildlife Declines, and Fish Supply in West Africa." Science 306 (5699): 1180-1183.
Breman, H. and J.-J. Kessler (1995). Woody Plants in Agro-Ecosystems of Semi-Arid Regions. Berlin, Springer-Verlag.
Breman, H. and C. T. D. Wit (1983). "Rangeland Productivity and Exploitation in the Sahel." Science 221 (4618): 1341-1347.
Briggs, C. L. (2001). Discourse, Anthropology of. International Encyclopedia of the Social &Behavioral Sciences. N. J. Smelser and P. B. Baltes. Oxford, Elsevier Science Ltd: 3732-3736.
Brocard, D., C. Lacaux, et al. (1996). Emissions from the combustion of biofuels in Western Africa. Biomass Burning and Global Change. J. S. Levine. Cambridge, MA, MIT Press. 1: 350-360.
Broch-Due, V. and D. M. Anderson (1999). Poverty and the Pastoralist: Deconstructng Myths and Reconstructing Realities. The Poor Are Not Us: Poverty and Pastoralism in East Africa. D. M. Anderson and V. Broch-Due. Athens, Ohio, Ohio University Press: 3-19.
Brockington, D. and K. Homewood (1996). Wildlife, Pastoralists, and Science: Debates Concerning Mkomazi Game Reserve, Tanzania. The Lie of the Land: Challenging Received Wisdom on the African Environment. M. Leach and R. Mearns. Portsmouth, NH, Heinemann: 91-104.

338
Bruce, J. (1993). Do Indigenous Tenure Systems Constrain Agricultural Development? Land in African Agrarian Systems. T. J. Bassett and D. E. Crummey. Madison, WI, University of Wisconsin Press: 35-56.
Bruce, J. and S. Migot-Adholla, Eds. (1994). Searching for Land Tenure Security in Africa. Dubuque, Iowa, Kendall/Hunt.
Bruijnzeel, L. A. (2004). "Hydrological functions of tropical forests: not seeing the soil for the trees?" Agriculture, Ecosystems & Environment 104 (1): 185-228.
Bryant, R. L. (1993). "Forest Problems in Colonial Burma - Historical Variations on Contemporary Themes." Global Ecology and Biogeography Letters 3 (4-6): 122-137.
Bryant, R. L. and S. Bailey (1997). Third World political ecology. New York, Routledge. Bush, S. R. (2004). "Scales and Sales: Changing Social and Spatial Fish Trading Networks in
the Siiphandone Fishery, Lao PDR." Singapore J Trop Geo 25 (1): 32-50. Campbell, D. (1993). Land as Ours, Land as Mine: Economic, Political and Ecological
Marginalization in Kajiado District. Being Maasai: Ethnicity and Identity in East Africa. T. Spear and R. Waller. London, James Currey Ltd: 258-272.
Center of Transportation Research (2001). The Greenhouse Gases, Regulated Emissions, and Energy Use in Transportation (GREET) Model, Argonne National Laboratory, U.S. Department of Energy, http://www.transportation.anl.gov/ttrdc/greet/index.html.
Central Bureau of Statistics (2003). Geographical Dimensions of Well-Being in Kenya: Where are the Poor? Nairobi, The Regal Press, Ltd.
Chambers, R. and M. Leach (1989). "Trees as savings and security for the rural poor." World Development 17 (3): 329-342.
Chanock, M. (1991). Paradigms, Policies, and Property: A Review of the Customary Law of Land Tenure. Law in colonial Africa. K. Mann and R. Roberts. Portsmouth, NH, Heinemann Educational Books.
Chavangi, N., R. Engelhard, et al. (1988). Culture as the Basis for Implementation of Self-Sustaining Woodfuel Development Programs. Whose Trees? Proprietary Dimensions of Forestry. L. Fortmann and J. Bruce. Boulder and London, Westview Press: 243-253.
Chibnik., M. (2000). "The Evolution of Market Niches in Oaxacan Woodcarving." Ethnology 39 (3): 225.
Chidumayo, E. N. (1988). "Estimating fuelwood production and yield in regrowth dry miombo woodland in Zambia." Forest Ecology and Management 24 (1): 59-66.
Chidumayo, E. N. (1993). "Zambian Charcoal Production: Miombo Woodland Recovery." Energy Policy 21 (5): 586-597.
Cline-Cole, R. (1990). "On Fuelwood Consumption, Population Dynamics, and Deforestation in Africa." World Development 18 (4): 513-527.
Cline-Cole, R. (2000). Knowledge Claims, Landscape, and the Fuelwood-Degradation Nexus in Dryland Nigeria. Producing Nature and Poverty in Africa. V. Brosch-Due and R. Schroeder. Stockholm, Norddiska Afrikainstitutet: 109-147.
339
Coast, E. (2002). "Maasai Socioeconomic Conditions: A Cross-Border Comparison." Human Ecology 30 (1): 79-105.
Cohen, A., R. Anderson, et al. (2004). Urban Ambient Air Pollution. Comparative Quantification of Health Risks: Global and Regional Burden of Disease Attributable to Selected Major Risk Factors. M. Ezzati, A. D. Lopez, A. Rodgers and C. J. L. Murray. Geneva, World Health Organization.
Coomes, O. T. and G. J. Burt (2001). "Peasant Charcoal Production in the Peruvian Amazon: rainforest use and economic reliance." Forest Ecology and Management 140: 39-50.
Cowlishaw, G., S. Mendelson, et al. (2005). "Structure and operation of a bushmeat commodity chain in southwestern Ghana." Conservation Biology 19 (1): 139-149.
Dahl, G. and A. Hjort (1976). Having herds : pastoral herd growth and household economy. Stockholm, Dept. of Social Anthropology, University of Stockholm.
Davis, M. (1990). City of quartz : excavating the future in Los Angeles. London, Verso. Davis, M. (1998). Ecology of fear: Los Angeles and the imagination of disaster. New York,
Metropolitan Books. Davis, M. (2002). Dead cities, and other tales. New York, New Press. Deaton, A. (1997). The Analysis of Household Surveys: A Microeconomic approach to
Development Policy. Baltimore, Published for the World Bank by Johns Hopkins University Press.
Dewees, P. (1989). "The Woodfuel Crisis Reconsidered." World Development 17 (8): 1159-1172.
Dietz, T. (1996). Entitlements to Natural Resources: Contours of Political Environmental Goegraphy. Utrecht, International Books.
Divisional Agricultural Officers (2002-2004). Monthly Divisional Agriculture Reports. Narok, Kenya, District Agricultural Office, Ministry of Agriculture.
Dixon, J. (1999). "A cultural economy model for studying food systems." Agriculture and Human Values 16 (2): 151-160.
Dodson, R. (2002). The Kilns of Kasigau. EcoForum. Nairobi. 25: 24-26. Dove, M. (1992). "Foresters' beliefs about farmers: a priority for social science research in
social forestry." Agroforestry Systems 17 (1): 13-41. Dublin, H. T. (1995). Vegetation dynamics in the Serengeti-Mara ecosystem: the role of
elephants, fire and other factors. Serengeti II: dynamics, management and conservation of an ecosystem. A. R. E. Sinclair and P. Arcese. Chicago, IL., University of Chicago Press: 71–90.
East Africa High Commission (1953). African population of Kenya Colony and Protectorate: geographical and tribal studies. Nairobi, East African Statistical Department.
Eckholm, E. (1975). The other energy crisis: Firewood. Washington DC, Worldwatch: 22. Eckholm, E. (1984). Fuelwood: The energy crisis that won't go away. Washington DC,
Earthscan.
340
Ecoforum (2002). Hot and Dirty: Inside Kenya's 23 Billion Shilling Charcoal Industry. EcoForum. Nairobi. 25: 16-22.
Ehrlich, P. (1968). The population bomb. New York, Ballantine Books. Eide, G. E. and I. Heuch (2001). "Attributable Fractions: Fundamental Concepts and Their
Visualization. ?" Statistical Methods in Medical Research 10: 159-193. Escobar, A. (1995). Encountering development : the making and unmaking of the Third
World. Princeton, NJ, Princeton University Press. ESMAP (1991). Rwanda: Commercialization of Improved Charcoal Stoves and
Carbonization Techniques - Mid-Term Progress Report. Washington DC, The Energy Sector Management Assistance Programme of the World Bank: 96.
Esteva, G. (1992). Development. The Development Dictionary: A Guide to Knowledge as Power. W. Sachs. London, Zed Books: 6-25.
Ezzati, M. and D. Kammen (2001). "Indoor Air Pollution from Biomass Combustion and Acute Respiratory Infections in Kenya: An Exposure Response Study." The Lancet 358: 619-625.
Ezzati, M. and D. Kammen (2002). "Evaluating the Health Benefits of Transitions in Household Energy Technology in Kenya." Energy Policy 30 (10): 815-826.
Ezzati, M., D. Kammen, et al. (2000a). "Comparison of Emissions and Residential Exposure from Traditional and Improved Cookstoves in Kenya." Environmental Science and Technology 34 (4).
Ezzati, M., D. Kammen, et al. (2000b). "Comparison of Emissions and Residential Exposure from Traditional and Improved Cookstoves in Kenya." Environmental Science and Technology 34 (4): 578-583.
Ezzati, M., A. Lopez, et al. (2001). "Selected major risk factors and global and regional burden of disease." The Lancet 360 (9343): 1347-1360.
Ezzati, M. and A. D. Lopez (2004). Smoking and oral tobacco use. Comparative Quantification of Health Risks: Global and Regional Burden of Disease Attributable to Selected Major Risk Factors. M. Ezzati, A. D. Lopez, A. Rodgers and C. J. L. Murray. Geneva, World Health Organization: 883-956.
Fairhead, J. and M. Leach (1996). Misreading the African Landscape: Society and Ecology in a Forest-Savanna Mosaic. Cambridge and New York, Cambridge University Press.
FAO (1978). Forestry for Local Community Development. Rome, UN Food and Agriculture Organization: 114.
FAO (1983). Simple technologies for charcoal making. Rome, UN Food and Agriculture Organization: 154.
FAO (1985). Industrial charcoal making. Rome, UN Food and Agriculture Organization. FAO (2000). Unified Wood Energy Terminology: UWET. Rome, UN Food and Agriculture
Organization.

341
FAOSTAT data (2004). FAOSTAT Forestry Data, United Nations Food and Agriculture Organization. May 17th, 2004, http://faostat.fao.org/faostat/collections?subset=forestry.
Ferguson, A. (1986). "Women's health in a marginal area of Kenya." Social Science & Medicine 23 (1): 17-29.
Ferguson, J. (1994). The Anti-politics Machine: "Development," Depoliticization. and Bureaucratic Power in Lesotho. Minneapolis, University of Minnesota Press.
Ferreira, O. C. (2000). "Emission of Greenhouse Effect Gases in Vegetal Coal Production." Economy and Energy 20.
Foley, G. (1986). Charcoal Making in Developing Countries. London, International Institute for Environment and Development: 214.
Foley, G. (2001). Sustainable Woodfuel Supplies from the Dry Tropical Woodlands. Washington DC, Joint UNDP/World Bank Energy Sector Management Assistance Programme (ESMAP): 100.
Fortmann, L. (1985). "The Tree Tenure Factor in Agroforestry with Particular Reference to Africa." Agroforestry Systems 2: 229-251.
Fortmann, L. and J. Bruce, Eds. (1988). Whose Trees? Proprietary Dimensions of Forestry. The Rural Studies Series of the Rural Sociological Society. Boulder and London, Westview Press.
Fratkin, E. (1997). "Pastoralism: Governance and Development Issues." Annual Review of Anthropology 26: 235-261.
Freidberg, S. (1997). "Contacts, Contracts, and Green Bean Schemes: Liberalisation and Agro-Entrepeneurship in Burkina Faso." Journal of Modern African Studies 35 (1): 101-128.
Friedland, W. (1984). Commodity Systems Analysis: An Approach to the Sociology of Agriculture. Research in Rural Sociology and Development. H. K. Schwarzweller. Greenwich, Conn, JAI Press. 1: 221-235.
Fumagalli, C. T. (1978). " An Evaluation of Development Projects Among East African Pastoralists." African Studies Review 21 (3): 49-63.
Galaty, J. (1980). The Maasai Group Ranch: Politics and Development in an African Pastoral Society. When Nomads Settle: Processes of Sedentarization as Adaptation and Response. P. C. Salzman. New York, Praeger Special Studies: 157-172.
Galaty, J. (1982). "Being Masai; Being People-of-Cattle: Ethnic Shifters in East-Africa." American Ethnologist 9 (1): 1-20.
Galaty, J. (1992). "This land is yours: Social and economic factors in the privatisation, subdivision and sale of Maasai ranches." Nomadic Peoples 30: 26-40.
Galaty, J. (1994). Rangeland Tenure and Pastoralism in Africa. African Pastoralist Systems: An Integrated Approach. E. Fratkin, K. A. Galvin and E. A. Roth. Boulder, CO, Lynne Rienner Publishers, Inc.: 185-204.

342
Gathaara, G. N. (1999). Aerial Survey of the Destruction Of Mt. Kenya, Imenti and Ngare Ndare Forest Reserves: February - June 1999. Nairobi, Kenya Wildlife Service: 33.
Geist, H. J. and E. F. Lambin (2002). "Proximate Causes and Underlying Driving Forces of Tropical Deforestation." BioScience 52 (2): 143-151.
Gereffi, G. and M. Korzeniewicz, Eds. (1994). Commodity chains and global capitalism. Contributions in economics and economic history. Westport, CT, Greenwood Press.
Giovannuccia, D. and S. Ponteb (2005). "Standards as a new form of social contract? Sustainability initiatives in the coffee industry." Food Policy In press.
Goldfrank, W. L. (1994). Fresh Demand: The Consumption of Chilean Produce in the United States. Commodity chains and global capitalism. G. Gereffi and M. Korzeniewicz. Westport, CT, Greenwood Press: 267-279.
Goodman, D. and M. Watts (1992). "Reconfiguiring the Rural or Fording the Divide?: Capitalist Restructuring and the Global Agro-Food System." Journal of Peasant Studies 22 (1): 1-49.
Goodman, M. K. (2004). "Reading fair trade: political ecological imaginary and the moral economy of fair trade foods." Political Geography 23 (7): 891-915.
Government of Kenya (1966). Kenya population census, 1962: tables. Nairobi, Kenya, Directorate of Economic Planning - Ministry of Finance and Economic Planning. 3-4.
Government of Kenya (1980-2002). Narok District Development Plan. Nairobi, Min. of Economic Planning and Development (1980); Ministry of Finance and Planning (1984-94, 2002); Office of the Vice-President (1997).
Government of Kenya (1992). The Forests Act. Nairobi, Government Printer: 43. Government of Kenya (1994). Kenya population census, 1989. Nairobi, Kenya, Central
Bureau of Statistics. Government of Kenya (1997a). Kisii District Development Plan: 1997-2001. Nairobi, Office
of the Vice-President. Government of Kenya (1997b). Nakuru District Development Plan: 1997-2001. Nairobi,
Office of the Vice-President. Government of Kenya (1999). Environmental Management and Co-Ordination Act. Nairobi,
Government Printer. Government of Kenya (2001). The 1999 Population and Housing Census. Nairobi, Kenya,
Central Bureau of Statistics. Government of Kenya (2004). Forest Policy (Draft). Government of Kenya (2005). The Proposed New Constitution of Kenya. Nairobi, Drafted
and Published by the Attorney-General Pursuant to Section 27 of the Constitution of Kenya Review Act: 153.
Government of Kenya (Various years). Statistical Abstract. Nairobi, Central Bureau of Statistics.

343
Graedel, T. E. (1998). Streamlined Life Cycle Assessment. Engelwood Cliffs, NJ, Prentice-Hall, Inc.
Gramsci, A. (1971). Selections from the Prison Notebooks. New York, International Publishers.
Gulbrandsen, Å. (1984). Access to agricultural land & communal land management in eastern Botswana. Gaberone, Applied Research Unit, Ministry of Local Government and Lands, Republic of Botswana and the Land Tenure Center, University of Wisconsin-Madison: 117.
Halderman, J. M. (1972). An analysis of continued semi-nomadism of the Kaputiei Maasai group ranches: sociological and ecological factors. Nairobi, Institute for Development Studies, University of Nairobi: 35.
Hansen, J., M. Sato, et al. (2000). "Global warming in the twenty-first century: An alternative scenario." Proceedings of the National Acadamy of Science 97 (18): 9875-9880.
Hardin, G. (1968). "Tragedy of the Commons." Science 162: 1243-1248. Harris, J. and M. Todaro (1970). "Migration, Unempolyment and Development: A Two-
Sector Analysis." The American Economic Review 60 (1): 126-142. Hart, G. (2001). "Development Critiques in the 1990's: Cul de Sacs and Promising Paths."
Progress in Human Geography 25 (4). Hartwick, E. (2000). "Towards a geographical politics of consumption." Environment and
Planning A 32: 1177-1192. Hartwick, E. R. (2001). Commodity Chains: International Encyclopedia of the Social
&Behavioral Sciences. Oxford, Elsevier Science Ltd: 2276-2279. Haugerud, A. (1983). "The Consequences of Land Tenure Reform Among Smallholders in
the Kenyan Highlands." Rural Africana 15/16: 65-90. Helland, J. (1977). Group Ranch Development Among the Maasai in Kenya. East African
Pastoralism: Anthropological Perspectives and Development Needs, Addis Ababa, International Livestock Research Institute (ILRI).
Hibajane, S. H. (1994). Assessment of Earth Kiln Charcoal Production Technology. Stockholm, Stockholm Environmental Institute: 39.
Hill, P. (1963). The migrant cocoa-farmers of southern Ghana; a study in rural capitalism. Cambridge, Cambridge University Press.
Homewood, K. (1995). "Development, Demarcation and Ecological Outcomes in Maasailand." Africa 65 (3): 331-350.
Homewood, K. (2005). Introduction: Rural Resource Use and Local Livelihoods in Sub-Saharan Africa. Rural Resources and Local Livelihoods in Africa. K. Homewood. Oxford, James Currey Ltd: 212.
Homewood, K., E. F. Lambin, et al. (2001). "Long-term changes in Serengeti-Mara wildebeest and land cover: Pastoralism, population, or policies?" PNAS 98 (22): 12544-12549.
344
Homewood, K. and W. Rodgers (1991). Maasailand Ecology: Pastoralist Development and Wildlife Conservation in Ngorongoro, Tanzania. Cambridge, Cambridge University Press.
Horowitz, M. and P. Little (1987). African Pastoralism and Poverty: Some Implications for Drought and Famine. Drought and Hunger in Africa: Denying Famine a Future. M. Glantz. Cambridge, Cambridge University Press: 59-82.
Hosier, R. (1985). Energy in Use Rural Kenya: Household Demand and Rural Transformation. Stockholm, The Beijer Institute and The Scandanavian Institute of African Studies.
Hosier, R. (1988). "The Economics of Deforestation in Eastern Africa." Economic Geography 64 (2): 121-136.
Hosier, R. H. (1993). "Charcoal Production and Environmental Degradation: environmental history, selective harvesting, and post-harvest management." Energy Policy 21 (5): 491-509.
House, J. I. and D. O. Hall (2003). Savannahs, King’s College London. July 12, http://www.savannas.net/newframe.htm.
Human Rights Watch (1997). Failing the Internally Displaced: The UNDP Displaced Persons Program in Kenya. Washington DC, Human Rights Watch/Africa.
Hyden, G. (2001). Moral Economy and Economy of Affection. International Encyclopedia of the Social &Behavioral Sciences. N. J. Smelser and P. B. Baltes. Oxford, Elsevier Ltd: 10021-10024.
IEA (2002). Energy and Poverty (Chapter 13 of World Energy Outlook 2002). World Energy Outlook 2002. Paris, IEA Publications: 49.
IEA (2003a). Energy Balance of Non-OECD Countries 2000-2001. Paris, The Organization for Economic Cooperation and Development (OECD).
IEA (2003b). Energy Statistics of Non-OECD Countries 2000-2001. Paris, The Organization for Economic Cooperation and Development (OECD).
IEA (2004). Energy Statistics of Non-OECD Countries. Iliffe, J. (1987). The African Poor. Cambridge, UK, Cambridge University Press. International Bank of Reconstruction and Development (1977). Kenya Second Livestock
Development Project, Report of the Review Mission, Feb 22 - Mar 26, 1976. International Geosphere-Biosphere Programme (2004). IGBP-DIS - Data and Information
Services, International Geosphere-Biosphere Programme. July 5, 2005, http://www.igbp.kva.se/cgi-bin/php/frameset.php.
International Labour Organization (1985). Fuelwood and charcoal preparation : an illustrated training manual on simple tools and techniques for small-scale enterprises. Geneva, International Labour Organization.
IPCC (1990). Climate Change: The IPCC Assessment. Cambridge, Cambridge University Press.

345
IPCC (1996). Climate Change 1995: Scientific-Technical Analyses of Impacts, Adaptations, and Mitigation of Climate Change. Cambridge, UK and New York, NY, USA, Cambridge University Press.
IPCC (1997a). Kyoto Protocol to the United Nations Framework Convention on Climate Change: 23.
IPCC (1997b). Revised 1996 IPCC Guidelines for National Greenhouse Gas Inventories: Reference Manual. Oxford, UK, Blackwell Press.
IPCC (2000a). IPCC Special Report on Emissions Scenarios. Bonn, Intergovernmental Panel on Climate Change.
IPCC (2000b). Special Report on Land-Use, Land-Use Change, and Forestry. New York, NY and Cambridge, UK, Cambridge University Press.
IPCC (2001). Climate Change 2001: The Scientific Basis. Cambridge, UK and New York, NY, USA, Cambridge University Press.
IPCC (2003). Good Practice Guidance for Land Use, Land-Use Change and Forestry. Hayama, Japan, Institute for Global Environmental Strategies (IGES) for the IPCC.
Jacobs, A. H. (1975). Maasai Pastoralism in Historical Perspective. XIIIth International African Seminar: Pastoralism in Tropical Africa, Niamey, Niger, Published for the International African Institute by Oxford University Press.
Jacobson, A. E. (2004). Connective power : solar electrification and social change in Kenya. Energy and Resources Group. Berkeley, University of California at Berkeley: 344.
Jaetzold, R. and H. Schmidt (1983). Farm Management Handbook of Kenya. Nairobi, Ministry of Agriculture with cooperation of Gesellschaft für Technische Zusammenarbeit (GTZ).
Johnson, S. (2004). "Gender Norms in Financial Markets: Evidence from Kenya." World Development 32 (8): 1355-1374.
Jones, G., R. Steketee, et al. (2001). "How many child deaths can we prevent this year." The Lancet 362 (9343): 65.
Kabigumila, J. (1990). "Feeding-Habits Of Elephants In Ngorongoro Crater, Tanzania." African Journal of Ecology 31 (2): 156-164.
Kambani, S., , et al. (2003). "Small-scale mining and cleaner production issues in Zambia." Journal of Cleaner Production 11 (2): 141-146.
Kameri-Mbote, P. (2002). Property Rights and Biodeiversity Management in Kenya. Nairobi, ACTS Press.
Kameri-Mbote, P. (2003). Land Tenure & conflict in kenya: Toward innovative conflict prevention and management. The Fourth Workshop of the Pan-African Programme on Land and Resource Rights (PAPLRR), University of Western Cape, Cape Town, South Africa, Published on the internet by the African Centre for Technology Studies (ACTS).

346
Kammen, D. (1995). From Energy Efficiency to Social Utility: Lessons from cookstove design. dissemination, and use. Energy as an Instrument for Socioeconomic Development, UNDP: Ch. 5.
Kanogo, T. (1987). Squatters and the Roots of Mau Mau. London, Currey. Kantai, P. (2002). Hot and Dirty: Inside Kenya's 23 Billion Shilling Charcoal Industry.
EcoForum. Nairobi. 25: 16-22. Karanja, A. M. and J. K. Nyoro (2002). Coffee Prices and Regulation and Their Impact on
Livelihoods of Rural Community in Kenya. Nairobi, Tegemeo Institute of Agricultural Policy and Development, Egerton University: 62.
Karanja, F., Y. Tessema, et al. (2002). Equity in the Loita/Purko Naimina Enkiyio Forest in Kenya: Securing Maasai Rights to and Responsibilities for the Forest. Nairobi, IUCN Regional Office for Eastern Africa (EARO): 45.
Karbolo, M. K. O. (1999). Facing modern land loss challenges: the Loita Maasai pastoralists and the recent controversy over the Naimina Enkiyio indigenous forest in Narok District. Kampala, Uganda, The Arid Lands and Resource Management Network in Eastern Africa (ALARM): 35.
Karekezi, S. (2002). "Poverty and energy in Africa--A brief review." Energy Policy 30 (11-12): 915-919.
Kemei, K. (2005). Suspicion, interference cripple registration. The Standard. Nairobi. Kenya Forests Working Group (2003). Minutes of KFWG meeting held on Jan. 23, 2003.
Nairobi, Kenya Forests Working Group. Kenya Land Commission (1933). Report of the Kenya Land Commission. Nairobi, Secretary
of State for the Colonies (UK): 618. Kenya Seed Company Limited (2005). Maize Varieties at a Glance, Kenya Seed Company
Limited. 05 July, 2005, http://www.kenyaseed.com/maize.htm. Kimani, K. and J. Pickard (1998). "Recent Trends and Implications of Group Ranch Sub-
Division and Fragmentation in Kajiado District, Kenya." The Geographical Journal 164 (2): 202-213.
Kimutai, V. (2005). Police burn 23 more homes in disputed forest. The Standard. Nairobi. Kinyungu, C. (2005). Now MPs tell hawkers to 'revenge' in 2007 polls. The Daily Nation.
Nairobi. Kitching, G. (1980). Class and Economic Change in Kenya: The Making of an African
Petite-Bourgeoisie. New Haven, CT, Yale University Press. Kituyi, E. (2002). Lost Opportunities: Woodfuel Data and Policy Development Concerns in
Kenya. Nairobi, African Centre for Technology Studies (ACTS): 12. Kituyi, E. (2004a). Lost Opportunities: Woodfuel Data And Policy Development Concerns In
Kenya. Nairobi, African Centre for Technology Studies (ACTS): 12.

347
Kituyi, E. (2004b). "Towards sustainable production and use of charcoal in Kenya: exploring the potential in life cycle management approach." Journal of Cleaner Production 12 (8-10): 1047-1057.
Kituyi, E., L. Marufu, et al. (2001). "Biofuel Consumption Rates and Patterns in Kenya." Biomass and Bioenergy 20: 83-99.
Kituyi, M. (1990). Becoming Kenyans: Socioeconomic Transformation of the Pastoral Maasai. Nairobi, ACTS Press.
Körber, A. (1998). "Why everybody loves Flipper: the political-economy of the U.S. dolphin-safe laws." European Journal of Political Economy 14 (3): 475-509.
Krapf, J. L. (1860). Travels, researches, and missionary labors during an eighteen years' residence in Eastern Africa: together with journeys to Jagga, Usambara, Ukambani, Shoa, Abessinia and Khartum, and a coasting voyage from Mombaz to Cape Delgado. Boston, Ticknor and Fields.
Kuletz, V. (1998). The tainted desert : environmental ruin in the American West. New York, Routledge.
Kwayera, J. (2003a). Judiciary Tested as Morans Block Entry into Keekorok. The East African. Nairobi.
Kwayera, J. (2003b). Wildlife Victims Want $65,000 for Every Death. The East African. Nairobi.
Lambrechts, C., B. Woodley, et al. (2003). Aerial Survey of the Destruction of the Aberdare Range Forests. Nairobi, UNEP: Division of Early Warning and Assessment: 35.
Lamprey, R. H. and R. S. Reid (2004). "Expansion of human settlement in Kenya’s Maasai Mara: what future for pastoralism and wildlife?" Journal of Biogeography (J. Biogeogr.) 31: 997-1032.
Leach, G. (1992). "The Energy Transition." Energy Policy 20 (2): 116-123. Leach, G. and R. Mearns, Eds. (1988). Beyond the Woodfuel Crises: people, land, and trees
in Africa. London, Earthscan. Leach, M. and R. Mearns (1996). Environmental Change and Policy: Challenging Received
Wisdom in Africa. The Lie of the Land: Challenging Received Wisdom on the African Environment. M. Leach and R. Mearns. London, The International African Institute: 240.
Leslie, D. and S. Reimer (1999). "Spatializing commodity chains." Progress in Human Geography 23 (3): 401–420.
Lettens, S., B. Muys, et al. (2003). "Energy budget and greenhouse gas balance evaluation of sustainable coppice systems for electricity production." Biomass and Bioenergy 24 (3): 179-197.
Leys, C. (1975). Underdevelopment in Kenya: The Political Economy of Neo-Colonialism 1964-1971. London, Heineman Educational Books Ltd.
Leys, N. (1925). Kenya. London, Hogarth press.
348
Li, T. M. (2000). "Articulating Indigenous Identity in Indonesia: Resource Politics and the Tribal Slot." Comparative Studies in Society and History 42: 149-179.
Liski, J., A. Nissinen, et al. (2003). "Climatic effects on litter decomposition from arctic tundra to tropical rainforest." Global Change Biol 9 (4): 575-584.
Loefler, I. (2004). In Case We've Forgotten, There's Money in Wildlife. The East African. Nairobi.
Loureiro, M. L. and J. Lotade (2005). "Do fair trade and eco-labels in coffee wake up the consumer conscience?" Ecological Economics 53 (1): 129-138.
Luoga, E. J., E. T. F. Witkowski, et al. (2000). "Economics of Charcoal Production in Miombo Woodlands of Eastern Tanzania: some hidden costs associated with commercialization of the resources." Ecological Economics 35: 243-257.
Maathai, W. (1999). Why forest farming is unacceptable. The Daily Nation. Nairobi. Maine, H. S. (1864). Ancient law: its connection with the early history of society, and its
relation to modern ideas. New York, C. Scribner [Electronic version available through the University of Michigan Digital Library at http://name.umdl.umich.edu/AEW3214.0001.001].
Mamdani, M. (1996). Citizen and subject : contemporary Africa and the legacy of late colonialism. London, James Currey.
Marshall, F. (1994). Archeological Perspectives on East African Pastoralism. African Pastoralist Systems: An Integrated Approach. E. Fratkin, K. A. Galvin and E. A. Roth. Boulder, CO, Lynne Rienner Publishers, Inc.: 17-43.
Masera, O., B. Saatkamp, et al. (2000). "From Linear Fuel Switching to Multiple Cooking Strategies: A Critique and Alternative to the Energy Ladder Model." World Development 28 (12): 2083-2103.
Masera, O. R., J. F. Garza-Caligaris, et al. (2003). "Modeling carbon sequestration in afforestation, agroforestry and forest management projects: the CO2FIX V.2 approach." Ecological Modelling 164: 177–199.
Matthews, R. W. (2001). "Modeling of energy and carbon budgets of wood fuel coppice systems." Biomass and Bioenergy 21 (1): 1-19.
McCarthy, J. (2001). States of Nature and Environmental Enclosures in the American West. Violent Environments. N. Peluso and M. Watts. Ithaca, NY, Cornell University Press: 117-145.
McDonald, D. A. (1999). "Lest the rhetoric begin: : migration, population and the environment in Southern Africa." Geoforum 30 (1): 13-25.
McKay, B. and J. Acheson (1996). Human Ecology of the Commons. The Question of the Commons: The Culture and Ecology of Communal Resources. B. McKay and J. Acheson. Tuscon, The University of Arizona Press: 1-34.
Menzies, N. (1988). "300 Years of Taungya - a Sustainable System of Forestry in South China." Human Ecology 16 (4): 361-376.
Merry, S. E. (1988). "Legal Pluralism." Law and Society Review 22 (5): 869-896.

349
Miettinen, O. S. (1974). "Proportion of Disease Caused or Prevented by a Given Exposure, Trait or Intervention." American Journal of Epidemiology 99: 325-332.
Ministry of Energy (2002). Study on Kenya's Energy Demand, Supply and Policy Strategy for Households, Small Scale Industries and Service Establishments: Final Report. Nairobi, KAMFOR Company Limited: 158.
Ministry of Energy (2003). The National Wood Energy Policy. Nairobi: 26. Ministry of Planning and National Development (1998). First report on poverty in Kenya.
Nairobi, Central Bureau of Statistics and Human Resources and Social Services Dept. Mishra, V., X. L. Dai, et al. (2004). "Maternal exposure to biomass smoke and reduced birth
weight in Zimbabwe." Annals of Epidemiology 14 (10): 740-747. Mission on Land Consolidation and Registration in Kenya (1966). Report of the Mission on
Land Consolidation and Registration in Kenya, 1965-1966. London, Government Printer: 192.
Mohan, G. and K. Stokke (2000). "Participatory development and empowerment: the dangers of localism." Third World Quarterly 21 (2): 247-268.
Monela, G. C., E. Zahabu, et al. (2000). Socio-Economics of Charcoal Extraction in Tanzania: A Case Of Eastern Part of Tanzania. Stockholm, Stockholm Environmental Institute (SEI): 14.
Moore, S. F. (1973). "Law and Social Change: The Semi-Autonomous Social Field as an Appropriate Subject of Study." Law and Society Review 7 (Summer): 719-746.
Moyo, S. S. M. (1995). The land question in Zimbabwe. Harare, Zimbabwe, SAPES Books (Southern Africa political economy series).
Mugo, F. (2004). Interview. Mugo, F. and C. Ong (2003). Charcoal Study Tour to Sudan: Lessons and Application To
Kenya, Tanzania, Uganda, and Zambia. Nairobi, RELMA: 8. Mugo, F. and E. Poulstrup (2003). Assessment of Potential Approaches to Charcoal as a
Sustainable Source of Income in The Arid and Semi-Arid Lands of Kenya. Nairobi, DANIDA and RELMA: 72.
Mugo, F. W. (1999). Charcoal Trade in Kenya. Nairobi, Kenya, RELMA/SIDA: 35. Mulama, J. (2005). Corruption-Kenya:MPs Face Prosecution for Failure to Declare Wealth.
Inter Press Service. Johannesburg. Munene, F. (2003). Household Population and Housing Characteristics. Kenya Demographic
and Health Survey. K. C. B. o. Statistics. Nairobi, Kenya Central Bureau of Statistics. Muriuki, M. (2005). PS: Take back grabbed land. The Daily Nation. Nairobi. Murray, C. and A. Lopez (1996a). Alternative visions of the future: projecting mortality and
disability, 1990-2020. The Global Burden of Disease. C. Murray and A. Lopez. Boston, Harvard School of Public Health on behalf of the WHO and the World Bank.

350
Murray, C. and A. Lopez, Eds. (1996b). The Global Burden of Disease. The Global Burden of Disease and Injury Series. Boston, Published by the Harvard School of Public Health on behalf of the WHO and the World Bank.
Murray, C. J. L., M. Ezzati, et al. (2003). "Comparative quantification of health risks: conceptual framework and methodological issues." Population Health Metrics 1: 1.
Musembi, D. K. (1986). The Seasonal Climate of Rangelands. Range Development and Research in Kenya, Egerton College - Njoro, Kenya, Winrock International.
Mutimba, S. (2005). Interview. Mutimba, S. and M. Barasa (2005a). National Charcoal Survey of Kenya. Nairobi, Energy
for Sustainable Development - Africa: 56. Mutimba, S. and M. Barasa (2005b). National Charcoal Survey: Exploring the potential for a
sustainable charcoal industry in Kenya. Nairobi, Energy for Sustainable Development - Africa: 74.
Mutimba, S. and V. Matiru (2002). Legalise It. EcoForum. Nairobi. 25: 34-35. Mwangi, M. (2005a). Bewildered villagers still in shock as police evict them from their
homes. The Daily Nation. Nairobi. Mwangi, M. (2005b). Continued destruction spells doom for many. The Daily Nation.
Nairobi. Mwangi, M. (2005c). Raiders shot dead in police swoop. The Daily Nation. Nairobi. Nabuurs, G. J., J. F. Garza-Caligaris, et al. (2001). CO2FIX V2.0 - manual of a model for
quantifying carbon sequestration in forest ecosystems and wood products. Wanginengen, ALTERRA: 48.
Nair, P. K. R. (1991). "State-of-the-Art of Agroforestry Systems." Forest Ecology and Management 45 (1-4): 5-29.
Narok Disrict Meteorological Office (2005). Rainfall records. Narok District Crops Officer (2005). Interview. Nation Correspondent (1999). Lonrho denies land sale claim. The Daily Nation. Nairobi. Nation Correspondent (2000). EATEC has sold 5,000 acres. The Daily Nation. Nairobi. Nation Correspondent (2003). Council staff to be paid Sh30m salary arrears. The Daily
Nation. Nairobi. Nation Correspondent (2004). Forest chiefs on suspension are dismissed. The Daily Nation.
Nairobi. Nation Correspondent (2005). Fresh hope for revised forests Bill. The Daily Nation. Nairobi. Nation Reporter (2004). Contentious forest plan halted. The Daily Nation. Nairobi. Nation Reporter (2005a). Kibaki gives consent to forests Bill. The Daily Nation. Nairobi. Nation Reporter (2005b). Maai Mahiu victims to be buried in one grave. The Daily Nation.
Nairobi. Nation Reporter (2005c). Ntimama accuses Kanu of land fraud. The Daily Nation. Nairobi.

351
Nation Reporter (2005d). Warning over forest depletion. The Daily Nation. Nairobi. Nation Team (2004). We'll block more Bills, say LDP and KANU. The Daily Nation.
Nairobi. Nation Team (2005a). Be careful, Biwott tells minister. The Daily Nation. Nairobi. Nation Team (2005b). Five MPs threaten to sue over clashes. The Daily Nation. Nairobi. National Environment Management Authority (2003). State of Environment Report - 2003
(Narok District), National Environment Management Authority,: 228. Njeru, M. (2005). 65 MPs to Face Court Over Concealed Wealth. The Nation. Nairobi. Nyang, F. (1999). Household Energy Demand and Environmental Management in Kenya.
Amsterdam, Thela Thesis publications. Ochieng, B. (2005). Personal Communication. Odour, N. and L. Wekesa (2003). Marketing aspects of charcoal from Commiphora Species
and Terminalia orbicularis. Nairobi, Kenya Forest Research Institute (KEFRI) with support from the Kingdo of Belgium (Belgian Technical Cooperation) and the Kenyan Forest Department: 83-94 (Ch. 6 in Feasibility study on Commiphora Spp).
Ojanji, W. (2001). New threat to Kenya tourism. The Daily Nation. Nairobi. O'Keefe, P., P. Raskin, et al., Eds. (1984). Energy and Development in Kenya: Opportunities
and Constraints. Energy, Environment and Development in Africa. Stockholm, The Beijer Institute and The Scandanavian Institute of Afrcan Studies.
Okello, B. D., T. G. O'Connor, et al. (2001). "Growth, biomass estimates and charcoal production of Acacia drepanolobiom in Laikipia, Kenya." Forest Ecology and Management 142: 143-153.
Okoth-Ogendo, H. (1989). "Some Issues of Theory in the Study of Tenure Relations in African Agriculture." Africa 59 (1): 6-17.
Okoth-Ogendo, H. W. O. (1991). Tenants of the crown: evolution of agrarian law and institutions in Kenya. Nairobi, Kenya, ACTS Press (African Centre for Technology Studies).
Okwemba, A. (2003). Charcoal Burning Could Be Legal Again. The Daily Nation. Nairobi. Ongugo, P. O. and J. W. Njuguna (2004). Effects of Decentralization Policies on Forest
Management: Experience from Seven Forests in Kenya. 10th. Biennial Conference of the International Association for the Study of Common Property (IASCP), Oaxaca, Mexico: August 9-13, 2004.
Openshaw, K. (1982). An Inventory of Biomass in Kenya: A Conditionally Renewable Resource. Stockholm, Sweden, Beijer Institute, (Stockholm Environmental Institute).
Ortiz, S. (2002). "Laboring in the Factories and in the Fields." Annual Review of Anthropology 31: 395–417.
Ostrom, E. (1990). Governing the Commons: The Evolution of Institutions for Collective Action. New York, Cambridge University Press.
352
Ottichilo, W. K., J. d. Leeuw, et al. (2001). "Population trends of resident wildebeest [Connochaetes taurinus hecki (Neumann)] and factors influencing them in the Masai Mara ecosystem, Kenya." Biological Conservation 97: 271-282.
Owour, O. and M. Mwangi (2005). 65 charged over fresh clashes. The Daily Nation. Nairobi. Pacca, S. and A. Horvath (2002). "Greenhouse Gas Emissions from Building and Operating
Electric Power Plants in the Upper Colorado River Basin." Environmental Science and Technology 36: 3194-3200.
Pasha, I. K. o. (1986). Evolution of Individuation of Group Ranches. Range Development and Research in Kenya, Egerton College - Njoro, Kenya, Winrock International.
Passmore, R., B. M. Nicol, et al. (1974). Handbook on human nutritional requirements. Geneva, UN Food and Agriculture Organization and the World Health Organization: 66.
Patterson, J. H. (1907). The man-eaters of Tsavo and other East African adventures. London, Macmillan and Co.
Peet, R. and M. Watts (1993). "Introduction: Development Theory and Environment in an Age of Market Triumphalism." Economic Geography, 69 (3): 227-253.
Peet, R. and M. Watts (1996). Liberation Ecology: Development, Sustainability , and Environment in an age of Market Triumphalism. Liberation Ecologies: Environment, Development, and Social Movements. R. Peet and M. Watts. New York, Routledge: 1-45.
Pennise, D. (2003). Greenhouse Gas, Indoor Air Pollution, and Wood Use Implications of the Charcoal Fuel Cycle. Environmental Health Sciences. Berkeley, CA, University of California: 194.
Pennise, D., K. R. Smith, et al. (2001). "Emissions of Greenhouse Gases and Other Airborne Pollutants from Charcoal-Making in Kenya and Brazil." Journal of Geophysical Research-Atmosphere 106: 24143-24155.
Peters, P. (1987). "Struggles over Water, Stuggles over Meaning: Cattle, Water, and the State in Botswana." Africa 54: 24-59.
Peters, P. (2002). The Limits of Negotiability: Security, Equity and Class Formation in Africa's Land Systems. Negotiating Property in Africa. K. Juul and C. Lund. Portsmouth, NH, Heinemann: 45-66.
Polanyi, K. (1957). The great transformation. Boston, Beacon Press. Porter, P. W. (2001). Ecology, Cultural. International Encyclopedia of the Social &
Behavioral Sciences. N. J. Smelser and P. B. Baltes. Oxford, Elsevier Ltd: 4035-4041.
Raikes, P. (1981). Livestock Development and Policy in East Africa. Upsalla, Scandinavian Institute for African Studies.
Raynolds, L. T. (1994). Institutionalizing Flexibility: A Comparative Analysis of Fordist and Post-Fordist Models of Third World Agro-Export Production. Commodity chains and

353
global capitalism. G. Gereffi and M. Korzeniewicz. Westport, CT, Greenwood Press: 349.
Reuters News Service (2004). McDonald's Studying More Humane Chicken Slaughter, Planet Ark - World Environmental News. August 27, http://www.planetark.com/avantgo/dailynewsstory.cfm?newsid=28736.
Ribot, J. (1999). "Decentralisation, Participation and Accountability in Sahelian Forestry: Legal Instruments of Political-Administrative Control." Africa 69 (1): 23-55.
Ribot, J. (2004). Waiting for Democracy: the Politics of Choice in Natural Resource Decentralization. Washington DC, World Resources Institute: 140.
Ribot, J. C. (1990). Markets, States and Environmental Policy: The Political Economy of Charcoal in Senegal. Energy and Resources Group. Berkeley, California, The University of California at Berkeley: 498.
Ribot, J. C. (1993). "Forestry Policy and Charcoal Production in Senegal." Energy Policy 21 (5): 559-585.
Ribot, J. C. (1998). "Theorizing Access: Forest Profits Along Senegal's Charcoal Commodity Chain." Development and Change 29: 307-341.
Ribot, J. C. and N. Peluso (2003). "A Theory of Access." Rural Sociology 63 (2): 153-181. Roe, E. M. (1991). "Development narratives, or making the best of blueprint development."
World Development 19 (4): 287-300. Roe, E. M. (1995). "Except-Africa: Postscript to a special section on development
narratives." World Development 23 (6): 1065-1069. Ruess, R. W. and F. L. Halter (1990). "The Impact of Large Herbivores on the Seronera
Woodlands, Serengeti National-Park, Tanzania." African Journal of Ecology 28 (4): 259-275.
Sadera, P. L. K. o. (1986). The Seasonal Climate of Rangelands. Range Development and Research in Kenya, Egerton College - Njoro, Kenya, Winrock International.
Salzman, P. C. (1980a). Introduction: Processes of Sedentarization as Adaptation and Response. When Nomads Settle: Processes of Sedentarization as Adaptation and Response. P. C. Salzman. New York, Praeger Special Studies: 1-19.
Salzman, P. C., Ed. (1980b). When Nomads Settle: Processes of Sedentarization as Adaptation and Response. New York, Praeger Special Studies.
Sanchez, P. (1999). "Improved fallows come of age in the tropics." Agroforestry Systems 47: 3-12.
Sandford, G. R. (1919). An administrative and political history of the Masai Reserve, Originally published by Waterlow & Sons Limited, accessed online via eHRAF (Human Relations Area Files). August 18, http://ets.umdl.umich.edu/cgi/e/ehraf/ehraf-idx?c=ehrafe;view=doc;subview=ocm;id=FL12-004;owc=FL12.

354
Sandford, S. (1995). Improving the efficiency of opportunism: new directions for pastoral development. Living with uncertainty: new directions for pastoral development in Africa. I. Scoones. London, Intermediate Technology Publications: 174–183.
Sankan, S. S. O. (1971). The Maasai. Nairobi, East African Literature Bureau. Schlamadinger, B., M. Apps, et al. (1997). "Toward a Standard Methodology for Greenhouse
Gas Balances of Bioenergy Systems in Comparison with Fossil Energy Systems." Biomass and Bioenergy 13 (6): 359-375.
Schlamadinger, B. and G. Marland (1996). "Full Fuel Cycle Carbon Balances of Bioenergy and Forestry Options." Energy Conversion and Management 37 (6-8): 813-818.
Scholes, R. J. and S. R. Archer (1997). "Tree-Grass Interactions in Savannas." Annual Review of Ecology and Systematics 28: 517-544.
Scholes, R. J. and D. O. Hall (1996). The Carbon Budget of Tropical Savannas, Woodlands, and Grasslands. Global Change: Effects on Coniferous Forests and Grasslands. A. I. Breymeyer, D. O. Hall, J. M. Melillo and G. I. Ågren. Chichester, New York, Wiley: 69-100.
Schroeder, R. A. (1993). "Shady Practice: Gender and the Political Ecology of Resource Stabilization in Gambian Garden/Orchards." Economic Goegraphy 69 (4): 349-365.
Scoones, I. (1996). Range Management, Science, and Policy: Politics, Polemics, and Pasture in Southern Africa. The Lie of the Land: Challenging Received Wisdom on the African Environment. M. Leach and R. Mearns. London, The International African Institute: 34-53.
Scoones, I. (1997). "Landscapes, Fields and Soils: Understanding the History of Soil Fertility Management in Southern Zimbabwe." ournal of Southern African Studies 23 (4): 615-634.
Scott, J. (1976). The Moral Economy of the Peasant: Rebellion and Subsistence in Southeast Asia. New Haven, CT, Yale University Press.
Scott, J. (1985). Weapons of the Weak: Everyday Forms of Peasant Resistance. New Haven, CT, Yale University Press.
Scott, J. (1998). Seeing Like a State. New Haven, CT, Yale University Press. Serneels, S. (2005). Personal communication. Serneels, S. and E. F. Lambin (2001). "Impact of land-use changes on the wildebeest
migration in the northern part of the Serengeti-Mara ecosystem." J Biogeography 28 (3): 391-407.
Serneels, S., M. Y. Said, et al. (2001). "Land cover changes around a major east African wildlife reserve: the Mara Ecosystem (Kenya)." International Journal of Remote Sensing 22 (17): 3397-3420.
Sindiga, I. (1984). "Land and Populaton Problems in Kajiado and Narok, Kenya." African Studies Review 27 (1): 23-39.
Singh, A. (1989). "Digital Change Detection Techniques Using Remotely-Sensed Data." International Journal of Remote Sensing 10 (6): 989-1003.
355
Smith, K., S. Mehta, et al. (2004). Indoor air pollution from household use of solid fuels. Comparative Quantification of Health Risks: Global and Regional Burden of Disease Attributable to Selected Major Risk Factors. M. Ezzati, A. Lopez, A. Rodgers and C. Murray. Geneva, World Health Organization: 1435-1493.
Smith, K., J. Samet, et al. (2000). "Indoor Air Pollution in Developing Countries and Acute Respiratory Infections in Children." Thorax 55: 518-532.
Smith, K., R. Uma, et al. (2000). Greenhouse Gases From Small-Scale Combustion Devices In Developing Countries Phase IIa: Household Stoves In India. Research Triangle Park, NC, US Environmental Protection Agency: 98.
Smith, K. R. (2002). "In Praise of Petroleum?" Science 298 (6 December, 2002): 1847. Smith, K. R., D. P. Pennise, et al. (1999). Greenhouse Gases from Small-scale Combustion in
Developing Countries: charcoal making kilns in Thailand. Research Triangle Park, NC, US EPA.
Sorrenson, M. P. K. (1968). Origins of European settlement in Kenya. Nairobi, Oxford University Press.
Spear, T. and R. Waller, Eds. (1993). Being Maasai: Ethnicity and Identity in East Africa. London, James Currey Ltd.
Spencer, P. (1988). The Maasai of Matapato: A Study of Rituals of Rebellion, Indiana University Press in association with the International African Institute.
Standard correspondent (2005). Coffee prices ease in tandem with demand. The East African Standard. Nairobi.
Steward, J. H. (1955). Theory of culture change; the methodology of multilinear evolution. Urbana, University of Illinois Press.
Swynnerton, R. J. M. (1955). A plan to intensify the development of African agriculture in Kenya. Nairobi, Government Printer.
Tanui, K. (2000). Ntimama in New Push for Maasai Land Rights. The Daily Nation. Nairobi. The East Africa Commission (1925). Report of the East Africa Commission. London,
Secretary of State for the Colonies (UK): 195. The Economist (2001). Science and Technology: A new game plan. The Economist. 359: 75. Thompson, E. P. (1975). Whigs and Hunters: the Origin of the Black Act. London, Allen
Lane. Thompson, M. and K. Homewood (2002). "Entrepreneurs, Elites, and Exclusion in
Maasailand: Trends in Wildlife Conservation and Pastoralist Development." Human Ecology 30 (1): 107-138.
Tiffen, M., M. Mortimore, et al. (1994). More People, Less Erosion: Environmental Recovery in Kenya. New York, John Wiley.
Transparency International - Kenya (2005). Transparency International Website, Transparency International - Kenya. October 10, http://www.tikenya.org.

356
Turner, M. (1999). "Conflict, environmental change, and social institutions in dryland Africa: Limitations of the community resource management approach." Society and Natural Resources 12: 643-657.
Udvardy, M. L. (1998). "Theorizing past and present women's organizations in Kenya." World Development 26 (9): 1749-1761.
United Nations (2004a). World Population Prospects: The 2002 Revision, Population Division of the Department of Economic and Social Affairs of the United Nations Secretariat. 15 June 2004, http://esa.un.org/unpp.
United Nations (2004b). World Urbanization Prospects: The 2001 Revision, Population Division of the Department of Economic and Social Affairs of the United Nations Secretariat. 15 June 2004, http://esa.un.org/unpp.
US CIA (2005). CIA - The World Factbook - Kenya, US Central Intelligence Agency. September 7, http://www.cia.gov/cia/publications/factbook/geos/ke.html.
van der Plas, R. (1995). Burning Charcoal Issues. Washington DC, The World Bank. Vanleeuwe, H., B. Woodley, et al. (2003). Changes in the State of Conservation of Mt.
Kenya Forests: 1999-2002. Nairobi, UNEP: Division of Early Warning and Assessment: 31.
Waithaka, J. (2004). " Maasai Mara - an ecosystem under siege: an African case study on the societal dimension of rangeland conservation." African Journal of Range and Forage Science 10 (2): 79-88.
Waller, R. (1985). "Ecology, Migration, and Expansion in East Africa." African Affairs. 84 (336): 347-370.
Waller, R. D. (1999). Pastoral Poverty in Historical Perspective. The Poor Are Not Us: Poverty and Pastoralism in East Africa. D. M. Anderson and V. Broch-Due. Athens, Ohio, Ohio University Press: 20-49.
Wamukonya, N. (2004). Women and Energy: Issues in Developing Nations. Encyclopedia of Energy. C. J. Cleveland. New York, Elsevier Inc.: 481-498.
Wangwe, L. O. a. J. B. (2005). Underlying Causes of Deforestation and Forest Degradation in Kenya, World Rainforest Movement. October 17, http://www.wrm.org.uy/deforestation/Africa/Kenya.html.
Warren, A., S. Batterbury, et al. (2001). "Soil erosion in the West African Sahel: a review and an application of a "local political ecology" approach in South West Niger." Global Environmental Change 11 (1): 79-95.
Watts, M. (1983). Silent violence : food, famine, and peasantry in northern Nigeria. Berkeley, CA, University of California Press.
Watts, M. (1985). Social Theory and Environmental Degradation. Desert Development. Y. Gradus, D. Reidel Publishing: 14-32.
Waweru, S. (2002). Charcoal Factory. EcoForum. Nairobi. 25: 33. Werthmann, K. (2003). "The president of the gold diggers: Sources of power in a gold mine
in Burkina Faso." Ethnos 68 (1): 95-111.
357
WHO (2002). World Health Report: Reducing Risks, Promoting Healthy Life. Geneva, World Health Organization.
WHO (2003). WHO Statistical Information System (WHOSIS). December 02, 2003, http://www3.who.int/whosis/menu.cfm.
Wilkie, D. S., M. Starkey, et al. (2005). "Role of Prices and Wealth in Consumer Demand for Bushmeat in Gabon, Central Africa." Conservation Biology 19 (1): 268-274.
World Agroforestry Center (ICRAF) (2004). Agroforestree Database, World Agroforestry Center (ICRAF). 8/16/2004, http://intranet.icraf.cgiar.org/icraf_web/sites/treedbs/AFT/Print.cfm?SpID=17949.
World Bank (2000). Africa Development Indicators: 2000. Washington D.C., The World Bank.
World Bank (2003a). Development Indicators Data-Base. 24 June, 2003, http://devdata.worldbank.org/dataonline/.
World Bank (2003b). Development Indicators Data-Base. October 3, http://devdata.worldbank.org/dataonline/.
World Bank (2004). Africa Development Indicators 2004. Washington D.C., The World Bank.
World Resources Institute (2003). EarthTrends: The Environmental Information Portal, World Resources Institute,. January 15, 2003, http://earthtrends.wri.org/index.cfm.
Young, T. P. and C. Francombe (1991). "Growth and yield estimates in natural stands of leleshwa (Tarconanthus camphoratus)." Forest Ecology and Management 41 (3-4): 309-321.
Yuko, D. (2004). Status of Renewable Energy Technologies in Kenya: A study into the Status and Potential of Power Generation from Biomass Waste in Kenya. Nairobi: 29.
Zaal, F. and T. Dietz (1999). Of Markets, Meat, Maize and Milk: Pastoral Commoditization in Kenya. The Poor Are Not Us: Poverty and Pastoralism in East Africa. D. M. Anderson and V. Broch-Due. Athens, Ohio, Ohio University Press: 163-198.

358
Appendix 1
Questionnaires used in surveys and guiding questions used in interviews
Contents of Appendix 1
Charcoal makers survey (English version)
Nairobi charcoal vendors survey (English version)
Nairobi charcoal vendors sampling frame
Guiding questions for in-depth interviews with landowners where charcoal
production was observed
Guiding questions for charcoal buyers and transporters

ACTS-UC Berkeley CHARCOAL MAKERS SURVEY (ENGLISH)Date: ____________________ Respondent Code: ____________________
359
Questions for charcoal producers on private/group land (English)
1. Survey Identification
1.1. Fill in the appropriate locational information:
1.2. Respondent code Record the Respondent’s name and contact information with their code in the code book – DO NOT RECORD THEIR NAME ON THIS FORM – if they decline to give their name or contact information, then proceed. Be sure to put their code on EVERY PAGE of the questionnaire.
1.3. Enumerator’s Name
2. Personal questions:
2.1. Where are you from? (record name of town/village and district)
2.2. Have you ever participated in a survey of charcoal production before? If Yes, where and when?
2.3. What is your ethnic group/tribe? Record tribe – if mixed background, record each tribe that is given.
2.4. What is your age? (record years)
2.5. Why do you make charcoal?
2.6. When did you come to this area for the first time? (record year and, if possible, month)
2.7. If you are not from this area, where did you stay just before coming here? (record name of town or village and district)
2.7.1. Did you make charcoal there? (circle Yes or No)
2.7.2. What did you do there?
2.8. What is your level of education?
2.9. Do you have any formal training as a skilled laborer?
2.9.1. What training do you have?
2.9.2. Have you ever been employed in a job that used your training?
2.9.3. When was the last time you worked in that kind of job?
2.10. Have you had any work besides charcoal making in the past year?
2.11. How many years have you been making charcoal?
2.12. Where did you first learn to make charcoal? Record name of town or village and district.
2.13. How did you learn to make charcoal? Check appropriate response.
2.14. Did you come to this area specifically to produce charcoal? (circle Yes or No)
2.14.1. Why did you come to this area?
2.15. Is charcoal your only income generating activity? (circle Yes or No)

ACTS-UC Berkeley CHARCOAL MAKERS SURVEY (ENGLISH)Date: ____________________ Respondent Code: ____________________
360
2.15.1. What fraction of your income comes from making charcoal?
2.15.2. What other work do you do and what fraction does each activity contribute to your income
2.16. Do you stay here throughout the year? (circle Yes or No)
2.16.1. If not, when are you here? Record time of year or range of months.
2.17. Do you have a family? (circle Yes or No)
2.17.1. How many people are in your family? List number of immediate family or dependents only: wives, children under 18, and other dependents such as nieces, nephews, grandchildren who the charcoal-maker supports with his labor.
2.17.2. Does your family stay here?
2.17.3. Where do they stay? (List village and district)
2.17.4. Do you send or bring money to them? (circle Yes or No)
2.17.5. What other sources of income does your family have in ___________ (response from 2.17.3)?
2.18. Do you own land? (circle Yes or No)
2.18.1. What is the size of the land? Record area in acres or hectares or other
2.18.2. Where is the land? (record town/village and district)
2.19. Do you own livestock (kept here or at home)?
2.19.1. List type and number of each.
2.20. Do you own any of the following goods? Circle Y/N as appropriate – circle Y even if the item in the respondent’s home area.
2.21. Have you planted crops in this area in the past year?
2.21.1. Where did you plant? If field is not in the immediate area, ask for the name of the ranch, sub-location, or village and record an approximate distance from the site of the kiln.
2.21.2. Who owns the land that you planted on?
2.21.3. How large an area did you plant?
2.21.4. Which crops do you plant how much did you produce in the last harvest?
2.21.5. When did you plant? When did you, or will you harvest? Record month for each.
3. Income and sales (income and sales questions apply to the past year of production).
3.1. About how many bags of charcoal have you made in the past 12 months?
3.2. Do you keep any records of your charcoal production?
3.2.1. What do you record?
3.3. At what price do you currently sell charcoal?

ACTS-UC Berkeley CHARCOAL MAKERS SURVEY (ENGLISH)Date: ____________________ Respondent Code: ____________________
361
3.4. Is this price the same every month or does it go up and down? Check appropriate answer
3.4.1. During the past year, which months have you gotten good prices and which months have you gotten bad prices?
List the months for each: give range or individual months as appropriate
3.5. In your opinion, who or what affects the price of charcoal? Check all that apply and indicate if the trend os for prices to go up down or both by circling the appropriate arrow (or both arrows).
3.5.1. What is the best price per bag of charcoal that you have received over the past year? What is the worst? When did you receive those prices?
3.6. Do you sell your charcoal at the kiln, do you transport it to the roadside, or sell it in another way?
3.7. Do you sell to the same buyers, to different people every time, or to a mix of customers? Check only one
3.8. What is the most common reason that your customers buy charcoal? Check only one
3.8.1. Where do your customers sell the charcoal?
3.8.2. How many bags do these buyers typically buy at one time? Check only one
3.8.3. How do your customers usually transport the charcoal? The answer should be the most common means of transportation.
4. Production - general:
4.1. What are characteristics of good charcoal?
4.2. Describe the time and number of people required for each step of the charcoal production process.
4.2.1. For steps that require more than one person, do you work in partnership or do you hire workers?
4.2.2. How do you divide work and profits among your partners?
4.2.3. How much do you pay workers/helpers? Indicate if the wages are per kiln, per bag, or on some other basis
4.3. Which kinds of tree make the best charcoal? Why? List up to four trees that the respondent names and ask for one or more reasons for each. If the respondent lists more than four, ask them for the four best kinds of trees.
4.4. Do you have trouble finding preferred tree species?
4.4.1. Which species are difficult to find? Since when?
4.5. Do your buyers ever ask you for charcoal from specific kinds of trees?
4.5.1. Which kinds? List species.
4.6. Indicate a tree that is NOT suitable for charcoal making and explain why.
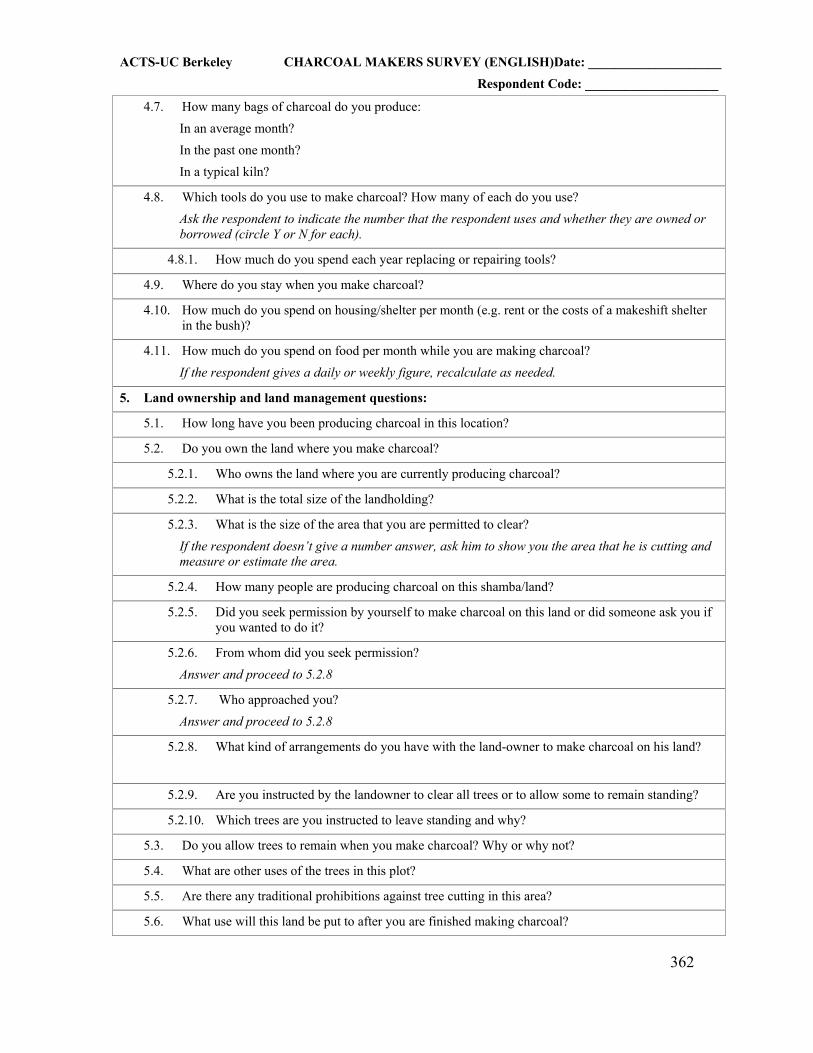
ACTS-UC Berkeley CHARCOAL MAKERS SURVEY (ENGLISH)Date: ____________________ Respondent Code: ____________________
362
4.7. How many bags of charcoal do you produce: In an average month? In the past one month? In a typical kiln?
4.8. Which tools do you use to make charcoal? How many of each do you use? Ask the respondent to indicate the number that the respondent uses and whether they are owned or borrowed (circle Y or N for each).
4.8.1. How much do you spend each year replacing or repairing tools?
4.9. Where do you stay when you make charcoal?
4.10. How much do you spend on housing/shelter per month (e.g. rent or the costs of a makeshift shelter in the bush)?
4.11. How much do you spend on food per month while you are making charcoal? If the respondent gives a daily or weekly figure, recalculate as needed.
5. Land ownership and land management questions:
5.1. How long have you been producing charcoal in this location?
5.2. Do you own the land where you make charcoal?
5.2.1. Who owns the land where you are currently producing charcoal?
5.2.2. What is the total size of the landholding?
5.2.3. What is the size of the area that you are permitted to clear? If the respondent doesn’t give a number answer, ask him to show you the area that he is cutting and measure or estimate the area.
5.2.4. How many people are producing charcoal on this shamba/land?
5.2.5. Did you seek permission by yourself to make charcoal on this land or did someone ask you if you wanted to do it?
5.2.6. From whom did you seek permission? Answer and proceed to 5.2.8
5.2.7. Who approached you? Answer and proceed to 5.2.8
5.2.8. What kind of arrangements do you have with the land-owner to make charcoal on his land?
5.2.9. Are you instructed by the landowner to clear all trees or to allow some to remain standing?
5.2.10. Which trees are you instructed to leave standing and why?
5.3. Do you allow trees to remain when you make charcoal? Why or why not?
5.4. What are other uses of the trees in this plot?
5.5. Are there any traditional prohibitions against tree cutting in this area?
5.6. What use will this land be put to after you are finished making charcoal?

ACTS-UC Berkeley CHARCOAL MAKERS SURVEY (ENGLISH)Date: ____________________ Respondent Code: ____________________
363
5.7. Do you have the option to plant crops on this land after you clear it? Circle Yes or No
5.7.1. What are the conditions to plant crops?
5.7.2. Do you plan to stay? Circle Yes or No
6. Production – specific (if there is a kiln currently being prepared):
6.1. Describe kiln type, location, etc. Note if the kiln is above or below ground, if any ventilation is used, and if any materials besides soil, grass, and leaves are used (e.g. mabati)
6.2. Record dimensions of kiln
6.3. Record location of kiln (gps)
6.4. What kind of trees are in the current kiln? How many of each kind (if the respondent can recall)
6.5. If possible, ask to see stumps of trees that were included in the kiln: measure and record diameter matching trees to entries in question 6.4.
6.6. How far were the trees brought to the kiln? Measure distance in paces or with a tape measure.
6.7. How wide of an area was cut? Measure area in paces or with a tape measure.
6.8. How long did it take to do each step of kiln preparation and how many people participated in each step?
6.8.1. Did/will you pay the people who assisted you?
6.8.2. If yes, how much did you pay in total?
6.8.3. If not, describe if you have an agreement to help them if/when they need it?
6.9. How long will the kiln take to burn (from lighting to opening)?
6.10. How many bags will it yield?
6.11. If there is an uncovered kiln in preparation ask to measure the size and record the kind of trees visible
7. Problems and solutions:
7.1. Do you ever come across problems from any of the following?
7.1.1. From local authorities?
7.1.2. From the landowner(s)?
7.1.3. From other charcoal producers?
7.1.4. From other sources – people and/or natural obstacles?
7.2. Have you ever had charcoal conficated by authorities or any other person? Circle Yes or No – if yes, answer When, Where and Why.
7.3. What is the most difficult thing about making charcoal?
7.4. Is there any assistance you would like from extension workers?

ACTS-UC Berkeley CHARCOAL MAKERS SURVEY (ENGLISH)Date: ____________________ Respondent Code: ____________________
364
7.5. Do you have any questions about charcoal-making or selling?
7.6. Would you be willing to plant trees in order to increase future supplies of charcoal?
7.7. Do you have any other questions about this research?

ACTS-UC Berkeley CHARCOAL VENDORS SURVEY (ENGLISH) Date: ____________________ Respondent Code: ____________________
365
Nairobi Charcoal Vendors Survey
1. Survey Identification
1.1. Fill in the appropriate locational information:
1.2. Enumerator’s Name
1.3. Describe location of charcoal vending in detail, including all identifying characteristics.
2. Personal/group questions: these questions can be applied to an individual or an entire group, but be sure to indicate who is answering.
2.1. Indicate if you are talking to a group or an individual. If group, how many people are contributing?
2.2. Ask where the person or group of people is from? Record the name of town/village and district. If the people in the group are from different places, record place of origin for main respondent.
2.3. Have you ever participated in a survey of charcoal selling before? If Yes, where, when, and which group did the study (if they recall)?
2.4. What is the ethnic group/tribe of the vendors? Record tribe – if mixed background, record each tribe that is given.
2.5. What is the age of the respondent(s)? (record years – list range if more than one person is answering)
2.6. How many years have you been selling charcoal? (record years – list range if more than one person is answering)
2.7. Have you always sold charcoal in this place? If not, where else have you sold charcoal?
2.8. Has there ever been a charcoal sellers association or cooperative here? If yes, is it still functioning? What is the name of the association and contact person?
2.9. How much do you pay in dues to be a member of the assn?
2.10. How much do you pay in the form of vending license?
2.11. Can you recall how much charcoal you sold in the following months:
2.12. In what units do you sell charcoal? Check all that apply.
2.13. At what price do you currently buy from transporters?
2.14. Can you recall your buying price in the following months:
2.15. What is your current selling price?
2.16. Can you recall your selling price in the following months:

ACTS-UC Berkeley CHARCOAL VENDORS SURVEY (ENGLISH) Date: ____________________ Respondent Code: ____________________
366
2.17. Do you keep records of sales volume and/or prices? If yes, how far back do your records go?
2.18. In your oppinion, what determines your selling price of charcoal? If respondent does not answer, prompt by asking about weather (rain and cold temperatures). Also ask about the type of tree that is used, government regulations, transporters, etc.
2.19. How many bags do you have in stock currently?
2.20. Is your stock usually higher than this, lower than this, or about the same?
2.21. During which months is charcoal most scarce? During which months is charcoal most abundent?
2.22. Who do you sell to primarily? Indicate 2 largest sources of sales
2.23. Do customers ever have special orders for charcoal? Explain…
2.24. Do you ever provide delivery to customers?
2.25. Do your customers ever complain about the quality of the charcoal?
2.26. Where does your charcoal come from generally? (Ask them to be as specific as possible).
2.27. Where did your latest shipment come from? (Ask them to be as specific as possible).
2.28. Do you place orders with transporters or do they just bring charcoal to you?
2.29. Do you always buy from the same transporters?
2.30. Has the business been impacted by recent actions in the Forest Sector? Explain…
2.31. Do you ever suffer from harrassment from NCC or other authorities?
2.32. Ask the respondents the steps that a newcomer would need to follow to start their own charcoal-vending business.
Other comments:
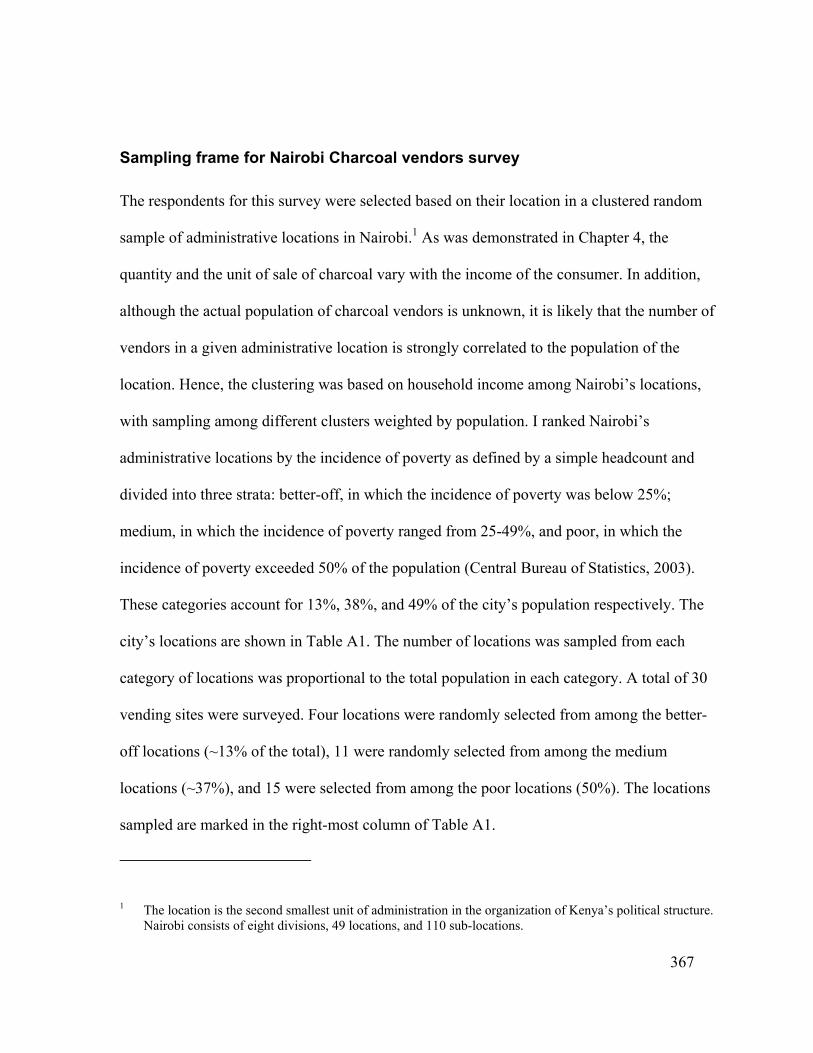
367
Sampling frame for Nairobi Charcoal vendors survey
The respondents for this survey were selected based on their location in a clustered random
sample of administrative locations in Nairobi.1 As was demonstrated in Chapter 4, the
quantity and the unit of sale of charcoal vary with the income of the consumer. In addition,
although the actual population of charcoal vendors is unknown, it is likely that the number of
vendors in a given administrative location is strongly correlated to the population of the
location. Hence, the clustering was based on household income among Nairobi’s locations,
with sampling among different clusters weighted by population. I ranked Nairobi’s
administrative locations by the incidence of poverty as defined by a simple headcount and
divided into three strata: better-off, in which the incidence of poverty was below 25%;
medium, in which the incidence of poverty ranged from 25-49%, and poor, in which the
incidence of poverty exceeded 50% of the population (Central Bureau of Statistics, 2003).
These categories account for 13%, 38%, and 49% of the city’s population respectively. The
city’s locations are shown in Table A1. The number of locations was sampled from each
category of locations was proportional to the total population in each category. A total of 30
vending sites were surveyed. Four locations were randomly selected from among the better-
off locations (~13% of the total), 11 were randomly selected from among the medium
locations (~37%), and 15 were selected from among the poor locations (50%). The locations
sampled are marked in the right-most column of Table A1.
1 The location is the second smallest unit of administration in the organization of Kenya’s political structure. Nairobi consists of eight divisions, 49 locations, and 110 sub-locations.

368
Table A1: Incidence of poverty in Nairobi’s administrative locations Wealth category Location Population Area
(km2) Density
(people/km2) Poverty
Incidence Selected (Yes/No)
Better-off locations Nairobi West 42,532 23.0 1,849 8% Lavington 18,966 11.0 1,724 9% Kilimani 43,799 14.3 3,063 10% Yes Parklands 11,456 4.6 2,490 11% Kenyatta/Golf C 30,253 9.3 3,253 12% Yes Ngara 25,667 2.7 9,506 17% Mugumoini 35,062 125.2 280 18% Karen 9,764 27.3 358 19% Highridge 46,642 42.3 1,103 20% Yes Starehe 16,006 2.6 6,156 21% Yes Medium locations Langata 16,118 44.5 362 25% Yes Umoja 93,254 9.1 10,248 26% Kariobangi S. 17,528 4.6 3,810 26% Yes Bahati 39,363 2.3 17,114 27% Yes Kariokor 34,190 2.4 14,246 28% Githurai 47,865 5.1 9,385 32% Yes Kahawa 31,915 14.7 2,171 32% Yes Makadara 52,182 3.6 14,495 35% Yes Roysambu 27,471 28.1 978 36% Embakasi 22,887 63.1 363 38% Kayole 98,522 3.6 27,367 40% Kitisuru 27,459 20.9 1,314 40% Yes Kasarani 37,436 29.3 1,278 42% Riruta 65,958 7.3 9,035 45% Mukuru Kwa Njenga 61,956 14.4 4,303 46% Yes Eastleigh South 52,979 1.5 35,319 47% Yes Uthiru/Ruthmitu 23,016 7.9 2,913 48% Yes Kamukunji 18,474 1.4 13,196 49% Mukuru Nyayo 36,232 2.3 15,753 49% Yes Poor locations Laini Saba 52,019 0.7 74,313 50% Yes Waithaka 19,937 5.4 3,692 50% Yes Dandora 110,164 4.0 27,541 51% Yes Ruai 12,528 99.3 126 53% Mathare 69,003 1.5 46,002 53% Yes Kawangware 86,824 4.0 21,706 53% Yes Sera Ngombe 47,557 1.0 47,557 54% Yes Ruaraka 79,099 2.5 31,640 54% Huruma 90,076 1.4 64,340 54% Yes Eastleigh North 70,231 6.0 11,705 54% Yes Kariobangi 71,337 5.1 13,988 55% Yes Pumwani 21,164 0.5 42,328 55% Yes Njiru 18,045 10.2 1,769 56% Yes Kibera 83,687 1.7 49,228 56% Yes Mutuini 14,521 4.8 3,025 57% Yes Korogocho 43,802 0.9 48,669 60% Kangemi 59,288 4.5 13,175 62% Yes Maringo 28,976 1.5 19,317 70% Viwandani 59,297 11.4 5,201 76% Makongeni 20,747 1.3 15,959 77% Yes

369
Guiding questions for in-depth interviews with landowners
The following questions were used to guide interviews with owners of land on which
charcoal production was observed. Not all questions were relevant in all cases.
Group ranch subdivision
Describe the subdivision process that occurred on your group ranch.
Were you happy with your allocation? Why/Why not?
Were there any disputes as a result of subdivision? Describe.
Describe your initial plans upon receiving your allocation
What barriers have you met in trying to implement the plans for your shamba
Have you received a title deed? If yes, how did you obtain it? If no, why not?
Land management and cultivation
When did you begin clearing land? How much land have you cleared to date? How much do you plan to clear in the future?
How have you cleared your land in the past? Currently?
Describe the state of cultivation among your family and other group ranch members before the group ranch was subdivided
Describe the current state if cultivation on your shamba (crops, areas planted, yields, problems encountered, etc.).
Do you plant for yourself and/or lease? If the former, how do you pay for the necessary inputs? If the latter, to whom do you lease and under what terms?
Describe any experience you've had with agricultural extension officers or other people concerning advise about farming

370
Sales of land
How do you feel about land sales?
Have you or any of your neighbors sold land since subdivision? Why/Why not?
Livestock
Describe your livestock holdings.
Who manages your stock?
Where are animals grazed and under what terms of access?
Where do you take your animals during severe drought?
Charcoal making
When did you first notice charcoal production in this area?
Describe your relationships with charcoal makers
Have you ever had trouble with authorities because charcoal is made on your land? If yes, describe it.
Relations with the state
Describe your relations with local authorities (e.g. the Chief or sub-Chief, District officer (DO), or other figures)
Do you get clearance permits before clearing land? Why/Why not?

371
Guiding questions for charcoal buyers and transporters
The following questions were used to guide the interviews with charcoal buyers and
transporters. As was explained in Chapter 4, these actors in the commodity chain are distinct,
but occasionally overlapped. In addition, the people whom we approached in the field were
not necessarily the primary actors, but rather his or her agent. Thus, the questions were
tailored to the individual with whom we spoke. Not all questions were appropriate under
every circumstance.
General questions
How did you enter this business?
Describe the management structure of the business:
o Who owns the means of transportation?
o How often do you transport charcoal? Do you transport other goods?
o Do you work only in Narok? If you also work in other areas, how do other areas compare to Narok?
What are some of the problems you encounter in getting charcoal to the market?
Relations with other groups of actors in the commodity chain
Describe your relationship with charcoal makers. Do you have regular producers with whom you interact? How do you decide on a buying price from the producers?
Describe your relationship with charcoal vendors. How do you decide on a selling price to vendors?

372
Relations with authorities
Describe your relationships with authorities.
Have you ever been arrested or had charcoal or your vehicle impounded? Describe the circumstances and the outcome of the incident.
Describe a typical round-trip journey from Nairobi. In particular, describe the checkpoints that you encounter in the return trip.

373
Appendix 2
IGBP land cover classifications
These categorizations are based on the International Geosphere-Biosphere Program (IGBP)
definitions as presented in the World Resources Institute’s Earthtrends database (World
Resources Institute, 2003). Also see (International Geosphere-Biosphere Programme, 2004)
for further details. Global land cover areas were determined by the Global Land Cover
Characteristics (GLCC) project, which used a framework of temporal and spatial patterns of
satellite data to assign a vegetation classification to each pixel.
Table A2: IGBP Categories of land cover Category Definition 1. Evergreen Needleleaf Forest Evergreen needleleaf forests are dominated by trees with a percent
canopy cover of greater than 60% and height exceeding 2 meters. Almost all of its trees remain green all year. Its canopy is never without green foliage.
2. Evergreen Broadleaf Forest Evergreen broadleaf forests are dominated by trees with a percent canopy cover of greater than 60% and height exceeding 2 meters. Almost all of its trees remain green year all year. Its canopy is never without green foliage.
3. Deciduous Needleleaf Forest Deciduous needleleaf forests are dominated by trees with a percent canopy cover of greater than 60% and height exceeding 2 meters. It consists of seasonal needleleaf tree communities with an annual cycle of leaf-on and leaf-off periods.
4. Deciduous Broadleaf Forest Deciduous broadleaf forests are dominated by trees with a percent canopy cover of greater than 60% and height exceeding 2 meters. It consists of seasonal broadleaf tree communities with an annual cycle of leaf-on and leaf-off periods.
5. Mixed Forests Consists of both broadleaf and needleleaf trees with a canopy cover greater than 60% and height exceeding 2 meters.
6. Closed Shrublands Closed shrublands are lands with woody vegetation less than 2 meters tall and with shrub canopy cover greater than 60%. The shrub foliage can be either evergreen or deciduous.

374
Category Definition 7. Open Shrublands Open shrublands are lands with woody vegetation less than 2
meters tall and with shrub canopy cover is between 10-60%. The shrub foliage can be either evergreen or deciduous.
8. Woody Savannas Woody Savannas are lands with herbaceous and other understory systems, and with forest canopy cover between 30-60%. The forest cover height exceeds 2 meters.
9. Savannas Non-woody savannas are lands with herbaceous and other understory systems, and with forest canopy cover between 10-30%. The forest cover height exceeds 2 meters.
10. Grasslands Grasslands are lands with herbaceous types of cover. Tree and shrub cover is less than 10%.
11. Permanent Wetlands Permanent wetlands are lands with a permanent mixture of water and herbaceous or woody vegetation that cover extensive areas. The vegetation can be present in either salt, brackish, or fresh water.
12. Croplands Croplands are lands covered with temporary crops followed by harvest and a bare soil period (e.g., single and multiple cropping systems). Note that perennial woody crops will be classified as the appropriate forest or shrub land cover type.
13. Urban and Built-Up Urban and built-up areas are covered by buildings and other man-made structures.
14. Cropland/Natural Vegetation Mosaic Cropland/natural vegetation mosaics are lands with a mosaic of croplands, forests, shrublands, and grasslands in which no one component comprises more than 60% of the landscape.
15. Snow and Ice Snow and ice covered areas are lands under snow and/or ice cover throughout the year.
16. Barren or Sparsely Vegetated Barren and sparsely vegetated areas are lands of exposed soil, sand, rocks, or snow and never has more than 10% vegetated cover during any time of the year.
17. Water Bodies Water bodies are oceans, seas, lakes, reservoirs, and rivers. They can be either fresh or salt water bodies.

375
Appendix 3
Carrying capacity in Narok’s rangelands
The notion of carrying capacity is a contentious one. Scholars have argued that it carries little
meaning in the context of pastoral societies in which livestock production is inherently
mobile, opportunistic and adaptable to highly variable range conditions (Behnke, Scoones et
al., 1993a; Sandford, 1995; Lamprey and Reid, 2004). Nevertheless, it is a potentially useful
concept to apply in the context of subdivided and bounded range units in which mobility is
highly restricted if not entirely curtailed.
In Narok’s rangelands, estimates of livestock carrying capacities are typically about 4 ha per
livestock unit (LU) (Jaetzold and Schmidt, 1983).1 Estimates of subsistence needs among
pastoral societies dependent on livestock products for their subsistence needs are commonly
around 5 LU per reference adult.2 A typical Maasai household in Narok consists of 4-5 RA
(Government of Kenya, 1994) Thus, a 200 ac (80 ha) plot of semiarid rangeland could, in
1 The livestock unit (LU) is a measure of livestock holding that is used to compare small and large stock in a single metric. Different units of measure are commonly in use. The numbers cited here were derived by Jaetzold and Schmidt, for whom 1LU = 300kg live-weight, which is equivalent to a local bull or 7 sheep or goats. For smallholders who own primarily indigenous cattle, this is a more appropriate figure than the Standard Stock Unit (SSU) of 1000lb (450kg), which was commonly used by the British (Jaetzold and Schmidt, 1983).
2 The reference adult (RA) is a measure of adult equivalents typically used in studies of consumption or nutrition to quantify people of different ages and genders into a single metric. The conversion factors defined by the UN Food and Agricultural Organization are commonly used: adult male = 1: adult female = 0.86; children 0–5 = 0.52; children 6–10 = 0.85; male child 11–15 = 0.96; female child 11–15 = 0.86 ((Passmore, Nicol et al., 1974) cited in (Lamprey and Reid, 2004)).

376
theory, support up to 20 LU, which is just sufficient for the subsistence needs of an average
sized household.
This is a simplification that is useful simply to give an indication of the number of stock
required to meet the minimal caloric needs for a household that is restricted to a diet of
livestock products. However, it ignores seasonal variation in milk production and differences
in both the productivity and the disposal of small stock relative to large stock like cattle. It
also ignores changing terms of trade between livestock products and other foods, which are
critical to the viability of pastoral economies. Finally, it discounts the social significance of
livestock and the additional numbers that are required to function “normally” within pastoral
societies.3
3 See (Zaal and Dietz, 1999) for a more sophisticated treatment.

377
Appendix 4
Revenue from different land management options
Land management in Narok can yield a wide range of returns. However, different groups of
actors have different levels of access to outside capital and other factors that mediate the
revenue that can be generated form a given activity. For example, the majority of former
group ranch residents can only hope to lease land to outsiders for commercial wheat
cultivation while a small fraction of elite former group ranch members can actually finance
wheat production themselves. The former earn a nice return from simply leasing, but the
latter earn over double that return. This and other disparities are shown in Table A4.1, which
is based on an analysis from (Thompson and Homewood, 2002). Of course, some poorer
residents are not able to attract commercial wheat growers at all. Similarly, not all land in
Narok is equally suitable for wheat cultivation. Thus, the entire range of land management
options are not equally accessible for all residents, nor are the expected returns equal.
Thompson and Homewood’s findings are similar to the results of this research. Leasing to
commercial wheat growers yields roughly at 1500-2000 KSH/acre yields between $2000 and
$2700 per 100 acres per year.

378
Table A4.1: Annual returns from different land management options
Activity US$ per 100 acres GR member Local Elite
Large scale cultivation $2,500 $5,350
Conservation-compatible land uses $1,200 $19,600
Livestock $530 $530
Small-scale cultivation $50 $550
Farming association $100 $100
Small-scale campsite $275 $7,300
GR level wildlife association $125 $3,500
Select campsite association - $3,500
Large-scale lodge - $4,000
Tourism wages $120 $1,150
From (Thompson and Homewood, 2002, Table X p. 129)

379
Appendix 5
Quantitative analysis of charcoal production in 10 kilns
During field work, 10 charcoal production runs were analyzed to verify data collected by
recall from the charcoal maker surveys. The data were obtained by direct observation of each
charcoal production run, each of which took between one and two weeks. Data collected
include: full labor inputs in person-hours for each stage of production; mass, species and
moisture content of trees harvested; area of land cleared for each kiln; and mass and number
of charcoal bags produced. Together, these data permitted a calculation of the returns that
charcoal production yields to inputs of land and labor. The first group of data collected
includes inputs of labor. These are shown in Table A5.1.
Table A5.1 Labor inputs Mean SD
No. of days to clear land for kiln (days) 2.6 1.9
No. of people to clear 2.1 0.9
Person days to clear 4.7 2.3
No. of days to arrange/cover (days) 2.2 0.8
No. of people to arrange 1.7 0.7
Person-days to arrange 3.8 2.3
Time to fire kiln (days) 6.3 1.9
No. of people to open and bag 3.1 0.9
Time to open and bag (fraction of 8 hr work-day) 0.4 0.3
Total person-days of labor per kiln 10.7 5.1
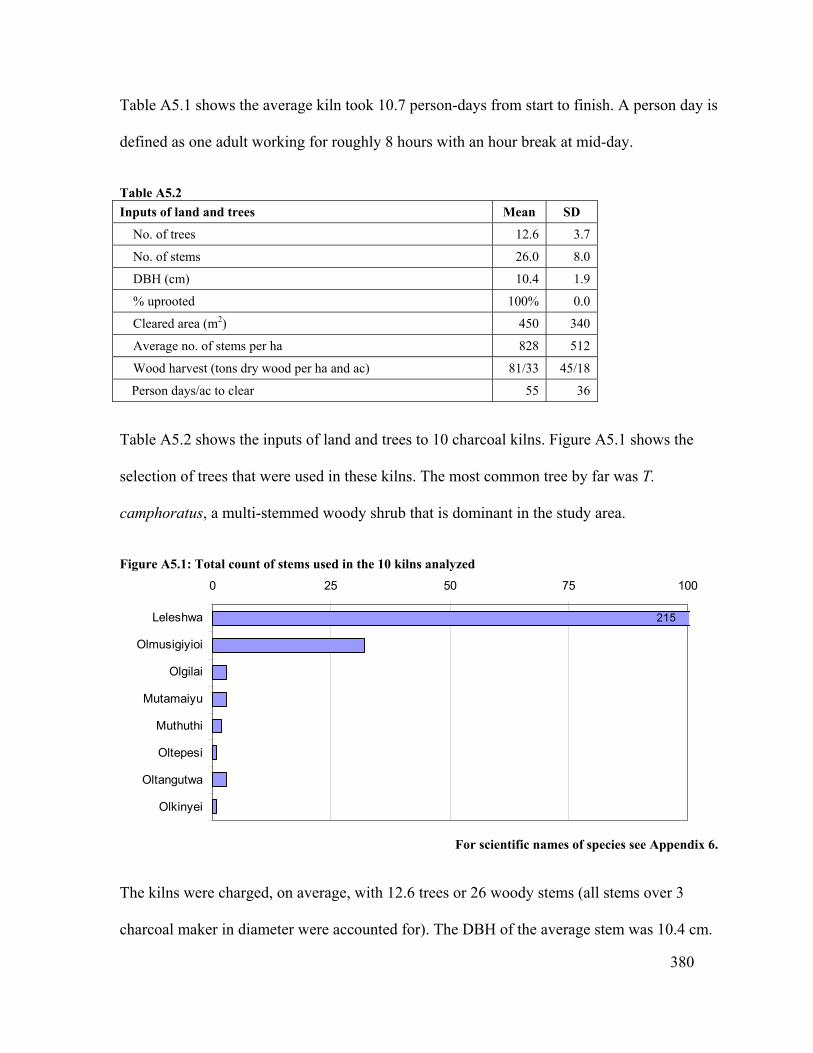
380
Table A5.1 shows the average kiln took 10.7 person-days from start to finish. A person day is
defined as one adult working for roughly 8 hours with an hour break at mid-day.
Table A5.2 Inputs of land and trees Mean SD
No. of trees 12.6 3.7
No. of stems 26.0 8.0
DBH (cm) 10.4 1.9
% uprooted 100% 0.0
Cleared area (m2) 450 340
Average no. of stems per ha 828 512
Wood harvest (tons dry wood per ha and ac) 81/33 45/18
Person days/ac to clear 55 36
Table A5.2 shows the inputs of land and trees to 10 charcoal kilns. Figure A5.1 shows the
selection of trees that were used in these kilns. The most common tree by far was T.
camphoratus, a multi-stemmed woody shrub that is dominant in the study area.
Figure A5.1: Total count of stems used in the 10 kilns analyzed
215
0 25 50 75 100
Leleshwa
Olmusigiyioi
Olgilai
Mutamaiyu
Muthuthi
Oltepesi
Oltangutwa
Olkinyei
For scientific names of species see Appendix 6.
The kilns were charged, on average, with 12.6 trees or 26 woody stems (all stems over 3
charcoal maker in diameter were accounted for). The DBH of the average stem was 10.4 cm.

381
On these 10 plots, every tree was uprooted. The average area cleared per kiln was about 450
m2 with over 800 woody stems and over 80 tons of dry woody biomass per ha.
Table A5.3 Kiln specifications Mean SD
Total mass of wood (kg) 3,672 1,978
Moisture content (wet-basis) 22% 4%
Mass of dry wood (kg) 2,802 1,365
Volume of wood stacked for kiln (m3) 11.5 5.5
Density wood stacked for kiln (kg/m3) 321.7 111.8
Mass of brands remaining (kg) 60.4 52.5
Fraction of initial charge as brands 2% 1%
Mass of charcoal (kg) 738 456
No. of bags 16.4 8.2
Average mass of bags (kg) 44.7 8.0
No. of bags produced per acre cleared 191 109
Yield (wet) 20% 3%
Yield (dry) 25% 5%
Table A5.3 gives the average specifications of the kilns. The average charge of wood was 3.6
tons with 22% moisture (wet basis) resulting in 2.8 dry tons of wood per kiln. The average
mass of charcoal produced was 738 kg, resulting in a conversion efficiency of 20% on the
basis of wet wood or 25% on the basis of dry wood. This is quite a bit better than is usually
assumed by analysts (for example, the MoE study reports efficiencies of about 10% without
conducting any empirical analyses). There are a range of empirical analyses reported int he
literature, and the findings from this study fall well within the range observed in other
empirical studies. Table A5.4 gives the efficiencies calculated in a number of other studies of
charcoal production. The conversion efficiencies of traditional kilns measured in these
studies range from ~8% to ~33%. So called improved kilns overlap this range substantially.

382
The efficiency of the best improved kilns that have been observed exceed the efficiency of
the best traditional kilns by a slight margin. However, the sample sizes are very small.
Table A5.4 Location of study
Kiln type No. of kilns analyzed
Mean efficiency
(%)
SD (%)
Comments and reference
Traditional kilns
Rwanda Earth-mound n = 47 8.2 3.0 2-15 m3 input (ESMAP, 1991)
Zambia Earth-mound n = 36 19.2 4.1 Inputs were all between 2.3 and 3.7 tons (dry basis) except for 3 trials which had over 10 tons each (Hibajane, 1994)
Kenya Small Earth-mound
n = 2 23.2 0.8 Inputs were all less than 1 ton (Pennise, 2003)
Kenya (this study)
Earth-mound n =10 24.9 3.6 Inputs ranged from 1.2- 6.2 tons (dry wood)
Thailand Earth-mound (rice husks)
n = 3 29.7 5.1 Inputs were rice husks between 100 and 200 kg (dry matter) (Smith, Pennise et al., 1999)
Thailand Earth-mound n = 3 29.8 2.5 Inputs ~170 kg (dry wood) (Smith, Pennise et al., 1999)
Kenya Large Earth-mound
n = 3 32.8 3.3 Inputs were all larger than 10 tons (Pennise, 2003)
Improved kilns
Rwanda Cassamance n = 22 15.5 6.7 10-30 m3 input (ESMAP, 1991)
Brazil Round brick n = 1 28.7 NA Input was over 15 tons (dry wood) (Pennise, 2003)
Thailand Metal drum n = 3 29.4 3.4 Inputs were very small (~60 kg dry wood) (Smith, Pennise et al., 1999)
Thailand Mud beehive n = 3 30.8 1.3 Inputs were all roughly ½ ton (dry wood) (Smith, Pennise et al., 1999)
Thailand Brick beehive n = 3 33.3 0.7 Inputs were roughly 0.7 tons (dry wood) (Smith, Pennise et al., 1999)
Brazil Hot-tail n = 1 34.1 NA The hot-tail is similar to a brick beehive kiln with a moderate charge of ~3 tons (dry wood) (Pennise, 2003)
Brazil Rectangular metal
n = 1 36.4 NA Kiln has tar recovery with very large inputs (> 60 tons dry wood) (Pennise, 2003)

383
Finally, I explore the productivity both in terms of land and labor. These results are shown in
Table A.5.5. The average return to labor of the 10 kilns analyzed was 71.4 kg (roughly two
sacks) of charcoal per person-day of labor. This translates to a daily cash return to labor of
about 165 KSH ($2.20). Similarly, the average productivity of the land being cleared can be
determined. The land yields, on average, 191 bags of charcoal per acre (471 bags/ha). In cash
terms, assuming a farmgate price of ~100 KSH, is 19,077 KSH/ha (47,120 KSH/ha).
Table A5.5 Output and productivity Mean SD
Productivity (kg charcoal per person-day of labor) 71.4 23.9
Person-days per ton of charcoal 15.3 4.3
Returns to labor (KSH per day assuming bags sold for 100 KSH) 164.8 68.2
Returns to labor ($ per day assuming bags sold for 100 KSH) 2.2 0.9
Area productivity (tons of charcoal per ha) 20.8 11.6
Bags of charcoal per acre 191 109
Returns per ac (assuming bags sold for 100 KSH) 19,077 10,922
The earnings of charcoal makers in Narok can be compared to earnings of charcoal makers
from other charcoal commodity chains adjusted to current US dollars reported in the
literature (Ribot, 1990; Mugo, 1999; Monela, Zahabu et al., 2000; Coomes and Burt, 2001;
Mugo and Poulstrup, 2003).* This comparison is shown in Figure A5.2 below. With the
exception of one study from Eastern Kenya (Mugo and Poulstrup, 2003), the productivity of
charcoal makers reported in different studies is quite similar. Of course, the cash returns to
* Price adjustments were done using data on consumer price indices for each country from the World Bank (World Bank, 2003a). Error bars in the figures show interquartile ranges, which were only possible to determine from this research and one other study.

384
labor are quite different because of the greater variation in farm-gate price obtained by the
producers.
Figure A5.2: Productivity of labor in charcoal production reported in the literature
-
70
140
210
280
Taita Makueni Directobservation
Recall datafrom surveys
Ribot (1990) Coomes andBurt (2001)
Monela et al.(2000)
Eastern Kenya: Mugo andPoulstrup (2003)
This research
Kenya Senegal Peru Tanzania
kg c
harc
oal p
er p
erso
n-da
y of
labo
r kg charcoal produced per person-day of labor
Figure A5.3: Cash returns to charcoal production reported in the literature
$0
$3
$6
$9
$12
$15
Taita Makueni Directobservation
Recall datafrom surveys
Ribot (1990) Coomes andBurt (2001)
Monela et al.(2000)
Eastern Kenya: Mugo andPoulstrup (2003)
This research
Kenya Senegal Peru Tanzania
Ear
ning
s (2
004
$US
per
day
)
Returns to labor (2004$ per day)

385
Appendix 6
Trees encountered during field work
Local name a Scientific name b
No. of times mentioned in
qualitative surveys (n=50)
Stems harvested during analysis
of charcoal kilns (n=10)
Uses other than for woodfuel c
1. Leleshwa Tarchonanthus camphoratus
20 215 Timber for Maasai dwellings[1,2]. Medicinal uses were not reported by informants in the field, but one source lists many, including treatment for bronchitis, chest ailments, stomach ailments, asthma, over-anxiety and heartburn. Essential oil is thought to have dermatological properties such as soothing, anti-irritation, decongestant remedy for sensitive skins, dermatitis, and sunburns [3].
2. Olmusigiyioi Rhus natalensis
8 32 None recorded.
3. Olgilai Teclea nobilis 3 3 Leaf decoction is used for chest ailments [1,2]. Wood is used for bows and canes [2].
4. Mutamaiyu (Kik.) or Olorien (Maa)
Olea africana 10 3 Building, furniture and weapons [1,2]. Leaves are used as emergency source of fodder during drought [1]. Wood is very hard and used for tool handles and rungus.d
5. Oltangutwa Pistacia aethiopica
-- 3 Twigs are chewed as toothbrush [2]. Root infusion is used as tea [2].
6. Muthuthi (Kik.)
Maytenus heterophylla
-- 2 Roots are boiled and eaten as a vegetable [2]
7. Oltepesi Acacia tortilis 1 1 The bark yields a decoctions used for stomach ailments [1,2]
8. Olkinyei Euclea divinorum
4 1 Decoction of the roots can be used as a purgative [2[

386
Local name a Scientific name b
No. of times mentioned in
qualitative surveys (n=50)
Stems harvested during analysis
of charcoal kilns (n=10)
Uses other than for woodfuel c
9. Olerai Acacia xanthaphloea
6 -- Bark is used for indigestion [1,2]
10. Olmorijoi Acokanthera schimperii
3 -- Roots, bark, and twigs all yield a poison used in poison arrows [1, 2]
11. Olpelaglagi Trichocladus ellipticus
5 -- Wood used for construction [2]
12. Eluai Acacia drepanolobium
1 -- Bark is chewed to aid sore throat, root decoction is given to new mothers after birth [2]
13. Olmositet Celtis africana 1 -- Used for construction and handles for weapons and tools [2]
14. Olsogonoi Warbugia ugandensis
1 -- Many medicinal applications: bark and roots are used as a cold remedy, as well as a treatment for chest pains, malaria and toothache [1]. The resin may be used as a glue.[2].
Total 63 260 a All local names are in Maa unless otherwise noted: Kik. = Kikuyu b Tree names have been cross-checked with (Beentje, 1994). c Sources: [1] Based on interviews and/or direct observation during field work. [2] (Beentje, 1994). [3]
(World Agroforestry Center (ICRAF), 2004). d A rungu is a common weapon among the Maasai similar to a knobkerrie, consisting of a shaft of wood
with a large heavy knob at one end. The knob may be a natural feature of the wood, as might be found where a branch meets the stemwood, or it may consist of a large metal attachment. Current designs often feature a straight shaft of wood with a large machinist’s nut fixed to one end.

387
Appendix 7
Extracts from Kenya’s proposed Forest Bill and Wood Energy
Policy
Forest Bill
Forests in the drylands will be sustainably managed and conserved for the production of gums and resins, charcoal and timber (p. 6).
Efficient charcoal production and utilization technologies will be promoted (p. 13).
Where they are not in conflict with the principle of efficient and sustainable resource utilization, management, and national development priorities, the traditional ways of life of forest-adjacent communities will be respected (p. 20).
The Government will promote tree planting and land rehabilitation for carbon sequestration (p. 21).
National Wood Energy Policy
A Wood Energy Board (WEB) shall operate under the Ministry of Energy and its responsibilities shall be to coordinate planning, production, processing, marketing and efficient utilization of wood energy in the country
Adequate land, financial and human resources shall be mobilized for massive tree planting in all possible sites including afforestation and reforestation in selected sites like water catchment or erosion vulnerable landscapes to ensure environmental stability.
A revolving fund called Wood Energy Fund shall be established to provide loans for firewood and charcoal development.
Wood royalties shall be paid to land owners whether, government, local authorities, communities, private companies or individual farmers for investment in management,

388
re-establishment or expansion of woodlands, woodlots or plantations.
For ease of enforcing regulations, regulation of the industry shall be decentralized. Wood energy management responsibilities shall be devolved down to lower administrative units like district, division, location and even sub-location in order to increase efficiency and effectiveness.
It is easier and more cost effective to work with organized legal groups than many scattered individuals. Firewood and charcoal producers, transporters and traders shall be required to form legal associations with by-laws for self regulation. This will also increase their negotiation powers.
For charcoal to take on its true economic value in the marketplace, and allow legitimate competition from tree growers within the private sector. Charcoal trade will be regulated by the WEB with the key areas of concern being certification, licensing and control of charcoal point of origin.


![[Austria] ZigBee exploited](https://img.pdfslide.net/doc/110x75/587cfa411a28ab1e7e8b4ab5/austria-zigbee-exploited.jpg)