Embed Size (px)
Citation preview

BS thesis
in Economics
The migration of doctors following Iceland’s economic collapse:
Is Iceland facing a brain drain?
Author: Alina Kerul
Advisor: Dr. Gylfi Zoega, professor
Department of Economics
January 2012
The migration of doctors following Iceland’s economic collapse:
Is Iceland facing a brain drain?
Author: Alina Kerul
Thesis for BS degree in Economics
Advisor: Dr. Gylfi Zoega, professor
Department of Economics
School of Social Sciences at the University of Iceland
January 2012

2
The migration of doctors following Iceland’s economic collapse
This thesis is a 12 credits thesis for the BS degree in Economics, Social
Sciences, University of Iceland.
© 2012 Alina Kerul
Thesis may not be copied without the permission of the author.
Printing: Háskólaprent
Reykjavik, 2012

3
Preface
This thesis is a 12 ECTS final project for a BS degree in the Department of Economics at
the University of Iceland. Advisor of the project was Dr. Gylfi Zoega, professor at the
University of Iceland, and I thank him for his excellent guidance and suggestions with
the construction of the paper. Furthermore, I would like to give special thanks to Sólveig
Fríða Jóhannsdóttir, economist at Læknafélag Íslands, for her assistance with data
collection.

4
Abstract
Since the middle of the 20th century, many theories on migration patterns have been
developed and tested. Most of this analytical work examines general population
migration patterns with respect to the micro- and macro- economic situations of source
and destination countries. But at the same time not many of them concentrate on the
level of education, and skills of the migrating population. This also applies to the
research that has been done in Iceland. This is not surprising due to the data shortage.
In my research I want to exam the doctors’ international migration after the 2008
recession, so that on my results I will be able to answer the following question: ,,Is
Iceland facing a brain drain when it comes to the medical profession?”. This research is
based on data that I received from the Læknafélag Íslands, which I then compare with
migration patterns for the general population.
The main result of this research is – the doctors’ migration rates are significantly
higher than general population rates in particular for the younger doctors. Moreover,
their main destination countries are Sweden and Norway. On that basis, I am concluding
that Iceland does in fact suffer from brain drain in the medical profession.
.

5
Table of Contents
Preface ...................................................................................................................3
Abstract..................................................................................................................4
Table of Contents ...................................................................................................5
List of Figures .........................................................................................................6
1 Introduction .....................................................................................................8
2 Forms of migration .........................................................................................11
3 Migration mechanism from an economic prospective ....................................13
3.1 Main theories of migration......................................................................14
3.2 Costs and returns of human migration ....................................................15
3.3 Family migration decisions ......................................................................17
3.4 Self-selection and the earnings of immigrants .........................................18
3.5 Theories on migration externalities .........................................................19
4 Economic model of individual migration decision ...........................................21
5 Historical development of the healthcare system in Iceland ...........................24
6 Economic situation in Iceland and the destination countries in 21st century ..26
6.1 Liberalization and build-up of vulnerability in Icelandic economy prior to
2008 26
6.2 Banking and BoP crises, credit and asset market bursts...........................29
6.3 Recession of 2008 –... ..............................................................................31
6.4 Economic situation in main destination countries since 2008 ..................37
7 Migration from Iceland during the years from 2005 until 2010, by Icelandic
citizens......................................................................................................................39
8 Doctors’ migration from Iceland after 2008....................................................46
9 Migration pattern comparison for Icelandic doctors and the general population
between 2009 and 2011 ...........................................................................................51

6
10 Summary of results .....................................................................................58
11 Conclusions.................................................................................................62
Bibliography .........................................................................................................63
List of Figures
Figure 1. Types of the health workers migration. ..........................................................12
Figure 2. ISK / USD exchange rate since 2000. ...............................................................28
Figure 3. Actual inflation rate and inflation rate target in Iceland since 2003. ...............28
Figure 4. Current account during period 2006 – 2011 (in billions)..................................31
Figure 5. Consumption expenditure total, Volume index and relative change (%)
in purchasing power of......................................................................................32
Figure 6. Annual GDP growth in 2000 -2010 period.......................................................33
Figure 7. Unemployment rate (%) in 2003 – 2010 period. .............................................34
Figure 8. Housing wealth breakdown by equity in the end of 2008 for households. ......35
Figure 9. Housing equity positions by age group at the end of 2008..............................35
Figure 10. Households in financial difficulties by age during 2006 – 2011 period...........36
Figure 11. Standard of living (real net national income deflated by domestic
consumer price index).......................................................................................37
Figure 12. Cumulative migration levels for Icelandic citizens, from 2005 until
2010..................................................................................................................40
Figure 13. International emigration by Icelandic citizens, from 2005 until 2010, by
age groups. .......................................................................................................41
Figure 14. International immigration (return migration) by Icelandic citizens, from
2005 until 2010, by............................................................................................41
Figure 15. International net migration by Icelandic citizens, from 2005 until 2010,
by age groups....................................................................................................42
Figure 16. International immigration by Icelandic citizens to the destination
countries, from 2005 until .................................................................................43
Figure 17. International emigration (return migration) by Icelandic citizens from
the destination..................................................................................................44

7
Figure 18. International net migration by Icelandic citizens to the destination
countries, from 2005 until .................................................................................44
Figure 19. Total doctors´ international migration in Iceland, between 2009 and
2011..................................................................................................................46
Figure 20. Doctors’ emigration, between 2009 and 2011, by age groups.......................47
Figure 21. Doctors’ immigration, between 2009 and 2011, by age groups.....................47
Figure 22. Doctors’ net migration, between 2009 and 2011, by age groups. .................48
Figure 23. Doctors‘ emigration, between 2009 and 2011, by destination
countries. ..........................................................................................................48
Figure 24. Doctors’ immigration, between 2009 and 2011, by destination
countries. ..........................................................................................................49
Figure 25. Doctors’ net migration, between 2009 and 2011, by destination
countries. ..........................................................................................................50
Figure 26. Icelandic citizens’ general population, by age groups (in %), between
2005 and 2010. .................................................................................................52
Figure 27. Doctors’ population, by age groups (in %), between 2009 and 2011. ............53
Figure 28. General population´s and doctors´emigration rates (%), between 2008
and 2011. ..........................................................................................................53
Figure 29. General population´s and doctors´ net migration rates (%), between
2008 and 2011. .................................................................................................54
Figure 30. General population´s emigration rates (%), by age groups, between
2007 and 2010. .................................................................................................55
Figure 31. Doctors’ emigration rates (%), by age groups, between 2009 and 2011. .......55
Figure 32. General population´s net migration rate (%), by age groups, between
2007 and 2010. .................................................................................................56
Figure 33. Doctors’ net migration rate (%), by age groups, between 2009 and
2011..................................................................................................................56
Figure 34. Cumulative doctors´ population, by age groups, between 2008 and
2011..................................................................................................................57

8
1 Introduction
In this paper I would like to research how Icelandic doctors’ international migration was
developing after the 2008 recession; what factors affected it, and then compare
doctors’ and population migration patterns, with the conclusion answering the
question: ,,Is Iceland facing a brain drain?’’.
In the second part I will identify two main types of migration: internal and external. I
will also identify four subtypes of health workers migration: return international
migration to health-related-industry, return international migration to health-unrelated-
industry, ,,cross-industries‘‘ and international ,,cross-industries‘‘ migrations.
In the third part I will review migration mechanism from the theoretical perspective.
In the first chapter of this part I will give short overview of the development of
migration theories. Beginning with the classical theory on efficient labour resources
allocation, developed by A. Smith; then on to neoclassical theories of migration, which
explains individual and family migration decisions, developed by Sjaastad, Harris and
Todaro; and finally I will cover the new economics of migration, which explains how
micro-level variables affect migration decision. The final theory depends on economic,
political and environmental conditions; and was developed by Stark, Mincer, Bloom and
Lukas. In the second chapter, I will take closer look on Sjaastad’s theory of costs and
returns of human migration, where migration decision will depend on the money and
non-money costs of migration and money and non-money private returns to migration.
If the second value exceeds the first, migration will take place. In the third chapter, I will
take a look at family migration decision, where family returns and costs from migration
are taken into account. Also, assumed that the family, as a whole, is risk aversed and on
the basis of such aversity, a destination territory will be chosen for each member of the
family separately. In the fourth chapter, I will take a closer look on Borjas’ theory of self-
selection and earnings of immigrants, which was based on the Roy theory. Borjas
showed that immigrants choose whether or not to migrate on the basis of their own
abilities and earnings distributions in the source and the destination countries. He
established three main selections: positive, negative and refuge sorting. The fifth and
final chapter of part three will take into account migration externalities: negative –

9
adverse selection, welfare magnets; and positive – decrease in monetary and non-
monetary costs due to network effect.
In the fourth part, I will develop an economic model for individual migration decision,
where individual working lives in source and destination countries, will be taken into
account; wages during those periods, discounted by equilibrium nominal interest rates,
and costs of migration. Such a model will give us predictions for future emigrants’
characteristics.
In the fifth part, I will do a quick overview of the historical development of the
healthcare system in Iceland: the healthcare authorities and financing; the healthcare
provision by GPs and specialists; and their employment contracts and wages.
In the sixth part, I will look on historical development of the economic situation in
Iceland and main doctors’ destination countries in 21st century. The first chapter of part
six will give us overview of the factors which lead Iceland towards the 2008 recession:
financial liberalization worldwide, increase in Icelandic money supply and public
expenditures, ISK appreciation and high interest rates (due to inflation being above
target); which lead to further ISK appreciation and a boom in asset- and construction-
markets. The second chapter will explain banking and BoP crisis’ development, credit-
and asset- markets bursts that lead to the 2008 recession in Iceland and worldwide. In
the third chapter we will see how loss of confidence by foreign investors, high inflation
rate and depreciated ISK exchange rate affected consumption, GDP growth rate,
unemployment rate, purchasing power and private sector wealth positions. The forth
part will give us an economic overview of main doctors’ destination countries since
2008: GDP growth rate and standard of living development.
In the seventh part, I will present research on international migration from Iceland,
by Icelandic citizens, from the year 2005 until 2010. The first I will look on total net
migration, immigration and emigration levels for the Icelandic citizens, then I will group
these levels into age groups and research the difference in patterns between them,
taking into account the economic model for individual migration decision predictions.
Those levels will then be grouped by main destination countries and the research
approach described above repeated.

10
In the eighth part, I will present research on international migration from Iceland
during the years 2009 through 2011 for the Icelandic doctors. This will be done in the
same way as the research of net migration, immigration and emigration levels (total, by
age groups and by main destination countries), for Icelandic general population.
In the ninth part, I will present the compared migration patterns for the Icelandic
doctors’ and general Icelandic population during the years of 2009 through 2011. The
first, I will present research done on the total levels for the doctors’ and general
population development, during research period, by grouping them in same age groups
and comparing growth rates for those age groups. Secondly, I will compare total
emigration and net migration rates for both populations, and then repeat the same
procedure with emigration and net migration rates for the populations’ age groups and
destination countries. Finally, I will present research on how size of doctors’ population
and size of population’s age groups was affected after the 2008 recession.
In the tenth part, I will describe the main results of the research: the difference in
patterns in the two populations on migration rates for age groups; on substitution
effect in age groups; and on the most preferred destination countries by doctors.
I will finish the paper by presenting a research conclusion.

11
2 Forms of migration
Khassoum Diallo (2004) described the relatively permanent movement of people across
territorial boundaries as in-migration and out-migration, or immigration and emigration,
when the boundaries crossed are international. The place of in-migration or
immigration is called the destination country/or region, and the place of out-migration
or emigration is called the source country/or region. We can distinguish two main
migration types:
1. Internal migration. This refers to a change of residence within national
boundaries, such as between cities, or municipalities. An internal migrant is
someone who moves to a different administrative territory. As result of such
migration, a problem of inequality in the healthcare provision and availability
between administrative territories could arise.
2. International migration. This refers to change of residence over national
boundaries. An international migrant is someone who moves to a different
country. International migrants are further classified as legal immigrants, illegal
immigrants, and refugees. Legal immigrants are those who moved with the legal
permission of the receiver nation; illegal immigrants are those who moved
without legal permission; and refugees are those who crossed an international
boundary to escape persecution.
In Figure 1 it is possible to see two main migration types of health workers and their
impact on the healthcare system. The third migration, defined by Diallo, is not across
boundaries, but ,,cross-industries” migration. This subtype can belong to international
or internal migration types. And it refers, for example, to health workers migration from
an health-related-industry to health-unrelated-industry. Such migration creates others
types of problems, such as – ,,loss of skills” (resources inefficiently allocated) after
international/ internal migration, and an increasing number of available vacancies in the
medical professions after internal migration. We can also see the fifth type of migration:
return international migration. It is new/or with some experience licensed doctors
coming back to the source country after some period of residency in the destination

12
country. The return migration can have a positive impact or no impact, on the
healthcare system of the source country. Impact would be considered positive if the
healthcare worker coming back to work goes into a health-related-industry. The
worker’s return would, however, have no impact if he/she comes back to work in
health-unrelated-industry. The sixth type of migration, return ,,cross-industry”
migration, refers to the situation, when, over some period of time, medical workers are
able to return back into the health-related-industry in the destination country due to
accrued information/knowledge. Such migration should have a positive impact on the
healthcare system of the destination country.
Source country. Destination country.
Figure 1. Types of the health workers migration.1
The distinction between internal and international migration is crucial, because the
migrations happen for different reasons. Structural barriers are more likely to impact
the mobility of a potential international migrant than an internal migrant. International
migration involves more administrative procedures, greater expenses, and more
difficulties associated with obtaining employment, accessing state services, learning a
new language, and so forth. The motivation behind international migration is usually
stronger than that behind internal migration.
1 Based on figure 1 from Diallo, K. (2004). Data on the migration of health-care workers: sources, uses,and challenges.Pp. 602.
Health sector.
Others sectors.
Health sector.
Others sectors.
International migration of health workers.
Return migration with positive effect on the health system.
Skils lost from health system.
Return migration that does not affect the health system.
Cross-industry migration.Foreign health personnel trainees who do not return home.
Internal migration.

13
3 Migration mechanism from an economic prospective
Migration is a mechanism, which redistributes labour resources efficiently. As was
mentioned in previous section, internal and international migrations are affected by
different economic variables and at different significance and strength.
Oded Stark (1984) assumed that internal migration was based on an individual
decision to improve household‘s position (decrease the relative deprivation of his/her
household) with respect to a relevant reference group, rather than to increase a
households absolute income.
In 1989, Stark and J. Edward Taylor concluded that initial relative deprivation of a
household with respect to relevant reference group has a significant role on
international migration. Education, skills and work experience in a source country may
increase returns on internal migration. But impact of those variables can give a
smaller/or minimum returns on international migration (Taylor, 1987). Differences in
labour markets of source and destination countries can create significant differences in
the returns to human capital for migrant workers (especially if they can get a job only in
a low-skill labour-intensive sector) and will affect decision to migrate to a destination
country (Taylor, 1987; Stark and Taylor, 1989). As well, skills and experience acquired in
a source country may not be used in a destination country. According to Stark and
Taylor (1991) households face a trade-off by choosing between internal and
international migration; between high risk of increased relative deprivation but high
returns to human capital (internal migration), and low risk of increased relative
deprivation but low returns to human capital (international migration).
As a result of the research, increased size of a household, real estate ownership,
increased relative deprivation and increased changes of inequality in income
distribution, family connections in a source country increase the probability of internal
migration more than probability of international migration. An increase in absolute
income of a household without migration, an increase in total value of major physical
assets, family connections in destination country and being a man increase the
probability of international migration.

14
As a result, Stark and Taylor suggested that distribution-neutral policy would
significantly decrease the probability of internal migration, but distribution-biased
police (more equal income distribution) would increase the probability of internal
migration. The richest households would always choose international migration and
increase in incomes of the poorest households would also push them towards
international migration. The economic development in a source country could also
increase the probability of international migration.
3.1 Main theories of migrationThe oldest theory, classical theory, explaining the existence of labour migration is based
on a theory by Adam Smith and other analytical papers by economists of his period.
They suggested that the migration of workers is caused by differences in supply and
demand for labour in different regions.
In 1960 – 1970, a new line of theories was developed: neoclassical theories of
migration by Sjaastad, Harris and Todaro. According to their theories, countries with a
large endowment of labour, relative to capital, will develop labour-intensive industries
(with low-skilled workers) and, as a result, will have a low equilibrium market wages in a
labour market; and countries with a large endowment of capital, relative to labour, will
develop capital-intensive industries (with high-skilled workers) and, therefore, will have
a high equilibrium market wages. The resulting wage differences will create incentives
for workers to emigrate from low-wage countries to high-wage countries. As a result of
such movement, supply of labour decreases and wages rise in source countries and the
supply of labour increases and wages fall in destination countries. It would lead to new
equilibriums in labour markets. Existing differences in wages will be equal to the private
costs of migration. But the neoclassical theory of international migration does not
explain how international, political and economic environment affects individual
migration decision.
In end of 1970 – 1980, new economics of migration was developed by Mincer (1978);
Stark, Bloom (1985) and Stark, Lukas (1988); which focused on the micro-level variables.
The new economics assumes that migration decisions are not made by isolated
individuals, but by households in an attempt to minimize risks by diversifying family
labour resources (by emigrating to different regions/countries and undertaking

15
different professions). According to this theory, migration can exist even if there are no
wage differences between source and destination countries. This theory determined
that migration decisions depend on economic, political and environmental conditions.
There were also developed concepts of network effect (Massey, 1993) and welfare
magnets (Borjas, 1999), and explained positive and negative externalities created by
these concepts.
3.2 Costs and returns of human migrationIn 1962, Larry A. Sjaastad wrote a famous paper on cost and returns of human migration
(the base of modern model for empirical research of migration). In his paper he placed
migration in resource allocation framework, because migration promotes efficient
resource allocation and because migration is an activity that requires resources. He was
the first to propose to treat migration as an investment (in human capital) increasing
the productivity of human resources, which has cost and accumulates return.
1. Private costs of migration consist from money costs – out-of-pocket expenses, and
non-money costs. Those costs include foregone (opportunity) costs and psychic
costs:
1.1. The money costs of emigration can be estimated for given distances between
the source and the destination countries. If distance would increase we can
expect that costs would increase as well; as a result of it, we could see
reduction in international emigration numbers. Individuals usually immigrate to
the closest countries from the source country. Such cost would be not difficult
to estimate, because they are real resource costs.
1.2. The non-money costs involved in emigration decision could be significant:
1.2.1. The first cost that needs to be considered is opportunity cost: the
incomes forgone due to such factors as searching for job and learning a
new skill (on-job-training). Such costs will depend on distance of travelling,
time needed to find a new job, conditions of labour market in source
country (i.e. level of unemployment). These costs would as well, not be
difficult to estimate (they are real resource costs) by choosing expected

16
income stream (after emigration) and compare it with expected income
stream without emigration. As a result of such costs, individuals will prefer
to emigrate to a destination country, where he/she can find a job similar to
his/hers old job in source country, which requires similar education, skills
and experience; and where an economy is in expansion/or a stable
economy. As a result, increasing dissimilarities in production technologies
between countries could decrease emigration numbers. As well, negative
movements in economic variables of the destination country, such as: a
decrease in GDP and standard of living will reduce the probability of
emigration significantly.
1.2.2. The second non-money cost of emigration is the psychic cost. It is the
cost of leaving familiar surroundings, family, friends, and loved ones. Such
costs are very difficult to estimate numerically. Sjaastad (1962) proposed to
estimate them ,,as a loss of individual surplus... – the maximum amount
that could be taken away” (by taxation) without increasing emigration
probability. The psychic costs do not involve any resource costs, but they
do have impact on efficient resource allocation. Sjaastad proposed that
they should be treated not as costs but rather to analyse rate of return on
human capital.
2. The private returns to migration consist as well from money and non-money returns:
2.1. The money return to emigration depends on changes in real stream of incomes
before and after emigration: differences in nominal incomes, differences in
costs of employment, differences in price levels between countries, or
combination of all these differences. Sjaastad explained that such returns will
depend on specific individual human capital as well: migration, training and
experience; or in other words: age, sex, and professional education. Therefore,
individual migration decision will depend on the possibility of increasing his/her
returns in the destination country, with respect to all those variables. However,
as any capital this investment will be subjected to deprecation and
deterioration (because of difference in technologies, languages, customs, etc.
between source and destination countries). Because of it, returns will be able to
increase if an individual will continue to invest in his/her human capital (on-job-

17
training, pre-employment training). However, these expected discounted
returns on investment will be higher for younger people than for older.
Therefore, younger people have bigger probability to emigrate than older ones.
If an individual expects discounted returns to be high and positive, he/she will
be more likely to migrate. If his/her individual expected discounted returns are
equal to zero, or less, he/she will stay in the source country.
2.2. The non-money return to emigration reflects specific individual preferences for
the destination country as compared to the source country. Such private non-
money returns to migration may very well exist and influence individual
behaviours, but they cannot be separated from those private returns reflecting
higher productivity alone. As a result, they should be ignored in estimations.
However, private and social costs and returns should be separated. Emigration has a
negative impact on social returns to emigration in the source country (tax revenue will
decrease) and positive impact on social returns to emigration in the destination country
(tax revenue will increase). Migration is not neutral. Difference between private and
social costs exists as well; the social system of the source country may be facing much
higher social cost of emigration than sum of all private costs.
3.3 Family migration decisionsThe first family decision model was proposed by Mincer in 1978. He argued that when
the estimated probability of household migration is considered, it should not be based
on an individual net gain from emigration but rather on the net family gain. This model
suggest that all expected discounted incomes and costs of all members of
family/household from migration are pooled together and, on the bases of negative or
positive net gain, the family makes the decision to emigrate or not. Usually, only
husband and wife, whose incomes and costs are considered (children do not work).
However, after such pooled positive net gain, personal husband/wife incomes and costs
can decrease/increase. As result of it, some household members will be tied movers
(they have positive personal gain from migration) and some tied stayers (otherwise).
Such migration behaviour is a product of family welfare maximisation. It is Pareto-
optimal.

18
In 1988, Stark and Lukas stated that individuals are risk averse and, as a result,
migration by different household members into different destination regions results
from such risk aversion. In this game, cooperation is a dominant strategy. We cannot
forget that such risk aversity will have an impact on the decision to which country
individual should emigrate. His/her preferences will be towards a country with a similar
language, similar customs, and open borders (illegal meet more difficulties in finding a
job than legal immigrants).
3.4 Self-selection and the earnings of immigrantsIn 1987, G. J. Borjas wrote a paper on how immigrants’ earnings will differ from the
earnings of the native population and which factors (such as the level of abilities) will
affect the decision to migrate. In his model, it was assumed, that ability distributions are
equal among all countries, but at the same time, countries differ in earnings
distributions. In some countries there is a great difference between the maximum and
minimum wages; in other countries, the gap is not as wide. Borjas researched, and
presented in his paper, how changes in variables of source countries will affect the
quality of immigrants; and estimated two possible effects of such changes. The first is
called the composition effect: how the change in independent variable (of
destination/source country) may create incentives for different skills´ individuals to
migrate. The second is the scale effect: how the changes in independent variable (of
destination/source country) may create incentives for different number of individuals to
migrate. Then he estimated three cases of migration quality:
1. Positive selection. When immigrants are the highest ability individuals in their source
country and earn higher wages in the destination country, than its average natives.
Such outcome will occur for immigrants from the source countries with narrow
(more equal) wage distributions. Quality of abilities for immigrants from such source
countries will decrease if wage distribution will increase and/or socioeconomic
variables will decrease in the source countries.
2. Negative selection. When immigrants are the lowest ability individuals in their
source country and earn lower wages in the destination countries than its average
natives. Such outcome will occur for immigrants from the source countries with

19
wide (more unequal) wage distributions. Quality of abilities for immigrants from
such source countries will increase if wage distribution and/or socioeconomic
variables will decrease in the source countries.
3. Refuge sorting. When immigrants are the highest ability individuals in their source
country, but earn very low wages there, less than average emigrants; they will earn
higher wages in the destination country than its average natives. Such outcome will
occur for immigrants from the source countries with narrow (more equal) wage
distributions, due to some recent political takeovers. Quality of abilities for
immigrants from such source countries will decrease if socioeconomic variables
lessen in source countries and/or correlation between wages of the source and the
destination country increases.
3.5 Theories on migration externalitiesMassey (1990) argued that the factors that influence migration to start could be very
different from the conditions that make migration to continue, i.e. to perpetuate. After
an initial phase of pioneer migration, migration becomes more common in the
community with more and more people imitating current migrants and receiving
assistance from them until the migration becomes self-sustaining (clustering of
immigrants in ethnic communities – herd behaviour). There are different aspects of the
perpetuation of migration, including social capital, social networks and migration
institutions, and cumulative and circular migration. Such network effect will as well have
an impact on the decision to which country an individual should emigrate. The network
effect creates negative and positive externalities:
1. Negative externalities will occur if migration is subjected to adverse selection. If
the first immigrants in ethnic community were low-skilled (low-productivity), it
will lead to more and more low-skilled same nationality immigrants, clustering
the new community. As a result, supply of low-skilled labour will increase in such
community and will reduce the wage equilibrium. Therefore, only a limited
number of immigrants can benefit from the network effect, and as a result it can
create return migration (Bauer and Gang, 1999).

20
2. Positive externalities will decrease personal money and non-money costs of
migration through available discounted information of the first immigrants. This
will lead to an increase in personal money returns on migration (Stark, 1991).
In 1997, Smith and Edmonston had done studies on the overall fiscal impact of
immigration in relation to the welfare state of the destination country. These studies
looked carefully at all layers of government (federal, regional, and local), all programs
(benefits), and all types of taxes. They found out that high-skilled immigrants do
contribute to the welfare state (they pay taxes) and it encourages the destination
country for a more generous welfare system, but low-skilled immigrants (with
education lower than high school) impose a fiscal burden on the welfare state and as a
result, the welfare state will contract. But in 2009, Cohen, Razin and Sadka found out
that ,,because of endogeneity problem that arise because the skill composition of
immigration will be itself affected by the generosity of the welfare state‘‘. It means that
higher-skilled immigrants will increase the welfare state of the destination country, but
higher welfare state will attract lower-skilled immigrants.

21
4 Economic model of individual migration decision
Individual has two choices. At the end of a period he/she can stay in the source (home)
country or he/she can emigrate. By emigrating he/she would invest in his/her human
capital. According to Sjaastad (1962), individual is more likely to immigrate to the
destination country if the costs of moving are low and the benefits from emigrating are
high. Therefore, net return to migration (Δ W) should be positive; otherwise he/she will
stay in the source country.
Individual migration decision model:
1. There are two countries: source (S) and destination (D). Individual is currently
a resident of the source country.
2. Individual is risk neutral and prefer to immigrate legally to country with similar
customs, language (or a language which he/she knows); and the economic
situation of the destination country is better than the economic situation of
the source country.
3. Individual seeks to maximize his/her discounted life time wealth (W)
conditional on his/her migration decision (M) over all his/her remaining (or
expected) working life time with T years:
T = t1 + t2
Where, M = 0, if individual will choose to stays in the source country.
M = 1, if individual will choose to immigrate to the destination
country.
t1 – is time interval (in years) of his/her working life, which he will
spend assimilating in the destination labour market.
t2 – is time interval (in years) of his/her working life in the
destination country after assimilation.
Assume that an individual is completely immobile after migration; he should
stay in the destination country if he/she chooses to emigrate there.
4. If an individual stays in the source country, he will earn ws (expected average
of earnings and welfare benefits) per year.

22
If an individual chooses to immigrate to the destination country, then for
time interval t1 (in years) he expects to earn w1 (expected average of earnings
and welfare benefits) per year, and for time interval t2 (in years) he expects to
earn w2 (expected average of earnings and welfare benefits) per year. Assume
that:
w1 < ws < w2.
5. Total (money + non-money) costs of emigration from the source country to
the destination country are C.
6. Financial markets are perfectly competitive and have only one equilibrium
nominal interest rate (i) and all earnings that he will earn after time interval t1
are discounted at the constant rate 1/(1 + i).
If M = 0, W0 = t1 * ws + t2 * (ws/ (1 + i))
If M = 1, W1 = t1 * w1 + t2 * ( w2/ (1 + i)) – C
Δ W = W1 – W0
Δ W > 0, an individual chooses to immigrate to the destination country (M = 1).
Δ W ≤ 0, an individual chooses to stay in the source country (M = 0).
Where, Δ w1 = ws – w1
Δ w2 = w2 – ws
So an individual will emigrate if
Δ W = t2 * (Δ w2/ (1 + i)) – t1 * Δ w1 – C > 0
An individual is more likely to emigrate if: t1 ↓
t2 ↑
Δ w1 ↓ (or w1 ↑, ws ↓)
Δ w2 ↑ (or w2 ↑)
i ↓
C ↓.
So as a result of this model, we can expect that younger people are more likely to
migrate to a destination country where the wages are higher and welfare benefits
better than in a source country. The assimilation period should be as short as possible
to give a higher return. An individual will prefer to migrate to country with a similar
culture, language, and others similarities. Moving costs should be as low as possible, so
an individual will prefer to travel shorter distances in the neighbour destination

23
countries, legally, and where the local community is of the same ethnic background. If
financial markets are perfectly competitive and have as low a rental price of capital as
possible it will also increase the probability of emigration.

24
5 Historical development of the healthcare system in Iceland2
Before 1974, the healthcare was provided by privet practitioners: general doctors and
specialists. But on January 1, 1974, the Health Services Act was introduced, which
reformed healthcare provision. The Act ,,accorded all citizens of Iceland access to the
best health services at any given time for the protection of their mental, physical and
social health. It laid the groundwork for the present organisation of the health services
and defined the structure of the health care centres and the hospital system‘‘3. Most of
the general practitioners (GPs) that had been providing primary care under the Act,
started working through the healthcare centers. Therefore, as a result of the Act, after
1974, no private agreements between the health authorities and general practitioners
were made. The main government policy for the past decades had been to centralize
the health services.
The GPs’ salaries are negotiated between the medical practitioners’ labour union and
the healthcare authorities, but they should wait for vacancies and compete with each
other for available ones.
Other arrangements exist for the specialists. Most of the specialists have private
practices which are in privately owned or rented locations. They are working on the fee-
for-service basis, which is, as well, regularly negotiated between the medical
practitioners’ labour union and the healthcare authorities; and as part-time employees
in the hospitals. But new specialists do not need to wait for available vacancies and can
get the contracts from the state as soon as they finish their studies and get a licence,
because the healthcare authorities do not know how much and which kind of medical
services they will need in the future. As we can see, the specialists’ activities are less
centralized and regulated by the state, than the GPs’ activities.
Until 1985, an arrangement existed for all the first time patients’ contacts that
should be made through the healthcare centres. But such system became more and
more complicated and was abandoned in 1985. As well, it was against principles of the
2 Historical review is based on Halldorsson, M. (2003). Health Care Systems in Transition.3 Persephone, D.; Giest, S. and Dumortier, J. (2003, October). Country Brief: Iceland. Pp.9.

25
Health Services Act, which stated, that patients are free to choose their own healthcare
providers.
Before 1991, all healthcare services were a joint responsibility. 85% was financed by
the government, and 15% was financed by the local officials (with one exception,
Landspítali, which was funded by state at 100%). However, in 1991, the state overtook
financing of all local healthcare centres and hospitals.
In 1996, changes were presented to the Health Services Act, where the right to
decide on management and mergers of all local healthcare centers was granted to the
Minister of the Health and Social Security (now the Minister of the Welfare), ,,without
needing to change the law‘‘4. In 2002, a detailed description on the structure of the
healthcare centres was finally abandoned.
Since the beginning of 2003, the state began making contracts with private
healthcare centers that should provide the same healthcare services as public centers.
Same year the state healthcare authorities overtook all operating and construction
costs of the healthcare centers, as well as costs of relocations for doctors, nurses, and
midwives. All these costs are financed by the independent branch inside of the State
Social Security Institute (SSSI). The SSSI is supervised by the Social Security Board (SSB),
which consists of five individuals, elected by the Icelandic Parliament, Althingi. The
Minister of the Welfare then chooses a chairman of the SSB from one of the five.
As we can see, the medical care system financing in Iceland is highly centralized,
because it is difficult in a country with a very small population to provide efficient
amount of primary and specialized healthcare services otherwise. Each healthcare
centre and every hospital have their own financial budget, based on quantity and types
of provided medical services, approved by SSSI. In case of surplus, any medical
institution will benefit from it the following year. If budget is in deficit, however, the
institutions will have less money to spend in the next period.
4 Halldorsson, M. (2003). Health Care Systems in Transition. Pp. 21.

26
6 Economic situation in Iceland and the destination countries in 21st century
6.1 Liberalization and build-up of vulnerability in Icelandic economy prior to 2008
The Gramm-Leach-Bliley Act was introduced in the United States in 1999, which ended
the separation of commercial banking from investment banking. This act assumed that
commercial bank may collect deposits back at their homeland (in Icelandic case, with a
population around 300.000, such system created a very weak deposit base for the
investment banks with operations overseas) and use this liquidity to support the
investment bank/or the investment branch of the same bank operations. Such banking
system was accepted, practically, worldwide, including the Iceland. It was, however,
never considered that the Icelandic economy (or most important – inputs for financial
intermediation) could not be even remotely equivalent to the American financial
endowments. Such financial system could never survive for a long period in Iceland
without specified restrictions (which were never introduced). In 2003, as their
privatisation ended, three of Iceland’s biggest banks began to operate under the Act
with no regulations and/or restrictions on their new investment activities; which should
be adapted to the Icelandic geographical, monetary, and population ratio, and other
specifications; being opposed.
In 2003, the Icelandic government significantly increased public expenditures to
finance the Kárahnjúkar, which was used to increase supply of electric power for two
aluminium factories, so that they could increase production capacities. It was the
biggest investment project, which cost was about 35% of the Icelandic GDP5.
Such fiscal expansion, due to a rise in public expenditures and a fall in tax revenue,
(as the Keynesian theory predicts), lead to an increase in aggregate output,
consumption, investment and appreciation of the ISK and so on. The most important
factors of all were that the ISK appreciated and the value of domestic assets, owned by
the Icelandic banks, increased significantly. The debt to total assets ratio (indicator of
5 Source of data: Ministry of Finance. ( 10 January 2003 ). The macro-economic impact of the construction of power plants and aluminium smelters.

27
financial leverage) decreased, which allowed them to take on more debt as inside of
Iceland so and outside of Iceland (which is more important). As well, the high increase in
the value of domestic assets made new investors to believe that the Icelandic banks
stocks would give even higher returns than was expected.
Since 2001, the Central Bank of Iceland was granted full independence and it
adopted the new monetary policy prior to inflation targeting. Under this commitment,
inflation should be around 2.5% with +/- 1.5% deviation. However, as we can see in
Figure 3, starting from 2004, inflation became unsustainable and rose above the Central
Bank’s inflation target (and continued to be above it until the end of 2010). Therefore,
in 2004, the CBI began to raise short-term interbank interest rates, trying to decrease
the expansion of the economy and to gain control over inflation. The monetary
contraction began.
In 2003, the Central Bank (CB) of Iceland decreased the reserve requirement (the
percentage of deposits that banks were not allowed to lend out) from 4% to 2%. Such
monetary expansion created an extra liquidity for the banks, around 20 thousand
million ISK, and allowed them to enter the real estate mortgage market in Iceland.
The debt to total assets ratio continued to decrease for the Icelandic banks and it
pushed investors to revisit their valuation of the Icelandic banks stocks and their
expected returns again, which lead to increased demand in the Icelandic financial
market and a further the ISK appreciation. In Figure 2, we can see that from 2003 until
2005 the ISK appreciated approximately by 25% against the USD. Banks began to offer
mortgages in the domestic market with very low collateral, which allowed more
Icelanders to buy real estate or take another mortgage on a previously bought real
estate.
Due to easy access to liquidity, banks could also offer very low interest rates on
loans, which lead to an increased demand in the real estate market and, following it,
boom in the construction sector.
All these factors, and previous the government and the CB actions, created
conditions for the rise in domestic stocks’ prices, real estates’ prices, and currency
appreciation. Movements in all three markets increased the assets’ value on the banks’
balance sheets and lead to higher out-lending volumes, which lead to a greater
domestic assets’ value and so on. The process was self-fulfilling. The expansion of the
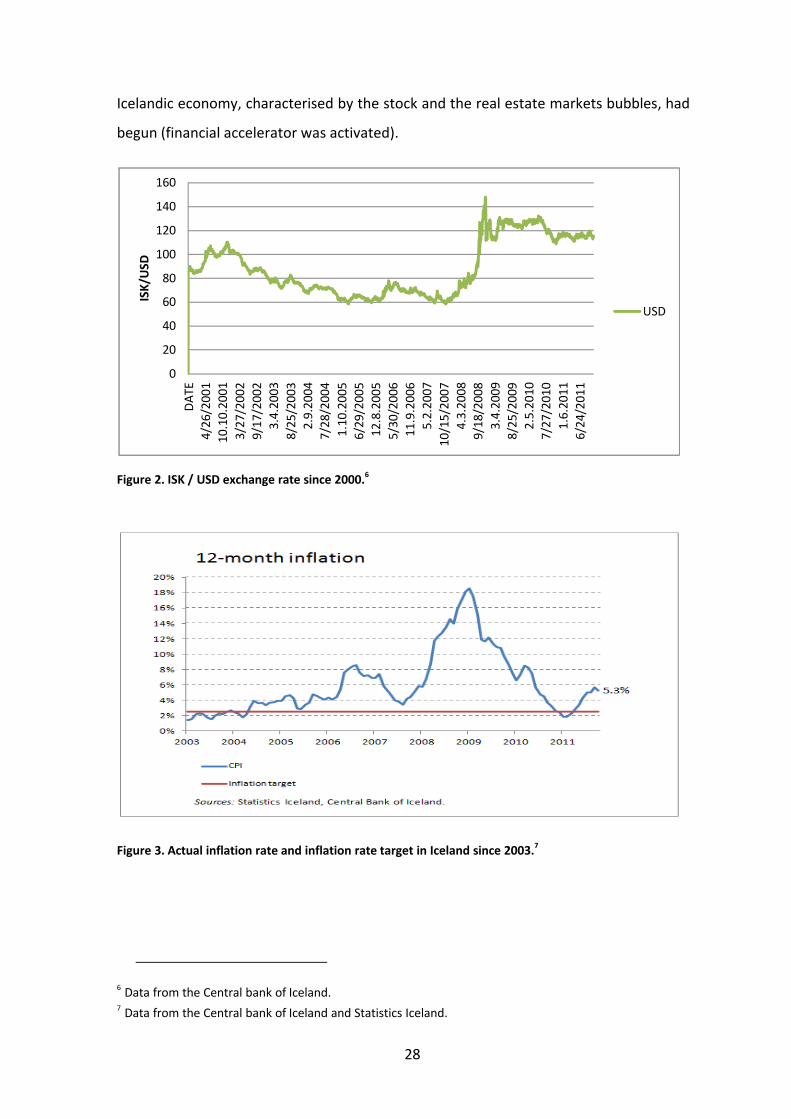
28
Icelandic economy, characterised by the stock and the real estate markets bubbles, had
begun (financial accelerator was activated).
Figure 2. ISK / USD exchange rate since 2000.6
Figure 3. Actual inflation rate and inflation rate target in Iceland since 2003.7
6 Data from the Central bank of Iceland.7 Data from the Central bank of Iceland and Statistics Iceland.
0
20
40
60
80
100
120
140
160DA
TE4/
26/2
001
10.1
0.20
013/
27/2
002
9/17
/200
23.
4.20
038/
25/2
003
2.9.
2004
7/28
/200
41.
10.2
005
6/29
/200
512
.8.2
005
5/30
/200
611
.9.2
006
5.2.
2007
10/1
5/20
074.
3.20
089/
18/2
008
3.4.
2009
8/25
/200
92.
5.20
107/
27/2
010
1.6.
2011
6/24
/201
1
ISK/
USD
USD

29
By aggressively increasing interest rates all the way through 2005 (interest rates rose
from 5.3% in 2003 up to 15.25% in 20078), the CBI created much higher returns on
Icelandic deposits compared to deposits interest rates in Europe, Great Britain or
Canada
It attracted a lot of foreign capital into the country. The first were carry traders,
which took loans in a low yielded currency and invested in a high yielded currency; then
big foreign banks started to issue ,,glacier bonds‘‘, which was denominated in the ISK,
but sold to investors in a foreign currency. All that created a great demand on the ISK,
which lead to even more appreciation of the ISK. The expansion continued, decreasing
ratio of debt to total assets (local + foreign), once again allowing for the Icelandic banks
to take on more debt, as well as increasing the value of stocks once again.
The Central Bank’s measures lead to two negative results: households and firms were
pushed towards a foreign currency denominated debt, because indexed domestic-
currency debt become too expensive; and invited carry traders into the country which
lead to more ISK overvaluation, as we can see in Figure 2 (Benediktsdottir, Danielsson,
and Zoega, 2010).
6.2 Banking and BoP crises, credit and asset market burstsThe banking crisis of 2008 started due to maturity and currency mismatching. The
Icelandic banks (Kaupthing, Glitnir, and Landsbanki) issued short-term liabilities (often in
foreign currency) in order to invest in long-term assets (which was mostly denominated
in the ISK). Such trend was common for most of the international banks due to arbitrage
opportunity, but very risky because short-term bonds needed constant refinancing.
However, on September 15th, 2008, one of the largest American financial-service
providers, the Lehman Brothers, collapsed. As a result, all global financial markets (for
short-term corporate assets) became very pessimistic and low liquid. It had
international investors running scared and trying to invest only in very safe assets: large
countries’ government bonds and notes.
The Icelandic banks, as many others international banks, started to struggle to find
new sources of liquidity, which could allow them to continue rolling over their liabilities;
8 Data from the Central bank of Iceland

30
a liquidity crisis for them became a very realistic outcome, more importantly, it could
lead to the collapse of the Icelandic financial system. One of the first Icelandic banks to
ask for help due to near future liquidity problems was Glitnir. On September 29th, 2008,
the Central Bank of Iceland announced that it had taken over 75% of Glitnir’s assets
(Danielsson and Zoega, 2009).
Morgan Stanley published a review on the European banks in March 2006, where the
level of cross-shareholdings in the Icelandic banks shares was a concern. It created a
question of the banks’ independence, especially given the limited free float. Kaupthing
had a free float of 28.73% and owned 19% in Exista, its largest shareholder. Kaupthing
also owned 24.7% in its fifth-largest shareholder, Vátryggingafélag Íslands. Landsbanki
had a free float of 31.33% and owned 29.9% in FL Group, its second-largest shareholder.
Furthermore, shareholders were borrowers as well.
Banks had invested in each other, creating a systemic risk and a multiplier factor: as
soon as the Icelandic stock market crashed, the value of some companies’ shares
decreased, the holders of those companies’ shares also started to suffer, because it
drew their own shares down. As an example: equity loss involved in Glitnir takeover
created a domino effect within the Icelandic financial system, and lead to the crash of
the Icelandic stock market in a matter of days. As a result of the Central Bank’s actions,
the week following Landsbanki was taken over, and soon thereafter, the same was done
with Kaupthing, the largest Icelandic bank.
The financial position of the Icelandic economy overall was worsening dramatically.
On October 6th, a number of private interbank credit facilities were shut off from the
Icelandic banks. On October 8th, the UK Minister of Finance announced a provision of
the Anti-terrorism, Crime and Security Act 2001 against Landsbanki. The
implementation of the Act meant that the assets of Landsbanki within the UK were
frozen, and any sale or movement of Landsbanki assets within the UK was forbidden. As
a result of the Act, international capital flows towards Iceland stopped immediately.
This was followed by the crash of the Icelandic currency exchange market on same day.
In Figure 2 we can see that the nominal rate of ISK during next two months depreciated
by approximately 50% with ,,overshooting‘‘.
As the economic situation was developing from bad to worse, many carry traders and
other foreign investors were trying to escape Iceland – therefore, the Central Bank of

31
Iceland did not have other choice than to impose controls on the capital flows. As we
can see in the Figure 4, the Current Account Balance from 2006 to 2008 was usually
negative. The country was living in credit from one period to the next and was collecting
debts. However, current account deficit is sustainable as long as foreign investors
believe that it will be repaid sometime in the future. But during the autumn of 2008,
due to the ISK depreciation, loss of foreign investors’ confidence, large current account
and fiscal deficits lead to the Balance of Payments crisis. The Icelandic government was
no longer able to borrow in the international financial markets and foreign currency
reserve was not sufficient enough to insure financial stability in the country. This crisis
was solved with assistance from the International Monetary Fund (IMF), Scandinavian
countries, and Poland.
Figure 4. Current account during period 2006 – 2011 (in billions).9
During the same period, the asset market bubble started to lose air due to excess
supply and a sudden stop in demand.
6.3 Recession of 2008 –...As was mentioned above, the Icelandic government imposed capital controls. Along
with those capital controls, the Central Bank of Iceland increased short-term interbank
interest rates trying to prevent capital outflows. Inflation rate was measured around
18% at end of 2008, 8% at end of 2009 and around 5.3% in 2011 (as seen in Figure 3). As
9 Data from the Central bank of Iceland.

32
we can see in Figure 2, the ISK depreciated on average by 40% since 2008. All those
factors added and closed all credit channels for Icelandic corporations and small
enterprises (and lead to a high bankruptcy rate), increased debt costs for firms and
households and decreased consumption – lead to a significant fall in the country’s
production (GDP).
In Figure 5, we can see that consumption expenditure starts to decrease in the
middle of 2007 and continues to do so until the middle of 2009. From the beginning of
the recession until the mid-2009, consumption decreased approximately by 15.9% and
by 3.2% in 2010. In Figure 6, we can see the annual GDP growth for six countries:
Iceland had the highest decrease in production after the 2008 crisis: -6.8% in 2009, -
3.5% in 2010 and in the end of 2011 it has still not gained positive GDP growth (the
Icelandic economy continues to contract at a low rate).
Figure 5. Consumption expenditure total, Volume index and relative change (%) in purchasing power of
disposable income per capita in 2000 – 2010 period.10
The Icelandic government, starting from 2009, did not have a choice but to adapt a
contractionary fiscal policy (so that it would be able to repay government debt and to
impact inflation). The government cut down all public expenditures and increased all
types of taxes (across all economic sectors). Due to the decrease in public expenditures,
number of employees in public sector continued to fall (wages of the personal are
usually the highest operating expense in balance sheet, over 60%) and unemployment
was on the rise. Due to increasing taxation burden (and inflation), the private sector’s
10 Data from Statistics Iceland.
-40
-20
0
20
40
60
80
100
120
2000 2001 2002 2003 2004 2005 2006 2007 2008 2009 2010
Consumtion expenditure total, Volume index
Relative change in purchasing power of disposable income per capita

33
purchasing power of disposable income decreased significantly. In Figure 5, we can see
that the purchasing power of disposable income at the end of 2008 decreased by 0.6%,
by 16.4% in 2009 and by 12.6% in 2010.
Figure 6. Annual GDP growth in 2000 -2010 period.11
The Icelandic GDP contraction, due to the contractionary fiscal policy and insolvency
in the private sector, resulted in a high unemployment rate, which was unprecedented
for Iceland in the past (natural unemployment rate prior to the autumn 2008 was
around 2%). In Figure 7, we can see that total unemployment rate increased to 6% at
the end of 2008 and between 2009 and 2010 it was around 7.6%. The highest
unemployment rate is among the youngest of Icelandic citizens, or people aged 16 to
24. By the end of 2008 Iceland’s youth unemployment rate was at 12% and between
2009 and 2010 it was around 16%. The lowest unemployment rate, among citizens over
the age of 55, was between 2% and 4%.
11 Data from Statistics Iceland.
-8
-6
-4
-2
0
2
4
6
8
10
2000 2001 2002 2003 2004 2005 2006 2007 2008 2009 2010
United States
United Kingdom
Denmark
Iceland
Norway
Sweden

34
Figure 7. Unemployment rate (%) in 2003 – 2010 period.12
High inflation, unemployment, the ISK depreciation, the asset bubble burst and taxes
– all that variables came down hard on the mortgage borrowers: households. Because
of the first three variables mortgage debt increased by equal or more than 20% by the
end of 2008, and continued to increase significantly after the following year. Due to the
bubble burst, prices on domestic assets continued to decrease during the two years
following the crisis. As a result, many households entered negative equity positions at
the end of 2008, and this is continuing still.
In Figure 8, we can see housing wealth for households at the end of 2008. Close to
20% of households entered negative equity a couple of months after the crisis, and 22%
had very limited positive equity. In other words, almost 42% of all Icelandic households
were having financial difficulties.
In Figure 9, it is possible to see the housing equity positions by age group at the end
of 2008. Number of households in the age group 30 – 44 years in the negative housing
equity was the highest one, next age group with high number of households in negative
equity were 45 – 59 year olds.
12 Data from Statistics Iceland.
02468
1012141618
2003 2004 2005 2006 2007 2008 2009 2010
Total
16-2425-5455-74

35
Figure 8. Housing wealth breakdown by equity in the end of 2008 for households.13
Figure 9. Housing equity positions by age group at the end of 2008.14
13 Data from the Central bank of Iceland.14 Data from the Central bank of Iceland.
3296
1882
9651
16742
9563
18215
8843
49114099
0
2000
4000
6000
8000
10000
12000
14000
16000
18000
20000
Negative 10m .kr. or more
Negative 6-9m.kr.
Negative 0-5m.kr.
From 0-5 m.kr. From 6-9 m .kr. From 10-19m.kr.
From 20-29m.kr.
From 30-39m.kr.
Positive 40m.kr. or more
Number of households
0
5,000
10,000
15,000
20,000
25,000
30,000
18-29 years 30-44 years 45-59 years 60 years and older
Posit ive equity 10 m .kr. or m orePosit ive equity 0-9 m .krNegative equity 0-9 m .krNegative equity 10 m .kr. or m ore
Num ber of households
36
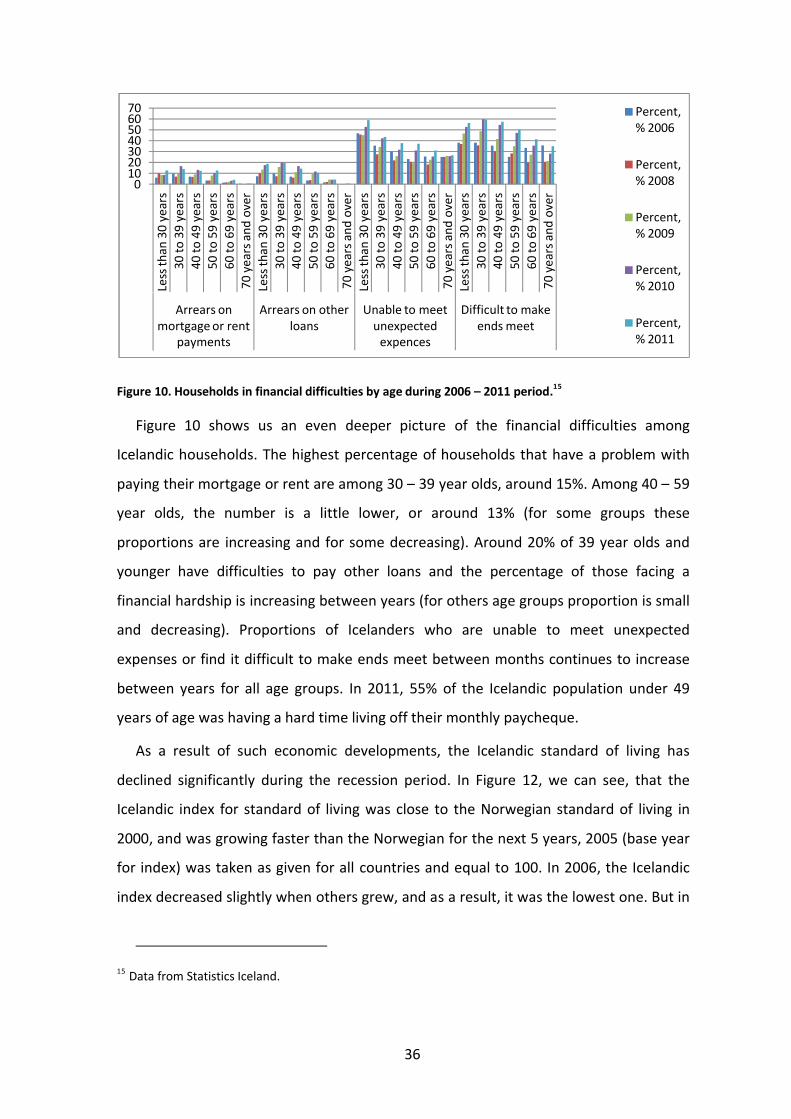
Figure 10. Households in financial difficulties by age during 2006 – 2011 period.15
Figure 10 shows us an even deeper picture of the financial difficulties among
Icelandic households. The highest percentage of households that have a problem with
paying their mortgage or rent are among 30 – 39 year olds, around 15%. Among 40 – 59
year olds, the number is a little lower, or around 13% (for some groups these
proportions are increasing and for some decreasing). Around 20% of 39 year olds and
younger have difficulties to pay other loans and the percentage of those facing a
financial hardship is increasing between years (for others age groups proportion is small
and decreasing). Proportions of Icelanders who are unable to meet unexpected
expenses or find it difficult to make ends meet between months continues to increase
between years for all age groups. In 2011, 55% of the Icelandic population under 49
years of age was having a hard time living off their monthly paycheque.
As a result of such economic developments, the Icelandic standard of living has
declined significantly during the recession period. In Figure 12, we can see, that the
Icelandic index for standard of living was close to the Norwegian standard of living in
2000, and was growing faster than the Norwegian for the next 5 years, 2005 (base year
for index) was taken as given for all countries and equal to 100. In 2006, the Icelandic
index decreased slightly when others grew, and as a result, it was the lowest one. But in
15 Data from Statistics Iceland.
010203040506070
Less
than
30
year
s30
to 3
9 ye
ars
40 to
49
year
s50
to 5
9 ye
ars
60 to
69
year
s70
yea
rs a
nd o
ver
Less
than
30
year
s30
to 3
9 ye
ars
40 to
49
year
s50
to 5
9 ye
ars
60 to
69
year
s70
yea
rs a
nd o
ver
Less
than
30
year
s30
to 3
9 ye
ars
40 to
49
year
s50
to 5
9 ye
ars
60 to
69
year
s70
yea
rs a
nd o
ver
Less
than
30
year
s30
to 3
9 ye
ars
40 to
49
year
s50
to 5
9 ye
ars
60 to
69
year
s70
yea
rs a
nd o
ver
Arrears on mortgage or rent
payments
Arrears on other loans
Unable to meet unexpected
expences
Difficult to make ends meet
Percent, % 2006
Percent, % 2008
Percent, % 2009
Percent, % 2010
Percent, % 2011

37
2007, it grew rapidly and was the third highest index among six countries. After 2008
the Icelandic index decreased to its 2000 level, and in 2009 it decreased below its 1998
level, and in 2010 it continued to decrease further.
Figure 11. Standard of living (real net national income deflated by domestic consumer price index)
index, base year 2005 = 100; during period 2000 – 2011.16
6.4 Economic situation in main destination countries since 2008In this paper I want to research doctors’ migration to five main destination countries:
Norway, Sweden, Denmark, the United States and the United Kingdom. The 2008 crisis
negatively affected economies worldwide, but in some countries the impact of the crisis
is still ongoing, and GDPs continue showing negative growth indicators. In other
countries, GDPs are showing full growth recovery. 2008 was The Test for economies on
the quality of legislation systems, prudentness of banking systems, preparedness of
monetary authorities and strengths of their local fiscal system. In Figure 6, we can see
that in 2008, only Denmark had negative growth around 1.1%, but in 2009, all five
countries became affected by crisis and had negative GDP growth: -5.2% in Denmark, -
2.7% in the US, -4.9% in the UK, -1.7% in Norway, and -5.3% in Sweden. In 2010, all of
them had recovered (except for the US) and were producing positive GDP growth.
16 Data from OECD.
0
20
40
60
80
100
120
2000 2001 2002 2003 2004 2005 2006 2007 2008 2009 2010
iceland
sweden
denmark
norway
usa
uk

38
In Figure 11, we can see how the standard of living was developing in these five
countries. As was mentioned above, Norway had the lowest standard of living among
the five countries in 2000, and for next three years it was fluctuating up and down. The
Danish standard of living takes an intermediate position. The US index was the highest
among all specified countries in 2000, but the UK, Sweden and the US shared this top
position all the way to 2006. But in 2007, Norway achieved the second highest level for
standard of living, passing all others countries; and achieved the highest level in 2008
among these countries; because the rest of countries’ indexes were same or decreased.
In 2009, all countries’ standards of living decreased to their 2005 level. The greatest
drop was for Norway. Only a year later, in 2010, indexes began to rise again. Sweden
was in top position, followed by Norway. The rest of the countries’ indexes were around
the 2005 and 2006 levels.

39
7 Migration from Iceland during the years from 2005 until 2010, by Icelandic citizens.
In this research, it is reasonable to take into consideration only migration patterns for
Icelandic citizens, because factors, which affect migration decisions of Icelandic and
foreign citizens will differ in dynamics; as well as they can be different at all. Most often,
foreign citizens have a small number or no assets to sell and therefore do not have to
make appropriate arrangements with said assets. Repeated migration, for foreign
citizens, is much easier. Family relationships are not so strong in a foreign country. So
on top of having no assets tying one to the country, repeated migrants monetary and
non-monetary costs are much lower than the costs for the native population.
After the recession in September 2008, Iceland was hit by the great emigration wave,
even bigger than the one in 1970. In Figure 12, we can see that cumulative emigration
level among Icelandic citizens fluctuated around 3200 (mean) between 2005 and 2008.
But in 2009, the emigration reached its highest level and in 2010, it began to decrease,
but still was significantly above the mean level. Between 2005 and 2009, Icelandic
cumulative immigration (return migration) level was, as well, fluctuating around 3000
(mean); but in 2009, it decreased significantly; and in 2010, Icelandic return migration
started to increase towards its mean. Icelandic cumulative net migration was, typically,
negative at low numbers (+/- 200), as proof of that, we can see its levels between 2005
and 2008. But in 2009, it became significantly negative due to increased emigration, and
reached 2466; and in 2010, it increased in a positive direction, but was still too far from
its average level.
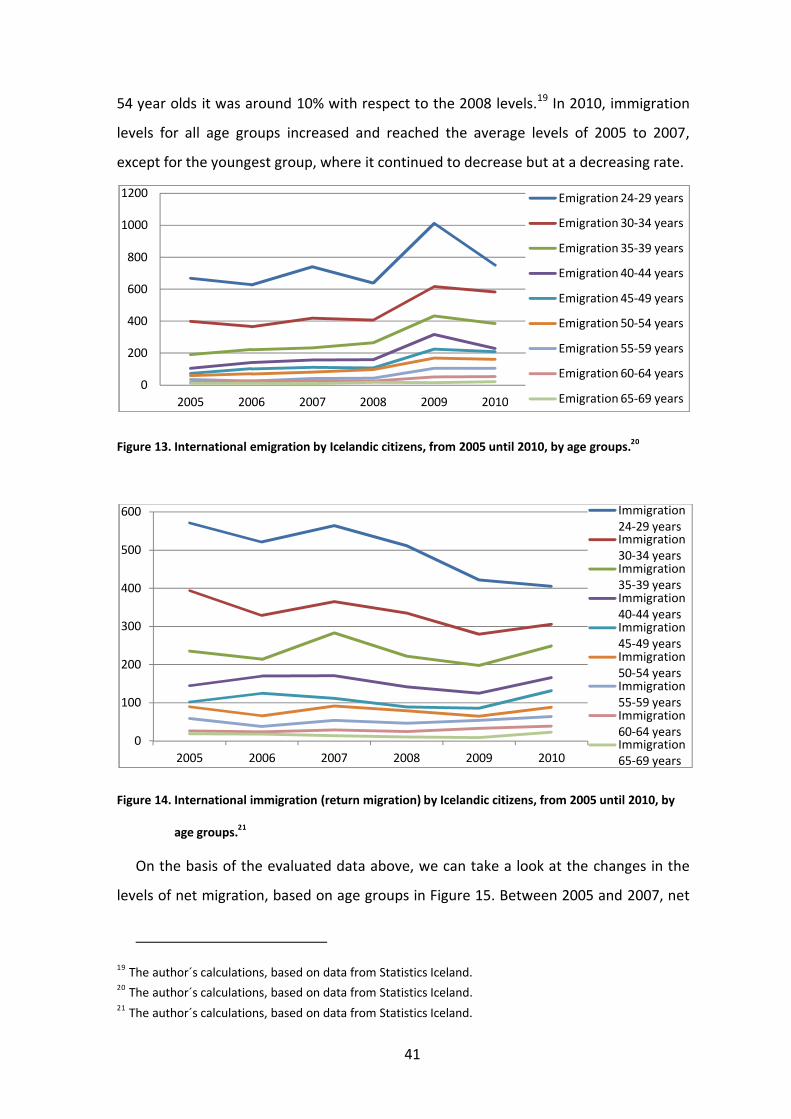
In Figure 13 we can see that international emigration among Icelandic citizens was,
at any time, the highest among the youngest research population group, 24-29 year
olds. It was the lowest among the oldest research population group, 65-69 year olds.
But from this figure, we see that during the years from 2005 until 2008, emigration
levels fluctuated around its means with respect to each age group. So, in the beginning
of the recession in 2008, emigration did not increase straight away. It took Icelanders
one year to adjust to the new economic situation, to make a decision on migration
or/and sell assets (because all these factors increase monetary and non-monetary costs

40
for decision makers). But in 2009, emigration among the youngest group increased by
more than 60%, by 50% for 30-39 year olds, and almost doubled for 40-64 year olds
with respect to the 2008 emigration levels17. At the same time there was no significant
change in emigration for the oldest age group; similar pattern for this group was in
2010. In 2010, emigration decreased towards an average level for 24-49 age groups, but
continued to hold close to the 2009 level (high) for the 50-64 year old group. So
predictions, established by the migration decision model, hold. We can see the highest
emigration level among the youngest group, because their costs are low; but as age
increases, it leads to higher monetary and non-monetary costs for individuals, so
emigration levels decrease.
Figure 12. Cumulative migration levels for Icelandic citizens, from 2005 until 2010.18
In Figure 14, the immigration (return migration) level among Icelanders is the highest
for the youngest age group, and lowest for the oldest age group. Between 2005 and
2010, there were no significant deviations from the average for 55-69 year old group.
For 24-54 year olds, immigration levels decreased by 10% on average during 2008, and
were continuing to decrease for all these age groups in 2009. We can see that many
Icelanders that lived abroad when the recession hit in 2008, chose to postpone return
migration that same year because such decision did not require extra costs (i.e. the
decision to stay in the destination country). The highest decrease, during 2009, was for
the youngest group, or around 20%; for 30-34 year olds it was around 15%; and for 35-
17 The author´s calculations.18 Data from Statistic Iceland.
-3000
-2000
-1000
0
1000
2000
3000
4000
5000
6000
2005 2006 2007 2008 2009 2010
Total
Net migration
Immigration
Emigration
41
54 year olds it was around 10% with respect to the 2008 levels.19 In 2010, immigration
levels for all age groups increased and reached the average levels of 2005 to 2007,
except for the youngest group, where it continued to decrease but at a decreasing rate.
Figure 13. International emigration by Icelandic citizens, from 2005 until 2010, by age groups.20
Figure 14. International immigration (return migration) by Icelandic citizens, from 2005 until 2010, by
age groups.21
On the basis of the evaluated data above, we can take a look at the changes in the
levels of net migration, based on age groups in Figure 15. Between 2005 and 2007, net
19 The author´s calculations, based on data from Statistics Iceland.20 The author´s calculations, based on data from Statistics Iceland. 21 The author´s calculations, based on data from Statistics Iceland.
0
200
400
600
800
1000
1200
2005 2006 2007 2008 2009 2010
Emigration 24-29 years
Emigration 30-34 years
Emigration 35-39 years
Emigration 40-44 years
Emigration 45-49 years
Emigration 50-54 years
Emigration 55-59 years
Emigration 60-64 years
Emigration 65-69 years
0
100
200
300
400
500
600
2005 2006 2007 2008 2009 2010
Immigration 24-29 yearsImmigration 30-34 yearsImmigration 35-39 yearsImmigration 40-44 yearsImmigration 45-49 yearsImmigration 50-54 yearsImmigration 55-59 yearsImmigration 60-64 yearsImmigration 65-69 years

42
migration levels for 35-69 year olds were, in most cases, positive. But 24-29 year olds
had the highest negative level, (more of them emigrated and less returned) because it
decreased by 70% in 2007; and net migration level for 30-34 year olds was continuously
decreasing at a decreasing rate from 2005 to 2007. In 2008, all age group’s net
migration levels decreased significantly, with respect to 2007, in a negative direction;
except for the youngest group which was moving towards a positive direction. During
2009, net migration levels were decreasing at an increasing rate for all groups. The rate
increased by 250% for 24-29 year olds and by 1000% for 40-44 year olds; but had lower
values for others groups, with respect to 200822. In 2010, net migration levels continued
to move in a positive direction, but were still less than the 2008 levels.
Figure 15. International net migration by Icelandic citizens, from 2005 until 2010, by age groups.23
Data in Figure 16 suggests that inflow of Icelanders between 2005 and 2008 to the
UK had the lowest level. Immigration to the US and to Norway had the second lowest
levels. Swedish immigration levels were just slightly above previous levels, but Denmark
was the main destination country for Icelandic citizens during this period. For the US
and the UK, immigration pattern continued even after the recession. But in the
Scandinavian countries, pattern for immigration changed among Icelanders after the
recession. Immigration levels to Denmark decreased slightly during this year and
continued to decrease in 2010 by approximately 30% with respect to the 2009 level
22 The author´s calculations.23 The author´s calculations, based on data from Statistics Iceland.
-500
-400
-300
-200
-100
0
100
2005 2006 2007 2008 2009 2010
Net migration 24-29 yearsNet migration 30-34 yearsNet migration 35-39 yearsNet migration 40-44 yearsNet migration 45-49 yearsNet migration 50-54 yearsNet migration 55-59 yearsNet migration 60-64 yearsNet migration 65-69 years
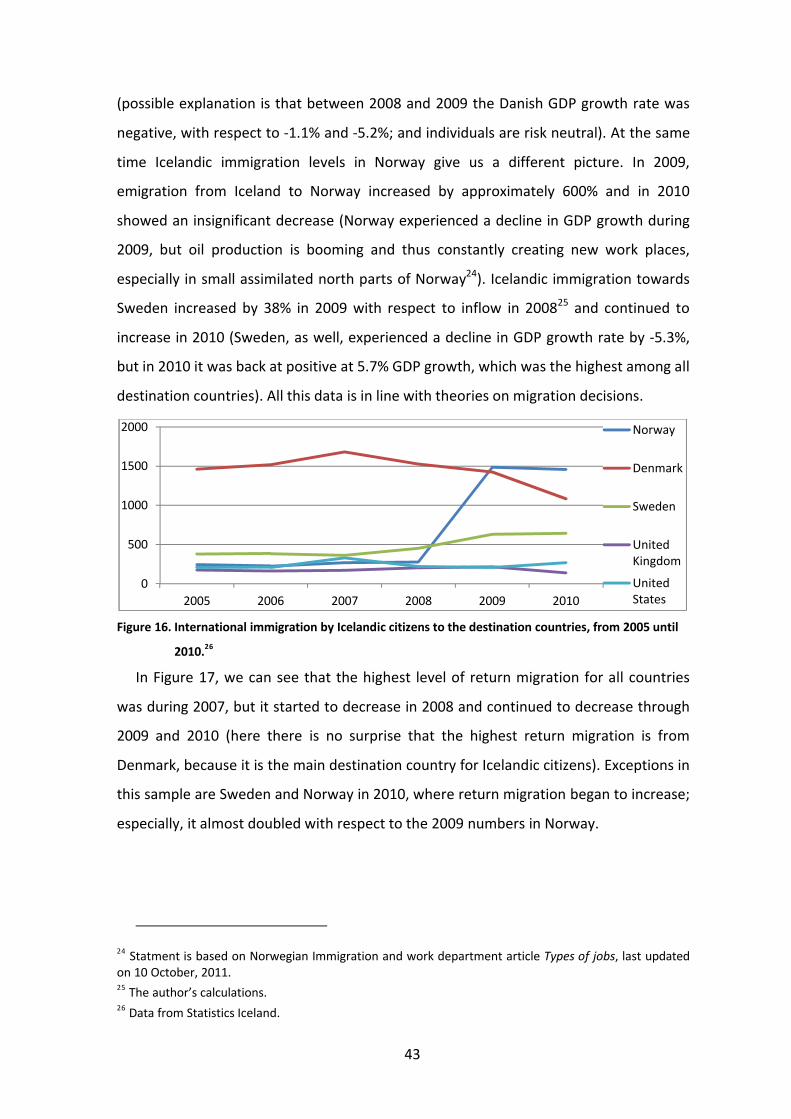
43
(possible explanation is that between 2008 and 2009 the Danish GDP growth rate was
negative, with respect to -1.1% and -5.2%; and individuals are risk neutral). At the same
time Icelandic immigration levels in Norway give us a different picture. In 2009,
emigration from Iceland to Norway increased by approximately 600% and in 2010
showed an insignificant decrease (Norway experienced a decline in GDP growth during
2009, but oil production is booming and thus constantly creating new work places,
especially in small assimilated north parts of Norway24). Icelandic immigration towards
Sweden increased by 38% in 2009 with respect to inflow in 200825 and continued to
increase in 2010 (Sweden, as well, experienced a decline in GDP growth rate by -5.3%,
but in 2010 it was back at positive at 5.7% GDP growth, which was the highest among all
destination countries). All this data is in line with theories on migration decisions.
Figure 16. International immigration by Icelandic citizens to the destination countries, from 2005 until
2010.26
In Figure 17, we can see that the highest level of return migration for all countries
was during 2007, but it started to decrease in 2008 and continued to decrease through
2009 and 2010 (here there is no surprise that the highest return migration is from
Denmark, because it is the main destination country for Icelandic citizens). Exceptions in
this sample are Sweden and Norway in 2010, where return migration began to increase;
especially, it almost doubled with respect to the 2009 numbers in Norway.
24 Statment is based on Norwegian Immigration and work department article Types of jobs, last updated on 10 October, 2011. 25 The author’s calculations.26 Data from Statistics Iceland.
0
500
1000
1500
2000
2005 2006 2007 2008 2009 2010
Norway
Denmark
Sweden
United Kingdom
United States

44
Figure 17. International emigration (return migration) by Icelandic citizens from the destination
countries, from 2005 until 2010.27
Figure 18. International net migration by Icelandic citizens to the destination countries, from 2005 until
2010.28
In Figure 18, we can see that net migration level from the UK was varying around
some mean between 2005 and 2010. Net migration level from the US was varying
around the mean between 2005 and 2008, but started to decrease in a negative
direction at increasing rate in 2009 and 2010. Net migration level from Denmark had
high deviation levels, positive and negative, during all periods, which is difficult to
explain. Maybe due to the close historical relationship between the Icelandic and the
Danish peoples, and the high number of Icelanders in Denmark, immigration toward
Denmark and return migration from Denmark does not have as high migration costs as
27 Data from Statistics Iceland.28 Data from Statistics Iceland.
0200400600800
1000120014001600
2005 2006 2007 2008 2009 2010
Norway
Denmark
Sweden
United Kingdom
United States
-1400
-1200
-1000
-800
-600
-400
-200
0
200
400
2005 2006 2007 2008 2009 2010
Norway
Denmark
Sweden
United Kingdom
United States

45
migration to other countries. Net migration level towards Sweden, as well was
fluctuating around its mean between 2005 and 2007, but decreased in a negative
direction in 2008, and continued to decrease in 2009. In 2010, the pattern changed
towards a positive direction by approximately 25%.
The most interesting case among all these patterns is the net migration level toward
Norway. It was highly positive during 2005 and 2006. An individual bases his/her
decision about migration in the end of a period, so if we are trying to understand the
economic situation, which impacted his/her decision, we need to look to the past
period. But in 2004 and 2005, economic situations in Iceland and Norway were similar,
so if the non-monetary costs are added it would gave to low benefits from migration. It
is understandable that individuals preferred to come back home. In 2007 and 2008, net
migration level decreased and continued decreasing with a sharp negative decline in
2009, approximately by 1200%, because immigration towards Norway increased
significantly, in negative direction with respect to 2008. In 2010 it increased by 25%29 in
positive direction with respect to 2009.
29 The author’s calculations.

46
8 Doctors’ migration from Iceland after 2008
In Figure 19, we can see that 2010 had the highest emigration level among Icelandic
doctors (even if we estimated expected data for full year, for 2009 and 2011), but
return migration during this year had, as well, the highest level. Because the emigration
level was significantly higher than the immigration level, net migration level had the
negative maximum in 2010, as well. In the first five months of 2011, emigration
continues to be high, but is lower than in 2010, with respect to estimated expected
value for 2011. Same statement holds for immigration and net migration levels of 2011,
based on estimated values. From this we can assume, that in 2011, actual net migration
for doctors will continue to be negative, but will be moving towards a positive direction.
Figure 19. Total doctors´ international migration in Iceland, between 2009 and 2011.30
In Figure 20, 21, and 22, we can see that the 60–69 year old group´s migration
towards destination countries and back can be eliminated from our research, because
the levels are too low to be considered. On the other hand, in Figure 20, we can see that
the highest emigration levels are among the 30-34 year old group, for any year given.
This is in full agreement with the migration decision theory, but again, for this group,
the 2010th level is the highest against the others. If we use the estimated expected full
values for 2009 and 2011; we can see that for the 35-44 year old group, emigration
levels were the highest in 2009, but decreased in 2010, and continue to hold around
same level in 2011. For all other age groups emigration levels were and continue to vary
30 The author´s calculations, based on data from Læknafélag Íslands.
-60
-40
-20
0
20
40
60
80
2009(8 months) 2010 2011(5 months)
Physicians Net migration
Physicians Immigration
Physicians Emigration

47
around some small number mean. So we can see that he high total emigration level in
2010 was caused by people aged 30 to 34, as seen in Figure 20.
Figure 20. Doctors’ emigration, between 2009 and 2011, by age groups.31
Figure 21. Doctors’ immigration, between 2009 and 2011, by age groups.32
Return migration levels was high among people aged 35 to 44 year old and continued
to hold around the same level in 2010, being close to the expected estimated values in
2009 and 2011. For other groups immigration levels were close to zero through the
period and are too insignificant to be considered.
31 The author’s calculations, based on data from Læknafélag Íslands.32 The author’s calculations, based on data from Læknafélag Íslands.
0
5
10
15
20
25
30
35
40
45
2009(8 months) 2010 2011(5 months)
24-29 years
30-34 years
35-39 years
40-44 years
45-49 years
50-54 years
55-59 years
60-64 years
65-69 years
0123456789
2009(8 months) 2010 2011(5 months)
24-29 years
30-34 years
35-39 years
40-44 years
45-49 years
50-54 years
55-59 years
60-64 years
65-69 years

48
Figure 22. Doctors’ net migration, between 2009 and 2011, by age groups.33
In Figure 22, we can see the complete picture of the Icelandic doctors’ net migration.
As was expected, the highest negative net migration is among doctors aged 30 to 34
year old, especially in 2010. The second highest negative net migration level in 2010
belongs to doctors aged 45-49 years old. Meanwhile, 35-44 year olds had the highest
estimated expected negative migration level in 2009. For 2011, net migration levels
moved towards a positive direction for all age groups.
Figure 23. Doctors‘ emigration, between 2009 and 2011, by destination countries.34
In Figure 23 we can see that the most doctors immigrated to Sweden between 2009
and 2011, and the highest immigration level was in 2010 to this destination country.
2009 was the second highest level of immigration to Norway, but in 2010 this flow
decreased and continued to decrease in 2011. Same time, immigration to Denmark was
33 The author´s calculations, based on data from Læknafélag Íslands.34 The author´s calculations, based on data from Læknafélag Íslands.
-45
-40
-35
-30
-25
-20
-15
-10
-5
0
5
2009(8 months) 2010 2011(5 months)
24-29 years
30-34 years
35-39 years
40-44 years
45-49 years
50-54 years
55-59 years
60-64 years
65-69 years
0
10
20
30
40
50
60
2009(8 months) 2010 2011(5 months)
Norway
Sweden
Denmark
US
UK
Others

49
none, or very low in 2009, but increased in 2010 and continued to increase in 2011.
Immigration levels to the US and the UK decreased in 2010 with respect to 2009 and
continued to decrease in 2011. Immigration to other countries fluctuated around a low
value mean between 2009 and 2011 with insignificant variations.
Figure 24. Doctors’ immigration, between 2009 and 2011, by destination countries.35
In Figure 24, we can see that the highest return migration was, as well, from Sweden
during research period with the highest level in 2010. Levels of immigration from
Sweden were around same value in 2009 and 2011, and decreased significantly in
comparison to 2010. From the other Scandinavian countries return migration levels
were zero. There was no reported return migration from Norway and Denmark. At the
same time, immigration levels to Iceland from the US, the UK and other countries
fluctuated around a low value, with insignificant deviations between 2009 and 2011.
In Figure 25, we can see that for almost all countries in all periods, net migration
among Icelandic doctors was negative. The highest negative net migration, as would be
expected, is to Sweden with the highest negative level in 2010. Negative net migration
to Norway was increasing in positive direction during all periods. That is to mean that
each year less, and less, doctors were immigrating to Norway (we can see a similar
pattern in net migration to the US and the UK). At the same time, net migration to
Denmark was decreasing in opposite direction between 2009 and 2011, as more and
more doctors emigrated from there. Net migration levels to other countries were
fluctuating around a low value, with insignificant deviations, between 2009 and 2011.
35 The author’s calculations, based on data from Læknafélag Íslands.
0
2
4
6
8
1012
14
16
2009(8 months) 2010 2011(5 months)
Norway
Sweden
Denmark
US
UK
Others

50
Figure 25. Doctors’ net migration, between 2009 and 2011, by destination countries.36
36 The author’s calculations, based on data from Læknafélag Íslands.
-40
-35
-30
-25
-20
-15
-10
-5
0
5
2009(8 months) 2010 2011(5 months)
Norway
Sweden
Denmark
US
UK
Others

51
9 Migration pattern comparison for Icelandic doctors and the general population between 2009 and 201137
Figures 12 and 19 show that the recession of 2008 had different dynamic effects on
emigration for Icelandic doctors and the general population. The highest emigration for
the general population was in 2009, but for doctors in 2010. In my opinion, it would be
right to compare patterns of developments with respect to this fact.
In Figures 26 and 27, we can see how total general population´s and doctors´ levels
were developing between 2009 and 2011, separated by age groups. In Figure 26, we can
see that the levels for 50 year old and older general population were continuously
increasing without an obvious deviation from the pattern. Emigration in those age
groups seems to be too insignificant to be considered (i.e. emigration that does not
have a significant impact). We can see a similar pattern in Figure 27, for doctors that are
45 years old and older. The only exceptions from those patterns were doctors aged 45-
49 and 55-59. Those age groups had the levels that were continuously decreasing during
the research period. In Figure 27, we can see that in 2010, the level decreased by 6.52%
for the 55-59 year olds, and in 2011 it decreased further, or by 6.98%. For 45-49 year
olds there was a decrease by 20.28% in 2010 and a 12.43% decrease in 2011.
In Figure 26, we can see that general population´s level for 24-29 year olds
significantly decreased during the research period and at the same time; Figure 27
shows the doctors’ level for 24 – 29 year olds which did not deviate from its increasing
pattern. The paths were moving in different directions. It can therefore be said that
these groups are affected by different factors, or different effects from same factors are
moving in opposite directions.
In Figure 26, the general population´s levels for 30-34 year olds decreased
insignificantly in 2009, less than 1%, and rose the following year. But in 2011 (the first
five months of the year), the doctors´ level for the same age group decreased by 7.29%,
(and it is likely that it continued to decrease for the remainder of the year), according to
Figure 27. Assumption about different factors impact holds for this group as well.
37 In the text are all author´s calculations.
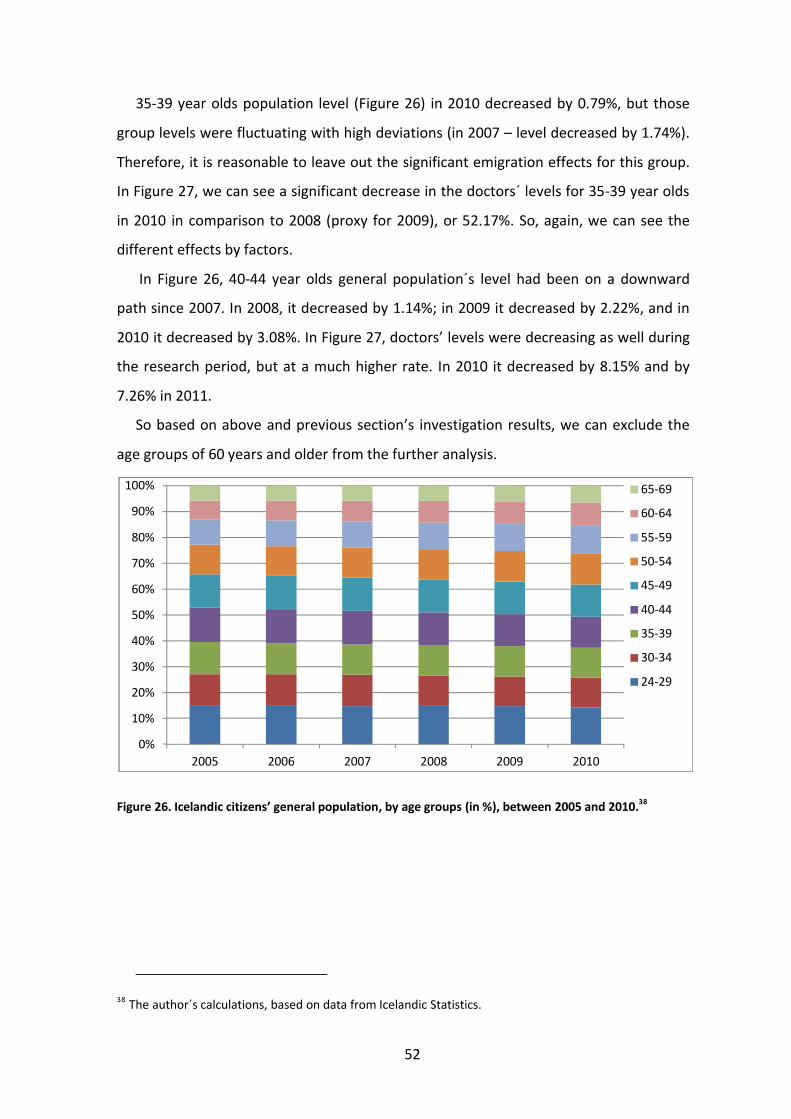
52
35-39 year olds population level (Figure 26) in 2010 decreased by 0.79%, but those
group levels were fluctuating with high deviations (in 2007 – level decreased by 1.74%).
Therefore, it is reasonable to leave out the significant emigration effects for this group.
In Figure 27, we can see a significant decrease in the doctors´ levels for 35-39 year olds
in 2010 in comparison to 2008 (proxy for 2009), or 52.17%. So, again, we can see the
different effects by factors.
In Figure 26, 40-44 year olds general population´s level had been on a downward
path since 2007. In 2008, it decreased by 1.14%; in 2009 it decreased by 2.22%, and in
2010 it decreased by 3.08%. In Figure 27, doctors’ levels were decreasing as well during
the research period, but at a much higher rate. In 2010 it decreased by 8.15% and by
7.26% in 2011.
So based on above and previous section’s investigation results, we can exclude the
age groups of 60 years and older from the further analysis.
Figure 26. Icelandic citizens’ general population, by age groups (in %), between 2005 and 2010.38
38 The author´s calculations, based on data from Icelandic Statistics.
0%
10%
20%
30%
40%
50%
60%
70%
80%
90%
100%
2005 2006 2007 2008 2009 2010
65-69
60-64
55-59
50-54
45-49
40-44
35-39
30-34
24-29

53
Figure 27. Doctors’ population, by age groups (in %), between 2009 and 2011.39
Figure 28. General population´s and doctors´emigration rates (%), between 2008 and 2011.40
In Figure 28, we can see that during the research period, the doctors´ emigration
rates were significantly higher than the emigration rates for the general population. The
highest emigration rate for the general population of the ages from 24 to 59 was 2.05%
in 2009, but 7.93% for doctors in the same age group a year later (2010). The highest
doctors´ emigration rate is therefore almost four times higher than the emigration rate
for the general Icelandic population.
In Figure 29, we can see that net migration (impact on economy) rate is much higher
for doctors. The highest net migration rate for the general Icelandic population was
1.07% in 2009, but 5.6% for doctors in 2010, which is more than five times higher than
for the Icelandic population.
39 Data from Læknafélag Íslands, data for 31.12.2007 taken as proxy for 01.01.09.40 The author´s calculations, based on data from Læknafélag Íslands and Statistics Iceland.
0%10%20%30%40%50%60%70%80%90%
100%
31.12.2007 1.1.2010 1.1.2011
65-69
60-64
55-59
50-54
45-49
40-44
35-39
30-34
24-29
0
2
4
6
8
10
2008 2009 2010 2011
population´s (24-59) emigration, %
doctors´(24-59) emigration, %

54
Figure 29. General population´s and doctors´ net migration rates (%), between 2008 and 2011.41
In Figure 30, and Figure 31, we can see emigration rates for Icelandic citizens and
doctors with respect to the age group (24-59 year olds) during the research period.
Main result that we can see from these figures is that, for any given age group, the
doctors´ emigration rates are at least three times higher than for the general Icelandic
population, but in some age groups it is more than ten times higher.
For 24-29 year olds group, we can see that the doctors´ emigration rate continuously
decreased, and in 2011 was 6.67%. Nevertheless, it was still much higher than for the
general Icelandic population, which in 2009 was only 4.17% (the highest one for
Icelandic population), and down to 3.19% in 2010.
30-34 year old doctors´ emigration rate reached 41.67% in 2010, when for Icelandic
population of same age it was only 3.24% in 2009. Both rates continued to decrease,
but the doctors´ rate is still at 37.75% in 2011.
The emigration rate for 35-39 year old Icelanders spiked in 2009 and reached 2.23%.
The rate for doctors in the same age group continues to increase and was estimated to
be around 18.46% in 2011.
For the Icelandic population in the age group of 40-44 year olds, the emigration rate
spiked in 2009 and was at 1.56%, but for doctors it was holding around same level,
slightly above 4%, during the research period. For the 45-54 year olds, the emigration
rate fluctuated around 1% for both groups. And for 55-59 year olds, the emigration rate
for doctors was higher by just 1% than for the Icelandic population, but both were
fluctuating around their means.
41 The author´s calculations, based on data from Læknafélag Íslands and Statistics Iceland.
-6
-5
-4
-3
-2
-1
02008 2009 2010 2011
population´s (24-59) net migration, %
doctors´(24-59) net migration, %

55
Figure 30. General population´s emigration rates (%), by age groups, between 2007 and 2010.42
Figure 31. Doctors’ emigration rates (%), by age groups, between 2009 and 2011.43
In Figures 32 and 33, we can see net migration rates for the doctors and the general
Icelandic population, grouped by age, during the research period. The net migration
rate for the general Icelandic population (Figure 32) was negative for all age groups in
2010, and the negative maximum, as expected, was in 2009. But for doctors, net
migration rates varied and, for example, were positive for 35-39 year olds, at an
estimated 4.62% in 2011. The net migration rate was the lowest for 24-34 year old
Icelanders, or around 1.8% in 2009, and 1.46% in 2010. Same holds for the doctors in
24-29 year old group, where the rate was -6.06% in 2010, and an estimated -6.67% in
2011. For 30-34 year old doctors, the rate was -41.67% in 2010, and an estimated -
42 The author´s calculations, based on data from Statistics Iceland.43 The author´s calculations, based on data from Læknafélag Íslands.
0
0,5
1
1,5
2
2,5
3
3,5
4
4,5
2007 2008 2009 2010
24-29
30-34
35-39
40-44
45-49
50-54
55-59
05
1015202530354045
2009(e) 2010 2011(e)
24-29
30-34
35-39
40-44
45-49
50-54
55-59

56
37.75% in 2011. As mentioned before, the migration decision´s theory holds, but with a
much higher negative value for doctors. For all others doctors´ age groups, the net
migration rates were negative during the research period, and were about 1% to 2%
higher than for the general Icelandic population.
Figure 32. General population´s net migration rate (%), by age groups, between 2007 and 2010.44
Figure 33. Doctors’ net migration rate (%), by age groups, between 2009 and 2011.45
If we compare emigration pattern, based on destination countries, for the Icelandic
population and doctors, we will see that in both cases the Scandinavian countries are
number one on the emigrants list. Among these two groups, these destination countries
44 The author´s calculations, based on data from Statistics Iceland.45 The author´s calculations, based on data from Læknafélag Íslands.
-2
-1,5
-1
-0,5
0
0,5
2007 2008 2009 201024-29
30-34
35-39
40-44
45-49
50-54
55-59
-50
-40
-30
-20
-10
0
10
2009(e) 2010 2011(e)
24-29
30-34
35-39
40-44
45-49
50-54
55-59

57
only differ in prioritising. For doctors the most popular destination country is Sweden,
then Norway and Denmark, during the research period. For the general Icelandic
population, however, the most popular destination country was Norway, followed by
Denmark, and finally, Sweden. So we can see that for one group Sweden is the most
preferred and for another group the less preferred. But we need to remember, that
between emigration booms of these two groups there was difference in one year, and
the economic situation did change in all three destination countries during that year.
But the story would not be told in full, if we did not look on the return pattern, or even
better, net migration pattern to these destination countries. The doctors´ preferences
did not change after less return migration, but for the Icelandic general population
preferences did change (Denmark and Sweden traded places).
Due to the migration movements (Figure 34), we can see that in the beginning of
2010, doctors´ population decreased by 7.78%, and by 7.43%, at the beginning of 2011,
in comparison to the start of 2008. Same time, between 2010 and 2011, doctors´
population increased by 0.37%. We can see, during the research period, significant
decrease in doctors´ population among 30-49 and 55-59 age groups, which was
balanced out by an increase in 24-29, 50-54 and 60-64 age groups. The best
qualification doctors (age, experience and ability to learn more) are substituted by the
less experienced.
Figure 34. Cumulative doctors´ population, by age groups, between 2008 and 2011.46
46 Data from Læknafélag Íslands.
0
200
400
600
800
1000
1200
1400
1.1.2008 1.1.2009 1.1.2010 1.1.2011
65-69
60-64
55-59
50-54
45-49
40-44
35-39
30-34
24-29

58
10 Summary of results
The first, what we can see from the emigration and the net migration rates for doctors,
is that the migration pattern was delayed by two years with respect to the recession of
2008, and by one year in comparison with the general population of Iceland. The first
year after recession, the Icelandic healthcare system was sheltered by the government
from the impact of the recession; no fiscal contraction was implemented in the
beginning of 2009. As a result, Icelandic doctors (and other budget organisations) and
competitive Icelandic labour markets were in different economic conditions. The first
one was not affected by the economic contraction in the first year, but the second one
experienced the shock straight away (average earnings of competitive market
participants decreased significantly due to increasing unemployment rate and others
variables).
But in the middle of 2009, the Icelandic government implemented a fiscal
contraction policy with a significant decrease in government expenditures and an
increase in tax revenues. As a result, budget organisations became affected (including
doctors), as their earnings decreased due to the increased taxation and contraction in
public spending - thus being the first effect on doctors´ migration pattern. But the
implementation of a decision to emigrate takes time, because individual capital stock is
fixed in the short run. It takes time to make necessary arrangements with housing,
other assets, family, friends, and other factors – the second effect on doctors´ migration
pattern are the non-monetary costs of migration. Due to these two effects, we can see a
peak of emigration and net migration rates for doctors in 2010.
As we can see above, the financing for the medical care system in Iceland is highly
centralized, which is consistent with a monopsonistic labour market. That means that
marginal labour costs for the buyer are equal to the marginal production, with respect
to the labour supply. In other words, wages to employees (including doctors’) will be set
below the competitive market equilibrium; because the employer is enjoying the
market power, as labour suppliers are not able to sell their abilities, education, or
experience elsewhere in a relative market. Overall, the value of wages for employees in
such market will be below their marginal production. There are, as well, mechanisms at

59
work to partially decrease this power, i.e. labour unions, which negotiate minimum
wages and other conditions for its members.
Such minimum wages will have the biggest impact on employees in entry-level
positions (with small or no experience), because the difference between their marginal
production and minimum wage will be insignificant, or even positive. As a result, their
marginal benefit from employment will be higher than the marginal cost of working. On
the other hand, with an increase in experience and education, the difference will
become increasingly negative. Proof of that, we can see in the research, where the
emigration rates for the 24-29 year old general population group and same age doctors
are close to each other. With one difference on the comparison scale: for the general
population it is the highest rate, and for the doctors it is one of the lowest and
continues to decrease. According to the migration theories, the people most likely to
migrate are young individuals. This statement holds for the general Icelandic
population, but not for the doctors because, as was assumed above, their marginal
benefit is higher than marginal costs in the monopsonistic market. At the same time,
the net migration rate among doctors is the second highest (in a negative direction). So
willingness to emigrate for this group decreasing, but return migration rate is close to
zero.
In the research above, we can see that the highest doctors´ emigration rate is among
30-34 year olds. It is possible to make two assumptions about the motives of this group.
(1) They leave to educate them more, and return as specialists. I, however, see a
problem with such an assumption, because the net migration rate among them was as
well highly negative, as nobody from that age group migrated back during the research
period. We could take next age group, 35-39 year olds, immigration rate (with
assumption that the first age group, mentioned above, would become the second, once
they’ve completed their studies); but still with respect to this value, the net migration
rate for 30-34 year olds would be highly negative. This age group, based on research
data, has a very low return migration rate.
(2) The second motive of emigration for this group has to do with higher earnings
and a higher standard of living in destination countries. This assumption will be in
agreement with the migration theories. As showed above, the Icelandic population

60
suffers from a highly negative wealth and purchasing power decrease. According to the
Central Bank of Iceland, and Statistics Iceland, this age group has the highest number of
households in negative housing equity and the highest percentage of households in
financial difficulties ,,to make ends meet’’. As well, for this group, expected working life
in a destination country, is higher than past working life in Iceland. Therefore, expected
returns from emigration are much higher than for other age groups.
Overall, if we look at the total migration rates for the Icelandic population and
doctors; the migration rates for doctors are much higher than for the general
population, because of the high percentages of migrants aged 25-34. If, in comparison,
we look at the age groups broken down separately; we can still see a higher percentage
for every doctors´ age group, than for the Icelandic population. I can therefore conclude
that the highly educated Icelanders´ (doctors´) migration rate is higher than the
migration rate of those less educated.
From data for the cumulative doctors population, we can see that total number of
doctors for the past three years decreased by 80, or approximately by 7.5% (this
number does not take into consideration the amount of doctors´ who received a
bachelor degree for the past three years; and it is, therefore, possible that the total
doctors´ population percentage would be even higher). Such a significant decrease in
doctors´ labour supply should have a negative effect and will lead to a shortage in the
labour market.
As well, we can see some indirect substitution in the doctors´ population, as 30-49
and 55-59 year old groups are substituted by 24-29, 50-54 and 60-64 year old groups.
The first two groups have more experience and higher marginal production than the
youngest group, as well as having a greater ability to continue learning and, possibly,
have a higher marginal production than the oldest group. Such a substitution could have
a negative effect on the healthcare provision as well.
The main destination country for doctors is Sweden, which had the highest standard
of living of the OECD countries in 2010. The second most popular destination country is
a tie between Norway and Denmark (both have a high standard of living). These chosen
destination countries are in line with the individual migration decision, as an individual
prefers to migrate to a country with a similar culture, language, technology, education,

61
and so on; to get the highest return from migrating. The possible explanation, of why
most doctors prefer to migrate to Sweden, could be previous relationships to Sweden
because for many doctors it could be a repeated migration to this destination country.
So, the results, developed in the economic model of the fourth part, are in line with
the research results. After the 2009 contractionary policy, doctors´ expected wages (ws),
in Iceland, decreased significantly in respect to doctors´ expected wages (w2) in the
destination countries. Such wages´ difference pushed doctors towards migration. Most
of doctors´ prefer to migrate to Sweden; because, by doing so, t1 will decrease due to
language; technologies and education similarities (same holds for other two
Scandinavian countries). Such similarities will give higher expected returns on human
capital, in case of migration. The doctors´ migration is most common among 24-49 year
olds, because for these groups t2 is very high, which gives higher expected returns to
migration than for other age groups. In economic model it was assumed that an
individual is risk neutral. The research results support that, because most of doctors
prefer to migrate to Sweden, which has the highest standard of living among OECD
countries.

62
11 Conclusions
Migration patterns of doctors´, in most cases, are in line with the individual migration
decision model; where the most likely to migrate are young individuals to their
neighbouring countries.
As we saw in the results, the net migration and the emigration rates for Icelandic
doctors are much higher than for the general population after the 2008 recession (even
if we take into consideration, that Iceland suffered from the second highest migration
wave for the past century). Young practitioners are especially on the move. At the same
time, the immigration levels of doctors´ in many cases were too insignificant to be
considered; the doctors did not come back home.
Such migration has the indirect effect on doctors´ population, when middle-age
group is substituted with the younger- and older-age groups. The direct effect is that
the total doctors´ population decreased approximately by 7.5% since 2008 (but this
number is even higher if doctors who received diplomas for the past three years are
included).
My main conclusion from this research is that Iceland is experiencing serious ‘brain
drain’ after the 2008 recession, due to a decrease in purchasing power and individual
wealth – especially in such a monopsonistic market as healthcare provision; where
wages are below marginal production. It is possible to assume that in others
sectors/industries, educated population´ migration is not so dramatic, but still
significant.
Due to the GDP decrease and poor data on migration rates for the educated
population; it goes unnoticed by the authorities. This conclusion calls for better data
collection by the statistic centers. Iceland’s brain drain problem cannot be ignored even
in short run, because such ignorance could delay a quick recovery for Icelandic
economy.

63
Bibliography
Ashby, B., and Henriques R. (2006). Icelandic banks, typical investor Q&A, and our response. JP Morgan, European Credit Research. Google.com, viewed 25 October 2011: http://notendur.hi.is/ajonsson/kennsla2006/060324%20Icelandic%20banks.pdf
Bauer, T., Epstein, G., and Gang, I. N. (August 2002). Herd effects or migration networks? The location choice of Mexican immigrants in the U.S. IZA DP No. 551. Google.com, viewed 25 October 2011: http://repec.iza.org/RePEc/Discussionpaper/dp551.pdf
Benediktsdottir, S., Danielsson, J., and Zoega, G. (October 2010). Lessons from a collapse of a financial system. Economic policy fifty-second panel meeting. Google.com, viewed 29 December 2011: http://www.cepr.org/meets/wkcn/9/979/papers/benediktsdottir_etal.pdf
Cobb-Clark, D.A., and Siew-Ean, K. (2006). Public policy and immigrant settlement.Chapter 4, pp. 106-118. Google.com, viewed 25 October 2011: http://books.google.is/books?id=Q_4c7pxVsN8C&pg=PA107&lpg=PA107&dq=mincer+1978&source=bl&ots=g5mQtqfXHu&sig=H_hB1vp3ys1sYnNQyIpJP3jOMHQ&hl=is&ei=Ht2BTqCWDoWl0QWr4_jXAQ&sa=X&oi=book_result&ct=result&resnum=6&ved=0CEAQ6AEwBQ#v=onepage&q=mincer%201978&f=false
Cohen, A., Razin, A., and Sadka E. (Feb., 2009). The skill composition of migration and the generosity of the welfare state. NBER Working Paper No. 14738. Google.com, viewed 25 October 2011: http://economics.cornell.edu/arazin/cohenrazinsadkanberw14738.pdf
Danielsson, A., and Zoega, G. (Feb., 2009) Hagkerfi biður skipbrot. Google.com, viewed 25 October 2011:http://www.hi.is/files/skjol/felagsvisindasvid/deildir/hagfraedi/2008_2009/Hagkerfib____ur_skipbrot.pdf
Diallo, K. (2004). Data on the migration of health-care workers: sources, uses, and challenges. Bulletin of the World Health Organization, Vol. 82, No. 8, pp. 601 – 607. Google.com, viewed 25 October 2011:http://www.who.int/bulletin/volumes/82/8/601arabic.pdf
Garðarsdóttir, Ó., and Bjarnason, Þ. (Oct., 2010). Áhrif efnahagsþrenginga á fólksflutninga til og frá landinu. Google.com, viewed 25 October 2011: http://skemman.is/is/stream/get/1946/6774/18462/3/205-215__l%C3%B6fGar_arsd%C3%B3ttir__oroddurBjarna_FELMAN.pdf
Hagen-Zanker, J. ( 2008). Why do people migrate? A review of the theoretical literature. Google.com, viewed 25 October 2011: http://mpra.ub.uni-muenchen.de/28197/1/MPRA_paper_28197.pdf

64
Halldorsson, M. (2003). Health care Systems in Transition. European observatory on health systems and policies. Google.com, viewed 25 October 2011: http://www.euro.who.int/__data/assets/pdf_file/0006/80844/e82881.pdf
Khwaja, Y. (2000). Should i stay or should i go? Migration under uncertainty: a new approach. Google.com, viewed 25 October 2011: http://www.soas.ac.uk/economics/research/workindoctorapers/file28864.pdf
Lahiri, K., and Moore, G. H. (1991). Leading economic indicators: new approaches and forecasting records. Chapter 9, pp. 152 – 162. Google.com, viewed 25 October 2011: http://books.google.com/books?hl=is&id=_DkgJfo5snEC&q=recession#v=snippet&q=recession&f=false
Laing, D. (2011). Labour economics: introduction to classic and the new labour economics. Chapter 20, pp. 687 – 713.
Magnússon, G. (1997). Internal and External Migration in Iceland 1960-94: A Structural Model, Government Policies and Welfare Implications. Google.com, viewed 25 October 2011: http://notendur.hi.is/gylfimag/migration.pdf
Maresová, J. (1999). Labour Migration to Austria: Czech and Slovak Temporary Workers in Vienna. IWM Junior Visiting Fellows Conferences, Vol. 7. Google.com, viewed 25 October 2011: http://www.iwm.at/publ-jvc/jc-07-09.pdf
McDowell, J. M., and Greenwood, M. J. (1992). The macro determinants of international migration: a survey. Google.com, viewed 25 October 2011:http://www.colorado.edu/Economics/courses/spring11-4292-001/Macro%20Determinants.pdf
Ministry of Finance of Iceland. (2003). The macro-economic impact of the construction of power plants and aluminium smelters. Nr. 1. Google.com, viewed 25 October 2011:http://eng.fjarmalaraduneyti.is/media/Utgefin_rit/SK_enskaal_0301.pdf
Miyagishima, C., and Ineke, J. (2006). Investment grade credit. Icelandic banks: chill out.Morgan Stanley fixed income research. Google.com, viewed 25 October 2011: http://notendur.hi.is/ajonsson/kennsla2006/morgan_stanley.pdf
Norwegian Immigration and work department. (Last updated on 10 October, 2011). Types of jobs. Google.com, viewed 25 October 2011:http://www.gotonorway.org/Working-here/types-of-jobs.html
OECD. (2008). OECD Economic Outlook. Vol. 2008, Issue 2. Google.com, viewed 25 October 2011: http://books.google.is/books?id=L7tzdPB_Ez0C&dq=,,+OECD+Economic+Outlook.+‘‘++(2008)+Vol.+2008,+Issue+2.&source=gbs_navlinks_

65
Persephone, D., Giest, S., and Dumortier, J. (Oct., 2010) Country Brief: Iceland. European Commission, DG Information Society and Media, ICT for Health Unit. Pp. 9-14. Google.com, viewed 25 October 2011: http://ehealth-strategies.eu/database/documents/Iceland_CountryBrief_eHStrategies.pdf
Peterson, J., and Lewis, M. (1999). The Elgar companion to feminist economics. Pp. 558-562. Google.com, viewed 25 October 2011: http://books.google.is/books?id=4BxSnNQIYx4C&printsec=frontcover&dq=The+Elgar+companion+to+feminist+economics&hl=is&ei=cpiLTuDtCuG00QW9_LnABQ&sa=X&oi=book_result&ct=result&resnum=1&ved=0CCoQ6AEwAA#v=onepage&q&f=false
Sjaastad, L. A. (Oct.,1962). Costs and returns of human migration. The Journal of Political Economy, Vol. 70, No. 5, pp. 80-93. Google.com, viewed 25 October 2011: http://www.wiso.unihamburg.de/fileadmin/vwl/aussenhandel/internationalewirtschaftsbeziehungen/Hauptstudium/Migration/WiSe_08_09/VL4_Sjaastad_The_costs_and_returns.pdf
Stark, O., and Taylor, J. E. (Sep., 1991). Migration Incentives, Migration Types: The Role of Relative Deprivation. The Economic Journal, Vol. 101, No. 408., pp. 1163-1178. Google.com, viewed 25 October 2011: http://rmru.birzeit.edu/resources/133/Migration_Incentives__Migration_Types_The_Role_of_Relative_Deprivation.pdf
U.S. Senate committee on banking, housing and urban affairs. (1999). Information Regarding the Gramm-Leach-Bliley Act of 1999. Google.com, viewed 25 October 2011:http://banking.senate.gov/index.htm
Vidal, J. P. (16 July 1997). The effect of emigration on human capital formation. Journal of Population Economics (1998) No. 11, pp. 589 – 600. Google.com, viewed 25 October 2011: arec.umd.edu/cmcausland/RAKhor/.../Vidal.pdf
Vignisdóttir, K. Á., and Ólafsson, Þ.T. (2009). Íslandsstaða íslenskra heimila í kjölfar bankahruns, frekari niðurstöður greiningar Seðlabanka Íslands. Málstofa í Seðlabanka Íslands. Google.com, viewed 25 October 2011:http://sedlabanki.is/lisalib/getfile.aspx?itemid=7122
Walters, A. (1999). Icelandic immigrants. Google.com, viewed 25 October 2011:http://www.islendingafelag.org/icq/a_walters.html
Wanner, P. (2002). Migration trends in Europe. European Population Papers, Series No. 7. Google.com, viewed 25 October 2011: http://www2.unine.ch/repository/default/content/sites/sfm/files/shared/pub/o/o_09.pdf

66
OECD. Google.com, viewed 25 October 2011: http://www.oecd.org/home/0,2987,en_2649_201185_1_1_1_1_1,00.html
Statistics Iceland. Google.com, viewed 25 October 2011: http://www.statice.is/