Embed Size (px)
Citation preview

BSE Ltd (BSE)
15th February, 2017
Endow in Pioneering Exchange
Company Profile: BSE Ltd (BSE) own and operate the BSE exchange platform (formerly, the Bombay Stock
Exchange), the first stock exchange in Asia, which was formed on July 9, 1875. At the end of October 2016, the
BSE was the world's largest exchange by number of listed companies, and India's largest and the world's 10th
largest exchange by market capitalization, with US$ 1.7 trillion in total market capitalization of listed
companies. It regulates listed issuers and provides a market for listing and trading in various types of securities
as may be allowed by SEBI from time to time.
Target Price : INR 1310.3
Potential Upside 30.5%
CMP : INR 1004
Market Cap (INR Mn) 53,788.21
022-6696 5555 www.krchoksey.com
KRChoksey Research is also available on Bloomberg KRCS<GO>
Thomson Reuters, Factset and Capital IQ
Analyst Dinesh Gupta, [email protected], 022 66965609
Shares outs (Mn) 107.36
Equity Cap (INR
Mn) 28501.3
Mkt Cap (INR Mn) 53,788.21
52 Wk H/L (INR) 1200/998
Volume Avg (K) 219.51
Face Value (INR) 2
Bloomberg Code BSE IN
MARKET DATA
SHARE PRICE PERFORMANCE
SHARE HOLDING PATTERN (%)
BSE Ltd (BSE)
Investment Rationale Strong brand recognition
Government allowed EPFO to invest in equity market
Trend of Market Capitalisation to GDP
Introduction of new products and Strategic tie-up with international
exchange
Growing demand for financial assets
Potential Disinvestment in Central Depository Services Limited (CDSL)
Establish an international exchange and an international clearing corporation at GIFT City
Indian market in Sweet Spot
Scope to grow in currency market
View & Valuation
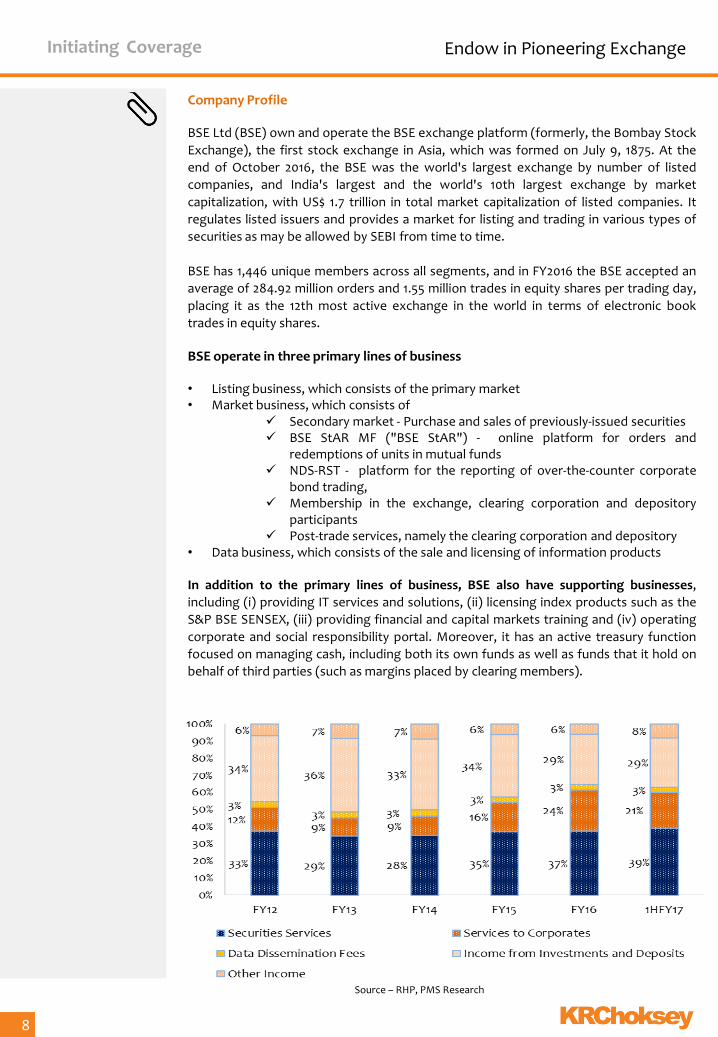
BSE operates a diversified and integrated business model including trading,
clearing and settlement of products listed and traded on the BSE, as well as
the provision of data products, IT services and solutions, index products and
training. Such an integrated approach benefits and keeps costs low for its
participants and members by providing efficiencies that are associated with
having a wide range of services integrated under one entity.
India’s exchange sector is still at nascent stage as compared to developed
and developing economies. We believe that there is significant growth
potential for BSE due to steady growth of the Indian economy, growing
awareness regarding the stock market, increased participation by foreign
institutional players as well as domestic retail investors and increased
penetration of share market trading services across India are some of the
key factors which contributed to this growth. At cmp Rs.1004 is trading at
2.2x TTM P/BV, as compare to other player its valuations are moderate in
terms of P/B. Hence we recommend ‘Buy’ based on 2.5x P/BV FY18E for
investors looking for stable companies with growth prospectus.
2
90
100
110
Feb-1
7
Feb-1
7
Feb-1
7
Feb-1
7
Sensex BSE Ltd
Particulars Feb17
Ownership (Institutional) 5.32%
Ownership (Retail & Other) 94.68%
Endow in Pioneering Exchange Initiating Coverage
Source – BSE RHP, KRChoskey PMS research
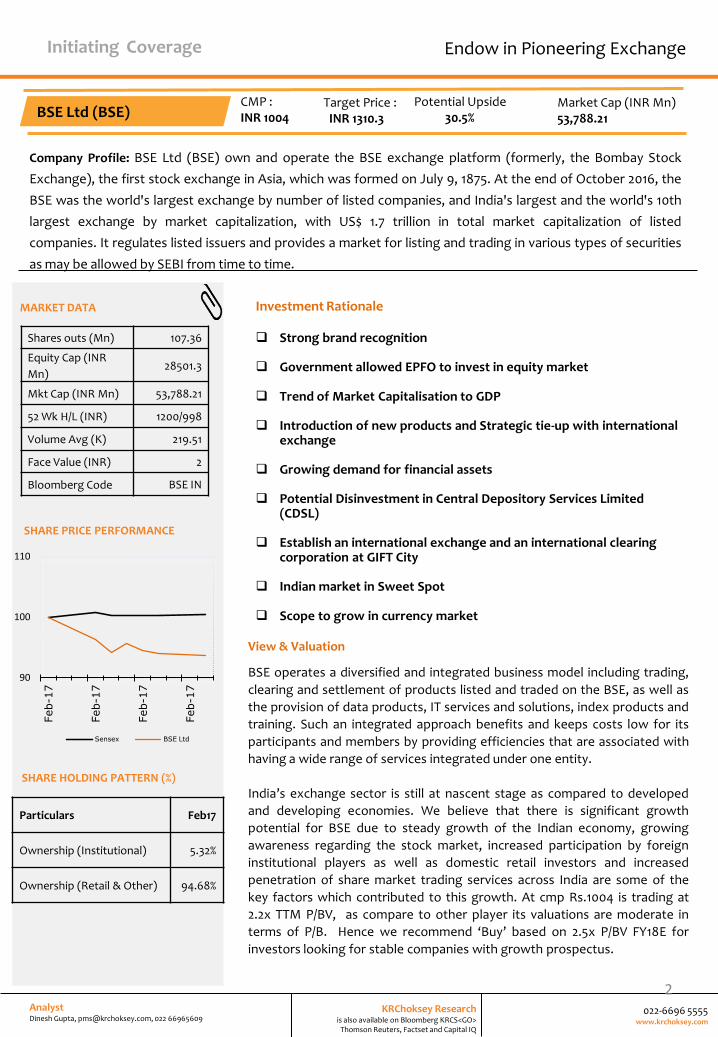
Overview – Indian Stock Exchange Sector
India has a history of stock trading dating back to around 200 years ago. Initially, the East India Company was
the dominant institution and business in its loan securities used to be transacted. Gradually, the trading list
broadened as the number of participating brokers increased with time. Subsequently, a formal stock
exchange was established in 1875 as "The Native Share & Stock Brokers Association" (which later became BSE
Limited). It is the first stock exchange in India to obtain permanent recognition in 1957 from the Government
of India under the Securities Contracts (Regulation) Act, 1956. Later, NSE was founded in 1992 and started
trading in 1994.
Products Traded on Major Indian Exchanges
The BSE and NSE offer trading primarily in equity, debt instruments, exchange traded funds and derivative
products of equities, interest rate and currencies. Commodity trading activity in India is dominated by Multi
Commodity Exchange and National Commodity Exchange.
BSE Ltd
Equity Cash
Equity Derivatives
Equity Indices / Global Indices
Debt Instruments
Mutual Fund / ETFs
Currency Derivative
Interest Rate Derivative
SME Platform
NSE Ltd
Equity Cash
Equity Derivatives
Equity Indices / Global Indices
Debt Instruments
Mutual Fund / ETFs
Currency Derivative
Interest Rate Derivative
SME Platform
MCX Ltd
Commodity Futures
Commodity Options
NCDEX Ltd
Commodity Futures
Commodity Options
Metropolitan Stock Exchange of India Ltd
Equity Cash
Equity Derivatives
Debt Instrument
s
Currency Derivative
3
Initiating Coverage Endow in Pioneering Exchange
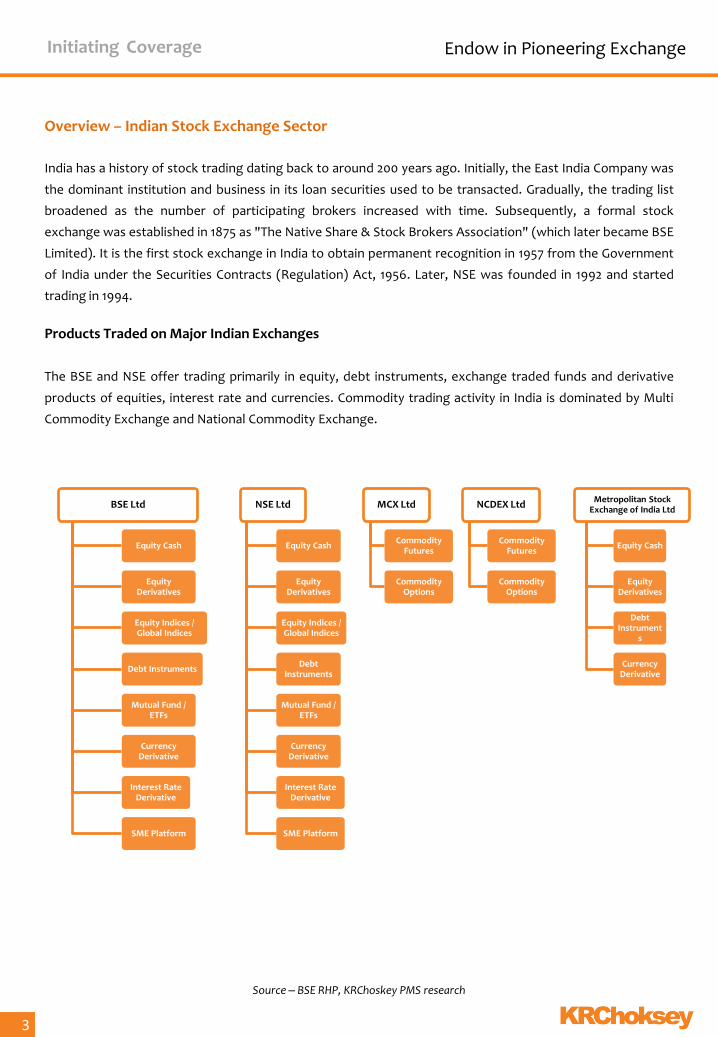
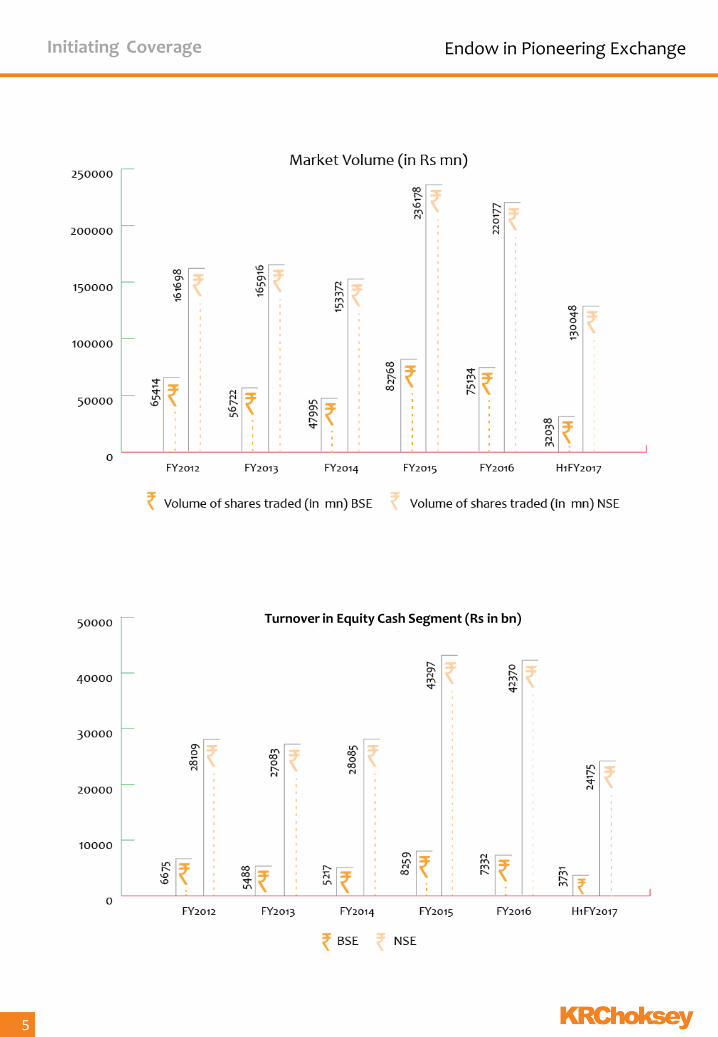
Stock exchange turnover is dominated by Equity & Equity derivative segment
The equity derivatives market, which accounts for more than 85% of the total traded turnover on Indian
exchanges, has seen greater participation by investors since FY2012.
Equity Cash Segment
The two major stock exchanges in India are the BSE and the NSE. The market capitalisation of both stock
exchanges has gradually increased in line with a rise in trading activities and increasing share prices for listed
companies. NSE is leader in equity cash segment.
Source – BSE RHP, KRChoskey PMS research 4
Market Capitalisation (Rs in bn)
Initiating Coverage Endow in Pioneering Exchange
Indian Stock Exchange turnover
Source – BSE RHP, KRChoskey PMS research
5
Turnover in Equity Cash Segment (Rs in bn)
Initiating Coverage Endow in Pioneering Exchange
Investment Rationale
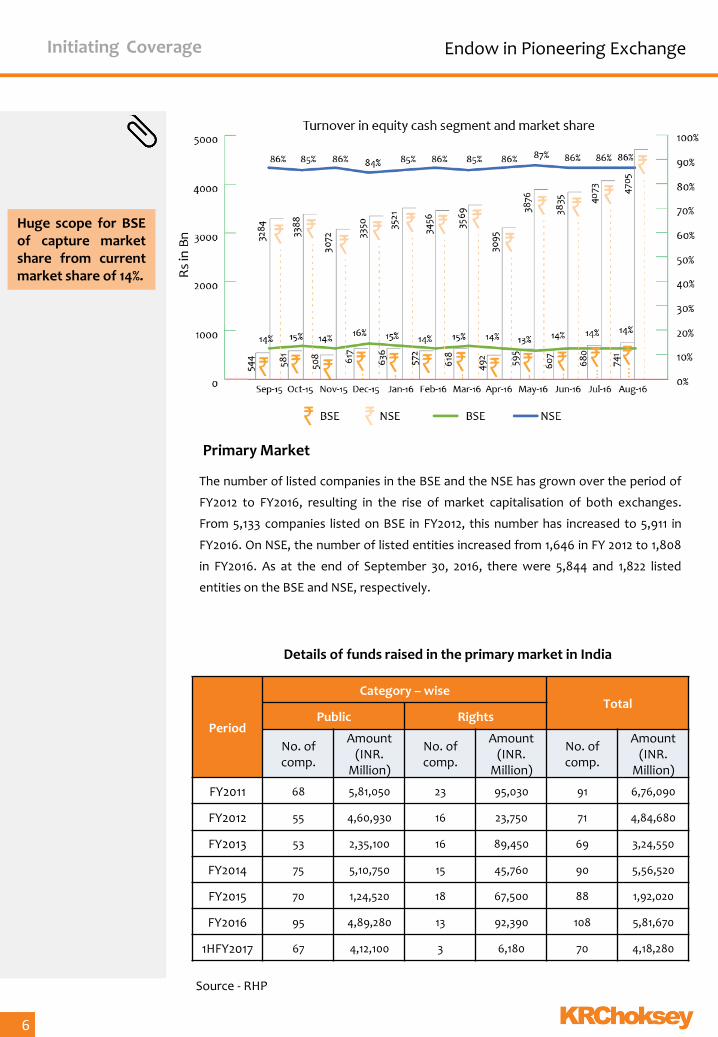
The number of listed companies in the BSE and the NSE has grown over the period of
FY2012 to FY2016, resulting in the rise of market capitalisation of both exchanges.
From 5,133 companies listed on BSE in FY2012, this number has increased to 5,911 in
FY2016. On NSE, the number of listed entities increased from 1,646 in FY 2012 to 1,808
in FY2016. As at the end of September 30, 2016, there were 5,844 and 1,822 listed
entities on the BSE and NSE, respectively.
Source - RHP
Period
Category – wise Total
Public Rights
No. of comp.
Amount (INR.
Million)
No. of comp.
Amount (INR.
Million)
No. of comp.
Amount (INR.
Million)
FY2011 68 5,81,050 23 95,030 91 6,76,090
FY2012 55 4,60,930 16 23,750 71 4,84,680
FY2013 53 2,35,100 16 89,450 69 3,24,550
FY2014 75 5,10,750 15 45,760 90 5,56,520
FY2015 70 1,24,520 18 67,500 88 1,92,020
FY2016 95 4,89,280 13 92,390 108 5,81,670
1HFY2017 67 4,12,100 3 6,180 70 4,18,280
Details of funds raised in the primary market in India
6
Primary Market
Huge scope for BSE of capture market share from current market share of 14%.
Initiating Coverage Endow in Pioneering Exchange
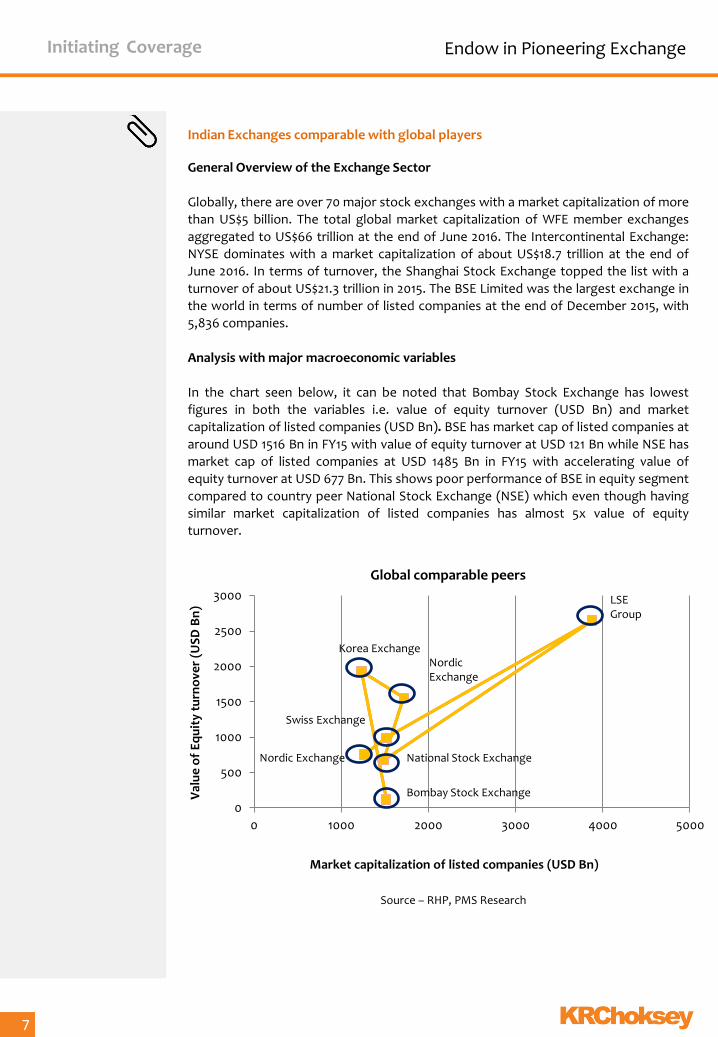
Indian Exchanges comparable with global players General Overview of the Exchange Sector
Globally, there are over 70 major stock exchanges with a market capitalization of more
than US$5 billion. The total global market capitalization of WFE member exchanges
aggregated to US$66 trillion at the end of June 2016. The Intercontinental Exchange:
NYSE dominates with a market capitalization of about US$18.7 trillion at the end of
June 2016. In terms of turnover, the Shanghai Stock Exchange topped the list with a
turnover of about US$21.3 trillion in 2015. The BSE Limited was the largest exchange in
the world in terms of number of listed companies at the end of December 2015, with
5,836 companies.
Analysis with major macroeconomic variables
In the chart seen below, it can be noted that Bombay Stock Exchange has lowest
figures in both the variables i.e. value of equity turnover (USD Bn) and market
capitalization of listed companies (USD Bn). BSE has market cap of listed companies at
around USD 1516 Bn in FY15 with value of equity turnover at USD 121 Bn while NSE has
market cap of listed companies at USD 1485 Bn in FY15 with accelerating value of
equity turnover at USD 677 Bn. This shows poor performance of BSE in equity segment
compared to country peer National Stock Exchange (NSE) which even though having
similar market capitalization of listed companies has almost 5x value of equity
turnover.
Investment Rationale
7
0
500
1000
1500
2000
2500
3000
0 1000 2000 3000 4000 5000
Val
ue
of
Eq
uit
y tu
rno
ver
(US
D B
n)
Market capitalization of listed companies (USD Bn)
Global comparable peers
LSE Group
National Stock Exchange Nordic Exchange
Bombay Stock Exchange
Swiss Exchange
Nordic Exchange
Korea Exchange
Source – RHP, PMS Research
Initiating Coverage Endow in Pioneering Exchange
Company Profile BSE Ltd (BSE) own and operate the BSE exchange platform (formerly, the Bombay Stock
Exchange), the first stock exchange in Asia, which was formed on July 9, 1875. At the
end of October 2016, the BSE was the world's largest exchange by number of listed
companies, and India's largest and the world's 10th largest exchange by market
capitalization, with US$ 1.7 trillion in total market capitalization of listed companies. It
regulates listed issuers and provides a market for listing and trading in various types of
securities as may be allowed by SEBI from time to time.
BSE has 1,446 unique members across all segments, and in FY2016 the BSE accepted an
average of 284.92 million orders and 1.55 million trades in equity shares per trading day,
placing it as the 12th most active exchange in the world in terms of electronic book
trades in equity shares.
BSE operate in three primary lines of business • Listing business, which consists of the primary market • Market business, which consists of
Secondary market - Purchase and sales of previously-issued securities BSE StAR MF ("BSE StAR") - online platform for orders and
redemptions of units in mutual funds NDS-RST - platform for the reporting of over-the-counter corporate
bond trading, Membership in the exchange, clearing corporation and depository
participants Post-trade services, namely the clearing corporation and depository
• Data business, which consists of the sale and licensing of information products
In addition to the primary lines of business, BSE also have supporting businesses,
including (i) providing IT services and solutions, (ii) licensing index products such as the
S&P BSE SENSEX, (iii) providing financial and capital markets training and (iv) operating
corporate and social responsibility portal. Moreover, it has an active treasury function
focused on managing cash, including both its own funds as well as funds that it hold on
behalf of third parties (such as margins placed by clearing members).
Source – RHP, PMS Research
Investment Rationale
8
Initiating Coverage Endow in Pioneering Exchange
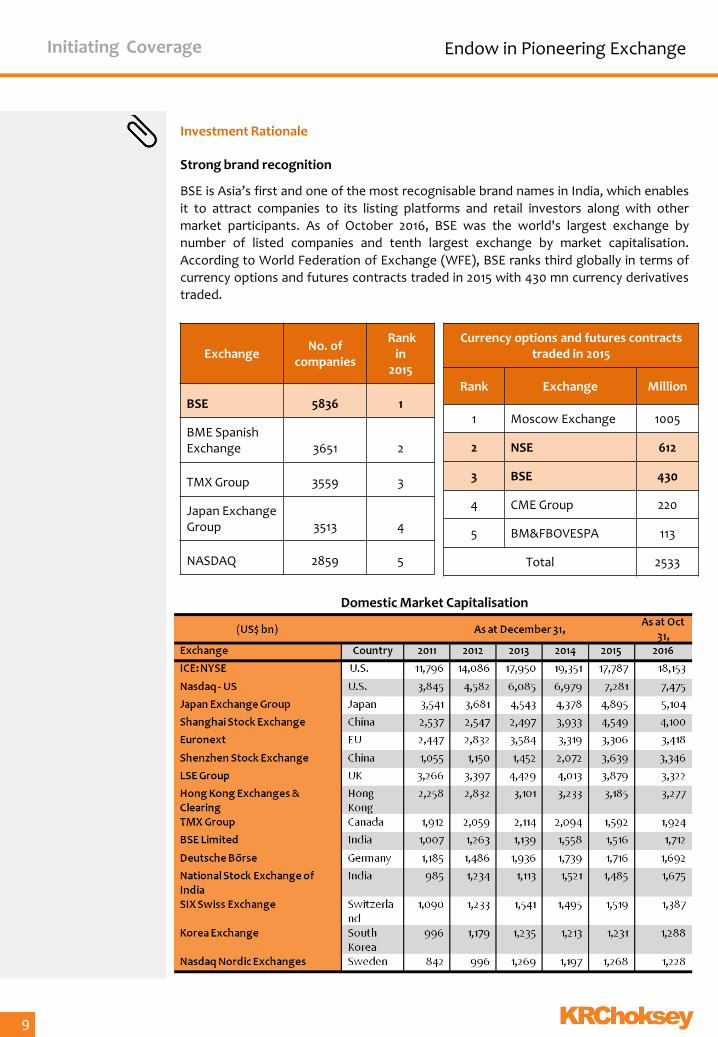
Investment Rationale Strong brand recognition
BSE is Asia’s first and one of the most recognisable brand names in India, which enables
it to attract companies to its listing platforms and retail investors along with other
market participants. As of October 2016, BSE was the world's largest exchange by
number of listed companies and tenth largest exchange by market capitalisation.
According to World Federation of Exchange (WFE), BSE ranks third globally in terms of
currency options and futures contracts traded in 2015 with 430 mn currency derivatives
traded.
Investment Rationale
9
Exchange No. of
companies
Rank in
2015
BSE 5836 1
BME Spanish Exchange 3651 2
TMX Group 3559 3
Japan Exchange Group 3513 4
NASDAQ 2859 5
Currency options and futures contracts traded in 2015
Rank Exchange Million
1 Moscow Exchange 1005
2 NSE 612
3 BSE 430
4 CME Group 220
5 BM&FBOVESPA 113
Total 2533
Domestic Market Capitalisation
Initiating Coverage Endow in Pioneering Exchange
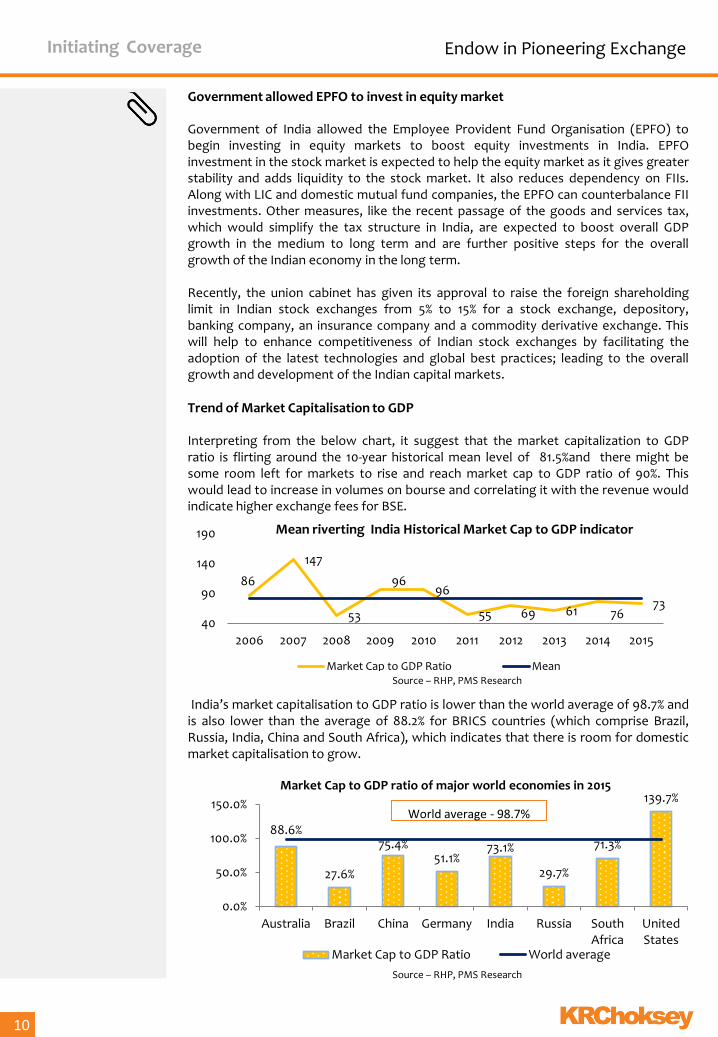
Government allowed EPFO to invest in equity market Government of India allowed the Employee Provident Fund Organisation (EPFO) to begin investing in equity markets to boost equity investments in India. EPFO investment in the stock market is expected to help the equity market as it gives greater stability and adds liquidity to the stock market. It also reduces dependency on FIIs. Along with LIC and domestic mutual fund companies, the EPFO can counterbalance FII investments. Other measures, like the recent passage of the goods and services tax, which would simplify the tax structure in India, are expected to boost overall GDP growth in the medium to long term and are further positive steps for the overall growth of the Indian economy in the long term. Recently, the union cabinet has given its approval to raise the foreign shareholding limit in Indian stock exchanges from 5% to 15% for a stock exchange, depository, banking company, an insurance company and a commodity derivative exchange. This will help to enhance competitiveness of Indian stock exchanges by facilitating the adoption of the latest technologies and global best practices; leading to the overall growth and development of the Indian capital markets. Trend of Market Capitalisation to GDP Interpreting from the below chart, it suggest that the market capitalization to GDP ratio is flirting around the 10-year historical mean level of 81.5%and there might be some room left for markets to rise and reach market cap to GDP ratio of 90%. This would lead to increase in volumes on bourse and correlating it with the revenue would indicate higher exchange fees for BSE.
Source – RHP, PMS Research
Investment Rationale
10
86
147
53
96 96
55 69 61 76 73
40
90
140
190
2006 2007 2008 2009 2010 2011 2012 2013 2014 2015
Mean riverting India Historical Market Cap to GDP indicator
Market Cap to GDP Ratio Mean
88.6%
27.6%
75.4% 51.1%
73.1%
29.7%
71.3%
139.7%
0.0%
50.0%
100.0%
150.0%
Australia Brazil China Germany India Russia South Africa
United States
Market Cap to GDP ratio of major world economies in 2015
Market Cap to GDP Ratio World average
World average - 98.7%
India’s market capitalisation to GDP ratio is lower than the world average of 98.7% and is also lower than the average of 88.2% for BRICS countries (which comprise Brazil, Russia, India, China and South Africa), which indicates that there is room for domestic market capitalisation to grow.
Source – RHP, PMS Research
Initiating Coverage Endow in Pioneering Exchange
Introduction of new products and Strategic tie-up with international exchange BSE continually strive to diversify its product and service offerings to serve investors'
needs by developing new products and bringing new types of financial instruments.
Even though stock exchanges in India have seen business growth in the past, there
are product gaps which exist in certain segments. There is room to introduce
innovative derivative products like weather derivatives, energy derivatives and credit
derivatives, which are currently traded in major exchanges worldwide. The availability
of such new products would bring additional business volumes on the exchanges.
BSE is expanding its overseas presence through strategic alliances. It entered into
strategic partnership with S&P Dow Jones Indices LLC (USA) to grow its index
business by licensing its index products. Further, BSE has signed agreement with
Deutsche Börse to sell and market BSE market data and information to global clients.
It is also a member of BRICS Exchanges Alliance, whereby leading exchanges in the
member counties (Brazil, Russia, India, China & South Africa) cross-list futures
products based on the flagship indices of each of the other exchanges.
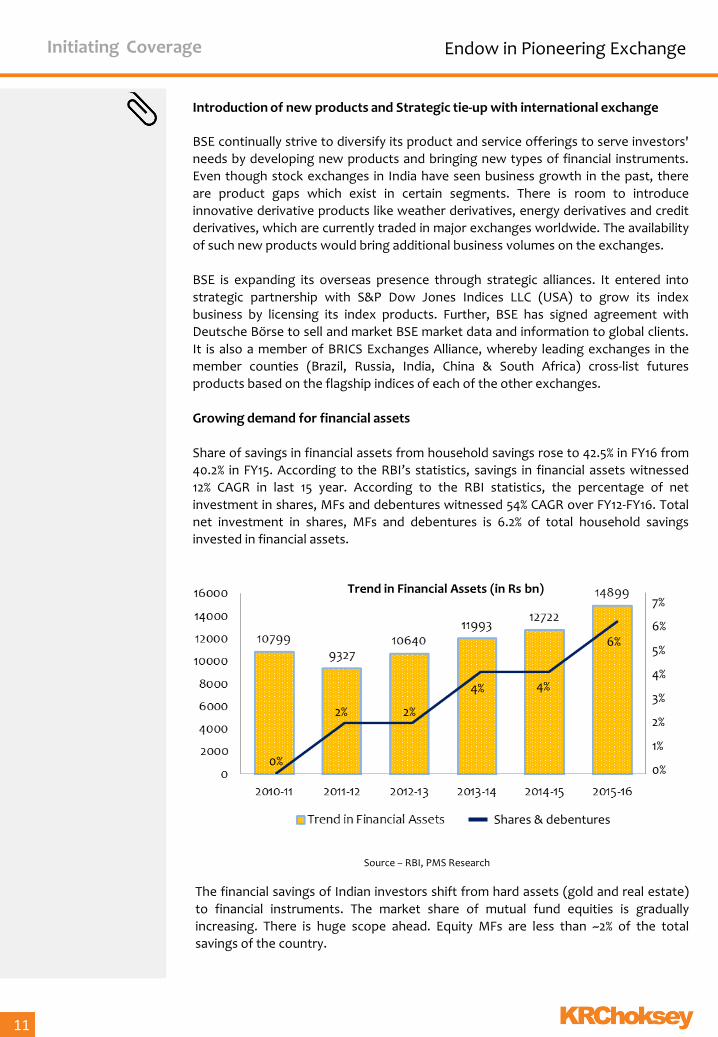
Growing demand for financial assets Share of savings in financial assets from household savings rose to 42.5% in FY16 from
40.2% in FY15. According to the RBI’s statistics, savings in financial assets witnessed
12% CAGR in last 15 year. According to the RBI statistics, the percentage of net
investment in shares, MFs and debentures witnessed 54% CAGR over FY12-FY16. Total
net investment in shares, MFs and debentures is 6.2% of total household savings
invested in financial assets.
Source – RBI, PMS Research
The financial savings of Indian investors shift from hard assets (gold and real estate)
to financial instruments. The market share of mutual fund equities is gradually
increasing. There is huge scope ahead. Equity MFs are less than ~2% of the total
savings of the country.
Investment Rationale
11
Shares & debentures
7%
6%
5%
4%
3%
2%
1%
0% 0%
2% 2%
4% 4%
6%
Trend in Financial Assets (in Rs bn)
Initiating Coverage Endow in Pioneering Exchange
Potential Disinvestment in Central Depository Services Limited (CDSL) BSE has divested a 4.15% stake in CDSL to LIC at Rs 78.93 per share aggregating to Rs.
342.3 mn valuing it Rs 8248.1 mn, currently hold 54.2% stake in CDSL. Pursuant to
Indian law, effective April 1, 2017 stock exchanges will be prohibited from holding
more than a 24.0% stake in depositories, as a result of which BSE is required to divest
26.05% of stake in CDSL. The disinvestment of stake in CDSL will significantly impact
revenue.
Establish an international exchange and an international clearing corporation at GIFT City BSE to investing about ~Rs 500 crore in the international exchange over the next
three years, International exchange in GIFT City (Ahmadabad) may turn into major
success due to first-mover advantage. Establishing this exchange will increase BSE’s
brand's profile and also provide with additional sources of revenue. BSE intends to
offer across equity and index derivatives, currency derivatives and commodities in
foreign currency. It will also offer interest rate futures, fixed income securities and
provide an electronic trading platform.
The exchange will be a beneficiary of several tax sops, including exemptions from
stamp duty, service tax, dividend distribution tax, as well as commodity and securities
transaction tax (STT). STT is one of the biggest sore points for investors participating
in derivatives trading and the new exchange will eliminate that. A lot of Indian traders
dealing in equity derivatives from Singapore and Dubai may be tempted to set up
desks here. At present, sellers of options contracts have to pay an STT of 0.05 per
cent on the premium value. In addition, STT on buying options that get exercised is
0.125 per cent of the entire contract value. For futures contracts, sellers have to pay
an STT of 0.01 per cent.
Indian market in Sweet Spot
India is in sweet spot and one of the preferred global investment destinations given
its macro-economic stability, long-term growth prospects and ongoing economic and
social reforms. With India's GDP growing at a rate of 7% to 8% in the current financial
year, India is one of the fastest growing economies in the world compared to the
relatively muted growth of other major global economies. We expect the growth of
the Indian economy to attract foreign investments in coming years. Global events
such as Brexit are also expected to attract new investors to India given slower growth
in the European continent. Given the rise in the Indian capital markets, 269 new
Foreign Portfolio Investors ("FPIs") registered with SEBI in April 2016.
Investment Rationale
12
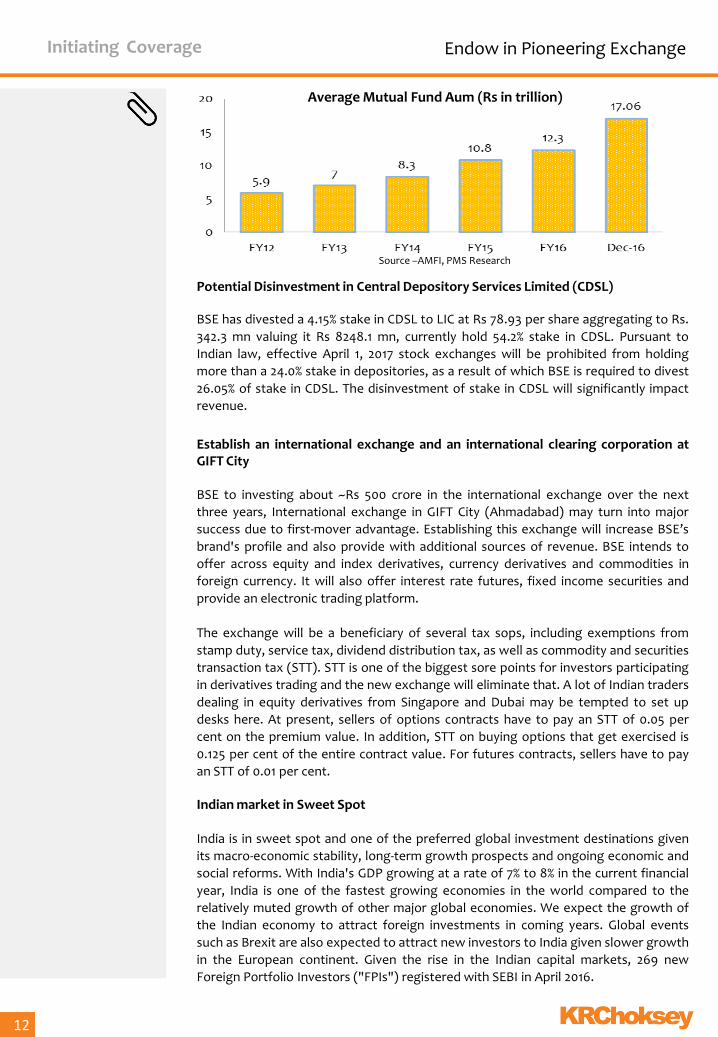
Source –AMFI, PMS Research
Average Mutual Fund Aum (Rs in trillion)
Initiating Coverage Endow in Pioneering Exchange
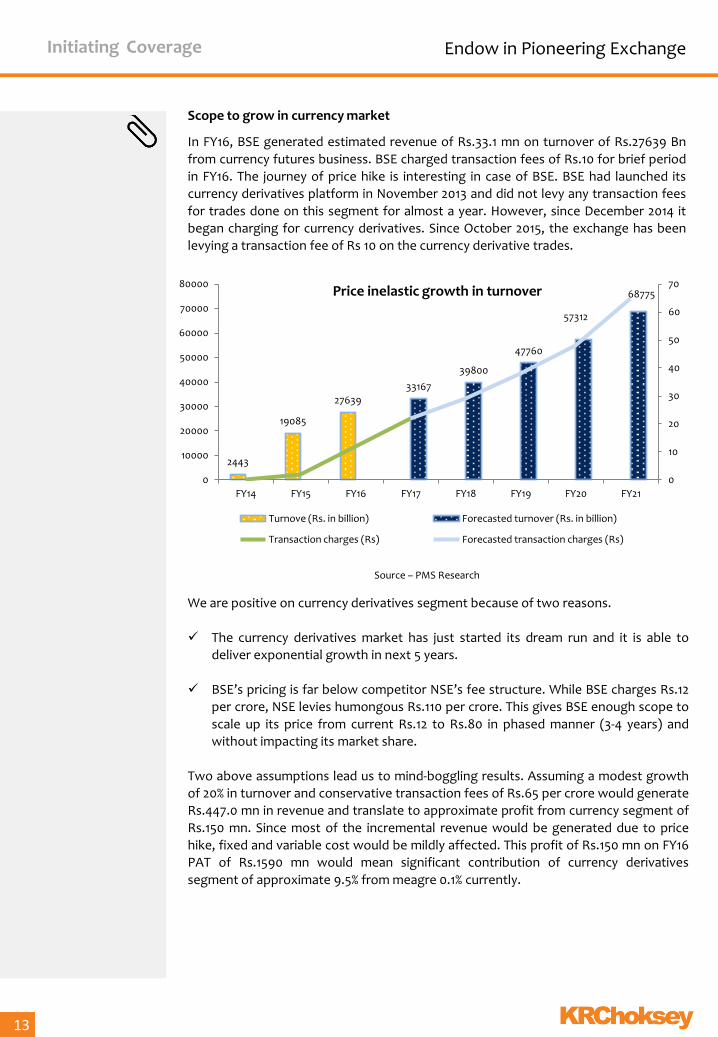
Scope to grow in currency market
In FY16, BSE generated estimated revenue of Rs.33.1 mn on turnover of Rs.27639 Bn
from currency futures business. BSE charged transaction fees of Rs.10 for brief period
in FY16. The journey of price hike is interesting in case of BSE. BSE had launched its
currency derivatives platform in November 2013 and did not levy any transaction fees
for trades done on this segment for almost a year. However, since December 2014 it
began charging for currency derivatives. Since October 2015, the exchange has been
levying a transaction fee of Rs 10 on the currency derivative trades.
Source – PMS Research
We are positive on currency derivatives segment because of two reasons.
The currency derivatives market has just started its dream run and it is able to
deliver exponential growth in next 5 years.
BSE’s pricing is far below competitor NSE’s fee structure. While BSE charges Rs.12
per crore, NSE levies humongous Rs.110 per crore. This gives BSE enough scope to
scale up its price from current Rs.12 to Rs.80 in phased manner (3-4 years) and
without impacting its market share.
Two above assumptions lead us to mind-boggling results. Assuming a modest growth
of 20% in turnover and conservative transaction fees of Rs.65 per crore would generate
Rs.447.0 mn in revenue and translate to approximate profit from currency segment of
Rs.150 mn. Since most of the incremental revenue would be generated due to price
hike, fixed and variable cost would be mildly affected. This profit of Rs.150 mn on FY16
PAT of Rs.1590 mn would mean significant contribution of currency derivatives
segment of approximate 9.5% from meagre 0.1% currently.
Investment Rationale
13
2443
19085
27639
33167
39800
47760
57312
68775
0
10
20
30
40
50
60
70
0
10000
20000
30000
40000
50000
60000
70000
80000
FY14 FY15 FY16 FY17 FY18 FY19 FY20 FY21
Turnove (Rs. in billion) Forecasted turnover (Rs. in billion)
Transaction charges (Rs) Forecasted transaction charges (Rs)
Price inelastic growth in turnover
Initiating Coverage Endow in Pioneering Exchange
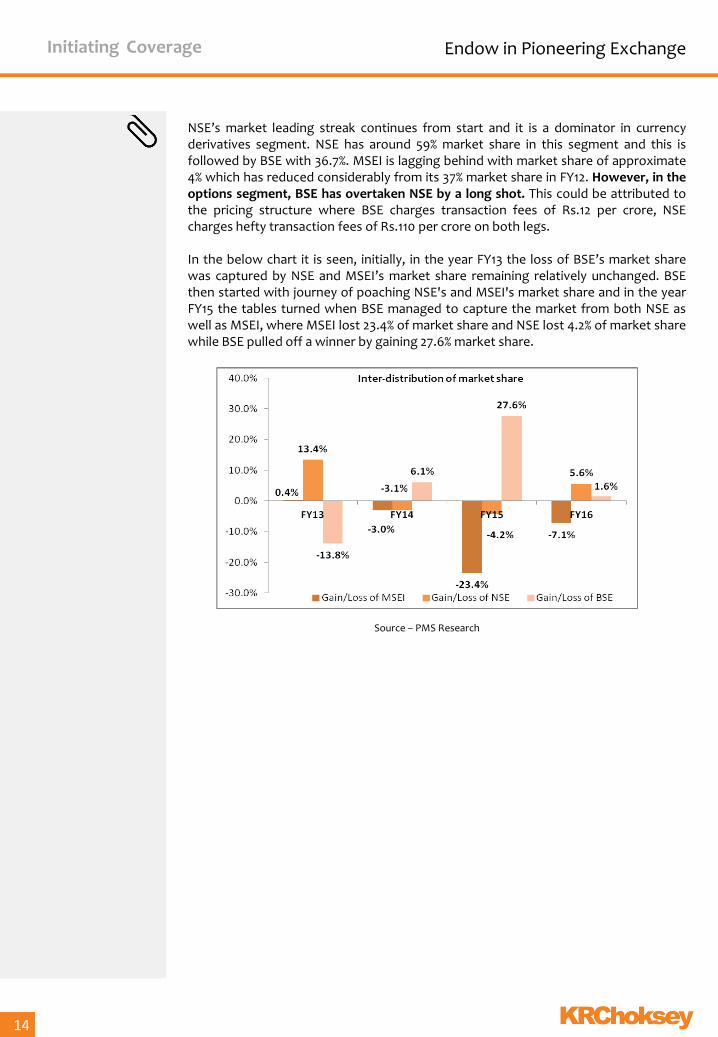
NSE’s market leading streak continues from start and it is a dominator in currency derivatives segment. NSE has around 59% market share in this segment and this is followed by BSE with 36.7%. MSEI is lagging behind with market share of approximate 4% which has reduced considerably from its 37% market share in FY12. However, in the options segment, BSE has overtaken NSE by a long shot. This could be attributed to the pricing structure where BSE charges transaction fees of Rs.12 per crore, NSE charges hefty transaction fees of Rs.110 per crore on both legs. In the below chart it is seen, initially, in the year FY13 the loss of BSE’s market share was captured by NSE and MSEI’s market share remaining relatively unchanged. BSE then started with journey of poaching NSE's and MSEI's market share and in the year FY15 the tables turned when BSE managed to capture the market from both NSE as well as MSEI, where MSEI lost 23.4% of market share and NSE lost 4.2% of market share while BSE pulled off a winner by gaining 27.6% market share.
Investment Rationale
14
Initiating Coverage Endow in Pioneering Exchange
Source – PMS Research
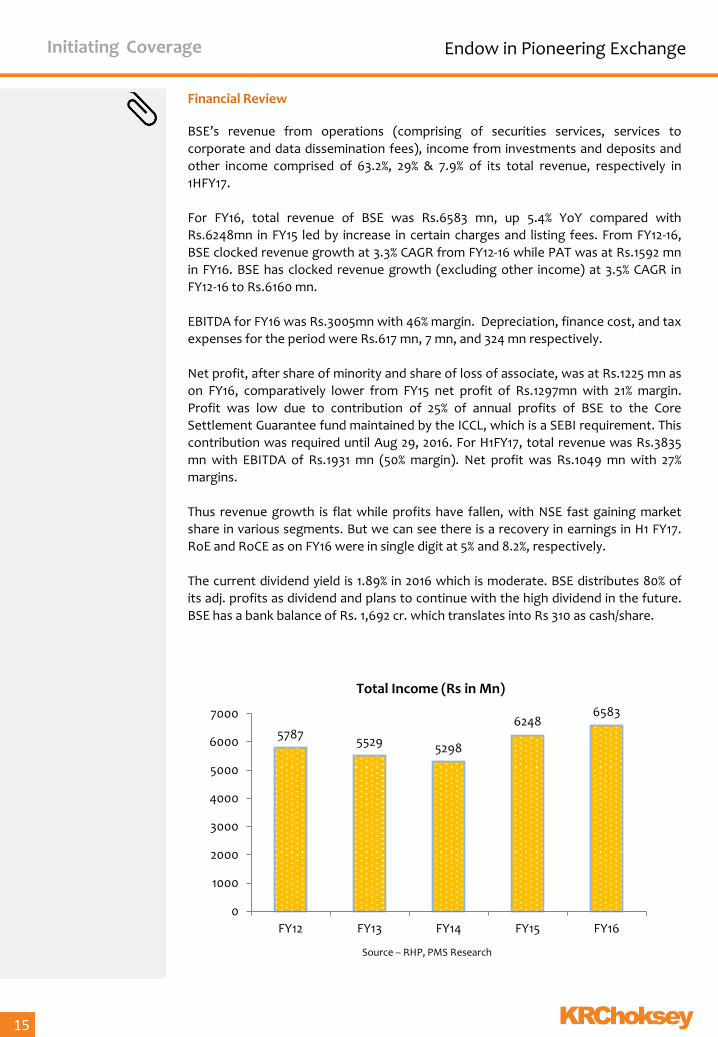
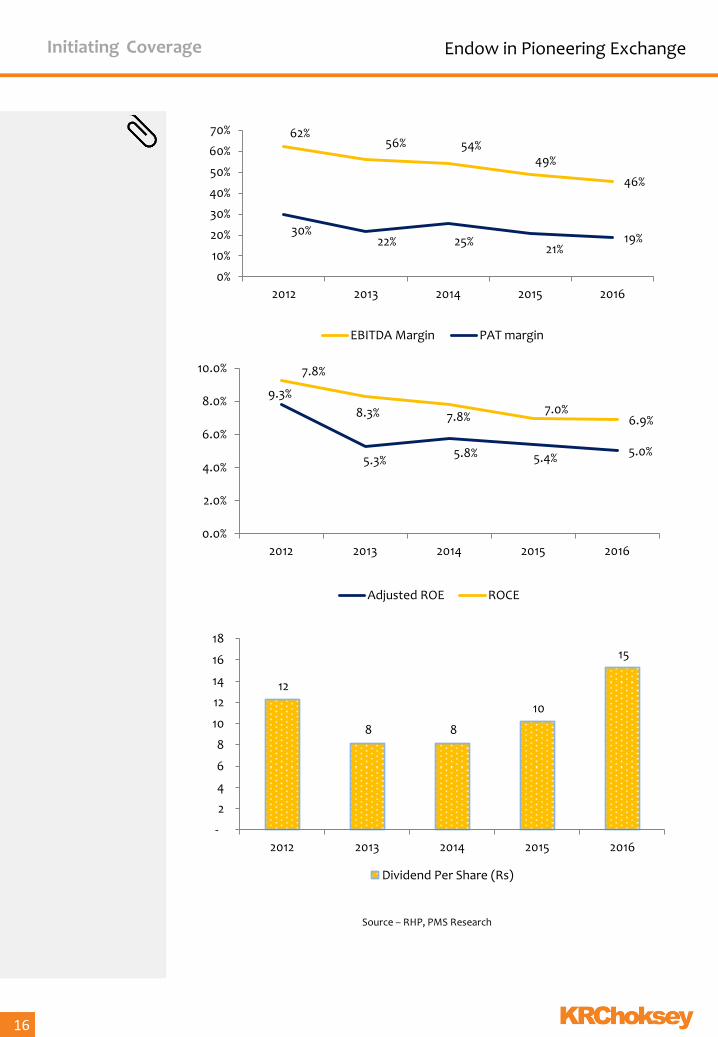
Financial Review BSE’s revenue from operations (comprising of securities services, services to
corporate and data dissemination fees), income from investments and deposits and
other income comprised of 63.2%, 29% & 7.9% of its total revenue, respectively in
1HFY17.
For FY16, total revenue of BSE was Rs.6583 mn, up 5.4% YoY compared with
Rs.6248mn in FY15 led by increase in certain charges and listing fees. From FY12-16,
BSE clocked revenue growth at 3.3% CAGR from FY12-16 while PAT was at Rs.1592 mn
in FY16. BSE has clocked revenue growth (excluding other income) at 3.5% CAGR in
FY12-16 to Rs.6160 mn.
EBITDA for FY16 was Rs.3005mn with 46% margin. Depreciation, finance cost, and tax
expenses for the period were Rs.617 mn, 7 mn, and 324 mn respectively.
Net profit, after share of minority and share of loss of associate, was at Rs.1225 mn as
on FY16, comparatively lower from FY15 net profit of Rs.1297mn with 21% margin.
Profit was low due to contribution of 25% of annual profits of BSE to the Core
Settlement Guarantee fund maintained by the ICCL, which is a SEBI requirement. This
contribution was required until Aug 29, 2016. For H1FY17, total revenue was Rs.3835
mn with EBITDA of Rs.1931 mn (50% margin). Net profit was Rs.1049 mn with 27%
margins.
Thus revenue growth is flat while profits have fallen, with NSE fast gaining market
share in various segments. But we can see there is a recovery in earnings in H1 FY17.
RoE and RoCE as on FY16 were in single digit at 5% and 8.2%, respectively.
The current dividend yield is 1.89% in 2016 which is moderate. BSE distributes 80% of
its adj. profits as dividend and plans to continue with the high dividend in the future.
BSE has a bank balance of Rs. 1,692 cr. which translates into Rs 310 as cash/share.
Investment Rationale
15
5787 5529 5298
6248 6583
0
1000
2000
3000
4000
5000
6000
7000
FY12 FY13 FY14 FY15 FY16
Total Income (Rs in Mn)
Source – RHP, PMS Research
Initiating Coverage Endow in Pioneering Exchange
Investment Rationale
16
12
8 8
10
15
-
2
4
6
8
10
12
14
16
18
2012 2013 2014 2015 2016
Dividend Per Share (Rs)
Source – RHP, PMS Research
62% 56% 54%
49%
46%
30% 22% 25%
21% 19%
0%
10%
20%
30%
40%
50%
60%
70%
2012 2013 2014 2015 2016
EBITDA Margin PAT margin
7.8%
5.3% 5.8% 5.4% 5.0%
9.3%
8.3% 7.8% 7.0%
6.9%
0.0%
2.0%
4.0%
6.0%
8.0%
10.0%
2012 2013 2014 2015 2016
Adjusted ROE ROCE
Initiating Coverage Endow in Pioneering Exchange
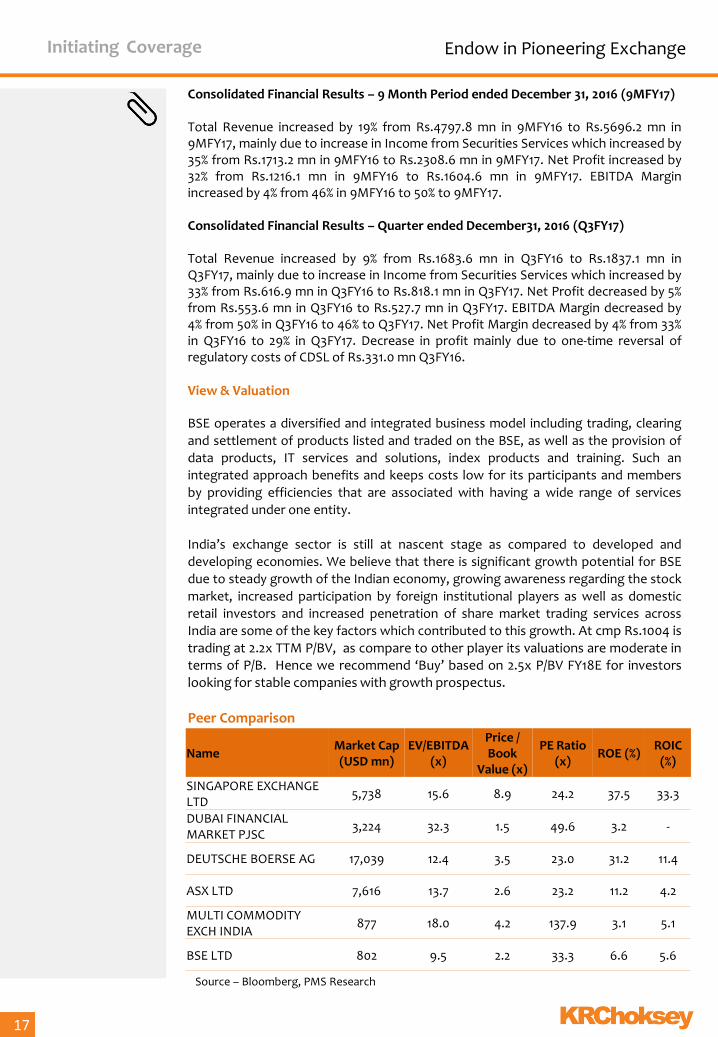
Consolidated Financial Results – 9 Month Period ended December 31, 2016 (9MFY17) Total Revenue increased by 19% from Rs.4797.8 mn in 9MFY16 to Rs.5696.2 mn in 9MFY17, mainly due to increase in Income from Securities Services which increased by 35% from Rs.1713.2 mn in 9MFY16 to Rs.2308.6 mn in 9MFY17. Net Profit increased by 32% from Rs.1216.1 mn in 9MFY16 to Rs.1604.6 mn in 9MFY17. EBITDA Margin increased by 4% from 46% in 9MFY16 to 50% to 9MFY17. Consolidated Financial Results – Quarter ended December31, 2016 (Q3FY17) Total Revenue increased by 9% from Rs.1683.6 mn in Q3FY16 to Rs.1837.1 mn in Q3FY17, mainly due to increase in Income from Securities Services which increased by 33% from Rs.616.9 mn in Q3FY16 to Rs.818.1 mn in Q3FY17. Net Profit decreased by 5% from Rs.553.6 mn in Q3FY16 to Rs.527.7 mn in Q3FY17. EBITDA Margin decreased by 4% from 50% in Q3FY16 to 46% to Q3FY17. Net Profit Margin decreased by 4% from 33% in Q3FY16 to 29% in Q3FY17. Decrease in profit mainly due to one-time reversal of regulatory costs of CDSL of Rs.331.0 mn Q3FY16. View & Valuation BSE operates a diversified and integrated business model including trading, clearing
and settlement of products listed and traded on the BSE, as well as the provision of
data products, IT services and solutions, index products and training. Such an
integrated approach benefits and keeps costs low for its participants and members
by providing efficiencies that are associated with having a wide range of services
integrated under one entity.
India’s exchange sector is still at nascent stage as compared to developed and
developing economies. We believe that there is significant growth potential for BSE
due to steady growth of the Indian economy, growing awareness regarding the stock
market, increased participation by foreign institutional players as well as domestic
retail investors and increased penetration of share market trading services across
India are some of the key factors which contributed to this growth. At cmp Rs.1004 is trading at 2.2x TTM P/BV, as compare to other player its valuations are moderate in terms of P/B. Hence we recommend ‘Buy’ based on 2.5x P/BV FY18E for investors looking for stable companies with growth prospectus.
Peer Comparison
Investment Rationale
17
Name Market Cap (USD mn)
EV/EBITDA (x)
Price / Book
Value (x)
PE Ratio (x)
ROE (%) ROIC
(%)
SINGAPORE EXCHANGE LTD
5,738 15.6 8.9 24.2 37.5 33.3
DUBAI FINANCIAL MARKET PJSC
3,224 32.3 1.5 49.6 3.2 -
DEUTSCHE BOERSE AG 17,039 12.4 3.5 23.0 31.2 11.4
ASX LTD 7,616 13.7 2.6 23.2 11.2 4.2
MULTI COMMODITY EXCH INDIA
877 18.0 4.2 137.9 3.1 5.1
BSE LTD 802 9.5 2.2 33.3 6.6 5.6
Source – Bloomberg, PMS Research
Initiating Coverage Endow in Pioneering Exchange
Profit & Loss Statement
Investment Rationale
18
Particulars ( Rs in Mn) FY13 FY14 FY15 FY16 H1FY17
Income
Total income 5,529 5,298 6,248 6,583 3,835
Expenses
Employee benefits expense 772 854 999 1,116 640
Administration and Other Expenses 1,648 1,570 2,196 2,462 1,264
Total expenses 2,421 2,424 3,194 3,578 1,904
EBITDA 3,109 2,875 3,053 3,005 1,931
Depreciation and amortisation expense
283 324 588 617 246
Finance Costs 25 4 7 7 6
Profit before exceptional Items 2,801 2,547 2,459 2,382 1,679
Exceptional Items :
Total Exceptional Items 979 613 508 466 208
Extraordinary Items 5 6 - - -
Profit before exceptional item and tax
1,817 1,929 1,951 1,916 1,471
Tax expense 377 340 438 324 224
Profit after Tax 1,440 1,589 1,514 1,592 1,248
Share of Minority 249 244 213 364 198
Share of Loss of Associate 4 3 4 3 3
Consolidated Profit after Tax 1,196 1,348 1,304 1,231 1,047
Equity share capital 104 104 107 107 107
Face Value 2.0 2.0 2.0 2.0 2.0
EPS 23.1 26.0 24.3 22.9 19.5
Initiating Coverage Endow in Pioneering Exchange
Investment Rationale
19
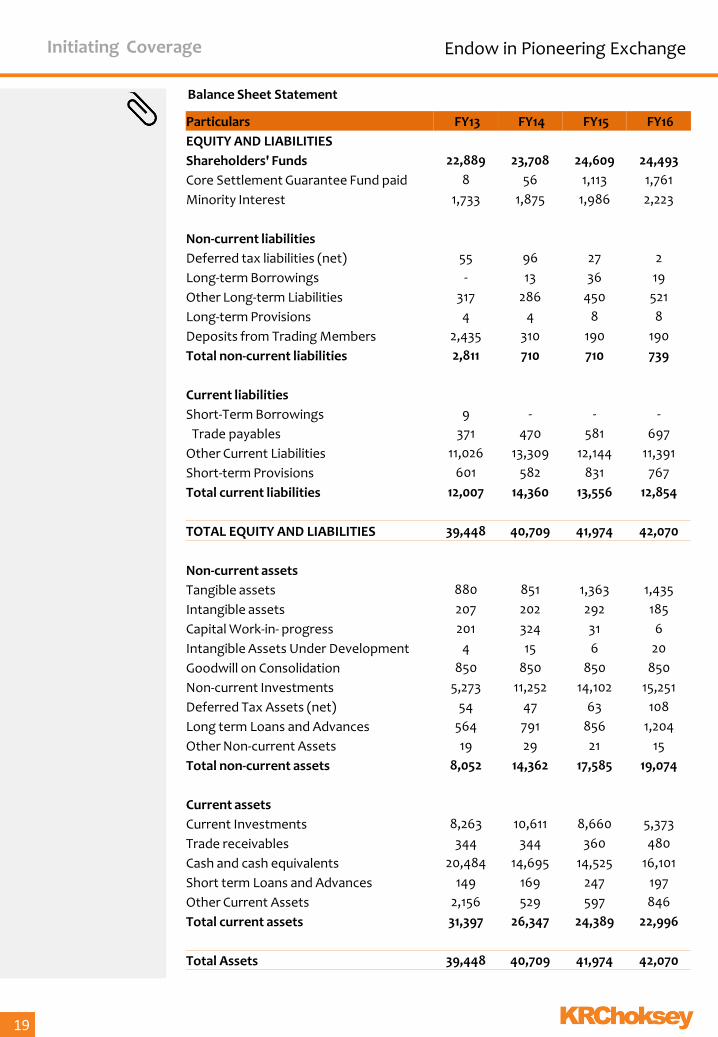
Balance Sheet Statement
Particulars FY13 FY14 FY15 FY16
EQUITY AND LIABILITIES
Shareholders' Funds 22,889 23,708 24,609 24,493
Core Settlement Guarantee Fund paid 8 56 1,113 1,761
Minority Interest 1,733 1,875 1,986 2,223
Non-current liabilities
Deferred tax liabilities (net) 55 96 27 2
Long-term Borrowings - 13 36 19
Other Long-term Liabilities 317 286 450 521
Long-term Provisions 4 4 8 8
Deposits from Trading Members 2,435 310 190 190
Total non-current liabilities 2,811 710 710 739
Current liabilities
Short-Term Borrowings 9 - - -
Trade payables 371 470 581 697
Other Current Liabilities 11,026 13,309 12,144 11,391
Short-term Provisions 601 582 831 767
Total current liabilities 12,007 14,360 13,556 12,854
TOTAL EQUITY AND LIABILITIES 39,448 40,709 41,974 42,070
Non-current assets
Tangible assets 880 851 1,363 1,435
Intangible assets 207 202 292 185
Capital Work-in- progress 201 324 31 6
Intangible Assets Under Development 4 15 6 20
Goodwill on Consolidation 850 850 850 850
Non-current Investments 5,273 11,252 14,102 15,251
Deferred Tax Assets (net) 54 47 63 108
Long term Loans and Advances 564 791 856 1,204
Other Non-current Assets 19 29 21 15
Total non-current assets 8,052 14,362 17,585 19,074
Current assets
Current Investments 8,263 10,611 8,660 5,373
Trade receivables 344 344 360 480
Cash and cash equivalents 20,484 14,695 14,525 16,101
Short term Loans and Advances 149 169 247 197
Other Current Assets 2,156 529 597 846
Total current assets 31,397 26,347 24,389 22,996
Total Assets 39,448 40,709 41,974 42,070
Initiating Coverage Endow in Pioneering Exchange
Cash Flow Statement
Investment Rationale
20
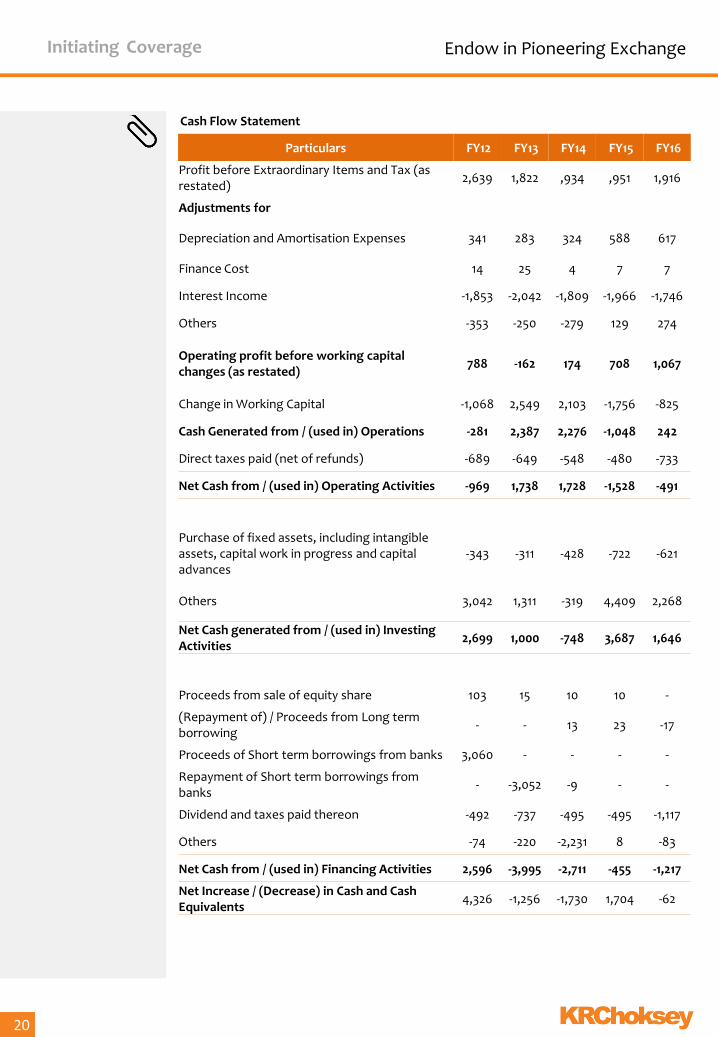
Particulars FY12 FY13 FY14 FY15 FY16
Profit before Extraordinary Items and Tax (as restated)
2,639 1,822 ,934 ,951 1,916
Adjustments for
Depreciation and Amortisation Expenses 341 283 324 588 617
Finance Cost 14 25 4 7 7
Interest Income -1,853 -2,042 -1,809 -1,966 -1,746
Others -353 -250 -279 129 274
Operating profit before working capital changes (as restated)
788 -162 174 708 1,067
Change in Working Capital -1,068 2,549 2,103 -1,756 -825
Cash Generated from / (used in) Operations -281 2,387 2,276 -1,048 242
Direct taxes paid (net of refunds) -689 -649 -548 -480 -733
Net Cash from / (used in) Operating Activities -969 1,738 1,728 -1,528 -491
Purchase of fixed assets, including intangible assets, capital work in progress and capital advances
-343 -311 -428 -722 -621
Others 3,042 1,311 -319 4,409 2,268
Net Cash generated from / (used in) Investing Activities
2,699 1,000 -748 3,687 1,646
Proceeds from sale of equity share 103 15 10 10 -
(Repayment of) / Proceeds from Long term borrowing
- - 13 23 -17
Proceeds of Short term borrowings from banks 3,060 - - - -
Repayment of Short term borrowings from banks
- -3,052 -9 - -
Dividend and taxes paid thereon -492 -737 -495 -495 -1,117
Others -74 -220 -2,231 8 -83
Net Cash from / (used in) Financing Activities 2,596 -3,995 -2,711 -455 -1,217
Net Increase / (Decrease) in Cash and Cash Equivalents
4,326 -1,256 -1,730 1,704 -62
Initiating Coverage Endow in Pioneering Exchange
Investment Rationale
21
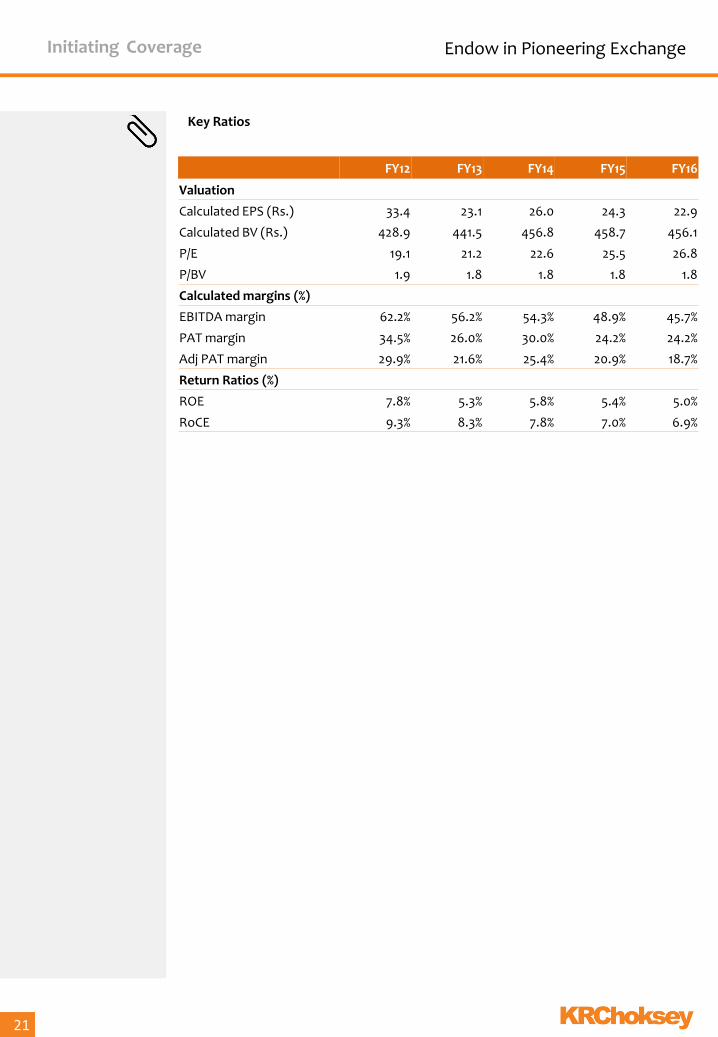
Key Ratios
FY12 FY13 FY14 FY15 FY16
Valuation
Calculated EPS (Rs.) 33.4 23.1 26.0 24.3 22.9
Calculated BV (Rs.) 428.9 441.5 456.8 458.7 456.1
P/E 19.1 21.2 22.6 25.5 26.8
P/BV 1.9 1.8 1.8 1.8 1.8
Calculated margins (%)
EBITDA margin 62.2% 56.2% 54.3% 48.9% 45.7%
PAT margin 34.5% 26.0% 30.0% 24.2% 24.2%
Adj PAT margin 29.9% 21.6% 25.4% 20.9% 18.7%
Return Ratios (%)
ROE 7.8% 5.3% 5.8% 5.4% 5.0%
RoCE 9.3% 8.3% 7.8% 7.0% 6.9%
Initiating Coverage Endow in Pioneering Exchange
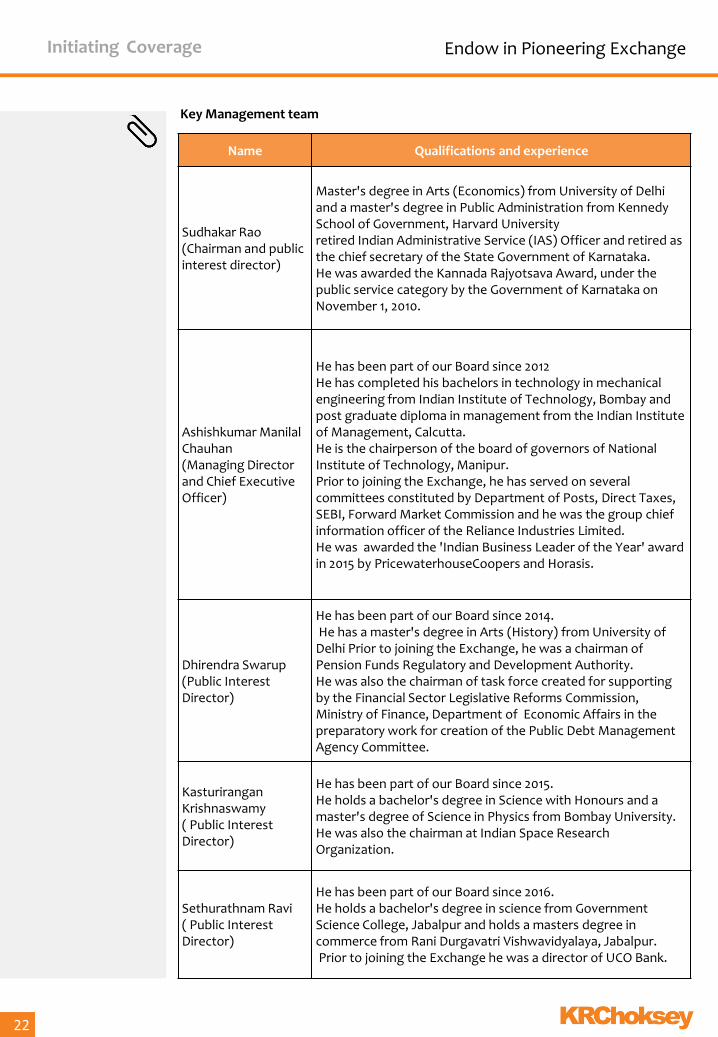
Name Qualifications and experience
Sudhakar Rao (Chairman and public interest director)
Master's degree in Arts (Economics) from University of Delhi and a master's degree in Public Administration from Kennedy School of Government, Harvard University retired Indian Administrative Service (IAS) Officer and retired as the chief secretary of the State Government of Karnataka. He was awarded the Kannada Rajyotsava Award, under the public service category by the Government of Karnataka on November 1, 2010.
Ashishkumar Manilal Chauhan (Managing Director and Chief Executive Officer)
He has been part of our Board since 2012 He has completed his bachelors in technology in mechanical engineering from Indian Institute of Technology, Bombay and post graduate diploma in management from the Indian Institute of Management, Calcutta. He is the chairperson of the board of governors of National Institute of Technology, Manipur. Prior to joining the Exchange, he has served on several committees constituted by Department of Posts, Direct Taxes, SEBI, Forward Market Commission and he was the group chief information officer of the Reliance Industries Limited. He was awarded the 'Indian Business Leader of the Year' award in 2015 by PricewaterhouseCoopers and Horasis.
Dhirendra Swarup (Public Interest Director)
He has been part of our Board since 2014. He has a master's degree in Arts (History) from University of Delhi Prior to joining the Exchange, he was a chairman of Pension Funds Regulatory and Development Authority. He was also the chairman of task force created for supporting by the Financial Sector Legislative Reforms Commission, Ministry of Finance, Department of Economic Affairs in the preparatory work for creation of the Public Debt Management Agency Committee.
Kasturirangan Krishnaswamy ( Public Interest Director)
He has been part of our Board since 2015. He holds a bachelor's degree in Science with Honours and a master's degree of Science in Physics from Bombay University. He was also the chairman at Indian Space Research Organization.
Sethurathnam Ravi ( Public Interest Director)
He has been part of our Board since 2016. He holds a bachelor's degree in science from Government Science College, Jabalpur and holds a masters degree in commerce from Rani Durgavatri Vishwavidyalaya, Jabalpur. Prior to joining the Exchange he was a director of UCO Bank.
Key Management team
Investment Rationale
22
Initiating Coverage Endow in Pioneering Exchange
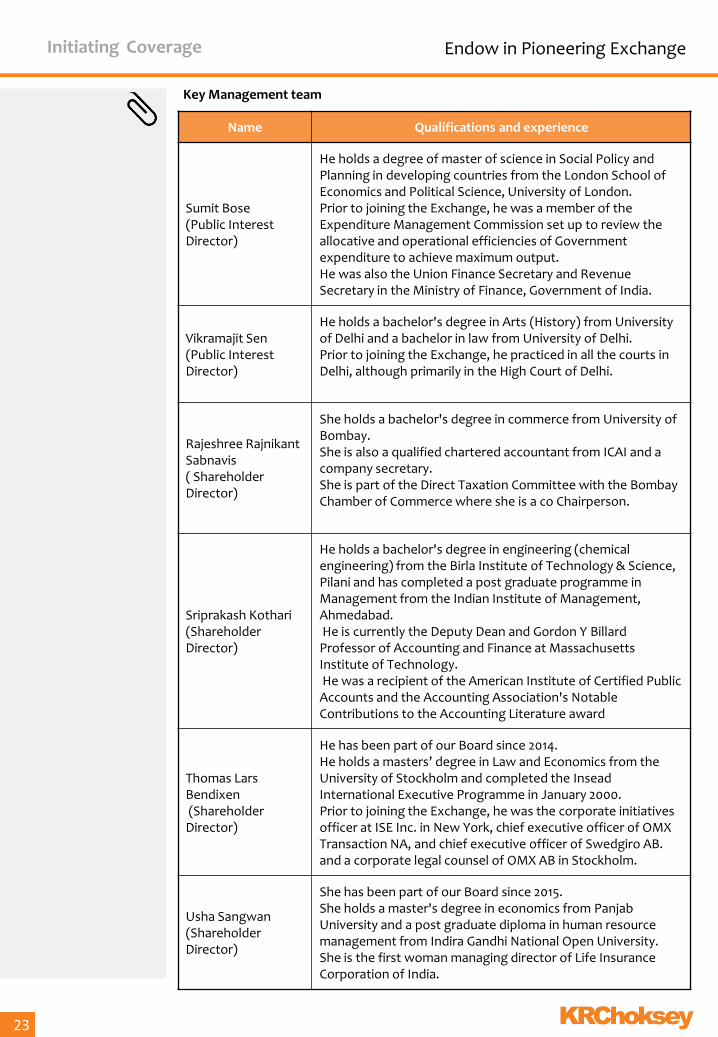
Name Qualifications and experience
Sumit Bose (Public Interest Director)
He holds a degree of master of science in Social Policy and Planning in developing countries from the London School of Economics and Political Science, University of London. Prior to joining the Exchange, he was a member of the Expenditure Management Commission set up to review the allocative and operational efficiencies of Government expenditure to achieve maximum output. He was also the Union Finance Secretary and Revenue Secretary in the Ministry of Finance, Government of India.
Vikramajit Sen (Public Interest Director)
He holds a bachelor's degree in Arts (History) from University of Delhi and a bachelor in law from University of Delhi. Prior to joining the Exchange, he practiced in all the courts in Delhi, although primarily in the High Court of Delhi.
Rajeshree Rajnikant Sabnavis ( Shareholder Director)
She holds a bachelor's degree in commerce from University of Bombay. She is also a qualified chartered accountant from ICAI and a company secretary. She is part of the Direct Taxation Committee with the Bombay Chamber of Commerce where she is a co Chairperson.
Sriprakash Kothari (Shareholder Director)
He holds a bachelor's degree in engineering (chemical engineering) from the Birla Institute of Technology & Science, Pilani and has completed a post graduate programme in Management from the Indian Institute of Management, Ahmedabad. He is currently the Deputy Dean and Gordon Y Billard Professor of Accounting and Finance at Massachusetts Institute of Technology. He was a recipient of the American Institute of Certified Public Accounts and the Accounting Association's Notable Contributions to the Accounting Literature award
Thomas Lars Bendixen (Shareholder Director)
He has been part of our Board since 2014. He holds a masters’ degree in Law and Economics from the University of Stockholm and completed the Insead International Executive Programme in January 2000. Prior to joining the Exchange, he was the corporate initiatives officer at ISE Inc. in New York, chief executive officer of OMX Transaction NA, and chief executive officer of Swedgiro AB. and a corporate legal counsel of OMX AB in Stockholm.
Usha Sangwan (Shareholder Director)
She has been part of our Board since 2015. She holds a master's degree in economics from Panjab University and a post graduate diploma in human resource management from Indira Gandhi National Open University. She is the first woman managing director of Life Insurance Corporation of India.
Key Management team
Investment Rationale
23
Initiating Coverage Endow in Pioneering Exchange
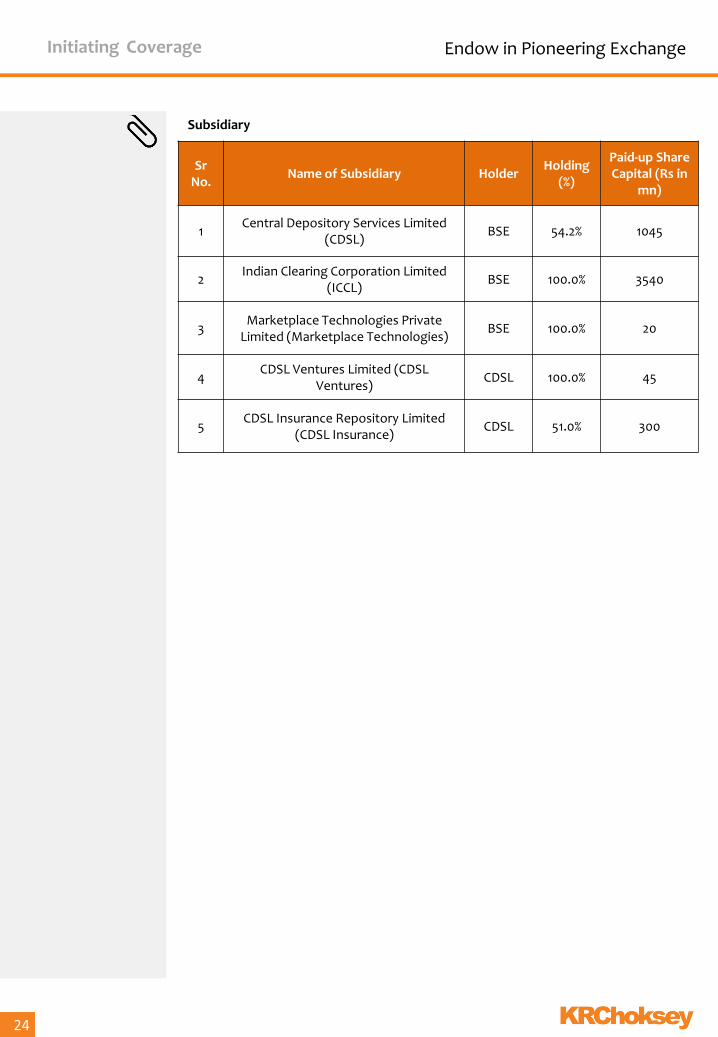
Sr No.
Name of Subsidiary Holder Holding
(%)
Paid-up Share Capital (Rs in
mn)
1 Central Depository Services Limited
(CDSL) BSE 54.2% 1045
2 Indian Clearing Corporation Limited
(ICCL) BSE 100.0% 3540
3 Marketplace Technologies Private
Limited (Marketplace Technologies) BSE 100.0% 20
4 CDSL Ventures Limited (CDSL
Ventures) CDSL 100.0% 45
5 CDSL Insurance Repository Limited
(CDSL Insurance) CDSL 51.0% 300
Subsidiary
Investment Rationale
24
Initiating Coverage Endow in Pioneering Exchange
Disclaimer
022-6696 5555 www.krchoksey.com
KRChoksey Research is also available on Bloomberg KRCS<GO>
Thomson Reuters, Factset and Capital IQ
Analyst Dinesh Gupta, [email protected], 022 66965609
25
We, Dinesh Gupta (B.com, M.Sc), research analyst, author and the name subscribed to this report, hereby certify that all of the views expressed in this research report accurately reflect my views about the subject issuer(s) or securities. I also certify that no part of our compensation was, is, or will be directly or indirectly related to the specific recommendation(s) or view(s) in this report. Terms & Conditions and other disclosures: KRChoksey Shares and Securities Pvt. Ltd (hereinafter referred to as KRCSSPL) is a registered member of National Stock Exchange of India Limited, Bombay Stock Exchange Limited and MCX Stock Exchange Limited. KRCSSPL is a registered Research Entity vide SEBI Registration No. INH000001295 under SEBI (Research Analyst) Regulations, 2014. We submit that no material disciplinary action has been taken on KRCSSPL and its associates (Group Companies) by any Regulatory Authority impacting Equity Research Analysis activities. KRCSSPL prohibits its analysts, persons reporting to analysts and their relatives from maintaining a financial interest in the securities or derivatives of any companies that the analyst covers. The information and opinions in this report have been prepared by KRCSSPL and are subject to change without any notice. The report and information contained herein is strictly confidential and meant solely for the selected recipient and may not be altered in any way, transmitted to, copied or distributed, in part or in whole, to any other person or to the media or reproduced in any form, without prior written consent of KRCSSPL. While we would endeavor to update the information herein on a reasonable basis, KRCSSPL is not under any obligation to update the information. Also, there may be regulatory, compliance or other reasons that may prevent KRCSSPL from doing so. Non-rated securities indicate that rating on a particular security has been suspended temporarily and such suspension is in compliance with applicable regulations and/or KRCSSPL policies, in circumstances where KRCSSPL might be acting in an advisory capacity to this company, or in certain other circumstances. This report is based on information obtained from public sources and sources believed to be reliable, but no independent verification has been made nor is its accuracy or completeness guaranteed. This report and information herein is solely for informational purpose and shall not be used or considered as an offer document or solicitation of offer to buy or sell or subscribe for securities or other financial instruments. Though disseminated to all the customers simultaneously, not all customers may receive this report at the same time. KRCSSPL will not treat recipients as customers by virtue of their receiving this report. Nothing in this report constitutes investment, legal, accounting and tax advice or a representation that any investment or strategy is suitable or appropriate to your specific circumstances. The securities discussed and opinions expressed in this report may not be suitable for all investors, who must make their own investment decisions, based on their own investment objectives, financial positions and needs of specific recipient. This may not be taken in substitution for the exercise of independent judgment by any recipient. The recipient should independently evaluate the investment risks. The value and return on investment may vary because of changes in interest rates, foreign exchange rates or any other reason. KRCSSPL accepts no liabilities whatsoever for any loss or damage of any kind arising out of the use of this report. Past performance is not necessarily a guide to future performance. Investors are advised to see Risk Disclosure Document to understand the risks associated before investing in the securities markets. Actual results may differ materially from those set forth in projections. Forward-looking statements are not predictions and may be subject to change without notice. Our employees in sales and marketing team, dealers and other professionals may provide oral or written market commentary or trading strategies that reflect opinions that are contrary to the opinions expressed herein, .In reviewing these materials, you should be aware that any or all of the foregoing, among other things, may give rise to real or potential conflicts of interest.
ANALYST CERTIFICATION:
022-6696 5555 www.krchoksey.com
KRChoksey Research is also available on Bloomberg KRCS<GO>
Thomson Reuters, Factset and Capital IQ
Analyst Dinesh Gupta, [email protected], 022 66965609
Disclaimer
26
Associates (Group Companies) of KRCSSPL might have received any commission/compensation from the companies mentioned in the report during the period preceding twelve months from the date of this report for services in respect of brokerage services or specific transaction or for products and services other than brokerage services. KRCSSPL or its Associates (Group Companies) have not managed or co-managed public offering of securities for the subject company in the past twelve months KRCSSPL encourages the practice of giving independent opinion in research report preparation by the analyst and thus strives to minimize the conflict in preparation of research report. KRCSSPL or its analysts did not receive any compensation or other benefits from the companies mentioned in the report or third party in connection with preparation of the research report. Accordingly, neither KRCSSPL nor Research Analysts have any material conflict of interest at the time of publication of this report. It is confirmed that, Dinesh Gupta (B.com, M.Sc), research analyst, of this report have not received any compensation from the companies mentioned in the report in the preceding twelve months. Compensation of our Research Analysts is not based on any specific brokerage service transactions. KRCSSPL or its associates (Group Companies) collectively or its research analyst do not hold any financial interest/beneficial ownership of more than 1% (at the end of the month immediately preceding the date of publication of the research report) in the company covered by Analyst, and has not been engaged in market making activity of the company covered by research analyst. Since associates (Group Companies) of KRCSSPL are engaged in various financial service businesses, they might have financial interests or beneficial ownership in various companies including the subject company/companies mentioned in this report. It is confirmed that, Dinesh Gupta (B.com, M.Sc), research analyst, do not serve as an officer, director or employee of the companies mentioned in the report. This report is not directed or intended for distribution to, or use by, any person or entity who is a citizen or resident of or located in any locality, state, country or other jurisdiction, where such distribution, publication, availability or use would be contrary to law, regulation or which would subject KRCSSPL and affiliates to any registration or licensing requirement within such jurisdiction. The securities described herein may or may not be eligible for sale in all jurisdictions or to certain category of investors. Persons in whose possession this document may come are required to inform themselves of and to observe such restriction.
Please send your feedback to [email protected] Visit us at www.krchoksey.com
Kisan Ratilal Choksey Shares and Securities Pvt. Ltd
Registered Office: 1102, Stock Exchange Tower, Dalal Street, Fort, Mumbai – 400 001.
Phone: 91-22-6633 5000; Fax: 91-22-6633 8060. Corporate Office:
ABHISHEK, 5th Floor, Link Road, Andheri (W), Mumbai – 400 053. Phone: 91-22-6696 5555; Fax: 91-22-6691 9576.


![CHALLAN-DEC.pdf n/epfopaymentbilldeskresponse.htm Pay EPFO Exit 15-Jan-2016 [01:52 PM IST] State Bank Co ect state Bank MOPS Pay EPFO > Pay EPFO You are here: Pay EPFO Cancel Pending](https://img.pdfslide.net/doc/110x75/5aefb4e07f8b9ac2468d2bba/challan-decpdf-nepfopaymentbilldeskresponsehtm-pay-epfo-exit-15-jan-2016-0152.jpg)