Embed Size (px)
Citation preview
2
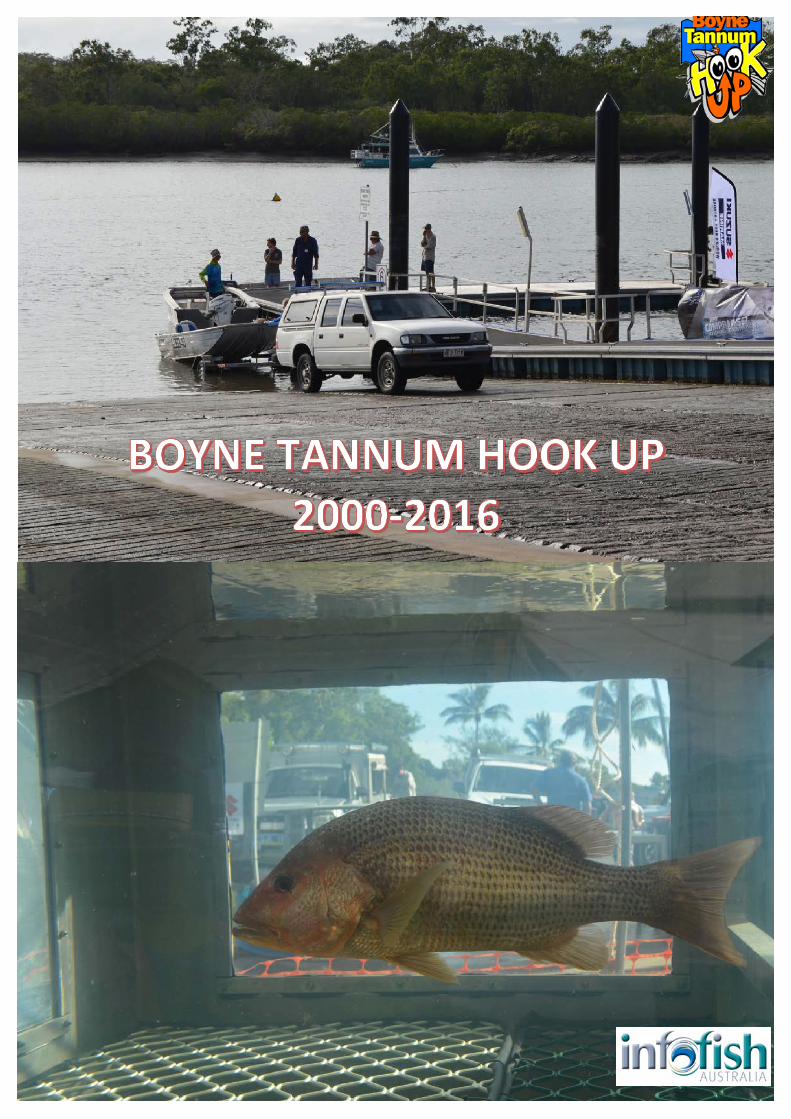
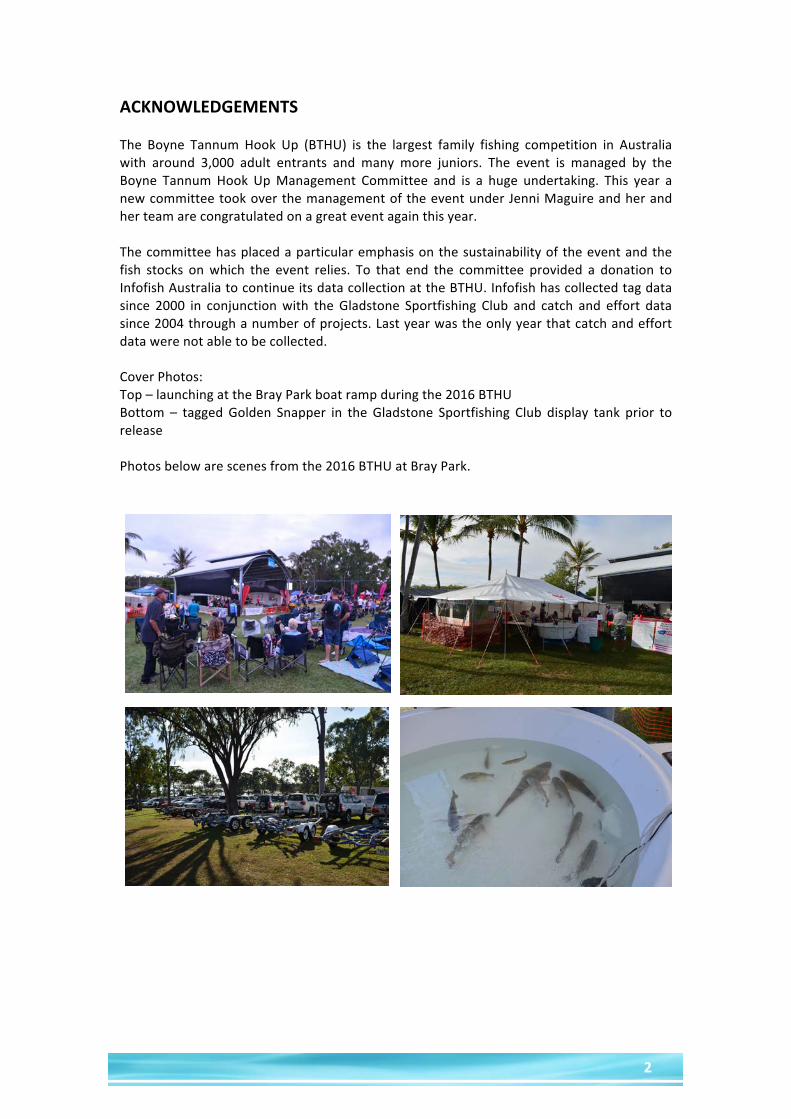
ACKNOWLEDGEMENTSThe Boyne Tannum Hook Up (BTHU) is the largest family fishing competition in Australiawith around 3,000 adult entrants and many more juniors. The event is managed by theBoyne TannumHook UpManagement Committee and is a huge undertaking. This year anewcommitteetookoverthemanagementoftheeventunderJenniMaguireandherandherteamarecongratulatedonagreateventagainthisyear.Thecommitteehasplacedaparticularemphasisonthesustainabilityoftheeventandthefish stocks onwhich the event relies. To that end the committee provided a donation toInfofishAustraliatocontinueitsdatacollectionattheBTHU.Infofishhascollectedtagdatasince 2000 in conjunctionwith theGladstone Sportfishing Club and catch and effort datasince2004throughanumberofprojects.Lastyearwastheonlyyearthatcatchandeffortdatawerenotabletobecollected.CoverPhotos:Top–launchingattheBrayParkboatrampduringthe2016BTHUBottom – taggedGolden Snapper in theGladstone Sportfishing Club display tank prior toreleasePhotosbelowarescenesfromthe2016BTHUatBrayPark.
3
BOYNETANNUMHOOKUP2000-2016REPORTThis report has been prepared by Infofish Australia for the Boyne Tannum Hook UpCommittee–May2016.SCOPE Thisreportexamines:
ª Changeinestuarycatchratesfrom2007-2016ª Speciescompositioninthecatchª Dispersaloftaggedfishreleasedfrom2000-2016ª Sizecompositionoffishweighedliveandtagged
DATASOURCESDatacollectedattheBoyneTannumHookUp:
ª CatchandeffortboatrampsurveysforestuarytripsbyInfofishAustraliafrom2007-2016
ª Taggingdatafromliveweigh-inbyGladstoneSportfishingClubfrom2000-2016ª DataarestoredintheInfofishAustraliadatabaseathttp://qld.info-fish.net.
BACKGROUNDThe Boyne TannumHook Up celebrated its 21st birthday in 2016. It has grown to be thelargestfishingcompetitioninAustraliawithacurrentcapof3,000adultentrants.Theeventhas its headquarters at Bray Park near themouthof theBoyneRiver.While there arenofishing boundaries most of the estuary fishing occurs from the Narrows in the north toRoddsHarbour(TurkeyBeach)inthesouth.Thereareanumberoffishingcategoriesincludingaliveweigh-insectionthatismanagedbytheGladstoneSportfishingClubwhichcommencedin2000.InfofishAustraliahasalsocollectedcatchandeffortdatathroughboatrampsurveyssince2004.From2004-2006thefocuswascollectingdataonoffshoretripsthroughtheCapReefproject. From2007-2014 the focus shifted to estuary trips through CapReef and later theGladfishproject.Noboatrampsurveyswereconductedin2015.In2016thefocusremainedonestuarytripswithanemphasisonBreamasYellowfinBreamandPikeyBreamrecruitmentwereselectedasthefish indicatorfortheGladstoneHealthyHarbourPartnership.
4
METHODSBoatrampsurveyswereundertakenattheBrayParkrampandotherkeyboatrampsintheGladstoneareatoobtaindetailsofcatchandeffort.Surveyswerealsoconductedattheliveweigh-instationasthisprovideddatafromalloverthefishingarea.Boatrampsurveyscollectedthefollowingdetails:
ª Dateoftripª Startandfinishtimesofthetrip(timeleavingboatrampandreturn)ª Forlandbasedtripsthefishingtimewasrecordedª Speciesbynumberkeptandnumberreleasedª Lengthswererecordedwhereprovided
Data from boat ramp surveyswere analysis to determine the catch rate for estuary tripseach year. Catch rates were calculated as fish caught/hour and fish kept/hour (total triptime) foreachyear’s event.Catch rateswere then converted toa standard fishing trip sothatavalidcomparisoncouldbemadebetweencatchandeffortforeachyear.
Standardfishingtrip=AveragenumberoffishersxaveragefishingtimeFor2016anadditionalanalysiswasundertakentocompareresultsoverthe3days,overalland forkeyspeciesBream,FlatheadandWhiting.Species in thecatchwereaggregatedatthegrouplevelastherewaslikelytobesomemisidentificationofactualspecies.The aggregated Bream data included Yellowfin Bream, Pikey Bream and Tarwhine. Theaggregateddata forFlathead includedDuskyFlathead,BartailFlathead.RockFlatheadandother Flathead (not specified). The aggregated data for Whiting included Sand Whiting,GoldenlineWhiting,NorthernWhiting,WinterWhitingandWhiting(notspecified).AsBreamrecruitmenthasbeenadoptedfor theGladstoneHealthyHarborPartnership fortheReportCardon thehealthofGladstoneHarbourand surroundscatch rates forBreamoverthedatacollectionperiodwerealsocalculated.Anadditionalanalysiswasundertakenofcatchratesbylocation.CatchratesfortheBoyneRiverandSouthTrees inlet (SuntaggridmapBRG)werecomparedwithcatch rates forallotherlocations.Total estuary trips were estimated to determine the overall fishing effort. Trailer countswereundertakenatkeyboatrampseachdayandthencorrectedtototaltripsperdayusinga correction factor calculated during the Gladfish project. For other ramps from RamsayCrossing at the Narrow in the north to Turkey Beach in the south the number of tripsrecordedfromthoserampsduringboatrampsurveyswereused.AnestimatewasthenmadeofthepercentageofthosetripsthatwereassociatedwithBTHUestuarytripsbasedontheweather(windspeed)andpercentageoflargertrailers(usedforoffshore fishing). Landbased tripswerealsoestimatedandcorrected to total tripsperdayusingacorrectionfactorcalculatedduringtheGladfishproject.The species composition of the catch from boat ramp surveys in 2016 was assessed todeterminethemostcaughtandkeptspecies.Locationswererecordedbasedonriver,creekorharboursothatanassessmentoflocationsfishedcouldbemade.

5
Datacollectedatboatrampssurveysincludedthehometownoffishersundertakingfishingtrips. Where fishers came from different home towns the home town of the boatowner/skipperwas recorded. Itwasnoted that inmany instances theboatowner/skipperwasalocalwithfamilymembersorfriendsfromothercentres.Astripswererecordedover3daysmanyfishersweresurveyedmorethanoncesothatthehometownfortripsreflectsthenumberoftripsbyfishersfromthosecentres.Theliveweigh-insectioninvolveslegalsizebeingbroughtinlivetotheheadquartersatBrayParkwheretheyaremeasured,weighedandtagged.Theywerethenplacedindisplaytankswhere their recovery can be monitored. They were then released at the Bray Park boatramp. Recaptures of these fish are then recorded to determine dispersal of fish from thereleasesite.Fish lengths were obtained from tag records and an analysis of size range of fish wasundertakenforBreamandFlathead.KEYFISHINGAREAThere are no fishing boundaries for fishing in the BTHU however much of the fishing iscarriedoutfromtheNarrowsinnorthtoRoddsHarbourinthesouth.Figure1showsthekeyfishingareasaroundGladstonewheremostestuaryfishersfishedintheBTHU.
Figure1:MainestuaryfishingareafishedintheBTHUin2016
6
SOMEOBSERVATIONSBasedonthedatacollectedintheBTHUin2016andfrom2000-2016:
ª Catchandefforthasbeenobtainedthroughboatrampsurveyseachyearovera10yeartimespanfrom2007-2016(except2015).
ª Fromboatrampsurveysthenumbersoffishcaughtrangedfrom572(169surveys)in2011to3,316(459surveys)in2013.
ª Catchrates for fishcaughtand forBreamcaughthave trendedupwardsover timewhilethecatchrateforkeptfishhastrendeddownwards.
ª Catch rates in 2016 for fish caught and for Bream caughtwere the highest in thepast10years(nodatain2015).
ª Catchratesin2016declinedoverthe3daysofthecompetition.ª YellowfinBreamcomprised35.5%ofthecatchfollowedbyGoldspottedRockcodat
14.9%andBarredJavelinat7.9%.ª FishersfromGladstoneandsurroundsfromBoyneIslandtoBenarabytoCalliopeto
Yarwunaccountedfor73.1%oftripsand63.0%oftripsweretotheBoyneRiverandSouthTreesInlet.
ª Liveweigh-inoffishandtagginghasoccurredfrom2000-2016.ª The average recapture rate from 2000-2016 was 5.0% and ranged from a low of
3.1%in2004toahighof8.3%in2001.ª For recaptures 77.2% were made within 6 months, 95.1% were recaptured were
within20kmand54.4%werewithin2km.ª Forfishtagged26.4%ofYellowfinBreamwereinthesizerange260:279mm,29.0%
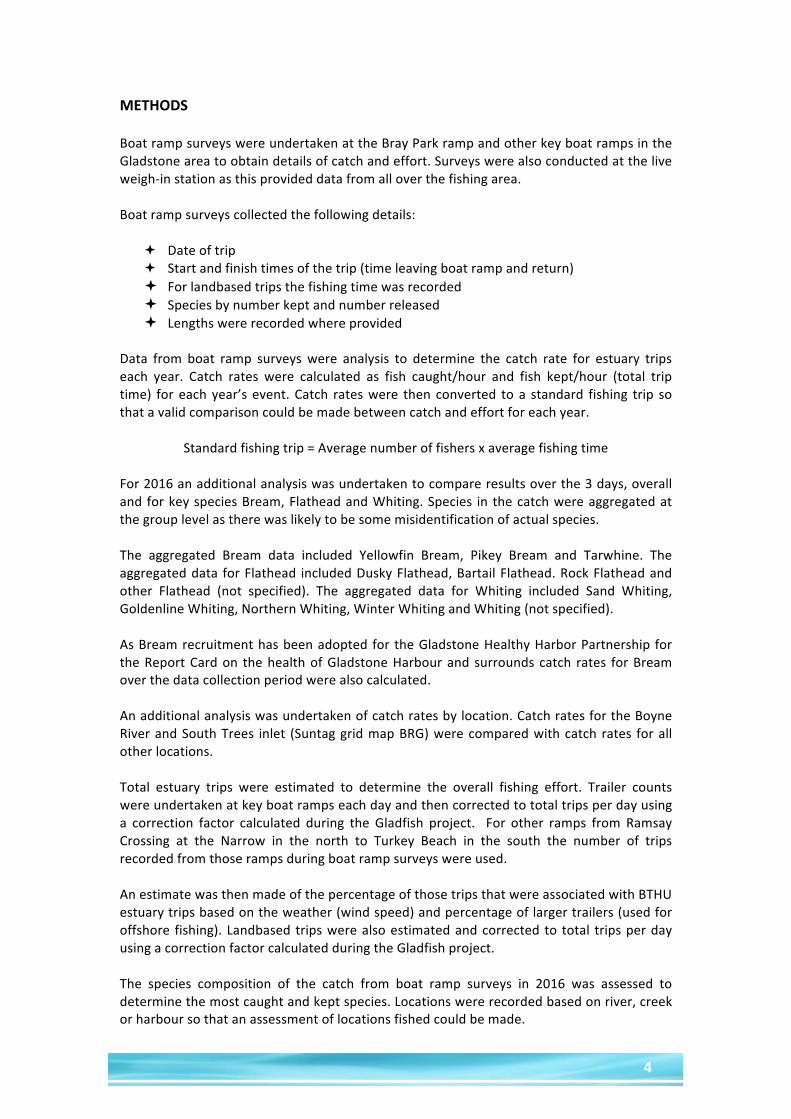
ofPikeyBreamwere280:299mmand26.7%ofDuskyFlatheadwere500:549mm.SUMMARYOFBOATRAMPSURVEYSTable1 isasummaryof thedatacollectedeachyear in theBTHU.Thenumberofsurveysranged from108 in2008to459 in2013.Fishcaught ranged from572 in2011to3,316 in2013.
Table1:Summaryofdatafromboatrampsurveysfrom2007-2016
YEAR 2007 2008 2009 2010 2011SURVEYS 211 108 182 215 169FISHERS 567 304 484 605 404HOURSFISHED 3114.8 1682.3 2577.5 2978.1 1937.5FISHCAUGHT 1184 850 1153 990 572FISHKEPT 358 261 232 189 67BREAMCAUGHT 145 223 219 202 251YEAR 2012 2013 2014 2015 2016SURVEYS 342 459 439 316FISHERS 856 1123 1084 806HOURSFISHED 3758.3 5875.9 5679.0 4103.5FISHCAUGHT 2436 3316 2973 2994FISHKEPT 410 395 434 168BREAMCAUGHT 831 1659 756 1235
7
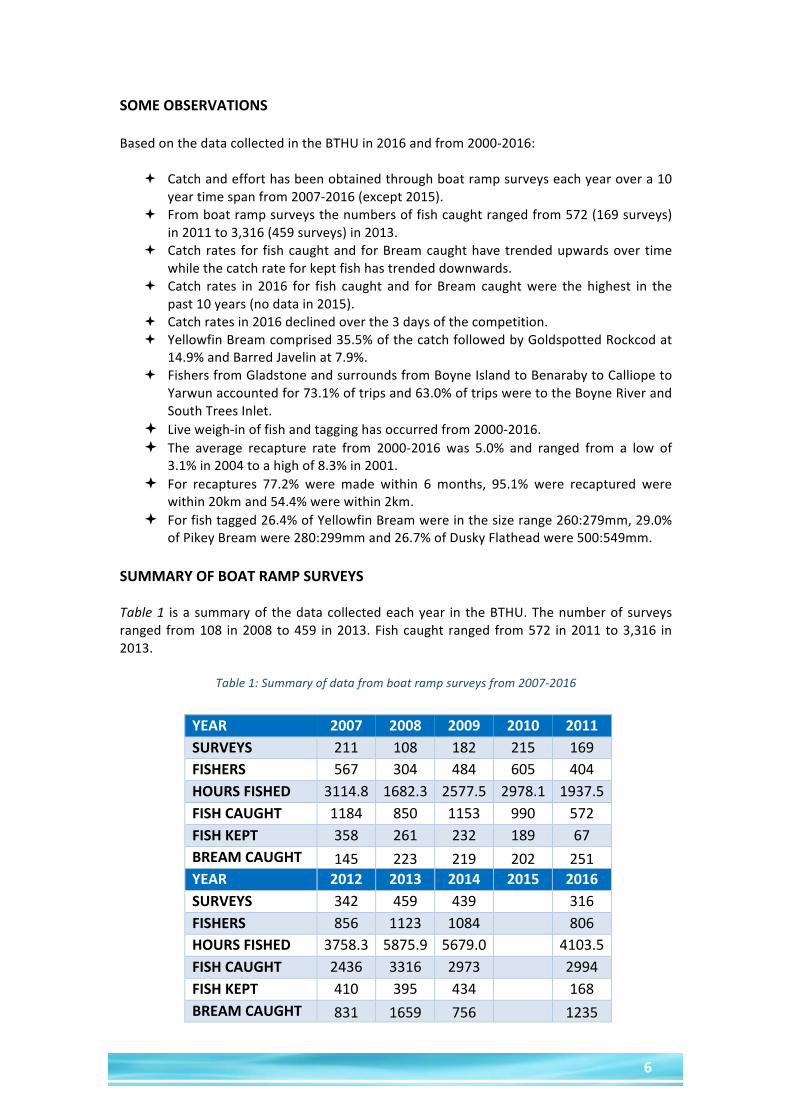
CATCHRATES2007-2016Toensurethatavalidcomparisoncouldbemadebetweencatchratesfromyeartoyearastandardfishingtripwasdeterminedbasedontheaveragefishingtripandcatchrateswereadjustedtothestandardtrip.Thestandardfishtripadoptedwas:
Standardfishingtrip=2.5fishersX5fishinghoursFigure2shows thecatch rateseachyear from2007-2016. The lowest catch ratewas2.4fish/stdtripin2010to5.3fish/stdtripin2016.Thisshowsanupwardtrendinthecatchrateoverthepast10yearswiththehighestcatchratein2016.
Figure2:BTHUestuarycatchratesfrom2007-2016(errorbars95%confidence)
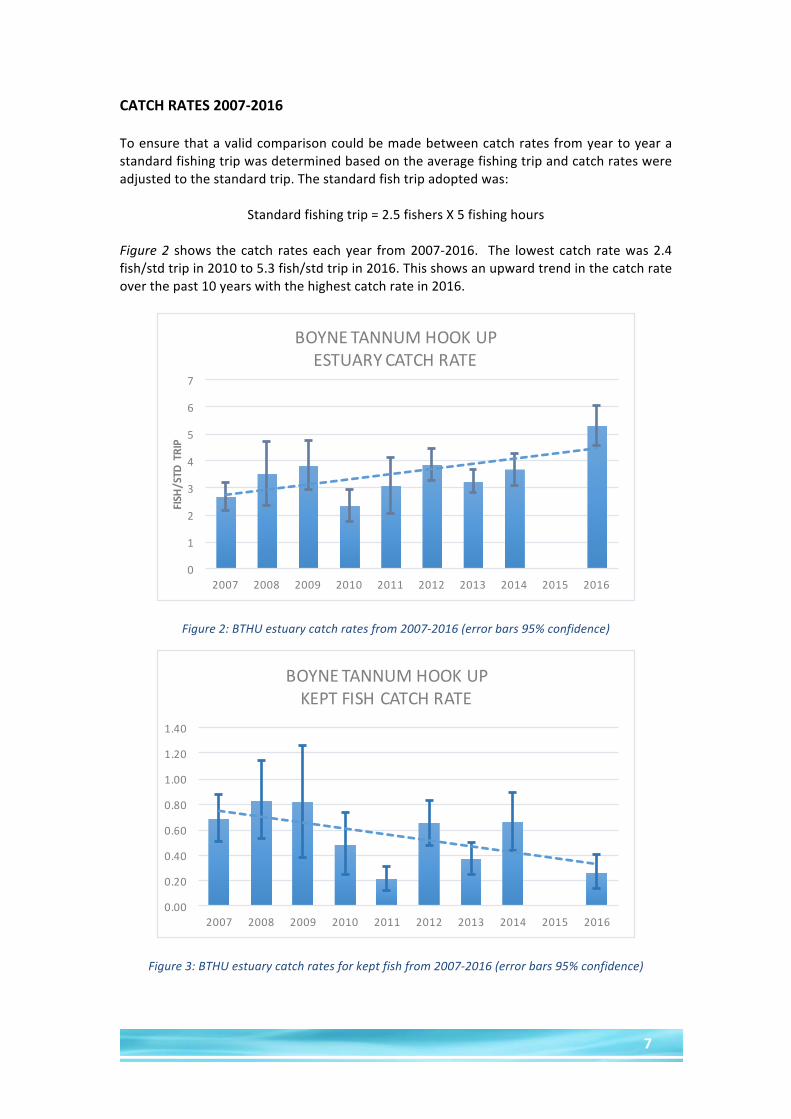
Figure3:BTHUestuarycatchratesforkeptfishfrom2007-2016(errorbars95%confidence)
0
1
2
3
4
5
6
7
2007 2008 2009 2010 2011 2012 2013 2014 2015 2016
FISH/
STDTRIP
BOYNETANNUMHOOKUPESTUARYCATCHRATE
0.00
0.20
0.40
0.60
0.80
1.00
1.20
1.40
2007 2008 2009 2010 2011 2012 2013 2014 2015 2016
BOYNETANNUMHOOKUPKEPTFISHCATCHRATE
8
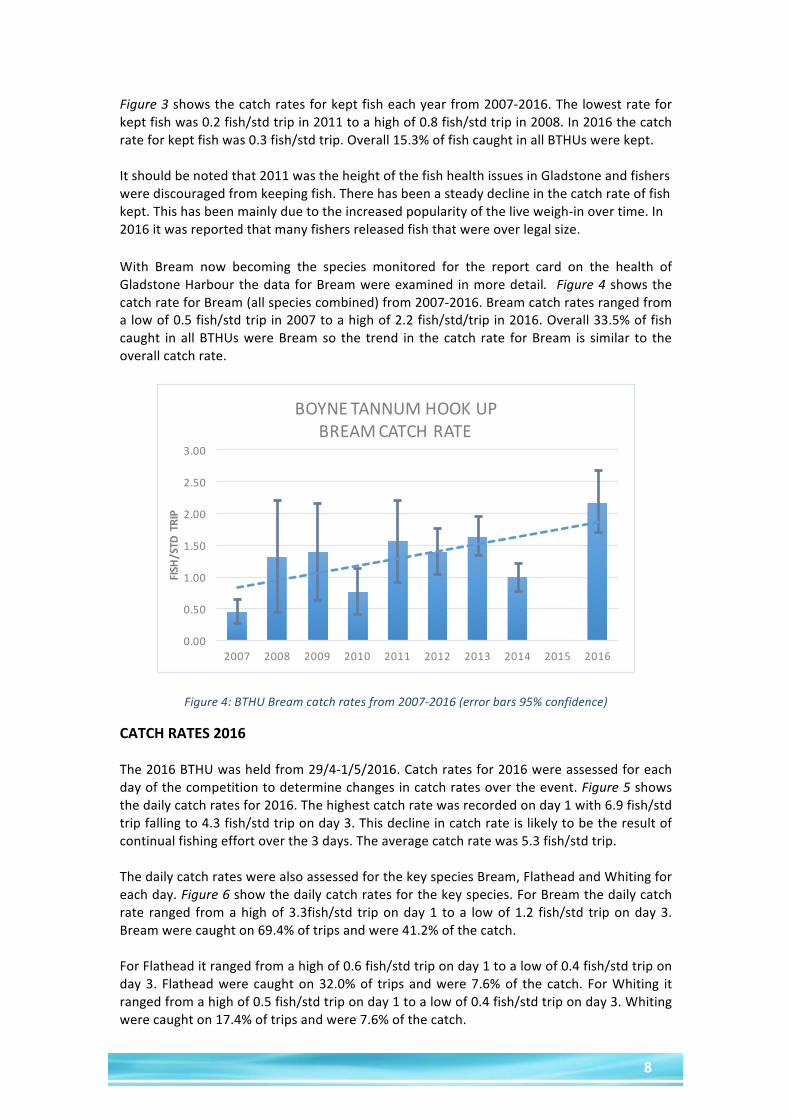
Figure3showsthecatchratesforkeptfisheachyearfrom2007-2016.Thelowestrateforkeptfishwas0.2fish/stdtripin2011toahighof0.8fish/stdtripin2008.In2016thecatchrateforkeptfishwas0.3fish/stdtrip.Overall15.3%offishcaughtinallBTHUswerekept.Itshouldbenotedthat2011wastheheightofthefishhealthissuesinGladstoneandfisherswerediscouragedfromkeepingfish.Therehasbeenasteadydeclineinthecatchrateoffishkept.Thishasbeenmainlyduetotheincreasedpopularityoftheliveweigh-inovertime.In2016itwasreportedthatmanyfishersreleasedfishthatwereoverlegalsize.With Bream now becoming the species monitored for the report card on the health ofGladstoneHarbourthedataforBreamwereexamined inmoredetail. Figure4 showsthecatchrateforBream(allspeciescombined)from2007-2016.Breamcatchratesrangedfromalowof0.5fish/stdtripin2007toahighof2.2fish/std/tripin2016.Overall33.5%offishcaught inallBTHUswereBreamso the trend in thecatch rate forBream is similar to theoverallcatchrate.
Figure4:BTHUBreamcatchratesfrom2007-2016(errorbars95%confidence)
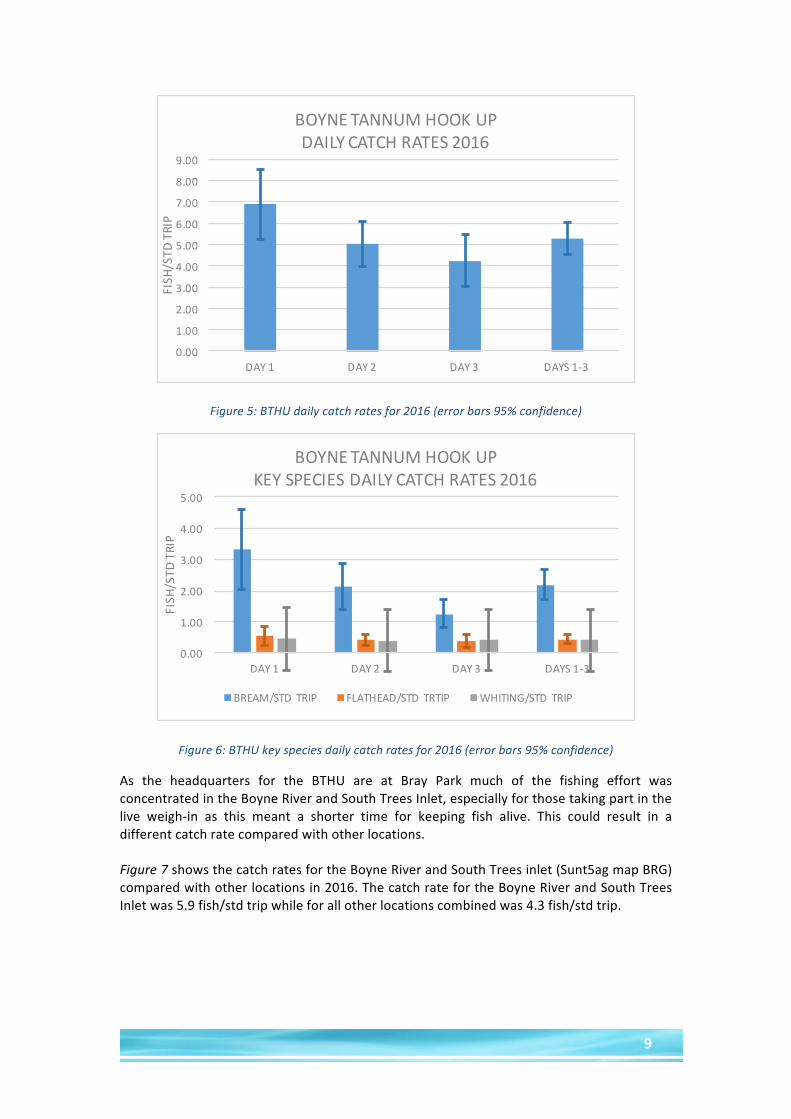
CATCHRATES2016The2016BTHUwasheldfrom29/4-1/5/2016.Catchratesfor2016wereassessedforeachdayofthecompetitiontodeterminechangesincatchratesovertheevent.Figure5showsthedailycatchratesfor2016.Thehighestcatchratewasrecordedonday1with6.9fish/stdtripfallingto4.3fish/stdtriponday3.Thisdeclineincatchrateislikelytobetheresultofcontinualfishingeffortoverthe3days.Theaveragecatchratewas5.3fish/stdtrip.ThedailycatchrateswerealsoassessedforthekeyspeciesBream,FlatheadandWhitingforeachday.Figure6showthedailycatchratesforthekeyspecies.ForBreamthedailycatchrate ranged fromahighof3.3fish/std triponday1 toa lowof1.2 fish/std triponday3.Breamwerecaughton69.4%oftripsandwere41.2%ofthecatch.ForFlatheaditrangedfromahighof0.6fish/stdtriponday1toalowof0.4fish/stdtriponday3. Flatheadwerecaughton32.0%of tripsandwere7.6%of the catch. ForWhiting itrangedfromahighof0.5fish/stdtriponday1toalowof0.4fish/stdtriponday3.Whitingwerecaughton17.4%oftripsandwere7.6%ofthecatch.
0.00
0.50
1.00
1.50
2.00
2.50
3.00
2007 2008 2009 2010 2011 2012 2013 2014 2015 2016
FISH/
STDTRIP
BOYNETANNUMHOOKUPBREAMCATCHRATE
9
Figure5:BTHUdailycatchratesfor2016(errorbars95%confidence)
Figure6:BTHUkeyspeciesdailycatchratesfor2016(errorbars95%confidence)
As the headquarters for the BTHU are at Bray Park much of the fishing effort wasconcentratedintheBoyneRiverandSouthTreesInlet,especiallyforthosetakingpartinthelive weigh-in as this meant a shorter time for keeping fish alive. This could result in adifferentcatchratecomparedwithotherlocations.Figure7showsthecatchratesfortheBoyneRiverandSouthTreesinlet(Sunt5agmapBRG)comparedwithotherlocationsin2016.ThecatchratefortheBoyneRiverandSouthTreesInletwas5.9fish/stdtripwhileforallotherlocationscombinedwas4.3fish/stdtrip.
0.00
1.00
2.00
3.00
4.00
5.00
6.00
7.00
8.00
9.00
DAY1 DAY2 DAY3 DAYS1-3
FISH
/STD
TRIP
BOYNETANNUMHOOKUPDAILYCATCHRATES2016
0.00
1.00
2.00
3.00
4.00
5.00
DAY1 DAY2 DAY3 DAYS1-3
FISH
/STD
TRIP
BOYNETANNUMHOOKUPKEYSPECIESDAILYCATCHRATES2016
BREAM/STDTRIP FLATHEAD/STDTRTIP WHITING/STDTRIP

10
Figure7:Catchratesbylocationin2016(errorbars95%confidence)
FISHINGEFFORT2016 There were 17 boat ramps from Ramsay Crossing at the Narrows in the north to TurkeyBeachinthesouththatwereprimarilyusedduringtheBTHU.Foreachdaythetotalnumberof fishing trips, both boat and landbased, were estimated. Figure 8 shows the estimatednumberofestuarytripseachdayandoverall.Theestimatednumberoftripsforthe3dayswas719.1+/-10%.Thetotalnumberofsurveyswas316whichwas43.9%oftheestimatedtotalnumberoftrips.
Figure8:Estimatednumberofestuarytripsin2016(errorbars10%ofestimate)
0
1
2
3
4
5
6
7
8
BOYNE/SOUTHTREESFISHCAUGHT/STDTRIP
OTHERLOCATIONSFISHCAUGHT/STDTRIP
FISH
/STD
TRIP
BOYNETANNUMHOOKUPCATCHRATESBYLOCATION2016
0
200
400
600
800
1000
DAY1 DAY2 DAY3 DAY1-3
TRIPS
BOYNETANNUMHOOKUPFISHINGTRIPSANDSURVEYS
FISHINGTRIPS SURVEYS

11
SPECIESCOMPOSITION2016 Fromtheboatrampsurveystherewereatotalof59speciesrecorded.Figure9showsthetop 10 species caught with Yellowfin Bream comprising 35.5% of the catch followed byGoldspottedRockcodat14.9%andBarredJavelinat7.9%.Of thekept fishSandWhitingwere27.4%of thekeptcatch followedbyKingThreadfinat12.5% and Yellowfin Bream at 11.9%. For species the most kept were King Threadfin at91.3% followed by Blue Threadfin at 60.7% and Black Jewfish at 55.6%. Just 1.9% of theYellowfinBreamcaughtwerekept.
Figure9:Top10speciesrecordedin2016boatrampsurveys
LOCATIONSFISHED2016
Figure10:Locationswheretripswererecordedin2016
020040060080010001200
NUMBEROFFISH
BOYNETANNUMHOOKUPSPECIESCOMPOSITION2016
Caught Kept
05101520253035404550
PERCEN
RTAG
ELO
CATIONS
BOYNETANNUMHOOKUPLOCATIONSFISHED

12
Figure10showsthelocationswherefishersfishedin2016rangingfromtheNarrowsinthenorthtoRoddsHarbourinthesouth.AstheBTHUiscentredaroundBrayPark46.5%oftripsweretotheBoyneRiverandafurther16.5%weretoSouthTreesInlet.HOMETOWNOFFISHERS2016 Forthe2016tripsthehometownoftheboatowner/skipperwasrecorded.Figure11showsthebreakdownofhometownsoffishers.Thehighestnumberoftripswereundertakenbythose fromBoyne Island/TannumSandswith37.7%of trips. ForGladstoneand surroundsfrom Boyne Island to Benaraby to Calliope to Yarwun the percentage of tripswas 73.1%.Fishers came from as far afield as Mount Isa in the north to Victoria in the south andBlackwatertothewest.
Figure11:Hometownoffishersfishingin2016
FISHTAGGEDANDRECAPTURED2000-2016
Figure12:Fishtaggedandrecapturerates2000-2016
38%
27%
8%
8%4%3%3%
2%2%2%1%1%1%0%0%
TTRRIIPPSS BOYNEISLAND/TANNUMSANDSGLADSTONEBENARABY/CALLIOPE/YARWUNROCKHAMPTON/CAPCOASTBRISBANEINLANDCENTRALQLDMIRIAMVALE/AGNESWATERBUNDABERGSUNSHINECOASTNORTHQLDMARYBOROUGH/HERVEYBAYINLANDSTHQLDNSWGOLDCOASTVICTORIA
0.0%
2.0%
4.0%
6.0%
8.0%
10.0%
0100200300400500600700
FISH
TAG
GED
BOYNETANNUMHOOKUPFISHTAGGEDANDRECAPTURERATE
TAGGED %RECAPTURED
13
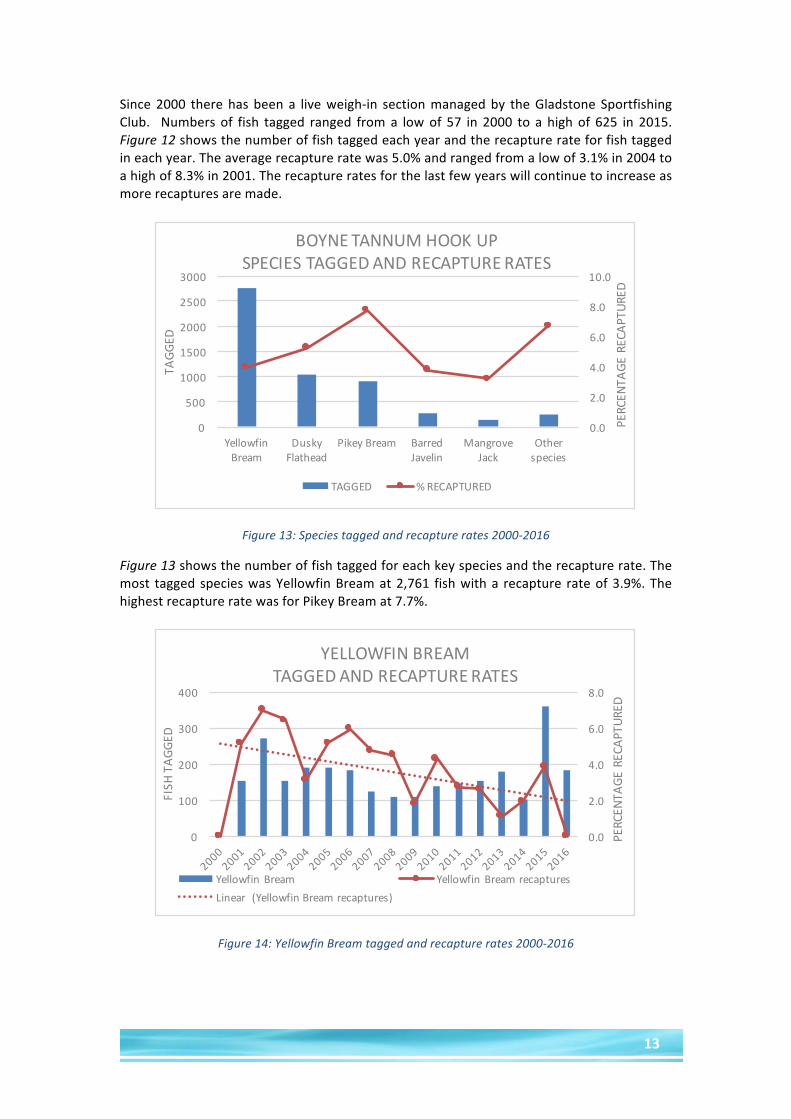
Since2000 therehasbeen a liveweigh-in sectionmanagedby theGladstone SportfishingClub. Numbers of fish tagged ranged froma lowof 57 in 2000 to a highof 625 in 2015.Figure12showsthenumberoffishtaggedeachyearandtherecapturerateforfishtaggedineachyear.Theaveragerecaptureratewas5.0%andrangedfromalowof3.1%in2004toahighof8.3%in2001.Therecaptureratesforthelastfewyearswillcontinuetoincreaseasmorerecapturesaremade.
Figure13:Speciestaggedandrecapturerates2000-2016
Figure13showsthenumberoffishtaggedforeachkeyspeciesandtherecapturerate.Themost taggedspecieswasYellowfinBreamat2,761 fishwitha recapture rateof3.9%.ThehighestrecaptureratewasforPikeyBreamat7.7%.
Figure14:YellowfinBreamtaggedandrecapturerates2000-2016
0.0
2.0
4.0
6.0
8.0
10.0
0
500
1000
1500
2000
2500
3000
YellowfinBream
DuskyFlathead
PikeyBream BarredJavelin
MangroveJack
Otherspecies
PERCENTAGERECAPTURED
TAGGED
BOYNETANNUMHOOKUPSPECIESTAGGEDANDRECAPTURERATES
TAGGED %RECAPTURED
0.0
2.0
4.0
6.0
8.0
0
100
200
300
400
PERC
ENTA
GER
ECAP
TURE
D
FISH
TAG
GED
YELLOWFINBREAMTAGGEDANDRECAPTURERATES
YellowfinBream YellowfinBreamrecapturesLinear (YellowfinBreamrecaptures)
14
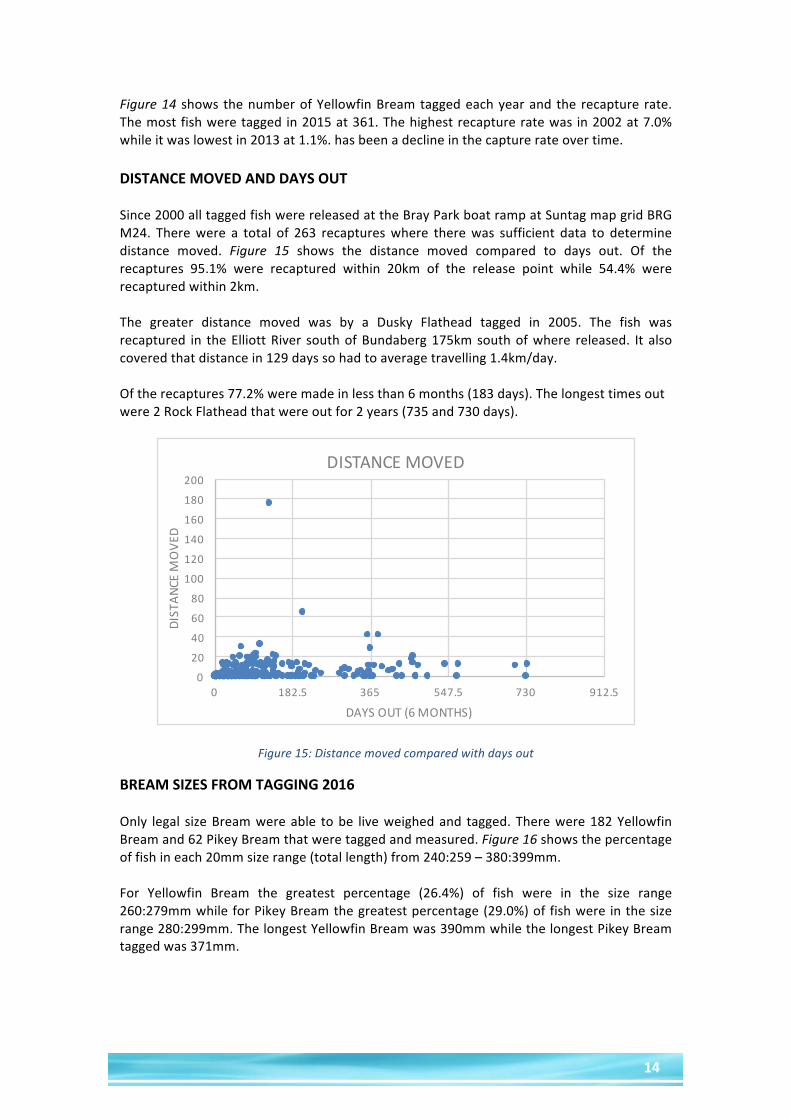
Figure14 shows thenumberofYellowfinBreamtaggedeachyearand the recapture rate.Themostfishweretaggedin2015at361.Thehighestrecaptureratewas in2002at7.0%whileitwaslowestin2013at1.1%.hasbeenadeclineinthecapturerateovertime.DISTANCEMOVEDANDDAYSOUT Since2000alltaggedfishwerereleasedattheBrayParkboatrampatSuntagmapgridBRGM24. Therewere a total of 263 recaptureswhere therewas sufficient data to determinedistance moved. Figure 15 shows the distance moved compared to days out. Of therecaptures 95.1% were recaptured within 20km of the release point while 54.4% wererecapturedwithin2km.The greater distance moved was by a Dusky Flathead tagged in 2005. The fish wasrecaptured in theElliottRiver southofBundaberg175kmsouthofwhere released. It alsocoveredthatdistancein129dayssohadtoaveragetravelling1.4km/day.Oftherecaptures77.2%weremadeinlessthan6months(183days).Thelongesttimesoutwere2RockFlatheadthatwereoutfor2years(735and730days).
Figure15:Distancemovedcomparedwithdaysout
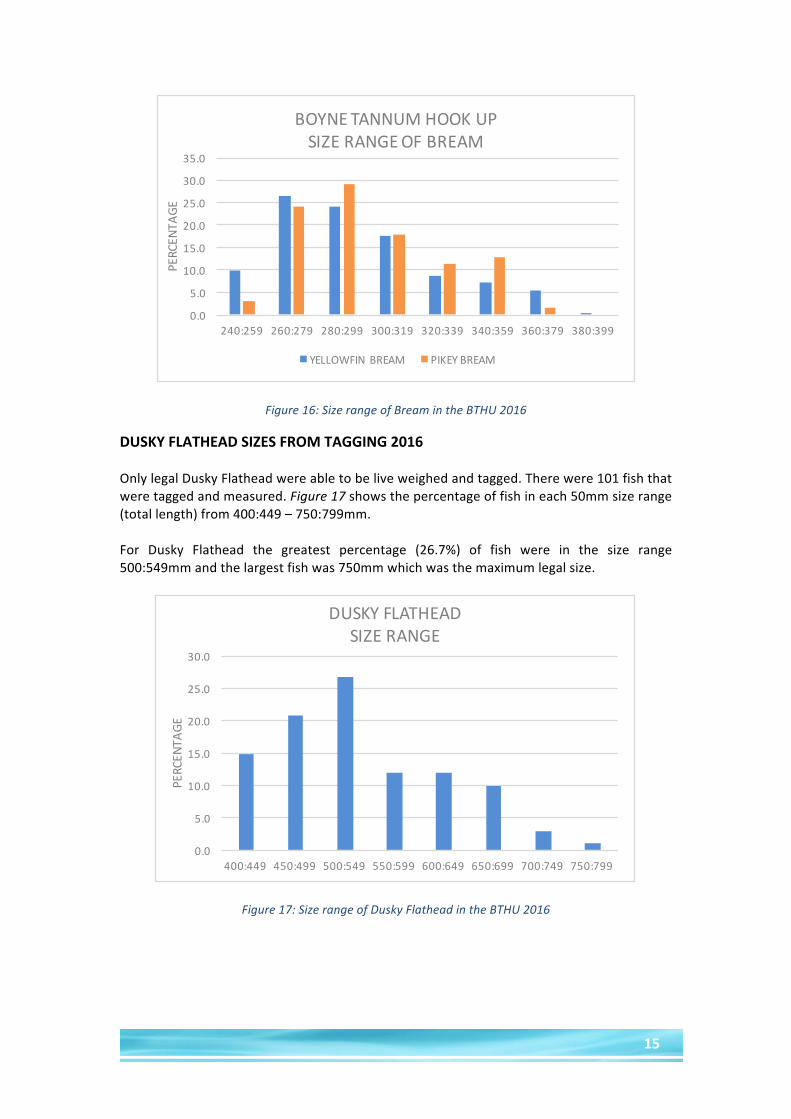
BREAMSIZESFROMTAGGING2016 Only legal sizeBreamwereable tobe liveweighedand tagged.Therewere182YellowfinBreamand62PikeyBreamthatweretaggedandmeasured.Figure16showsthepercentageoffishineach20mmsizerange(totallength)from240:259–380:399mm.For Yellowfin Bream the greatest percentage (26.4%) of fish were in the size range260:279mmwhileforPikeyBreamthegreatestpercentage(29.0%)offishwereinthesizerange280:299mm.ThelongestYellowfinBreamwas390mmwhilethelongestPikeyBreamtaggedwas371mm.
020406080
100120140160180200
0 182.5 365 547.5 730 912.5
DISTAN
CEM
OVE
D
DAYSOUT(6MONTHS)
DISTANCEMOVED
15
Figure16:SizerangeofBreamintheBTHU2016
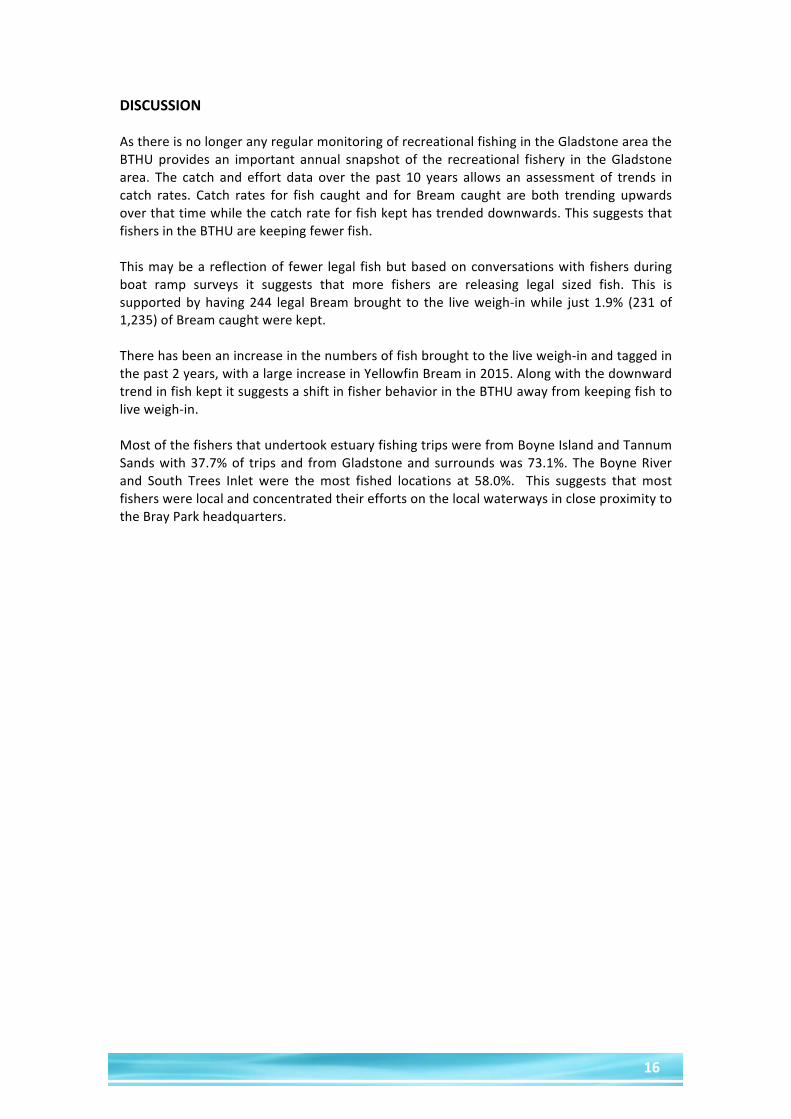
DUSKYFLATHEADSIZESFROMTAGGING2016 OnlylegalDuskyFlatheadwereabletobeliveweighedandtagged.Therewere101fishthatweretaggedandmeasured.Figure17showsthepercentageoffishineach50mmsizerange(totallength)from400:449–750:799mm.For Dusky Flathead the greatest percentage (26.7%) of fish were in the size range500:549mmandthelargestfishwas750mmwhichwasthemaximumlegalsize.
Figure17:SizerangeofDuskyFlatheadintheBTHU2016
0.0
5.0
10.0
15.0
20.0
25.0
30.0
35.0
240:259 260:279 280:299 300:319 320:339 340:359 360:379 380:399
PERCEN
TAGE
BOYNETANNUMHOOKUPSIZERANGEOFBREAM
YELLOWFINBREAM PIKEYBREAM
0.0
5.0
10.0
15.0
20.0
25.0
30.0
400:449 450:499 500:549 550:599 600:649 650:699 700:749 750:799
PERCEN
TAGE
DUSKYFLATHEADSIZERANGE
16
DISCUSSIONAsthereisnolongeranyregularmonitoringofrecreationalfishingintheGladstoneareatheBTHUprovides an important annual snapshot of the recreational fishery in theGladstonearea. The catch and effort data over the past 10 years allows an assessment of trends incatch rates. Catch rates for fish caught and for Bream caught are both trending upwardsoverthattimewhilethecatchrateforfishkepthastrendeddownwards.ThissuggeststhatfishersintheBTHUarekeepingfewerfish.Thismaybeareflectionof fewer legal fishbutbasedonconversationswith fishersduringboat ramp surveys it suggests that more fishers are releasing legal sized fish. This issupportedbyhaving244 legalBreambrought to the liveweigh-inwhile just1.9% (231of1,235)ofBreamcaughtwerekept.Therehasbeenanincreaseinthenumbersoffishbroughttotheliveweigh-inandtaggedinthepast2years,withalargeincreaseinYellowfinBreamin2015.AlongwiththedownwardtrendinfishkeptitsuggestsashiftinfisherbehaviorintheBTHUawayfromkeepingfishtoliveweigh-in.MostofthefishersthatundertookestuaryfishingtripswerefromBoyneIslandandTannumSandswith37.7%of tripsand fromGladstoneand surroundswas73.1%.TheBoyneRiverand South Trees Inlet were themost fished locations at 58.0%. This suggests that mostfisherswerelocalandconcentratedtheireffortsonthelocalwaterwaysincloseproximitytotheBrayParkheadquarters.