Embed Size (px)
Citation preview
1 | Program Name or Ancillary Text eere.energy.gov
BTO Program Peer Review - HPwES
Home Performance with ENERGY STAR
Ely Jacobsohn U.S. Department of Energy
[email protected], 202-287-1333
April 3, 2013
2 | Building Technologies Office eere.energy.gov
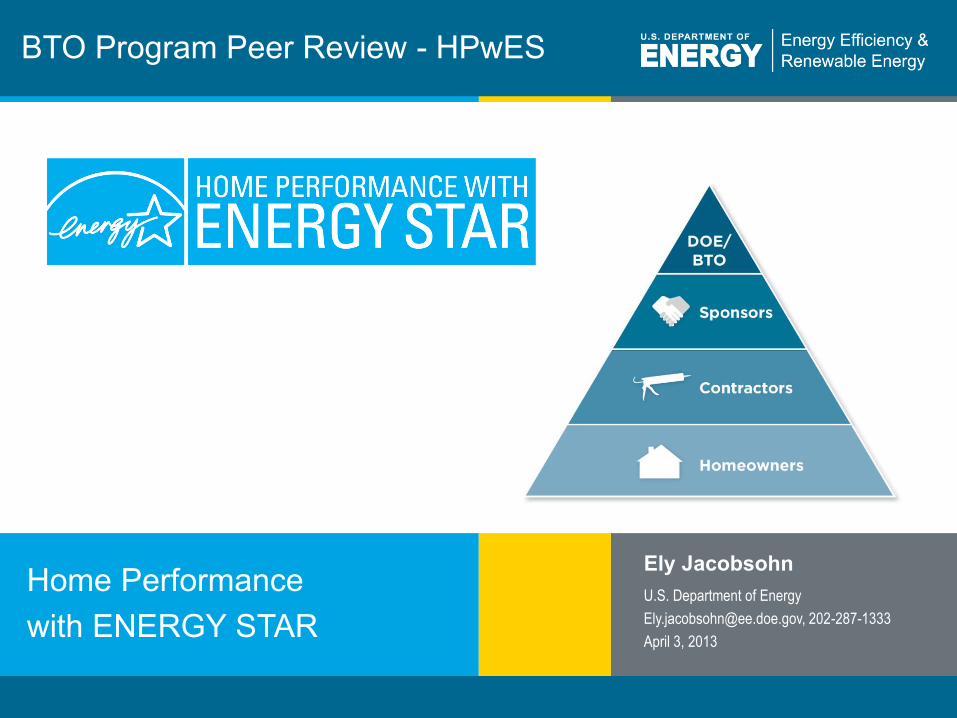
Purpose and Objectives: Problem Statement
Works to advance the Department’s and Administration’s energy-related goals in the residential sector
Face challenging and often conflicting mandates to save energy, meet environmental goals, and satisfy needs of customers and investors
Fragmented home improvement and budding home performance industries challenge consumer confidence and impede the private investment needed to grow
Lack of awareness and understanding to make informed home improvement decisions leads to discomfort in making investments in home performance
Home Performance with ENERGY STAR (HPwES) provides a programmatic platform that helps three main constituencies resolve some of our nation’s most challenging energy issues resulting in broad-based adoption of energy efficiency improvements in homes.
3 | Building Technologies Office eere.energy.gov
Purpose and Objectives: HPwES Purpose and Impact
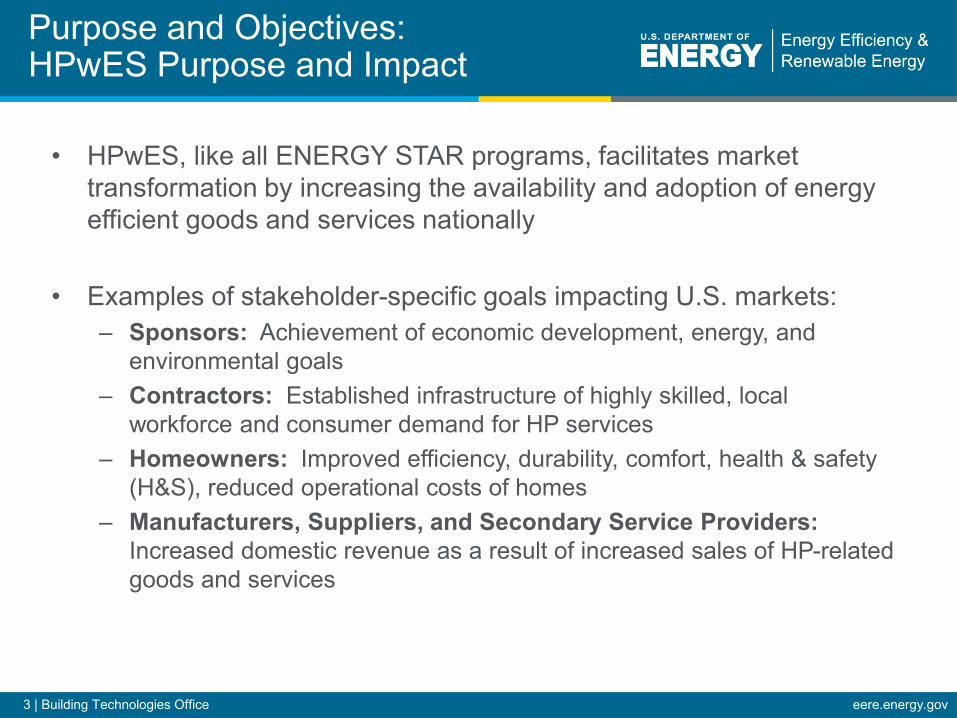
• HPwES, like all ENERGY STAR programs, facilitates market transformation by increasing the availability and adoption of energy efficient goods and services nationally
• Examples of stakeholder-specific goals impacting U.S. markets:
– Sponsors: Achievement of economic development, energy, and environmental goals
– Contractors: Established infrastructure of highly skilled, local workforce and consumer demand for HP services
– Homeowners: Improved efficiency, durability, comfort, health & safety (H&S), reduced operational costs of homes
– Manufacturers, Suppliers, and Secondary Service Providers: Increased domestic revenue as a result of increased sales of HP-related goods and services
4 | Building Technologies Office eere.energy.gov
Purpose and Objectives: Project Focus & Connection to BTO Goals
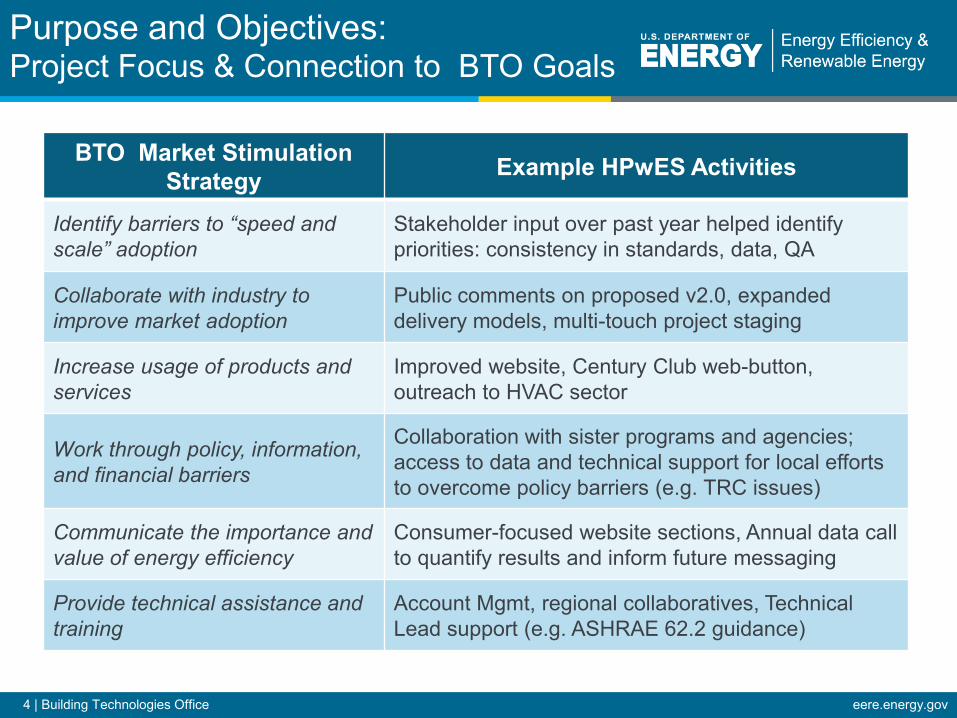
BTO Market Stimulation Strategy Example HPwES Activities
Identify barriers to “speed and scale” adoption
Stakeholder input over past year helped identify priorities: consistency in standards, data, QA
Collaborate with industry to improve market adoption
Public comments on proposed v2.0, expanded delivery models, multi-touch project staging
Increase usage of products and services
Improved website, Century Club web-button, outreach to HVAC sector
Work through policy, information, and financial barriers
Collaboration with sister programs and agencies; access to data and technical support for local efforts to overcome policy barriers (e.g. TRC issues)
Communicate the importance and value of energy efficiency
Consumer-focused website sections, Annual data call to quantify results and inform future messaging
Provide technical assistance and training
Account Mgmt, regional collaboratives, Technical Lead support (e.g. ASHRAE 62.2 guidance)
5 | Building Technologies Office eere.energy.gov
Approach: HPwES Program Platform
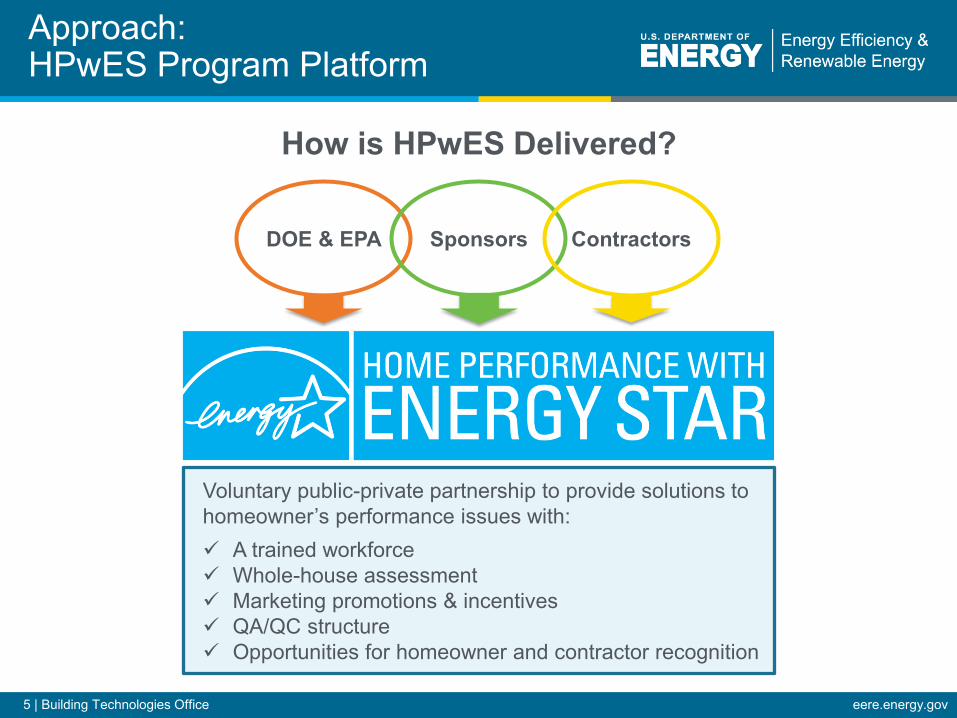
How is HPwES Delivered?
DOE & EPA Sponsors Contractors
Voluntary public-private partnership to provide solutions to homeowner’s performance issues with: A trained workforce Whole-house assessment Marketing promotions & incentives QA/QC structure Opportunities for homeowner and contractor recognition
6 | Building Technologies Office eere.energy.gov
Approach: Key Issues and Challenges
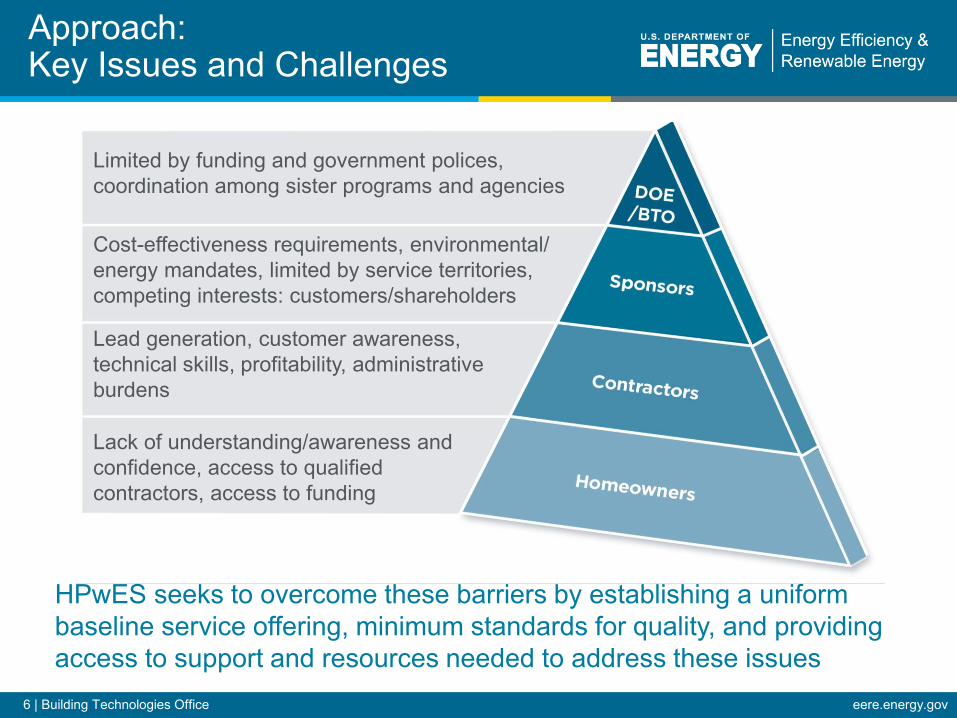
Limited by funding and government polices, coordination among sister programs and agencies
Cost-effectiveness requirements, environmental/ energy mandates, limited by service territories, competing interests: customers/shareholders
Lead generation, customer awareness, technical skills, profitability, administrative burdens
Lack of understanding/awareness and confidence, access to qualified contractors, access to funding
HPwES seeks to overcome these barriers by establishing a uniform baseline service offering, minimum standards for quality, and providing access to support and resources needed to address these issues
7 | Building Technologies Office eere.energy.gov
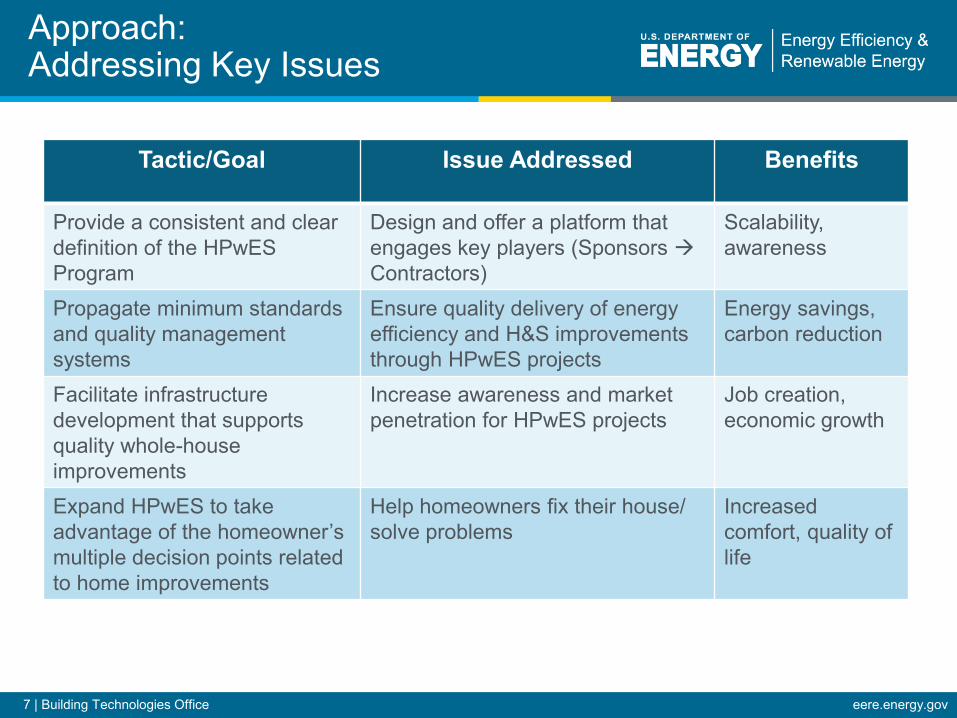
Approach: Addressing Key Issues
Tactic/Goal Issue Addressed Benefits
Provide a consistent and clear definition of the HPwES Program
Design and offer a platform that engages key players (Sponsors Contractors)
Scalability, awareness
Propagate minimum standards and quality management systems
Ensure quality delivery of energy efficiency and H&S improvements through HPwES projects
Energy savings, carbon reduction
Facilitate infrastructure development that supports quality whole-house improvements
Increase awareness and market penetration for HPwES projects
Job creation, economic growth
Expand HPwES to take advantage of the homeowner’s multiple decision points related to home improvements
Help homeowners fix their house/ solve problems
Increased comfort, quality of life
8 | Building Technologies Office eere.energy.gov
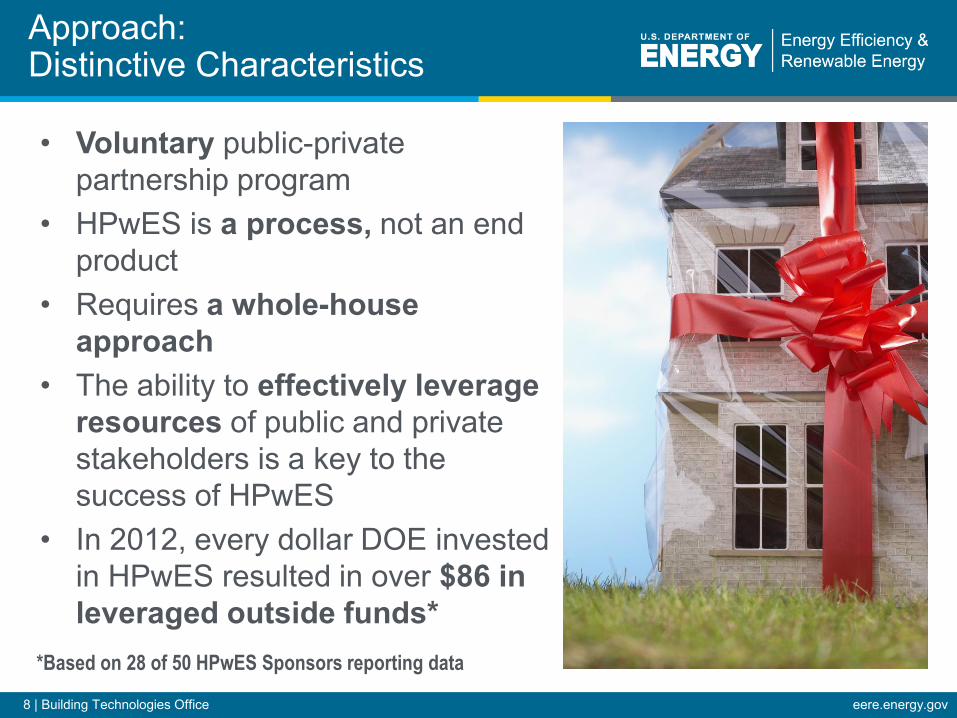
Approach: Distinctive Characteristics
• Voluntary public-private partnership program
• HPwES is a process, not an end product
• Requires a whole-house approach
• The ability to effectively leverage resources of public and private stakeholders is a key to the success of HPwES
• In 2012, every dollar DOE invested in HPwES resulted in over $86 in leveraged outside funds*
*Based on 28 of 50 HPwES Sponsors reporting data
9 | Building Technologies Office eere.energy.gov
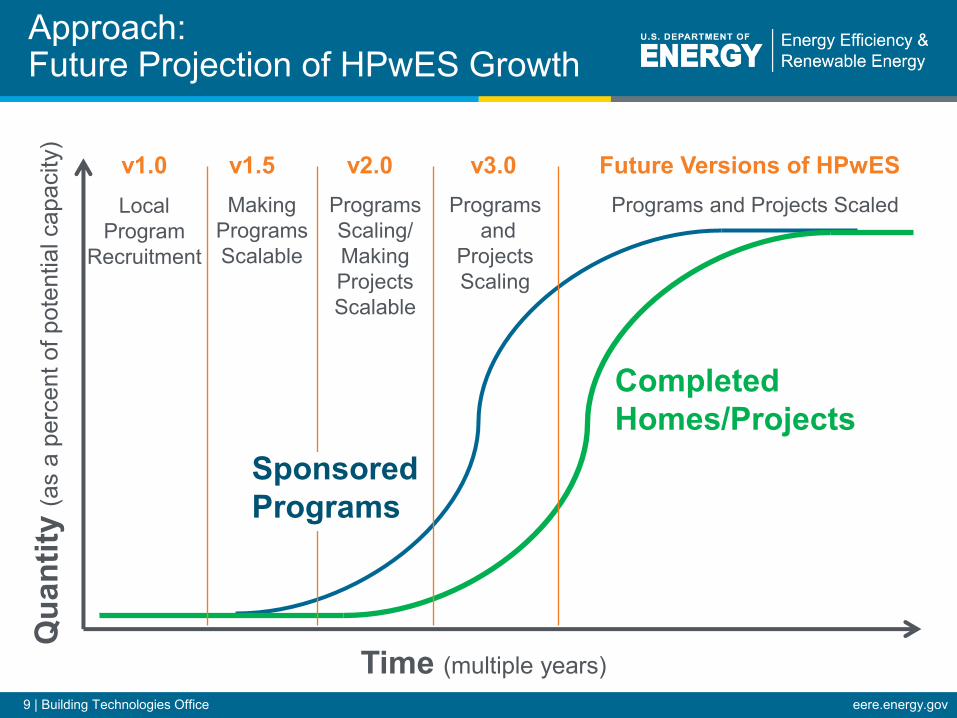
Approach: Future Projection of HPwES Growth
Time (multiple years)
Qua
ntity
(as
a pe
rcen
t of p
oten
tial c
apac
ity)
Completed Homes/Projects
v1.0 v1.5 v2.0 v3.0 Future Versions of HPwES Making
Programs Scalable
Programs Scaling/ Making Projects Scalable
Programs and
Projects Scaling
Programs and Projects Scaled Local Program
Recruitment
Sponsored Programs
10 | Building Technologies Office eere.energy.gov
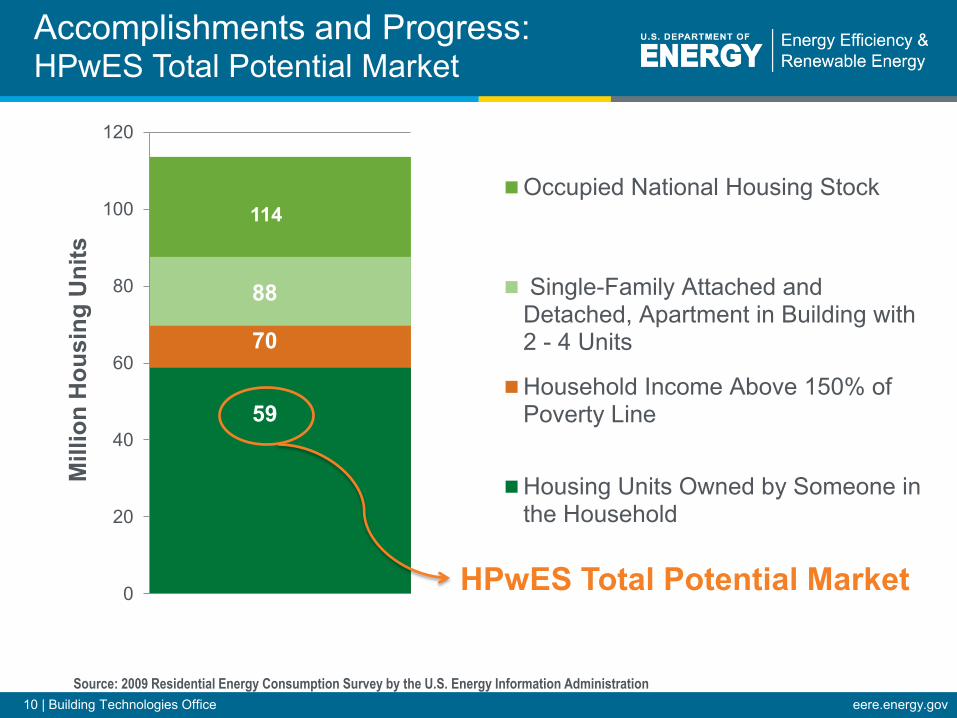
Accomplishments and Progress: HPwES Total Potential Market
0
20
40
60
80
100
120
Mill
ion
Hou
sing
Uni
ts
Occupied National Housing Stock
Single-Family Attached andDetached, Apartment in Building with2 - 4 Units
Household Income Above 150% ofPoverty Line
Housing Units Owned by Someone inthe Household
114
88
59
70
Source: 2009 Residential Energy Consumption Survey by the U.S. Energy Information Administration
HPwES Total Potential Market
11 | Building Technologies Office eere.energy.gov
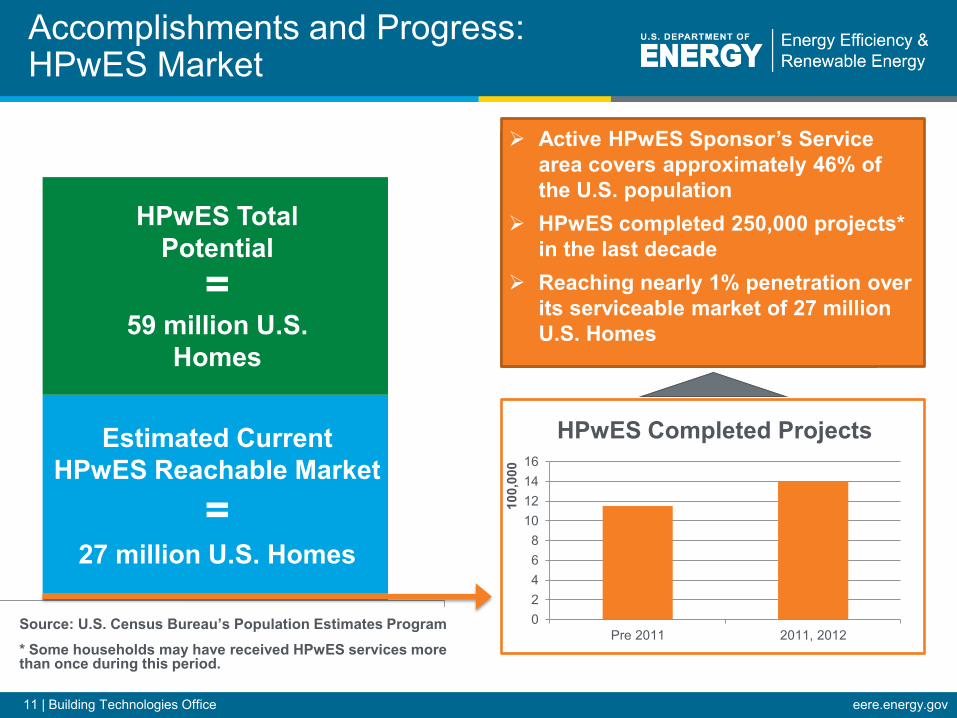
Accomplishments and Progress: HPwES Market
HPwES Total Potential
02468
10121416
Pre 2011 2011, 2012
100,
000
HPwES Completed Projects Estimated Current HPwES Reachable Market
Active HPwES Sponsor’s Service area covers approximately 46% of the U.S. population
HPwES completed 250,000 projects* in the last decade
Reaching nearly 1% penetration over its serviceable market of 27 million U.S. Homes
Source: U.S. Census Bureau’s Population Estimates Program * Some households may have received HPwES services more than once during this period.
59 million U.S. Homes
=
27 million U.S. Homes =
12 | Building Technologies Office eere.energy.gov
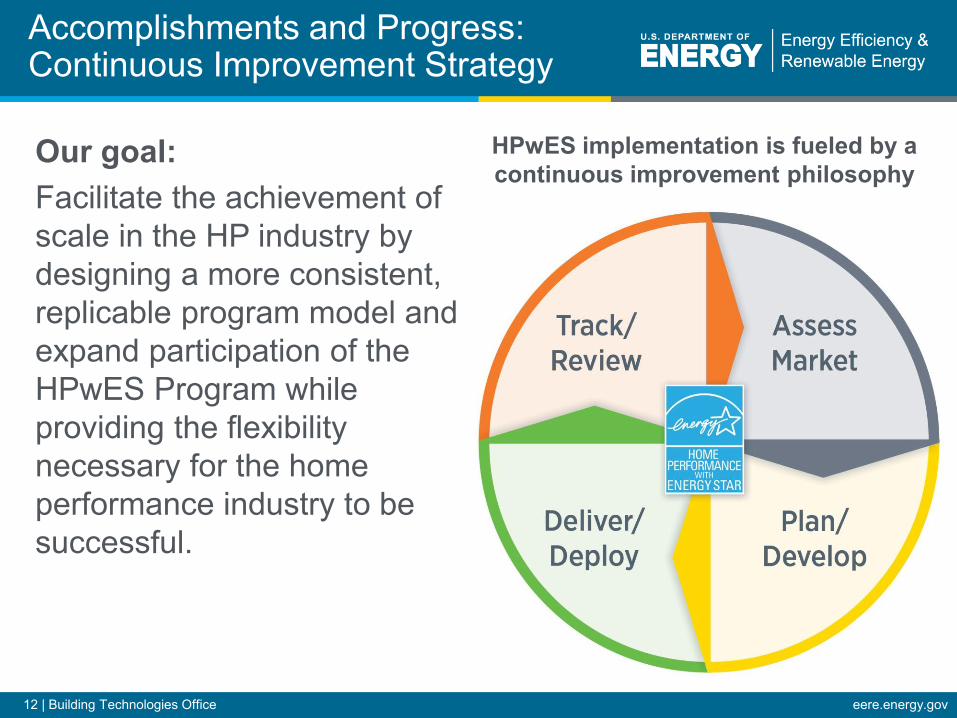
Accomplishments and Progress: Continuous Improvement Strategy
Our goal: Facilitate the achievement of scale in the HP industry by designing a more consistent, replicable program model and expand participation of the HPwES Program while providing the flexibility necessary for the home performance industry to be successful.
HPwES implementation is fueled by a continuous improvement philosophy
13 | Building Technologies Office eere.energy.gov
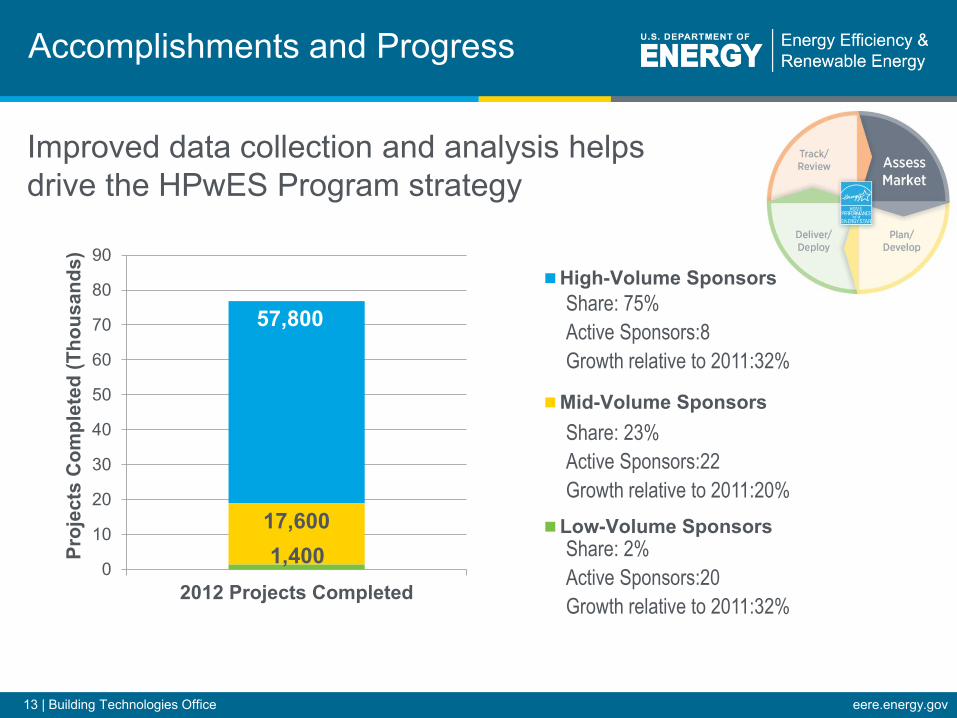
Accomplishments and Progress
Improved data collection and analysis helps drive the HPwES Program strategy
17,600
57,800
2012 Projects Completed0
10
20
30
40
50
60
70
80
90
Proj
ects
Com
plet
ed (T
hous
ands
)
High-Volume Sponsors
Mid-Volume Sponsors
Low-Volume Sponsors
Share: 75%
Active Sponsors:8
Growth relative to 2011:32%
Share: 23%
Active Sponsors:22
Growth relative to 2011:20%
Share: 2%
Active Sponsors:20
Growth relative to 2011:32%
1,400
14 | Building Technologies Office eere.energy.gov
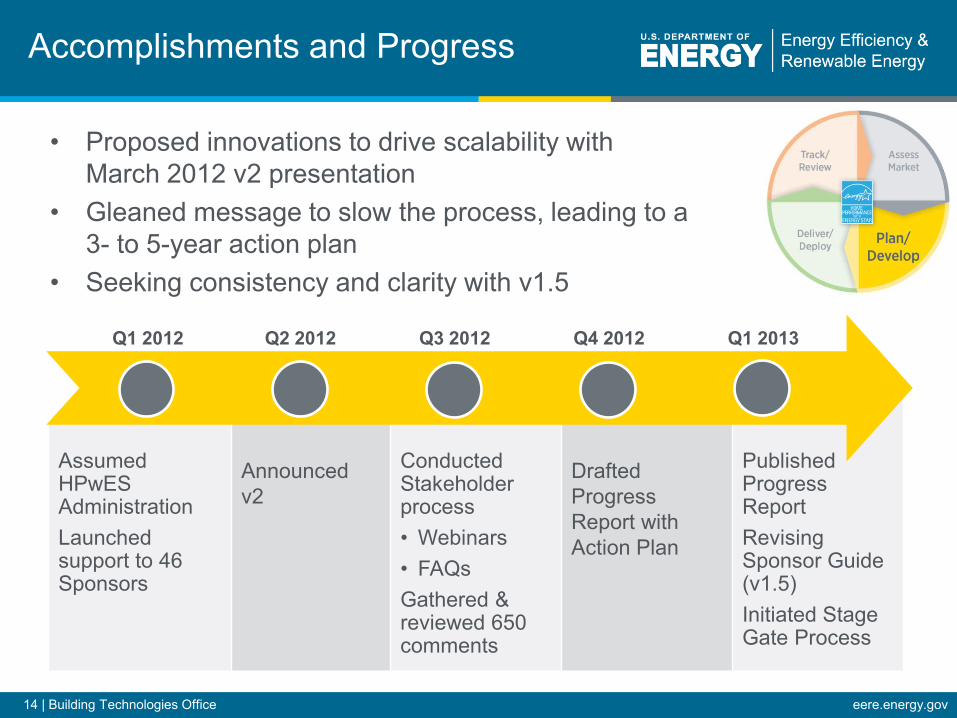
Assumed HPwES Administration Launched support to 46 Sponsors
Announced v2
Conducted Stakeholder process • Webinars • FAQs Gathered & reviewed 650 comments
Drafted Progress Report with Action Plan
Published Progress Report Revising Sponsor Guide (v1.5) Initiated Stage Gate Process
Accomplishments and Progress
Q1 2012 Q2 2012 Q3 2012 Q4 2012 Q1 2013
• Proposed innovations to drive scalability with March 2012 v2 presentation
• Gleaned message to slow the process, leading to a 3- to 5-year action plan
• Seeking consistency and clarity with v1.5
15 | Building Technologies Office eere.energy.gov
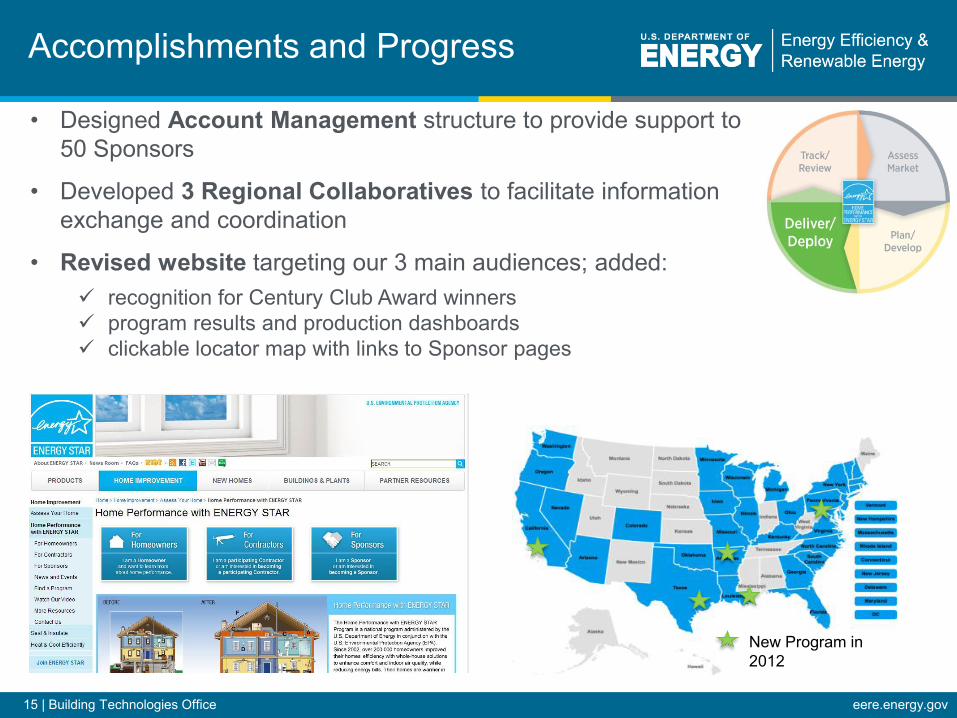
Accomplishments and Progress
New Program in 2012
• Designed Account Management structure to provide support to 50 Sponsors
• Developed 3 Regional Collaboratives to facilitate information exchange and coordination
• Revised website targeting our 3 main audiences; added: recognition for Century Club Award winners program results and production dashboards clickable locator map with links to Sponsor pages
16 | Building Technologies Office eere.energy.gov
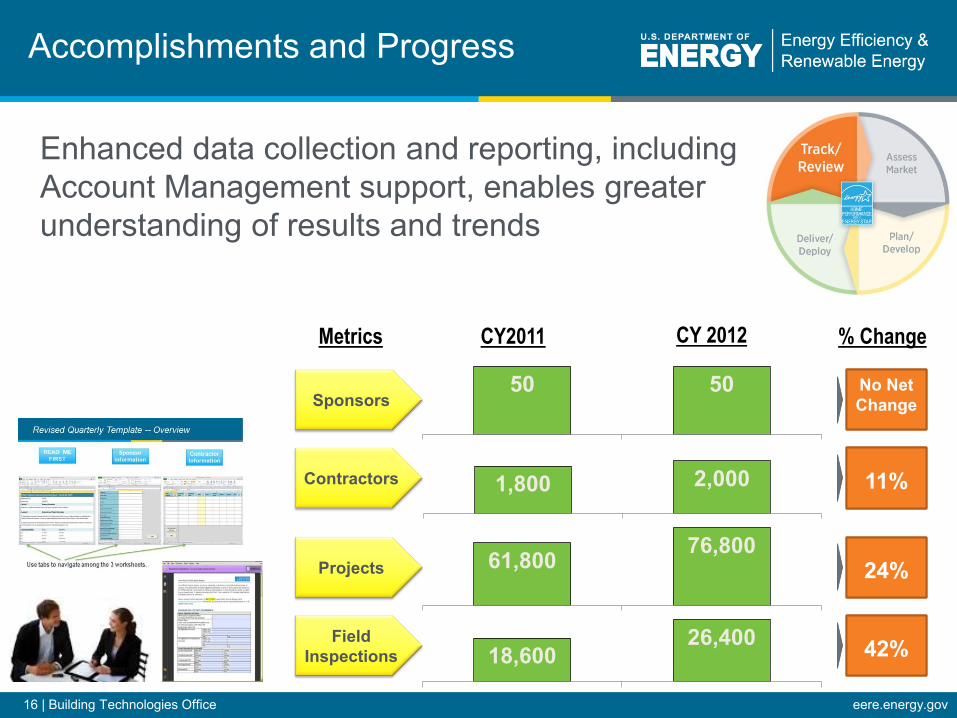
Accomplishments and Progress
Enhanced data collection and reporting, including Account Management support, enables greater understanding of results and trends
50 50Sponsors
Contractors
Projects
Field Inspections
Metrics CY2011 CY 2012 % Change
1,800 2,000
61,800 76,800
18,60026,400
No Net Change
11%
24%
42%
17 | Building Technologies Office eere.energy.gov
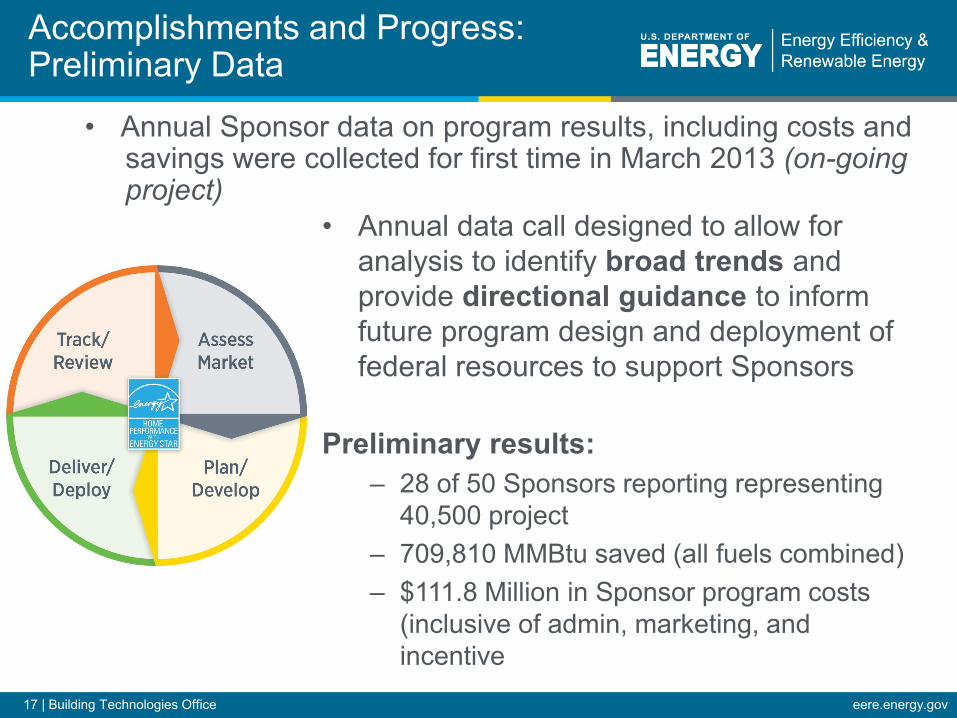
Accomplishments and Progress: Preliminary Data
• Annual data call designed to allow for analysis to identify broad trends and provide directional guidance to inform future program design and deployment of federal resources to support Sponsors
Preliminary results:
– 28 of 50 Sponsors reporting representing 40,500 project
– 709,810 MMBtu saved (all fuels combined) – $111.8 Million in Sponsor program costs
(inclusive of admin, marketing, and incentive
• Annual Sponsor data on program results, including costs and savings were collected for first time in March 2013 (on-going project)
18 | Building Technologies Office eere.energy.gov
• Limitations of Annual Sponsor Data: – Variations in energy
savings data collected by fuel type
– Variations in program cost tracking (admin, marketing, incentives, etc.)
– Variations due to maturity of program, market, and delivery infrastructure
– Variations in calculation methodologies used to estimate predicted energy savings
• Future Analysis: – Quantify program costs
and savings overall and average per project
– Filter and segment results by program profile characteristics:
• Maturity of the program • Targeted fuel(s) • Critical design elements
such as direct-install, free energy assessments, whole-house incentives, financing, etc.
Accomplishments and Progress: Future Data Analysis
19 | Building Technologies Office eere.energy.gov
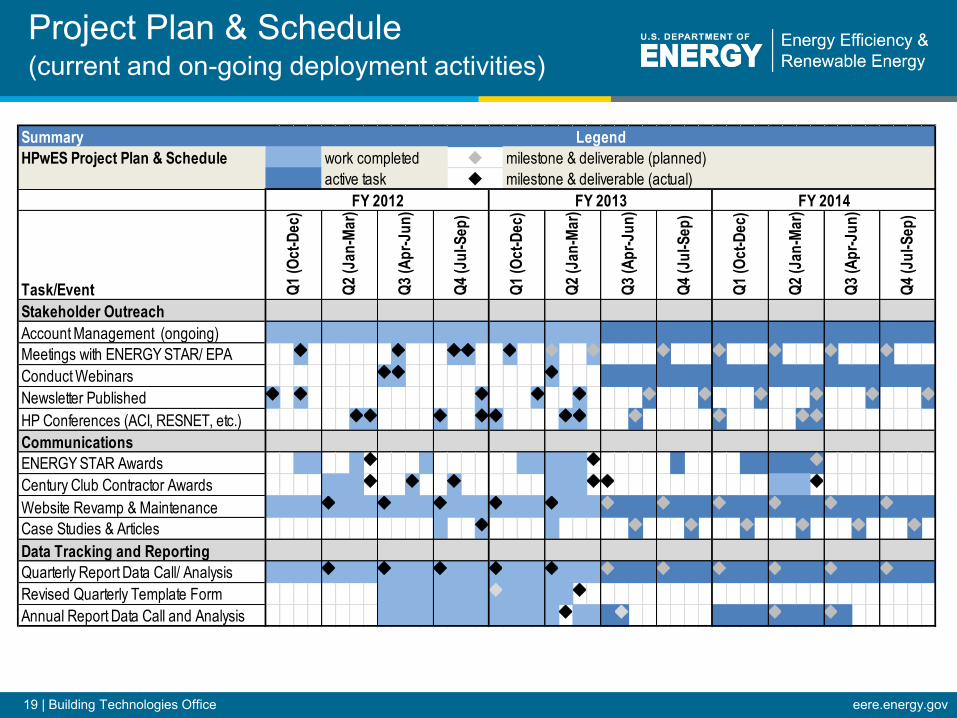
Project Plan & Schedule (current and on-going deployment activities)
Summary
HPwES Project Plan & Schedule work completed milestone & deliverable (planned)
active task
Task/Event
Stakeholder Outreach
Account Management (ongoing)
Meetings with ENERGY STAR/ EPA u u u u u u u u u u u u
Conduct Webinars u u u
Newsletter Published u u u u u u u u u u u
HP Conferences (ACI, RESNET, etc.) u u u u u u u u u u u
Communications
ENERGY STAR Awards u u u
Century Club Contractor Awards u u u u u u
Website Revamp & Maintenance u u u u u u u u u u u
Case Studies & Articles u u u u u u u
Data Tracking and Reporting
Quarterly Report Data Call/ Analysis u u u u u u u u u u u
Revised Quarterly Template Form u u
Annual Report Data Call and Analysis u u u u
Legend
Q1
(O
ct-
De
c)
Q2
(J
an
-Ma
r)
Q3
(A
pr-
Ju
n)
Q4
(J
ul-
Se
p)
u
u
Q2
(J
an
-Ma
r)
Q3
(A
pr-
Ju
n)
Q4
(J
ul-
Se
p)
FY 2013
Q1
(O
ct-
De
c)
Q1
(O
ct-
De
c)
Q2
(J
an
-Ma
r)
Q3
(A
pr-
Ju
n)
milestone & deliverable (actual)
FY 2014
Q4
(J
ul-
Se
p)
FY 2012
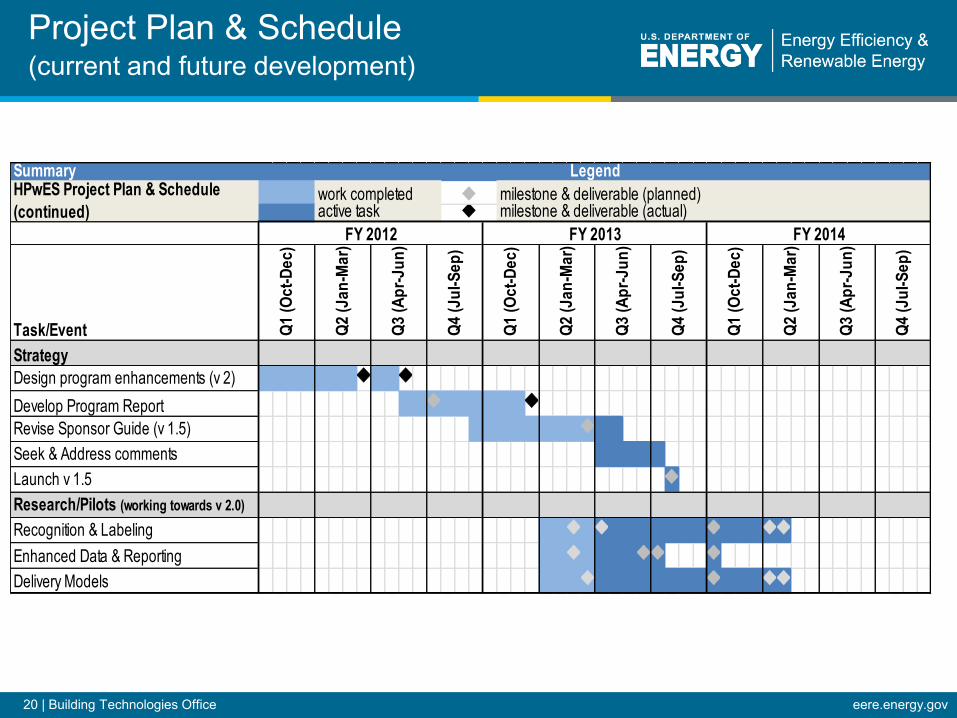
20 | Building Technologies Office eere.energy.gov
Project Plan & Schedule (current and future development)
Summary
work completed milestone & deliverable (planned)active task
Task/Event
Strategy
Design program enhancements (v 2) u uDevelop Program Report u u
Revise Sponsor Guide (v 1.5) u
Seek & Address comments
Launch v 1.5 u
Research/Pilots (working towards v 2.0)
Recognition & Labeling u u u u u
Enhanced Data & Reporting u u u u
Delivery Models u u u u
Legend
FY 2012 FY 2013 FY 2014
Q3
(A
pr-
Ju
n)
Q4
(J
ul-
Se
p)
HPwES Project Plan & Schedule
(continued)
Q2
(J
an
-Ma
r)
Q3
(A
pr-
Ju
n)
Q4
(J
ul-
Se
p)
Q1
(O
ct-
De
c)
Q2
(J
an
-Ma
r)
Q1
(O
ct-
De
c)
Q2
(J
an
-Ma
r)
Q3
(A
pr-
Ju
n)
Q4
(J
ul-
Se
p)
Q1
(O
ct-
De
c)
u
u milestone & deliverable (actual)
21 | Building Technologies Office eere.energy.gov
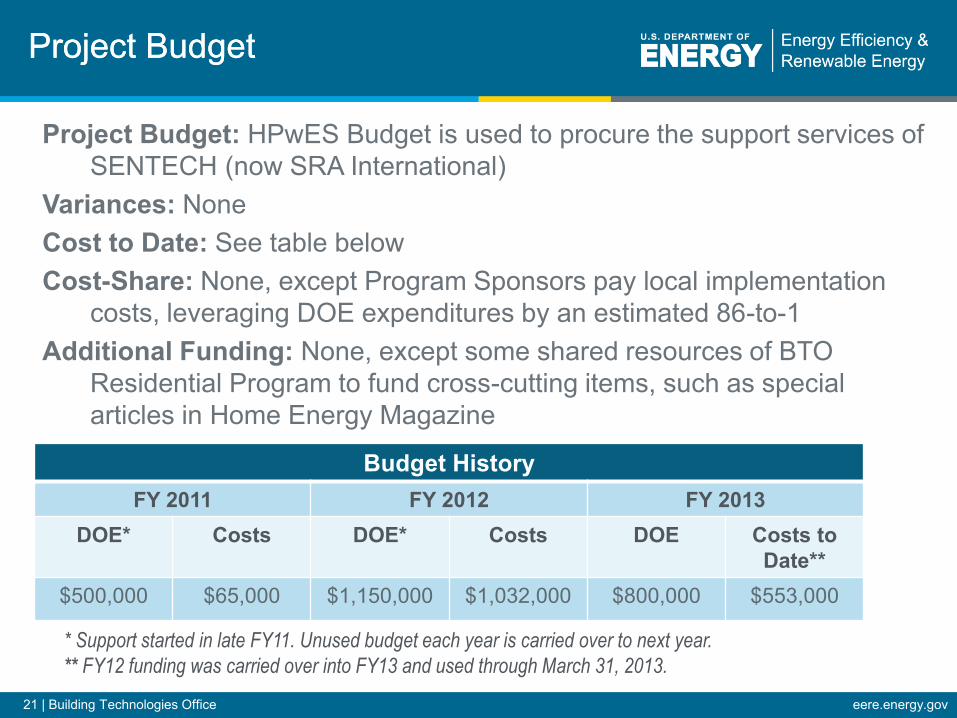
Project Budget Project Budget
Project Budget: HPwES Budget is used to procure the support services of SENTECH (now SRA International)
Variances: None Cost to Date: See table below Cost-Share: None, except Program Sponsors pay local implementation
costs, leveraging DOE expenditures by an estimated 86-to-1 Additional Funding: None, except some shared resources of BTO
Residential Program to fund cross-cutting items, such as special articles in Home Energy Magazine
* Support started in late FY11. Unused budget each year is carried over to next year.
** FY12 funding was carried over into FY13 and used through March 31, 2013.
Budget History FY 2011 FY 2012 FY 2013
DOE* Costs DOE* Costs DOE Costs to Date**
$500,000 $65,000 $1,150,000 $1,032,000 $800,000 $553,000
22 | Building Technologies Office eere.energy.gov
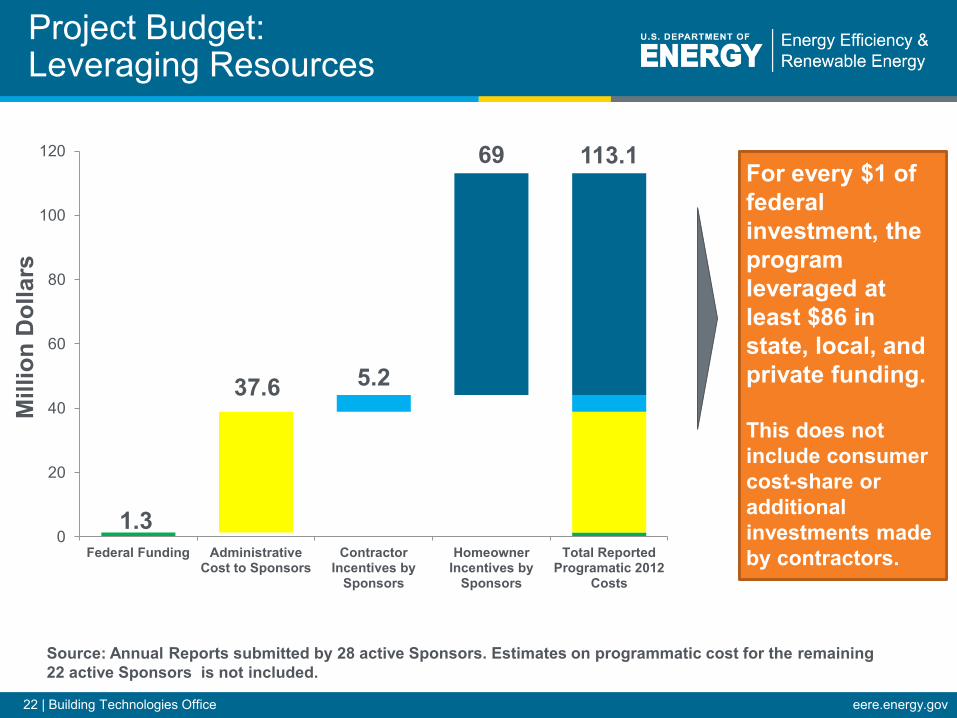
Project Budget: Leveraging Resources
1.3
37.6 5.2
69 113.1
0
20
40
60
80
100
120
Federal Funding AdministrativeCost to Sponsors
ContractorIncentives by
Sponsors
HomeownerIncentives by
Sponsors
Total ReportedProgramatic 2012
Costs
Mill
ion
Dol
lars
For every $1 of federal investment, the program leveraged at least $86 in state, local, and private funding. This does not include consumer cost-share or additional investments made by contractors.
Source: Annual Reports submitted by 28 active Sponsors. Estimates on programmatic cost for the remaining 22 active Sponsors is not included.
23 | Building Technologies Office eere.energy.gov
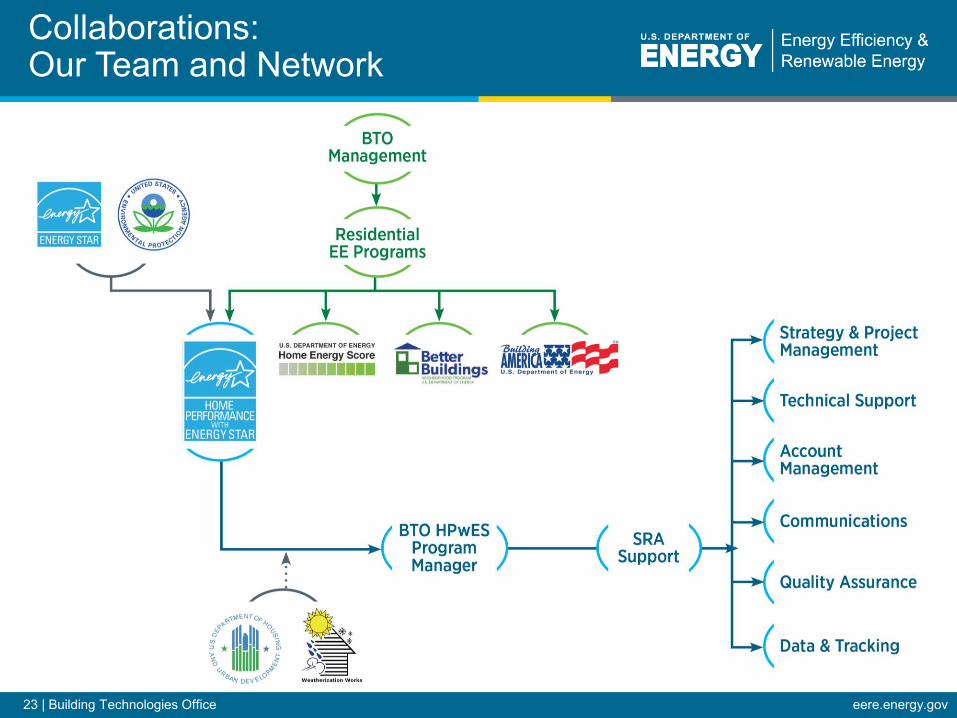
Collaborations: Our Team and Network
24 | Building Technologies Office eere.energy.gov
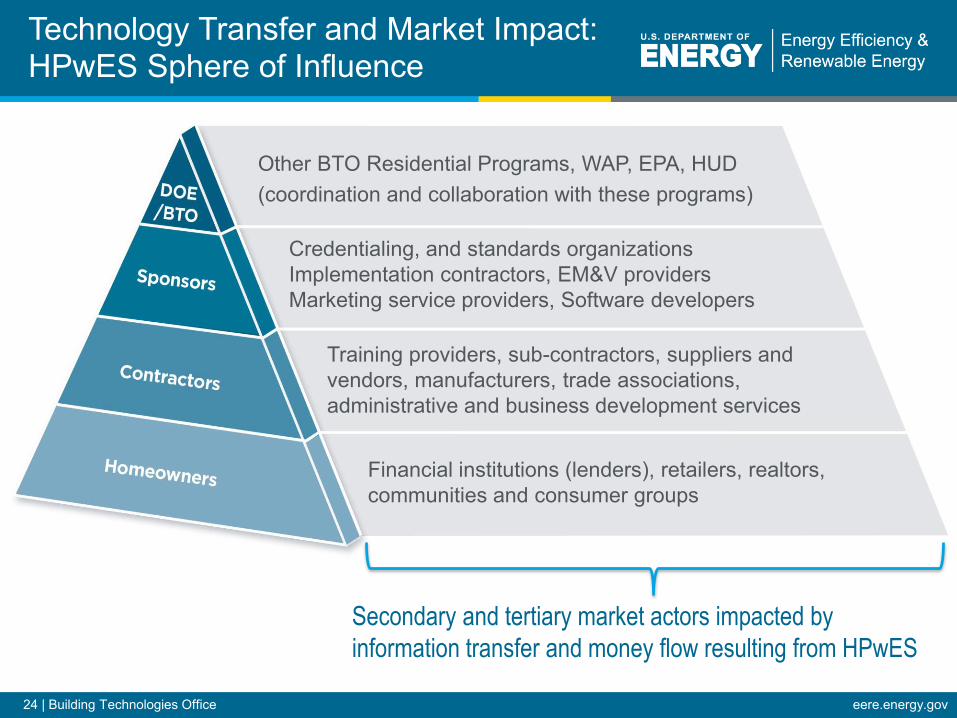
Technology Transfer and Market Impact: HPwES Sphere of Influence
Other BTO Residential Programs, WAP, EPA, HUD (coordination and collaboration with these programs)
Credentialing, and standards organizations Implementation contractors, EM&V providers Marketing service providers, Software developers
Training providers, sub-contractors, suppliers and vendors, manufacturers, trade associations, administrative and business development services
Financial institutions (lenders), retailers, realtors, communities and consumer groups
Secondary and tertiary market actors impacted by
information transfer and money flow resulting from HPwES
25 | Building Technologies Office eere.energy.gov
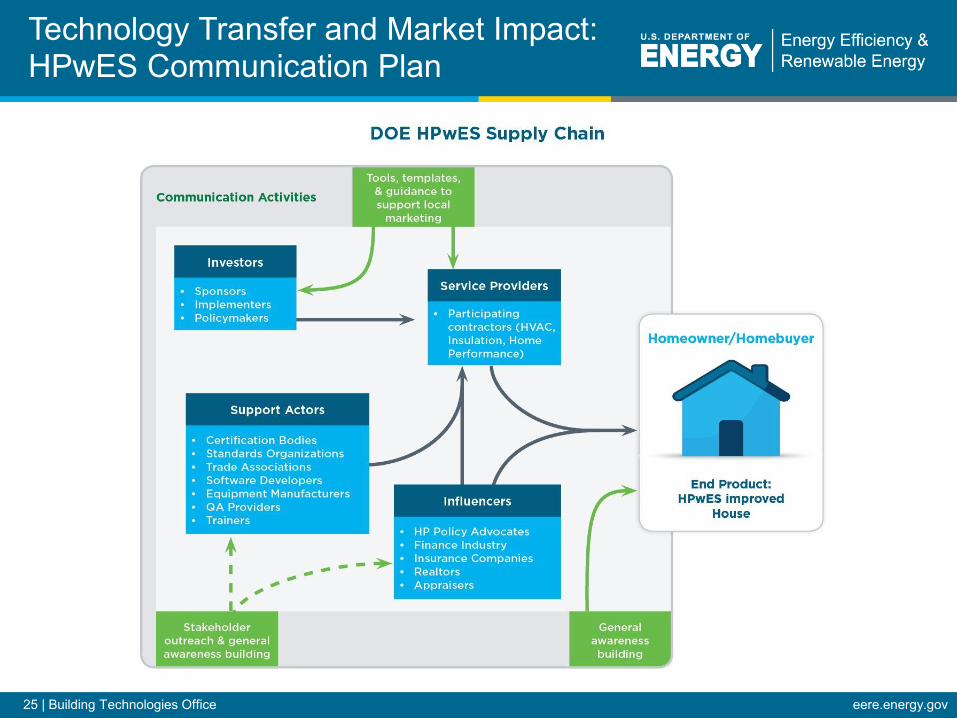
Technology Transfer and Market Impact: HPwES Communication Plan
26 | Building Technologies Office eere.energy.gov
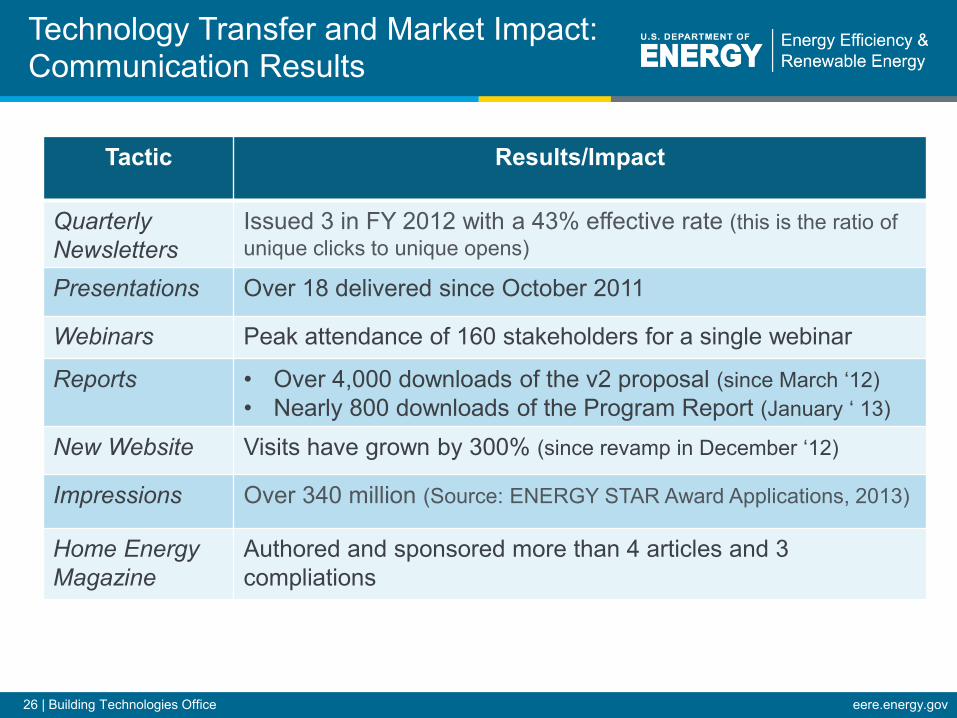
Technology Transfer and Market Impact: Communication Results
Tactic Results/Impact
Quarterly Newsletters
Issued 3 in FY 2012 with a 43% effective rate (this is the ratio of unique clicks to unique opens)
Presentations Over 18 delivered since October 2011
Webinars Peak attendance of 160 stakeholders for a single webinar
Reports • Over 4,000 downloads of the v2 proposal (since March ‘12) • Nearly 800 downloads of the Program Report (January ‘ 13)
New Website Visits have grown by 300% (since revamp in December ‘12)
Impressions Over 340 million (Source: ENERGY STAR Award Applications, 2013)
Home Energy Magazine
Authored and sponsored more than 4 articles and 3 compliations
27 | Building Technologies Office eere.energy.gov
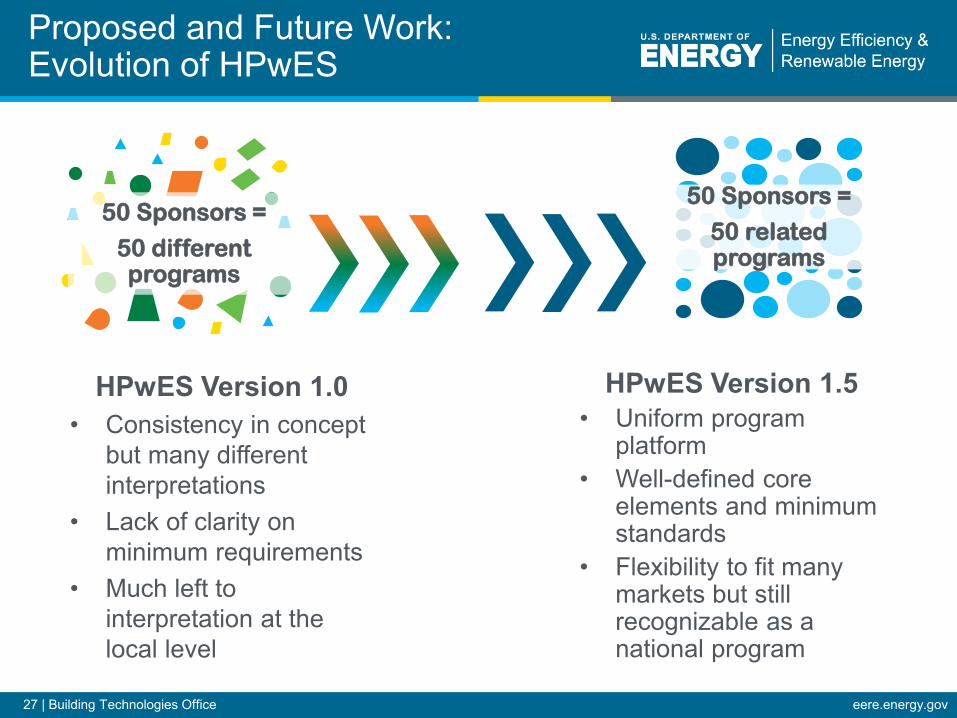
Proposed and Future Work: Evolution of HPwES
50 Sponsors =
50 different programs
50 Sponsors =
50 related programs
HPwES Version 1.0 • Consistency in concept
but many different interpretations
• Lack of clarity on minimum requirements
• Much left to interpretation at the local level
HPwES Version 1.5 • Uniform program
platform • Well-defined core
elements and minimum standards
• Flexibility to fit many markets but still recognizable as a national program
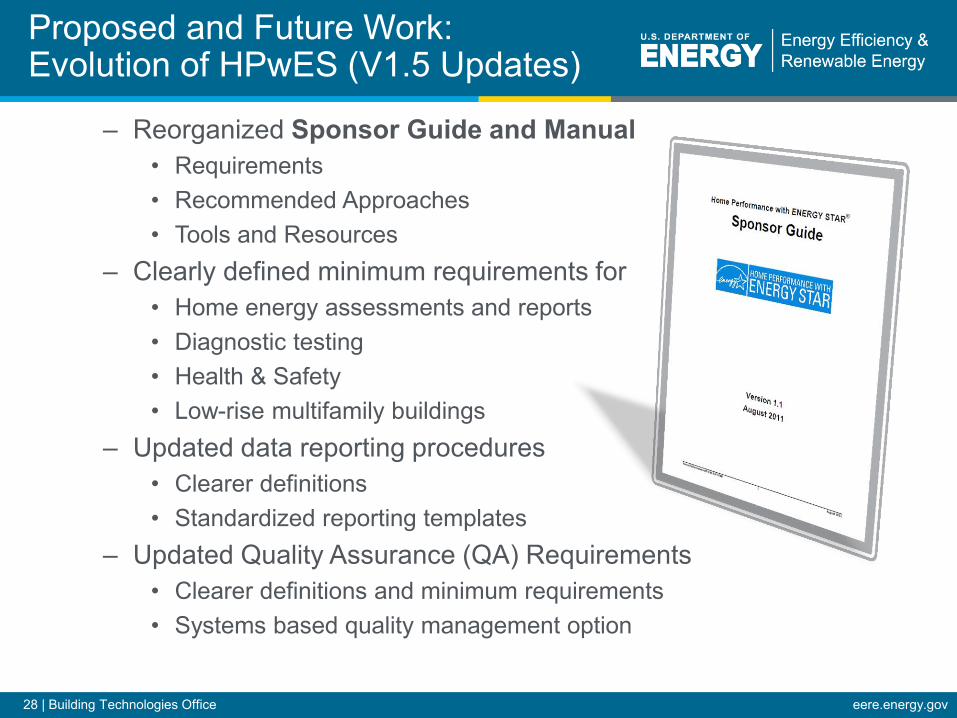
28 | Building Technologies Office eere.energy.gov
– Reorganized Sponsor Guide and Manual • Requirements • Recommended Approaches • Tools and Resources
– Clearly defined minimum requirements for • Home energy assessments and reports • Diagnostic testing • Health & Safety • Low-rise multifamily buildings
– Updated data reporting procedures • Clearer definitions • Standardized reporting templates
– Updated Quality Assurance (QA) Requirements • Clearer definitions and minimum requirements • Systems based quality management option
Proposed and Future Work: Evolution of HPwES (V1.5 Updates)
29 | Building Technologies Office eere.energy.gov
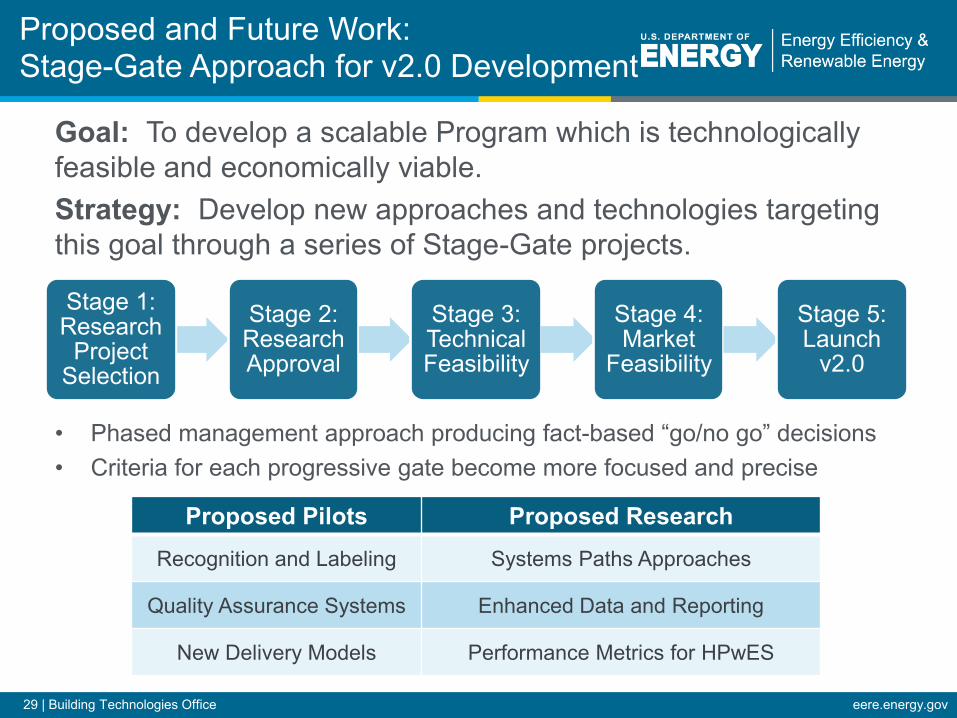
Proposed and Future Work: Stage-Gate Approach for v2.0 Development
• Phased management approach producing fact-based “go/no go” decisions • Criteria for each progressive gate become more focused and precise
Stage 1: Research
Project Selection
Stage 2: Research Approval
Stage 3: Technical Feasibility
Stage 4: Market
Feasibility
Stage 5: Launch
v2.0
Proposed Pilots Proposed Research Recognition and Labeling Systems Paths Approaches
Quality Assurance Systems Enhanced Data and Reporting
New Delivery Models Performance Metrics for HPwES
Goal: To develop a scalable Program which is technologically feasible and economically viable. Strategy: Develop new approaches and technologies targeting this goal through a series of Stage-Gate projects.
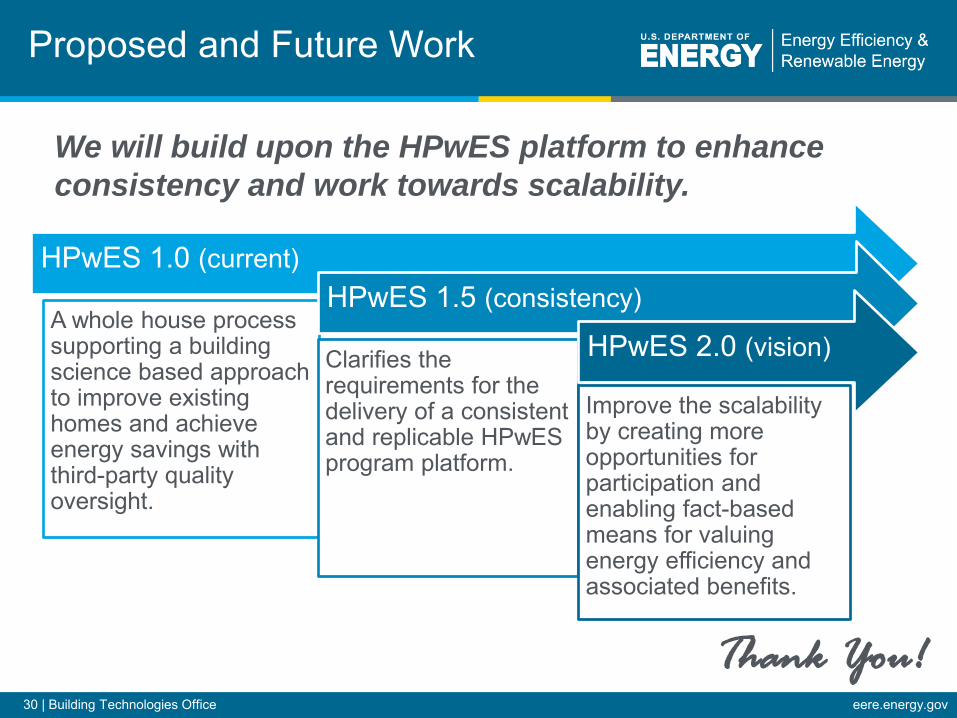
30 | Building Technologies Office eere.energy.gov
We will build upon the HPwES platform to enhance
consistency and work towards scalability.
Proposed and Future Work
HPwES 1.0 (current)
A whole house process supporting a building science based approach to improve existing homes and achieve energy savings with third-party quality oversight.
HPwES 1.5 (consistency)
Clarifies the requirements for the delivery of a consistent and replicable HPwES program platform.
HPwES 2.0 (vision)
Improve the scalability by creating more opportunities for participation and enabling fact-based means for valuing energy efficiency and associated benefits.
Thank You!