Embed Size (px)
Citation preview

Journal of the Mechanics and Physics of Solids 138 (2020) 103923
Contents lists available at ScienceDirect
Journal of the Mechanics and Physics of Solids
journal homepage: www.elsevier.com/locate/jmps
Buckling of pressurized spherical shells containing a
through-thickness defect
Dong Yan, Matteo Pezzulla, Pedro M. Reis ∗
Flexible Structures Laboratory, Institute of Mechanical Engineering, École Polytechnique Fédérale de Lausanne, 1015 Lausanne, Switzerland
a r t i c l e i n f o
Article history:
Received 4 October 2019
Revised 17 January 2020
Accepted 19 February 2020
Available online 28 February 2020
Keywords:
Shell buckling
Thickness defect
Knockdown factor
Buckling regimes
a b s t r a c t
We present a study on the pressure buckling of thin, elastic spherical shells containing
a thickness defect. Methodologically, we combine precision model experiments, finite ele-
ment simulations, and a reduced axisymmetric shell model. We observe qualitatively dif-
ferent buckling behavior by varying the geometry of the defect: either one buckling event
or two events comprising local buckling at the defect and global buckling of the entire
shell. We systematically analyze the loading path for the imperfect shell under prescribed
pressure or volume change and identify three buckling regimes. We then explore a wide
parameter space to study the dependence of the buckling regimes on the defect geometry,
thus obtaining a phase diagram with quantitative relationships between critical buckling
pressures and defect geometry. We find that the global buckling becomes insensitive to
the defect beyond a critical value of its amplitude, and we demonstrate that the buckling
regimes are governed by the three geometric parameters of the defect, namely its width,
amplitude and the width of the transition region across the edge of the defect.
© 2020 Elsevier Ltd. All rights reserved.
1. Introduction
Shell structures are observed regularly in nature and employed routinely in technology, across length scales, with the
buckling of shells often playing an important role in biology ( Katifori et al., 2010; Lidmar et al., 2003; Yin et al., 2008 ) and in
the design of engineering structures ( Hilburger, 2012; Pedersen and Jensen, 1995 ). From a traditional view point, the catas-
trophic collapse caused by buckling is seen as the first route to the failure of structures, thus large effort s have been made
to understand shell buckling and provide criteria or predictions for the critical buckling load for structural design ( Babcock,
1983; Hilburger et al., 2006; Samuelson and Eggwertz, 1992 ). In the recent decades, the large deformation accompanying
buckling has been seen as an opportunity for shape morphing in the design of novel materials and structures with new
functionalities ( Reis, 2015; Shim et al., 2012; Wang et al., 2014; Xu et al., 2015 ). This new perspective has stimulated fur-
ther research on the fundamental aspect of buckling, with a particular attention to imperfection sensitivity and probing
forces ( Baumgarten and Kierfeld, 2018; 2019; Gerasimidis et al., 2018; Haynie et al., 2012; Hutchinson, 2016; Hutchinson
and Thompson, 2017a; 2017b; Knoche and Kierfeld, 2011; 2014; Kriegesmann et al., 2012; Lee et al., 2016b; Marthelot et al.,
2017; Paulose and Nelson, 2013; Virot et al., 2017 ). In these recent studies, cylindrical shells under axial compression and
spherical shells under external pressure are two common settings used to understand the underlying mechanism of shell
∗ Corresponding author.
E-mail addresses: [email protected] (D. Yan), [email protected] (M. Pezzulla), [email protected] (P.M. Reis).
https://doi.org/10.1016/j.jmps.2020.103923
0022-5096/© 2020 Elsevier Ltd. All rights reserved.

2 D. Yan, M. Pezzulla and P.M. Reis / Journal of the Mechanics and Physics of Solids 138 (2020) 103923
buckling and its imperfection sensitivity. In this paper, we will focus on the pressure buckling of spherical shells, for which
we now review the relevant literature.
Under uniform pressure loading, the classic prediction for the critical buckling load of a perfect spherical shell with
radius R and thickness h o is ( Zoelly, 1915 )
p c =
2 E √
3(1 − ν2 )
(R
h o
)−2
, (1)
where E and ν are the Young’s modulus and Poisson’s ratio of the material, respectively. However, this theoretical prediction
always overpredicts the buckling pressure, p max , measured in experiments ( Carlson et al., 1967; Kaplan and Fung, 1954;
Krenzke and Kiernan, 1963; Tsien, 1942 ). The ratio of p max to p c defines the knockdown factor of a shell, quantifying the
difference between the actual buckling load and the theoretical prediction, as
κd =
p max
p c . (2)
From the survey of historical experimental results presented in our previous work ( Lee et al., 2016b ), knockdown factors
are widely distributed and fall in the range between 0.1 and 0.3, for the worst cases. The low value of knockdown factors
and their large variability are due to the high imperfection sensitivity of shells, since pressure buckling is a subcritical
bifurcation. These imperfections often arise during the fabrication process within the material or the geometry of the shell.
The imperfection-sensitive nature of shell buckling requires the proper consideration of defects in both theory and sim-
ulations in order to attain a reliable prediction of the critical buckling load. The first attempts to rationalize the knockdown
factor were carried out by von Kármán and Tsien (1939) and Tsien (1942) . Subsequently, Koiter (1945) developed a general
theory for the stability of elastic systems subject to a conservative loading, in which the imperfection sensitivity was re-
lated to the initial post-buckling behavior of the perfect structure. Since then, several studies based on Koiter’s theory have
been conducted to assess the effect of imperfections of different types, including geometry ( Budiansky and Hutchinson,
1972; Hutchinson et al., 1971 ), loading ( Bijlaard and Gallagher, 1960 ), and boundary conditions ( Kobayashi, 1968 ). Nonethe-
less, this body of work has led mostly to a qualitative understanding of the intricate relationship between critical load and
imperfections. Statistical approaches have also been explored to study the imperfection sensitivity, although this requires
the knowledge of defect distributions that cannot be easily obtained ( Elishakoff, 2014 ). The lack of a fabrication technique
where defects could be eliminated or at least controlled made it difficult to test theoretical predictions against precision
experimental results involving a systematic exploration of the primary parameters. For decades, experiments lagged behind
both theory and simulations ( Chen, 1959; Hutchinson et al., 1971; Seaman, 1962 ). This gap between theory and experiments
results in a fundamental lack of understanding, which has so far forced the practical design of shells to be based on dated
empirical guidelines that largely overestimate the critical loads to guarantee safety.
In engineering practice, with the development of advanced fabrication techniques, imperfections in shell structures have
been remarkably reduced. Therefore, the old design guidelines tend to be overly conservative and no longer applicable to
the current structural design ( Hilburger, 2012 ). Additionally, buckling is increasingly being used to achieve functionality as
in microcapsules ( Datta et al., 2012; Vian and Amstad, 2019 ), metamaterials ( Kochmann and Bertoldi, 2017; Rafsanjani et al.,
2019 ), and robots ( Jampani et al., 2018; Whitesides, 2018 ). As such, a thorough understanding of how defects interact with
buckling is desirable, so as to be able to tune the buckling conditions on demand.
A breakthrough in experiments was recently made by Lee et al. (2016a) with the development of a rapid prototyping
technique to fabricate thin shells that are applicable to precision laboratory research settings. This technique is based on
coating a spherical mold with a polymer solution, and can be modified to allow for the precise engineering of a defect in
the shell ( Lee et al., 2016b; 2019; Marthelot et al., 2017 ). By modifying the original coating technique, Lee et al. (2016b) in-
troduced a local dimple-like geometric defect to the shell, whose amplitude and width could be varied systematically. The
authors then reported the quantitative relationship between the knockdown factor and defect geometry. In parallel, simula-
tions through finite element modeling (FEM) and a numerical analysis based on small-strain and moderate-rotation theory
were also carried out, yielding results in good agreement with experiments. This study demonstrated that the knockdown
factor can be accurately predicted, provided the imperfections are taken into account and modeled appropriately.
The experimental advances mentioned above have played an important role on revival of the interest on the buck-
ling of both perfect and imperfect shells ( Hutchinson, 2016; Hutchinson and Thompson, 2017a; 2017b; 2018 ). In particu-
lar, Hutchinson (2016) studied the load-carrying behavior of imperfect shells subject to uniform external pressure in the
pre-buckling and post-buckling regimes, showing a strong dependence of the knockdown factor on the type of the defect.
Gerasimidis et al. (2018) performed a systematic study through FEM simulations on the difference between a dimple-like
defect embedded in the geometry and a dimple-like defect created by a probing force. They concluded that the pertur-
bation induced by a probing force leads to larger knockdown factors than the equivalent geometric defect. Moreover, a
non-destructive probing technique was proposed and successfully applied in experiments to access the landscape of sta-
bility of cylindrical shells under axial compression, without any foreseeing on imperfections ( Hutchinson and Thompson,
2017b; Thompson, 2015; Thompson and Sieber, 2016; Virot et al., 2017 ). It is still debatable whether this technique can be
used for spherical shells ( Marthelot et al., 2017; Thompson et al., 2017 ).
Whereas several past studies have focused on the effect of defects of the geometry of the middle surface, much less
attention has been dedicated to imperfections in the thickness profile. Hutchinson et al. (1971) numerically studied the ef-

D. Yan, M. Pezzulla and P.M. Reis / Journal of the Mechanics and Physics of Solids 138 (2020) 103923 3
Rβ
xO
y
ho-δh
βh
ho
(A)
Zenith angle, β
Thickness, h
ho
ho-δh
δh
βhO
(B)
Fig. 1. (A) Schematic diagram of a shell containing a through-thickness defect. (B) Thickness profile as a function of the zenith angle.
fect of a local axisymmetric thickness variation on the buckling of cylindrical shells under axial compression. Experiments
on the buckling of non-homogeneous capsules under an external osmotic pressure were carried out by Datta et al. (2012) .
The capsule thickness was gradually varied from a minimum value at one of its poles to a maximum value at the other
pole. Both through experiments and simulations, it was found that the onset of buckling initiates from the thinner region,
which, therefore, sets the critical osmotic pressure. In a related study, Paulose and Nelson (2013) numerically investigated
the buckling of spherical shells with a thinner region under prescribed pressure loading. The shell exhibited different buck-
ling pathways affected by the soft spot; either a single buckling event or two separate buckling events could be observed.
They also analyzed the dependence of buckling transitions on the dimensions of the soft spot through numerical simulations
and theoretical arguments. These studies motivate a research effort to fundamentally understand the influence of thickness
defect on the buckling of spherical shells via experiments, FEM, and reduced shell theory.
Here, we study the buckling of pressurized spherical shells containing a defect consisting in a localized region of reduced
thickness. Our focus is to both quantify and rationalize how this through-thickness imperfection modifies the critical buckling
conditions compared to the classic prediction of Eq. (1) , i.e. , the knockdown factor. Qualitatively different buckling behavior
depending on the geometry of the defect is observed and analyzed by combining experiments, finite element simulations,
and axisymmetric shell theory. We identify three distinct buckling regimes involving local buckling at the defect and global
buckling of the entire shell. The quantitative results are summarized in a phase diagram, where the relationships between
critical buckling pressures and defect geometry are elucidated.
Our paper is organized as follows. In Section 2 , we define our problem, and the experimental, numerical and theoretical
methodology followed to investigate it is presented in Section 3 . The experimental results of the critical buckling pres-
sures of our fabricated shells are reported in Section 4 . In parallel, we perform FEM simulations using the experimentally
measured geometric profiles and validate the FEM against experiments. In Section 5 , we then use the validated FEM to sys-
tematically study the buckling behavior of spherical shells affected by the through-thickness defect in a wider parameter
space than that available experimentally. Furthermore, we juxtapose predictions from the axisymmetric shell theory onto
the FEM results. In Section 6 , we discuss and summarize our findings.
2. Definition of the problem
We consider a thin, elastic, imperfect hemispherical shell of radius, R , and thickness, h o , clamped at its equator and
loaded under uniform pressure (see schematic in Fig. 1 ). The shell is imperfect since it contains a through-thickness defect
at its pole, where there is a local region of reduced thickness; the thickness is constant elsewhere ( h o ). Let β be the zenith
angle with the north pole located at β = 0 . The through-thickness defect is located in the region 0 ≤ β ≤ βh , where βh is
the half angular width of the defect, and the shell thickness is h o − δh . We shall refer to δh as the amplitude of the defect,
and h o as the nominal thickness of the shell.
To generalize the description of the through-thickness defect, we consider a hyperbolic tangent profile
δ(β) =
1
2
δh
(1 − tanh
(β − βh
γh
)), (3)
where γ h is an angular parameter setting the width of the transition region across the edge of the defect. Consequently, the
thickness profile of the imperfect shell is
h (β) = h o − δ(β) . (4)
Overall, the geometry of the generalized through-thickness defect is characterized by its amplitude δh , half angular width βh ,
and the transition-region parameter γ h . We normalize δh and h ( β) by the nominal thickness, h o , to define the nor-
malized defect amplitude δh = δh /h o ∈ [0 , 1) and the normalized thickness profile h (β) . Following Hutchinson (2016) ,
Lee et al. (2016b) and López Jiménez et al. (2017) , who showed that the buckling behavior of thin elastic shells is inde-
pendent of the radius-to-thickness ratio, we scale βh and γ h , respectively, as
βh = βh
(√
12(1 − ν2 ) R/h o
) 1 2
, (5)
4 D. Yan, M. Pezzulla and P.M. Reis / Journal of the Mechanics and Physics of Solids 138 (2020) 103923
Compressed air
Nozzle
Shell
10mm
Mold
VPS(A1) (A2)
(A4) (A3)
(B)
R
βxO
y
δh
βh
ho
Air flow
Nozzle
dnozzle
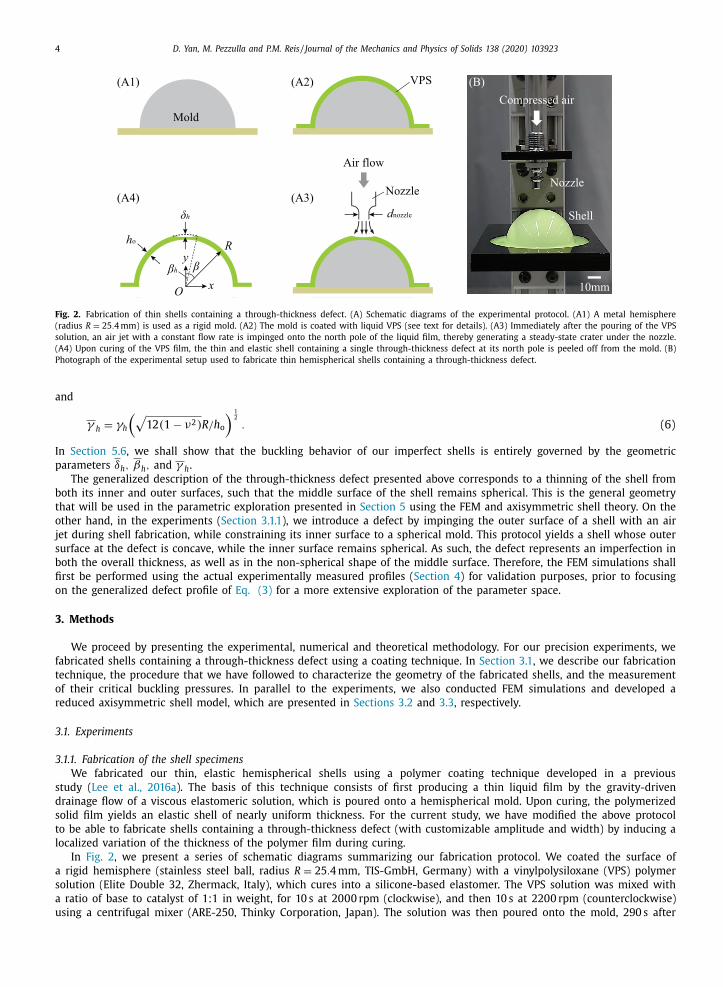
Fig. 2. Fabrication of thin shells containing a through-thickness defect. (A) Schematic diagrams of the experimental protocol. (A1) A metal hemisphere
(radius R = 25 . 4 mm) is used as a rigid mold. (A2) The mold is coated with liquid VPS (see text for details). (A3) Immediately after the pouring of the VPS
solution, an air jet with a constant flow rate is impinged onto the north pole of the liquid film, thereby generating a steady-state crater under the nozzle.
(A4) Upon curing of the VPS film, the thin and elastic shell containing a single through-thickness defect at its north pole is peeled off from the mold. (B)
Photograph of the experimental setup used to fabricate thin hemispherical shells containing a through-thickness defect.
and
γ h = γh
(√
12(1 − ν2 ) R/h o
) 1 2
. (6)
In Section 5.6 , we shall show that the buckling behavior of our imperfect shells is entirely governed by the geometric
parameters δh , βh , and γ h .
The generalized description of the through-thickness defect presented above corresponds to a thinning of the shell from
both its inner and outer surfaces, such that the middle surface of the shell remains spherical. This is the general geometry
that will be used in the parametric exploration presented in Section 5 using the FEM and axisymmetric shell theory. On the
other hand, in the experiments ( Section 3.1.1 ), we introduce a defect by impinging the outer surface of a shell with an air
jet during shell fabrication, while constraining its inner surface to a spherical mold. This protocol yields a shell whose outer
surface at the defect is concave, while the inner surface remains spherical. As such, the defect represents an imperfection in
both the overall thickness, as well as in the non-spherical shape of the middle surface. Therefore, the FEM simulations shall
first be performed using the actual experimentally measured profiles ( Section 4 ) for validation purposes, prior to focusing
on the generalized defect profile of Eq. (3) for a more extensive exploration of the parameter space.
3. Methods
We proceed by presenting the experimental, numerical and theoretical methodology. For our precision experiments, we
fabricated shells containing a through-thickness defect using a coating technique. In Section 3.1 , we describe our fabrication
technique, the procedure that we have followed to characterize the geometry of the fabricated shells, and the measurement
of their critical buckling pressures. In parallel to the experiments, we also conducted FEM simulations and developed a
reduced axisymmetric shell model, which are presented in Sections 3.2 and 3.3 , respectively.
3.1. Experiments
3.1.1. Fabrication of the shell specimens
We fabricated our thin, elastic hemispherical shells using a polymer coating technique developed in a previous
study ( Lee et al., 2016a ). The basis of this technique consists of first producing a thin liquid film by the gravity-driven
drainage flow of a viscous elastomeric solution, which is poured onto a hemispherical mold. Upon curing, the polymerized
solid film yields an elastic shell of nearly uniform thickness. For the current study, we have modified the above protocol
to be able to fabricate shells containing a through-thickness defect (with customizable amplitude and width) by inducing a
localized variation of the thickness of the polymer film during curing.
In Fig. 2 , we present a series of schematic diagrams summarizing our fabrication protocol. We coated the surface of
a rigid hemisphere (stainless steel ball, radius R = 25 . 4 mm, TIS-GmbH, Germany) with a vinylpolysiloxane (VPS) polymer
solution (Elite Double 32, Zhermack, Italy), which cures into a silicone-based elastomer. The VPS solution was mixed with
a ratio of base to catalyst of 1:1 in weight, for 10 s at 20 0 0 rpm (clockwise), and then 10 s at 2200 rpm (counterclockwise)
using a centrifugal mixer (ARE-250, Thinky Corporation, Japan). The solution was then poured onto the mold, 290 s after

D. Yan, M. Pezzulla and P.M. Reis / Journal of the Mechanics and Physics of Solids 138 (2020) 103923 5
Table 1
Nozzle diameters, flow rates, and the yielded defect ampli-
tudes in fabrication.
Nozzle diameter Flow rate Defect amplitude
d nozzle [mm] q [L/min] δh
3.5 [0.4, 1.6] [0.06, 0.83]
4.0 [0.6, 3.0] [0.18, 0.80]
4.8 [0.5, 4.0] [0.03, 0.73]
the mixing so as to increase its viscosity to a desired value ( Lee et al., 2016a ). The gravity-driven viscous flow yielded a
thin polymer layer with nearly uniform thickness. Immediately after pouring, a steady jet of compressed air with a constant
flow rate coming out of a nozzle (diameter d nozzle , fixed at a height of 15 mm above the mold) was imposed to steadily
impinge onto the pole of the polymer film until it cured. Since this film was constrained at its inner surface by the rigid
hemispherical mold, a crater was generated on the outer surface of the film as a result of the air impingement. This crater of
amplitude δh set the thin region in the shell. The drainage of excess polymer formed a thicker band (puddle) at the equator,
approximately 3 mm in thickness, which ensures the clamped boundary condition there.
Upon curing (in approximately 20 min at room temperature 22 ± 0.4 ◦C), the polymer film was peeled from the mold,
yielding a thin, elastic hemispherical shell containing a through-thickness defect. The fabricated defect comprises a region
in the shell of reduced thickness, but, as we mentioned in Section 2 , it also modifies the shape of the middle surface. The
produced defect is, therefore, a combination of a ‘pure’ through-thickness defect and a dimple-like geometric defect. How-
ever, as we shall show in Section 5 , with this defect, the experimental shells exhibit buckling behavior that is qualitatively
similar to shells containing the pure through-thickness defect described by Eq. (3) .
To characterize the nominal thickness, h o , of the shells, we cut off a narrow strip ( ≈ 2 × 6 mm
2 ) from the shell,
along a meridian at β = 45 ◦ and measured the thickness of this strip using a microscope (VHX-50 0 0, Keyence Corporation,
Japan). Note that the thickness measurements were performed after the buckling pressure measurements ( Section 3.1.3 ), so
as to have the precise thickness value for the specimen used for a specific measurement. As demonstrated in our previous
work ( Lee et al., 2016a ), shells with different values of h o could have been attained by varying the waiting time between the
preparation of the polymer solution and the moment of pouring onto the mold. However, given the otherwise already vast
parameter space, in our experiments, we have decided to fix the nominal thickness at h o = 269 ± 10 μm (the uncertainty
corresponds to the standard deviation of 42 fabricated shells), which translates into a radius-to-thickness ratio of R/h o = 94 .
The fabrication technique developed here also allows us to systematically tune the amplitude of the defect by varying the
air flow rate, q , and the width of the defect by varying the nozzle diameter, d nozzle . Impinging the polymer layer at a higher
flow rate will produce a deeper crater, and, hence, a larger defect amplitude. We have used three different nozzles with
diameters d nozzle = { 3 . 5 , 4 . 0 , 4 . 8 } mm. For each nozzle, we adjusted the air flow rate to vary defect amplitude and obtained
three sets of shells ( Table 1 ). Next, we detail the characterization of the geometry of these defects.
3.1.2. Characterization of the defect geometry through profilometry
We characterized the geometry of the experimental shells containing a through-thickness defect using an optical pro-
filometer (VR-3200, Keyence Corporation, Japan). After curing but prior to demolding the shell, the 3D profile of its outer
surface was measured and averaged latitude-wise to obtain an axisymmetric 2D profile, Y o ( x ), with the pole located at (0,
Y o (0)). Since, during these measurements, the shell was still adhered to the rigid mold, we assume that its inner surface is
a hemisphere of radius R = 25 . 4 mm. After the experimental campaign of critical pressure was completed for a particular
shell (more details in Section 3.1.3 ), we cut off a small piece at the pole of the shell and also measured the local thickness
there, h p . Then, the centroid of the shell was determined as O (0 , Y o (0) − h p − R ) . With this information at hand, we can now
transform Y o ( x ), the 2D profile of the outer surface, from the ( x, y ) Cartesian coordinates into the ( r, β) polar coordinates
with the origin at O , as R o ( β). Naturally, the 2D profile of the inner surface is R i (β) = R . Then, the radial distance between
the two surfaces, h (β) = R o (β) − R i (β) , is the thickness profile of the shell. Due to limitations in the field of view of our
optical profilometer, we could only measure the profile in the range of approximately 0 ≤ β ≤ π /6, which can, however, still
fully cover all the defects of the experimental shells investigated. Out of this range, the thickness is assumed to transition
linearly to h o at β = π/ 4 and then keep a constant of h o from β = π/ 4 to π /2.
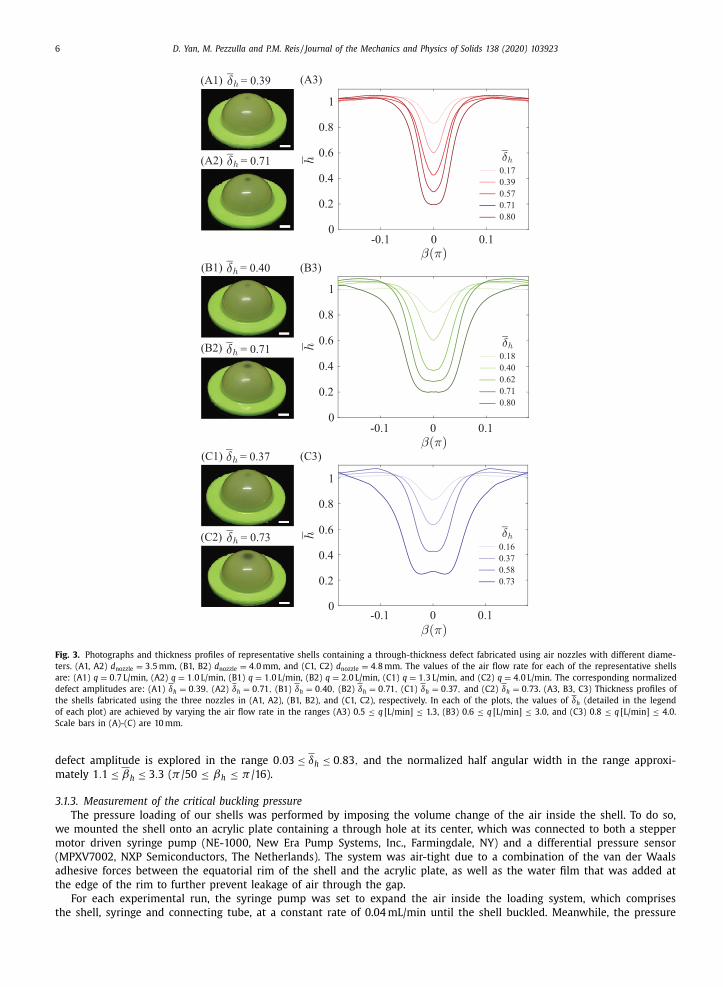
In Fig. 3 , we present three sets of representative thickness profiles (normalized by the nominal thickness h o ) of shells
fabricated using the three nozzles with increasing diameters d nozzle = { 3 . 5 , 4 . 0 , 4 . 8 } mm. All thickness profiles exhibit a min-
imum near the defect, at β = 0 , and gradually recover to the nominal thickness towards the equator. For each set, we tuned
the defect amplitude by adjusting the flow rate of the air jet that impinged the uncured polymer film during the coating
process. For example, with d nozzle = 3 . 5 mm ( Fig. 3 A), the normalized defect amplitude δh is increased from 0.17 to 0.80 by
increasing the air flow rate from 0.5 to 1.3 L/min. The defect width also increases with nozzle diameter, a trend that becomes
more pronounced for larger defect amplitudes.
In short, by adjusting the air flow rate and nozzle diameter, our experimental fabrication protocol allows us to fabricate
shells with a customizable defect amplitude and width, over a wide parameter range. In the experiments, the normalized
6 D. Yan, M. Pezzulla and P.M. Reis / Journal of the Mechanics and Physics of Solids 138 (2020) 103923
(A3)
(B3)
(C3)
(A1) = 0.39
= 0.71(A2)
= 0.73(C2)
(C1) = 0.37
= 0.71(B2)
(B1) = 0.40
0.170.390.570.710.80
-0.1 0 0.10
0.2
0.4
0.6
0.8
1
0.180.400.620.710.80
-0.1 0 0.10
0.2
0.4
0.6
0.8
1
0.160.370.580.73
-0.1 0 0.10
0.2
0.4
0.6
0.8
1
Fig. 3. Photographs and thickness profiles of representative shells containing a through-thickness defect fabricated using air nozzles with different diame-
ters. (A1, A2) d nozzle = 3 . 5 mm, (B1, B2) d nozzle = 4 . 0 mm, and (C1, C2) d nozzle = 4 . 8 mm. The values of the air flow rate for each of the representative shells
are: (A1) q = 0 . 7 L/min, (A2) q = 1 . 0 L/min, (B1) q = 1 . 0 L/min, (B2) q = 2 . 0 L/min, (C1) q = 1 . 3 L/min, and (C2) q = 4 . 0 L/min. The corresponding normalized
defect amplitudes are: (A1) δh = 0 . 39 , (A2) δh = 0 . 71 , (B1) δh = 0 . 40 , (B2) δh = 0 . 71 , (C1) δh = 0 . 37 , and (C2) δh = 0 . 73 . (A3, B3, C3) Thickness profiles of
the shells fabricated using the three nozzles in (A1, A2), (B1, B2), and (C1, C2), respectively. In each of the plots, the values of δh (detailed in the legend
of each plot) are achieved by varying the air flow rate in the ranges (A3) 0.5 ≤ q [L/min] ≤ 1.3, (B3) 0.6 ≤ q [L/min] ≤ 3.0, and (C3) 0.8 ≤ q [L/min] ≤ 4.0.
Scale bars in (A)-(C) are 10 mm.
defect amplitude is explored in the range 0 . 03 ≤ δh ≤ 0 . 83 , and the normalized half angular width in the range approxi-
mately 1 . 1 ≤ βh ≤ 3 . 3 ( π /50 ≤ βh ≤ π /16).
3.1.3. Measurement of the critical buckling pressure
The pressure loading of our shells was performed by imposing the volume change of the air inside the shell. To do so,
we mounted the shell onto an acrylic plate containing a through hole at its center, which was connected to both a stepper
motor driven syringe pump (NE-10 0 0, New Era Pump Systems, Inc., Farmingdale, NY) and a differential pressure sensor
(MPXV7002, NXP Semiconductors, The Netherlands). The system was air-tight due to a combination of the van der Waals
adhesive forces between the equatorial rim of the shell and the acrylic plate, as well as the water film that was added at
the edge of the rim to further prevent leakage of air through the gap.
For each experimental run, the syringe pump was set to expand the air inside the loading system, which comprises
the shell, syringe and connecting tube, at a constant rate of 0.04 mL/min until the shell buckled. Meanwhile, the pressure

D. Yan, M. Pezzulla and P.M. Reis / Journal of the Mechanics and Physics of Solids 138 (2020) 103923 7
differential between the outside (atmospheric pressure) and inside of the shell was monitored by the pressure sensor at
an acquisition rate of 1 Hz. For each tested shell, we obtained the evolution of the pressure loading, p , as a function of
the volume change imposed by the syringe, V im
. The critical buckling pressure is defined as the peak value of this signal,
which represents the load-carrying capacity of the shell. Note that, in the experiments, the imposed volume change of the
air inside the loading system, V im
, is not exactly the volume change of the pressurized shell, V , due to the compressibility
of air. Given the volume of the air inside our loading system and the stiffness of our shells, V im
for a perfect hemispherical
shell is ≈ 1.25 V , in the pre-buckling regime. We estimated this value using the ideal gas law at the initial state, pressure
differential p = 0 , compared to the pressurized state (the temperature is assumed to be constant during loading). The details
for the computation of this prefactor of 1.25, which is specific to our loading system, are provided in Appendix A . Past the
onset of buckling, the feedback between the internal pressure and volume will make the volume change of the shell unable
to be strictly prescribed by this system, thus, will affect the bifurcation behavior in the post-buckling regime ( Knoche and
Kierfeld, 2014 ). In any case, the primary quantity that is of interest in the experiments is the critical buckling pressure
(rather than V ), which can be directly and accurately measured from the pressure sensor.
3.2. Finite element modeling
FEM simulations were performed using the commercial finite element modeling package Abaqus/Standard. The hemi-
spherical shell was reduced to a 2D axisymmetric model. A through-thickness defect with either the geometry measured in
experiments or the generalized geometry described in Eq. (3) was imported into the model, as will be detailed later. The
elastomer was modeled as an incompressible neo-Hookean material with a Young’s modulus E = 1 . 16 ± 0 . 03 MPa, which
was experimentally measured through dog-bone tests. The Poisson’s ratio was assumed to be 0.5. The shell was discretized
using reduced hybrid axisymmetric solid elements (CAX4RH) with a regular mesh. The mesh had a constant of 8 elements
in the thickness direction, and the element size in the longitudinal direction was varied according to the thickness profile
in order to generate elements with an aspect ratio of approximately 1. A mesh convergence study was performed to ensure
that the mesh was sufficiently fine. Geometric nonlinearities were taken into consideration in the simulations.
In the finite element analysis using the experimentally measured geometry, we imported the 2D profile of the shell outer
surface measured after demolding, r o ( β), through optical profilometry. This way, we can take into account any slight changes
in the geometry of the shell away from a perfect hemisphere imparted by the fabrication process ( e.g. , due to gravity or the
pre-stresses developed in the constrained polymer layer during curing), for a direct comparison between the experimental
and numerical results. Eventually, r i (β) = r o (β) − h (β) and r o ( β), the experimentally obtained profiles for the inner and
outer geometry of the shell, respectively, were used to determine the shell geometry. In the FEM simulations using the
generalized geometry, the through-thickness defect involves thinning a perfect shell from both its inner and outer surfaces,
by the same amount, as was stated in Section 2 . As such, the 2D profiles of the inner and outer surfaces of an imperfect
shell can, respectively, be written as
r i (β) = R − (h o − δ(β)) / 2 (7)
and
r o (β) = R + (h o − δ(β)) / 2 , (8)
both of which determine the shell geometry.
The shell was loaded by a uniform live pressure applied on its inner surface, and clamped at the equator. The simu-
lations were conducted using the Riks method, which solves for equilibrium states by prescribing the arc-length of load-
displacement curve, allowing us to follow both stable and unstable equilibrium paths. For each simulation, we obtained the
following quantities:
(i) p = p/p c , the pressure loading normalized by the classic buckling pressure p c ;
(ii) V = V/V c , the volume change normalized by the volume change of a perfect hemispherical shell immediately prior to
buckling at p c , that is V c = 2 π(1 − ν) R 2 h o / √
3(1 − ν2 ) ( Hutchinson and Thompson, 2017a );
(iii) w = w/h o , displacement at the pole normalized by the nominal thickness of the shell h o .
Throughout, we assume axisymmetry, both in the pre-buckling and post-buckling configurations. This choice is moti-
vated by the fact that, for a perfect shell with R/h o = 100 , non-axisymmetric bifurcation can be found only when the pole
deflection reaches w/h o = 22 , deep into the post-buckling range ( Hutchinson and Thompson, 2017a ). Also, for shells with
an axisymmetric dimple imperfection, non-axisymmetric bifurcations do not occur prior to attainment of the maximum
pressure in the axisymmetric state ( Hutchinson, 2016 ). However, specifically for shells containing a through-thickness defect
presented in this study, a large defect that produces an excessively wide or/and thin region could break the axisymmetry of
buckling ( Paulose and Nelson, 2013 ), which is beyond the scope of this study. Thus, we carefully examined the post-buckling
behavior of representative shells within the explored parameter space by full 3D FEM. For the results presented in this pa-
per, no non-axisymmetric bifurcations were found in the vicinity of the buckling onset, but we shall indicate the area in the
parameter space where the break of axisymmetry occurs.

8 D. Yan, M. Pezzulla and P.M. Reis / Journal of the Mechanics and Physics of Solids 138 (2020) 103923
0.160.370.510.580.68
0 0.2 0.4 0.6 0.8 10
0.2
0.4
0.6
0.8
1
Fig. 4. Typical load-carrying curves, showing the normalized pressure, p , as a function of the normalized volume change of the air inside the load-
ing system imposed by the syringe, V im . The critical buckling pressures associated with each curve are represented by the corresponding large sym-
bols, open for p 1 and closed for p 2 . The defects were fabricated using the large nozzle d nozzle = 4 . 8 mm. The normalized defect amplitude was var-
ied δh = { 0 . 16 , 0 . 37 , 0 . 51 , 0 . 58 , 0 . 68 } . The various values of δh are detailed in the legend.
3.3. Theoretical description of axisymmetric (1D) shells
Within the framework of small strains and large displacements/rotations, we use a shell model whose implementation
has been recently reported in Pezzulla and Reis (2019) . Next, we provide a brief outline that summarizes this recent work.
First, the dimensionless elastic energy of the shell is written as
U =
∫ π/ 2
0
h (s )[(1 − ν) tr (a − ◦a ) 2 + νtr 2 (a − ◦
a )] R
2 sin s d s
+
1
3
∫ π/ 2
0
h (s ) 3 [(1 − ν) tr (b − ◦b
) 2 + νtr 2 (b − ◦b
)] R
2 sin s d s , (9)
where a and b are the metric and curvature tensors of the deformed middle surface of the shell, whereas ◦a and
◦b
are those
related to the undeformed middle surface ( Niordson, 1985 ). The trace operator in the metric ◦a is denoted by ‘ tr ’, and the s
coordinate runs along meridians. The energy functional in Eq. (9) has been normalized by πE/ (4(1 − ν2 )) . Parametrizing
the deformed profile curve of the middle surface as r (s ) = (φ(s ) , ψ(s )) , where φ and ψ are the 2D Cartesian coordinates,
the potential associated to the live pressure P = pV, itself normalized by πE/ (4(1 − ν2 )) , can be written as ( Pezzulla and
Reis, 2019 )
P =
8
3
(1 − ν2 ) p
E
∫ π/ 2
0
φ(ψφs − ψ s φ) d s . (10)
Equilibrium equations can then be generated by imposing δ( U + P ) = 0 , for all possible variations δφ and δψ . Regarding the
displacement at the north pole as the loading parameter since shell buckling is subcritical, the corresponding equilibrium
solutions are computed via the Newton-Raphson method.
4. Buckling of the fabricated shells: Experiments versus FEM
In this section, we investigate the load-carrying behavior and critical buckling pressures of the three sets of shells fabri-
cated using the nozzles with d nozzle = { 3 . 5 , 4 . 0 , 4 . 8 } mm. The defect amplitude of each set was varied in the ranges 0 . 06 ≤δh ≤ 0 . 83 , 0 . 18 ≤ δh ≤ 0 . 80 , and 0 . 03 ≤ δh ≤ 0 . 73 , respectively. The results of the FEM simulations using the experimentally
measured geometry are also presented and validated through direct comparison against the experimental results.
4.1. Load-carrying behavior
In Fig. 4 , we present typical load-carrying curves, p ( V im
) , for shells with a wide defect (fabricated using the nozzle
d nozzle = 4 . 8 mm). In this plot, the critical buckling pressures associated with each curve are represented by the correspond-
ing large symbols, which are normalized by the classic prediction for a prefect shell, p c . Naturally, the normalized critical
buckling pressure is smaller than unity, due to the imperfection.

D. Yan, M. Pezzulla and P.M. Reis / Journal of the Mechanics and Physics of Solids 138 (2020) 103923 9
With a small defect amplitude ( e.g. , δh = { 0 . 16 , 0 . 37 } ), the normalized pressure loading p increases with V im
in the linear
regime, until the peak value p 1 (open symbols) is reached; this maximum value is the normalized critical buckling pressure
of the shell. The shell buckles at p 1 accompanied by an abrupt pressure drop. Past the onset of buckling, p decreases grad-
ually with V im
, showing a significant loss in the load-bearing capacity of the shell, similarly to that of the imperfect shells
with a dimple-like geometric defect ( Hutchinson, 2016; Lee et al., 2016b ).
When the defect amplitude is increased further ( e.g. , δh = 0 . 51 ), the load-carrying behavior is qualitatively different;
the p ( V im
) curve exhibits two peak pressure values in the loading path corresponding to two distinct buckling events. In
this case, we denote the normalized critical pressures corresponding to the first and second buckling event by p 1 (open
symbols) and p 2 (closed symbols), respectively. During the experiments, we observed that, at p 1 , the shell buckled locally at
the defect, while at p 2 , the entire shell buckled globally. For this particular shell with δh = 0 . 51 , we have p 1 = 0 . 24 and p 2 =0 . 22 . Since p 1 > p 2 , the first event at p 1 makes the shell unable to sustain any increasing pressure loading, although the
second buckling at p 2 was observed in the experiment with prescribed volume change. Again, if the shell were to be loaded
with prescribed pressure, it would immediately collapse at p 1 .
For even larger values of the defect amplitude ( e.g. , δh = { 0 . 58 , 0 . 68 } ), the qualitative features of the loading-carrying
behavior change again. The value of the first buckling pressure is now found to be lower than that of the second event
( p 1 < p 2 ). Consequently, following the loading path, the shell first buckles at p 1 with a small pressure drop, but the buckled
shell is still able to carry the increasing pressure loading, until p 2 is reached. In contrast to the previous case of p 1 > p 2 ,
the two buckling events can be observed with either prescribed pressure or volume change.
4.2. Critical buckling pressure vs. the amplitude and the width of the defect
Thus far, from the loading curves measured in the experiments, we have found qualitatively distinct buckling behavior as
the geometry of the through-thickness defect is varied. This motivates us to study the dependence of the critical buckling
pressures on the defect amplitude and width in more detail. In Fig. 5 , we plot the normalized buckling pressures, p 1 (open
symbols) and p 2 (closed symbols), for the three sets of shells with increasing defect widths, as a function of normalized
defect amplitude, δh .
With a relative narrow defect ( Fig. 5 A, fabricated using the small nozzle d nozzle = 3 . 5 mm), the shell always exhibits a
single buckling event. For these shells, increasing the defect amplitude changes the buckling behavior only quantitatively. In
the range 0 . 06 ≤ δh ≤ 0 . 57 , the normalized buckling pressure, p 1 , decreases from 0.82 to 0.26, and, for δh ≥ 0 . 57 , a nearly-
flat plateau is reached at p 1 ≈ 0 . 22 . This functional dependence is similar to that found previously for shells containing a
dimple-like geometric defect ( Hutchinson, 2016; Lee et al., 2016b ). For large defect amplitudes, the fact that the plateau is
not exactly constant ( p 1 decreases slightly with increasing δh ) may be due to the unavoidable experimental interdependence
during fabrication, even if small, between the setting of the defect amplitude (set mostly by the flow rate of the air jet) and
the defect width (set mostly by the diameter of the nozzle).
For shells with a wider defect ( Fig. 5 B and 5 C), the defect amplitude turns to qualitatively affect the critical buckling
conditions beyond a threshold value for δh : δh ≥ 0 . 57 in Fig. 5 B and δh ≥ 0 . 48 in Fig. 5 C. In these ranges, two buckling
events occur at p 1 and p 2 : p 1 decreases monotonically with increasing δh , showing its sensitivity to the defect, while p 2follows a nearly-flat plateau.
Comparing the buckling pressures of the three sets of shells ( Fig. 5 ), the plateau is lowered with increasing defect width.
p 1 reaches a plateau for the relatively narrow defect ( Fig. 5 A) with only one buckling event, while the plateaus for the two
relatively wider defects are constructed by p 2 ( Fig. 5 B and 5 C). For all three cases, in contrast to the behavior at large values
of δh , the defects fabricated using different nozzles do not yield significant differences in buckling pressure for δh < 0 . 5 . This
might be because the defect width is not sufficiently changed by varying nozzle diameters for δh < 0 . 5 , as can be observed
in the thickness profiles presented in Fig. 3 .
In parallel to the experimental tests, we also conducted FEM simulations using the actual geometry measured from the
experimental specimens through optical profilometry for all of the shells that were fabricated. These FEM results for the
buckling pressures presented in Fig. 5 ( × and
∗ symbols joined by dashed lines) show an excellent quantitative agreement
with the experiments. This juxtaposition of FEM and experimental results validates that our numerical analysis can capture
the buckling behavior of shells containing a through-thickness defect.
Before proceeding with presenting the more detailed results from the FEM and the theoretical analysis, we provide a
partial summary of the findings uncovered thus far. We have developed an experimental protocol to fabricate shells con-
taining a through-thickness defect, whose amplitude and width can be customized, and measured their critical buckling
loads under pressure loading. The buckling behavior can be qualitatively different depending on the width of the defect. For
narrow defects, the buckling behavior is ‘classic’; the critical pressure decreases with defect amplitude, as a signature of the
sensitivity to imperfections. For wider defects, above a threshold defect amplitude, two buckling events can occur: (i) local
buckling at the defect and (ii) global buckling of the shell.
5. Buckling of shells containing a generalized defect profile: FEM and axisymmetric shell theory
Given the validity of our numerical analysis established in the previous section, we now focus on FEM to perform a
systematic and extensive exploration of the parameter space that would be difficult (or cumbersome) to perform in the

10 D. Yan, M. Pezzulla and P.M. Reis / Journal of the Mechanics and Physics of Solids 138 (2020) 103923
(A)
(C)
(B)
FEMExp.
0 0.2 0.4 0.6 0.8 10
0.2
0.4
0.6
0.8
1
FEMExp.
0 0.2 0.4 0.6 0.8 10
0.2
0.4
0.6
0.8
1
FEMExp.
0 0.2 0.4 0.6 0.8 10
0.2
0.4
0.6
0.8
1
Fig. 5. Critical buckling conditions of the fabricated hemispherical shells containing a through-thickness defect. Normalized critical buckling pressures, p 1 and p 2 , versus normalized defect amplitude, δh , measured in the experiments and predicted by FEM. The defects are fabricated using air nozzles with
different diameters: (A) d nozzle = 3 . 5 mm, (B) d nozzle = 4 . 0 mm, and (C) d nozzle = 4 . 8 mm.
experiments. In addition, we shall contrast the FEM results to axisymmetric shell theory. For the sake of generality, we will
consider the generalized through-thickness defect profile of Eq. (3) . Specifically we will:
(i) characterize various buckling regimes and quantify the associated critical buckling conditions of the system by inde-
pendently varying the normalized defect amplitude δh and half angular width βh ( Sections 5.1 –5.4 );
(ii) investigate the influence of the width of the transition region across the edge of the defect, set by γ h ( Section 5.5 );
(iii) establish that the results are independent of radius-to-thickness ratio of the shell, R / h o ( Section 5.6 ).
5.1. Load-carrying behavior and the associated buckling regimes
Before exploring the broad parameter space, we start by considering two representative sets of defects with βh = 1 . 2
(relatively narrow) and βh = 2 . 6 (relatively wide), with different amplitudes. In Fig. 6 A, for the narrow defect case ( βh = 1 . 2 )
we plot the normalized pressure, p , as a function of, respectively, the normalized displacement at the pole, w , and the
normalized volume change, V . The corresponding values of δh (for the various curves) are provided in the legend of the
figure. With a small defect amplitude ( e.g. , δh = 0 . 1 ), the shell initially deforms in the linear regime, where w and V increase
linearly with p . Buckling occurs when the normalized critical buckling pressure p 1 (open symbols) is reached at w ≈ 0 . 5 . Past
this peak pressure, in the p ( V ) curve, both p and V decrease, closely following the upward branch. This indicates that the
shell deformation occurs along the unstable branch and its strain energy decreases. Eventually, the shell stabilizes again at

D. Yan, M. Pezzulla and P.M. Reis / Journal of the Mechanics and Physics of Solids 138 (2020) 103923 11
(A1)
0.20.30.40.50.60.7
1D FEM0.1
0.8
(B1)
0.20.30.40.50.60.7
1D FEM0.1
0.8
(A2)
0 0.2 0.4 0.6 0.8 10
0.2
0.4
0.6
0.8
1
0 2 4 6 8 100
0.2
0.4
0.6
0.8
1
0 0.2 0.4 0.6 0.8 10
0.2
0.4
0.6
0.8
1
0 2 4 6 8 100
0.2
0.4
0.6
0.8
1
(B2)
Fig. 6. Load-carrying behavior of shells with a generalized through-thickness defect under pressure loading. Normalized pressure, p , as a function of (A1,B1)
normalized pole deflection, w , and (A2,B2) normalized volume change, V , is presented for shells containing (A1,A2) a narrow defect βh = 1 . 2 or (B1,B2) a
wide defect βh = 2 . 6 : FEM (dashed lines) and axisymmetric shell theory (solid lines). The values of the normalized defect amplitude δh for each βh are
provided in the legend. The critical buckling pressures associated with each curve are represented by the corresponding large symbols, open for p 1 and
closed for p 2 .
the lower branch. The value of p 1 decreases significantly as a function of the defect amplitude. Meanwhile, as the amplitude
of the defect increases, p becomes increasingly nonlinear with w in the pre-buckling stage. For larger defect amplitudes
( δh ≥ 0 . 7 ), the p ( w ) curve is remarkably nonlinear even in the early stage of loading, and the shell at the pole undergoes a
large deformation ( w ≈ 2 ) prior to the onset of buckling. The corresponding critical buckling pressure, p 1 , reaches a plateau
and the unstable branch in the p ( V ) curve disappears.
We now turn to the shell containing a wider defect, as represented by the case with βh = 2 . 6 , whose p ( w ) and p ( V )
curves are plotted in Fig. 6 B1 and 6 B2, respectively. Overall, for δh ≤ 0 . 3 , the data shows similar trends to the previous
narrow defect case ( βh = 1 . 2 ). However, the load-carrying behavior is qualitatively different when δh ≥ 0 . 4 ; a second peak
pressure, p 2 , emerges in the loading path, following p 1 . This first buckling event at p 1 occurs in the early loading stage with
a small deformation at the pole, which decreases gradually with increasing defect amplitude; e.g. , from w = 0 . 38 at δh = 0 . 4
to w = 0 . 13 at δh = 0 . 8 . Along the loading path, past p 1 , the shell deforms in the unstable equilibrium state with decreasing
trends for both p and V . In contrast with the above case for a narrow defect, as the shell stabilizes again at the lower branch,
the pressure turns to increase, indicating that the buckled shell is still able to carry the increasing pressure loading. The shell
at the pole continues to deform, with the development of a large dimple. By the time the second buckling condition p = p 2is attained, this dimple has a depth of w ≈ 4 . For shells exhibiting two buckling events, p 1 decreases monotonically but p 2forms a plateau, leading to a swap in order of the pressure values associated with the two buckling events.
The two contrasting cases presented above suggest the presence of three robust buckling regimes, which we now seek to
characterize further. To do so, we plot the normalized critical buckling pressures, p 1 and p 2 , and the associated normalized
volume changes immediately prior to buckling, V 1 and V 2 , as a function of defect amplitude, for the two representative
cases of a narrow defect βh = 1 . 2 ( Fig. 7 A) and a wide defect βh = 2 . 6 ( Fig. 7 B). In our description and interpretation of
the buckling regimes, we will make use of the concept of energy barrier ( Baumgarten and Kierfeld, 2018; 2019; Hutchinson
and Thompson, 2017b; 2018; Knoche and Kierfeld, 2011; 2014; Marthelot et al., 2017 ), which the shell needs to overcome
to attain the stable buckled state. This energy barrier, W, is the difference in the free energy of the shell between the pre-
buckling and the unstable buckled state, and can be written in dimensionless form as ( Hutchinson and Thompson, 2018 )

12 D. Yan, M. Pezzulla and P.M. Reis / Journal of the Mechanics and Physics of Solids 138 (2020) 103923
Fig. 7. Critical buckling pressures, p 1 and p 2 , and the associated normalized volume changes immediately prior to buckling, V 1 and V 2 , are plotted as a
function of normalized defect amplitude δh , for (A) the narrow defect case βh = 1 . 2 and (B) the wide defect case βh = 2 . 6 . The dashed black lines are the
boundaries between different buckling regimes. The dotted black line represents the transition from V 1 ≥ V 2 to V 1 < V 2 within Regime II.
(A) (B)
0.10.20.30.40.50.60.70.8
FEM1D0.10.20.30.40.50.6
FEM1D
0 0.2 0.4 0.6 0.8 10
0.05
0.1
0.15
0.2
0.25
0 0.2 0.4 0.6 0.8 10
0.05
0.1
0.15
0.2
0.25
Fig. 8. Normalized energy barrier for the first buckling event, W , as a function of normalized prescribed volume change, V , for shells with (A) the narrow
defect βh = 1 . 2 or (B) the wide defect βh = 2 . 6 . The normalized defect amplitude for each βh is varied δh = { 0 . 1 , 0 . 2 , 0 . 3 , 0 . 4 , 0 . 5 , 0 . 6 , 0 . 7 , 0 . 8 } , as detailed
in the legend.
W =
2 (1 − ν) √
1 − ν2
√
3 p c V c ( h o /R ) W . (11)
Next, we describe the features of the three buckling regimes in more detail.
Regime I : In this regime, only one buckling event occurs in the loading path at p 1 ( V 1 ); p 1 is the loading strength of the
shell. With prescribed volume change, we now plot the normalized energy barrier, W , as a function of the volume change,
V , in Fig. 8 A for shells with a narrow defect ( βh = 1 . 2 ), and, similarly, in Fig. 8 B for shells with a wide defect ( βh = 2 . 6 ).
When there is an energy barrier, the shell snaps at p 1 and jumps to the lower stable post-buckled state, inducing a pressure
drop. At the same value of prescribed volume change, the energy barrier is lower for a larger defect amplitude, thus the
buckling event is less catastrophic. In the absence of an energy barrier, no unstable branch exists in the loading path and
the shell buckles with smooth changes in pressure and volume (rather than through snap-through buckling).
Regime II : In this regime, two buckling events occur sequentially along the loading path, first p 1 ( V 1 ) and then p 2 ( V 2 ),
with p 1 ≥ p 2 . Under prescribed volume change, if V 1 ≥ V 2 , after the first buckling at p 1 ( V 1 ), the second buckling will not
occur. Conversely, V 1 < V 2 ensures that, after the first buckling event, V will reach V 2 and trigger the second buckling event,
as we have also observed in the experiments reported in Fig. 4 for δh = 0 . 51 . To determine the type of buckling, we again
examine the energy barrier under prescribed volume change and plot the results in Fig. 8 B. We find that the shell undergoes
snap-through buckling at p 1 and the associated energy barrier decreases for increasing defect amplitude. Since there is no
energy barrier required for the buckling at p 2 , the shell buckles without snapping.
Regime III : In this regime, two buckling events occur in the loading path at p 1 ( V 1 ) and p 2 ( V 2 ), in a sequence with p 1 <
p 2 and V 1 < V 2 . The types of buckling at p 1 ( V 1 ) and p 2 ( V 2 ) are the same as those in Regime II. Given that p 1 < p 2 and V 1 <
V is a signature of this regime, past the initial snap-through buckling at p ( V ), the shell carries the increasing pressure
2 1 1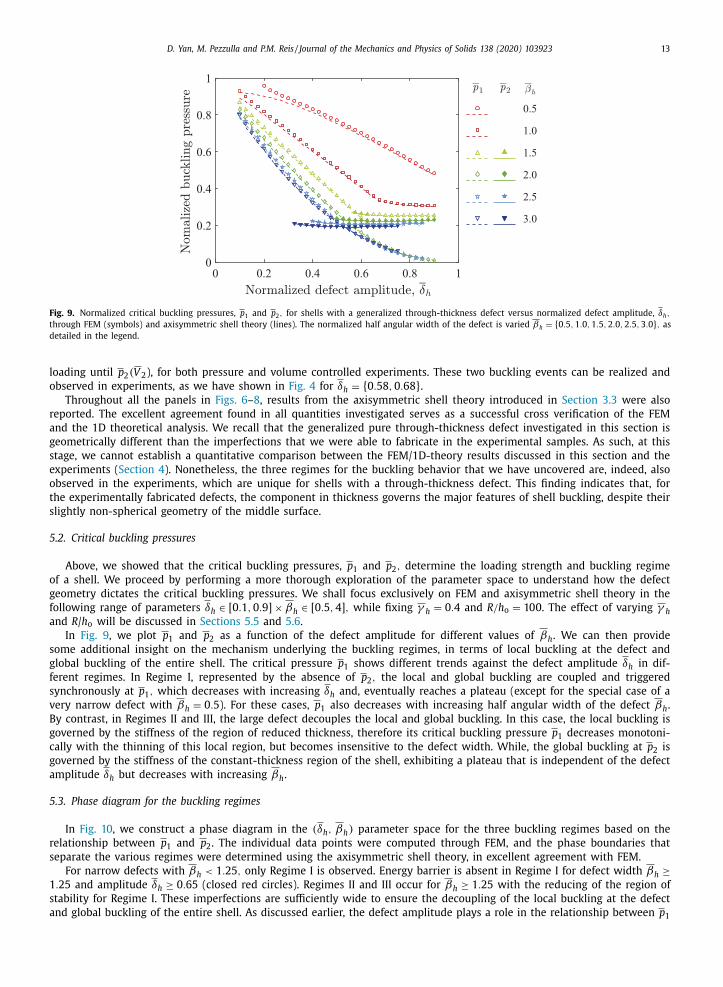
D. Yan, M. Pezzulla and P.M. Reis / Journal of the Mechanics and Physics of Solids 138 (2020) 103923 13
0.5
1.0
1.5
2.0
2.5
3.0
0 0.2 0.4 0.6 0.8 10
0.2
0.4
0.6
0.8
1
Fig. 9. Normalized critical buckling pressures, p 1 and p 2 , for shells with a generalized through-thickness defect versus normalized defect amplitude, δh ,
through FEM (symbols) and axisymmetric shell theory (lines). The normalized half angular width of the defect is varied βh = { 0 . 5 , 1 . 0 , 1 . 5 , 2 . 0 , 2 . 5 , 3 . 0 } , as
detailed in the legend.
loading until p 2 ( V 2 ), for both pressure and volume controlled experiments. These two buckling events can be realized and
observed in experiments, as we have shown in Fig. 4 for δh = { 0 . 58 , 0 . 68 } . Throughout all the panels in Figs. 6 –8 , results from the axisymmetric shell theory introduced in Section 3.3 were also
reported. The excellent agreement found in all quantities investigated serves as a successful cross verification of the FEM
and the 1D theoretical analysis. We recall that the generalized pure through-thickness defect investigated in this section is
geometrically different than the imperfections that we were able to fabricate in the experimental samples. As such, at this
stage, we cannot establish a quantitative comparison between the FEM/1D-theory results discussed in this section and the
experiments ( Section 4 ). Nonetheless, the three regimes for the buckling behavior that we have uncovered are, indeed, also
observed in the experiments, which are unique for shells with a through-thickness defect. This finding indicates that, for
the experimentally fabricated defects, the component in thickness governs the major features of shell buckling, despite their
slightly non-spherical geometry of the middle surface.
5.2. Critical buckling pressures
Above, we showed that the critical buckling pressures, p 1 and p 2 , determine the loading strength and buckling regime
of a shell. We proceed by performing a more thorough exploration of the parameter space to understand how the defect
geometry dictates the critical buckling pressures. We shall focus exclusively on FEM and axisymmetric shell theory in the
following range of parameters δh ∈ [0 . 1 , 0 . 9] × βh ∈ [0 . 5 , 4] , while fixing γ h = 0 . 4 and R/h o = 100 . The effect of varying γ h
and R / h o will be discussed in Sections 5.5 and 5.6 .
In Fig. 9 , we plot p 1 and p 2 as a function of the defect amplitude for different values of βh . We can then provide
some additional insight on the mechanism underlying the buckling regimes, in terms of local buckling at the defect and
global buckling of the entire shell. The critical pressure p 1 shows different trends against the defect amplitude δh in dif-
ferent regimes. In Regime I, represented by the absence of p 2 , the local and global buckling are coupled and triggered
synchronously at p 1 , which decreases with increasing δh and, eventually reaches a plateau (except for the special case of a
very narrow defect with βh = 0 . 5 ). For these cases, p 1 also decreases with increasing half angular width of the defect βh .
By contrast, in Regimes II and III, the large defect decouples the local and global buckling. In this case, the local buckling is
governed by the stiffness of the region of reduced thickness, therefore its critical buckling pressure p 1 decreases monotoni-
cally with the thinning of this local region, but becomes insensitive to the defect width. While, the global buckling at p 2 is
governed by the stiffness of the constant-thickness region of the shell, exhibiting a plateau that is independent of the defect
amplitude δh but decreases with increasing βh .
5.3. Phase diagram for the buckling regimes
In Fig. 10 , we construct a phase diagram in the ( δh , βh ) parameter space for the three buckling regimes based on the
relationship between p 1 and p 2 . The individual data points were computed through FEM, and the phase boundaries that
separate the various regimes were determined using the axisymmetric shell theory, in excellent agreement with FEM.
For narrow defects with βh < 1 . 25 , only Regime I is observed. Energy barrier is absent in Regime I for defect width βh ≥1 . 25 and amplitude δh ≥ 0 . 65 (closed red circles). Regimes II and III occur for βh ≥ 1 . 25 with the reducing of the region of
stability for Regime I. These imperfections are sufficiently wide to ensure the decoupling of the local buckling at the defect
and global buckling of the entire shell. As discussed earlier, the defect amplitude plays a role in the relationship between p
1
14 D. Yan, M. Pezzulla and P.M. Reis / Journal of the Mechanics and Physics of Solids 138 (2020) 103923
Fig. 10. Phase diagram of the buckling regimes for shells with a generalized through-thickness defect in the ( δh , βh ) parameter space, δh ∈ [0 . 1 , 0 . 9]
and βh ∈ [0 . 5 , 4] . The symbols and boundary lines are the results from FEM and axisymmetric shell theory, respectively. In Regime I, buckling with or
without an energy barrier under prescribed volume change is represented by the open or closed circles, respectively. In Regime II, shells with V 1 < V 2 ,
whose second buckling event can be observed under prescribed volume change, are represented by open squares, while shells with V 1 ≥ V 2 are represented
by closed squares. Non-axisymmetric buckling occurs for shells in the gray region.
and p 2 , thereby dictating the phase boundary between Regimes II and III. We note that shells in the gray region experience
non-axisymmetric buckling due to the extremely thin and wide local region ( Paulose and Nelson, 2013 ), which was also
observed in our full 3D FEM simulations, but this regime is beyond the scope of this study.
This phase diagram quantifies the role of the geometry of a through-thickness defect in dictating the buckling regimes
of our shells and further attests the ability of the axisymmetric (1D) shell theory to quantitatively describe the system, and
capture the transition regions across the various buckling regimes.
5.4. Knockdown factor
We now focus on the knockdown factors, as defined in Eq. (2) , for our imperfect shells containing a through-thickness
defect. For shells buckling in Regime I, p 1 is the loading strength normalized by the classic prediction. Thus, the associated
knockdown factor is simply κd = p 1 . For shells buckling in Regimes II and III, the largest buckling pressure among p 1 and p 2 sets the loading strength of the shell, such that the corresponding knockdown factor is
κd = max { p 1 , p 2 } . (12)
According to the classification of the three buckling regimes that we introduced in Section 5.1 , we have κd = p 1 for Regimes I
and II, and κd = p 2 for Regime III.
In Fig. 11 A, we now plot the knockdown factors for different defect amplitudes and widths. The corresponding contour
map in the ( δh , βh ) parameter space is presented in Fig. 11 B.
From the data presented in both Fig. 11 A and 11 B, we find a clear plateau of knockdown factor for shells with a wide
or/and deep defect. We determine the onset of the plateau by ∣∣∣∣d κd
d δh
∣∣∣∣ ≤ ξ , (13)
where ξ is a threshold chosen to be ξ = 0 . 2 . The onset of the plateau is represented by the open circle on each line in
Fig. 11 A and the corresponding defect amplitude at this onset, δp , is plotted as a function of βh in Fig. 12 B (solid line with
circles). Below βh = 0 . 75 , for a very narrow defect, κd does not reach a plateau in the ranges of parameters explored. A
plateau does develop for βh ≥ 0 . 75 , and its onset gradually moves towards lower values of δh ( Fig. 12 B). δp reaches the
minimum of 0.52 at βh = 2 . 5 . The plateau knockdown factor κp shown in Fig. 12 A (solid line with circles) is the average
of κd over the extent of the plateau, which is monotonously decreasing with increasing defect width from κp = 0 . 36 at βh =0 . 75 down to κp = 0 . 19 at βh = 3 . 25 .
5.5. Effect of the width of the transition region across the edge of the defect
In this section, we will discuss the effect of the geometric parameter γ h on both the critical buckling pressures and the
plateau of knockdown factor. This parameter γ h sets the width of the transition region across the edge of the defect, as
shown in the inset of Fig. 13 . The smaller γ h , the steeper the transition. However, the varied γ h = { 0 . 2 , 0 . 4 , 0 . 6 } (see legend
of the plot) just slightly affects the critical buckling pressures, as shown in Fig. 13 . We also plot the corresponding plateau

D. Yan, M. Pezzulla and P.M. Reis / Journal of the Mechanics and Physics of Solids 138 (2020) 103923 15
0.1 0.3 0.5 0.7 0.90.5
1
1.5
2
2.5
3
3.5
4
0
0.2
0.4
0.6
0.8
1
0.84
0.76
0.68
0.600.51
0.430.35
0.27
0.1 0.3 0.5 0.7 0.90
0.2
0.4
0.6
0.8
1
0.51.01.52.02.53.0
(A) (B)
Fig. 11. Knockdown factors of shells with a generalized through-thickness defect. (A) knockdown factor, κd , versus normalized defect amplitude, δh . The
normalized half angular width of the defect is varied βh = { 0 . 5 , 1 . 0 , 1 . 5 , 2 . 0 , 2 . 5 , 3 . 0 } , as detailed in the legend. The open circle on each line represents the
onset of the plateau. (b) Contour plot of the knockdown factor for different values of the normalized defect amplitude, δh ∈ [0 . 1 , 0 . 9] , and normalized half
angular width, βh ∈ [0 . 5 , 4] . Non-axisymmetric buckling occurs for shells in the gray region.
(A) (B)
0.20.40.6
0 1 2 3 4
0.2
0.3
0.4
0.5
0 1 2 3 4
0.5
0.6
0.7
0.8
0.9
0.20.40.6
Fig. 12. (A) Normalized pressure level of the plateau, κp , versus normalized half angular width of the defect, βh . (B) Normalized defect amplitude at onset
of the plateau, δp , versus βh . The width of the transition region across the edge of the defect is varied by changing γ h = { 0 . 2 , 0 . 4 , 0 . 6 } .
knockdown factor, κp , in Fig. 12 A. We can find that, κp slightly decreases with increasing γ h , since the wide transition
region effectively enlarges the defect width, but the effect is small. On the other hand, the region of reduced thickness close
to the edge of the defect becomes thicker with increasing γ h . As a result, the critical buckling pressure for local buckling,
p 1 for Regimes II and III, is increased. An increasing γ h also pushes the onset of plateau moving towards higher values of
defect amplitude, as shown in Fig. 12 B.
5.6. Independence of radius-to-thickness ratio of the shell
Thus far, the radius-to-thickness ratio was fixed at R/h o = 100 , but we will now establish that the results that we have
obtained are independent of this value. For this purpose, we obtain the critical buckling pressures for R/h o = { 50 , 100 , 200 }(see legend of the plot) as a function of the normalized defect amplitude through the developed axisymmetric shell theory,
as shown in Fig. 14 . We also vary the normalized half angular width of the defect βh = { 1 . 0 , 1 . 5 , 2 . 5 } . It can be seen that, p 1and p 2 versus δh are not affected by R / h o , while fixing βh and γ h . We can conclude that the buckling behavior of the shell
is entirely governed by the three geometric parameters of the through-thickness defect, δh , βh and γ h , thereby ensuring
that the results presented in the paper are applicable to thin spherical shells.

16 D. Yan, M. Pezzulla and P.M. Reis / Journal of the Mechanics and Physics of Solids 138 (2020) 103923
0 0.2 0.4 0.6 0.8 10
0.2
0.4
0.6
0.8
1
0.20.4
0.6
0 2 40.5
1
= 0.2, 0.4, 0.6
Fig. 13. Normalized critical buckling pressures, p 1 and p 2 , versus normalized defect amplitude, δh , for different widths of the transition region across the
edge of the defect: γ h = 0 . 2 (dashed lines), γ h = 0 . 4 (solid lines), and γ h = 0 . 6 (dash-dotted lines), through the axisymmetric shell theory. The normalized
half angular width of the defect is varied: βh = 1 . 0 (red lines), βh = 1 . 5 (green lines), and βh = 2 . 5 (blue lines). Inset: Thickness profiles of shells with
varied γ h = { 0 . 2 , 0 . 4 , 0 . 6 } for δh = 0 . 5 and βh = 1 . 5 (For interpretation of the references to color in this figure legend, the reader is referred to the web
version of this article.).
0 0.2 0.4 0.6 0.8 10
0.2
0.4
0.6
0.8
1
200100
50
Fig. 14. Normalized critical buckling pressures, p 1 and p 2 , versus normalized defect amplitude, δh , for shells with different radius-to-thickness ratio:
R/h o = 200 (dashed lines), R/h o = 100 (solid lines), and R/h o = 50 (dash-dotted lines), through the axisymmetric shell theory. The normalized half angular
width of the defect is varied: βh = 1 . 0 (red lines), βh = 1 . 5 (green lines), and βh = 2 . 5 (blue lines). The width of the transition region across the edge of
the defect is fixed at γ h = 0 . 4 (For interpretation of the references to color in this figure legend, the reader is referred to the web version of this article.).
6. Conclusion
We have studied the buckling of pressurized spherical shells containing a through-thickness defect, and identified three
buckling regimes. In Regime I, the shell exhibits only one buckling event and its load-carrying behavior is similar to a
constant thickness shell containing a local geometric defect. The buckling behavior of Regimes II and III is qualitatively
different, showing two buckling events. In Regime II, local buckling at the defect is the first buckling event that has a
high critical pressure, which will simultaneously trigger global buckling under prescribed pressure. In Regime III, the two
buckling events can always be observed with either prescribed pressure or volume change. We summarized these buckling
regimes in a phase diagram, representing the dependence of the phase boundaries on the geometry of the defect. We also
systematically analyzed the critical buckling conditions affected by the defect and the underlying mechanism involving local
and global buckling, which are dictated by the three geometric parameters of the defect, independent of the radius-to-
thickness ratio of the shell. Buckling behavior similar to Regimes I and III of spherical shells has also been observed in
cylindrical shells under axial compression ( Gerasimidis et al., 2018; Haynie et al., 2012; Kriegesmann et al., 2012 ). In these
cases with cylindrical shells, local buckling is triggered by a geometric imperfection or a lateral force probe, which always
has a value of critical load/shortening lower than that corresponding to global buckling, at least in the explored parameter
space. The buckling of cylindrical shells in the presence of thickness variation is yet unexplored and would be an interesting
topic for future studies.

D. Yan, M. Pezzulla and P.M. Reis / Journal of the Mechanics and Physics of Solids 138 (2020) 103923 17
Although the buckling strength is reduced by the defect, the shell along the plateau has a deterministic critical buckling
load, which can be predicted. This indicates that, a precisely engineered through-thickness defect could be used to accurately
control the onset of buckling, when used for functionality. For example, under prescribed pressure, the through-thickness
defect induces two buckling events, with one stable post-buckled state for the shells in Regime III. The two bucking events
can be triggered in sequence by adjusting the external pressure. This could be used as an actuator in soft robotics to execute
sequential actions, or in drug delivery as a capsule to release drugs at two different speeds through its break-downs by local
and global buckling.
The agreement between experiments and FEM simulations presented in this study further concretes the finding that
numerics can give an accurate prediction on critical buckling loads, as long as the imperfections are properly considered.
Recent developments in imaging techniques, e.g. , optical profilometry or x-ray computed tomography, are making it possible
to access the 3D geometry of structures. Further numerical simulations are required to make use of the measured full 3D
geometric information of a specific structure and produce an accurate prediction for the buckling strength. This could be
used to study the effect of a distribution of defects on the critical load, which represents a more realistic scenario. We hope
our study will provide valuable physical insight for the engineering design of shell structures, and stimulate future studies
on this topic.
Declaration of Competing Interest
The authors declare that they have no known competing financial interests or personal relationships that could have
appeared to influence the work reported in this paper.
Appendix A. Imposed volume change in the experiments
In Section 3.1.3 , we noted that, in the experiments, the volume of the air expansion imposed by the syringe, V im
, is not
equal to the volume change of the shell, V . This difference is due to the compressibility of air, even in the pre-buckling
regime. Next, we will detail the relationship between V im
and V .
We shall refer to the pressure differential between the outside and inside of the shell as p = p out − p in , and to the volume
change of the shell as V = −(V shell − V shell0 ) , where V shell is the volume of the shell. Quantities with the subscript “0” refer to
the reference state ( p = 0 ). In our experiments, the shell specimen is tested by connecting it to a syringe via a thick-walled
silicone tube. The syringe is used to expand the air in the system (volume V system
), which comprises the shell, syringe and
connecting tube. As a result, the internal pressure in the system will decrease, thus, the shell is pressurized by the positive
outside/inside pressure differential.
For the reference state ( V im
= 0 and p = 0 ) the ideal gas law yields
p in0 V system0 = Nk B T , (A.1)
where N is the number of gas molecules in the system, k B is the Boltzmann constant, and T is the absolute temperature of
the gas. During the expansion of the air inside the system, we have
(p in0 − p)(V system0 − V + V im
) = Nk B T . (A.2)
Assuming an isothermal process, combining Eqs. (A.1) and (A.2) yields,
V system0
−V + V im
=
p in0
p − 1 . (A.3)
For our experimental shells, classic shell theory (for a perfect spherical shell) predicts a critical buckling pressure of
p c = 173 Pa , which is significantly smaller than p in0 = 1 . 01 × 10 5 Pa , such that p in0 / p 1. Therefore, we obtain
V system0
−V + V im
≈ p in0
p , (A.4)
which can be rearranged to read
V im
≈ p
p in0
V system0 + V . (A.5)
The above equation establishes the dependence between the volume change of the shell and the volume change imposed
by the syringe. In the pre-buckling regime, for a perfect hemispherical shell, we have p = KV, where K = Eh o /π(1 − ν) R 4 is
the stiffness of the shell ( Hutchinson and Thompson, 2017a ). Hence, we can rewrite Eq. (A.5) as
V im
≈(
KV system0
p in0
+ 1
)V . (A.6)
Therefore, we find that V im
depends linearly on V , with V im
> V . Moreover, the prefactor in Eq. (A.6) , KV system0 /p in0 + 1 ,
depends on both the volume of the air inside the system and the shell stiffness. For our specific experimental conditions,
we have V system0 = 5 . 4 × 10 4 mm
3 , K = 0 . 48 Pa / mm
3 , and p in0 = 1 . 01 × 10 5 Pa, yielding V im
≈ 1.25 V .

18 D. Yan, M. Pezzulla and P.M. Reis / Journal of the Mechanics and Physics of Solids 138 (2020) 103923
Supplementary material
Supplementary material associated with this article can be found, in the online version, at doi: 10.1016/j.jmps.2020.103923
References
Babcock, C.D. , 1983. Shell stability. J. Appl. Mech. 50 (4b), 935–940 .
Baumgarten, L. , Kierfeld, J. , 2018. Buckling of thermally fluctuating spherical shells: Parameter renormalization and thermally activated barrier crossing.Phys. Rev. E 97, 052801 .
Baumgarten, L. , Kierfeld, J. , 2019. Shallow shell theory of the buckling energy barrier: From the pogorelov state to softening and imperfection sensitivityclose to the buckling pressure. Phys. Rev. E 99, 022803 .
Bijlaard, P.P. , Gallagher, R.H. , 1960. Elastic instability of a cylindrical shell under arbitrary circumferential variation of axial stress. J. Aerosp. Sci. 27 (11),854–858 .
Budiansky, B. , Hutchinson, J.W. , 1972. Buckling of circular cylindrical shells under axial compression. In: Contributions to the Theory of Aircraft Structures.
Delft University Press, The Netherlands, pp. 239–259 . Carlson, R.L. , Sendelbeck, R.L. , Hoff, N.J. , 1967. Experimental studies of the buckling of complete spherical shells. Exper. Mech. 7 (7), 281–288 .
Chen, W.L. , 1959. Effect of geometrical imperfection on the elastic buckling of thin shallow spherical shells. Massachusetts Institute of Technology, Cam-bridge, MA Ph.D. thesis .
Datta, S.S. , Kim, S.-H. , Paulose, J. , Abbaspourrad, A. , Nelson, D.R. , Weitz, D.A. , 2012. Delayed buckling and guided folding of inhomogeneous capsules. Phys.Rev. Lett. 109 (13), 134302 .
Elishakoff, I. , 2014. Resolution of the Twentieth Century Conundrum in Elastic Stability. World Scientific Publishing, Singapore .
Gerasimidis, S. , Virot, E. , Hutchinson, J.W. , Rubinstein, S.M. , 2018. On establishing buckling knockdowns for imperfection-sensitive shell structures. J. Appl.Mech. 85 (9), 091010 .
Haynie, W. , Hilburger, M. , Bogge, M. , Maspoli, M. , Kriegesmann, B. , 2012. Validation of lower-bound estimates for compression-loaded cylindrical shells. In:Proceedings of the 53rd AIAA/ASME/ASCE/AHS/ASC Structures, Structural Dynamics and Materials Conference. American Institute of Aeronautics and
Astronautics, Honolulu, HI . Hilburger, M.W. , 2012. Developing the next generation shell buckling design factors and technologies. In: Proceedings of the 53rd AIAA/ASME/ASCE/AHS/ASC
Structures, Structural Dynamics and Materials Conference. American Institute of Aeronautics and Astronautics, Honolulu, HI .
Hilburger, M.W. , Nemeth, M.P. , Starnes, J.H. , 2006. Shell buckling design criteria based on manufacturing imperfection signatures. AIAA J. 44 (3), 654–663 . Hutchinson, J.W. , 2016. Buckling of spherical shells revisited. Proc. R. Soc. A Math. Phys. Eng. Sci. 472 (2195), 20160577 .
Hutchinson, J.W. , Muggeridge, D.B. , Tennyson, R.C. , 1971. Effect of a local axisymmetric imperfection on the buckling behavior of a circular cylindrical shellunder axial compression. AIAA J. 9 (1), 48–52 .
Hutchinson, J.W. , Thompson, J.M.T. , 2017. Nonlinear buckling behaviour of spherical shells: barriers and symmetry-breaking dimples. Philosoph. Trans. R.Soc. A Math. Phys. Eng. Sci. 375 (2093), 20160154 .
Hutchinson, J.W. , Thompson, J.M.T. , 2017. Nonlinear buckling interaction for spherical shells subject to pressure and probing forces. J. Appl. Mech. 84 (6),
061001 . Hutchinson, J.W. , Thompson, J.M.T. , 2018. Imperfections and energy barriers in shell buckling. Int. J. Solids Struct. 148-149, 157–168 .
Jampani, V.S.R. , Mulder, D.J. , Sousa, K.R.D. , Glbart, A.-H. , Lagerwall, J.P.F. , Schenning, A.P.H.J. , 2018. Micrometer-scale porous buckling shell actuators basedon liquid crystal networks. Adv. Funct. Mater. 28 (31), 1801209 .
Kaplan, A. , Fung, Y.C. , 1954. A nonlinear theory of bending and buckling of thin elastic shallow spherical shells. Technical Note. National Advisory Committeefor Aeronautics, Washington, DC .
von Kármán, Th. , Tsien, H.-S. , 1939. The buckling of spherical shells by external pressure. J. Aeronaut. Sci. 7 (2), 43–50 . Katifori, E. , Alben, S. , Cerda, E. , Nelson, D.R. , Dumais, J. , 2010. Foldable structures and the natural design of pollen grains. Proc. Natl. Acad. Sci. 107 (17),
7635–7639 .
Knoche, S. , Kierfeld, J. , 2011. Buckling of spherical capsules. Phys. Rev. E 84, 046608 . Knoche, S. , Kierfeld, J. , 2014. Osmotic buckling of spherical capsules. Soft Matter 10, 8358–8369 .
Kobayashi, S. , 1968. The influence of the boundary conditions on the buckling load of cylindrical shells under axial compression. J. Jap. Soc. Aeronaut. Eng.16 (170), 74–82 .
Kochmann, D.M. , Bertoldi, K. , 2017. Exploiting microstructural instabilities in solids and structures: from metamaterials to structural transitions. Appl. Mech.Rev. 69 (5), 050801 .
Koiter, W.T. , 1945. Over de stabiliteit van het elastisch evenwicht. Delft University of Technology, Delft, The Netherlands Ph.D. thesis .
Krenzke, M.A. , Kiernan, T.J. , 1963. Elastic stability of near-perfect shallow spherical shells. AIAA J. 1 (12), 2855–2857 . Kriegesmann, B. , Hilburger, M. , Rolfes, R. , 2012. The effects of geometric and loading imperfections on the response and lower-bound buckling load of a
compression-loaded cylindrical shell. In: Proceedings of the 53rd AIAA/ASME/ASCE/AHS/ASC Structures, Structural Dynamics and Materials Conference.American Institute of Aeronautics and Astronautics, Honolulu, HI .
Lee, A. , Brun, P.-T. , Marthelot, J. , Balestra, G. , Gallaire, F. , Reis, P.M. , 2016. Fabrication of slender elastic shells by the coating of curved surfaces. NatureCommun. 7, 11155 .
Lee, A. , López Jiménez, F. , Marthelot, J. , Hutchinson, J.W. , Reis, P.M. , 2016. The geometric role of precisely engineered imperfections on the critical buckling
load of spherical elastic shells. J. Appl. Mech. 83 (11), 111005 . Lee, A. , Yan, D. , Pezzulla, M. , Holmes, D.P. , Reis, P.M. , 2019. Evolution of critical buckling conditions in imperfect bilayer shells through residual swelling.
Soft Matter 15 (30), 6134–6144 . Lidmar, J. , Mirny, L. , Nelson, D.R. , 2003. Virus shapes and buckling transitions in spherical shells. Phys. Rev. E 68 (5), 051910 .
López Jiménez, F. , Marthelot, J. , Lee, A. , Hutchinson, J.W. , Reis, P.M. , 2017. Technical brief: knockdown factor for the buckling of spherical shells containinglarge-amplitude geometric defects. J. Appl. Mech. 84, 034501 .
Marthelot, J. , López Jiménez, F. , Lee, A. , Hutchinson, J.W. , Reis, P.M. , 2017. Buckling of a pressurized hemispherical shell subjected to a probing force. J. Appl.
Mech. 84, 121005 . Niordson, F. , 1985. Shell Theory. Elsevier Science .
Paulose, J. , Nelson, D.R. , 2013. Buckling pathways in spherical shells with soft spots. Soft Matter 9 (34), 8227–8245 . Pedersen, P.T. , Jensen, J.J. , 1995. Buckling behaviour of imperfect spherical shells subjected to different load conditions. Thin-Walled Struct. 23 (1), 41–55 .
Pezzulla, M. , Reis, P.M. , 2019. Technical brief: a weak form implementation of nonlinear axisymmetric shell equations with examples. J. Appl. Mech. 84 (3),034501 .
Rafsanjani, A. , Bertoldi, K. , Studart, A.R. , 2019. Programming soft robots with flexible mechanical metamaterials. Sci. Robot. 4 (29), eaav7874 .
Reis, P.M. , 2015. A perspective on the revival of structural (in)stability with novel opportunities for function: from buckliphobia to buckliphilia. J. Appl.Mech. 82 (11), 111001 .
Samuelson, L. ̊A. , Eggwertz, S. , 1992. Shell Stability Handbook. Elsevier Applied Science, London . Seaman, L. , 1962. The nature of buckling in thin spherical shells. Massachusetts Institute of Technology, Cambridge, MA Ph.D. thesis .
Shim, J. , Perdigou, C. , Chen, E.R. , Bertoldi, K. , Reis, P.M. , 2012. Buckling-induced encapsulation of structured elastic shells under pressure. Proc. Natl. Acad.Sci. 109 (16), 5978–5983 .

D. Yan, M. Pezzulla and P.M. Reis / Journal of the Mechanics and Physics of Solids 138 (2020) 103923 19
,
Thompson, J.M.T. , 2015. Advances in shell buckling: theory and experiments. Int. J. Bifurcat. Chaos 25 (1), 1530 0 01 . Thompson, J.M.T. , Hutchinson, J.W. , Sieber, J. , 2017. Probing shells against buckling: a nondestructive technique for laboratory testing. Int. J. Bifurcat. Chaos
27 (14), 1730048 . Thompson, J.M.T. , Sieber, J. , 2016. Shock-sensitivity in shell-like structures: with simulations of spherical shell buckling. Int. J. Bifurcat. Chaos 26 (2),
1630 0 03 . Tsien, H.-S. , 1942. A theory for the buckling of thin shells. J. Aeronaut. Sci. 9 (10), 373–384 .
Vian, A. , Amstad, E. , 2019. Mechano-responsive microcapsules with uniform thin shells. Soft Matter 15 (6), 1290–1296 .
Virot, E. , Kreilos, T. , Schneider, T.M. , Rubinstein, S.M. , 2017. Stability landscape of shell buckling. Phys. Rev. Lett. 119 (22), 224101 . Wang, P. , Casadei, F. , Shan, S. , Weaver, J.C. , Bertoldi, K. , 2014. Harnessing buckling to design tunable locally resonant acoustic metamaterials. Phys. Rev. Lett.
113 (1), 014301 . Whitesides, G.M. , 2018. Soft robotics. Angewandte Chemie Int. Ed. 57 (16), 4258–4273 .
Xu, S. , Yan, Z. , Jang, K.-I. , Huang, W. , Fu, H. , Kim, J. , Wei, Z. , Flavin, M. , McCracken, J. , Wang, R. , Badea, A. , Liu, Y. , Xiao, D. , Zhou, G. , Lee, J. , Chung, H.U.Cheng, H. , Ren, W. , Banks, A. , Li, X. , Paik, U. , Nuzzo, R.G. , Huang, Y. , Zhang, Y. , Rogers, J.A. , 2015. Assembly of micro/nanomaterials into complex,
three-dimensional architectures by compressive buckling. Science 347 (6218), 154–159 . Yin, J. , Cao, Z. , Li, C. , Sheinman, I. , Chen, X. , 2008. Stress-driven buckling patterns in spheroidal core/shell structures. Proc. Natl. Acad. Sci. 105 (49),
19132–19135 .
Zoelly, R. , 1915. Ueber ein knickungsproblem an der kugelschale. ETH Zürich, Zürich, Switzerland Ph.D. thesis .