Embed Size (px)
Citation preview

1
Buddha’s Grace Illuminates All: Temple Destruction, School
Construction, and Modernization in the 20th Century China
Shaoda Wang† Boxiao Zhang‡
October 2015
Preliminary Version, Please Do Not Cite or Circulate
Abstract
This study documents a novel natural experiment in the early 20th century China called the
“Temple Destruction Movement (TDM),” where local governments were required to take
over the assets of Buddha and Taoist temples to support local modern schooling. We show
that before the TDM, the prior stock of average temple assets was not correlated with
various measures of human capital and economic development; while after the TDM
started, regions with higher prior stock of average temple assets constructed more schools,
enrolled more students, evolved more modern elites, and also experienced faster
urbanization. Moreover, we find that the impacts of the TDM persist in the 21st century:
regions with higher prior stock of temple assets before the TDM have higher human
capital and better economic performance in 2000.
Keywords: Temple Destruction Movement; Human Capital; Economic Development
JEL: O15; O18; N35
† Department of Agricultural and Resource Economics, U.C. Berkeley. ‡ Guanghua School of Management, Peking University.
We are indebted to Noam Yuchtman and Se Yan for their generous support. We would also like to thank Alain de Janvry, Elisabeth Sadoulet, Debin Ma, Yu Hao, Kris Mitchener, Jean-Laurent Rosenthal, Aprajit Mahajan, Ethan Ligon, Jeremy Magruder, Zhiwu Chen, Paul Katz, Yang Xie, Xi Lu, Chicheng Ma, John Loeser, Ye Wang, Xuenong Zhou, and seminar participants at the NEUDC conference, the All-UC group Frontiers in Chinese Economic History conference, Berkeley ARE development workshop, and the third International Symposium on Quantitative History for their helpful comments. Financial support from the Berkeley Economic History Lab (BEHL) is gratefully acknowledged. Any remaining errors are solely ours.

2
1 Introduction
For over 1,300 years, especially in the late imperial period (1368-1911), China’s civil society
in general, and its traditional education system in particular, were fundamentally shaped by
the civil service exams (Elman, 2000). At various levels, tutors, schools, and academies
trained students with Confucian classics, which were the official materials of the exams.
To prepare for these exams, students had to devote themselves mainly into writing poems
and eight-legged essays, which partly led to the academic tradition of valuing humanities
over science and technology (Lin, 1995; Huff, 2003).
In the late 19th and early 20th centuries, China experienced consecutive military defeats
against the western powers and Japan, which led to the abolishment of the civil service
exams, and the explorations of ways to generate modern human capital and new elites.
Among the numerous attempts made by the government, not surprisingly, constructing
modern schools was the most important and persistent one. Since the central government
faced severe debts and deficits, the provision of education funding was almost entirely
undertaken by lower-level governments and local elites.
To help the local elites raise adequate amount of funding for modern schooling, the
central government implemented a novel policy aimed to close most of China’s total
200,000 Buddha\Taoist temples and take over most of their assets to finance modern
education, which was known as the “Temple Destruction Movement (TDM).” The TDM
was first proposed and approved in 1898, but due to political and ideological reasons never
actually implemented until 1912.
In this paper, making use of a unique prefecture-level panel dataset on modern
education in the late Imperial and early Republican eras of China, we first show that before
the movement started, stock of average temple assets (measured by the average number
of temples in 1820) was orthogonal to various kinds of indicators for human capital and
economic prosperity, and was not correlated with either the levels or the trends of average
number of schools and students. However, after the movement started, places with higher
stock of temple assets ex ante constructed more schools, enrolled more students, and later

3
evolved more elite human capital (measured by average number of top university alumni
and oversea students), and also experienced faster economic growth (measured by
urbanization rate). Furthermore, we provide evidence that the increase of human capital
and its positive effects on economic growth persists until the 21st century: places with
higher prior stock of average temple assets in 1820 have higher levels of human capital
and economic performance in 2000. Our study speaks to several strands of literature.
First, we add to the increasing literature on the formation and persistence of human
capital through time. Economic historians have long argued that formation of modern
human capital is essential for a society’s transition towards a modern economy (Yuchtman,
2014), but there is few empirical evidence documenting how exactly does modern human
capital evolve, our paper fills in this blank. Also, there have been papers showing that mass
human capital investment in history could have persistent effects on today’s educational
levels and investments (Huillery, 2009; Wantchekon et al., 2015; Nunn, 2011). Different
from these works, we also study how elite human capital could evolve from investment in
mass human capital, and also estimate the effects of human capital on economic
development in the mid-run and in the long-run.
Second, our paper contributes to the literature on the relationship between human
capital and economic development. There exists a huge literature on whether human
capital could boost economic development, some using cross-country comparison (Hall
and Jones, 1999; Glaeser et al., 2004; Acemoglu et al., 2014), others using cross-regional
analysis (Acemoglu and Dell, 2009; Gennaioli et al., 2013). But as pointed out by many
researchers, investment in education is an endogenous decision affected by many factors,
such as institutions (North and Thomas, 1973, Acemoglu et al., 2002, Acemoglu et al.,
2014, Engerman et al., 2012, Galor et al., 2009), political structure (Lindert, 2004), fiscal
capacity (Bardhan and Mookherjee, 2006), ethnicity and culture (Easterly and Levine, 2012,
Fernandez, 2011, Peri, 2012), which will also affect economic outcomes. Therefore,
estimating the causal effects of human capital on development remains challenging. Some
of the more recent works adopt historical natural experiments to identify this causal
relationship (Ferraz et al., 2015; Hornung, 2014; Becker et al., 2011; Squicciarini and
Voigtlaender, 2015), basically showing that human capital has positive impacts on

4
development, and such effects could persist in the long run. Our paper reassures these
findings in the context of 20th century China using a comprehensive historical dataset. We
also differentiate from these recent papers by studying and documenting the formation of
elite human capital in addition to only mass human capital, which is believed to be crucial
to the transition and upgrade of an economy (Cantoni and Yuchtman, 2014).
Third, our paper is also related to the large literature on the effects of religion on
economic growth. Since Max Weber (2002), whether Protestantism could actually
encourage hard work and in turn contribute to economic prosperity has led to heated
debates and mixed evidence in the empirical literature. Cantoni (2013) finds no relationship
between Protestantism and growth, many papers find evidence supporting Weber’s
proposed channel (Stulz and Williamson, 2003; Barro and McCleary, 2003), but others
argue that it is not religion itself, but the human capital and other by-products of it, that
contribute to growth (Glaeser and Sacerdote, 2008; Becker and Woessmann, 2009). In the
context of China, Bai and Kung (2015) find that Protestantism promoted growth in China
through building hospitals and schools, Chen et al (2015) find similar results, but also
suggest that this human capital channel is not exclusive. To our best knowledge, despite
the large literature on Protestantism, there has been few studies on the social and economic
effects of Buddhism and Taoism, which are highly important religions in the context of
China, and many other Asian countries as well. Our results suggest that these two religions
contributed to modernization significantly, but likely only through the channel of their
assets being appropriated to support modern schooling, and not through shaping social
preferences or any other channels.
The remainder of this paper is organized as follows. Section 2 will document the
historical background of the formation of modern human capital in China and the Temple
Destruction Movement. Section 3 discusses the data and presents descriptive statistics.
Section 4 will present the effects of the TDM on both mass and elite human capital
formation, and the effects on mid-run economic development. Section 5 presents evidence
of the persistence of human capital and its effects on economic growth in the 21st century.
Section 6 discusses the robustness of our results. Section 7 concludes.

5
2 Historical Background
Fundamentally shaped by the civil service exam, China’s traditional education system were
constituted by tutors, traditional schools and academies. At the junior level, there were
several kinds of public or private traditional schools, including community schools (shexue),
charitable schools (yixue) and clan schools (zuxue). According to imperial edict, those
schools’ objective was jiaohua, can be translated as “civilization” or “enculturation.” They
trained students to learn basic reading and writing skills, and to recite Confucian classics,
including the Four Books and Five Classics (Sishu Wujing), which were the standard
textbooks of the civil service exam. For exam participants, they usually needed to hire
tutors or attend academies to obtain senior education afterwards, including writing poems
and eight-legged essays (Baguwen).
In the late 19th and early 20th centuries, after consecutive military defeats against the
western powers and Japan, Chinese government and elites realized the challenges they
faced in technology, as well as in culture and education. In 1902, China issued the first
comprehensive plan of building its own modern education system, and began to construct
modern primary schools, secondary schools and universities. Instead of Confucian classics,
students were required to learn modern knowledge about science, technology and
humanities in those schools.
During 1904-1905, Japan succeeded in the Russo-Japanese War, which was the first
major military victory in the modern era of an Asian power over a European nation. Japan's
success was attributed to the Meiji Restoration and Modernization, which set an example
for the Qing Dynasty and facilitated a new round of education reform, including the
abolishment of the civil exam system as well as the traditional education system, and the
further construction of modern schools (Franke, 1960).
According the experiences of western countries, public provision of modern
education requires consistent financial support. However, in late Qing Dynasty, both
central and local governments faced severe debts and deficits, and were unable to build
and sustain a modern education system. In 1895, after the Sino-Japanese war, the deficit

6
of Qing government reached 15 million tael of silver.1 In 1910, the number increased to
80 million (Zhang, 1996). To raise adequate funding to support modern schooling, a novel
policy was prompted, which aims to activate traditional temple assets to finance local
education, and is often referred to as the “Temple Destruction Movement (TDM).”
Early in 1898, one of the most important Chinese politicians, Zhang Zhidong, wrote
a famous proposal (Quanxue Pian) to the Emperor Guangxu and the Empress Dowager
Cixi, suggesting that the government should take over the assets of those Buddha temples,
and use the money to build primary schools in the local communities, so that China will
cultivate more literate youngsters and generate modern human capital to compete against
the western countries. As part of the tremendous 1898 reform plan (Wuxu Bianfa), the
government accepted this advice, and planned to change 70% of the country’s temples
into primary schools, and take over 70% of these temples’ assets to use as education budget.
However, due to political and ideological reasons, the 1898 reform plan only lasted for 104
days, before most of the innovative policies were terminated by the Empress Dowager
Cixi, and 7 of the major designers of the reform were sentenced to death, even the emperor
himself was imprisoned in the Forbidden City (Xu 2008). As a result, the TDM was also
banned by the government. However, under the pressure of raising enough fund for local
education, some local governments implemented this policy secretly at smaller scales.
Realizing such cases, in 1905, the central government re-emphasized that the TDM was
illegal.
In 1912, the Qing government was overthrown, and the Republican of China was
founded. In the same year, President Yuan Shikai issued the “31 rules of temple
administration,” which formally urged the local governments to take over all (rather than
70%) of the temple assets to construct modern schools. Soon after that, the TDM thrived
across the whole country, and persisted with local authorities even though the centralized
state power disappeared again after Yuan Shikai died in 1916. Nearly twenty years later, in
the 1930s, the Kuomintang reestablished the centralized state power and formally
1 Tael is a Chinese traditional unit of weight, 1 tael ≈ 37.8 g.

7
facilitated the movement once again. Therefore, the TDM persisted for more than 40 years,
until the establishment of the PR China (Katz 2012, 2013).
Buddha and Taoist temples had accumulated large amount of assets throughout the
history, including buildings, land, and cash. While there is no official survey data, some
studies estimate temple assets using historical documents. Xu (2010) summarizes that, in
late Qing Dynasty, there were about 2 million Buddha and Tau temples, and they totally
owned about 16 million houses, 13,000 square kilometers’ land and “millions tael of silver.”
As a matter of fact, the imperial China actually had a long-standing historical tradition that
governments solve their fiscal crisis by seizing temple assets. Following that tradition, it
was natural that the Qing and Republican governments regarded temple assets as viable
sources of funding for modern education. During the TDM, local governments and elites
took over tremendous amount of wealth from temples, and used it to support the
construction of a modern education system.
With adequate funding collected from temple assets, modern education thrived
quickly across the country. As shown in figures 1 and 2, during the first half of the 20th
century, the development of modern education has been boosted twice2. In 1910s and
1930s, both the amount of schools and students had increased greatly, which are consistent
with the periods that the TDM was conducted and facilitated.
[Insert Figure 1 and 2 about here]
Historical studies also find that the Temple Destruction Movement had huge
destructive effects on Buddhism and Taoism in China. Before the Temple Destruction
Movement, in Chinese history, there were four similar movements of seizing temple assets,
summarized by the Buddhists as “four greatest disasters” (Sanwu Yizong Fanan). However,
none of them can be compared to the TDM. The most common form of destruction was
to use temples’ houses as schools. From existing historical evidences, more than 70% of
schools were transformed from temples. In addition, some local governments also
regulated temples’ land as part of schools’ assets, or imposed high “religion tax” on temples
(Xu, 2010).
2 The data we use in the figures will be introduced in section 3.

8
3 Data and Key Variables
The data for our analysis is collected from assorted sources, and constructed as several
datasets. First, we have a prefectural-level panel dataset, with information on modern
education, temple and other control variables in the early 20th century (1907-1930), which
will be used to investigate the effects of the TDM on school construction. Second, we
obtain personal information of top university alumni and oversea students before the
establishment of the PR China, and use the average number of students as the measure of
elite human capital from the 1890s to the 1940s. Third, we use a county-level cross-
sectional dataset, with information on urbanization rate and other control variables in 1920
and 1964, to identify the effects of school construction on economic development in the
mid-run. Finally, we collect county-level average income and other indicators of human
capital in 2000, and try to investigate the TDM’s positive effects on long-term economic
growth.
3.1 Prefectural-level Panel Data of Modern Education and Temple Assets
Modern Education Data
The original education data basically includes three historical periods, from the late Qing
Dynasty to the Republic of China. It records detailed information on the number of
schools, number of students, types of schools and education budget at the county-level.
In the first period, this database includes three years’ education data in the late Qing
Dynasty, which is the year of 1907, 1908 and 1909. In the second period, this database
includes two years’ education data in the beginning of the Republic of China, which is the
year of 1915 and 1916. The above five years’ survey data was respectively complied as the
first, second, third, fourth and fifth time of the “Statistical Chart of Education” (Jiaoyu
Tongji Tubiao). In 1905, during the political reform in the late Qing Dynasty, the Ministry
of Education was established for modern education reform. Between the year of 1907 and
1909, the Minister of Education was Zhang Zhidong, who was well-known for his progress
of sponsoring modern education in Hubei. Since the modern education reform had been

9
conducted in China for nearly ten years at that time, Zhang Zhidong carried out those
surveys to investigate and evaluate the reform in nationwide.
However, after the third survey in 1909, the nationwide survey of modern education
was interrupted by the 1911 Revolution. Till the year of 1915 and 1916, in the early
Republic of China, the Ministry of Education successfully conducted the fourth and fifth
surveys again under the comparatively stabilized atmosphere. Afterwards, the national
survey of modern education was once again interrupted by conflicts and wars.3
The third period is much longer than the first two periods, which is between the year
of 1919 and 1935. From 1920s to 1930s, the national surveys of modern education were
missing because of the unstable political atmosphere. Therefore, the county-level
education data comes from several provincial surveys conducted by some local education
authorities. This dataset includes five provinces’ county-level education data in 1920s, and
nine provinces in 1930s. The above surveys provide by far the best and the most complete
national county-level education data, which has been cited as credible historical data in the
history literature (Shang, 2001; Su, 2007). The specific sources of education data can be
specifically traced and is summarized in table A1 in Appendix.
Based on the original county-level education data with multiple years, we then do two
important adjustments to reorganize it into a prefectural-level panel data with five years.
In the first period, we observed that the data of 1907, 1908 and 1909 is basically complete
with little missing values. Therefore, we keep all the 1907, 1908 and 1909’s data in the first
period. However, in the second period, we observed that the data of 1915 has a complete
coverage, while the data of 1916 has many missing values. We then only use the 1915’s
data to represent the second period and drop the data of 1916. As for the third period, we
set 1930 as the representative year, and for each available province, we choose data whose
survey year is closest to 1930. In summary, we now have the adjusted data with five
representative years, for each period. A tricky problem is how to append them into a panel
data. From the late Qing Dynasty to the Republic of China, the changes of county-level
administrative divisions were frequent and complicated. Furthermore, we are lack of any
3 The detailed process of the five times’ nationwide education survey has been fully studied by several historians, see Guan (1999), Ma and Lu (2002), and Wang (2010).

10
GIS map to handle the changes. Luckily, most of the changes are within prefectures, and
we can avoid the tricky problem by summarizing the data from county-level to prefecture-
level. Based on 1820’s map from CHGIS,4 we are finally able to construct a prefectural-
level education panel data with years of 1907, 1908, 1909, 1915 and 1930.
The modern education data has 264 prefectures in 18 provinces in 1907, 1908, 1909
and 1915, and 135 prefectures in 10 provinces in 1930. We use the number of primary
schools and students as the main indicator of modern education development.
Temple and Traditional School Data
The data for temple assets is documented in the “Imperial Encyclopedia of the Qing
Empire” (Daqing Yitong Zhi), which includes prefecture-level information on the important
local Buddha and Taoist temples. This book was compiled by Qing government for more
than 150 years, and was final-edited in 1842. For each prefecture, we obtain the total
number of important temples as the indicator of temple assets before the TDM. Our data
includes 264 prefectures in 18 provinces, which can be perfectly matched to 1820’s map
from CHGIS.
Furthermore, we also collect the number of traditional schools in 1820, and include
it in our regression as a control variable.
Population, Area and Jinshi Data
We also include other important socioeconomic information in our study. We have
collected prefectural-level population data for six years, including 1776, 1820, 1850, 1880,
1910 and 1953. We have also collected area of each prefecture.
In Qing dynasty, there are more than 26,000 successful candidates of the civil exam
(Jinshi). From the “Official Records of Jinshi in Qing Dynasty” (Qingdai Jinshi Timing Lu),
we identify each exam successful candidate’s prefecture of origin and construct a
prefectural-level data of the total number of civil exam graduates.
4 The China Historical Geographic Information System provide a prefectural-level GIS map in 1820.

11
We match the aforementioned datasets to the panel dataset of education. Except for
the number of primary schools and students, all the other variables are time-invariant.
3.2 Prefecture-level Panel Data of Top University Alumni and Oversea Students
From assorted historical archives and alumni books, we obtain personal information of
top university alumni and oversea students. We identify 16,439 students who graduated
before 1950, from the top 2 universities in China, Peking University and Tsinghua
University, both located in Beijing. We divide the era into eight 5-year periods, and for
each prefecture, we summarize the number of students enrolled in the top 2 universities
in each period. For oversea students, we identify 9,001 individuals who were born between
1890s and 1940s. Similarly, we divide the birth era into 10-year periods, and for each
prefecture, we count the number of future oversea students born in each period.
By above method, we construct two prefecture-level panel data of the number of top
university alumni and oversea students. Furthermore, we match the datasets to the panel
datasets of education, population and area, especially the variable of average temples.
3.3 County-level Data of Urban Population and Urbanization Rate
The data of urban population and urbanization rate in 1920 are obtained from “The
Christian Occupation of China” (Stauffer, 1922), which contains population of all counties
and urban population of cities with more than 25,000 residents. Therefore, we compute
the proportion of population living in urban areas as a measure of urbanization in 1920.
We also collect population data in 1964 from the “The Complied Statistics of the
Second National Population Census” (National Bureau of Statistics, 1982). The data
includes total population, male population and the number of households. In the Census
data, we also know in each county how many people are registered as “urban residents,”
and how many as “rural residents.” The residents were largely classified by their types of
occupation: urban residents typically participate in non-agricultural production, and vice
versa. Since in the 1960s migrations across regions were banned in most cases, the ratio of
urban residents in a region is an accurate measure of its level of urbanization. Therefore,
we can obtain urbanization rate and average family size in 1964.

12
We merge the above two datasets together, and construct a county-level dataset of
urbanization rate. Furthermore, we identify the prefecture each county belongs to, and
combine the data with prefectural-level variables. In the end, we have information for 1,700
counties from 18 provinces in our data.
3.4 County-level Contemporary Data of Economic Growth and Human Capital
To study the long-term impacts of the TDM, we assemble contemporary socioeconomic
indicators of Chinese counties. We obtained county-level data on economic growth and
human capital in 2000, including aggregate GDP, government subsidies on education and
culture, from the Statistical Materials of Public Finance of Cities and Counties; and data on
population, literacy rates and years of schooling from the Fifth National Population
Census (2000).
One of the challenges faced by our study is that because of the long historical span,
political regimes changed and territorial borders of many counties also shifted. We address
this challenge by first comparing the GIS data for both 1820 and 2000 and then converting
prefecture-level variables in the early 20th century to those in 2000 using overlapping area
as weights. To achieve those ends, we obtain historical GIS data from the China Historical
Geographic Information System (CHGIS). Then we construct a data set that combines
historical education and temple data, and contemporary socioeconomic data.
3.5 Key Variables
All variables used in this study are summarized in table 1, containing their definition,
sources and statistics. In the following, we discuss several key variables.
Average Temple Assets
Ideally, to construct a proxy for temple assets, we would like to have detailed information
on the number of temples in each prefecture, along with measurements of scale and wealth
for each temple. However, as discussed in section 3.1, the “Imperial Encyclopedia of the
Qing Empire” only lists those important temples, and doesn’t include the small ones.

13
Therefore, we could only proxy for the “stock of temple assets” using the “number of
important temples” in each prefecture.
For this to be a good proxy, we need to assume that the (unobservable) overall temple
asset is positively correlated with the number of important temples, which seems to be
reasonable. Also, since whether a temple is listed as “important” or not is a subjective
judgement of the authors of the “Imperial Encyclopedia of the Qing Empire,” the
standards may be inconsistent across regions, and lead to measurement errors. We need to
assume that the measurement error is not correlated with local education conditions, which
means that the authors do not change their criterion for temples according to the local
education levels, which is also likely to be satisfied.
We use 1820 population as denominator to calculate the average number of important
temples, and obtain the proxy variable of average temple assets.
Average Schools\Students
We use the education data and population data described in section 3.1 to calculate the
average schools and average students.5 For modern schools\students in 1907, 1908, 1909
and 1915, we use the population of 1910 as denominator. For schools\students in 1930,
since we only have population data for 1910 and 1953, we use 1910 population as
denominator, but also try to use 1953 and the simple average of 1910 and 1953, for all the
three cases, the results are largely the same.
Average Top University Alumni and Oversea Students
With the student data in section 3.2, combined with population data, we calculate the
average number of enrolled top university students and born oversea students in every
period. Similarly, for periods after 1920s, we use 1910 population as denominator, but also
try to use 1953 and the simple average of 1910 and 1953, for all the three cases, the results
are largely the same.
5 Average Schools= Schools/Population, Average Students= Students/Population.

14
Urbanization Rate and Schools’ Differences
In the county-level data, we have urbanization rate in 1920 and 1964. We define the
∆Urban as the difference between two rates.6 We also have average schools in 1909 and
1915, and can define ∆School and ∆ln(School) in the same way.7
Contemporary Economic Development and Human Capital
In our contemporary county-level data, we have average income (GDP per capita) and
urbanization rate as the indicator of economic development level in 2000. To investigate
the mechanisms, we use average years of schooling, literacy rate and culture and education
expenditure per capita to measure the level of human capital.
[Insert Table 1 about here]
4 Empirical Results: Short- and Mid-Terms
4.1 TDM and Mass Education
As argued above, prefectures with more temple assets ex ante, thanks to the TDM, had
easier access to education funding during the Republican era, and were thus more likely to
invest in modern education, which would lead to better economic development later on.
To formalize this logic, we first adopt a DID model, and test whether the places with more
temple assets ex ante indeed constructed more schools during the movement.
We define the prefectures with temples more than the median value as “treated,” the
others as “control.” The information of schools is available in years 1907, 1908, 1909, 1915,
and 1930. As discussed above, the Temple Destruction Movement really started to peak
after 1912, so we can regard the changes between 1907 and 1909 as “pre-trends,” and the
changes between 1909 and 1930 as “post-trends.”
[Insert Figure 3 about here]
Figure 3 shows the trends in the average number of schools for treated and control
groups. In 1907, both groups had essentially the same amount of schools; before the TDM
6 ∆Urban= urbanization rate in 1964 - urbanization rate in 1920 7 ∆School= average primary schools in 1915 - average primary schools in 1920. ∆ln(School)= ln(average primary schools in 1915) – ln(average primary schools in 1909).

15
was introduced, the school construction for both groups followed very similar trends, and
their difference in levels were also almost negligible. Differences between the prior trends
is statistically insignificant, so the identical trends assumption holds, which makes our
Difference-in-Differences approach likely to be a valid one. Moreover, before the
treatment, difference in levels in the two groups is also statistically insignificant, which
provides further credibility to our identification strategy. During the post-treatment period
(1909-1930), the number of schools in the treated group (prefectures with temples above
the median value) increased much faster than that in the control group. Moreover, the
differences between trends enlarged between 1915 and 1930, a naïve but intuitive
interpretation for this fact is that the control group started to face increasing marginal costs
of taking over temple assets, while the treated group, having more temples, did not face
such problem.
In figure 4, we show the trends in the number of students for treated and control
groups in years 1907, 1908, 1909, 1915 and 1930. We see that both the pre-trends and the
post-trends of average primary students are very similar to that of the schools.
[Insert Figure 4 about here]
We quantify the observations from the graphical analysis using a DID method:
𝑆𝑐ℎ𝑜𝑜𝑙𝑖𝜏 = ∑ 𝛼𝜏𝜏∈{1908−1930} ∗ 𝑇𝑒𝑚𝑝𝑙𝑒𝑖 ∗ 𝑌𝑒𝑎𝑟𝜏 + 𝑋𝑖𝜏′ ∗ 𝛽 + 𝜌𝜏 + 𝜇𝑖 + 𝜀𝑖𝜏 (1)
where 𝑆𝑐ℎ𝑜𝑜𝑙𝑖𝜏 is defined as the number of primary schools per 10,000 people in
prefecture i, 𝑇𝑒𝑚𝑝𝑙𝑒𝑖 is defined as the number of temples per 10,000 people in
prefecture i in 1820, 𝑌𝑒𝑎𝑟𝜏 is the time dummy. 𝑋𝑖𝜏 is a set of control variables that vary
both across units and time, 𝜌𝜏 is a time effect common to all prefectures in period 𝜏, 𝜇𝑖
is a time-invariant effect unique to prefecture i, and 𝜀𝑖𝜏 is a prefecture time-varying error
distributed independently of 𝜇𝑖 and 𝜌𝜏. The year of 1907 is left as a comparison.
[Insert Table 2 about here]
As shown in table 2, the interactions of temples and 1908 and 1909 are not statistically
significant, which is consistent with the “parallel trends” assumption. The interactions
“temple*1915” and “temple*1930” are both statistically significant at 1% level, which
indicates that the prefectures with more temples have a faster speed of school construction

16
after the movement started. We try to control for different variables, including the time-
variant impacts of ln(Population), ln(Area), Average Traditional Schools and Average Jinshi
Number, in column 2 and 3, and the prior results are highly robust. Since nearly half of
prefectures have missing values in 1930’s data, in column 4, we only include the data of
1907, 1908, 1909 and 1915, and the prior results remain the same. In column 5, we exclude
prefecture fixed-effects, and include the interaction term temple*1907, to test whether
regions with different number of temples have different number of schools in 1907. As
we can see, the coefficient is statistically insignificant, indicating that temples are unlikely
to be correlated with number of schools in 1907.
We also estimate the effect of TDM on primary school students using the same DID
method:
𝑆𝑡𝑢𝑑𝑒𝑛𝑡𝑖𝜏 = ∑ 𝛼𝜏𝜏∈{1908−1930} ∗ 𝑇𝑒𝑚𝑝𝑙𝑒𝑖 ∗ 𝑌𝑒𝑎𝑟𝜏 + 𝑋𝑖𝜏′ ∗ 𝛽 + 𝜌𝜏 + 𝜇𝑖 + 𝜀𝑖𝜏 (2)
where the dependent variable has been changed as 𝑆𝑡𝑢𝑑𝑒𝑛𝑡𝑖𝜏, which is defined as the
number of primary schools per 10,000 people in prefecture i. As shown in table 3, patterns
the results are very similar to table 2. Before the TDM, parallel trends are satisfied, but
after the TDM, places with higher stock of average temples enrolled significantly more
students. Results are highly robust to the inclusion of various control variables, column 5
indicates that the initial level of average students is also uncorrelated with average stock of
temples.
[Insert Table 3 about here]
4.2 TDM and Elite Education
As shown in section 4.1, the TDM led to construction of more schools and enrollment of
more students, indicating that the TDM has very likely contributed to massive education.
However, did the TDM affected only mass human capital, or did it also contribute to the
formation of elite human capital?
In this section, we measure elite human capital using “average number of alumni
from top universities” and “average number of oversea students,” and provide evidence
that before the TDM, the formation of elite human capital was uncorrelated with the stock

17
of average temples; but after the TDM, regions with more temples cultivated significantly
more modern elites. We provide suggestive evidence that higher education expenditure per
student due to the TDM might contributed to elite human capital.
Alumni of Top Universities
For top 2 university alumni, we aggregate the individual level data to the prefecture level
and match it with the stock of average temples and other prefecture level variables. We
also aggregate the yearly data to 8 five-year periods, so that the change of alumni for each
prefecture becomes smooth. Our results are not sensitive to different methods of
aggregation.
As shown in section 4, the TDM started to peak after 1909. Considering the regular
time of primary and middle schools education, we would expect that the stock of average
temples had and only had effects on top university enrollment after the 1920s. Therefore,
we define a dummy variable 𝑃𝑜𝑠𝑡𝜏, which equals one if period 𝜏 is after 1920, and zero
otherwise. We then estimate the following equation:
𝐴𝑙𝑢𝑚𝑛𝑖𝑖𝜏 = 𝛼 ∗ 𝑇𝑒𝑚𝑝𝑙𝑒𝑖 ∗ 𝑃𝑜𝑠𝑡𝜏 + 𝑋𝑖𝜏′ ∗ 𝛽 + 𝜌𝜏 + 𝜇𝑖 + 𝜀𝑖𝜏 (3)
where 𝑇𝑒𝑚𝑝𝑙𝑒𝑖 is the stock of average temples in prefecture i in 1820, 𝑋𝑖𝜏′ is a vector
of prefecture level control variables that varies with time. 𝜌𝜏 is time fixed effect, 𝜇𝑖 is
prefecture fixed effect, 𝜀𝑖𝜏 is the error term that varies both with time and prefecture.
As shown in the first three columns of table 4, a 10% increase in the stock of average
temples would result in about 2% increase in average top university alumni after the
movement.
[Insert Table 4 about here]
In order to present the dynamic effects and test for pre-trends, we also explore a
slightly different specification where the stock of average temples is interacted with each
period, and the coefficients and confidence intervals are plotted in figure 5. As we can see,
there is no differences in trends for the pre-periods, and significantly different trends in
the post-periods, suggesting that our diff-in-diff approach is likely to be valid.
[Insert Figure 5 about here]

18
Oversea Students
We do almost exactly the same exercise with oversea students as outcome variable. We
aggregate the individual data to prefecture level, and aggregate the yearly data into 6 ten-
year periods. The record of oversea students document their birth year rather than year of
going abroad, so we define periods according to year of birth. Since the TDM started in
1912, we would expect that only individuals born after 1900 could benefit from the stock
of average temples. Therefore, in this specification, 𝑃𝑜𝑠𝑡𝜏 equals one for periods after
1900, and zero otherwise.
We estimate the following equation:
𝑂𝑣𝑒𝑟𝑠𝑒𝑎𝑖𝜏 = 𝛼 ∗ 𝑇𝑒𝑚𝑝𝑙𝑒𝑖 ∗ 𝑃𝑜𝑠𝑡𝜏 + 𝑋𝑖𝜏′ ∗ 𝛽 + 𝜌𝜏 + 𝜇𝑖 + 𝜀𝑖𝜏 (4)
where 𝑂𝑣𝑒𝑟𝑠𝑒𝑎𝑖𝜏 is defined as the average number of oversea students in prefecture i in
period 𝜏, other variables are defined same as before.
As shown in table 4, previous stock of temple assets would strongly affect the ratio
of oversea students after the TDM started. A 10% increase in average temple assets would
lead to 1.2% increase of average oversea students.
Same as for top university students, we run another specification that interact average
temples with each period, and plot the coefficients and confidence intervals. As shown in
figure 6, temples were not correlated with change in oversea students before the movement,
while places with more temples had significantly more oversea students after the
movement started.
[Insert Figure 6 about here]
4.3 Mid-Term Impacts on Economic Development
As discussed in sections 4.1 and 4.2, because of the TDM, regions with more temples
accumulated higher human capital, at both mass and elite levels. A natural question would
then be, whether the advantage in human capital later transformed in to a margin in
economic development?
Before the Temple Destruction Movement
As shown before, human capital was uncorrelated with temples in both levels and trends.
Ideally, we would like to conduct same tests for our economic outcomes. However, there

19
are very few economic indicators that have multiple periods of data available before the
TDM started. So instead, we do the following two tests.
First, we collect cross-sectional data on average tax revenue before the TDM, and run
an OLS regression of tax on temples. Since average tax revenue is a good indicator for
local economic prosperity, and our hypothesis is that temples are orthogonal to economic
development before the TDM, we should expect to see that the stock of temples have no
effects on average tax revenue. As we can see from columns 1-3 in table 5, this is exactly
the case.
Second, while we do not have multiple periods for most economic indicators, we do
have a cross-sectional dataset on the distribution of modern factories across the country
in 1916. We first argue that since the TDM only started in 1912, and education should need
longer time to influence industrialization, the establishment of factories before 1916
should not be affected by the TDM. Furthermore, since there were very few modern
factories before the self-strengthen movement (1861), we could actually interpret the level
of factories in 1916 as the trends of factory establishment between 1861 and 1916. This
way, by running a regression of the 1916 factories on 1820 temples, we are actually also
testing whether the stock of temple assets affected the trend of industrialization in the
late-Qing era (pre-TDM). As shown in columns 4-6 in table 5, temples are uncorrelated
with factories, indicating that the parallel trends assumption is also likely to hold for
economic development.
[Insert Table 5 about here]
After the Temple Destruction Movement
Since information for China’s regional economic outcomes before the 1980s is largely
missing, for economic outcomes, we follow the literature and specify the degree of
urbanization as a proxy for economic development, given that this indicator is believed to
be highly and positively correlated with per capita income (Acemoglu et al 2005; Bai and
Kung, 2014).
We estimate the following equation:

20
∆𝑢𝑟𝑏𝑎𝑛𝑖 = 𝛼 ∗ 𝑇𝑒𝑚𝑝𝑙𝑒𝑖 + 𝑋𝑖′ ∗ 𝛽 + 𝜇𝑝𝑟𝑜𝑣 + 𝜀𝑖 (5)
where ∆𝑢𝑟𝑏𝑎𝑛𝑖 is the speed of urbanization during 1920-1964, 𝑇𝑒𝑚𝑝𝑙𝑒𝑖 stands for the
average number of temples in 1820 in the prefecture that county i belongs to, 𝑋𝑖′ is a
vector of county-level control variables, 𝜇𝑝𝑟𝑜𝑣 is province fixed effect, 𝜀𝑖 is the error
term.
As shown in columns 1 and 2 of table 6, counties with higher stock of average temples
in 1820 experienced faster urbanization during 1920-1964. While exclusion restriction
could not be directly tested, we provide suggestive evidence by exploring the channels
through which temples might affect growth: if temples affect economic outcomes only
through human capital, once including measures of human capital as control variables in
the regressions, temples should no longer have significant impacts on economic outcomes.
As shown in columns 3 and 4 of table 6, once control for mass education, the
magnitude and significance of the coefficient for temples drop sharply; when we further
control for elite education in in columns 5 and 6, the magnitude further drops and the
significance totally disappears. These results suggest that human capital accumulation is
likely to be the source of economic development we observed in the data.
[Insert Table 6 about here]
4.4 Mechanisms
4.4.1 Mechanisms for Elite Human Capital Formation
Since temples and elite human capital are uncorrelated for periods before the TDM, it is
likely that the parallel prior trends assumption is satisfied: places with more temples and
places with fewer temples did not have significant differences in human capital
accumulation. To further test this hypothesis, we regress the average number of Jinshi on
the average number of temples. As shown in table 7, there is no statistically significant
relationship between Jinshi and temples, this reassures that the TDM is an appropriate
natural experiment to study the effects of human capital accumulation.
[Insert Table 7 about here]
Why might the TDM improve elite human capital formation? One straight-forward
channel is that since more schools were constructed, more students were enrolled in

21
modern schools, and thus more elites were selected out of a larger pool. In addition to this
explanation, since temple assets were used to not only construct schools, but also finance
students, it could be possible that the TDM also cultivated elites by improving the quality
of education. We test this hypothesis by regressing the average education fund per student
on the average amount of temples using a fixed effect model. As shown in table 8, places
with more temples had higher education fund per student, which suggests that the quality
of education was also better. Considering the large heterogeneity of education quality in
the Republican era, it is reasonable that places with more sufficient funding could provide
much better education, and their students will be more likely to stand out and become
elites.
[Insert Table 8 about here]
4.4.2 Mechanisms for Economic Development
As shown in section 4.3, by exploiting the TDM as a natural experiment, we find significant
positive effects of education investment on economic development. However, remaining
concerns include the following two:
1. It might be the case that the TDM added to the budget of local governments where
there were more temples, and not 100% of the added budget was on school
construction, or by adding new education budgets, they could reallocate the original
government education budget for other purposes. If that is the case, then the observed
effects on urbanization could also be explained by “resource reallocation” and “general
government spending,” rather than just increased investment in education.
2. During the TDM, thousands of temples were shut down, as a result, many monks
decided to return to laity (Katz, 2013). It might be the case that these “monks returned
to laity” added to the local labor supply, and directly contributed to local development.
In this section, we discuss these two concerns respectively. Qualitative evidence and
placebo tests will be provided to address the concerns.
Resource Reallocation
Both government documents and anecdotal evidence suggest that during the late Imperial

22
and early Republican eras of China, massive primary education was supported exclusively
by the local gentries, and the governments at different levels were really hands-off on such
issues (Shang, 2001; Su, 2007). Given that the local governments did not have any budget
prepared for massive education before the TDM, we may not need to worry too much
about the possibility that by using temple assets to build schools, they can then reallocate
the original education budget in other ways, and boost the economy.
However, even though the TDM requires that the temple assets should be used only
for massive education, we may still be concerned that some governments would simply use
the temple assets in other ways, for instance, invest in basic infrastructures, and thus
contribute to the local economy. If that is the case, temples may affect the economy
through channels other than education, then we could no longer interpret findings of
section 4.3 as a causal relationship between human capital and economic development.
However, as we discussed in section 4.3, once human capital is controlled for, temples
no longer affect growth. This indicates that it is unlikely that temples boosted the economy
in ways other than education, which is inconsistent with this hypothesis. In addition,
qualitative evidence suggests that local governments hardly had any budget prepared for
modern education other than raising from local elites and temples, and education budget
was almost the only legitimate reason to ask for their donations. As a result, using these
funds to serve other purposes is difficult for the local governments, and could easily cause
severe social unrest and even local conflicts (Xu, 2010; Katz, 2013). Therefore, both the
data and the historical evidence seem to be inconsistent with this alternative hypothesis.
Increased Labor Supply
As shown in section 4.3, temples have no effects on growth after controlling for human
capital, so it is unlikely that the temples, in addition to boosting investment in education,
had also contributed to the economy by adding the “monks returned to laity” to local labor
supply.
To further address this concern, we carry out a falsification test. We have shown that
the treatment group (prefectures with temples above the median value) and the control
group (prefectures with temples below the median value) had largely comparable

23
socioeconomic conditions before the TDM, and we have also shown that the TDM was
happening very rapidly between 1909 and 1930. So if it was the case that many “monks
returned to laity” joined the labor force due to the TDM, given that the monks did not
have their own land and were thus unlikely to participate in agricultural production, it is
likely that we would observe the treatment group had a higher worker/population ratio in
the 1930s. From the “Chinese Industry Report,” we collect total numbers of industry
workers in 135 counties in 1934. However, as shown in table 9, the average temple assets
has little impact on the ratio of workers in 1934, meaning that the “monks returning to
laity” concern may not be a severe one.
[Insert Table 9 about here]
5 Empirical Results: Long-Term
In section 4, we have shown the effects of the TDM on mass and elite human capital, and
also the effects of such human capital growth on economic development. In this section,
we would like to further explore the persistence of these effects.
As explained in section 3, we matched a county level socio-economic dataset with our
historical prefecture level panel dataset. Using this merged dataset, we could estimate the
following equation:
𝑌𝑖 = 𝛼 ∗ 𝑇𝑒𝑚𝑝𝑙𝑒𝑖 + 𝑋𝑖′ ∗ 𝛽 + 𝜇𝑝𝑟𝑜𝑣 + 𝜀𝑖 (6)
where 𝑌𝑖 is the outcome of interest for county i in year 2000, 𝑇𝑒𝑚𝑝𝑙𝑒𝑖 stands for the
average number of temples in 1820 in the prefecture that county i belongs to, 𝑋𝑖′ is a
vector of county-level control variables, 𝜇𝑝𝑟𝑜𝑣 is province fixed effect, 𝜀𝑖 is the error
term.
Persistence of Human Capital
We first test whether the positive effects of the stock of average temples persisted into the
21st century.
As shown in table 10, counties with higher stock of temples in 1820 have significantly
higher average years of schooling, literacy rate, and per capita culture and education
expenditure in 2000. On average, a one standard deviation increase of average temples in

24
that prefecture would lead to the average years of schooling in that county to increase by
0.1 years, the illiteracy rate to drop by 6%, and the per capita culture and education
expenditure to increase by about 4%.
These results are highly robust to various types of control variables. Specifically, if
one concerns that the TDM has direct impact on religious practices in different regions,
which would in turn affect the outcomes, we show that including other measurements of
religious practices (average vicars, average churches) does not change the result at all, which
could arguably reduce the concern.
[Insert Table 10 about here]
Persistent Impacts on Economic Development
We now examine whether the persistence of human capital would contribute to economic
development in the long run.
As shown in table 11, counties with higher stock of temples in 1820 have significantly
higher per capita GDP and urbanization rate in 2000. On average, a one standard deviation
increase of average temples in that prefecture would lead to per capita GDP to increase
by about 300 Yuan (about 10% of the mean), and urbanization rate to increase by about
6%.
To justify the causal effects of human capital on these economic outcomes, we
explore the potential channels through which temples could affect the economy: if temples
affect economic outcomes through ways other than human capital, by including measures
of human capital as control variables in the regressions, temples should still have
significant impacts on economic outcomes.
As we can see from columns 3 and 6 of table 11, after including three measures of
human capital (average years of schooling, literacy rate, average culture and education
expenditure) as control variables, the positive effects of average temples totally disappear.
Therefore, it is unlikely that temples affect the economy through channels other than
human capital, and thus the results of table 11 could likely be interpreted as causal evidence
that human capital accumulation contributed to economic growth in the long run.
[Insert Table 11 about here]

25
6 Robustness
As shown in the previous tables, our results are not sensitive to the inclusion of various
kinds of control variables. In addition to that, in this section, we explore several different
datasets and specifications to further justify the robustness of our previous results.
Alternative Measurement of Temple Assets
The key variable for our analysis is the “stock of average temples,” which is used to proxy
for the average stock of temple assets in that local area. In our main analysis, we used
prefecture-level data digitized from the “Imperial Encyclopedia of the Qing Empire”
(Daqing Yitong Zhi), which documents the most important temples across the country.
According to historical records, China had more than 200,000 registered temples, but only
about the most important 1.5% were documented in our data.
For our measurement to precisely reflect the distribution of temple assets, we then
need to make the assumption that the total stock of temple assets in a region is highly and
positively correlated with its stock of large temples. How reliable is this assumption, or
how sensitive are our results with respect to it? We explore another source of temple data,
a county-level record digitized from the “Imperial Encyclopedia of Gazeteer” (Gujin Tushu
Jicheng). It also documents the most important temples across the country in 1776, basically
in a close period to the first source. Since there is no county-level population data available,
we could not conduct our analysis at the county-level using this new dataset. Instead, we
aggregate it to the prefecture level, so that we have a different measure of the stock of
temple assets, which covers about the most important 15% of the temples in China. We
first plot a scatter graph between the two different measures, as shown in figure 7, they are
very highly and positively correlated, just as we expected. Furthermore, we re-produce
figures 1 and 2 using the new data, as shown in figures 8 and 9, the patterns are almost
26
identical. We re-run all the main specifications using the new dataset, all the results go
through8.
Therefore, we conclude that our main findings are unlikely to be sensitive to the
measurement of temples.
Inclusion of Primary Schools in 1820
Another concern about our results is that when testing for pre-trends of school
construction and students enrollment before the TDM started, while we had three periods
(1907-1909), they are too adjacent to each other, and that may reduce the power to detect
potential significant differences in such a short period. If that is the case, our evidence for
“parallel trends” will be weakened.
To address this issue, we make use of the 1820 data of traditional primary schools.
While both referred to as “primary schools,” the traditional ones in 1820 are different in
many ways from the modern ones in our latter data, so we did not include this period in
our panel dataset for main analysis. However, for the sake of testing parallel trends and
balanced initial levels, the 1820 data could be helpful: change of primary schools between
1820 and 1909 could reflect the trend of human capital investment in the long-run, which
could provide us with substantial power to detect any potential differences caused by the
differences in the stock of temples.
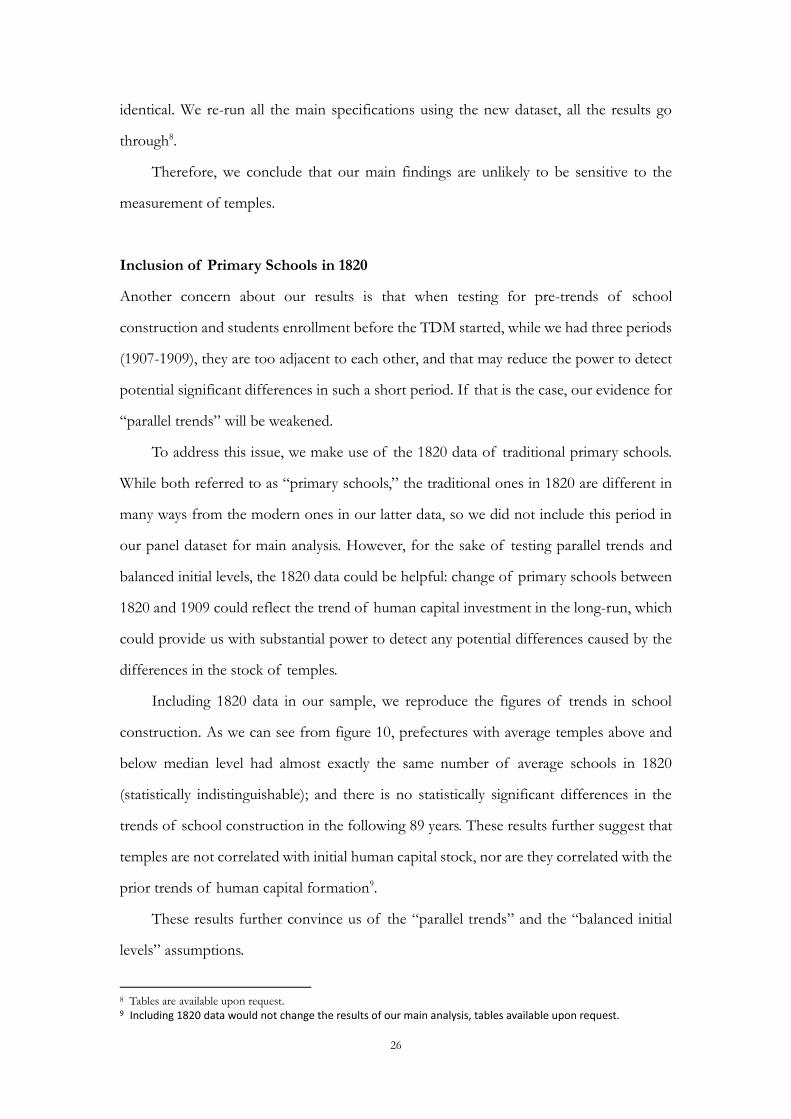
Including 1820 data in our sample, we reproduce the figures of trends in school
construction. As we can see from figure 10, prefectures with average temples above and
below median level had almost exactly the same number of average schools in 1820
(statistically indistinguishable); and there is no statistically significant differences in the
trends of school construction in the following 89 years. These results further suggest that
temples are not correlated with initial human capital stock, nor are they correlated with the
prior trends of human capital formation9.
These results further convince us of the “parallel trends” and the “balanced initial
levels” assumptions.
8 Tables are available upon request. 9 Including 1820 data would not change the results of our main analysis, tables available upon request.

27
Excluding Treaty Ports
Past research has shown that the treaty ports experienced significantly faster development
throughout the 20th century (Jia, 2014). In addition, some of the coastal areas have more
Buddhists than other regions. Therefore, one might be concerned that our results of
temples on economic growth could be partly driven by the development of the treaty ports.
To reduce this concern, we re-run our main results excluding the treaty ports10. As
shown in table 12, the results are very similar to what we had using a full sample. Therefore,
our results are unlikely to be driven by a spurious correlation between treaty ports and
Buddhists.
7 Conclusion
In this paper, we combine various sources of historical datasets and document a novel
natural experiment in the early 20th century China, the Temple Destruction Movement.
We show that before the TDM, the stock of average temple assets is not correlated
with various measures for human capital and economic development; but after the TDM
started, regions with higher stock of temple assets obtained both higher mass human
capital (constructing more schools, enrolling more students), and higher elite human
capital (cultivating more top university alumni and oversea students). In the mid-run, our
results suggest that places invested more in human capital due to the TDM also
experienced faster urbanization in the later periods.
In the long-run, we present evidence that human capital created by the TDM
persisted into the 21st century: regions with higher temple stocks in 1820 have higher
average years of schooling, literacy rate, and per capita expenditure on culture and
education in 2000. Furthermore, our results suggest that the economic impacts persisted
as well: regions with higher temple stocks in 1820 also have higher per capita GDP and
urbanization rate in 2000.
10 We present here the results of human capital on economic growth using the restricted sample. Other results are available upon request.

28
Our results are robust to various types of different specifications and use of
alternative datasets. Several alternative channels are also discussed and ruled out.
The findings of this paper suggest that investment in modern education could have
significant and persistent positive effects on human capital accumulation, which could
contribute to regional economic growth, both in the mid-run and in the long-run. In
addition to highlighting the importance of education, another potentially important policy
lesson from the documented Temple Destruction Movement is that: for many developing
countries with rich under-used cultural assets in the religious sector, and meanwhile weak
stock of human capital to sustain modern economic growth (e.g., Nepal, Mongolia, etc.),
finding proper ways to activate these cultural assets to serve for human capital growth
could receive tremendous positive effects, which would persist even in the long-run.
References
Abe, Hiroshi. “China’s First Modern Educational System.” In China’s Education and the
Industrialized World, edited by Ruth Hayhoe and Marianne Bastid. Armonk, NY: M.
E. Sharpe, Inc., 1987. 57-80.
Acemoglu, Daron, and Melissa Dell. Productivity differences between and within countries.
No. w15155. National Bureau of Economic Research, 2009.
Acemoglu, Daron, Francisco Gallego, and James A. Robinson. Institutions, human capital
and development. No. w19933. National Bureau of Economic Research, 2014.
Acemoglu, D., Johnson, S., and Robinson, J. A. Reversal of Fortune: Geography and
Institutions in the Making of the Modern World Income Distribution. The Quarterly
Journal of Economics, 117.4 (2002): 1231–1294.
Acemoglu, D., Johnson, S., and Robinson, J. A. "The rise of Europe: Atlantic trade,
institutional change, and economic growth." American economic review (2005): 546-
579.
Ayers, William, Chang Chih-tung and Educational Reform in China. Cambridge, MA:
Harvard University Press, 1971.
Ansell, Ben W. From Ballot to the Blackboard: The Redistributive Political Economy of
Education. Cambridge, England: Cambridge University Press, 2010.
Bai, Ying and Ruixue Jia. “Mobility and Revolution: The Impact of the Abolition of
China's Civil Service Exam System.” Econometrica, forthcoming.
Bai, Ying, and James Kai-sing Kung. “Diffusing Knowledge While Spreading God’s

29
Message: Protestantism and Economic Prosperity in China, 1840-1920.” Journal of
the European Economic Association (forthcoming)
Bailey, Paul J. Reform the People: Changing Attitudes Towards Popular Education in Early
Twentieth-Century China. Edinburgh, Scotland: Edinburgh University Press, 1990.
Bardhan, Pranab. “Decentralization of Governance and Development.” Journal of
Economic Perspectives 16, no. 4 (2002): 185-205.
Bardhan, Pranab, and Dilip Mookherjee, eds. Decentralization and Local Governance in
Developing Countries. Cambridge, MA: The MIT Press, 2006.
Barkan, Lenore. “Patterns of Power: Forty Years of Elite Politics in a Chinese County.” In
Chinese Local Elites and Patterns of Dominance, edited by Joseph W. Esherick and
Mary Backus Rankin, 191-215. Berkeley, CA: University of California Press, 1990.
Barro, Robert J., and Jong‐Wha Lee. “International data on educational attainment:
updates and implications.” oxford Economic papers 53.3 (2001): 541-563.
Barro, Robert J., and Rachel M. McCleary. “Religion and Economic Growth across
Countries”, American Sociological Review, 68.5 (2003): 760-781.
Becker, Sascha O., Hornung, E., and Woessmann, L. “Education and catch-up in the
industrial revolution.” American Economic Journal: Macroeconomics, 3.3 (2011): 92–
126.
Becker, Sascha O., and Ludger Woessmann. “Was Weber Wrong? A Human Capital Theory
of Protestant Economic History.” The Quarterly Journal of Economics 124.2 (2009):
531-596.
Benhabib, Jess, and Mark M. Spiegel. “The role of human capital in economic development
evidence from aggregate cross-country data.” Journal of Monetary economics 34.2
(1994): 143-173.
Bils, Mark, and Peter J. Klenow. “Does schooling cause growth?.” American economic
review (2000): 1160-1183.
Borthwick, Sally. Education and Social Change in China: The Beginnings of the Modern
Era. Stanford, CA: Stanford University Press, 1983.
Buck, David D. “Educational Modernization in Tsinan, 1899-1937.” In The Chinese City
between Two Worlds, edited by Mark Elvin and G. William Skinner, 171-212.
Stanford, CA: Stanford University Press, 1974.
Cantoni, Davide. "The economic effects of the Protestant Reformation: testing the Weber
hypothesis in the German Lands." Journal of the European Economic Association
(2014).
Cantoni, Davide, and Noam Yuchtman. “Medieval Universities, Legal Institutions, and the
Commercial Revolution.” The Quarterly Journal of Economics 129.2 (2014): 823-
887.

30
Chang, P'eng-yuan, and Andrew J. Nathan. “Political Participation and Political Elites in
Early Republican China: The Parliament of 1913-1914.” The Journal of Asian Studies
37, no. 2 (1978): 293-313.
Chaudhary, Latika, Aldo Musacchio, Steven Nafziger, and Se Yan. “Big BRICs, Weak
Foundations: The Beginnings of Public Elementary Education in Brazil, Russia, India,
and China.” Explorations in Economic History 49 (2012): 221-240.
Chauncey, Helen R. Schoolhouse Politicians: Locality and State During the Chinese
Republic. Honolulu, HI: University of Hawaii Press, 1992.
Chen, Yuyu, Hui Wang, and Se Yan. “The long-term effects of Christian activities in China.”
Peking University, manuscript (2013).
Chen, Zhongping. “Beneath the Republican Revolution, Beyond Revolutionary Politics:
Elite Associations and Social Transformation in Lower Yangzi Towns, 1903-1912.”
Late Imperial China 28, no. 1 (2007): 92-127.
Cohen, Daniel, and Marcelo Soto. “Growth and human capital: good data, good results.”
Journal of economic growth 12.1 (2007): 51-76.
Culp, Robert J. “Elite Associations and Local Politics in Republican China: Educational
Institutions in J'iashan and Lanqi Counties, Zhejiang, 1911-1937.” Modern China 20,
no. 4 (1994): 446-477.
De La Croix, David, and Matthias Doepke. “To Segregate or to Integrate: Education
Politics and Democracy.” Review of Economic Studies 76 (2009): 597-628.
Doménech, Rafael. “Human capital in growth regressions: how much difference does data
quality make?” Journal of the European Economic Association 4.1 (2006): 1-36.
Duara, Prasenjit. “State Involution: A Study of Local Finances in North China, 1911-1935.”
Comparative Studies in Society and History 29.1 (1987): 132-161.
Easterly, William, and Ross Levine. The European origins of economic development. No.
w18162. National Bureau of Economic Research, 2012.
Elman, Benjamin A. “Political, Social, and Cultural Reproduction Via Civil Service
Examinations in Late Imperial China.” The Journal of Asian Studies 50, no. 1 (1991):
7-28.
Elman, Benjamin A. A cultural history of civil examinations in late imperial China. Univ
of California Press, 2000.
Engerman, Stanley L., Elisa Mariscal, and Kenneth L. Sokoloff. “The Evolution of
Schooling in the Americas, 1800-1925.” In Human Capital and Institutions: A Long
Run View, edited by David Eltis, Frank D. Lewis and Kenneth L. Sokoloff, 93-142.
Cambridge, England: Cambridge University Press, 2009.
Engerman, Stanley L., and Kenneth L. Sokoloff. Economic development in the Americas
since 1500: endowments and institutions. Cambridge University Press, 2012.

31
Esherick, Joseph W., and Mary Backus Rankin, eds. Chinese Local Elites and Patterns of
Dominance. Berkeley, CA: University of California Press, 1990.
Franke, Wolfgang. The reform and abolition of the traditional Chinese examination system.
Vol. 10. Harvard Univ Asia Center, 1960.
Fernandez, R. Does Culture Matter?, volume In: Benhabib, J., Jackson, M. and A. Bisin.
Handbook of Social Economics, Vol. 1A. North-Holland, 2011.
Gallego, Francisco A. “Historical Origins of Schooling: The Role of Democracy and
Political Decentralization.” Review of Economics and Statistics 92, no. 2 (2010): 228-
243.
Galor, Oded, and Omer Moav. “Das Human-Kapital: A Theory of the Demise of the
Class Structure.” Review of Economic Studies 73 (2006): 85-117.
Galor, Oded, Omer Moav, and Dietrich Vollrath. “Inequality in landownership, the
emergence of human-capital promoting institutions, and the great divergence.” The
Review of economic studies 76.1 (2009): 143-179.
Gennaioli, N., Porta, R. L., de Silanes, F. L., and Shleifer, A. “Human Capital and Regional
Development.” The Quarterly Journal of Economics 128.1 (2013): 105–164.
Glaeser, Edward L., et al. "Do institutions cause growth?." Journal of economic
Growth 9.3 (2004): 271-303.
Glaeser, Edward L., and Bruce Sacerdote. “Education and religion” Journal of Human
Capital 2.2 (2008): 188-215.
Go, Sun, and Peter Lindert. “The Uneven Rise of American Public Schools to 1850.” The
Journal of Economic History 70.1 (2010): 1-26.
Grew, Raymond, and Patrick J. Harrigan. School, State, and Society: The Growth of
Elementary Schooling in Nineteenth-Century France -- A Quantitative Analysis. Ann
Arbor, MI: The University of Michigan Press, 1991.
Guan, Xiaohong. “The Study of Ministry of Education in Late Qing Dynasty.” Working
Paper, Sun Yat-Sen University, 1999.
Hall, Robert E., and Charles I. Jones. Why do some countries produce so much more
output per worker than others?. No. w6564. National bureau of economic research,
1999.
Herbst, Jurgen. “Nineteenth-Century Schools between Community and State: The Case
of Prussia and the United States.” History of Education Quarterly 42.2 (2002): 317-
341.
Ho, Ping-ti. The Ladder of Success in Imperial China. New York, NY: Wiley and Sons,
1962.
Hornung, E. “Immigration and the diffusion of technology: The huguenot diaspora in
prussia.” The American Economic Review, 104.1 (2014): 84–122.

32
Huff, Toby E. The rise of early modern science: Islam, China and the West. Cambridge
University Press, 2003.
Huillery, Elise. “History matters: The long-term impact of colonial public investments in
French West Africa.” American Economic Journal: Applied Economics (2009): 176-
215.
Jia, Ruixue. “The Legacies of Forced Freedom: China's Treaty Ports.” Review of
Economics and Statistics 96.4 (2014): 596-608.
Katz, Paul R. “Chinese Religious Life.” The Journal of Asian Studies 71.03 (2012): 784-
787.
Katz, Paul R. Divine justice: Religion and the Development of Chinese Legal Culture.
London and New York: Routledge, 2009.
Keenan, Barry. "Lung-Men Academy in Shanghai and the Expansion of Kingsu's
Educated Elite, 1865-1911." Education and Society in Late Imperial China, 1600-
1900 (1994): 493-524.
Benjamin A. Elman and Alexander Woodside, 493-524. Berkeley, CA: University of
California Press, 1994
Lin, Justin Yifu. "The Needham puzzle: Why the industrial revolution did not originate in
China." Economic development and cultural change (1995): 269-292.
Lindert, Peter H. Growing Public: Social Spending and Economic Growth since the
Eighteenth Century. 2 vols. New York, NY: Cambridge University Press, 2004.
Lizzeri, Alessandro, and Nicola Persico. “Why Did the Elites Extend the Suffrage?
Democracy and the Scope of Government with an Application to Britain’s ‘Age of
Reform’.” The Quarterly Journal of Economics 119, no. 2 (2004): 707-765.
Ma, Debin. “Economic Growth in the Lower Yangzi Region of China in 1911-1937: A
Quantitative and Historical Analysis.” The Journal of Economic History 68, no. 2
(2008): 355-392.
Ma, Min and Hanwen Lu. “The Government’s Statistical Work and Data in The Republic
of China” in Thirties year’s Historical Studies of the Republic of China (1972-2002),
edited by Chinese Academy of Social Science. Beijing: Social Sciences Academic Press,
2002.
Maddison, Angus. 2006. The World Economy: historical statistics, OECD, 2006. Data
Appendix available at http://www.ggdc.net/maddison/, accessed August 5, 2010.
McCord, Edward A. “Local Bullies and Armed Force Entrepreneurs: Militia Leadership in
Republican Hunan.” Twentieth-Century China 34, no. 2 (2009): 5-29.
Michalopoulos, Stelios, Alireza Naghavi, and Giovanni Prarolo. “Trade and geography in
the economic origins of Islam: theory and evidence.” (2010).
Mitchell, B.R. International Historical Statistics: Africa, Asia, and Oceania, 1750-2000.

33
London: Palgrave MacMillan, 2003.
Mitchell, B.R. International Historical Statistics: The Americas, 1750-2000. London:
Palgrave MacMillan, 2003.
Mitchell, B.R. International Historical Statistics: Europe, 1750-2000. London: Palgrave
MacMillan, 2003.
Mitchener, Kris, and Se Yan. “Globalization, Trade & Wages: What Does History tell us
about China?” NBER Working Paper No. 15679: January 2010.
North, Douglass C., and Robert Paul Thomas. The rise of the western world: A new
economic history. Cambridge University Press, 1973.
Nunn, Nathan. “Christians in colonial Africa.” Unpublished manuscript (2009).
Peri, Giovanni. “The effect of immigration on productivity: Evidence from US
states.” Review of Economics and Statistics 94.1 (2012): 348-358.
Persson, Petra, and Ekaterina Zhuravskaya. “Elite Capture in the Absence of Democracy:
Evidence from Backgrounds of Chinese Provincial Leaders.” Working paper, Paris
School of Economics, 2011.
Prazniak, Roxanne. “Tax protest at Laiyang, Shandong, 1910.” Modern China 6, no 1
(1980): 41-71.
Rankin, Mary B. Elite activism and political transformation in China: Zhejiang Province,
1865-1911. Stanford, CA: Stanford University Press, 1986.
Republic of China, Ministry of Education, The First Education Yearbook of China,
Kaiming Press, Shanghai, China, 1934
Rocha, Rudi, Claudio Ferraz, and Rodrigo R. Soares. “Human Capital and Development:
The Legacy of European Settlements in Brazil.” PUC Rio, manuscript (2013).
Romer, Paul. “Idea gaps and object gaps in economic development.” Journal of monetary
economics 32.3 (1993): 543-573.
Schoppa, Keith R., Chinese Elites and Political Change: Zhejiang Province in the Early
Twentieth Century. Cambridge, MA: Harvard University Press, 1982.
Shang, Lihao. Government and Society: The Allocation of Education Funds in Modern
China. Shijiazhuang: Hebei Education Press, 2001.
Squicciarini, M. and Voigtlaender, N. “Human Capital and Industrialization: Evidence
from the Age of Enlightenment.” Quarterly Journal of Economics, forthcoming
(2015).
Stasavage, David. “Democracy and Education Spending in Africa.” American Journal of
Political Science 49, no. 2 (2005): 343-358.
Stauffer, Milton T. ed. The Christian Occupation of China. Shanghai: China Continuation
Committee, 1922.

34
Stulz, Rene M., and Rohan Williamson. "Culture, openness, and finance." Journal of
financial Economics 70.3 (2003): 313-349.
Su, Yunfeng. The Emergence and Growth of Modern Education in China, Beijing: Peking
University Press, 2007.
Thøgersen, Stig. A County of Culture: Twentieth-Century China Seen from the Village
Schools of Zouping, Shandong. Ann Arbor, MI: The University of Michigan Press,
2005.
Van de Ven, Hans J. “Public Finance and the Rise of Warlordism.” Modern Asian Studies
30, no. 4 (1996): 829-868.
Vander Ven, Elizabeth. “Village-State Cooperation: Modern Community Schools and
Their Funding, Haicheng County, Fengtian, 1905-1931.” Modern China 31, no. 2
(2005): 204-235.
United States, Department of Education. Report of the Commissioner of Education for
the Year Ended June 30, 1909. Washington DC: Government Printing Office, 1910.
Wang, Yanzhi. “The Study of Ministry of Education in The Republic of China (1912-
1916).” Working Paper, Shaanxi Normal University, 2010.
Wantchekon, Leonard, Marko Klašnja, and Natalija Novta. "Education and Human Capital
Externalities: Evidence from Colonial Benin." The Quarterly Journal of
Economics 130.2 (2015): 703-757.
Wenegast, Tim. “Cana, Cafe, and Cacau: Agrarian Structure and Educational Inequalities
in Brazil.” Revista de Historia Economica 28.1 (2010): 103-137.
West, Martin R., and Ludger Woessman. “‘Every Catholic Child in a Catholic School’:
Historical Resistance to State Schooling, Contemporary Private Competition, and
School Achievement across Countries.” IZA Discussion Paper Series, no. 3818 (2008).
Willcox, Walter F., “The Population of China in 1910.” Journal of the American Statistical
Association 23, no. 161 (1928): 18-30
Wong, R. Bin. China Transformed: Historical Change and the Limits of European
Experience. Ithaca, NY: Cornell University Press, 2000.
Woodside, Alexander, and Benjamin A. Elman. “Afterword: The Expansion of Education
in Ch’ing China.” In Education and Society in Late Imperial China, 1600-1900, edited
by Benjamin A. Elman and Alexander Woodside, 525-560. Berkeley, CA: University
of California Press, 1994.
Xu, Xiaozheng. “Temple Property in Late Qing Dynasty and The Republic of China (1895-
1916).” Working Paper, Shaanxi Normal University, 2010.
Yan, Se. “Real Wages and Skill Premia in China, 1860 to 1936.” Unpublished Ph. D.
Dissertation, UCLA. 2008.
Yuchtman, Noam. “An Economic Analysis of Traditional and Modern Education in Late

35
Imperial and Republican China.” Working paper, Haas School of Business, UC
Berkeley, 2014.
Cantoni, Davide, and Noam Yuchtman. “Medieval universities, legal institutions, and the
commercial revolution.” Quaterly Journal of Economics 192.2 (2014): 823-887.
Zhang, Xin. Social Transformation in Modern China: The State and Local Elites in Henan,
1900-1937. Cambridge, England: Cambridge University Press, 2000.
Zhang, Shengen. “Studies of Central and Local Government Finance in Late Qing
Dynasty.” History Monthly, no. 1 (1999): 51-55.

36
Figure 1. Total Number of Primary Schools between 1907 and 1946
Figure 2. Total Number of Primary Students between 1907 and 1946

37
Figure 3. Average Primary Schools between 1907 and 1930
Figure 4. Average Primary School Students between 1907 and 1930

38
Figure 5. The Dynamic Impacts of Average Temple Assets on Top University
Alumni (1900-1950)
Figure 6. The Dynamic Impacts of Average Temple Assets on Oversea Students
(1890-1940)

39
Figure 7. Correlation between Two Measures of Temple Assets

40
Figure 8. Average Primary Schools between 1907 and 1930
(With Robust Measure)
Figure 9. Average Primary School Students between 1907 and 1930
(With Robust Measure)

41
Figure 10. Average Primary Schools between 1820 and 1930
(With Traditional Primary Schools in 1820)

42
Table 1. Statistics Summary
Variables Variable Definition Sources Obs. Mean S.D.
Prefectural-level Panel Data of Modern Education and Temple Assets
Primary Schools # of primary schools between 1907 and 1930 1 1150 314.67 517.68
Primary Students # of primary students between 1907 and 1930 1 1162 11844.90 25066.60
Temple Assets # of temples in 1820 2 264 12.31 10.49
Traditional Schools # of traditional schools in 1820 2 264 12.31 8.27
Jinshi Number # of civil exam graduates 3 264 95.50 152.57
Average Primary Schools # of primary schools / pop in 1910 1, 4 1150 2.57 4.41
Average Primary Students # of primary students / pop in 1910 1, 4 1162 90.14 172.92
Average Temple Assets # of temples / pop in 1820 2, 4 264 0.14 0.13
Average Traditional Schools # of traditional schools / pop in 1820 2, 4 264 0.13 0.09
Average Jinshi Number # of civil exam graduates / pop in 1910 3, 4 264 0.63 0.88
1820 Population 10,000 4 264 143.68 128.69
ln(1820 Population) 4 264 4.53 1.05
1910 Population 10,000 4 264 154.32 141.54
ln(1910 Population) 4 264 4.60 1.05
1953 Population 10,000 4 264 196.78 181.08
ln(1953 Population) 4 264 4.85 1.01
Area square km 5 264 15914.78 19272.74
ln(Area) 5 264 9.35 0.78
Prefecture-level Panel Data of Top University Alumni and Oversea Students
Average Top University Alumni Top University Students / population 6 2,420 0.03 0.05
Average Oversea Students Oversea Students / population 7 1,268 0.02 0.06
County-level Data of Urbanization Rate
1964 Urbanization Rate urban population / population 8 1,701 0.10 0.14
1920 Urbanization Rate urban population / population 9 1,701 0.06 0.08
∆Urban 1964's urban rate - 1920's urban rate 8, 9 1,701 0.04 0.15
∆School 1915's schools - 1909's schools 2 1,701 2.14 2.30
∆ln(School) ln(1915's schools) - ln(1909's schools) 2 1,701 2.94 4.43
Family Size population / # of households 8 1,701 4.40 0.89
1964 Population 10,000 8 1,701 33.90 31.02
1964 Male Population 10,000 8 1,701 17.38 15.93
Contemporary County-level Data of Economic Development and Human Capital
Average Years of Schooling 12 1,742 7.22 1.01
Literacy Rate (%) 12 1,742 89.18 8.06
CE Expenditure per Capita Culture and Education Expenditure per Capita 11 1,742 94.37 45.83
Average Income GDP per Capita 11 1,742 5406.43 3937.03
2000 Urbanization Rate urban population / population 12 1,742 27.36 21.52
Data Sources: 1: Statistical Chart of Education (1907-1934). 2: Imperial Encyclopedia of the Qing Empire (1842). 3: Jiang, Qingbai (2007), Official Records of Jinshi in Qing Dynasty. 4: Ge, Jianxiong
(2000) China Population History. 5: Harvard Yenching Institution (2007), CHGIS, Version 4. 6: Books of Peking University and Tsinghua University. 7: Archives of Oversea Students. 8: National
Bureau of Statistics (1982), The Complied Statistics of the Second National Population Census. 9: Stauffer (1922), The Christian Occupation of China. 10: Liu, Dajun (1934) Chinese Industry Report.
11: Statistical Materials of Public Finance of Cities and Counties (2000). 12: National Bureau of Statistics (2000), The Complied Statistics of the Fifth National Population Census.

43
Table 2. DID Model: Effects of TDM on Primary School
Dependent Variable: Average Primary School
(1) (2) (3) (4) (5)
Average Temple Assets*1907 -1.756
[1.560]
Average Temple Assets*1908 0.799 0.600 0.736 0.736 -0.744
[1.686] [1.830] [1.875] [0.997] [1.457]
Average Temple Assets*1909 0.764 0.571 0.669 0.669 -0.889
[1.686] [1.830] [1.875] [0.996] [1.455]
Average Temple Assets*1915 6.138 5.218 4.938 4.938 3.832
[1.686]*** [1.830]*** [1.875]*** [0.996]*** [1.455]***
Average Temple Assets*1930 37.988 29.759 26.559 28.594
[2.302]*** [2.610]*** [2.680]*** [2.332]***
ln(Population)*Year FE NO YES YES YES YES
ln(Area)*Year FE NO YES YES YES YES
Average Jinshi Number*Year FE NO NO YES YES YES
Average Traditional Schools*Year FE NO NO YES YES YES
Year FE YES YES YES YES YES
City FE YES YES YES YES NO
R-squared 0.622 0.643 0.657 0.536 0.556
Num. of Prefecture 264 264 264 264 264
Obs. 1,150 1,150 1,150 1,027 1,150
Notes: This table reports estimation results of equation (1). Coefficients are reported with standard errors in brackets. ***, **,
and * indicate significance at 1%, 5% and 10% levels.

44
Table 3. DID Model: Effects of TDM on Primary Student
Dependent Variable: Average Primary Student
(1) (2) (3) (4) (5)
Average Temple Assets*1907 -33.462
[54.063]
Average Temple Assets*1908 18.764 10.782 7.393 7.393 -14.748
[63.286] [69.631] [69.477] [29.978] [50.242]
Average Temple Assets*1909 19.675 13.076 7.861 7.861 -16.769
[63.265] [69.628] [69.471] [29.975] [50.180]
Average Temple Assets*1915 155.915 121.696 104.333 104.333 100.568
[63.265]** [69.628]* [69.471] [29.975]*** [50.180]**
Average Temple Assets*1930 1,636.907 1,429.753 1,204.461 1,202.466
[85.394]*** [98.588]*** [98.649]*** [82.070]***
ln(Population)*Year FE NO YES YES YES YES
ln(Area)*Year FE NO YES YES YES YES
Average Jinshi Number*Year FE NO NO YES YES YES
Average Traditional Schools*Year FE NO NO YES YES YES
Year FE YES YES YES YES YES
City FE YES YES YES YES NO
R-squared 0.693 0.703 0.729 0.583 0.662
Num. of Prefecture 264 264 264 264 264
Obs. 1,162 1,162 1,162 1,027 1,162
Notes: This table reports estimation results of equation (2). Coefficients are reported with standard errors in brackets. ***, **,
and * indicate significance at 1%, 5% and 10% levels.

45
Table 4. Effects of TDM on Elite Human Capital
Dependent Variable: Top 2 University Alumni Oversea Students
(1) (2) (3) (4) (5) (6)
ln(Average Temple Assets)*Post -0.029 0.211 0.096 -0.077 0.123 0.042
[0.034] [0.038]*** [0.036]*** [0.049] [0.055]** [0.049]
ln(Population)*Year FE NO YES YES NO YES YES
ln(Area)*Year FE NO YES YES NO YES YES
Average Jinshi Number*Year FE NO NO YES NO NO YES
Year FE YES YES YES YES YES YES
City FE YES YES YES YES YES YES
R-squared 0.578 0.773 0.803 0.342 0.636 0.714
Num. of Prefecture 242 242 242 212 212 212
Obs. 2,420 2,420 2,420 1,268 1,268 1,268
Notes: This table reports estimation results of equation (3) and (4). Coefficients are reported with standard errors in brackets. ***, **, and *
indicate significance at 1%, 5% and 10% levels.

46
Table 5. Effects of TDM on Average Tax Revenue and Factories
Dependent Variable: Average Tax Revenue Average Factories
(1) (2) (3) (4) (5) (6)
Average Temple Assets -0.056 0.005 0.001 -0.056 0.010 0.008
[0.050] [0.062] [0.068] [0.053] [0.064] [0.065]
Population 0.000 0.000 0.000 0.000
[0.000] [0.000] [0.000] [0.000]
Area -0.030 -0.030 -0.000 -0.000
[0.037] [0.037] [0.000] [0.000]
Average Traditional
School 0.015 0.028 0.027
[0.108] [0.046] [0.046]
Province Dummy NO YES YES NO YES YES
R-squared 0.001 0.081 0.081 0.004 0.151 0.152
Obs. 264 264 264 264 264 264
Coefficients are reported with standard errors in brackets. ***, **, and * indicate significance at 1%, 5% and 10%
levels.

47
Table 6. Effects of TDM on Mid-term Economic Development
Dependent Variable: ∆Urban = 1964 Urban Rate - 1920
(1) (2) (3) (4) (5) (6)
Average Temple Assets 0.086 0.109 0.089 0.073 0.051 0.048
[0.033]*** [0.039]*** [0.035]** [0.039]* [0.035] [0.039]
Average Jinshi Number -0.000 -0.000 0.000 0.000
[0.000] [0.000] [0.000]*** [0.000]
1964 Population 0.006 -0.032 0.003 -0.027
[0.007] [0.009]*** [0.007] [0.009]***
1964 Household -0.000 0.001 0.000 0.001
[0.000] [0.000]** [0.000] [0.000]***
Area 0.000 0.000 -0.000 0.000
[0.000] [0.000] [0.000] [0.000]
Mass Education NO NO YES YES YES YES
Elite Education NO NO NO NO YES YES
Province Dummy NO YES NO YES NO YES
R-squared 0.004 0.089 0.007 0.108 0.038 0.125
Obs. 1,700 1,700 1,700 1,700 1,700 1,700
Notes: This table reports estimation results of equation (5). Coefficients are reported with standard errors in brackets. ***,
**, and * indicate significance at 1%, 5% and 10% levels. For mass education, we control variables of the difference of
primary schools, students and expenditure between 1909 and 1915, as well as the amount of primary schools, students and
expenditure in 1915. For elite education, we include variables of the total number the average number of top university
students and oversea students into regression.

48
Table 7. Average Jinshi Number on Average Temple Assets
Dependent Variable: Average Jinshi Number
(1) (2) (3) (4)
Average Temple Assets 0.048 0.035 0.198 0.224
[0.404] [0.441] [0.471] [0.476]
Population -0.056 -0.048
[0.084] [0.087]
Area 0.082 0.065
[0.072] [0.083]
Average Traditional School -0.301
[0.727]
Province Dummy NO YES YES YES
R-squared 0.000 0.236 0.240 0.241
Obs. 264 264 264 264
Coefficients are reported with standard errors in brackets. ***, **, and * indicate
significance at 1%, 5% and 10% levels.

49
Table 8. DID Model: Effects of TDM on Expenditure of Primary Student
Dependent Variable: Average Expenditure of Primary Student
(1) (2) (3)
Average Temple Assets*1915 8.110 7.074 4.112
[4.537]* [4.936] [4.959]
Average Temple Assets*1930 11.793 17.463 15.243
[6.221]* [6.790]** [6.811]**
Average Jinshi Number*1915 2.612
[0.818]***
Average Jinshi Number*1930 1.848
[0.870]**
Year FE YES YES YES
ln(Population)*Year FE NO YES YES
ln(Area)*Year FE NO YES YES
City FE YES YES YES
R-squared 0.219 0.361 0.382
Num. of Prefecture 264 264 264
Obs. 586 586 586
Notes: Coefficients are reported with standard errors in brackets. ***, **, and * indicate significance
at 1%, 5% and 10% levels.

50
Table 9. Mechanism II: Increased Labor Supply
Dependent Variable: Ratio of Workers
(1) (2) (3) (4)
Average Temple Assets 0.017 0.019 0.002
[0.023] [0.026] [0.032]
ln(Average Temple Assets) -0.002
[0.003]
Average Jinshi Number 0.000 0.001 0.001
[0.001] [0.001] [0.001]
Population 0.000 0.000 0.000
[0.000] [0.000] [0.000]
Area -0.000 -0.000 -0.000
[0.000] [0.000] [0.000]
Province Dummy NO NO YES YES
R-squared 0.004 0.022 0.090 0.094
Obs. 135 135 135 132
Coefficients are reported with standard errors in brackets. ***, **, and * indicate
significance at 1%, 5% and 10% levels.

51
Table 10. Effects of TDM on Long-term Human Capital Accumulation
Dependent Variable: Average Years of
Schooling Literacy Rates (%)
Culture and Education
Expenditure per Capita
(1) (2) (3) (4) (5) (6)
Average Temple Assets 0.010 0.010 0.055 0.066 0.451 0.369
[0.002]*** [0.002]*** [0.020]*** [0.015]*** [0.097]*** [0.097]***
Population in 1820, 1910, 1953 YES YES YES YES YES YES
Area YES YES YES YES YES YES
Average Jinshi Number YES YES YES YES YES YES
Population in 2000 NO YES NO YES NO YES
Average Primary School NO YES NO YES NO YES
Prov FE YES YES YES YES YES YES
R-squared 0.515 0.504 0.438 0.446 0.573 0.615
Obs. 1,742 1,616 1,742 1,616 1,742 1,616
Notes: This table reports estimation results of equation (6). Coefficients are reported with standard errors in brackets. ***, **, and * indicate significance at
1%, 5% and 10% levels.
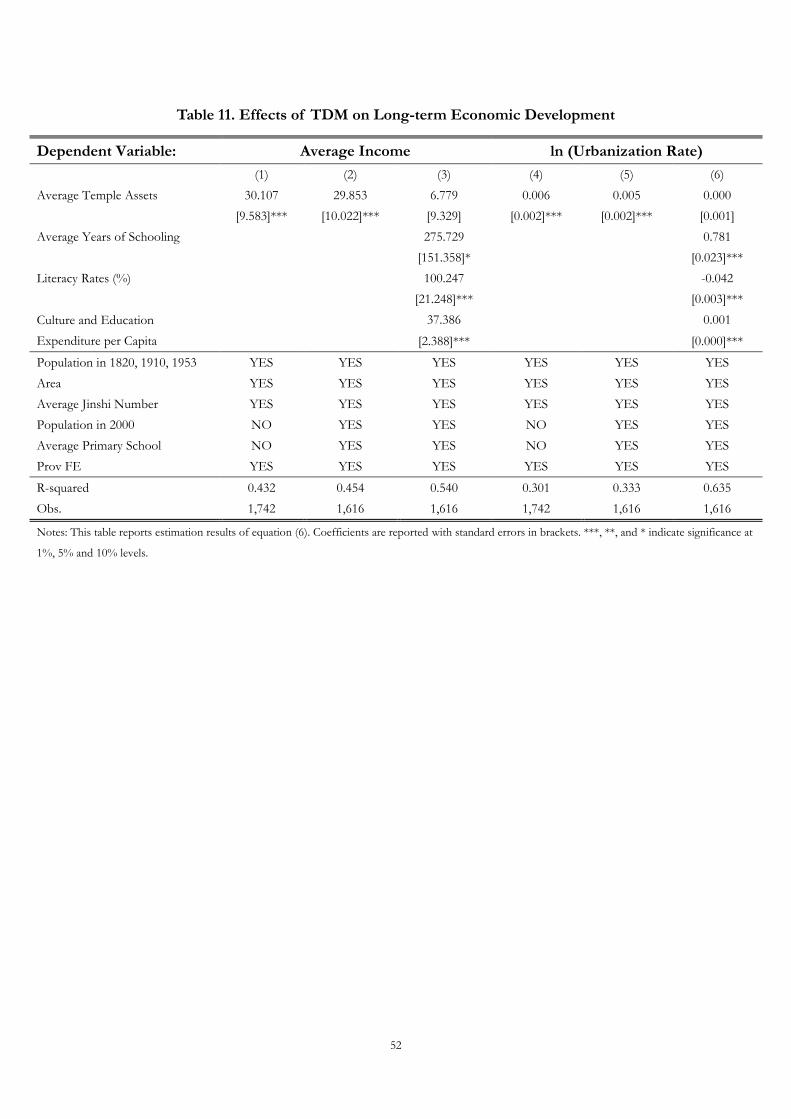
52
Table 11. Effects of TDM on Long-term Economic Development
Dependent Variable: Average Income ln (Urbanization Rate)
(1) (2) (3) (4) (5) (6)
Average Temple Assets 30.107 29.853 6.779 0.006 0.005 0.000
[9.583]*** [10.022]*** [9.329] [0.002]*** [0.002]*** [0.001]
Average Years of Schooling 275.729 0.781
[151.358]* [0.023]***
Literacy Rates (%) 100.247 -0.042
[21.248]*** [0.003]***
Culture and Education
Expenditure per Capita
37.386 0.001
[2.388]*** [0.000]***
Population in 1820, 1910, 1953 YES YES YES YES YES YES
Area YES YES YES YES YES YES
Average Jinshi Number YES YES YES YES YES YES
Population in 2000 NO YES YES NO YES YES
Average Primary School NO YES YES NO YES YES
Prov FE YES YES YES YES YES YES
R-squared 0.432 0.454 0.540 0.301 0.333 0.635
Obs. 1,742 1,616 1,616 1,742 1,616 1,616
Notes: This table reports estimation results of equation (6). Coefficients are reported with standard errors in brackets. ***, **, and * indicate significance at
1%, 5% and 10% levels.

53
Table 12. Effects of TDM on Mid-term Economic Development
(Robustness Check without Treaty Ports)
Dependent Variable: ∆Urban = 1964 Urban Rate - 1920
(1) (2) (3) (4) (5) (6)
Average Temple Assets 0.075 0.091 0.086 0.069 0.060 0.048
[0.030]** [0.035]*** [0.031]*** [0.035]** [0.031]* [0.035]
Average Jinshi Number 0.000 0.000 0.000 0.000
[0.000] [0.000] [0.000]* [0.000]
1964 Population 0.007 -0.017 0.002 -0.015
[0.006] [0.008]** [0.007] [0.008]*
1964 Household -0.000 0.001 -0.000 0.001
[0.000] [0.000] [0.000] [0.000]
Area 0.000 0.000 0.000 0.000
[0.000]* [0.000] [0.000] [0.000]
Mass Education NO NO YES YES YES YES
Elite Education NO NO NO NO YES YES
Province Dummy NO YES NO YES NO YES
R-squared 0.005 0.077 0.018 0.094 0.045 0.117
Obs. 1,308 1,308 1,308 1,308 1,308 1,308
Notes: This table reports estimation results of equation (5). Coefficients are reported with standard errors in brackets. ***,
**, and * indicate significance at 1%, 5% and 10% levels. For mass education, we control variables of the difference of
primary schools, students and expenditure between 1909 and 1915, as well as the amount of primary schools, students and
expenditure in 1915. For elite education, we include variables of the total number the average number of top university
students and oversea students into regression.

54
Appendix
Table A1. Sources of Education Data (1907-1934)
Year Region Source
1907 Nationwide 《光绪三十三年第一次教育统计图表》
1908 Nationwide 《光绪三十四年第二次教育统计图表》
1909 Nationwide 《宣统元年第三次教育统计图表》
1915 Nationwide 《中华民国第四次教育统计图表》
1916 Nationwide 《中华民国第五次教育统计图表》
1919 Jiangsu 《江苏六十县八年度教育状况表》《民国教育统计资料汇编 16》
1921 Guangdong 《广东教育统计图表民国十年度》
1922 Guangdong 《广东教育统计图表民国十一年度》
1923 Guangdong 《广东教育统计图表民国十二年度》
1923 Zhili 《直隶教育统计表民国十二年度》《民国教育统计资料汇编 10》
1925 Zhili 《直隶教育统计表民国十四年度》《民国教育统计资料汇编 10》
1924 Shanxi 《山西省第九次教育统计民国十三年》《民国教育统计资料汇编 12》
1925 Zhejiang 《中华民国十四年度浙江省教育统计图表》
1927 Zhejiang 《中华民国十六年度浙江省教育统计图表》
1929 Zhejiang 《中华民国十八年度浙江省教育统计图表》《民国教育统计资料汇编 23》
1928 Hebei (Zhili) 《河北省各县普通教育概览》《民国教育统计资料汇编 11》
1929 Hebei (Zhili) 《河北省教育统计概要民国十八年》《民国教育统计资料汇编 11》
1930 Fujian 《福建省教育统计民国十九年度》《民国教育统计资料汇编 30》
1931 Henan 《民国二十年河南省教育统计图表》
1931 Anhui 《安徽省教育统计民国二十年度》《民国教育统计资料汇编 25》
1932 Anhui 《安徽省教育统计民国二十一年度》《民国教育统计资料汇编 25》
1933 Anhui 《安徽省教育统计民国二十二年度》《民国教育统计资料汇编 25》
1934 Anhui 《安徽省教育统计民国二十三年度》《民国教育统计资料汇编 26》
1932 Jiangxi 《江西省教育统计民国二十一年度》《民国教育统计资料汇编 28》
1933 Jiangxi 《江西省各县教育概况二十二年度》《民国教育统计资料汇编 28》
1932 Jiangsu 《民国二十一年度江苏省教育经费统计图表》
1933 Jiangsu 《民国二十二年度江苏省教育经费统计图表》
1933 Guangxi 《广西省教育概况统计民国二十二年》《民国教育统计资料汇编 29》
1934 Zhejiang 《浙江省二十三年度教育统计》
1934 Guangdong 《广东省二十三年度教育概况》《民国教育统计资料汇编 30》
1935 Hebei (Zhili) 《河北省教育概况民国二十四年》《民国教育统计资料汇编 11》