Embed Size (px)
Citation preview

Budget 101 and Beyond – January 8, 2014
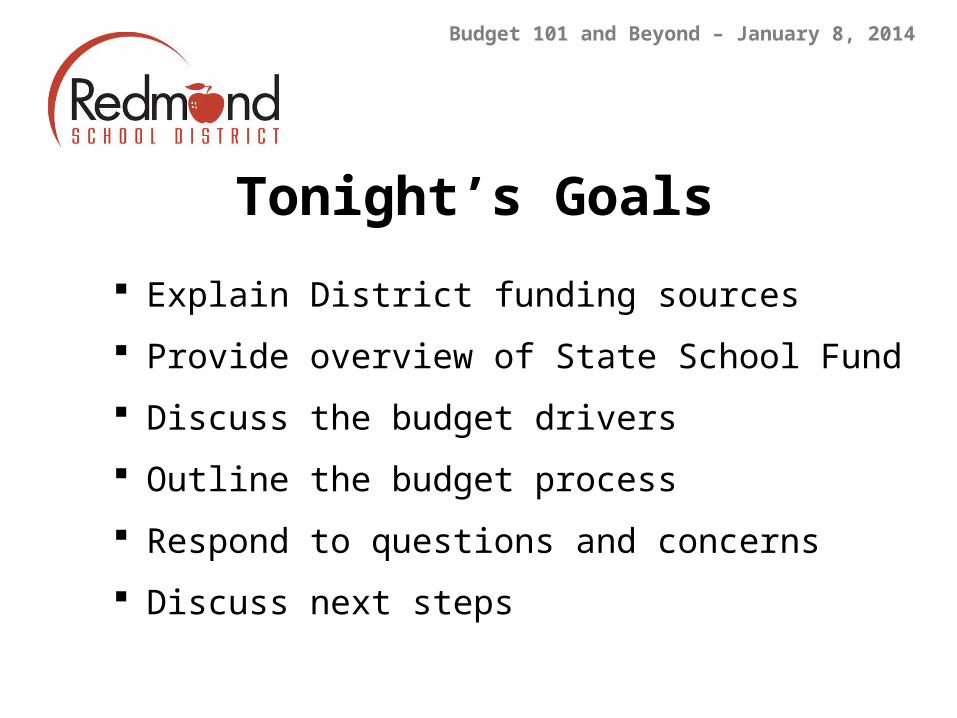
Tonight’s Goals
Budget 101 and Beyond – January 8, 2014
Explain District funding sources
Provide overview of State School Fund
Discuss the budget drivers
Outline the budget process
Respond to questions and concerns
Discuss next steps

A relentless commitment to academic achievement and personal growth for every student.
Redmond School District Graduates are fully prepared for the demands and responsibilities of adult life. Each solidly grounded in the knowledge and skills essential for success as a student, as an employee and as a citizen
of the 21st Century.
RSD Vision
Mission Statement
A commitment to rigorous and relevant instruction which leads to mastery and development of productive citizens.
Each team member within the Redmond School District is dedicated to the growth and full development of every Redmond student. As a team, we
unrelentingly seek continuous improvement for self and for students. We value collaborative response and expect rigorous student performance that is
solidly grounded in relevant real world applications.

Personalized supports that nurture stakeholder engagement, student success, and safe and effective school environments.
Wise, transparent stewardship of district resources that are prioritized for student achievement.
A highly effective and professional team that prioritizes student growth, values collaboration and seeks continuous growth and improvement.
RSD Strategic Priorities
Balance Resources to Maximize
Student Achievement
Every student graduates college-prepared and/or career ready.
Support and Develop Our
Human Resources
Sustain Safe and Vibrant School Communities
Elevate Student Achievement

2013-14 Adopted BudgetAll Funds
$96,505,200
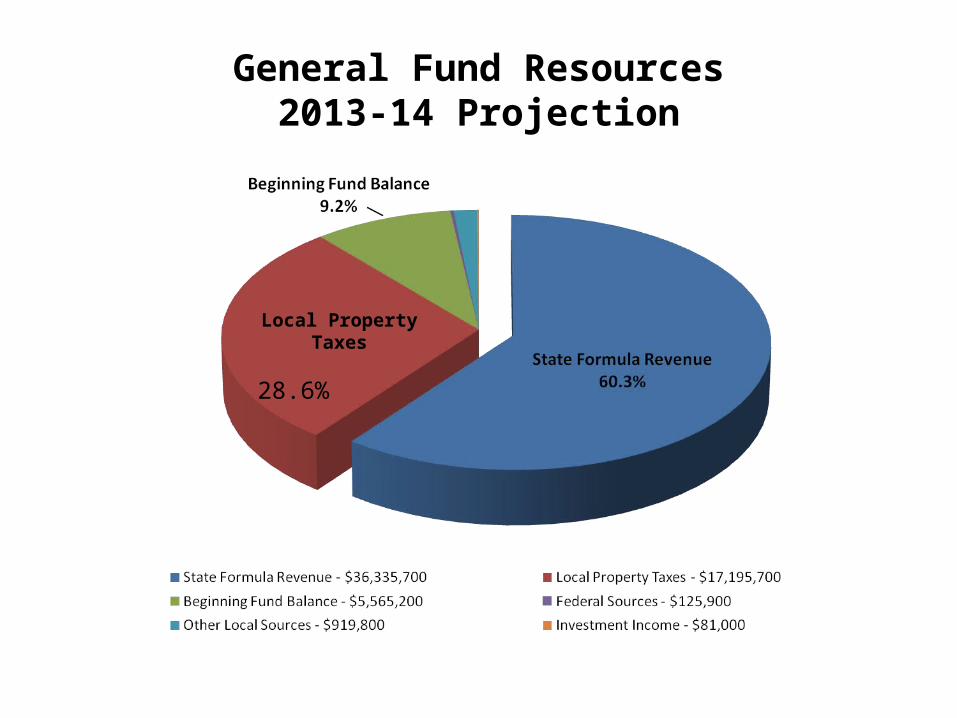
General Fund Resources2013-14 Projection
Local Property Taxes
28.6%
Measure 5o Passed in 1990o Capped property tax rate to $5 per $1,000 of assessed
value for public educationo Required State to cover any local revenue losses to public
education
History of School Funding
Budget 101 and Beyond – January 8, 2014

Measures 47 and 50
o Passed in 1996 and 1997 respectively
o Switched to permanent rates
o Cut assessed property values
o Capped growth of assessed property values to 3% a year
History of School Funding
Budget 101 and Beyond – January 8, 2014
School Funding post Measures 5, 47, and 50:
30% Local Revenue (property taxes)
60% State Revenue (income taxes)
10% Federal Revenue
History of School Funding
Budget 101 and Beyond – January 8, 2014
Consequences of Measures 5, 47, and 50:
Increased volatility of school fundingo Shifted funding from property to income tax
Made state primary source of school funding
Equalized funding across districts
History of School Funding
Budget 101 and Beyond – January 8, 2014

Education’s Share of State Budget

K-12 Funding 1990-91 through 2014-15B
illio
ns o
f D
olla
rs

Equalize funding across all districts
Equalize funding between districts and education service districts (ESDs)
Define equity according to student and district characteristics (weights)
Goals of School Funding Formula
Budget 101 and Beyond – January 8, 2014

Equalize district funding:o Distribute all state fundingo Account for all local revenue
Equalize District and ESD funding:o Districts receive 95.5%o ESDs receive 4.5%
District Equity:o More weights receive more funding
Local Control:o Districts control spending decisions unless Legislature
states otherwise
Distribution Principles
Budget 101 and Beyond – January 8, 2014
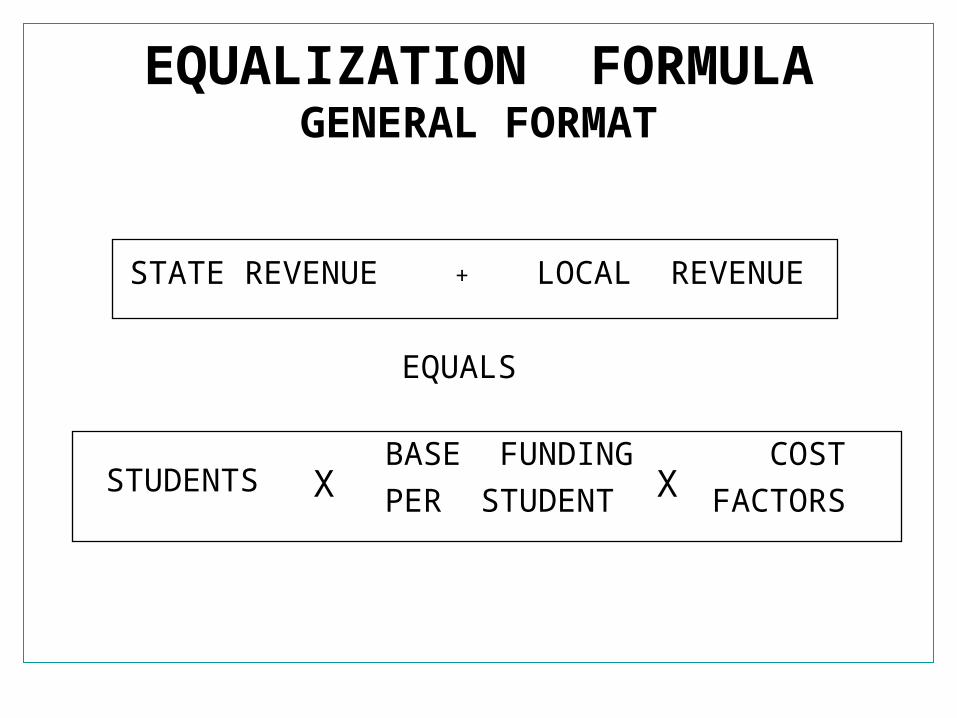
EQUALIZATION FORMULAGENERAL FORMAT
STATE REVENUE + LOCAL REVENUE
EQUALS
STUDENTS XBASE FUNDINGPER STUDENT X
COSTFACTORS

EQUALIZATION FORMULA
STATE REVENUE + LOCAL REVENUE
EQUALS
General Purpose
Grant+
TransportationGrant +
Facility Grant

A general cost reimbursement
A revenue entitlement per student
An assurance of funding stability or adequacy
A measure of student outcomes
An accountability system
Formula Is Not
Budget 101 and Beyond – January 8, 2014

Current State and Local Revenue
2013-15 Biennium
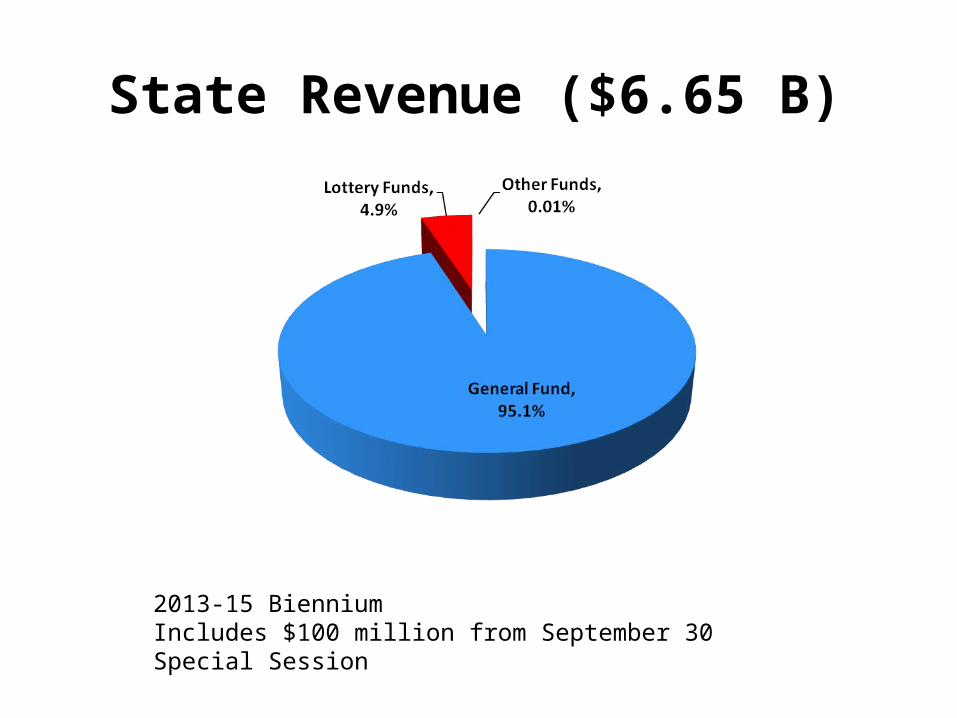
State Revenue ($6.65 B)
2013-15 BienniumIncludes $100 million from September 30 Special Session

Local Revenue
Estimated for 2013-15 biennium

Of the $6.65 billion in state revenueo 95.5% goes to Districtso 4.5% goes to ESDs
All local revenue stays with the school district or ESD where collected
District and ESD Revenue
School Finance Presentation – July 17, 2013
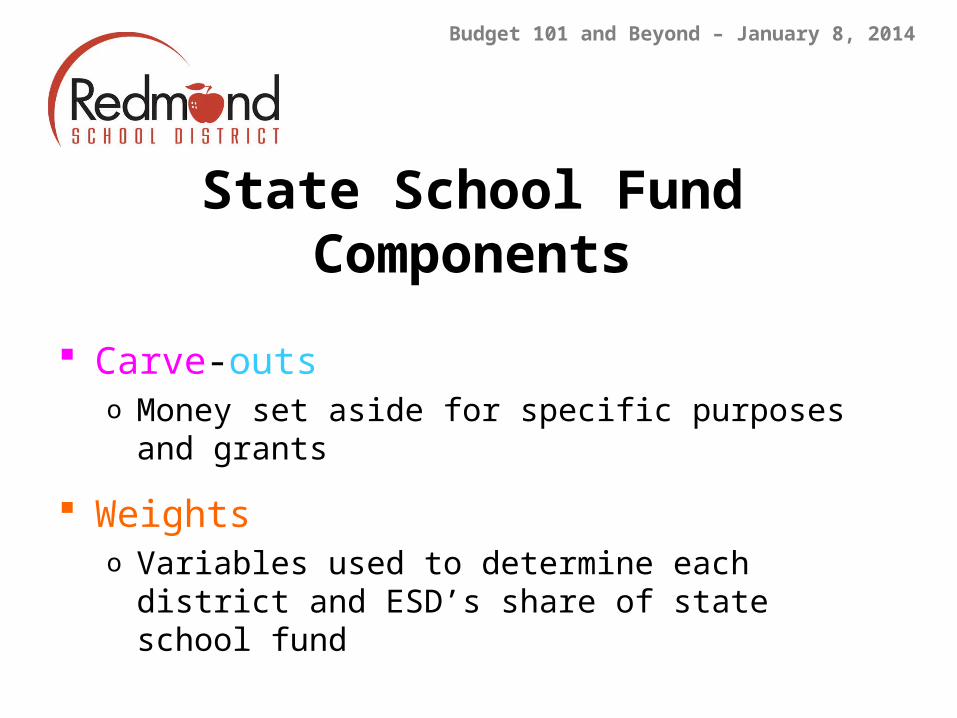
Carve-outso Money set aside for specific purposes and grants
Weightso Variables used to determine each district and ESD’s
share of state school fund
State School Fund Components
Budget 101 and Beyond – January 8, 2014
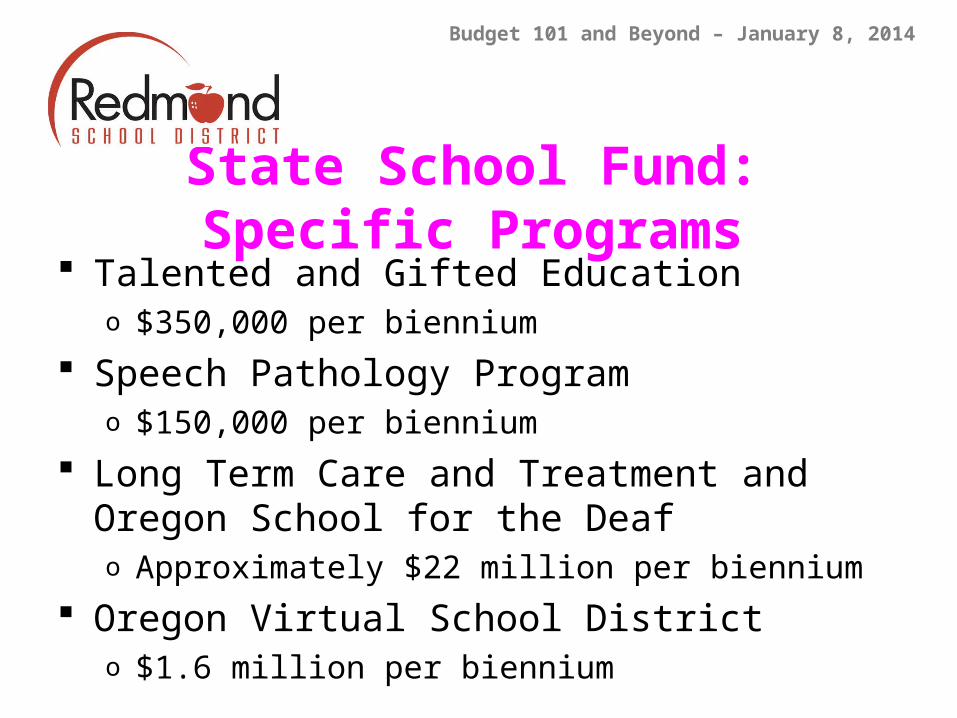
State School Fund: Specific Programs Talented and Gifted Education
o $350,000 per biennium Speech Pathology Program
o $150,000 per biennium Long Term Care and Treatment and Oregon School
for the Deafo Approximately $22 million per biennium
Oregon Virtual School Districto $1.6 million per biennium
Budget 101 and Beyond – January 8, 2014

Small High School Granto Provides additional funds to small high schoolso $2.5 million per year (ends June 30, 2015)
High Cost Disability Granto Reimburses districts for costs over $30,000 per IEP studento $18 million per year
Facility Granto Pays up to 8% of construction costs for new classroom
furnishingso $20 million per biennium
State School Fund: Sub-Grants
Budget 101 and Beyond – January 8, 2014

Transportation Granto Reimburses eligible transportation costso Reimbursement rates set by costs per ADMro Reimburse at 70%, 80% or 90% of eligible costs
Network of Quality Teaching and Learning (NQTL)o Supports implementation of Educator Effectiveness (SB 290) and
CCSS to improve educator practiceso $45 million for the 2013-15 biennium
State School Fund: Sub-Grants
Budget 101 and Beyond – January 8, 2014
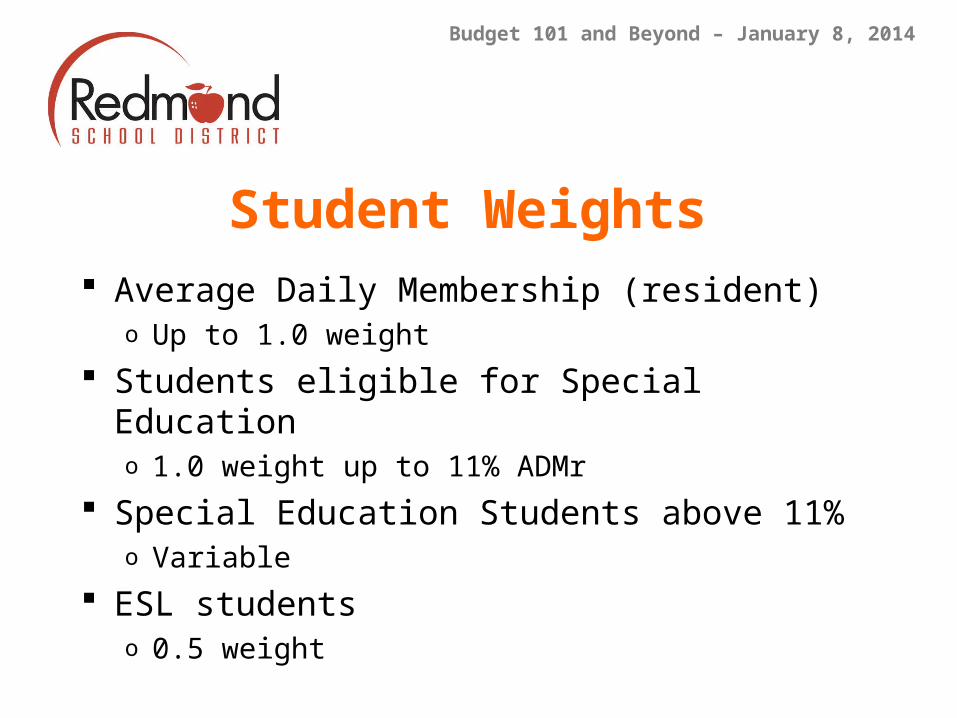
Average Daily Membership (resident)o Up to 1.0 weight
Students eligible for Special Educationo 1.0 weight up to 11% ADMr
Special Education Students above 11%o Variable
ESL studentso 0.5 weight
Student Weights
Budget 101 and Beyond – January 8, 2014
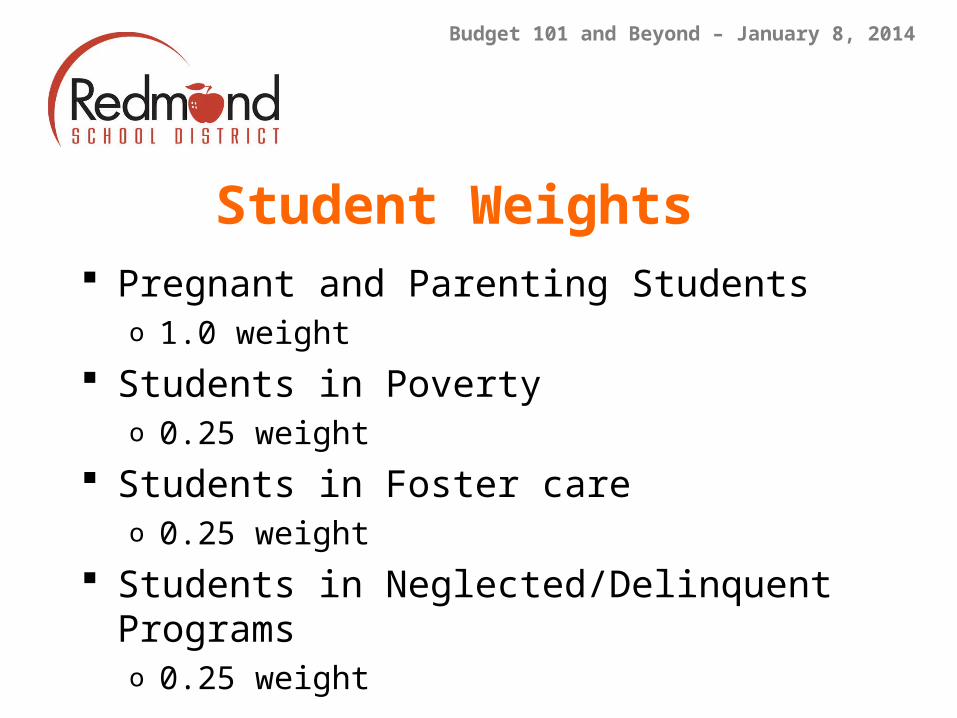
Pregnant and Parenting Studentso 1.0 weight
Students in Povertyo 0.25 weight
Students in Foster careo 0.25 weight
Students in Neglected/Delinquent Programso 0.25 weight
Student Weights
Budget 101 and Beyond – January 8, 2014

Remote Small Elementary School correctiono 8 miles from nearest elementary school in same
districto No more than 28 students per grade
Small High School Correctiono No more than 350 students for 4 gradeso No more than 267 students for 3 grades
School Weights
Budget 101 and Beyond – January 8, 2014
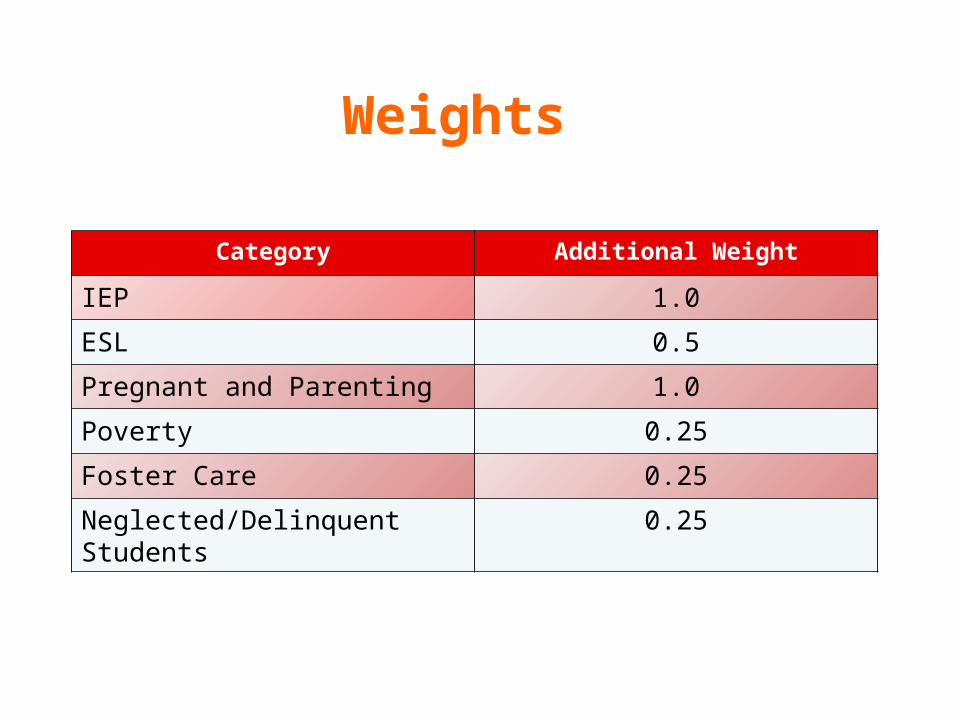
Category Additional Weight
IEP 1.0
ESL 0.5
Pregnant and Parenting 1.0
Poverty 0.25
Foster Care 0.25
Neglected/Delinquent Students 0.25
Weights
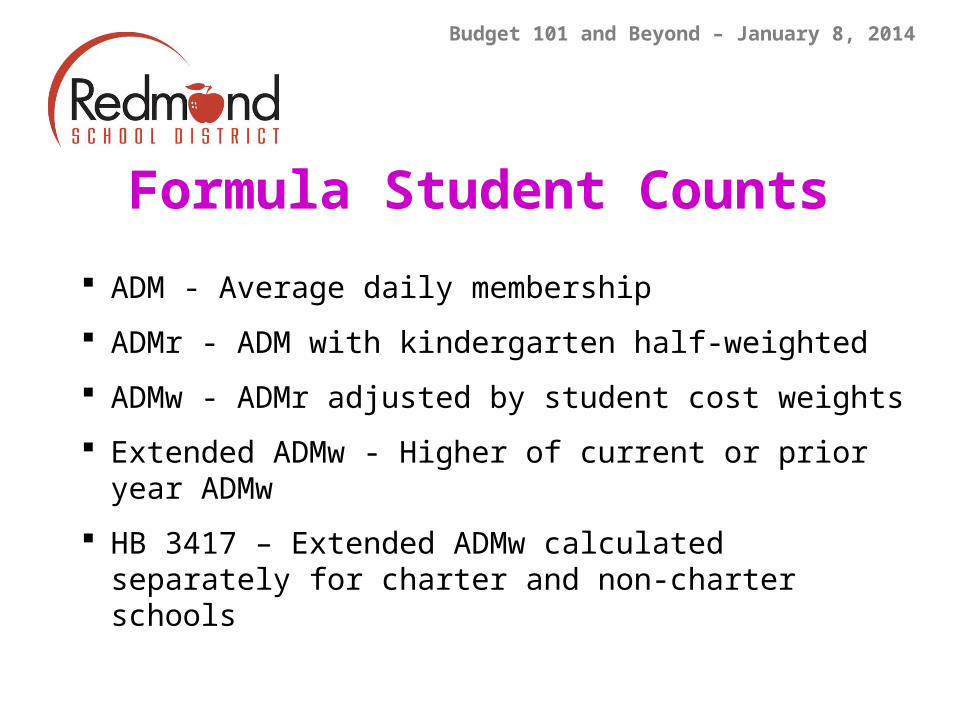
Formula Student Counts
ADM - Average daily membership
ADMr - ADM with kindergarten half-weighted
ADMw - ADMr adjusted by student cost weights
Extended ADMw - Higher of current or prior year ADMw
HB 3417 – Extended ADMw calculated separately for charter and non-charter schools
Budget 101 and Beyond – January 8, 2014

Recognizes that more experienced teachers may have increased costs
Calculation (District Average – State Average)
Teacher Experience Factor may be positive or negative value
Teacher Experience
Budget 101 and Beyond – January 8, 2014

(District ADMw * ($4,500 + [$25 * (teacher experience difference]) * funding ratio) – Local Revenueo District ADMw: District Weightso $4,500: minimum fundingo Funding Ratio completely distributes all State School
Funds
District FormulaDistrict Formula
Budget 101 and Beyond – January 8, 2014

FORMULA EXAMPLEFORMULA EXAMPLE
STATE REVENUE + LOCAL REVENUE
EQUALS
Student ADMwExtended
X$4,500 adjusted by teacher experience and to total funds
+70% of
TransportCosts
[7,893.12 x ( $4,500 + ($25 x 0.14)) x 1.45] + [70% x $2,890,700] + 0= $51,511,228 + $2,023,490 + 0
= $53,534,718 OR $6,782 Per Extended ADMw
+Up to 8% of Const. Costs

Pause …. Questions on State School Fund?
School Finance Presentation – July 17, 2013
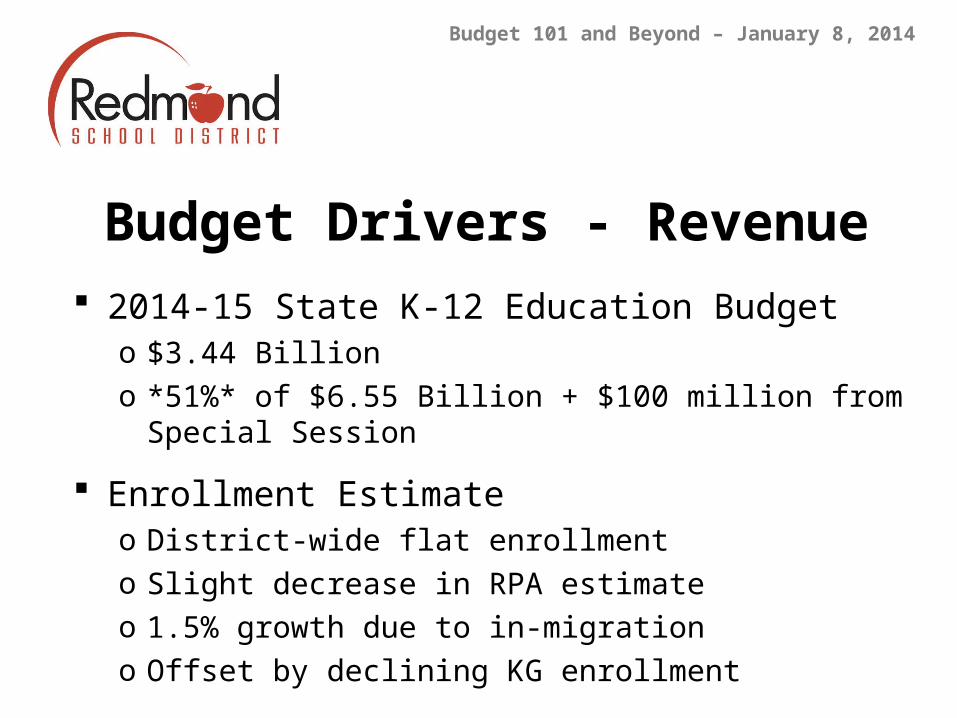
2014-15 State K-12 Education Budgeto $3.44 Billiono *51%* of $6.55 Billion + $100 million from Special Session
Enrollment Estimateo District-wide flat enrollmento Slight decrease in RPA estimateo 1.5% growth due to in-migrationo Offset by declining KG enrollment
Budget Drivers - Revenue
Budget 101 and Beyond – January 8, 2014
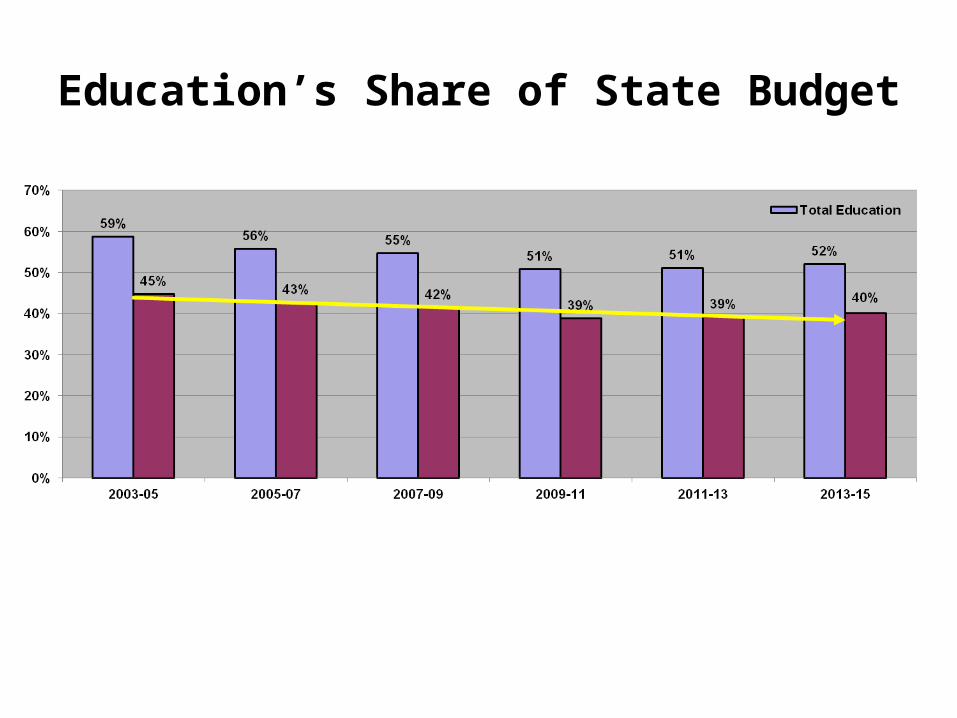
Education’s Share of State Budget

State School Fund (SSF) Per ADMw
* Assumes no changes in local revenues from 2013-14.
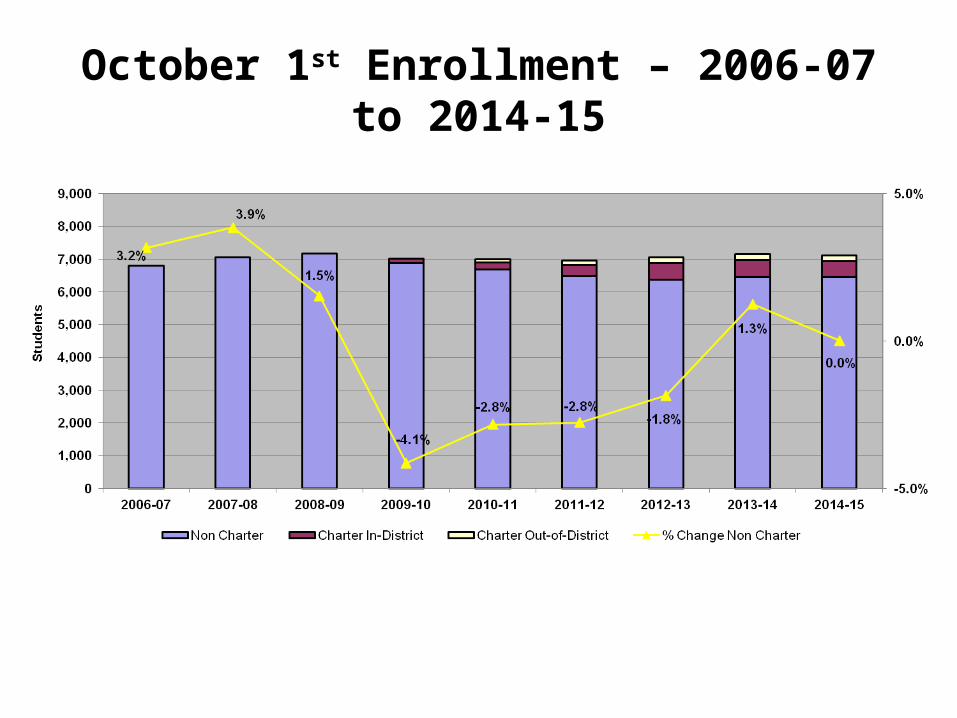
October 1st Enrollment – 2006-07 to 2014-15
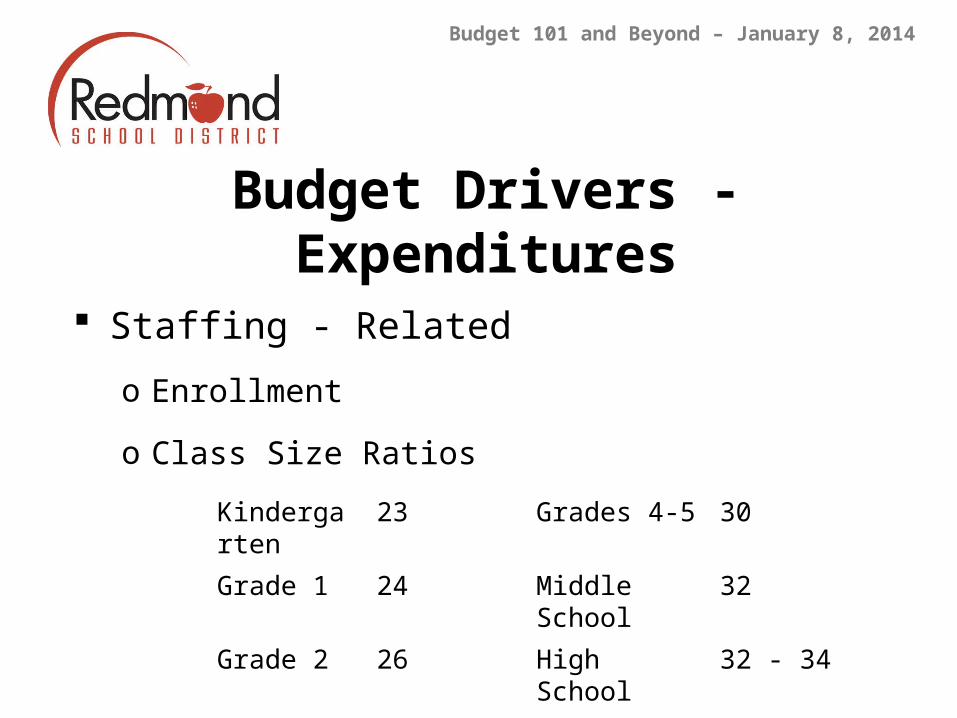
Staffing - Related
o Enrollment
o Class Size Ratios
Budget Drivers - Expenditures
Budget 101 and Beyond – January 8, 2014
Kindergarten
23 Grades 4-5 30
Grade 1 24 Middle School 32
Grade 2 26 High School 32 - 34
Grade 3 28 Redmond K-12 75
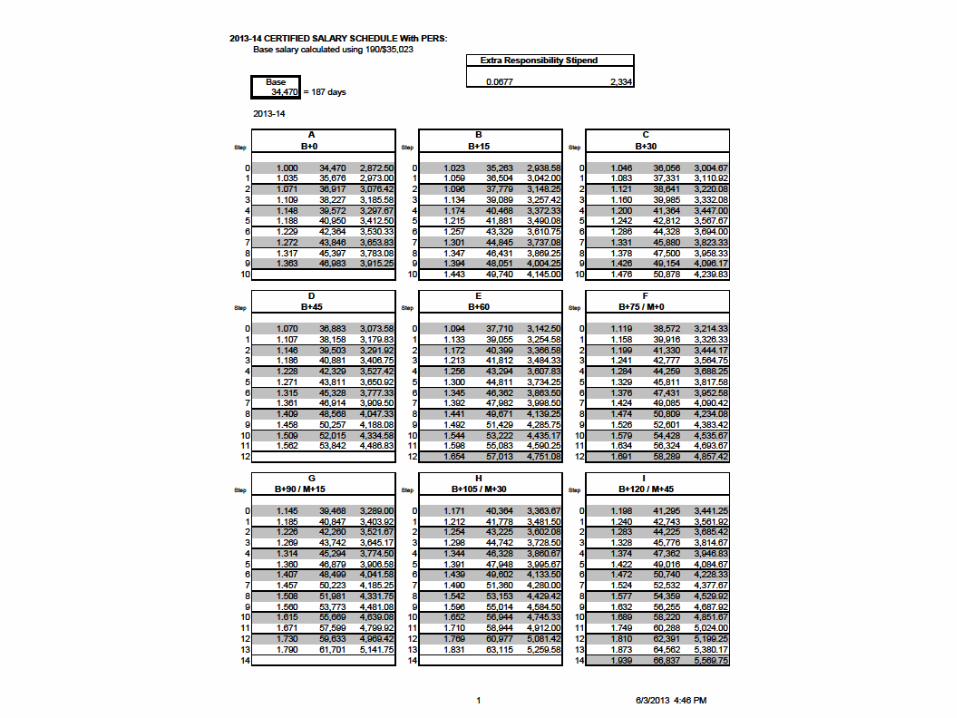
Salary - Relatedo Contract Dayso Horizontal & vertical salary schedule movemento COLA
Related Payroll Costso PERS rateso Health Insurance Cap – currently $1,145o Other Contractual Employee Benefits
Budget Drivers - Expenditures
Budget 101 and Beyond – January 8, 2014


RSD Average PERS Rates

Poverty weights resolution
Potential new grants
Contract negotiations
Budget Unknowns
Budget 101 and Beyond – January 8, 2014

District Staff Budget Committee Board
Timeline: Jan – June Apr – May Feb – June
Budget Version: Proposed Approved Adopted
Responsibilities: -Prepare Long Range Financial Plan
-Convene & conduct Work Sessions with Budget Task Force, Board and Budget Committee
-Determine staffing levels and prepare budget aligned to Board goals and Strategic Plan
-Review budget for accuracy & alignment to Strategic Plan
-Receive Public Comment
-Approve budget and tax levies
-Gives direction to budget process
-Sets financial goals
-Appoint Budget Committee members
-Members of Budget Committee -Budget Hearing
-Adopt budget, set appropriations and approve tax levies
Budget Process and Roles

Next Steps
Budget Committee Work Session – February 12
Budget Development
First Budget Committee Meeting – April 30
Second Budget Committee Meeting & Public Input – May 7
Last Budget Committee Meeting & Public Input – May 21
Budget Hearing – School Board Adoption – June 25
Budget 101 and Beyond – January 8, 2014