Embed Size (px)
Citation preview
BUDGET 2017-2018
Table of Contents 17-18 BUDGET SUMMARY ....................................................................................................... 1 Section 1: General Operating Fund Budget
Table 1 - Schedule of Funds Available & Funds to be Expended..................................... 4
Graph - Sources of Funds 2017-2018 & 2016-2017 ........................................................ 5
Graph - Uses of Funds 2017-2018 & 2016-2017 ............................................................. 6
Table 1.a - Uses of Funds by Nature of Expense ........................................................... 7
Table 1.b - Sources of Revenue ...................................................................................... 8 Section 2: Ancillary Operations Fund Budget
Table 2 – Conferences, University Bookstore & The Pond .............................................. 9
Table 2.a - Residences .................................................................................................. 10
Table 2.b - Schedule of Student Fees and Other Income .............................................. 11 Section 3 - Endowment Fund
Table 3 - Schedule of Funds Available and Planned Expenditures ................................ 12
Graph - Uses of Funds 2017-2018 & 2016-2017 ........................................................... 13
Table 3.a - Schedule of Academic Spending Allocations ............................................... 14 Section 4 - Special Program Operating Fund
Table 4 – University Advancement ................................................................................ 15 Section 5 - Appendices
Appendix A – Schedule of Ancillary Fees 2017-2018 .................................................... 16 Appendix B-1 – Chart - MPHEC 2016-2017 undergraduate Arts and Sciences Tuition
Fees and Provincial Tuition Rebates/Bursaries ........................ 17 Appendix B-2 – Chart - MPHEC 2016-2017 undergraduate Ancillary and
Residence Fees........................................................................ 18 Appendix C – Table – Academic Staffing Supported by Operating Budget .................... 19 Appendix D – Table – Ongoing Administrative & Support Positions ............................... 20
Appendix E – Table – Contingency Fund ....................................................................... 21 Appendix F – Graph – Student Numbers ....................................................................... 22
- i -
Budget Summary 2018
Revenues and Interfund Transfers
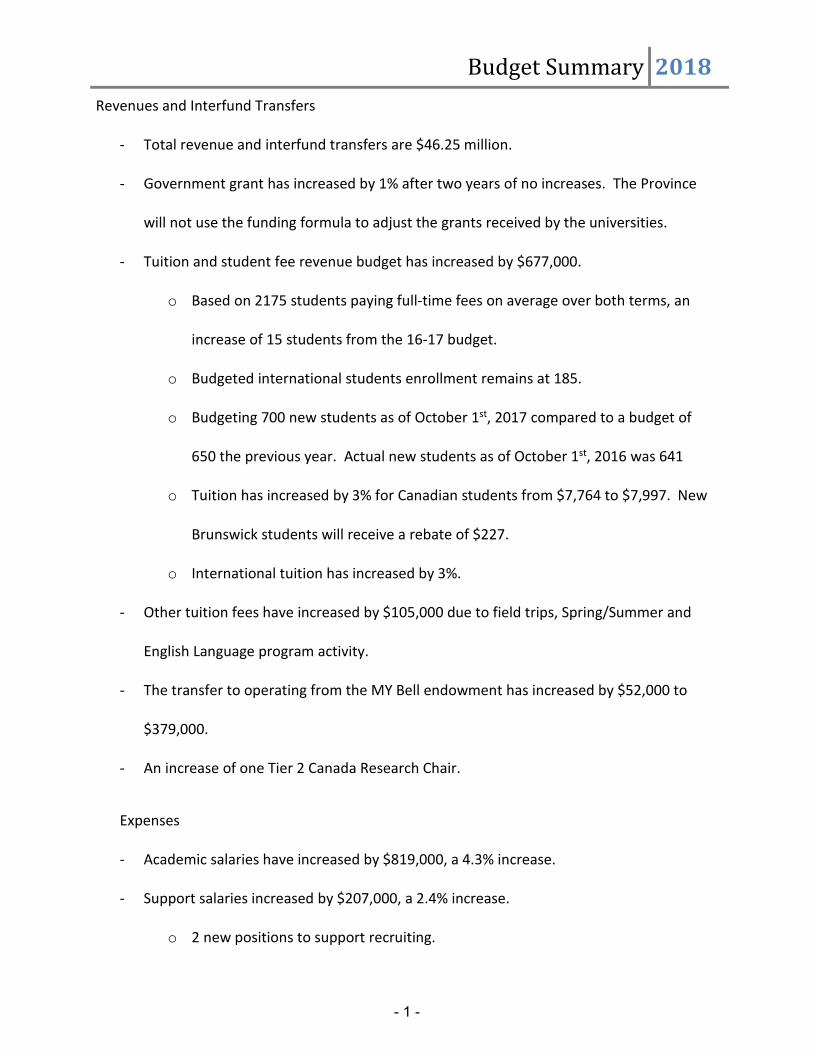
- Total revenue and interfund transfers are $46.25 million.
- Government grant has increased by 1% after two years of no increases. The Province
will not use the funding formula to adjust the grants received by the universities.
- Tuition and student fee revenue budget has increased by $677,000.
o Based on 2175 students paying full-time fees on average over both terms, an
increase of 15 students from the 16-17 budget.
o Budgeted international students enrollment remains at 185.
o Budgeting 700 new students as of October 1st, 2017 compared to a budget of
650 the previous year. Actual new students as of October 1st, 2016 was 641
o Tuition has increased by 3% for Canadian students from $7,764 to $7,997. New
Brunswick students will receive a rebate of $227.
o International tuition has increased by 3%.
- Other tuition fees have increased by $105,000 due to field trips, Spring/Summer and
English Language program activity.
- The transfer to operating from the MY Bell endowment has increased by $52,000 to
$379,000.
- An increase of one Tier 2 Canada Research Chair.
Expenses
- Academic salaries have increased by $819,000, a 4.3% increase.
- Support salaries increased by $207,000, a 2.4% increase.
o 2 new positions to support recruiting.
- 1 -
Budget Summary 2018
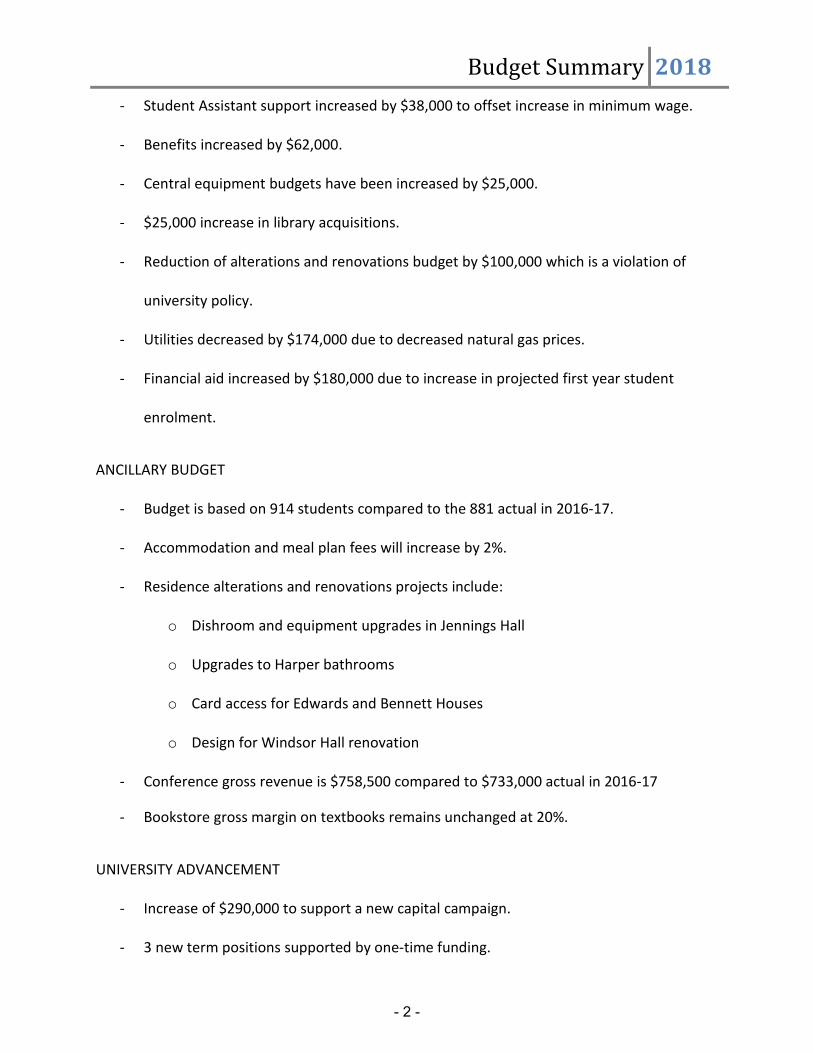
- Student Assistant support increased by $38,000 to offset increase in minimum wage.
- Benefits increased by $62,000.
- Central equipment budgets have been increased by $25,000.
- $25,000 increase in library acquisitions.
- Reduction of alterations and renovations budget by $100,000 which is a violation of
university policy.
- Utilities decreased by $174,000 due to decreased natural gas prices.
- Financial aid increased by $180,000 due to increase in projected first year student
enrolment.
ANCILLARY BUDGET
- Budget is based on 914 students compared to the 881 actual in 2016-17.
- Accommodation and meal plan fees will increase by 2%.
- Residence alterations and renovations projects include:
o Dishroom and equipment upgrades in Jennings Hall
o Upgrades to Harper bathrooms
o Card access for Edwards and Bennett Houses
o Design for Windsor Hall renovation
- Conference gross revenue is $758,500 compared to $733,000 actual in 2016-17
- Bookstore gross margin on textbooks remains unchanged at 20%.
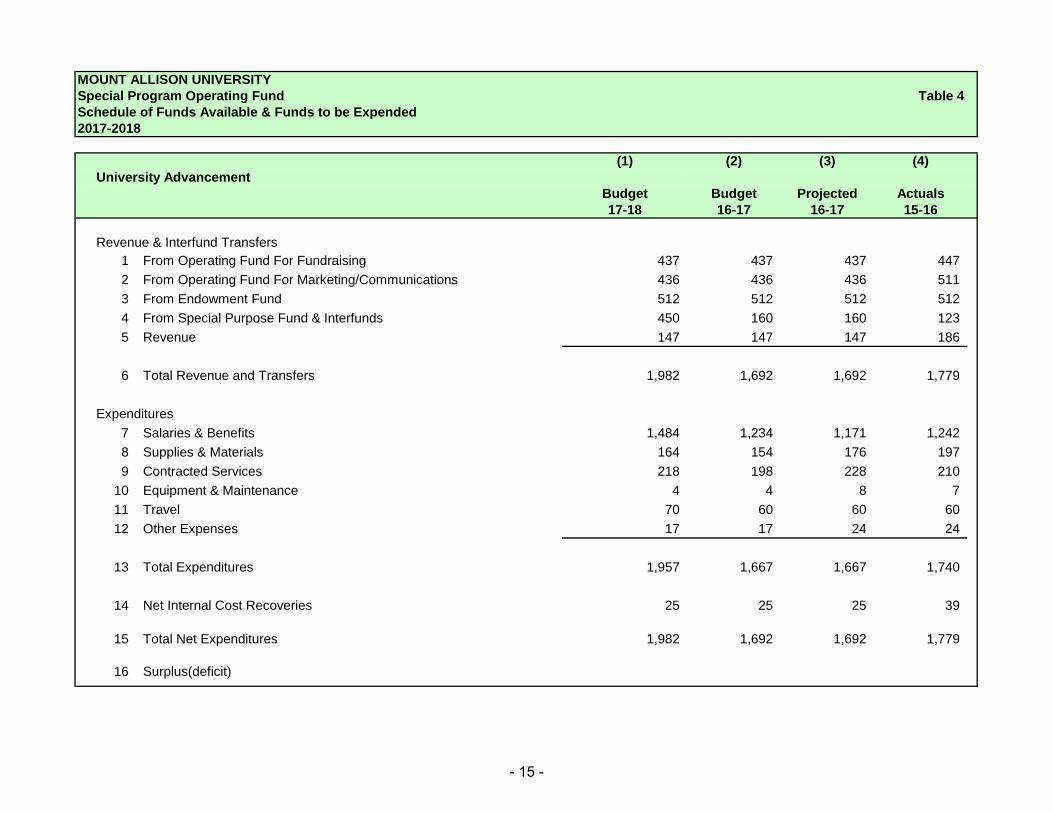
UNIVERSITY ADVANCEMENT
- Increase of $290,000 to support a new capital campaign.
- 3 new term positions supported by one-time funding.
- 2 -
Budget Summary 2018
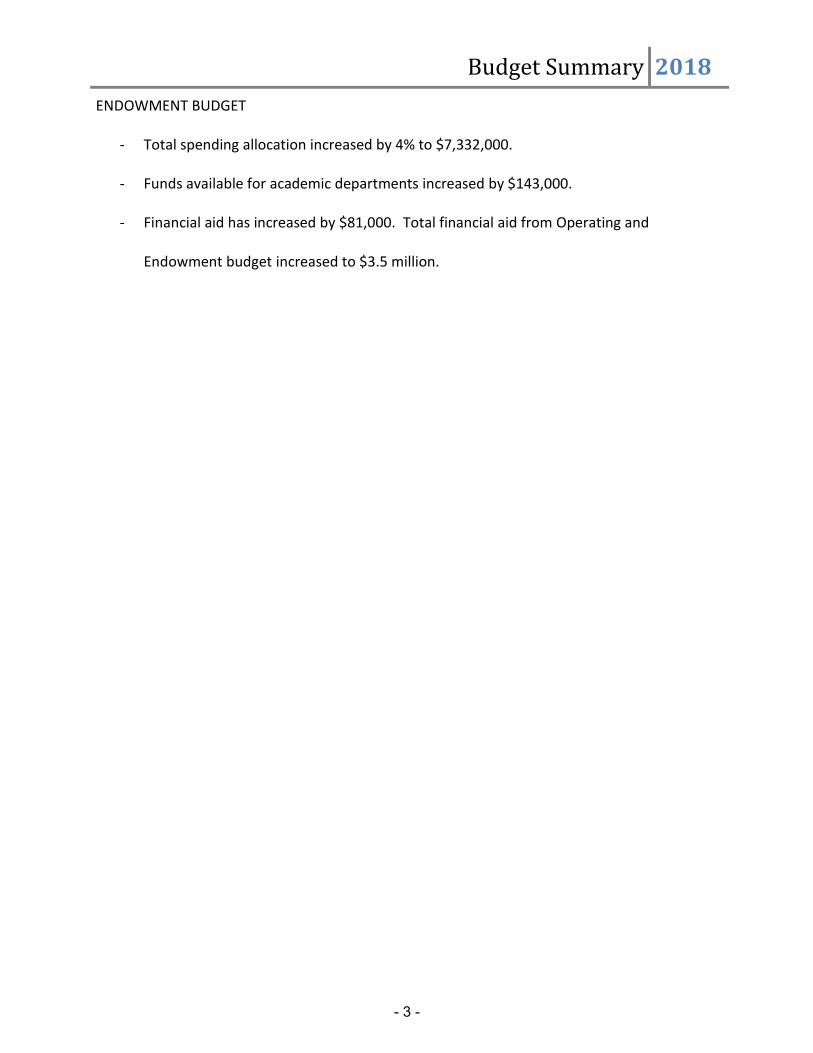
ENDOWMENT BUDGET
- Total spending allocation increased by 4% to $7,332,000.
- Funds available for academic departments increased by $143,000.
- Financial aid has increased by $81,000. Total financial aid from Operating and
Endowment budget increased to $3.5 million.
- 3 -
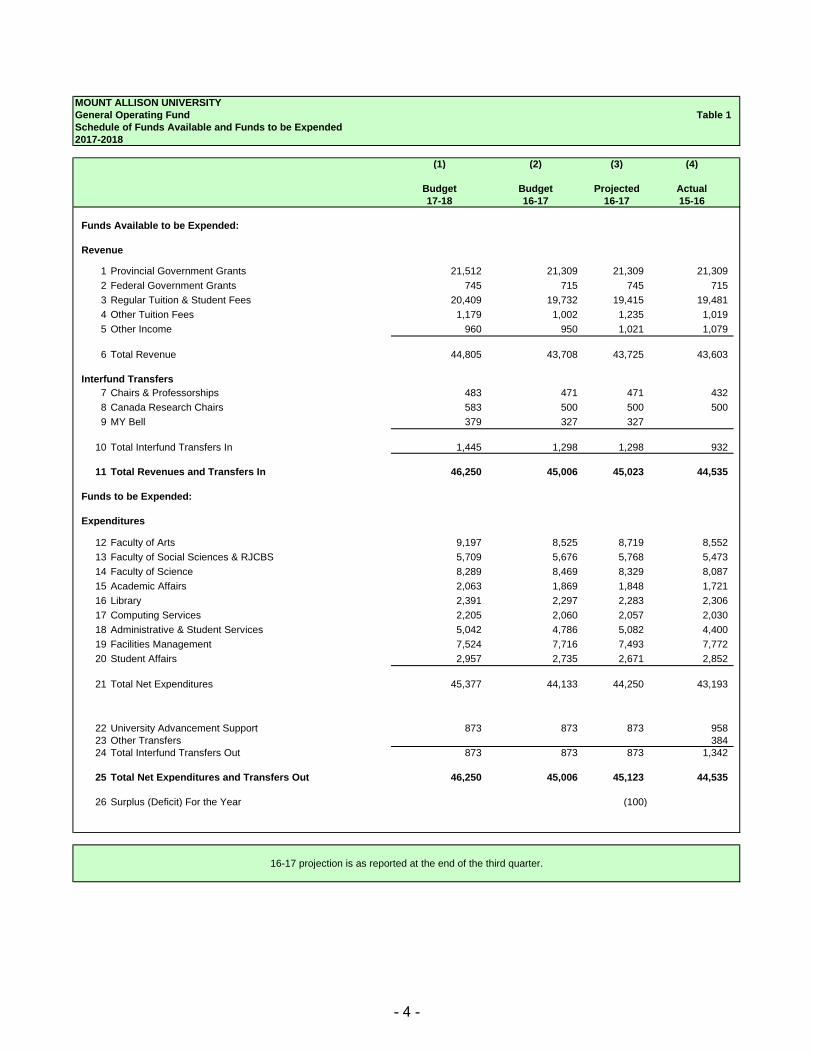
MOUNT ALLISON UNIVERSITY
General Operating Fund Table 1
Schedule of Funds Available and Funds to be Expended
2017-2018
(1) (2) (3) (4)
Budget Budget Projected Actual
17-18 16-17 16-17 15-16
Funds Available to be Expended:
Revenue
1 Provincial Government Grants 21,512 21,309 21,309 21,309
2 Federal Government Grants 745 715 745 715
3 Regular Tuition & Student Fees 20,409 19,732 19,415 19,481
4 Other Tuition Fees 1,179 1,002 1,235 1,019
5 Other Income 960 950 1,021 1,079
6 Total Revenue 44,805 43,708 43,725 43,603
Interfund Transfers
7 Chairs & Professorships 483 471 471 432
8 Canada Research Chairs 583 500 500 500
9 MY Bell 379 327 327
10 Total Interfund Transfers In 1,445 1,298 1,298 932
11 Total Revenues and Transfers In 46,250 45,006 45,023 44,535
Funds to be Expended:
Expenditures
12 Faculty of Arts 9,197 8,525 8,719 8,552
13 Faculty of Social Sciences & RJCBS 5,709 5,676 5,768 5,473
14 Faculty of Science 8,289 8,469 8,329 8,087
15 Academic Affairs 2,063 1,869 1,848 1,721
16 Library 2,391 2,297 2,283 2,306
17 Computing Services 2,205 2,060 2,057 2,030
18 Administrative & Student Services 5,042 4,786 5,082 4,400
19 Facilities Management 7,524 7,716 7,493 7,772
20 Student Affairs 2,957 2,735 2,671 2,852
21 Total Net Expenditures 45,377 44,133 44,250 43,193
22 University Advancement Support 873 873 873 958
23 Other Transfers 384
24 Total Interfund Transfers Out 873 873 873 1,342
25 Total Net Expenditures and Transfers Out 46,250 45,006 45,123 44,535
26 Surplus (Deficit) For the Year - - (100) -
16-17 projection is as reported at the end of the third quarter.
- 4 -
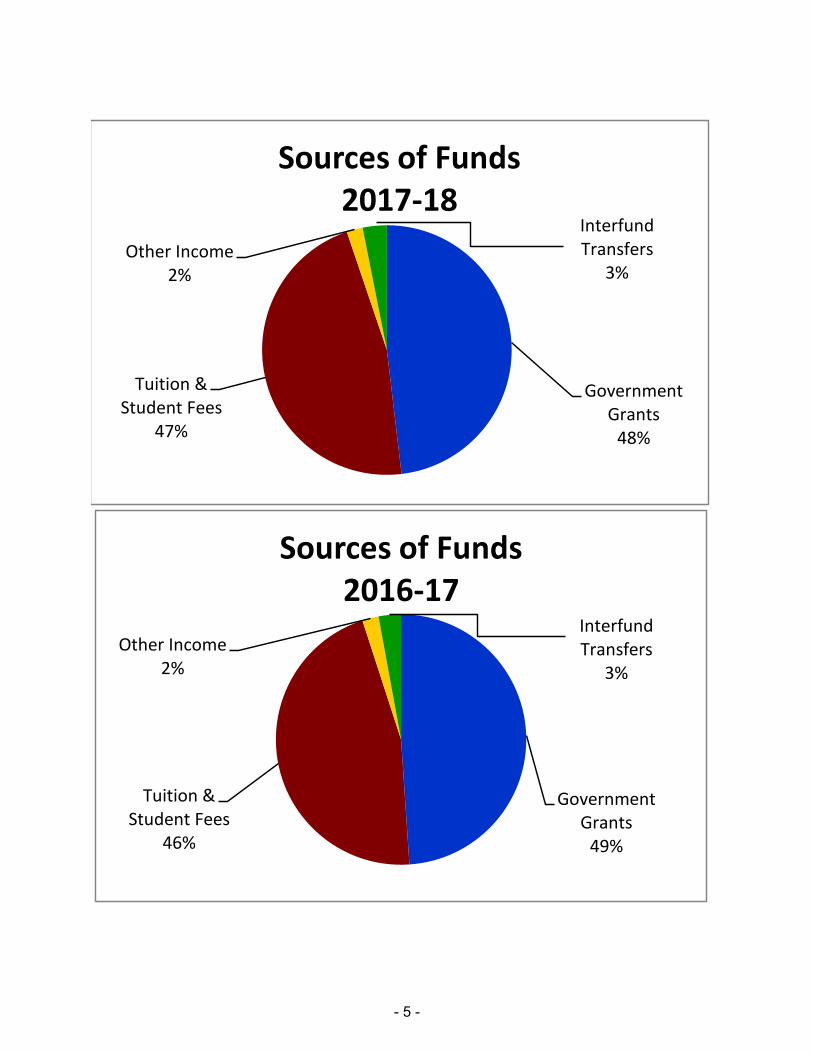
Government Grants
48%
Tuition & Student Fees
47%
Other Income2%
Interfund Transfers
3%
Sources of Funds2017-18
Government Grants
49%
Tuition & Student Fees
46%
Other Income2%
Interfund Transfers
3%
Sources of Funds2016-17
- 5 -
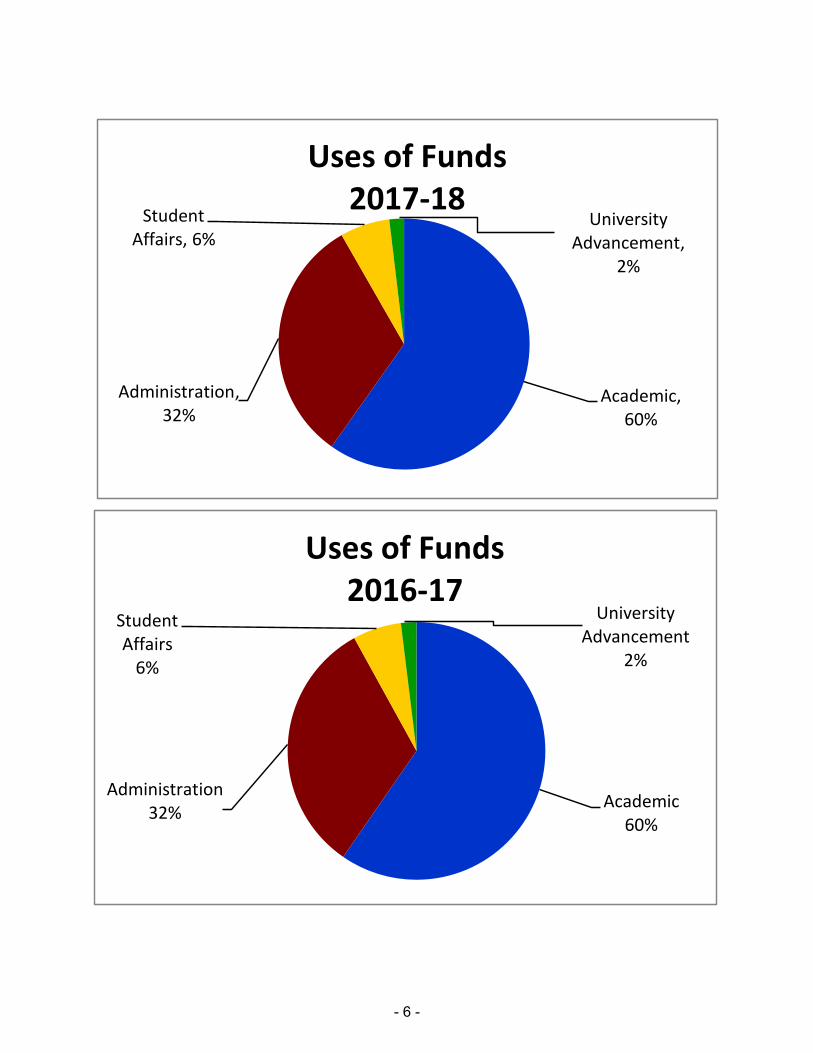
Academic, 60%
Administration, 32%
Student Affairs, 6%
University Advancement,
2%
Uses of Funds2017-18
Academic60%
Administration32%
Student Affairs
6%
University Advancement
2%
Uses of Funds2016-17
- 6 -
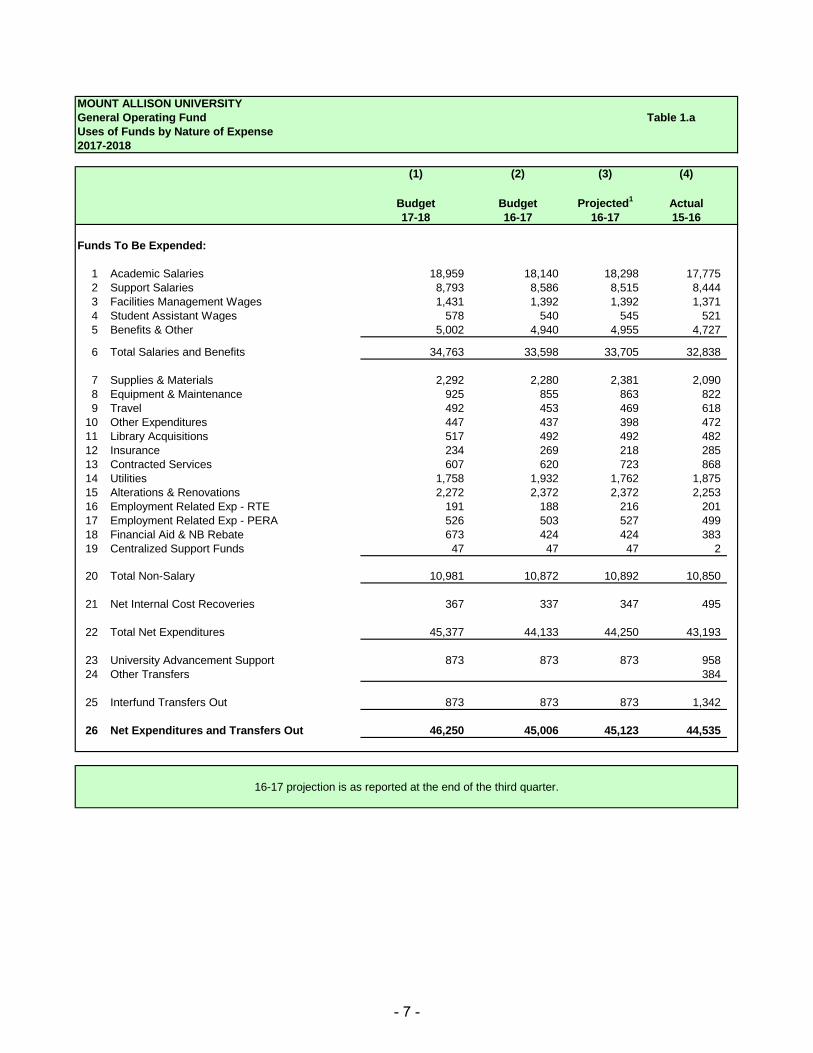
MOUNT ALLISON UNIVERSITY
General Operating Fund Table 1.a
Uses of Funds by Nature of Expense
2017-2018
(1) (2) (3) (4)
Budget Budget Projected1
Actual
17-18 16-17 16-17 15-16
Funds To Be Expended:
1 Academic Salaries 18,959 18,140 18,298 17,775
2 Support Salaries 8,793 8,586 8,515 8,444
3 Facilities Management Wages 1,431 1,392 1,392 1,371
4 Student Assistant Wages 578 540 545 521
5 Benefits & Other 5,002 4,940 4,955 4,727
6 Total Salaries and Benefits 34,763 33,598 33,705 32,838
7 Supplies & Materials 2,292 2,280 2,381 2,090
8 Equipment & Maintenance 925 855 863 822
9 Travel 492 453 469 618
10 Other Expenditures 447 437 398 472
11 Library Acquisitions 517 492 492 482
12 Insurance 234 269 218 285
13 Contracted Services 607 620 723 868
14 Utilities 1,758 1,932 1,762 1,875
15 Alterations & Renovations 2,272 2,372 2,372 2,253
16 Employment Related Exp - RTE 191 188 216 201
17 Employment Related Exp - PERA 526 503 527 499
18 Financial Aid & NB Rebate 673 424 424 383
19 Centralized Support Funds 47 47 47 2
20 Total Non-Salary 10,981 10,872 10,892 10,850
21 Net Internal Cost Recoveries 367 337 347 495
22 Total Net Expenditures 45,377 44,133 44,250 43,193
23 University Advancement Support 873 873 873 958
24 Other Transfers 384
25 Interfund Transfers Out 873 873 873 1,342
26 Net Expenditures and Transfers Out 46,250 45,006 45,123 44,535
16-17 projection is as reported at the end of the third quarter.
- 7 -
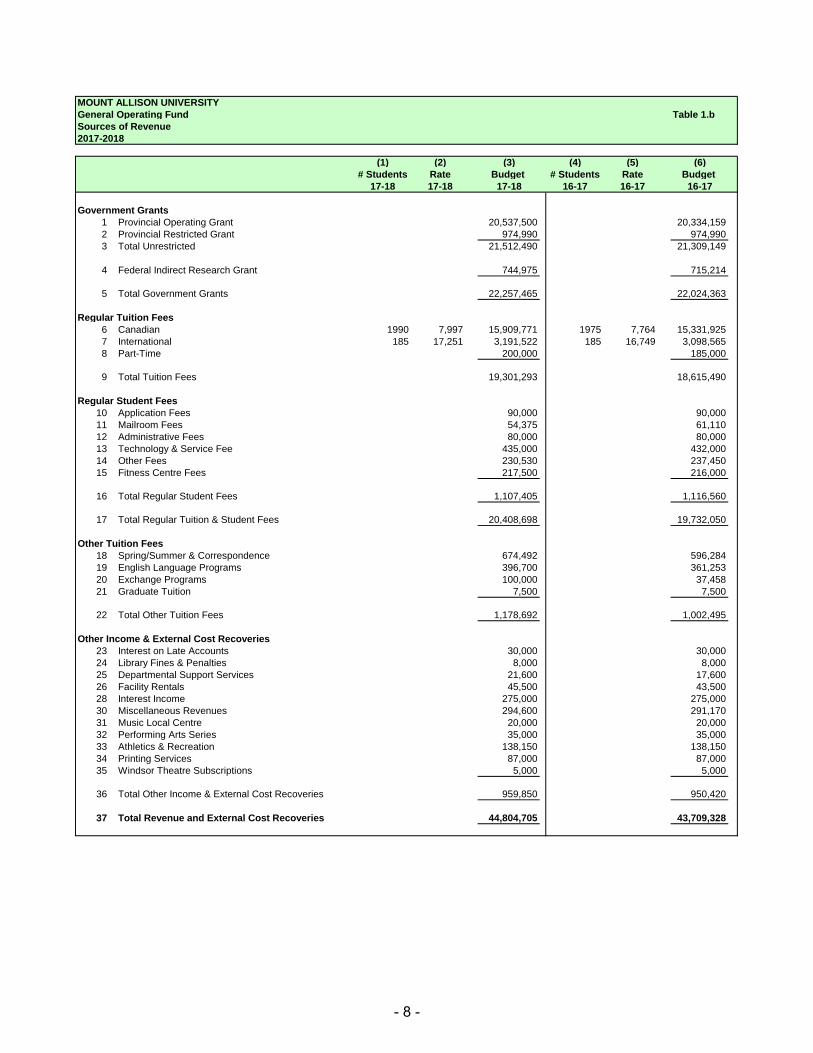
MOUNT ALLISON UNIVERSITY
General Operating Fund Table 1.b
Sources of Revenue
2017-2018
(1) (2) (3) (4) (5) (6)
# Students Rate Budget # Students Rate Budget
17-18 17-18 17-18 16-17 16-17 16-17
Government Grants
1 Provincial Operating Grant 20,537,500 20,334,159
2 Provincial Restricted Grant 974,990 974,990
3 Total Unrestricted 21,512,490 21,309,149
4 Federal Indirect Research Grant 744,975 715,214
5 Total Government Grants 22,257,465 22,024,363
Regular Tuition Fees
6 Canadian 1990 7,997 15,909,771 1975 7,764 15,331,925
7 International 185 17,251 3,191,522 185 16,749 3,098,565
8 Part-Time 200,000 185,000
9 Total Tuition Fees 19,301,293 18,615,490
Regular Student Fees
10 Application Fees 90,000 90,000
11 Mailroom Fees 54,375 61,110
12 Administrative Fees 80,000 80,000
13 Technology & Service Fee 435,000 432,000
14 Other Fees 230,530 237,450
15 Fitness Centre Fees 217,500 216,000
16 Total Regular Student Fees 1,107,405 1,116,560
17 Total Regular Tuition & Student Fees 20,408,698 19,732,050
Other Tuition Fees
18 Spring/Summer & Correspondence 674,492 596,284
19 English Language Programs 396,700 361,253
20 Exchange Programs 100,000 37,458
21 Graduate Tuition 7,500 7,500
22 Total Other Tuition Fees 1,178,692 1,002,495
Other Income & External Cost Recoveries
23 Interest on Late Accounts 30,000 30,000
24 Library Fines & Penalties 8,000 8,000
25 Departmental Support Services 21,600 17,600
26 Facility Rentals 45,500 43,500
28 Interest Income 275,000 275,000
30 Miscellaneous Revenues 294,600 291,170
31 Music Local Centre 20,000 20,000
32 Performing Arts Series 35,000 35,000
33 Athletics & Recreation 138,150 138,150
34 Printing Services 87,000 87,000
35 Windsor Theatre Subscriptions 5,000 5,000
36 Total Other Income & External Cost Recoveries 959,850 950,420
37 Total Revenue and External Cost Recoveries 44,804,705 43,709,328
- 8 -
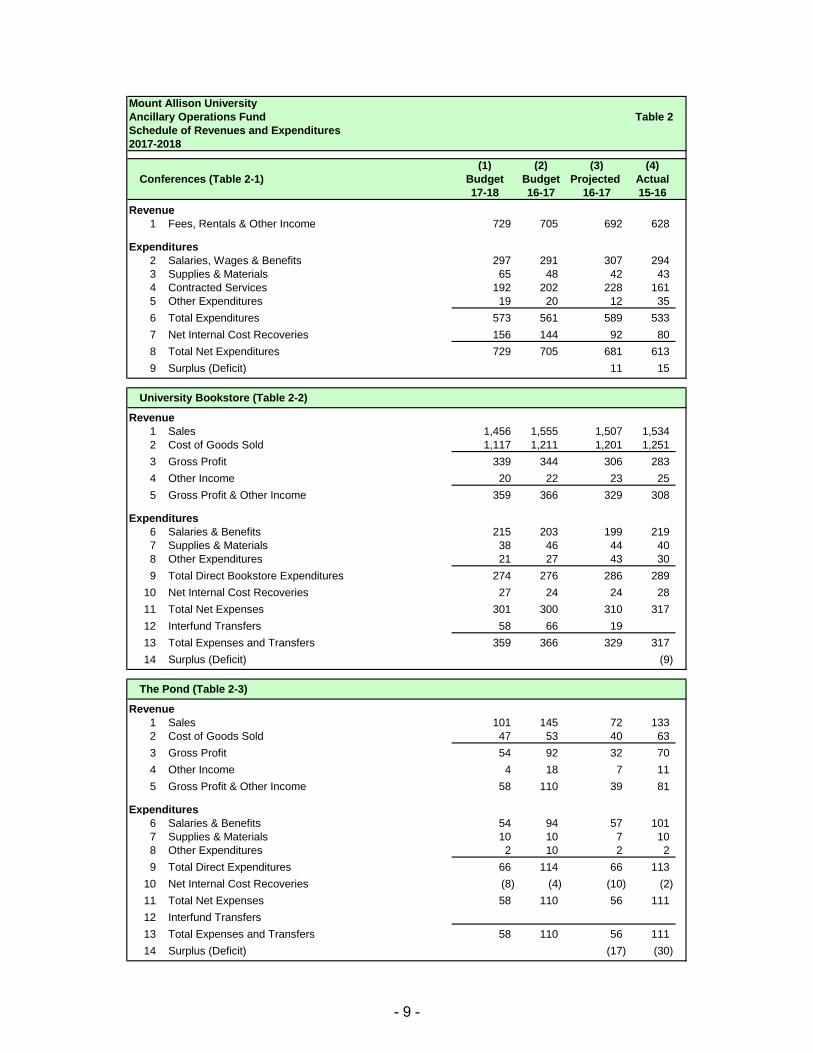
Mount Allison University
Ancillary Operations Fund Table 2
Schedule of Revenues and Expenditures
2017-2018
(1) (2) (3) (4)
Conferences (Table 2-1) Budget Budget Projected Actual
17-18 16-17 16-17 15-16
Revenue
1 Fees, Rentals & Other Income 729 705 692 628
Expenditures
2 Salaries, Wages & Benefits 297 291 307 294
3 Supplies & Materials 65 48 42 43
4 Contracted Services 192 202 228 161
5 Other Expenditures 19 20 12 35
6 Total Expenditures 573 561 589 533
7 Net Internal Cost Recoveries 156 144 92 80
8 Total Net Expenditures 729 705 681 613
9 Surplus (Deficit) - - 11 15
University Bookstore (Table 2-2)
Revenue
1 Sales 1,456 1,555 1,507 1,534
2 Cost of Goods Sold 1,117 1,211 1,201 1,251
3 Gross Profit 339 344 306 283 16
4 Other Income 20 22 23 25
5 Gross Profit & Other Income 359 366 329 308
Expenditures
6 Salaries & Benefits 215 203 199 219
7 Supplies & Materials 38 46 44 40
8 Other Expenditures 21 27 43 30
9 Total Direct Bookstore Expenditures 274 276 286 289
10 Net Internal Cost Recoveries 27 24 24 28
11 Total Net Expenses 301 300 310 317
12 Interfund Transfers 58 66 19
13 Total Expenses and Transfers 359 366 329 317
14 Surplus (Deficit) - - - (9)
The Pond (Table 2-3)
Revenue
1 Sales 101 145 72 133
2 Cost of Goods Sold 47 53 40 63
3 Gross Profit 54 92 32 70
4 Other Income 4 18 7 11
5 Gross Profit & Other Income 58 110 39 81
Expenditures
6 Salaries & Benefits 54 94 57 101
7 Supplies & Materials 10 10 7 10
8 Other Expenditures 2 10 2 2
9 Total Direct Expenditures 66 114 66 113
10 Net Internal Cost Recoveries (8) (4) (10) (2)
11 Total Net Expenses 58 110 56 111
12 Interfund Transfers
13 Total Expenses and Transfers 58 110 56 111
14 Surplus (Deficit) - - (17) (30)
- 9 -
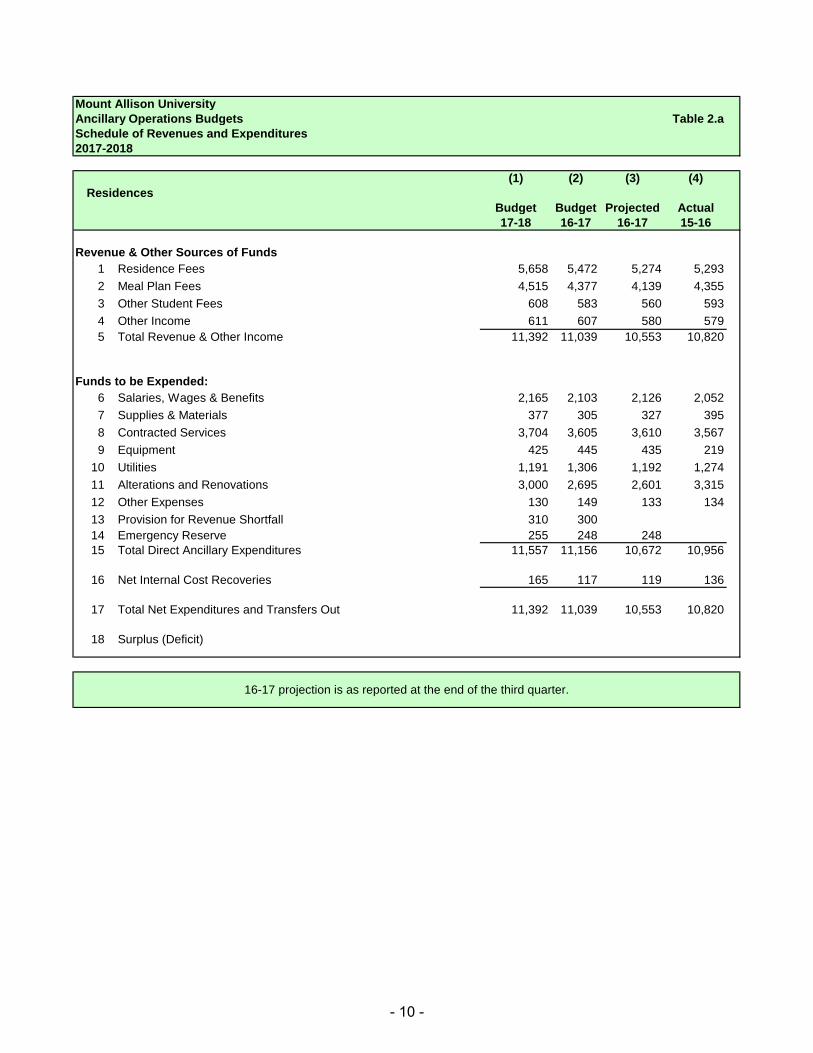
Mount Allison University
Ancillary Operations Budgets Table 2.a
Schedule of Revenues and Expenditures
2017-2018
(1) (2) (3) (4)
Residences
Budget Budget Projected Actual
17-18 16-17 16-17 15-16
Revenue & Other Sources of Funds
1 Residence Fees 5,658 5,472 5,274 5,293
2 Meal Plan Fees 4,515 4,377 4,139 4,355
3 Other Student Fees 608 583 560 593
4 Other Income 611 607 580 579
5 Total Revenue & Other Income 11,392 11,039 10,553 10,820
Funds to be Expended:
6 Salaries, Wages & Benefits 2,165 2,103 2,126 2,052
7 Supplies & Materials 377 305 327 395
8 Contracted Services 3,704 3,605 3,610 3,567
9 Equipment 425 445 435 219
10 Utilities 1,191 1,306 1,192 1,274
11 Alterations and Renovations 3,000 2,695 2,601 3,315
12 Other Expenses 130 149 133 134
13 Provision for Revenue Shortfall 310 300
14 Emergency Reserve 255 248 248
15 Total Direct Ancillary Expenditures 11,557 11,156 10,672 10,956
16 Net Internal Cost Recoveries 165 117 119 136
17 Total Net Expenditures and Transfers Out 11,392 11,039 10,553 10,820
18 Surplus (Deficit) - - - -
16-17 projection is as reported at the end of the third quarter.
- 10 -
Mount Allison University
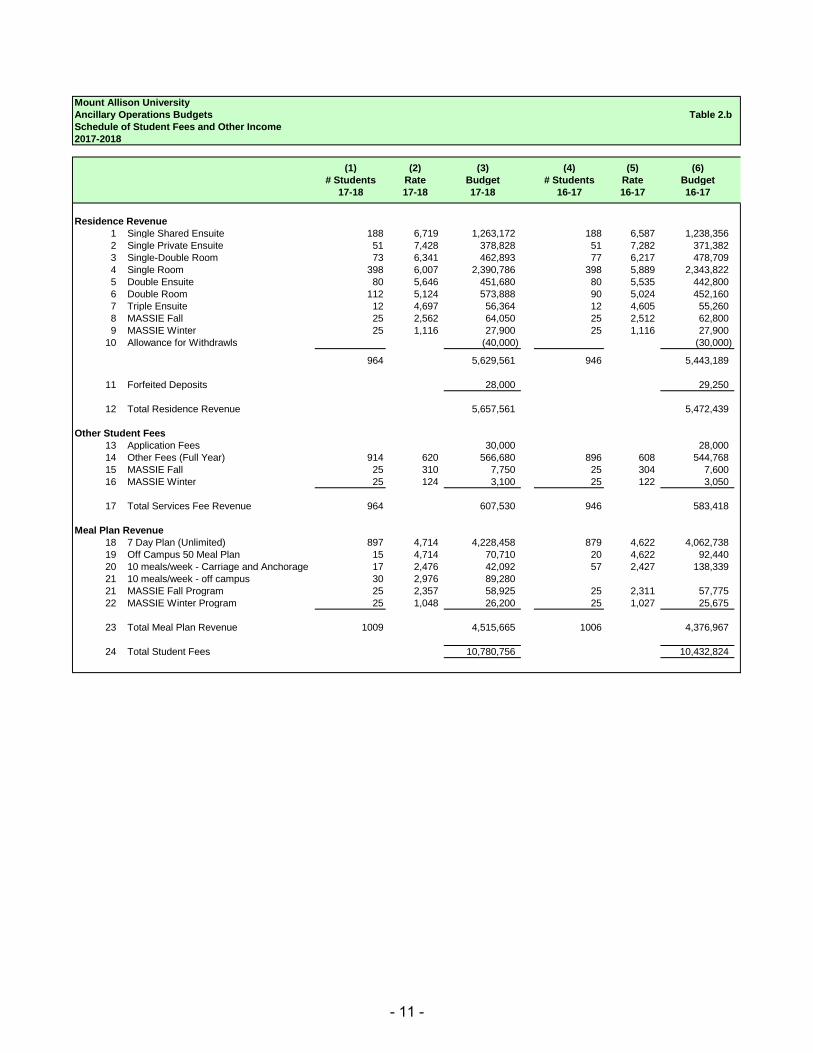
Ancillary Operations Budgets Table 2.b
Schedule of Student Fees and Other Income
2017-2018
(1) (2) (3) (4) (5) (6)
# Students Rate Budget # Students Rate Budget
17-18 17-18 17-18 16-17 16-17 16-17
Residence Revenue
1 Single Shared Ensuite 188 6,719 1,263,172 188 6,587 1,238,356
2 Single Private Ensuite 51 7,428 378,828 51 7,282 371,382
3 Single-Double Room 73 6,341 462,893 77 6,217 478,709
4 Single Room 398 6,007 2,390,786 398 5,889 2,343,822
5 Double Ensuite 80 5,646 451,680 80 5,535 442,800
6 Double Room 112 5,124 573,888 90 5,024 452,160
7 Triple Ensuite 12 4,697 56,364 12 4,605 55,260
8 MASSIE Fall 25 2,562 64,050 25 2,512 62,800
9 MASSIE Winter 25 1,116 27,900 25 1,116 27,900
10 Allowance for Withdrawls (40,000) (30,000)
964 5,629,561 946 5,443,189
11 Forfeited Deposits 28,000 29,250
12 Total Residence Revenue 5,657,561 5,472,439
Other Student Fees
13 Application Fees 30,000 28,000
14 Other Fees (Full Year) 914 620 566,680 896 608 544,768
15 MASSIE Fall 25 310 7,750 25 304 7,600
16 MASSIE Winter 25 124 3,100 25 122 3,050
17 Total Services Fee Revenue 964 607,530 946 583,418
Meal Plan Revenue
18 7 Day Plan (Unlimited) 897 4,714 4,228,458 879 4,622 4,062,738
19 Off Campus 50 Meal Plan 15 4,714 70,710 20 4,622 92,440
20 10 meals/week - Carriage and Anchorage 17 2,476 42,092 57 2,427 138,339
21 10 meals/week - off campus 30 2,976 89,280
21 MASSIE Fall Program 25 2,357 58,925 25 2,311 57,775
22 MASSIE Winter Program 25 1,048 26,200 25 1,027 25,675
23 Total Meal Plan Revenue 1009 4,515,665 1006 4,376,967
24 Total Student Fees 10,780,756 10,432,824
- 11 -
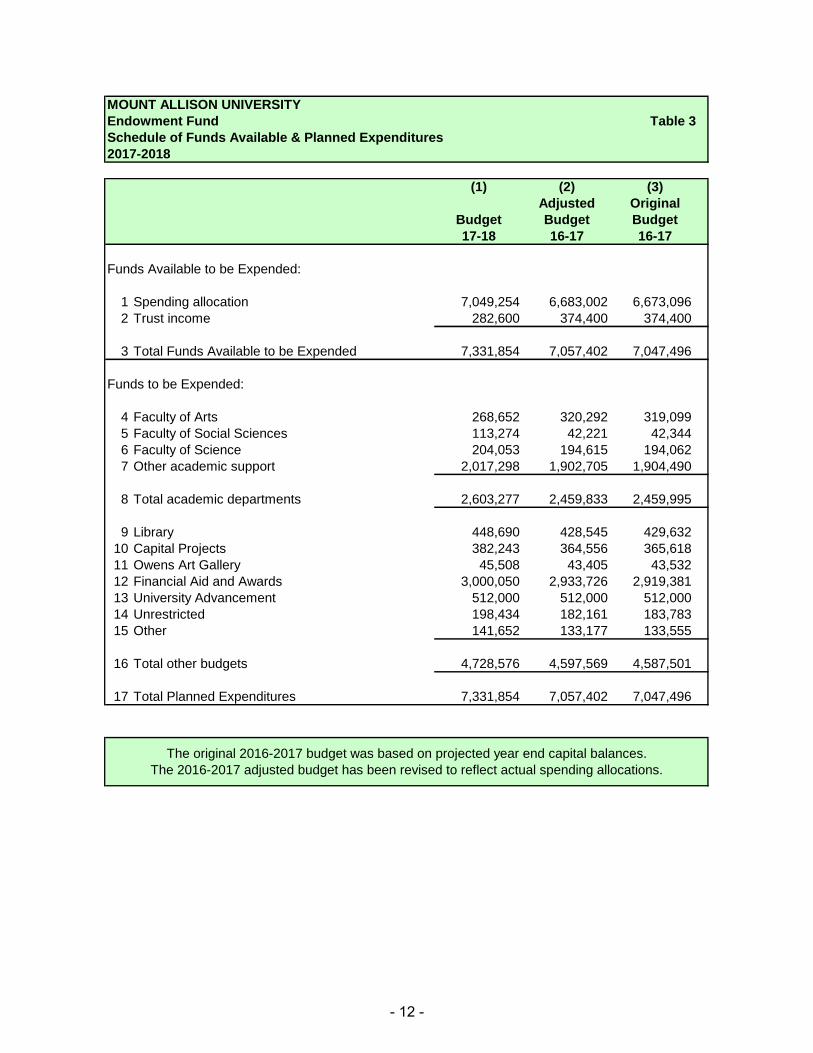
MOUNT ALLISON UNIVERSITY
Endowment Fund Table 3
Schedule of Funds Available & Planned Expenditures
2017-2018
(1) (2) (3)
Adjusted Original
Budget Budget Budget
17-18 16-17 16-17
Funds Available to be Expended:
1 Spending allocation 7,049,254 6,683,002 6,673,096
2 Trust income 282,600 374,400 374,400
3 Total Funds Available to be Expended 7,331,854 7,057,402 7,047,496
Funds to be Expended:
4 Faculty of Arts 268,652 320,292 319,099
5 Faculty of Social Sciences 113,274 42,221 42,344
6 Faculty of Science 204,053 194,615 194,062
7 Other academic support 2,017,298 1,902,705 1,904,490
8 Total academic departments 2,603,277 2,459,833 2,459,995
9 Library 448,690 428,545 429,632
10 Capital Projects 382,243 364,556 365,618
11 Owens Art Gallery 45,508 43,405 43,532
12 Financial Aid and Awards 3,000,050 2,933,726 2,919,381
13 University Advancement 512,000 512,000 512,000
14 Unrestricted 198,434 182,161 183,783
15 Other 141,652 133,177 133,555
16 Total other budgets 4,728,576 4,597,569 4,587,501
17 Total Planned Expenditures 7,331,854 7,057,402 7,047,496
The original 2016-2017 budget was based on projected year end capital balances.
The 2016-2017 adjusted budget has been revised to reflect actual spending allocations.
- 12 -
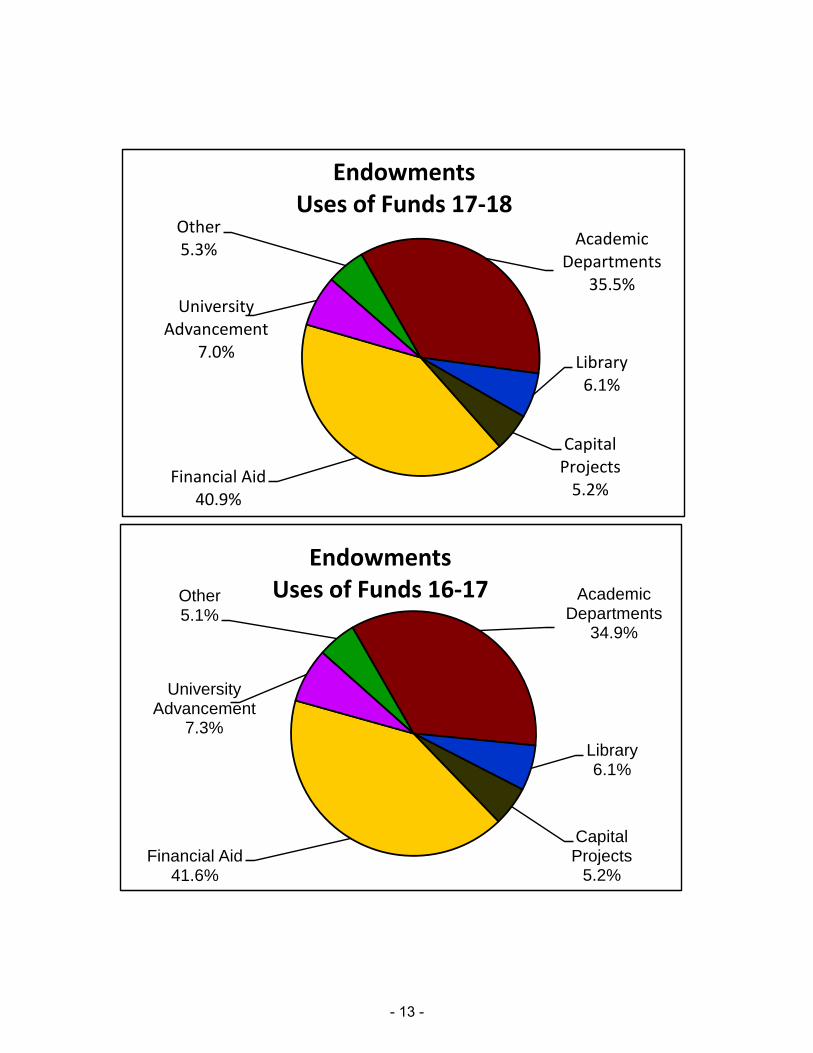
Academic Departments
35.5%
Library6.1%
Capital Projects
5.2%Financial Aid
40.9%
University Advancement
7.0%
Other5.3%
EndowmentsUses of Funds 17-18
Academic Departments
34.9%
Library6.1%
Capital Projects
5.2%Financial Aid
41.6%
University Advancement
7.3%
Other5.1%
EndowmentsUses of Funds 16-17
- 13 -
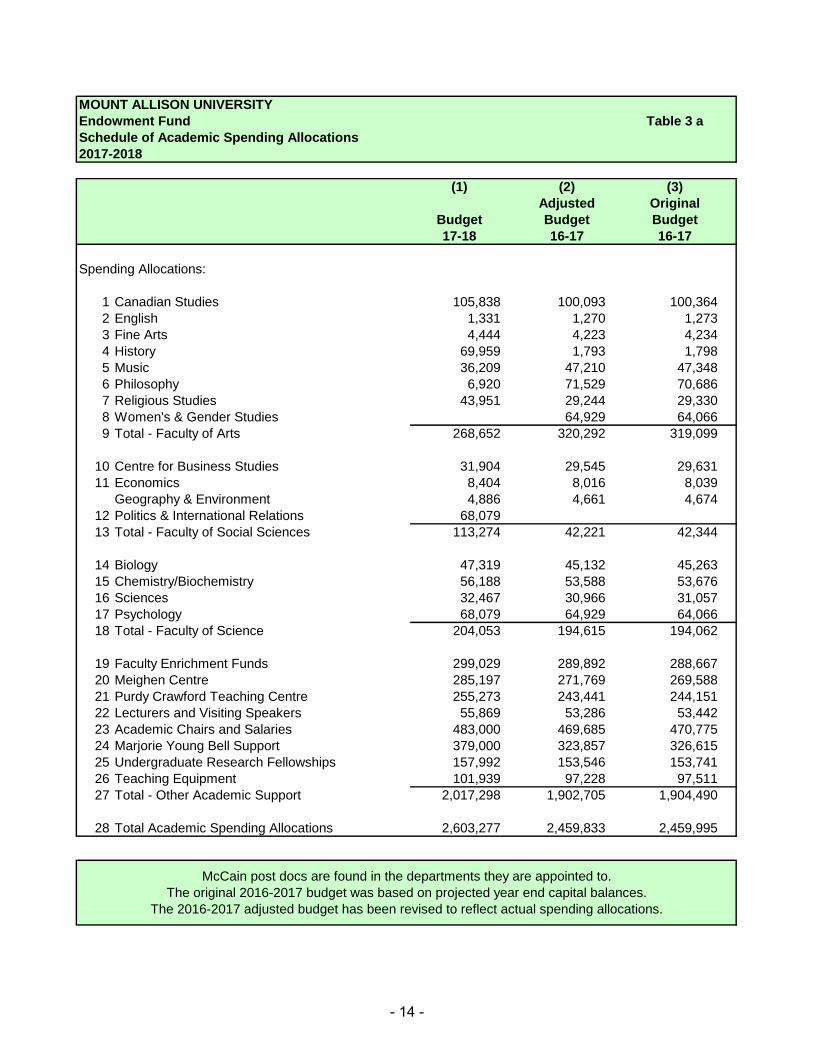
MOUNT ALLISON UNIVERSITY
Endowment Fund Table 3 a
Schedule of Academic Spending Allocations
2017-2018
(1) (2) (3)
Adjusted Original
Budget Budget Budget
17-18 16-17 16-17
Spending Allocations:
1 Canadian Studies 105,838 100,093 100,364
2 English 1,331 1,270 1,273
3 Fine Arts 4,444 4,223 4,234
4 History 69,959 1,793 1,798
5 Music 36,209 47,210 47,348
6 Philosophy 6,920 71,529 70,686
7 Religious Studies 43,951 29,244 29,330
8 Women's & Gender Studies 64,929 64,066
9 Total - Faculty of Arts 268,652 320,292 319,099
10 Centre for Business Studies 31,904 29,545 29,631
11 Economics 8,404 8,016 8,039
Geography & Environment 4,886 4,661 4,674
12 Politics & International Relations 68,079
13 Total - Faculty of Social Sciences 113,274 42,221 42,344
14 Biology 47,319 45,132 45,263
15 Chemistry/Biochemistry 56,188 53,588 53,676
16 Sciences 32,467 30,966 31,057
17 Psychology 68,079 64,929 64,066
18 Total - Faculty of Science 204,053 194,615 194,062
19 Faculty Enrichment Funds 299,029 289,892 288,667
20 Meighen Centre 285,197 271,769 269,588
21 Purdy Crawford Teaching Centre 255,273 243,441 244,151
22 Lecturers and Visiting Speakers 55,869 53,286 53,442
23 Academic Chairs and Salaries 483,000 469,685 470,775
24 Marjorie Young Bell Support 379,000 323,857 326,615
25 Undergraduate Research Fellowships 157,992 153,546 153,741
26 Teaching Equipment 101,939 97,228 97,511
27 Total - Other Academic Support 2,017,298 1,902,705 1,904,490
28 Total Academic Spending Allocations 2,603,277 2,459,833 2,459,995
The original 2016-2017 budget was based on projected year end capital balances.
The 2016-2017 adjusted budget has been revised to reflect actual spending allocations.
McCain post docs are found in the departments they are appointed to.
- 14 -
MOUNT ALLISON UNIVERSITY
Special Program Operating Fund Table 4
Schedule of Funds Available & Funds to be Expended
2017-2018
(1) (2) (3) (4)
University Advancement
Budget Budget Projected Actuals
17-18 16-17 16-17 15-16
Revenue & Interfund Transfers
1 From Operating Fund For Fundraising 437 437 437 447
2 From Operating Fund For Marketing/Communications 436 436 436 511
3 From Endowment Fund 512 512 512 512
4 From Special Purpose Fund & Interfunds 450 160 160 123
5 Revenue 147 147 147 186
6 Total Revenue and Transfers 1,982 1,692 1,692 1,779
Expenditures
7 Salaries & Benefits 1,484 1,234 1,171 1,242
8 Supplies & Materials 164 154 176 197
9 Contracted Services 218 198 228 210
10 Equipment & Maintenance 4 4 8 7
11 Travel 70 60 60 60
12 Other Expenses 17 17 24 24
13 Total Expenditures 1,957 1,667 1,667 1,740
14 Net Internal Cost Recoveries 25 25 25 39
15 Total Net Expenditures 1,982 1,692 1,692 1,779
16 Surplus(deficit) - - - -
- 15 -
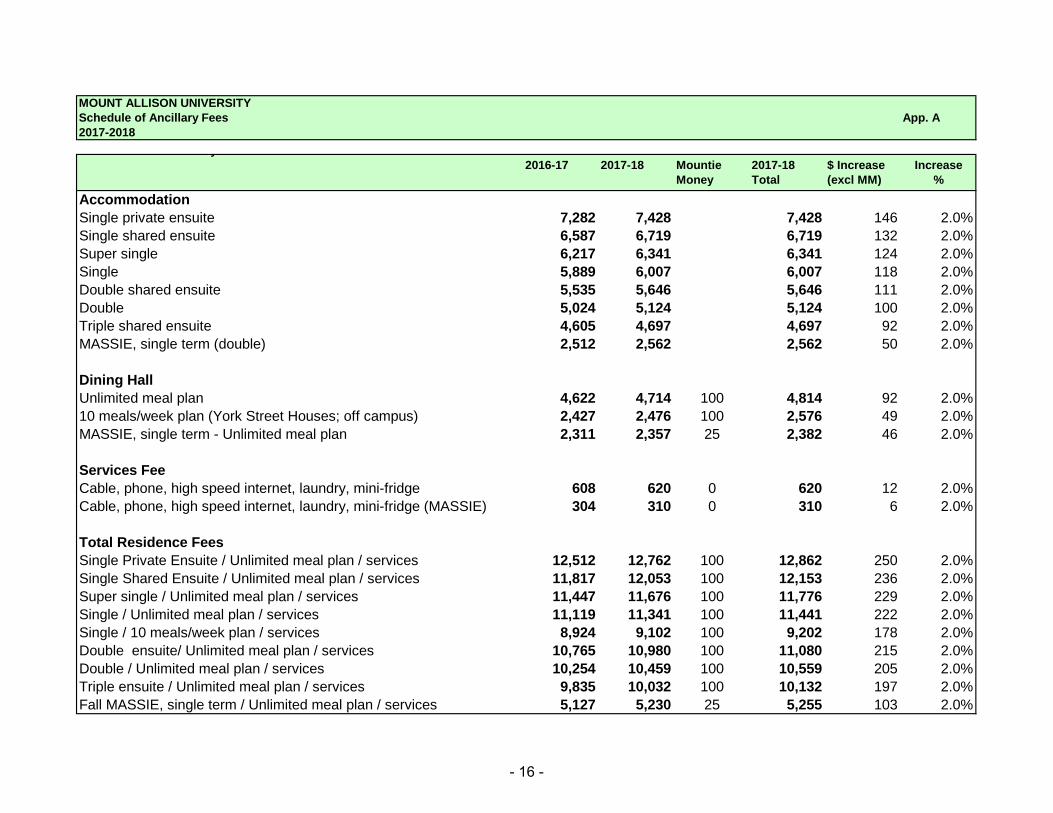
MOUNT ALLISON UNIVERSITY
Schedule of Ancillary Fees App. A
2017-2018
Mount Allison University
2016-17 2017-18 Mountie 2017-18 $ Increase Increase
Money Total (excl MM) %
Accommodation
Single private ensuite 7,282 7,428 7,428 146 2.0%
Single shared ensuite 6,587 6,719 6,719 132 2.0%
Super single 6,217 6,341 6,341 124 2.0%
Single 5,889 6,007 6,007 118 2.0%
Double shared ensuite 5,535 5,646 5,646 111 2.0%
Double 5,024 5,124 5,124 100 2.0%
Triple shared ensuite 4,605 4,697 4,697 92 2.0%
MASSIE, single term (double) 2,512 2,562 2,562 50 2.0%
Dining Hall
Unlimited meal plan 4,622 4,714 100 4,814 92 2.0%
10 meals/week plan (York Street Houses; off campus) 2,427 2,476 100 2,576 49 2.0%
MASSIE, single term - Unlimited meal plan 2,311 2,357 25 2,382 46 2.0%
Services Fee
Cable, phone, high speed internet, laundry, mini-fridge 608 620 0 620 12 2.0%
Cable, phone, high speed internet, laundry, mini-fridge (MASSIE) 304 310 0 310 6 2.0%
Total Residence Fees
Single Private Ensuite / Unlimited meal plan / services 12,512 12,762 100 12,862 250 2.0%
Single Shared Ensuite / Unlimited meal plan / services 11,817 12,053 100 12,153 236 2.0%
Super single / Unlimited meal plan / services 11,447 11,676 100 11,776 229 2.0%
Single / Unlimited meal plan / services 11,119 11,341 100 11,441 222 2.0%
Single / 10 meals/week plan / services 8,924 9,102 100 9,202 178 2.0%
Double ensuite/ Unlimited meal plan / services 10,765 10,980 100 11,080 215 2.0%
Double / Unlimited meal plan / services 10,254 10,459 100 10,559 205 2.0%
Triple ensuite / Unlimited meal plan / services 9,835 10,032 100 10,132 197 2.0%
Fall MASSIE, single term / Unlimited meal plan / services 5,127 5,230 25 5,255 103 2.0%
- 16 -
Full-time Tuition
Fees
$
Percent change from
2015-2016
International
Students Full-time
Tuition Fees
$
Percent change from
2015-2016
Full-time Tuition
Fees
$
Percent change from
2015-2016
International
Students Full-time
Tuition Fees
$
Percent change from
2015-2016
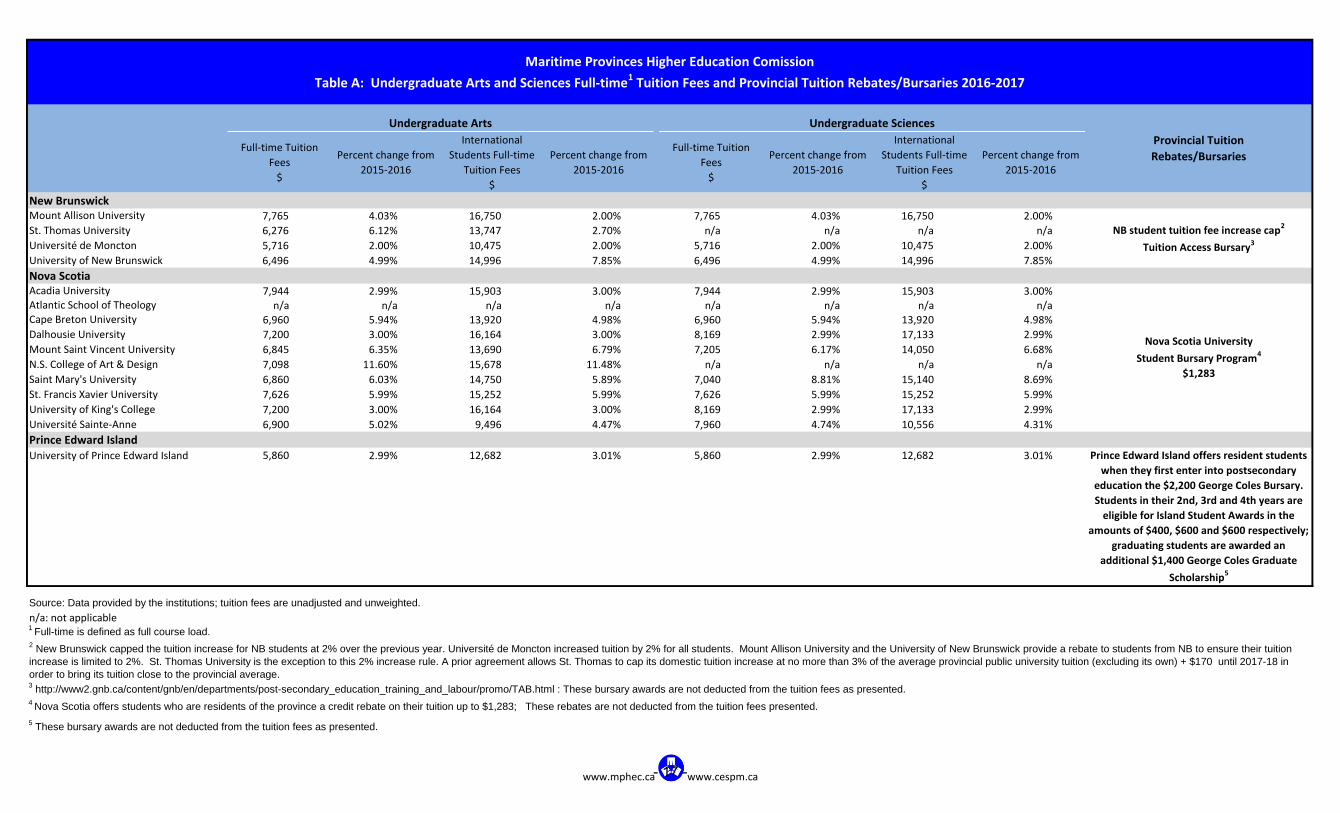
New BrunswickMount Allison University 7,765 4.03% 16,750 2.00% 7,765 4.03% 16,750 2.00%
St. Thomas University 6,276 6.12% 13,747 2.70% n/a n/a n/a n/a
Université de Moncton 5,716 2.00% 10,475 2.00% 5,716 2.00% 10,475 2.00%
University of New Brunswick 6,496 4.99% 14,996 7.85% 6,496 4.99% 14,996 7.85%
Nova ScotiaAcadia University 7,944 2.99% 15,903 3.00% 7,944 2.99% 15,903 3.00%Atlantic School of Theology n/a n/a n/a n/a n/a n/a n/a n/aCape Breton University 6,960 5.94% 13,920 4.98% 6,960 5.94% 13,920 4.98%
Dalhousie University 7,200 3.00% 16,164 3.00% 8,169 2.99% 17,133 2.99%
Mount Saint Vincent University 6,845 6.35% 13,690 6.79% 7,205 6.17% 14,050 6.68%
N.S. College of Art & Design 7,098 11.60% 15,678 11.48% n/a n/a n/a n/a
Saint Mary's University 6,860 6.03% 14,750 5.89% 7,040 8.81% 15,140 8.69%
St. Francis Xavier University 7,626 5.99% 15,252 5.99% 7,626 5.99% 15,252 5.99%
University of King's College 7,200 3.00% 16,164 3.00% 8,169 2.99% 17,133 2.99%
Université Sainte-Anne 6,900 5.02% 9,496 4.47% 7,960 4.74% 10,556 4.31%
Prince Edward IslandUniversity of Prince Edward Island 5,860 2.99% 12,682 3.01% 5,860 2.99% 12,682 3.01%
n/a: not applicable1 Full-time is defined as full course load.
Maritime Provinces Higher Education Comission
Table A: Undergraduate Arts and Sciences Full-time1 Tuition Fees and Provincial Tuition Rebates/Bursaries 2016-2017
2 New Brunswick capped the tuition increase for NB students at 2% over the previous year. Université de Moncton increased tuition by 2% for all students. Mount Allison University and the University of New Brunswick provide a rebate to students from NB to ensure their tuition
increase is limited to 2%. St. Thomas University is the exception to this 2% increase rule. A prior agreement allows St. Thomas to cap its domestic tuition increase at no more than 3% of the average provincial public university tuition (excluding its own) + $170 until 2017-18 in
order to bring its tuition close to the provincial average.
5 These bursary awards are not deducted from the tuition fees as presented.
Undergraduate Arts
4 Nova Scotia offers students who are residents of the province a credit rebate on their tuition up to $1,283; These rebates are not deducted from the tuition fees presented.
Prince Edward Island offers resident students
when they first enter into postsecondary
education the $2,200 George Coles Bursary.
Students in their 2nd, 3rd and 4th years are
eligible for Island Student Awards in the
amounts of $400, $600 and $600 respectively;
graduating students are awarded an
additional $1,400 George Coles Graduate
Scholarship5
Source: Data provided by the institutions; tuition fees are unadjusted and unweighted.
Provincial Tuition
Rebates/Bursaries
Undergraduate Sciences
Nova Scotia University
Student Bursary Program4
$1,283
3 http://www2.gnb.ca/content/gnb/en/departments/post-secondary_education_training_and_labour/promo/TAB.html : These bursary awards are not deducted from the tuition fees as presented.
NB student tuition fee increase cap2
Tuition Access Bursary3
www.mphec.ca www.cespm.ca- 17 -
Student Association 2
$
Health Services
$
Athletics / Fitness
Facility Membership
$
Campus or Facility
Renewal Fees
$
Other 3
$
TOTAL
$
Low
$
High
$
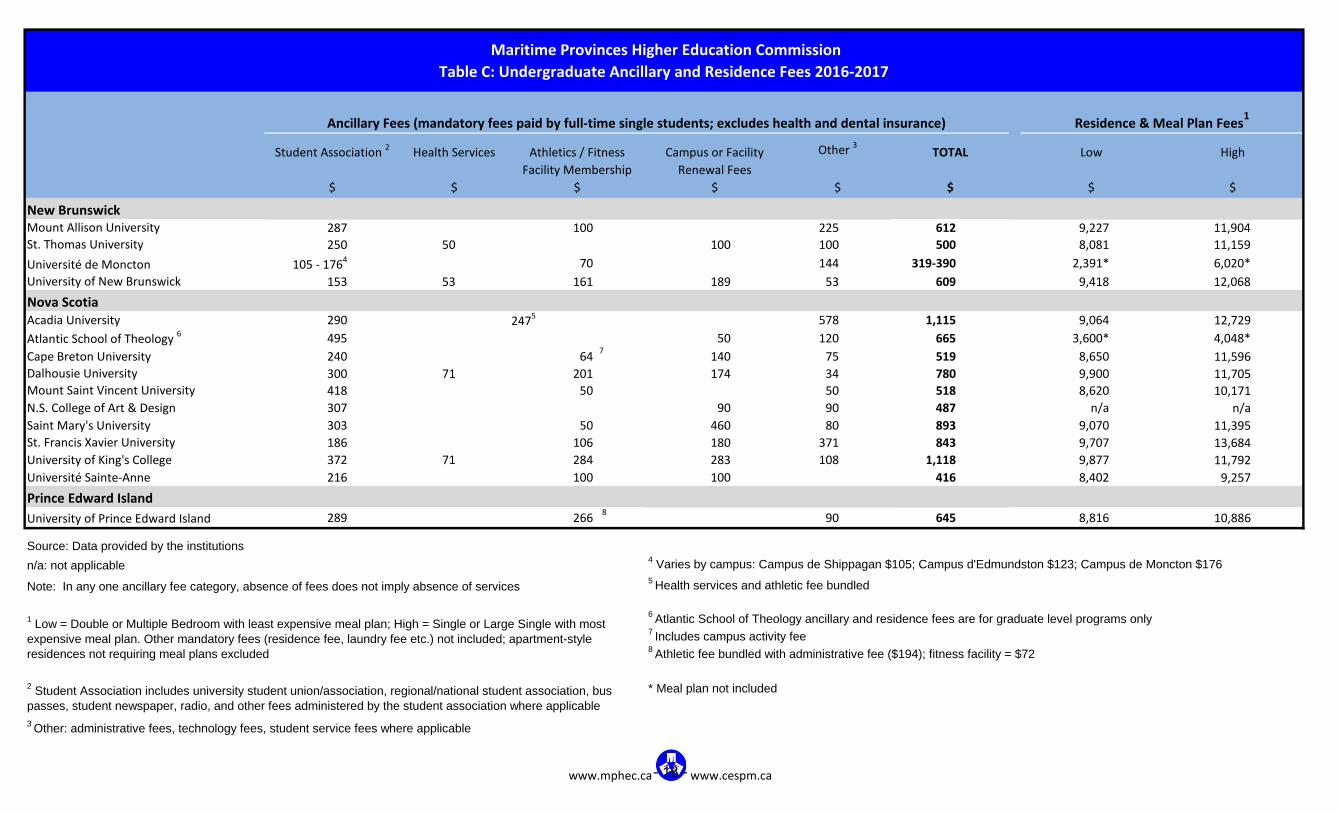
New BrunswickMount Allison University 287 100 225 612 9,227 11,904
St. Thomas University 250 50 100 100 500 8,081 11,159
Université de Moncton 105 - 1764 70 144 319-390 2,391* 6,020*
University of New Brunswick 153 53 161 189 53 609 9,418 12,068
Nova ScotiaAcadia University 290 578 1,115 9,064 12,729
Atlantic School of Theology 6 495 50 120 665 3,600* 4,048*
Cape Breton University 240 64 140 75 519 8,650 11,596
Dalhousie University 300 71 201 174 34 780 9,900 11,705Mount Saint Vincent University 418 50 50 518 8,620 10,171
N.S. College of Art & Design 307 90 90 487 n/a n/a
Saint Mary's University 303 50 460 80 893 9,070 11,395
St. Francis Xavier University 186 106 180 371 843 9,707 13,684
University of King's College 372 71 284 283 108 1,118 9,877 11,792
Université Sainte-Anne 216 100 100 416 8,402 9,257
Prince Edward Island
University of Prince Edward Island 289 266 90 645 8,816 10,886
Source: Data provided by the institutions
n/a: not applicable4 Varies by campus: Campus de Shippagan $105; Campus d'Edmundston $123; Campus de Moncton $176
5 Health services and athletic fee bundled
* Meal plan not included
3 Other: administrative fees, technology fees, student service fees where applicable
1 Low = Double or Multiple Bedroom with least expensive meal plan; High = Single or Large Single with most
expensive meal plan. Other mandatory fees (residence fee, laundry fee etc.) not included; apartment-style
residences not requiring meal plans excluded
2 Student Association includes university student union/association, regional/national student association, bus
passes, student newspaper, radio, and other fees administered by the student association where applicable
6 Atlantic School of Theology ancillary and residence fees are for graduate level programs only
7 Includes campus activity fee
8 Athletic fee bundled with administrative fee ($194); fitness facility = $72
Maritime Provinces Higher Education Commission
Table C: Undergraduate Ancillary and Residence Fees 2016‐2017
Ancillary Fees (mandatory fees paid by full-time single students; excludes health and dental insurance) Residence & Meal Plan Fees1
2475
Note: In any one ancillary fee category, absence of fees does not imply absence of services
7
8
www.mphec.ca www.cespm.ca- 18 -
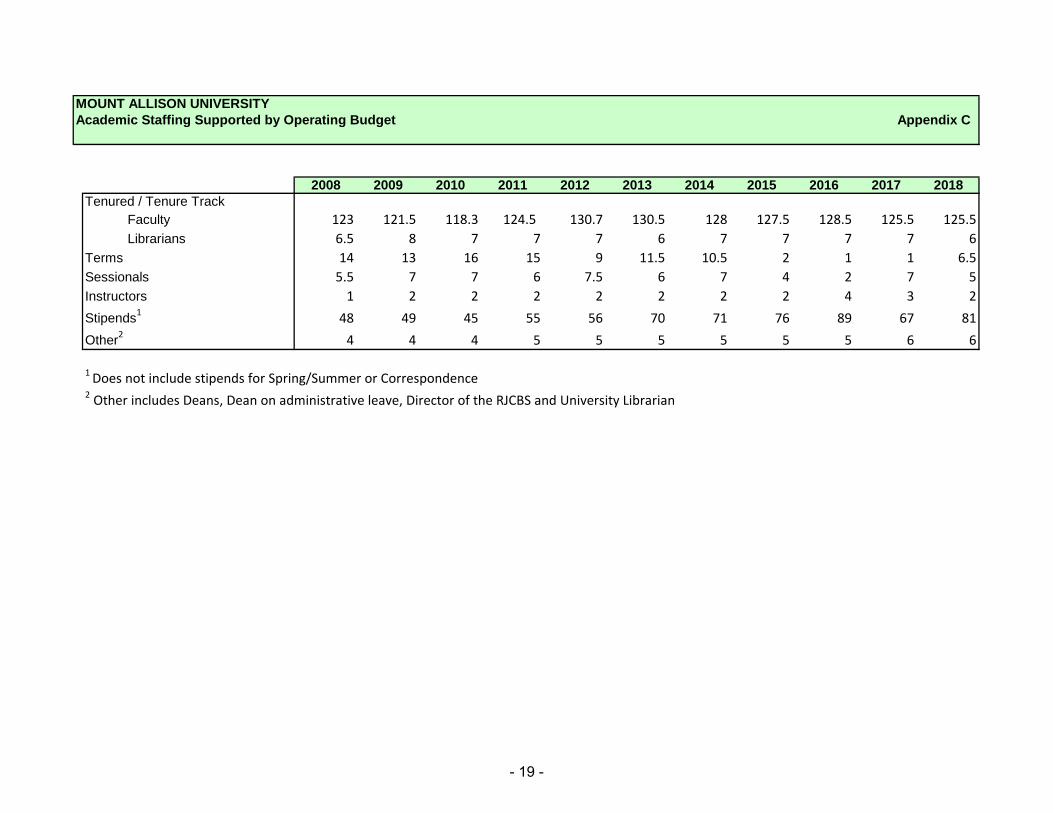
MOUNT ALLISON UNIVERSITY
Academic Staffing Supported by Operating Budget Appendix C
2008 2009 2010 2011 2012 2013 2014 2015 2016 2017 2018
Tenured / Tenure Track
Faculty 123 121.5 118.3 124.5 130.7 130.5 128 127.5 128.5 125.5 125.5
Librarians 6.5 8 7 7 7 6 7 7 7 7 6
Terms 14 13 16 15 9 11.5 10.5 2 1 1 6.5
Sessionals 5.5 7 7 6 7.5 6 7 4 2 7 5
Instructors 1 2 2 2 2 2 2 2 4 3 2
Stipends1
48 49 45 55 56 70 71 76 89 67 81
Other2
4 4 4 5 5 5 5 5 5 6 6
1 Does not include stipends for Spring/Summer or Correspondence2 Other includes Deans, Dean on administrative leave, Director of the RJCBS and University Librarian
- 19 -
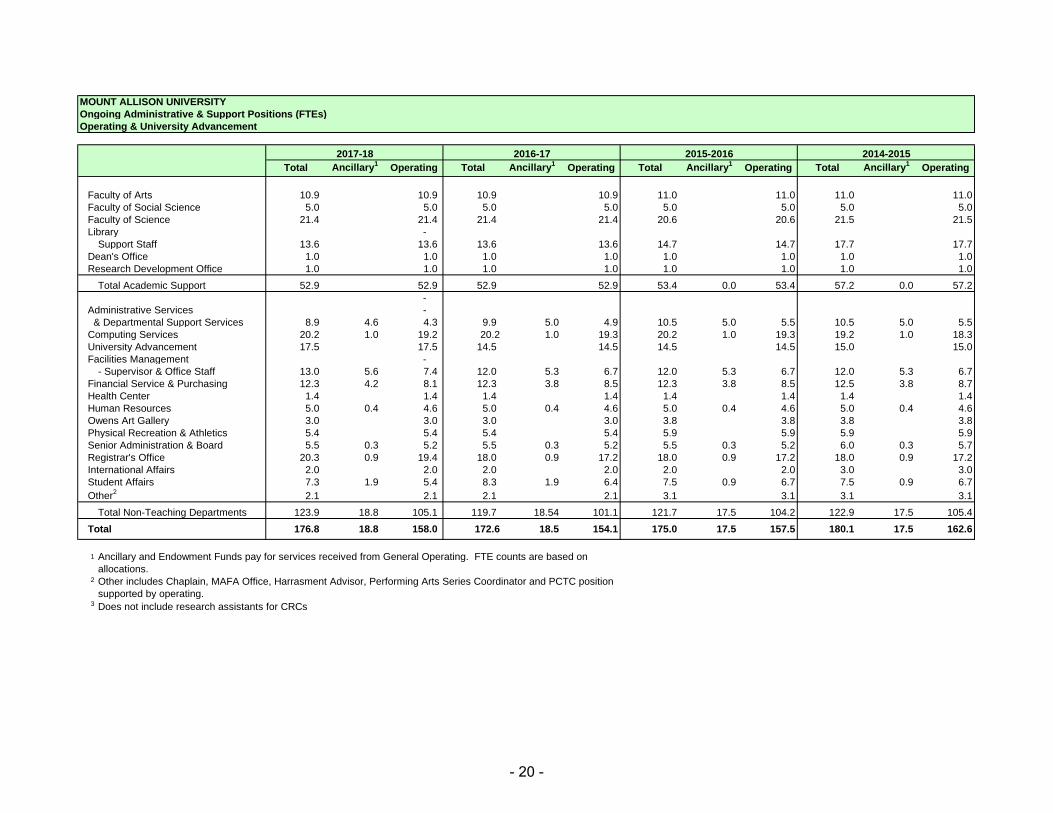
MOUNT ALLISON UNIVERSITY
Ongoing Administrative & Support Positions (FTEs)
Operating & University Advancement
2017-18
Total Ancillary1
Operating Total Ancillary1
Operating Total Ancillary1
Operating Total Ancillary1
Operating
Faculty of Arts 10.9 10.9 10.9 10.9 11.0 11.0 11.0 11.0
Faculty of Social Science 5.0 5.0 5.0 5.0 5.0 5.0 5.0 5.0
Faculty of Science 21.4 21.4 21.4 21.4 20.6 20.6 21.5 21.5
Library -
Support Staff 13.6 13.6 13.6 13.6 14.7 14.7 17.7 17.7
Dean's Office 1.0 1.0 1.0 1.0 1.0 1.0 1.0 1.0
Research Development Office 1.0 1.0 1.0 1.0 1.0 1.0 1.0 1.0
Total Academic Support 52.9 52.9 52.9 52.9 53.4 0.0 53.4 57.2 0.0 57.2
-
Administrative Services -
& Departmental Support Services 8.9 4.6 4.3 9.9 5.0 4.9 10.5 5.0 5.5 10.5 5.0 5.5
Computing Services 20.2 1.0 19.2 20.2 1.0 19.3 20.2 1.0 19.3 19.2 1.0 18.3
University Advancement 17.5 17.5 14.5 14.5 14.5 14.5 15.0 15.0
Facilities Management -
- Supervisor & Office Staff 13.0 5.6 7.4 12.0 5.3 6.7 12.0 5.3 6.7 12.0 5.3 6.7
Financial Service & Purchasing 12.3 4.2 8.1 12.3 3.8 8.5 12.3 3.8 8.5 12.5 3.8 8.7
Health Center 1.4 1.4 1.4 1.4 1.4 1.4 1.4 1.4
Human Resources 5.0 0.4 4.6 5.0 0.4 4.6 5.0 0.4 4.6 5.0 0.4 4.6
Owens Art Gallery 3.0 3.0 3.0 3.0 3.8 3.8 3.8 3.8
Physical Recreation & Athletics 5.4 5.4 5.4 5.4 5.9 5.9 5.9 5.9
Senior Administration & Board 5.5 0.3 5.2 5.5 0.3 5.2 5.5 0.3 5.2 6.0 0.3 5.7
Registrar's Office 20.3 0.9 19.4 18.0 0.9 17.2 18.0 0.9 17.2 18.0 0.9 17.2
International Affairs 2.0 2.0 2.0 2.0 2.0 2.0 3.0 3.0
Student Affairs 7.3 1.9 5.4 8.3 1.9 6.4 7.5 0.9 6.7 7.5 0.9 6.7
Other2
2.1 2.1 2.1 2.1 3.1 3.1 3.1 3.1
Total Non-Teaching Departments 123.9 18.8 105.1 119.7 18.54 101.1 121.7 17.5 104.2 122.9 17.5 105.4
Total 176.8 18.8 158.0 172.6 18.5 154.1 175.0 17.5 157.5 180.1 17.5 162.6-
1
2
3 Does not include research assistants for CRCs
Ancillary and Endowment Funds pay for services received from General Operating. FTE counts are based on
allocations.
Other includes Chaplain, MAFA Office, Harrasment Advisor, Performing Arts Series Coordinator and PCTC position
supported by operating.
2015-2016 2014-20152016-17
- 20 -
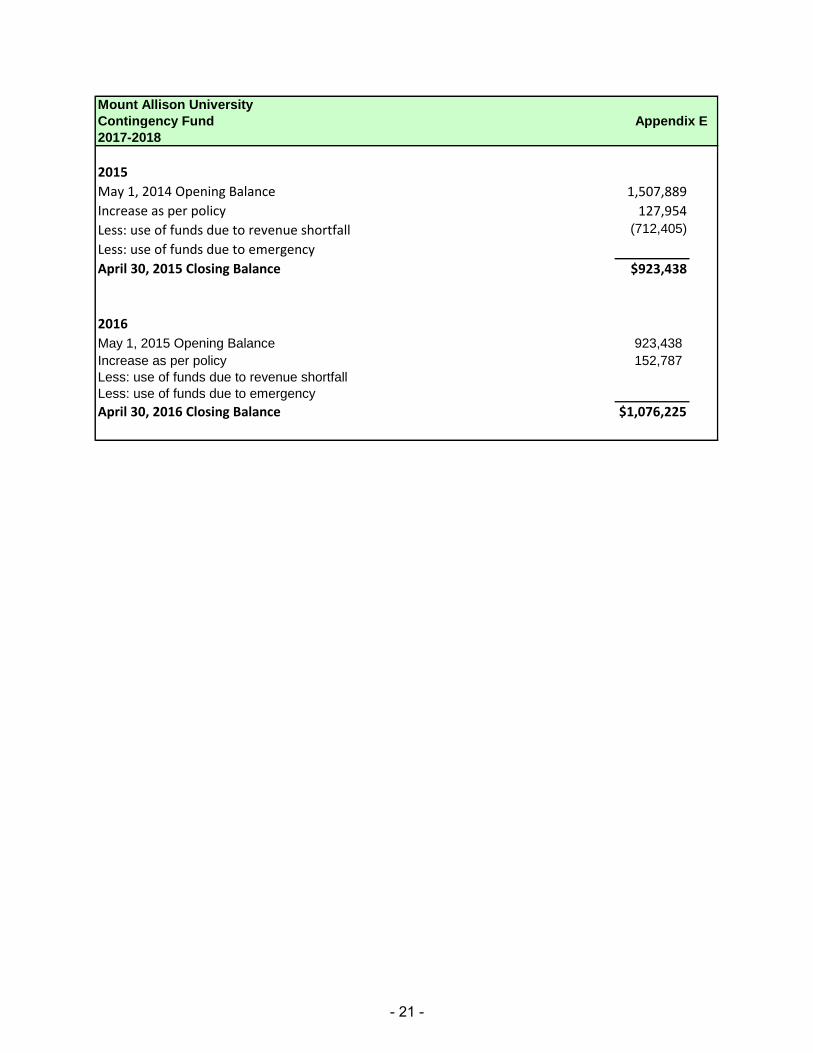
Mount Allison University
Contingency Fund Appendix E
2017-2018
2015
May 1, 2014 Opening Balance 1,507,889
Increase as per policy 127,954
Less: use of funds due to revenue shortfall (712,405)
Less: use of funds due to emergency
April 30, 2015 Closing Balance $923,438
2016
May 1, 2015 Opening Balance 923,438
Increase as per policy 152,787
Less: use of funds due to revenue shortfall
Less: use of funds due to emergency
April 30, 2016 Closing Balance $1,076,225
- 21 -
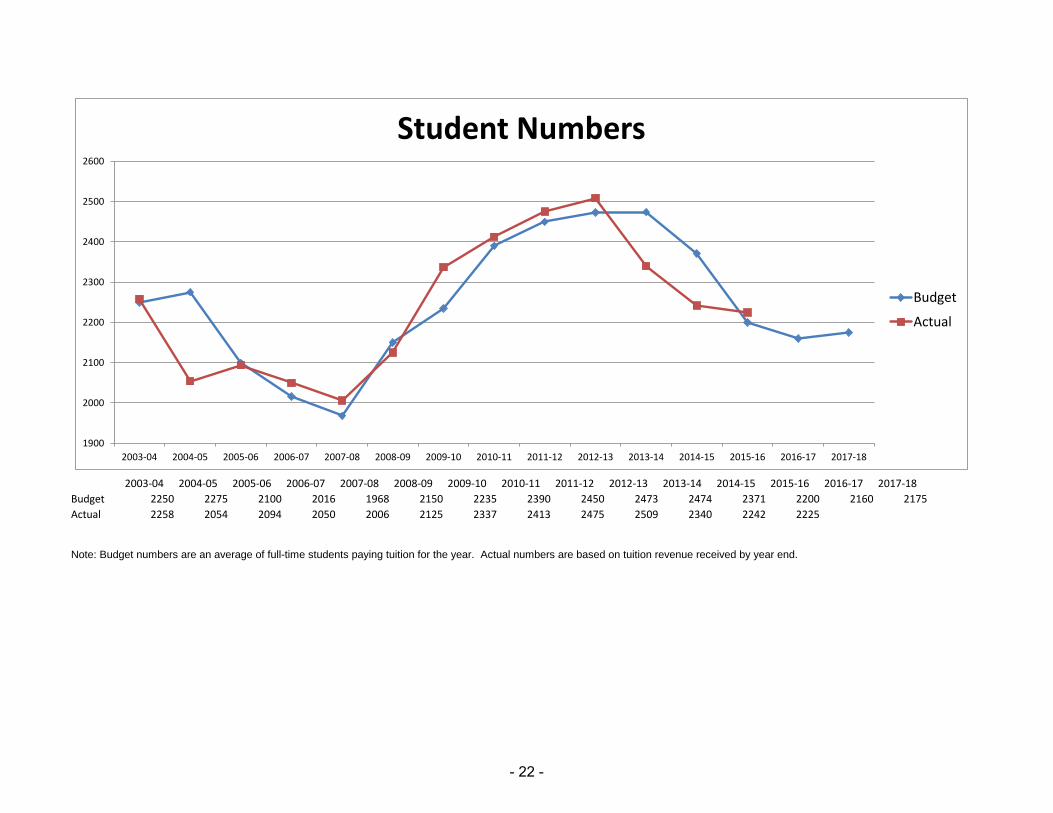
2003-04 2004-05 2005-06 2006-07 2007-08 2008-09 2009-10 2010-11 2011-12 2012-13 2013-14 2014-15 2015-16 2016-17 2017-18
Budget 2250 2275 2100 2016 1968 2150 2235 2390 2450 2473 2474 2371 2200 2160 2175
Actual 2258 2054 2094 2050 2006 2125 2337 2413 2475 2509 2340 2242 2225
Note: Budget numbers are an average of full-time students paying tuition for the year. Actual numbers are based on tuition revenue received by year end.
1900
2000
2100
2200
2300
2400
2500
2600
2003-04 2004-05 2005-06 2006-07 2007-08 2008-09 2009-10 2010-11 2011-12 2012-13 2013-14 2014-15 2015-16 2016-17 2017-18
Student Numbers
Budget
Actual
- 22 -