Embed Size (px)
Citation preview
Budget & Management Services
FY 2021 1st Quarter Financial Report
November 19, 2020
✔ The update reflects the Administration’s effort to continually monitor the City’s financial status and update City Council.
✔ It is very early in the fiscal year and a lot of uncertainty exists. Projections reflect staff’s best estimate given the information available.
✔ The next financial update will be given in February 2021 when we have more information.
2First Quarter Financial Report
FY 2021 Financial Update
General Fund
3First Quarter Financial Report
4
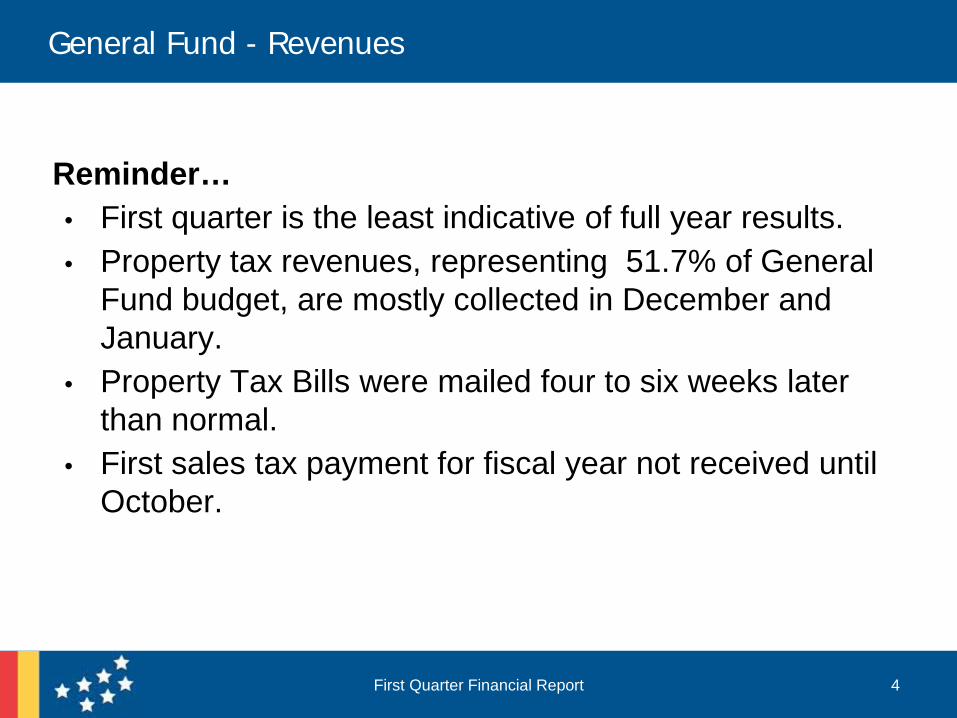
Reminder…• First quarter is the least indicative of full year results.• Property tax revenues, representing 51.7% of General
Fund budget, are mostly collected in December and January.
• Property Tax Bills were mailed four to six weeks later than normal.
• First sales tax payment for fiscal year not received until October.
First Quarter Financial Report
General Fund - Revenues
5
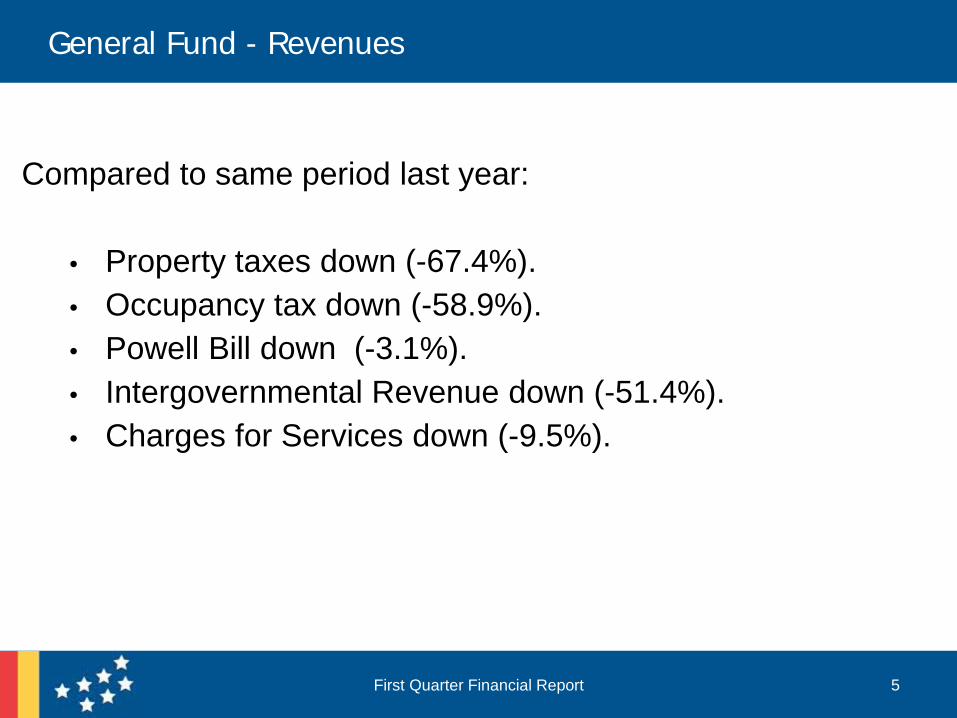
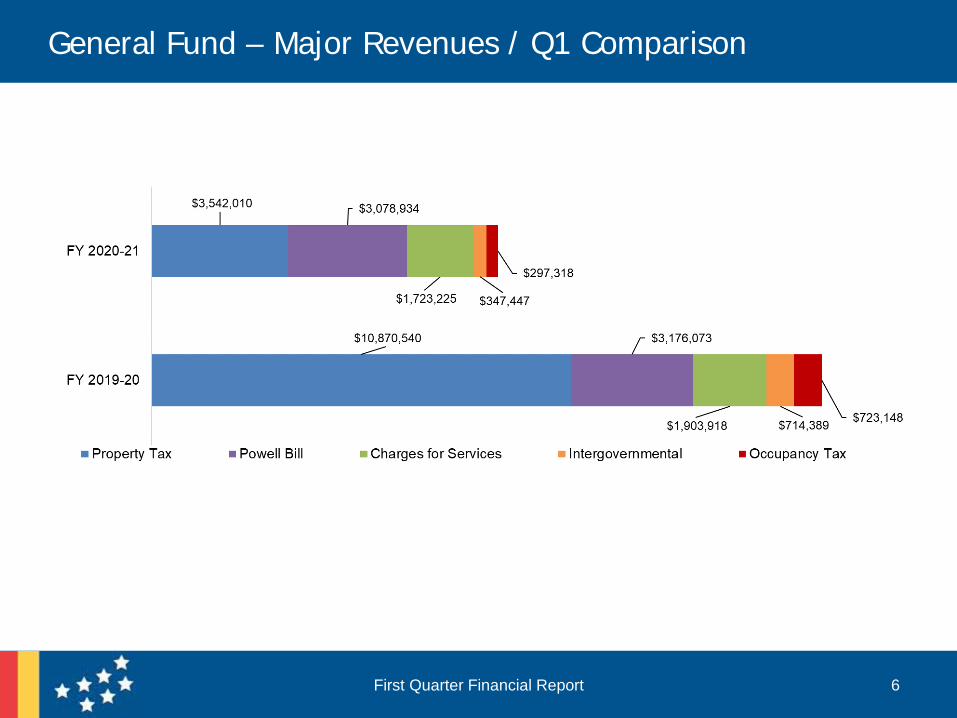
Compared to same period last year:
• Property taxes down (-67.4%).• Occupancy tax down (-58.9%).• Powell Bill down (-3.1%).• Intergovernmental Revenue down (-51.4%).• Charges for Services down (-9.5%).
First Quarter Financial Report
General Fund - Revenues
6First Quarter Financial Report
General Fund – Major Revenues / Q1 Comparison
7First Quarter Financial Report
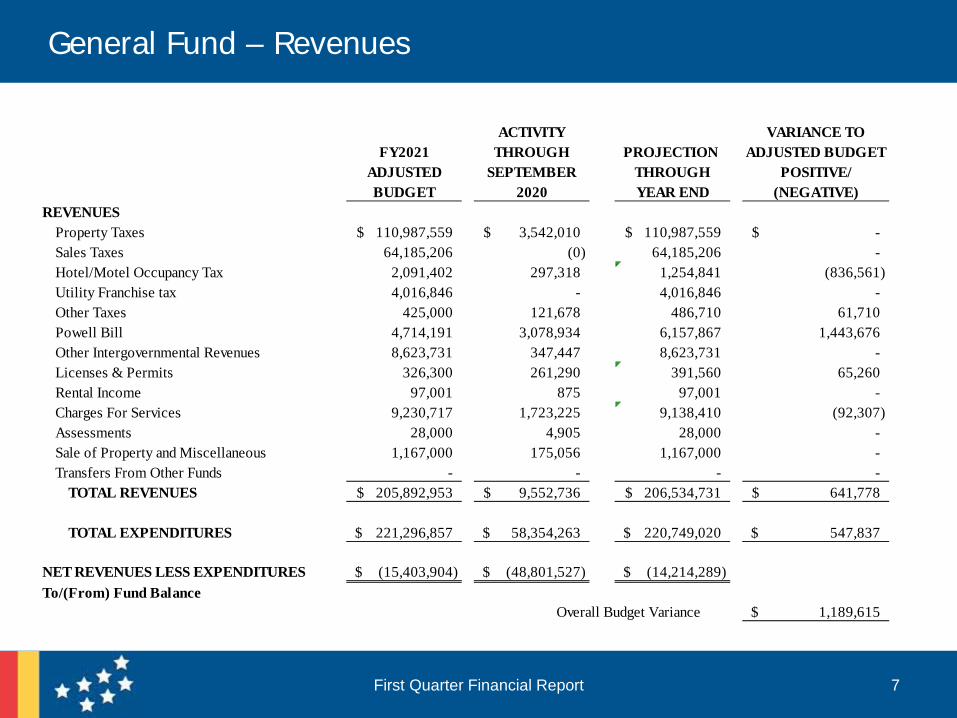
General Fund – Revenues
ACTIVITY VARIANCE TOFY2021 THROUGH PROJECTION ADJUSTED BUDGET
ADJUSTED SEPTEMBER THROUGH POSITIVE/BUDGET 2020 YEAR END (NEGATIVE)
REVENUESProperty Taxes 110,987,559$ 3,542,010$ 110,987,559$ -$ Sales Taxes 64,185,206 (0) 64,185,206 - Hotel/Motel Occupancy Tax 2,091,402 297,318 1,254,841 (836,561) Utility Franchise tax 4,016,846 - 4,016,846 - Other Taxes 425,000 121,678 486,710 61,710 Powell Bill 4,714,191 3,078,934 6,157,867 1,443,676 Other Intergovernmental Revenues 8,623,731 347,447 8,623,731 - Licenses & Permits 326,300 261,290 391,560 65,260 Rental Income 97,001 875 97,001 - Charges For Services 9,230,717 1,723,225 9,138,410 (92,307) Assessments 28,000 4,905 28,000 - Sale of Property and Miscellaneous 1,167,000 175,056 1,167,000 - Transfers From Other Funds - - - -
TOTAL REVENUES 205,892,953$ 9,552,736$ 206,534,731$ 641,778$
TOTAL EXPENDITURES 221,296,857$ 58,354,263$ 220,749,020$ 547,837$
NET REVENUES LESS EXPENDITURES (15,403,904)$ (48,801,527)$ (14,214,289)$ To/(From) Fund Balance
Overall Budget Variance 1,189,615$
8
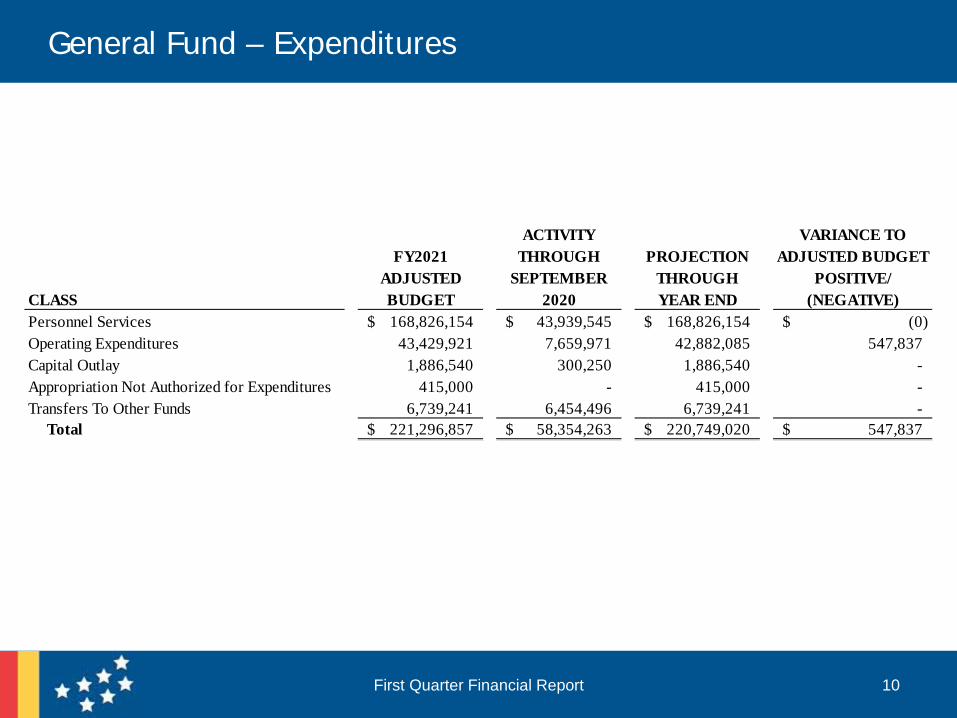
• Year-end operations spending projected at $548K less than budgeted:– Personnel costs at budget– Operating and capital costs under budget by
$548K
• No departments are projected to exceed budget
First Quarter Financial Report
General Fund – Expenditures
9First Quarter Financial Report
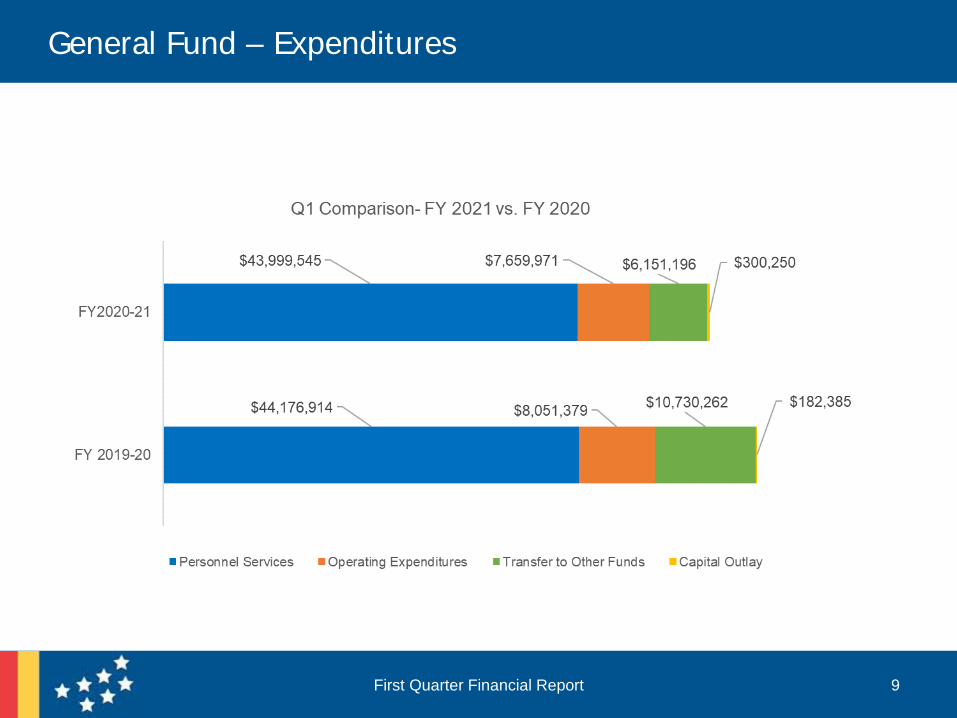
General Fund – Expenditures
10First Quarter Financial Report
General Fund – Expenditures
ACTIVITY VARIANCE TOFY2021 THROUGH PROJECTION ADJUSTED BUDGET
ADJUSTED SEPTEMBER THROUGH POSITIVE/CLASS BUDGET 2020 YEAR END (NEGATIVE)Personnel Services 168,826,154$ 43,939,545$ 168,826,154$ (0)$ Operating Expenditures 43,429,921 7,659,971 42,882,085 547,837 Capital Outlay 1,886,540 300,250 1,886,540 - Appropriation Not Authorized for Expenditures 415,000 - 415,000 - Transfers To Other Funds 6,739,241 6,454,496 6,739,241 - Total 221,296,857$ 58,354,263$ 220,749,020$ 547,837$
Enterprise Funds
11First Quarter Financial Report
12
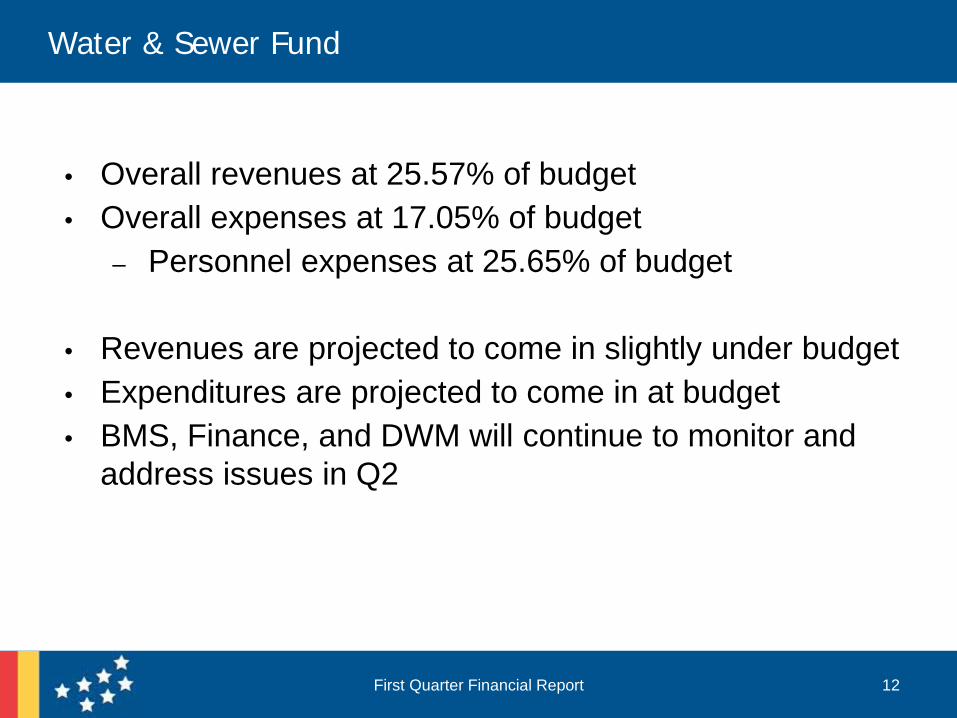
• Overall revenues at 25.57% of budget• Overall expenses at 17.05% of budget
– Personnel expenses at 25.65% of budget
• Revenues are projected to come in slightly under budget• Expenditures are projected to come in at budget• BMS, Finance, and DWM will continue to monitor and
address issues in Q2
First Quarter Financial Report
Water & Sewer Fund
13First Quarter Financial Report
Water & Sewer Fund - Revenues
ACTIVITY VARIANCE TOFY2021 THROUGH PROJECTION ADJUSTED BUDGET
ADJUSTED SEPTEMBER THROUGH POSITIVE/BUDGET 2020 YEAR END (NEGATIVE)
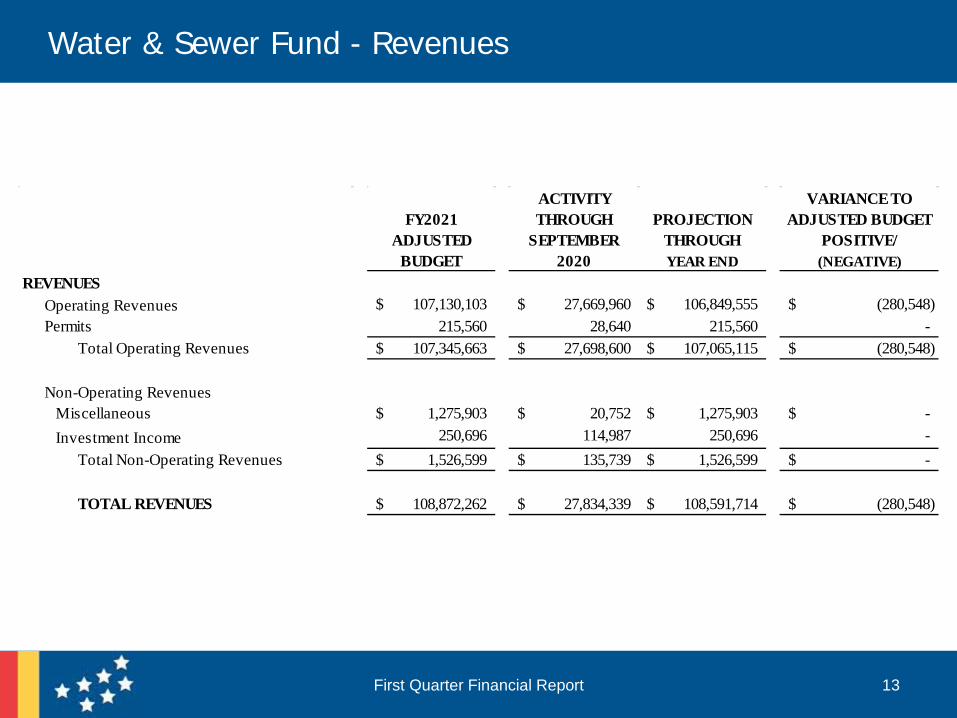
REVENUESOperating Revenues 107,130,103$ 27,669,960$ 106,849,555$ (280,548)$ Permits 215,560 28,640 215,560 -
Total Operating Revenues 107,345,663$ 27,698,600$ 107,065,115$ (280,548)$
Non-Operating RevenuesMiscellaneous 1,275,903$ 20,752$ 1,275,903$ -$ Investment Income 250,696 114,987 250,696 -
Total Non-Operating Revenues 1,526,599$ 135,739$ 1,526,599$ -$
TOTAL REVENUES 108,872,262$ 27,834,339$ 108,591,714$ (280,548)$
14First Quarter Financial Report
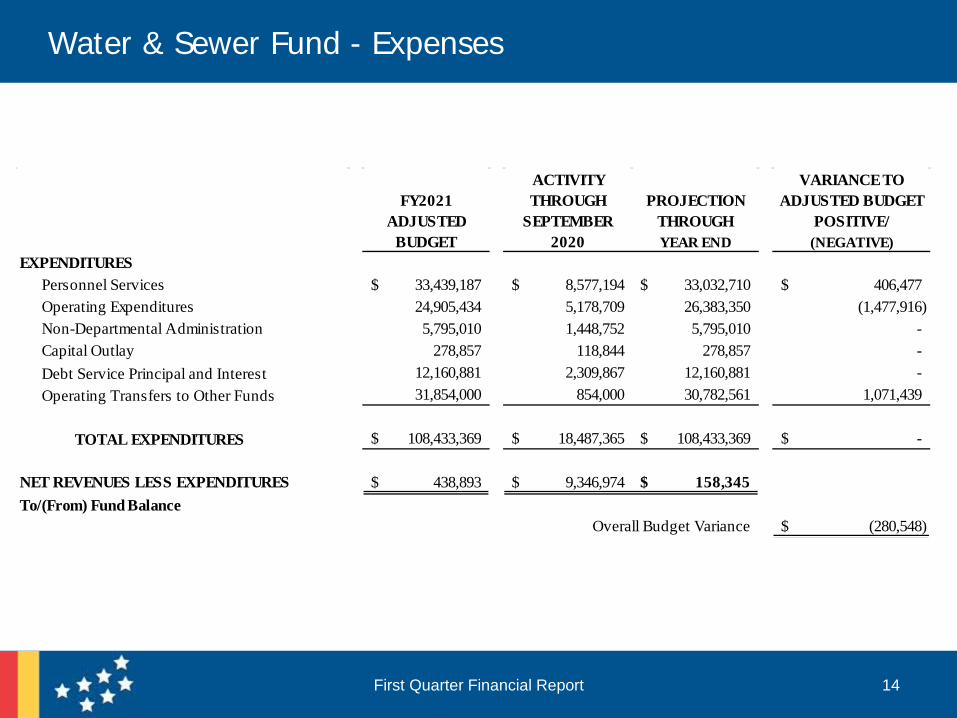
Water & Sewer Fund - Expenses
ACTIVITY VARIANCE TOFY2021 THROUGH PROJECTION ADJUSTED BUDGET
ADJUSTED SEPTEMBER THROUGH POSITIVE/BUDGET 2020 YEAR END (NEGATIVE)
EXPENDITURESPersonnel Services 33,439,187$ 8,577,194$ 33,032,710$ 406,477$ Operating Expenditures 24,905,434 5,178,709 26,383,350 (1,477,916) Non-Departmental Administration 5,795,010 1,448,752 5,795,010 - Capital Outlay 278,857 118,844 278,857 - Debt Service Principal and Interest 12,160,881 2,309,867 12,160,881 - Operating Transfers to Other Funds 31,854,000 854,000 30,782,561 1,071,439
TOTAL EXPENDITURES 108,433,369$ 18,487,365$ 108,433,369$ -$
NET REVENUES LESS EXPENDITURES 438,893$ 9,346,974$ 158,345$ To/(From) Fund Balance
Overall Budget Variance (280,548)$
15
• Transit Operations Fund overall expected to operate under budget due to CARES grant funding; and anticipates coming in under adjusted budget by $7.2M.
• Revenues will continue to be under budget until such time as COVID related fare free changes are lifted.
• State funding will not be received during FY21 due to cuts.
• Tax rate of 3.75 cents per $100 (about $13.5M) is budgeted in the Transit Fund.
First Quarter Financial Report
Transit Operations Fund
16First Quarter Financial Report
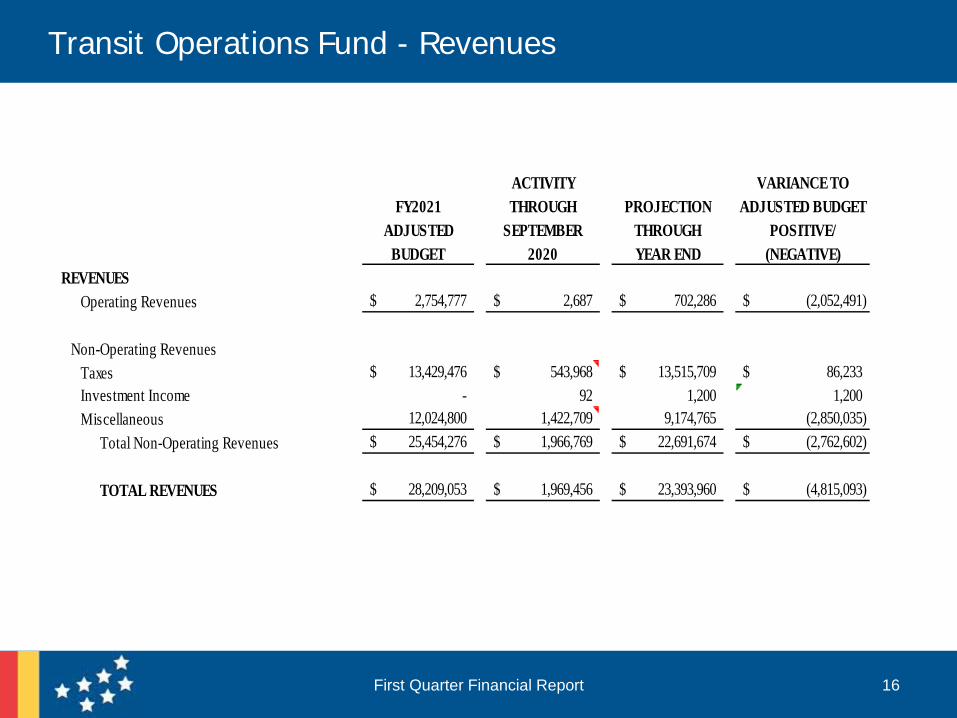
Transit Operations Fund - Revenues
ACTIVITY VARIANCE TOFY2021 THROUGH PROJECTION ADJUSTED BUDGET
ADJUSTED SEPTEMBER THROUGH POSITIVE/BUDGET 2020 YEAR END (NEGATIVE)
REVENUESOperating Revenues 2,754,777$ 2,687$ 702,286$ (2,052,491)$
Non-Operating RevenuesTaxes 13,429,476$ 543,968$ 13,515,709$ 86,233$ Investment Income - 92 1,200 1,200 Miscellaneous 12,024,800 1,422,709 9,174,765 (2,850,035)
Total Non-Operating Revenues 25,454,276$ 1,966,769$ 22,691,674$ (2,762,602)$
TOTAL REVENUES 28,209,053$ 1,969,456$ 23,393,960$ (4,815,093)$
17First Quarter Financial Report
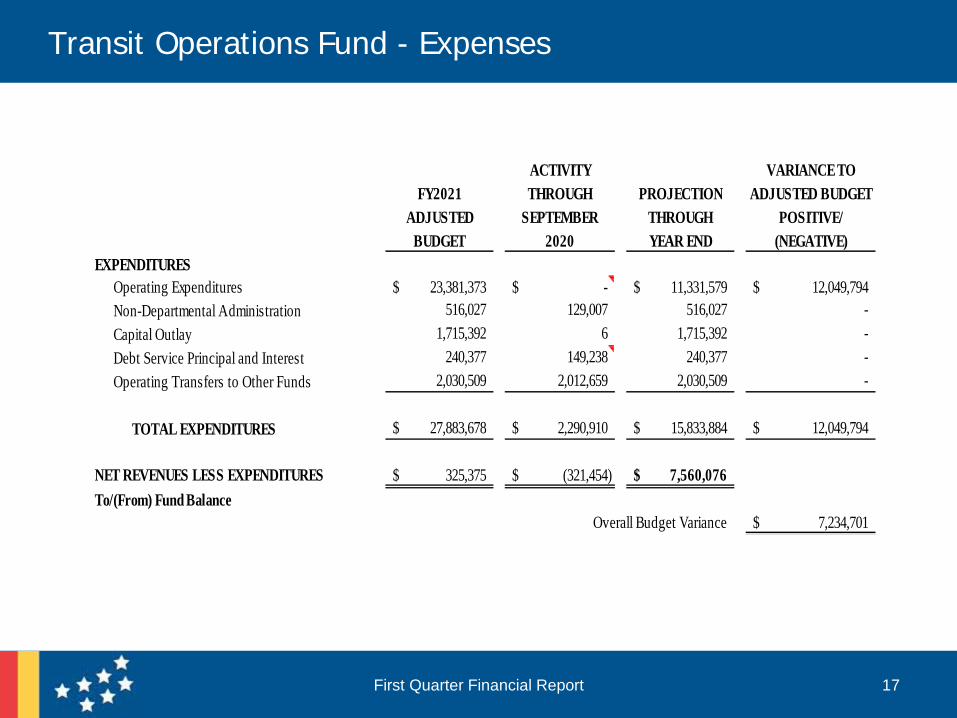
Transit Operations Fund - Expenses
ACTIVITY VARIANCE TOFY2021 THROUGH PROJECTION ADJUSTED BUDGET
ADJUSTED SEPTEMBER THROUGH POSITIVE/BUDGET 2020 YEAR END (NEGATIVE)
EXPENDITURESOperating Expenditures 23,381,373$ -$ 11,331,579$ 12,049,794$ Non-Departmental Administration 516,027 129,007 516,027 - Capital Outlay 1,715,392 6 1,715,392 - Debt Service Principal and Interest 240,377 149,238 240,377 - Operating Transfers to Other Funds 2,030,509 2,012,659 2,030,509 -
TOTAL EXPENDITURES 27,883,678$ 2,290,910$ 15,833,884$ 12,049,794$
NET REVENUES LESS EXPENDITURES 325,375$ (321,454)$ 7,560,076$ To/(From) Fund Balance
Overall Budget Variance 7,234,701$
18
• Operating revenues under original budget mostly due to COVID-19.
• Personnel expenditures projected slightly over budget and operating expenditures under budget.
• Solid Waste Fund originally budgeted to receive 31% of revenues from charges and other non-tax revenues.
• Remaining revenue is provided by allocating 5.59 cents of tax rate.
First Quarter Financial Report
Solid Waste Fund
19First Quarter Financial Report
Solid Waste Fund - Revenues
ACTIVITY VARIANCE TOFY2021 THROUGH PROJECTION ADJUSTED BUDGET
ADJUSTED SEPTEMBER THROUGH POSITIVE/BUDGET 2020 YEAR END (NEGATIVE)
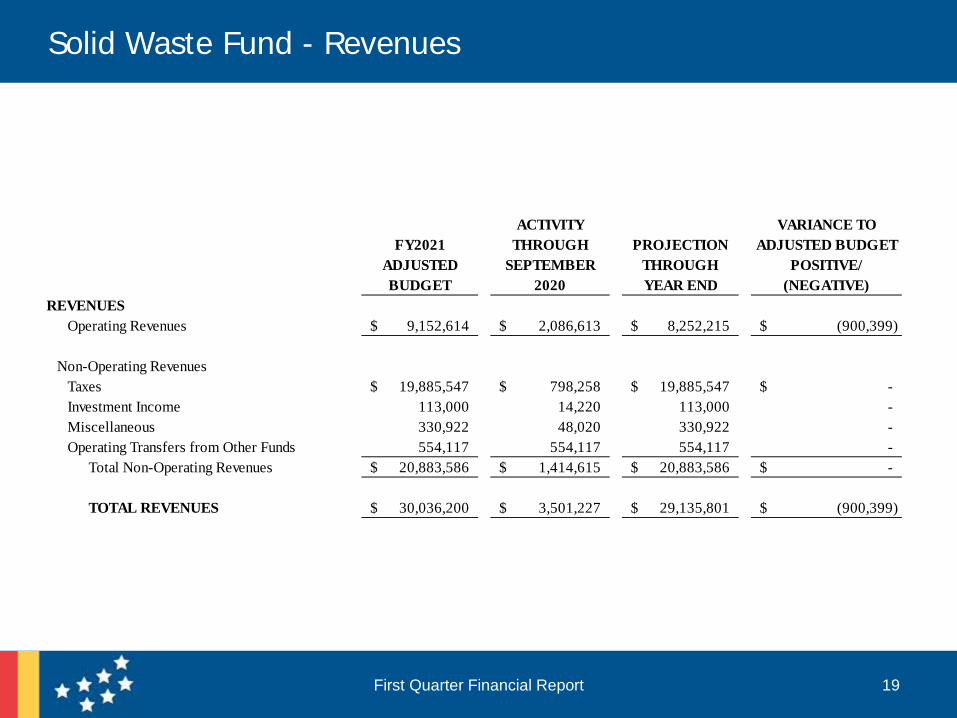
REVENUESOperating Revenues 9,152,614$ 2,086,613$ 8,252,215$ (900,399)$
Non-Operating Revenues Taxes 19,885,547$ 798,258$ 19,885,547$ -$
Investment Income 113,000 14,220 113,000 - Miscellaneous 330,922 48,020 330,922 - Operating Transfers from Other Funds 554,117 554,117 554,117 -
Total Non-Operating Revenues 20,883,586$ 1,414,615$ 20,883,586$ -$
TOTAL REVENUES 30,036,200$ 3,501,227$ 29,135,801$ (900,399)$
20First Quarter Financial Report
Solid Waste Fund - Expenses
ACTIVITY VARIANCE TOFY2021 THROUGH PROJECTION ADJUSTED BUDGET
ADJUSTED SEPTEMBER THROUGH POSITIVE/BUDGET 2020 YEAR END (NEGATIVE)
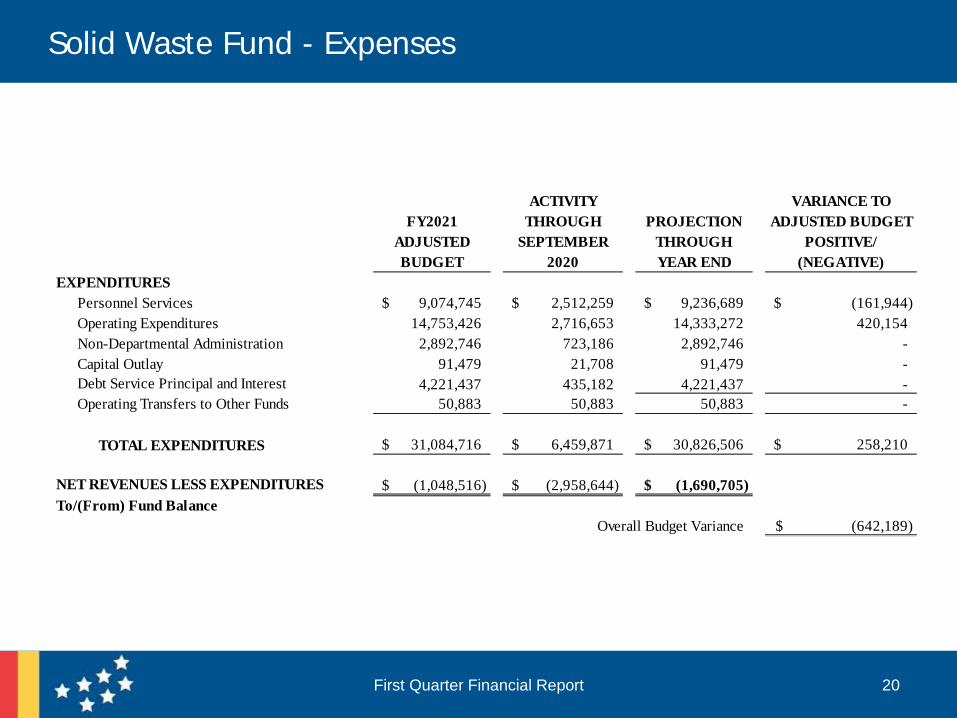
EXPENDITURESPersonnel Services 9,074,745$ 2,512,259$ 9,236,689$ (161,944)$ Operating Expenditures 14,753,426 2,716,653 14,333,272 420,154 Non-Departmental Administration 2,892,746 723,186 2,892,746 - Capital Outlay 91,479 21,708 91,479 - Debt Service Principal and Interest 4,221,437 435,182 4,221,437 - Operating Transfers to Other Funds 50,883 50,883 50,883 -
TOTAL EXPENDITURES 31,084,716$ 6,459,871$ 30,826,506$ 258,210$
NET REVENUES LESS EXPENDITURES (1,048,516)$ (2,958,644)$ (1,690,705)$ To/(From) Fund Balance
Overall Budget Variance (642,189)$
21
• Provides for the management and maintenance of operational expenses of stormwater activities which include street cleaning.
• The fund is a self-sufficient enterprise fund and receives no tax support.
• At quarter-one, the Stormwater Fund has received 19.48% of projected revenues. Fund anticipating deficit due to revenue actuals and an increase in capital infrastructure expeditures.
First Quarter Financial Report
Stormwater Fund
22First Quarter Financial Report
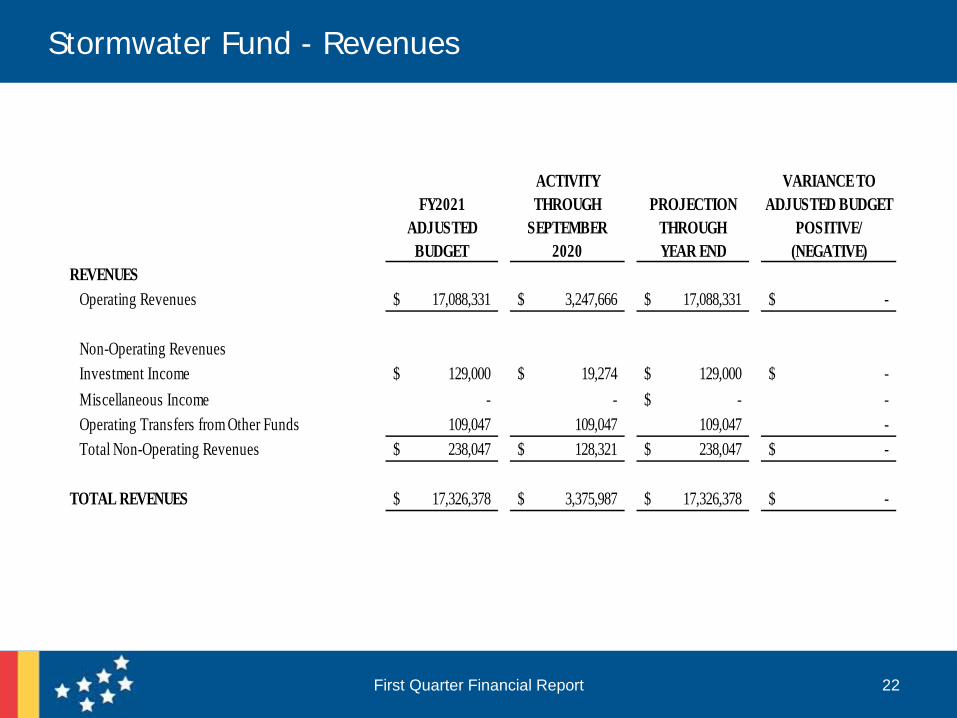
Stormwater Fund - Revenues
ACTIVITY VARIANCE TOFY2021 THROUGH PROJECTION ADJUSTED BUDGET
ADJUSTED SEPTEMBER THROUGH POSITIVE/BUDGET 2020 YEAR END (NEGATIVE)
REVENUESOperating Revenues 17,088,331$ 3,247,666$ 17,088,331$ -$
Non-Operating RevenuesInvestment Income 129,000$ 19,274$ 129,000$ -$ Miscellaneous Income - - -$ - Operating Transfers from Other Funds 109,047 109,047 109,047 - Total Non-Operating Revenues 238,047$ 128,321$ 238,047$ -$
TOTAL REVENUES 17,326,378$ 3,375,987$ 17,326,378$ -$
23First Quarter Financial Report
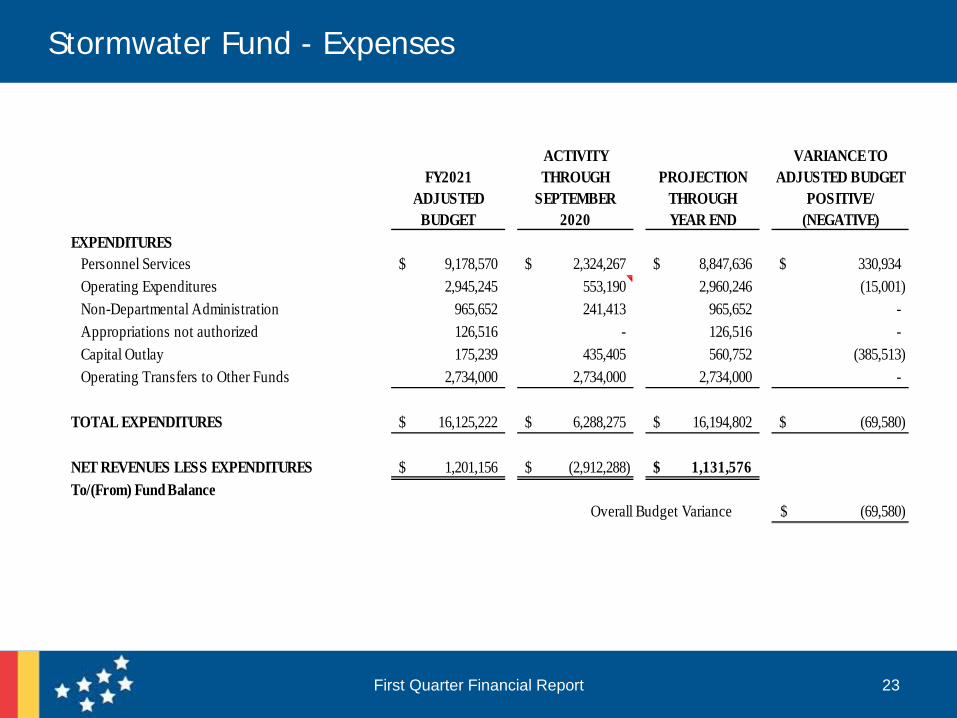
Stormwater Fund - Expenses
ACTIVITY VARIANCE TOFY2021 THROUGH PROJECTION ADJUSTED BUDGET
ADJUSTED SEPTEMBER THROUGH POSITIVE/BUDGET 2020 YEAR END (NEGATIVE)
EXPENDITURESPersonnel Services 9,178,570$ 2,324,267$ 8,847,636$ 330,934$ Operating Expenditures 2,945,245 553,190 2,960,246 (15,001) Non-Departmental Administration 965,652 241,413 965,652 - Appropriations not authorized 126,516 - 126,516 - Capital Outlay 175,239 435,405 560,752 (385,513) Operating Transfers to Other Funds 2,734,000 2,734,000 2,734,000 -
TOTAL EXPENDITURES 16,125,222$ 6,288,275$ 16,194,802$ (69,580)$
NET REVENUES LESS EXPENDITURES 1,201,156$ (2,912,288)$ 1,131,576$ To/(From) Fund Balance
Overall Budget Variance (69,580)$
24
• The Parking fund operating revenues fully cover fund operating expenses.
• Debt Service Fund subsidizes the existing debt portion of the fund.
• Parking Fund is overall anticipated to operate significantly negative budget variance due to COVID-19.
First Quarter Financial Report
Parking Fund
25First Quarter Financial Report
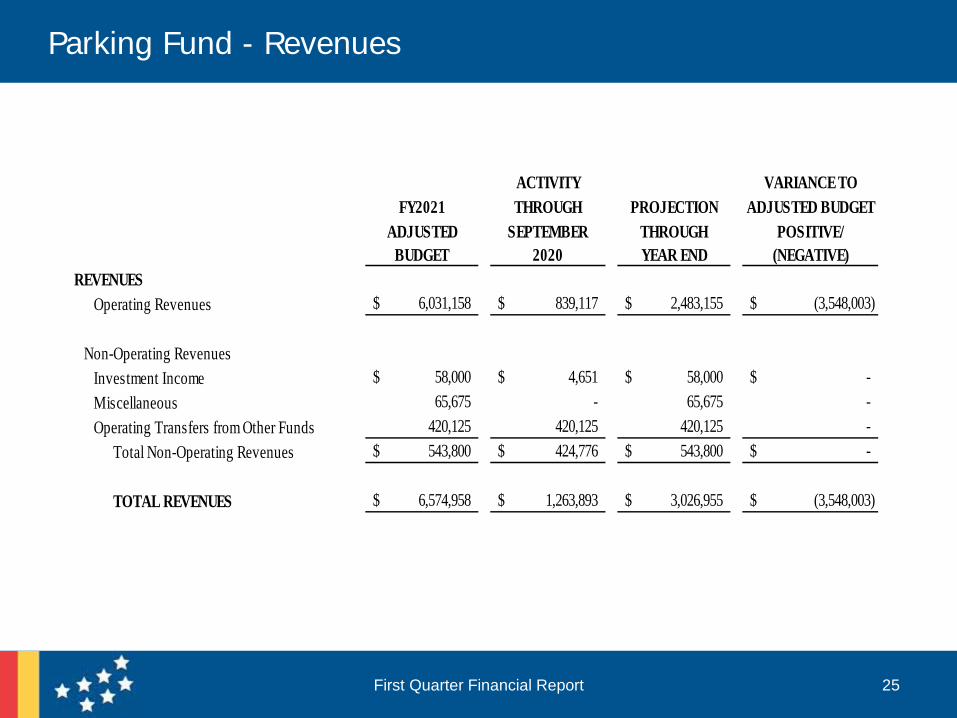
Parking Fund - Revenues
ACTIVITY VARIANCE TOFY2021 THROUGH PROJECTION ADJUSTED BUDGET
ADJUSTED SEPTEMBER THROUGH POSITIVE/BUDGET 2020 YEAR END (NEGATIVE)
REVENUESOperating Revenues 6,031,158$ 839,117$ 2,483,155$ (3,548,003)$
Non-Operating RevenuesInvestment Income 58,000$ 4,651$ 58,000$ -$ Miscellaneous 65,675 - 65,675 - Operating Transfers from Other Funds 420,125 420,125 420,125 -
Total Non-Operating Revenues 543,800$ 424,776$ 543,800$ -$
TOTAL REVENUES 6,574,958$ 1,263,893$ 3,026,955$ (3,548,003)$
26First Quarter Financial Report
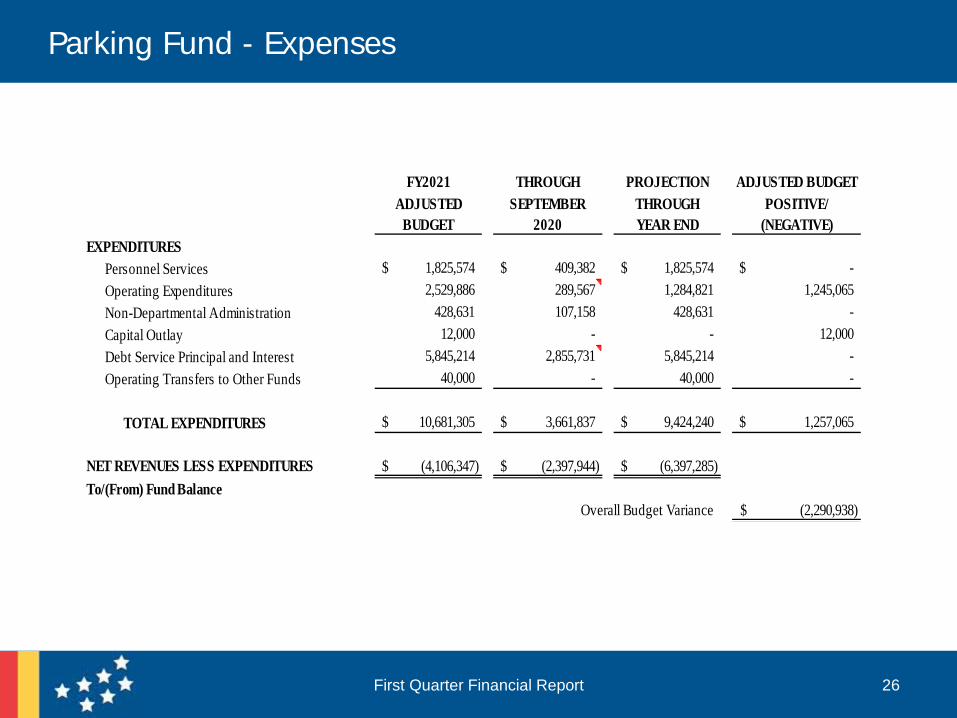
Parking Fund - Expenses
FY2021 THROUGH PROJECTION ADJUSTED BUDGETADJUSTED SEPTEMBER THROUGH POSITIVE/
BUDGET 2020 YEAR END (NEGATIVE)EXPENDITURES
Personnel Services 1,825,574$ 409,382$ 1,825,574$ -$ Operating Expenditures 2,529,886 289,567 1,284,821 1,245,065 Non-Departmental Administration 428,631 107,158 428,631 - Capital Outlay 12,000 - - 12,000 Debt Service Principal and Interest 5,845,214 2,855,731 5,845,214 - Operating Transfers to Other Funds 40,000 - 40,000 -
TOTAL EXPENDITURES 10,681,305$ 3,661,837$ 9,424,240$ 1,257,065$
NET REVENUES LESS EXPENDITURES (4,106,347)$ (2,397,944)$ (6,397,285)$ To/(From) Fund Balance
Overall Budget Variance (2,290,938)$
27
• Provides for support of the Inspections Department and other inspection related activities.
• The Inspections fund operating revenues fully cover fund operating expenses.
• At quarter-one, the Inspections fund has received 28% of revenues. The fund is projected to end the year with surplus.
First Quarter Financial Report
Inspections Fund
28First Quarter Financial Report
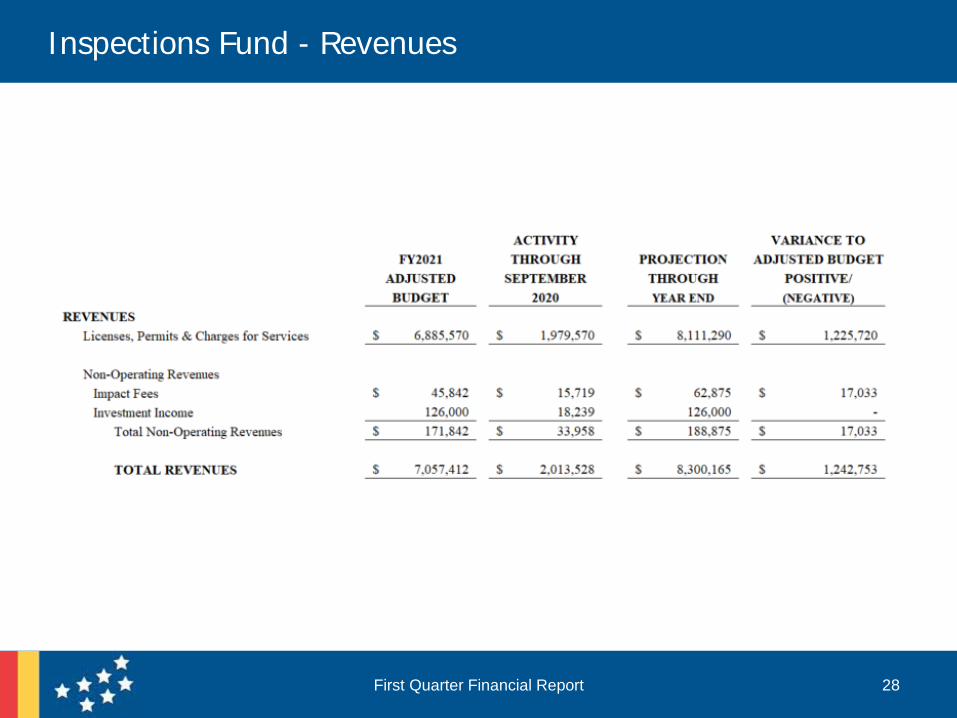
Inspections Fund - Revenues
29First Quarter Financial Report
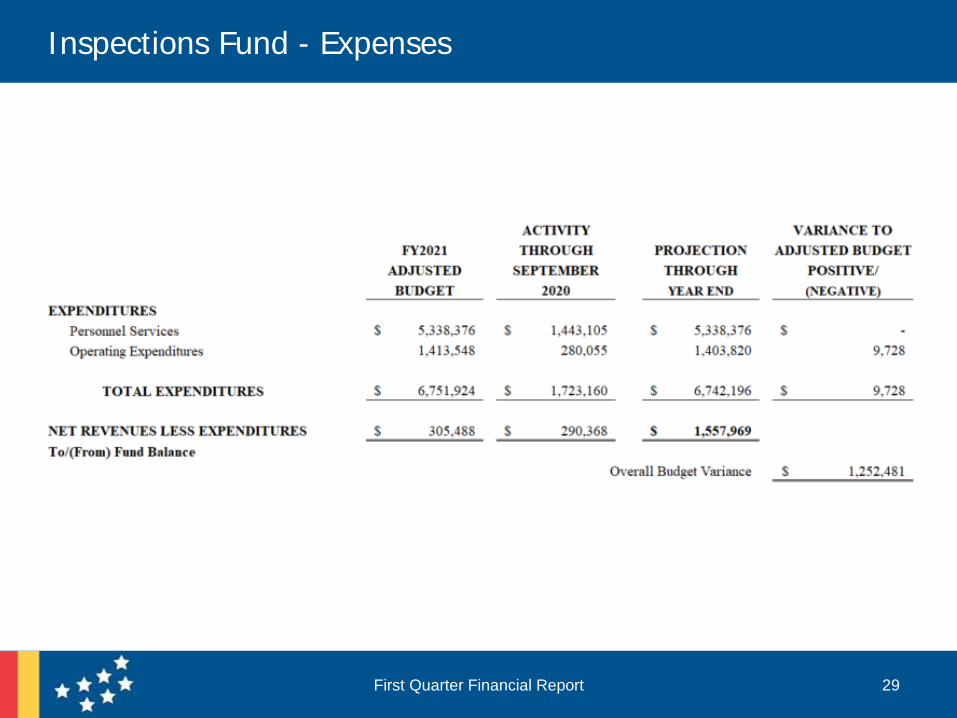
Inspections Fund - Expenses
30
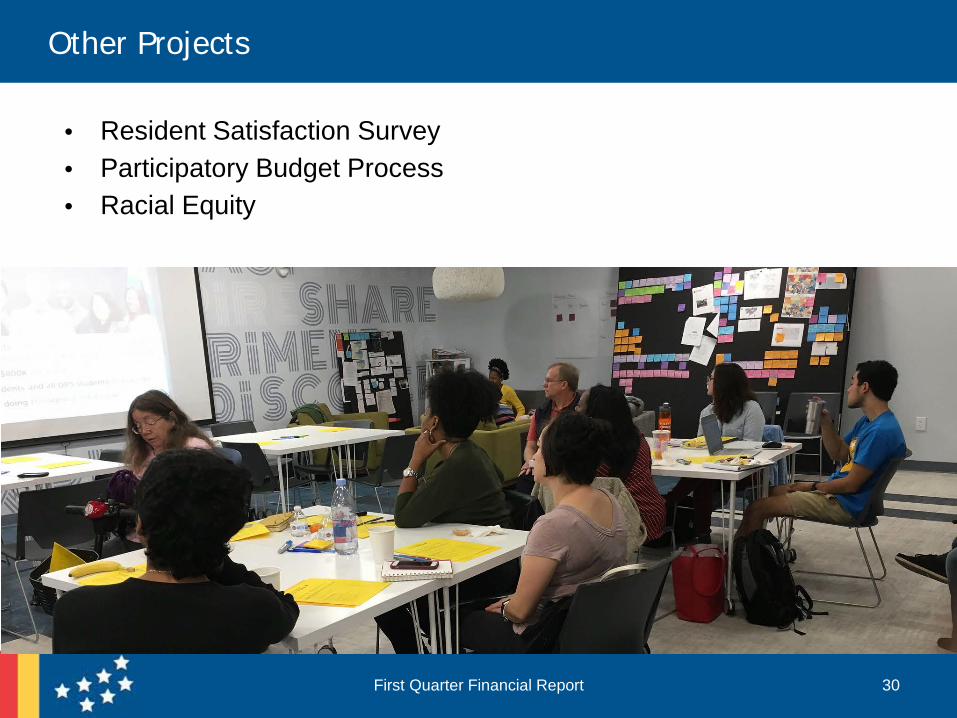
• Resident Satisfaction Survey• Participatory Budget Process• Racial Equity
First Quarter Financial Report
Other Projects