Embed Size (px)
Citation preview
ACODE Policy Research Paper Series No.104, 2021
A SYNTHESIS REPORT
BUDGET AND SERVICE DELIVERY MONITORING EXERCISES
Daniel Lukwago
Published by ACODE P. O. Box 29836, Kampala Email: [email protected]; [email protected] Website: http://www.acode-u.org
CitationLukwago, D. (2021). Budget and Service Delivery Monitoring Exercises: A Synthesis Report, Kampala, ACODE Policy Research Paper Series No.104.© ACODE 2021 All rights reserved. No part of this publication may be reproduced, stored in a retrieval system or transmitted in any form or by any means electronic, mechanical, photocopying, recording or otherwise without the prior written permission of the publisher. ACODE policy work is supported by generous donations and grants from bilateral donors and charitable foundations. Reproduction or use of this publication for academic or charitable purposes or for purposes of informing public policy is excluded from this restriction.ISBN 978 9970 56 726 3
ACODE Policy Research Paper Series No.104, 2021
A SYNTHESIS REPORT
Daniel Lukwago
BUDGET AND SERVICE DELIVERY MONITORING EXERCISES
i
Budget and Service Delivery Monitoring Exercises
CONTENTS
ACKNOWLEDGEMENTS ......................................................................................... III
LIST OF ACRONYMS ............................................................................................... IV
EXECUTIVE SUMMARY ......................................................................................... VI
1.0 INTRODUCTION .................................................................................................. 11.1 Background and Context ....................................................................................................... 11.2 Objectives ................................................................................................................................... 21.3 Methodology .............................................................................................................................. 2
2.0 LOCAL GOVERNMENT BUDGET PERFORMANCE ...........................................32.1 Trends in District Budget Allocations ................................................................................ 32.2 Trends in District Spending ................................................................................................... 42.3 Trends in District Budget Allocations ................................................................................ 42.4 Trends in Agriculture Spending ........................................................................................... 52.5 Trends in Education Spending ............................................................................................. 62.6 Trends in Health Spending .................................................................................................... 72.7 Trends in Roads Spending ..................................................................................................... 92.8 Trends in Water Spending ...................................................................................................102.9 Absorption Challenges ........................................................................................................12
3.0 EFFECTS OF PUBLIC FINANCIAL MANAGEMENT REFORMS ON LOCAL GOVERNMENT ..................................................................................................14
3.1 Public Financial Management (PFM) Reforms ...........................................................143.2 Impact of the Reforms on Service Delivery ..................................................................173.3 Strengths and Weaknesses of PFM Reforms ..............................................................18
4.0 PERSPECTIVES OF USERS ON PUBLIC SERVICES .................................... 224.1 Perceptions on the Agriculture, Health, Roads, and Education Sectors ............224.3 Challenges Faced in the Provision of Services ...........................................................244.4 Assessment of Accountability Mechanisms .................................................................255.1 Conclusion .................................................................................................................................285.2 Recommendations .................................................................................................................28
REFERENCES ......................................................................................................... 30
ANNEXES .................................................................................................................01

ii
Budget and Service Delivery Monitoring Exercises
LIST OF FIGURESFigure 1: Trends in District Budgeting and spending (average for the 26 districts) 4Figure 2: Trends in District Absorption rates (average for the 26 districts) ............... 6Figure 3: Trends in District Agriculture budget and spending (average for the 26
districts) ........................................................................................................................................ 8Figure 4: Trends in Agriculture Budget spending rates (average for the 26
districts) ........................................................................................................................................ 9Figure 5: Trends in District Education budget and spending (average for the 26
districts) ......................................................................................................................................10Figure 6: Trends in Health Budget Absorption rates (average for the 26 districts) ...
11Figure 7: Trends in District Health budget and spending (average for the 26
districts) ......................................................................................................................................12Figure 8: Trends in Roads Budget Absorption rates (average for the 26 districts) 13Figure 9: Trends in District Roads budget and spending (average for the 26
districts) ......................................................................................................................................14Figure 10: Trends in Roads Budget Absorption rates (average for the 26 districts) .
15Figure 11: Trends in District Water budget and spending (average for the 26
districts) ......................................................................................................................................16Figure 12: Trends in Roads Budget Absorption rates (average for the 26 districts) .
17Figure 13: Trends in Supplementary Budgets .....................................................................27
LIST OF TABLESTable 1: Trends in District Budgets and Spending (averages for the 26 districts) ... 6Table 2: Rating of Services at Health Centers .....................................................................31
iii
Budget and Service Delivery Monitoring Exercises
ACKNOWLEDGEMENTS ACODE acknowledges the invaluable contribution of both individuals and organizations that made this work possible. Foremost is the Hewlett Foundation for providing funding and the Ministry of Ministry of Finance, Planning and Economic Development for the cooperation and coordination of the Budget Transparency Initiative (BTI); the entire ACODE Research team especially Dr. Arthur Bainomugisha, Prof. Wilson Winstons Muhwezi, Mr. George Bogere and Emmanuel Keith Kisaame, for their insight into this publication.Also, the contribution of the various Local Government political and technical leaders in the districts covered by ACODE’s Budget and Service Delivery Monitoring Exercises (BMSDE) is appreciated. Their views and perspectives were pivotal in framing the arguments and conclusions embedded in this publication. ACODE is convinced that this publication will be instrumental in informing public financial management, especially, in relation to the transfers of funds to the Local Governments.
iv
Budget and Service Delivery Monitoring Exercises
LIST OF ACRONYMSACODE Advocates Coalition for Development and EnvironmentAMP Aid Management PlatformBCN Budget Champion NetworkBSDME Budget and Service Deliver Monitoring ExerciseBTI Budget Transparency InitiativeCAO Chief Administrative OfficerCBEG Center for Budget and Economic Governance CBOs Community Based OrganisationsCDO Community Development OfficerCG Central GovernmentCSO Civil Society OrganizationDCDO District Community Development Officer DHO District Health Officer EAC East African CommunityEFT Electronic Funds TransferFY Financial YearHSDP Health Sector Development PlanHUMC Health Unit Management CommitteeIFMS Integrated Financial Management SystemIPFs Indicative Planning FiguresLCV Local Council 5LG Local GovernmentLGA Local Government Act LGPAC Local Government Public Accounts CommitteeMDAs Ministries Departments and AgenciesMoFPED Ministry of Finance, Planning and Economic DevelopmentMoLG Ministry of Local Government NDP National Development Plan NGO Non-Government Organisation
v
Budget and Service Delivery Monitoring Exercises
NPA National Planning AuthorityNPPAs National Priority Programme Areas OAG Office of the Auditor GeneralOBT Output Based BudgetingODI Overseas Development InstitutePAC Public Accounts CommitteePBB Performance Based BudgetingPBS Program Budgeting System PFM Public Finance ManagementPFMRS Public Financial Management Reform StrategySMC School Management CommitteeSTA Single Treasury AccountSTP Straight Through ProcessingUDHS Uganda Demographic Household Survey
vi
Budget and Service Delivery Monitoring Exercises
EXECUTIVE SUMMARY This Budget Champions Network (BCN) report is a synthesis of six Budget and Service Delivery Monitoring Exercises (BSDMEs) by the Advocates Coalition for Development and Environment (ACODE) and its partners between FY 2018/19 and FY 2020/21. The focus was mainly on three aspects: the display of information on grants; timeliness of the transfer of funds to districts and Sub-Counties; and assessing capabilities for service delivery in roads, health and agricultural extension services. The exercise covered 27 districts across Uganda namely: Agago, Amuru, Bududa, Buliisa, Gulu, Hoima, Jinja, Kabarole, Kamuli, Lira, Luweero, Mbale, Mbarara, Mpigi, Mukono, Nakapipirit, Nebbi, Ntungamo, Rukungiri, Soroti, Tororo, Amuria, Moyo, Moroto, Wakiso, Masindi and Kanungu. Data was collected using observation and semi-structured questionnaires. In nominal terms, the average total budget for the 26 districts declined from UGX 29 billion in 2017/18 to UGX 25 billion in 2019/20. In terms of spending, the average total spending for the 26 districts declined from UGX 27 billion in 2017/18 to UGX 23 billion in 2019/20. The decline in the budgets and spending can be attributed to factors such as the decline in local revenues, but most significantly the decline in Central Government transfers since all LGs largely depended on this source or revenue to finance their budgets. However, the largest proportion of CG transfers was conditional in nature and given the conditions attached, districts lacked the discretionary powers to allocate resources to ensure that the peculiar needs of their citizens were met.The budget allocations by Local Governments (LGs) were dominated by social services, namely, education and health followed by roads, agriculture and water. The absorption rate for funds increased from 92 % in 2017/18 to 95% in FY 2018/19 before dipping to 89% in 2019/20, although the releases were higher, averaging 97% for these three financial years (FYs). The constraints to absorption of funds ranged from procurement and contracting delays to late releases nested with lengthy bureaucratic requisition procedures and political interference.Over the last decade under review, Central Government has implemented various Public Finance Management (PFM) reforms which included among others: Integrated Finance Management System (IFMS); Treasury Single Account and Straight Through Processing of Salaries and Pensions (STP) and Electronic Funds Transfer (EFT); Decentralization Policy for Salaries and Pension; Public Finance Management (PFM) Act 2015; Programme Based Budgeting (PBB); Integrated Personnel and Payroll System (IPPS); and Independence of office of the Auditor General (OAG). These reforms led to greater predictability of funds, more order in the budget process and alignment of the national and sector plans and budgets with the National Development Plan (NDP) as well as greater budget transparency.
vii
Budget and Service Delivery Monitoring Exercises
The reports indicated that although there were some improvements, late release of funds by MoFPED to LGs was still a big challenge. The failure to disburse funds in timely manner had major negative impact on service delivery to the citizens. In addition, the display of budget releases on district and sub-county notice boards was irregular and or totally missing in some LG and service centres. This made it difficult for the citizens to monitor service delivery in their communities.It is against these findings, that this report recommends the following:
1. The MoFPED should reduce the number of LG transfers, through full implementation of the Fiscal Decentralization Strategy (FDS).
2. MoFPED needs to harmonize the funds transfer systems so that service delivery units receive funds within the first week of any quarter.
3. MoFPED should set distinct and strict penalties for non-adherence to the requirement to display Budget, pension and Payroll information.
4. MoFPED, MDAs and LGs should explore production of simplified versions of the selected budget documents to make them more accessible to citizens, and where possible, to translate them in target local languages to increase access to budget information to local Councillors and other citizen groups.
5. MoFPED should strengthen the budget processes, credibility and compliance with existing PFM regulations.
6. The MoLG needs to strengthen the role of the District Councils in Public Financial Management by clarifying the role of Local Government Public Accounts Committee (LGPACs) in audit and reporting monitoring compliance.
7. LGs should monitor the utilisation of monies sent to them to ensure efficient allocation of these funds.
8. The Local Governance Sector needs to work with the National Planning Authority (NPA) to ensure that standards are developed for improved service delivery.
9. LG accounting officers should adopt a high level of budget transparency to enhance access to budget information with the Local Councilors and allow effective engagement with the public in prioritization, revenue collection and resource allocations.
10. Districts and Sub county headquarters need to acquire proper notice boards where information can be displayed as opposed to tree trunks and corridors where the information is often destroyed in short time after being displayed.
1
Budget and Service Delivery Monitoring Exercises
1.0 INTRODUCTION
1.1 Background and Context
The Advocates Coalition for Development and Environment (ACODE) has been undertaking Budget and Service Delivery Monitoring Exercises (BSDME) in 26 districts1 bi-annually as part the Budget Transparency Initiative (BTI) of ACODE. This Initiative is a partnership with Ministry of Finance Planning and Economic Development (MFPED), the Budget Strengthening Initiative of the Overseas Development Institute (BSI-ODI) and the Civil Society Budget Advocacy Group (CSBAG). The main objective of the BTI is to promote budget transparency and accountability in Uganda through the dissemination of budget information to citizens and the soliciting of feedback on the use of public resources. The BSDME largely focuses on three basic aspects, namely, the display of information on transfers at service delivery units, payroll & pensions, timeliness of funds (delays), and the quality and challenges of services. The findings of the quarterly budget monitoring reports have been shared with the MFPED.The BMSDE is carried out against the backdrop of the Public Financial Management Reform Strategy (PFMRS) FY2017/18 - FY2022/23. The goal of the strategy is to enhance resource mobilisation, improve planning and public investment management, and strengthen accountability for quality, effective and efficient service delivery. The main outcome targets of the strategy include improved aggregate fiscal control, resource allocation and operational efficiency. Whereas the BSDME focuses on districts, it is important to put the findings in the context of the broader Public Financial Management (PFM) reforms with the view of gauging the efficacy of the latter on the former.As such, ACODE commissioned this assignment to synthesize the budget and service delivery monitoring to contextualize the PFM reforms as laid out in the PFMRS with the purpose of identifying the effect of PFM reforms on Local Government (LG) PFM. These findings were to be used in advocacy for improved PFM at Local Government Levels.The 26 district reports highlight performance in budgetary and key PFM reforms over a period of 4 years in areas such as Single Treasury Account (STA), Performance Based Budgeting and related tools, Medium Term Budgets, Integrated Financial Management Strategy (IFMS), Domestic Revenue Mobilisation Strategy (DRMS), and Gender & Equity Budgeting. Significantly, the district reports underscore perspectives of users on public service delivery in Agriculture sector, Health sector, Roads sector and Education Sector, strengths of the service delivery mechanisms, and the challenges citizens face in accessing services provided by the different Sectors.
1 Agago, Amuru, Bududa, Buliisa, Gulu, Hoima, Jinja, Kabarole, Kamuli, Kanungu, Lira, Luweero, Mbale, Moroto, Moyo, Mbarara, Mpigi, Mukono, Nakapipirit, Nebbi, Ntungamo, Rukungiri, Soroti, Tororo, Amuria, Wakiso.
2
Budget and Service Delivery Monitoring Exercises
1.2 Objectives
The objectives of the analysis of the BSDME reports were to: a. Examine the budget performance (outcomes) of Local Governments for
FY 2017/18 to FY 2019/20.b. Examine the effects of key PFM reforms on LG Public Finance Management c. Elaborate the perspectives of users on public service delivery in
Agriculture, Health, roads and Education Sectors.
1.3 Methodology
The synthesis relied mainly on an extensive document review which included a critical review of the Public Financial Management Reform Strategy (PFMRS); National Budget Framework Papers (NBFP); Approved Estimates of Revenue and Expenditure; Budget and Service Delivery Monitoring Reports; Budget Call Circulars; Annual National Budget Performance Reports; Approved Annual Work-plans, Budgets, and Annual District Budget Performance Reports for each of the 26 districts. The review ascertained the performance of Local Governments in terms of absorption/spending of funds allocated annually; to examine the effects of key PFM reforms on LG Public Finance Management and experiences at district level with respect to key PFM reforms such as, the Single Treasury Account (STA), Performance Based Budgeting (PBB), Medium Term Budgets, IFMS, DRMS, and Gender & Equity Budgeting; and also to elaborate perspectives of users on public service delivery in Agriculture, Health, Roads, and Education Sectors in the 26 LGs.Content analysis was used to analyse qualitative data collected during document reviews. This allowed drawing inferences from qualitative data by objectively and systematically identifying specific themes and sub-themes within the data and assessing their relative importance in answering the objectives of the assignment. Quantitative data was analysed using Microsoft Excel. Data analysis involved generating descriptive statistics for the budget performance of LGs. The synthesis focused on the BSDME reports for FY 2017/18 up to FY 2019/20, the budget performance for each of the 26 districts in the FY 2017/18 up to FY 2019/20, and the district level key PFM reforms and experiences. Perspectives of users on public service delivery in Agriculture, Health, Roads, and Education Sectors in the 26 LGs also informed the study.
3
Budget and Service Delivery Monitoring Exercises
2.0 LOCAL GOVERNMENT BUDGET PERFORMANCE
2.1 Trends in District Budget Allocations
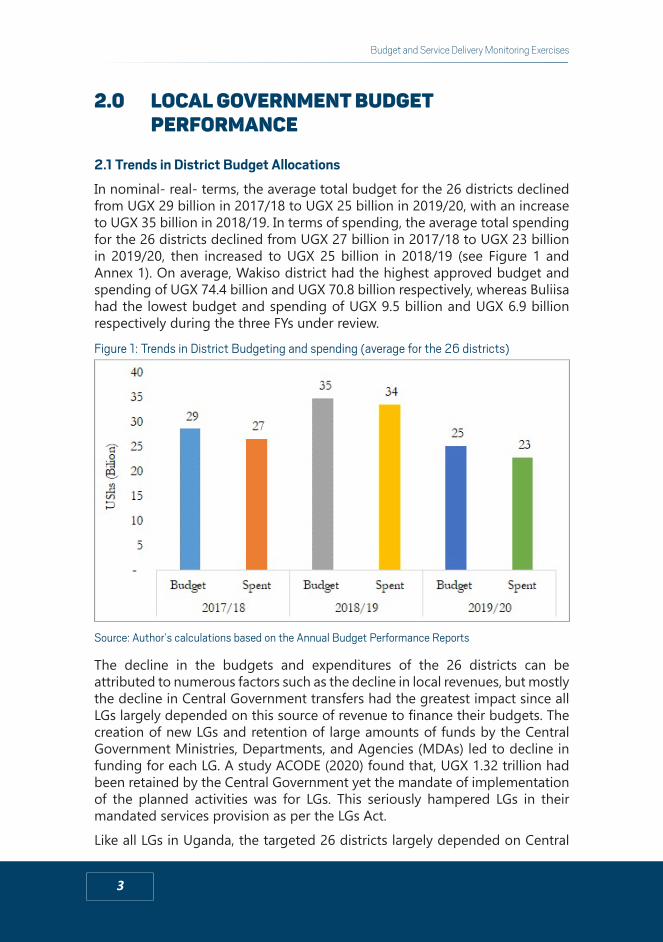
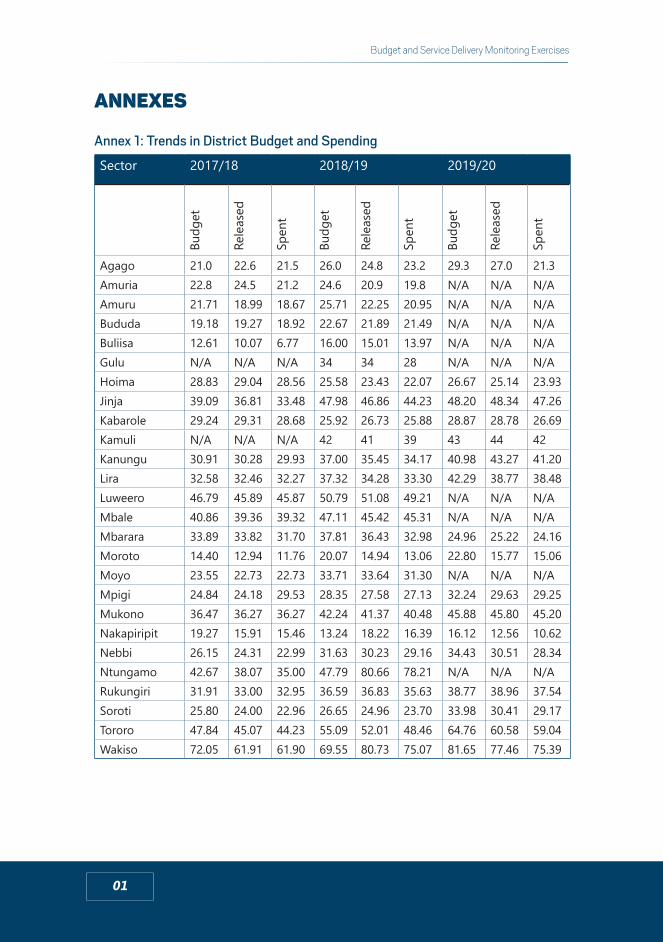
In nominal- real- terms, the average total budget for the 26 districts declined from UGX 29 billion in 2017/18 to UGX 25 billion in 2019/20, with an increase to UGX 35 billion in 2018/19. In terms of spending, the average total spending for the 26 districts declined from UGX 27 billion in 2017/18 to UGX 23 billion in 2019/20, then increased to UGX 25 billion in 2018/19 (see Figure 1 and Annex 1). On average, Wakiso district had the highest approved budget and spending of UGX 74.4 billion and UGX 70.8 billion respectively, whereas Buliisa had the lowest budget and spending of UGX 9.5 billion and UGX 6.9 billion respectively during the three FYs under review.
Figure 1: Trends in District Budgeting and spending (average for the 26 districts)
Source: Author’s calculations based on the Annual Budget Performance Reports
The decline in the budgets and expenditures of the 26 districts can be attributed to numerous factors such as the decline in local revenues, but mostly the decline in Central Government transfers had the greatest impact since all LGs largely depended on this source of revenue to finance their budgets. The creation of new LGs and retention of large amounts of funds by the Central Government Ministries, Departments, and Agencies (MDAs) led to decline in funding for each LG. A study ACODE (2020) found that, UGX 1.32 trillion had been retained by the Central Government yet the mandate of implementation of the planned activities was for LGs. This seriously hampered LGs in their mandated services provision as per the LGs Act. Like all LGs in Uganda, the targeted 26 districts largely depended on Central
4
Budget and Service Delivery Monitoring Exercises
Government transfers as the major source of revenue for financing their budgets. However, the largest proportion of CG transfers were conditional in nature; biased towards the National Priority Programme Areas (NPPAs),2 dictated through the Indicative Planning Figures (IPFs). Given the conditions attached to the CG transfers, districts lacked the discretionary powers to allocate resources and ensure that the peculiar needs of their citizens were met.
2.2 Trends in District Spending
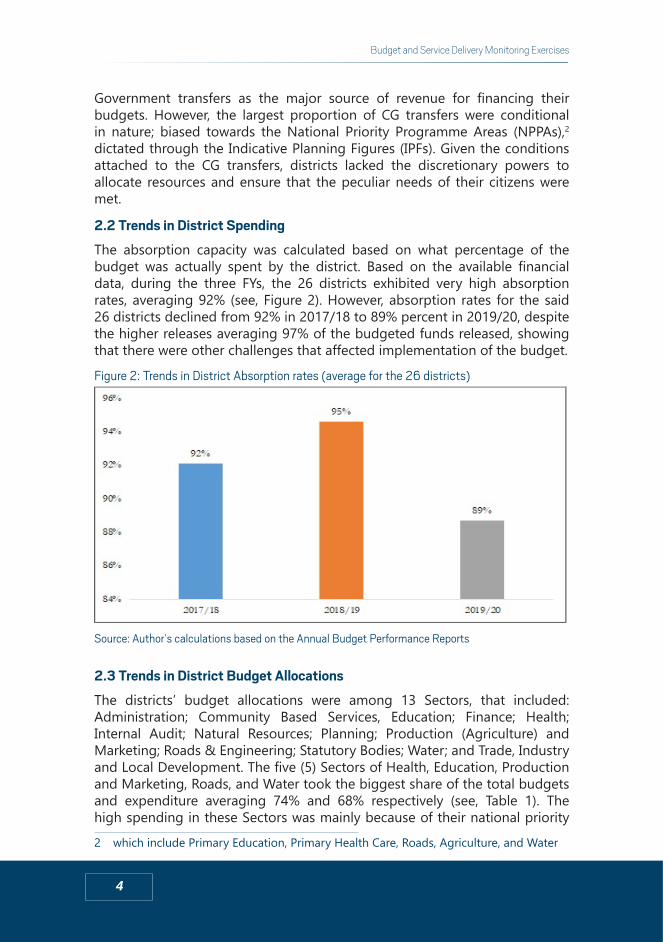
The absorption capacity was calculated based on what percentage of the budget was actually spent by the district. Based on the available financial data, during the three FYs, the 26 districts exhibited very high absorption rates, averaging 92% (see, Figure 2). However, absorption rates for the said 26 districts declined from 92% in 2017/18 to 89% percent in 2019/20, despite the higher releases averaging 97% of the budgeted funds released, showing that there were other challenges that affected implementation of the budget.
Figure 2: Trends in District Absorption rates (average for the 26 districts)
Source: Author’s calculations based on the Annual Budget Performance Reports
2.3 Trends in District Budget Allocations
The districts’ budget allocations were among 13 Sectors, that included: Administration; Community Based Services, Education; Finance; Health; Internal Audit; Natural Resources; Planning; Production (Agriculture) and Marketing; Roads & Engineering; Statutory Bodies; Water; and Trade, Industry and Local Development. The five (5) Sectors of Health, Education, Production and Marketing, Roads, and Water took the biggest share of the total budgets and expenditure averaging 74% and 68% respectively (see, Table 1). The high spending in these Sectors was mainly because of their national priority
2 which include Primary Education, Primary Health Care, Roads, Agriculture, and Water
5
Budget and Service Delivery Monitoring Exercises
programme areas.
Table 1: Trends in District Budgets and Spending (averages for the 26 districts)
Sector 2017/18 2018/19 2019/20
Budgeted Spent Budgeted Spent Budgeted SpentHealth 14.3% 12.0% 20.2% 17.1% 14.3% 12.9%Education 44.8% 43.0% 53.0% 49.7% 36.9% 36.2%Agriculture 3.7% 3.3% 6.5% 5.1% 5.1% 3.2%Roads 5.7% 4.6% 7.3% 6.8% 4.6% 3.6%Water 2.2% 2.0% 2.2% 2.1% 1.5% 1.3%Total 71% 65% 89% 81% 62% 57%
Source: Author’s calculations based on the Annual Budget Performance Reports
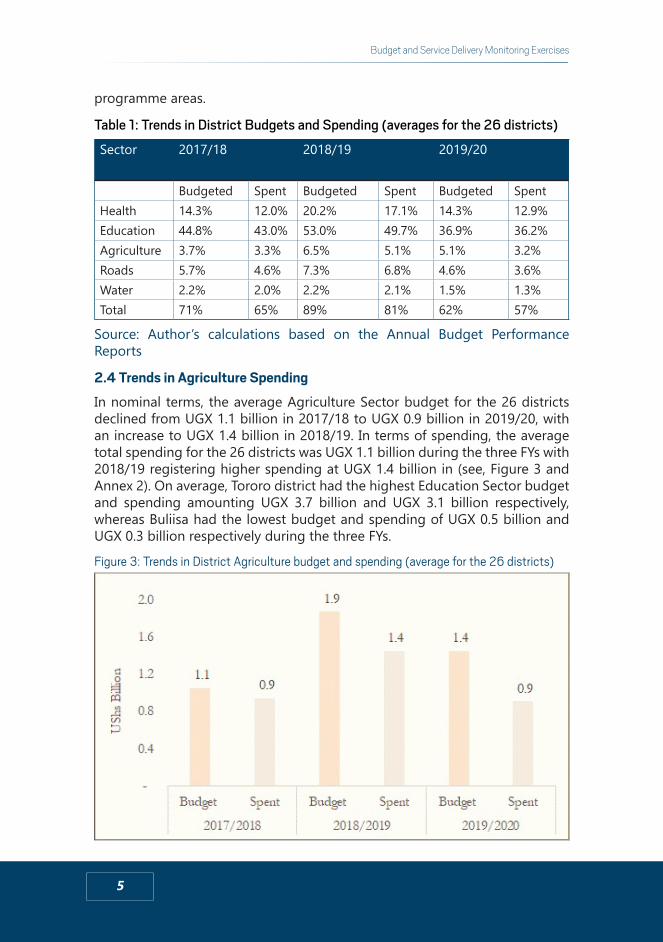
2.4 Trends in Agriculture Spending
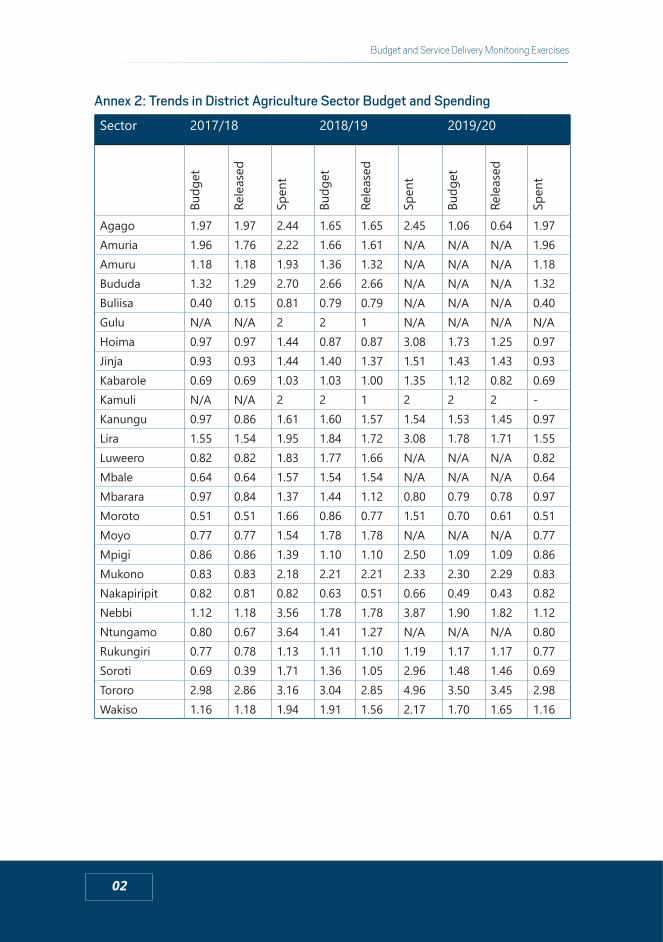
In nominal terms, the average Agriculture Sector budget for the 26 districts declined from UGX 1.1 billion in 2017/18 to UGX 0.9 billion in 2019/20, with an increase to UGX 1.4 billion in 2018/19. In terms of spending, the average total spending for the 26 districts was UGX 1.1 billion during the three FYs with 2018/19 registering higher spending at UGX 1.4 billion in (see, Figure 3 and Annex 2). On average, Tororo district had the highest Education Sector budget and spending amounting UGX 3.7 billion and UGX 3.1 billion respectively, whereas Buliisa had the lowest budget and spending of UGX 0.5 billion and UGX 0.3 billion respectively during the three FYs.
Figure 3: Trends in District Agriculture budget and spending (average for the 26 districts)
6
Budget and Service Delivery Monitoring Exercises
Source: Author’s calculations based on the Annual Budget Performance Reports
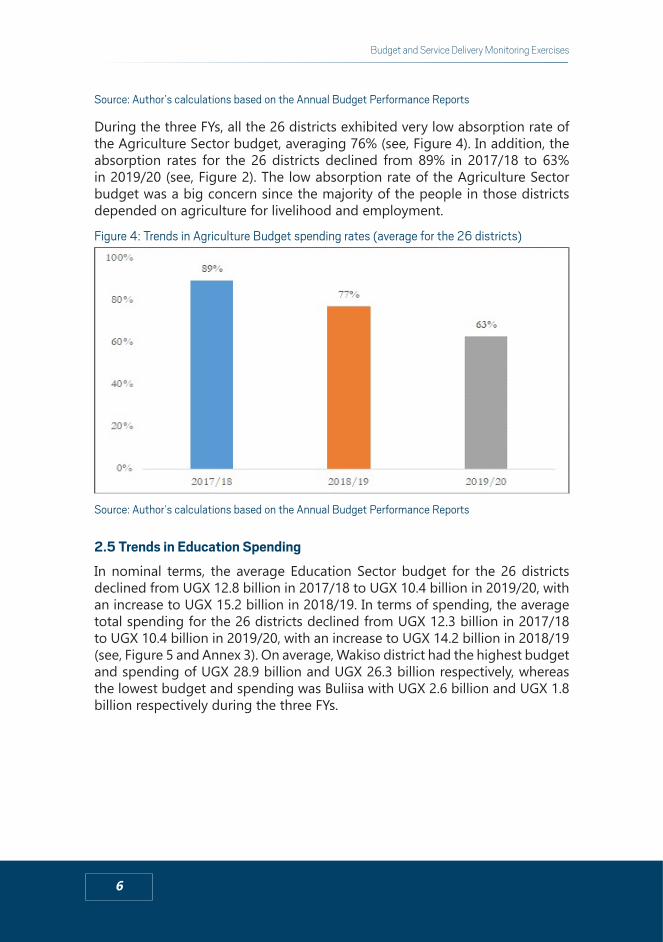
During the three FYs, all the 26 districts exhibited very low absorption rate of the Agriculture Sector budget, averaging 76% (see, Figure 4). In addition, the absorption rates for the 26 districts declined from 89% in 2017/18 to 63% in 2019/20 (see, Figure 2). The low absorption rate of the Agriculture Sector budget was a big concern since the majority of the people in those districts depended on agriculture for livelihood and employment.
Figure 4: Trends in Agriculture Budget spending rates (average for the 26 districts)
Source: Author’s calculations based on the Annual Budget Performance Reports
2.5 Trends in Education Spending
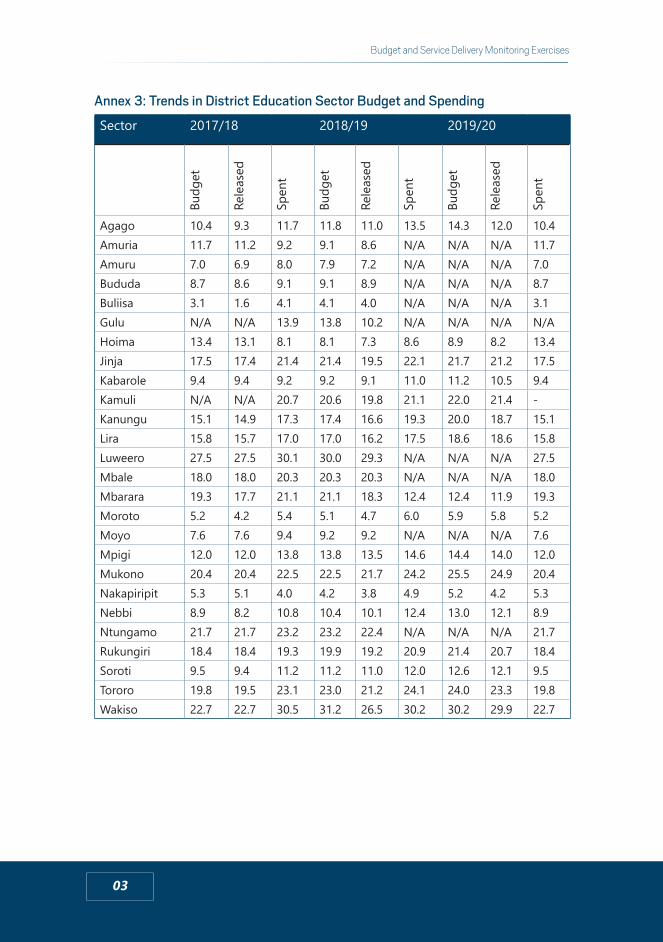
In nominal terms, the average Education Sector budget for the 26 districts declined from UGX 12.8 billion in 2017/18 to UGX 10.4 billion in 2019/20, with an increase to UGX 15.2 billion in 2018/19. In terms of spending, the average total spending for the 26 districts declined from UGX 12.3 billion in 2017/18 to UGX 10.4 billion in 2019/20, with an increase to UGX 14.2 billion in 2018/19 (see, Figure 5 and Annex 3). On average, Wakiso district had the highest budget and spending of UGX 28.9 billion and UGX 26.3 billion respectively, whereas the lowest budget and spending was Buliisa with UGX 2.6 billion and UGX 1.8 billion respectively during the three FYs.
7
Budget and Service Delivery Monitoring Exercises
Figure 5: Trends in District Education budget and spending (average for the 26 districts)
Source: Author’s calculations based on the Annual Budget Performance Reports
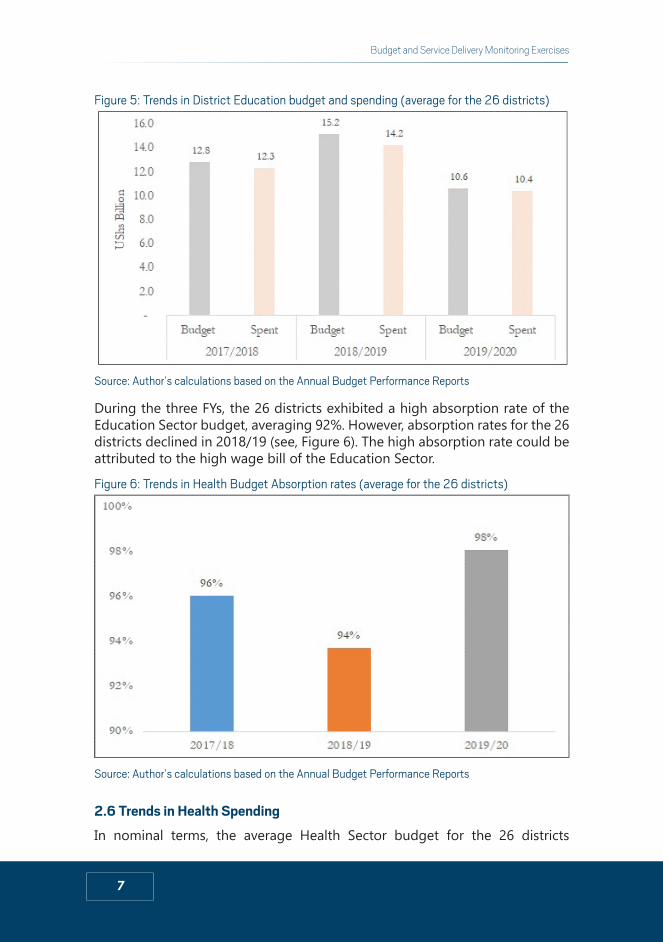
During the three FYs, the 26 districts exhibited a high absorption rate of the Education Sector budget, averaging 92%. However, absorption rates for the 26 districts declined in 2018/19 (see, Figure 6). The high absorption rate could be attributed to the high wage bill of the Education Sector.
Figure 6: Trends in Health Budget Absorption rates (average for the 26 districts)
Source: Author’s calculations based on the Annual Budget Performance Reports
2.6 Trends in Health Spending
In nominal terms, the average Health Sector budget for the 26 districts
8
Budget and Service Delivery Monitoring Exercises
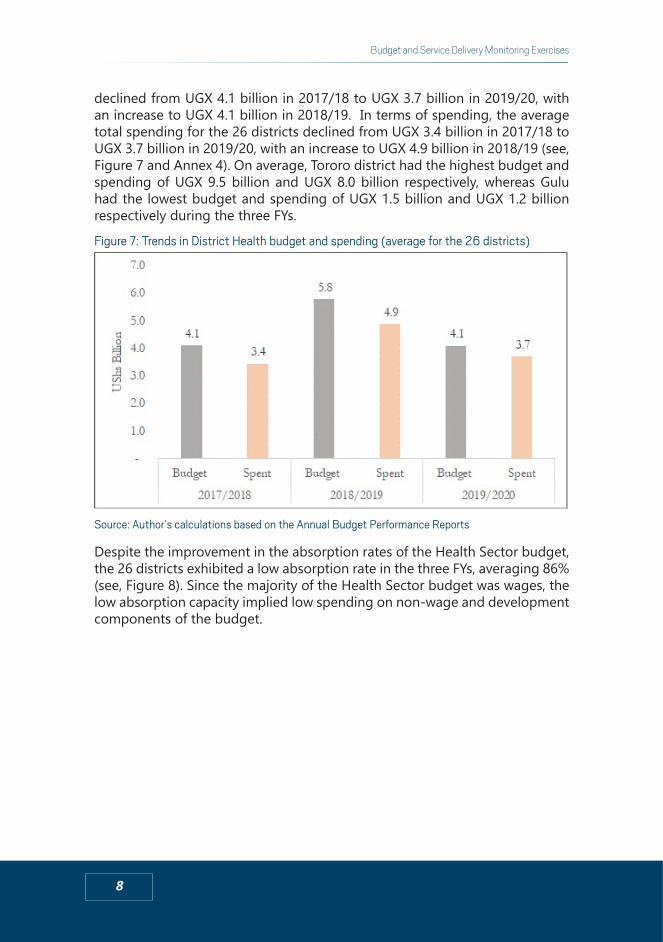
declined from UGX 4.1 billion in 2017/18 to UGX 3.7 billion in 2019/20, with an increase to UGX 4.1 billion in 2018/19. In terms of spending, the average total spending for the 26 districts declined from UGX 3.4 billion in 2017/18 to UGX 3.7 billion in 2019/20, with an increase to UGX 4.9 billion in 2018/19 (see, Figure 7 and Annex 4). On average, Tororo district had the highest budget and spending of UGX 9.5 billion and UGX 8.0 billion respectively, whereas Gulu had the lowest budget and spending of UGX 1.5 billion and UGX 1.2 billion respectively during the three FYs.
Figure 7: Trends in District Health budget and spending (average for the 26 districts)
Source: Author’s calculations based on the Annual Budget Performance Reports
Despite the improvement in the absorption rates of the Health Sector budget, the 26 districts exhibited a low absorption rate in the three FYs, averaging 86% (see, Figure 8). Since the majority of the Health Sector budget was wages, the low absorption capacity implied low spending on non-wage and development components of the budget.

9
Budget and Service Delivery Monitoring Exercises
Figure 8: Trends in Roads Budget Absorption rates (average for the 26 districts)
Source: Author’s calculations based on the Annual Budget Performance Reports
2.7 Trends in Roads Spending
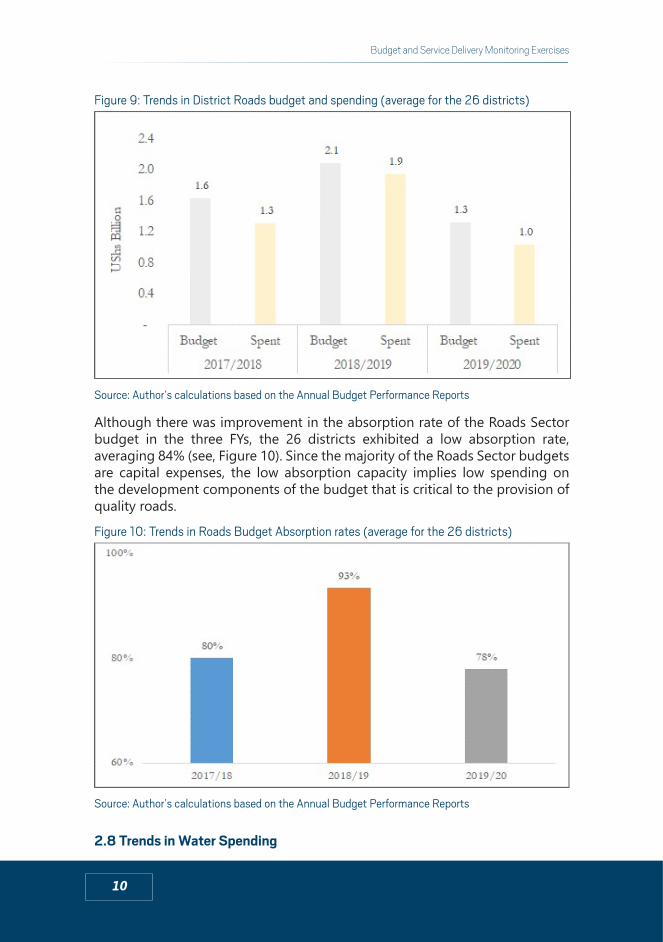
In nominal terms, the average Roads Sector budget for the 26 districts declined from UGX 1.6 billion in 2017/18 to UGX 1.3 billion in 2019/20, with an increase to UGX 2.1 billion in 2018/19. In terms of spending, the average total spending for the 26 districts declined from UGX 1.3 billion in 2017/18 to UGX 1.0 billion in 2019/20, with an increase to UGX 1.9 billion in 2018/19 (see, Figure 9 and Annex 5). On average, Wakiso district had the highest budget and spending of UGX 1.5 billion and UGX 1.6 billion respectively, whereas Gulu had the lowest budget and spending of UGX 0.2 billion during the three FYs.
10
Budget and Service Delivery Monitoring Exercises
Figure 9: Trends in District Roads budget and spending (average for the 26 districts)
Source: Author’s calculations based on the Annual Budget Performance Reports
Although there was improvement in the absorption rate of the Roads Sector budget in the three FYs, the 26 districts exhibited a low absorption rate, averaging 84% (see, Figure 10). Since the majority of the Roads Sector budgets are capital expenses, the low absorption capacity implies low spending on the development components of the budget that is critical to the provision of quality roads.
Figure 10: Trends in Roads Budget Absorption rates (average for the 26 districts)
Source: Author’s calculations based on the Annual Budget Performance Reports
2.8 Trends in Water Spending
11
Budget and Service Delivery Monitoring Exercises
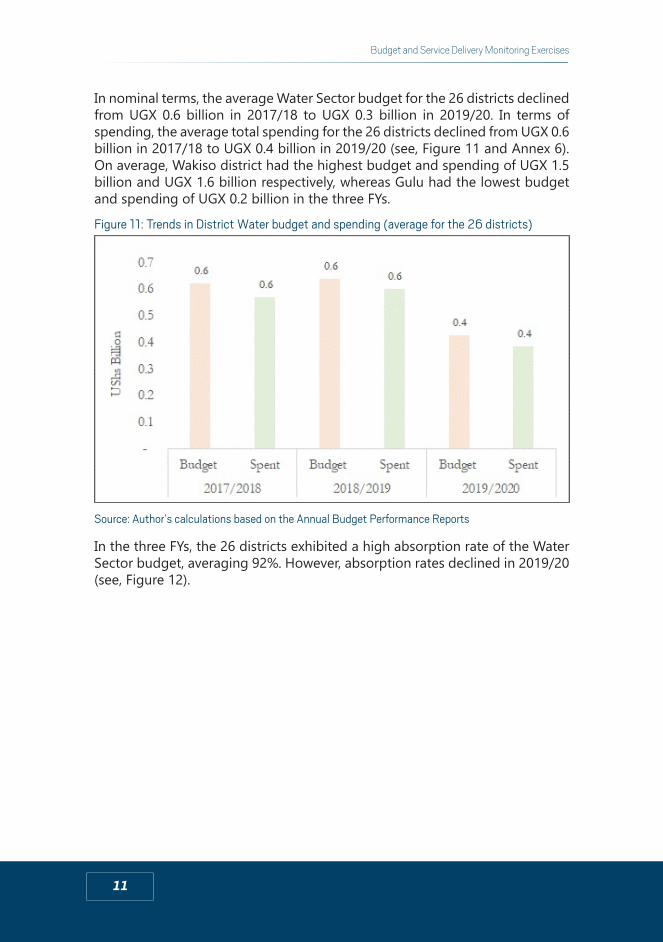
In nominal terms, the average Water Sector budget for the 26 districts declined from UGX 0.6 billion in 2017/18 to UGX 0.3 billion in 2019/20. In terms of spending, the average total spending for the 26 districts declined from UGX 0.6 billion in 2017/18 to UGX 0.4 billion in 2019/20 (see, Figure 11 and Annex 6). On average, Wakiso district had the highest budget and spending of UGX 1.5 billion and UGX 1.6 billion respectively, whereas Gulu had the lowest budget and spending of UGX 0.2 billion in the three FYs.
Figure 11: Trends in District Water budget and spending (average for the 26 districts)
Source: Author’s calculations based on the Annual Budget Performance Reports
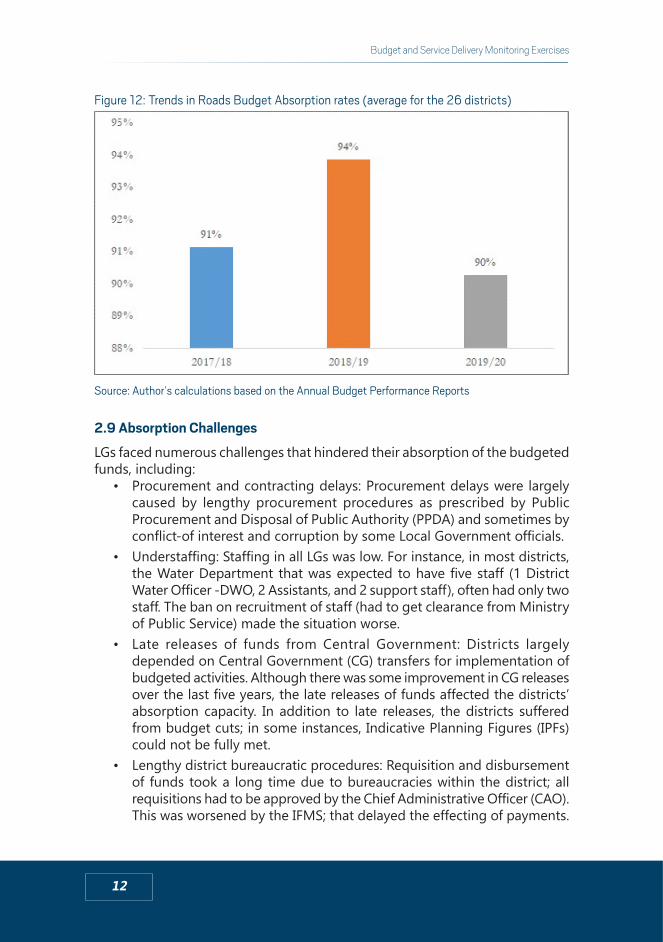
In the three FYs, the 26 districts exhibited a high absorption rate of the Water Sector budget, averaging 92%. However, absorption rates declined in 2019/20 (see, Figure 12).
12
Budget and Service Delivery Monitoring Exercises
Figure 12: Trends in Roads Budget Absorption rates (average for the 26 districts)
Source: Author’s calculations based on the Annual Budget Performance Reports
2.9 Absorption Challenges
LGs faced numerous challenges that hindered their absorption of the budgeted funds, including:
• Procurement and contracting delays: Procurement delays were largely caused by lengthy procurement procedures as prescribed by Public Procurement and Disposal of Public Authority (PPDA) and sometimes by conflict-of interest and corruption by some Local Government officials.
• Understaffing: Staffing in all LGs was low. For instance, in most districts, the Water Department that was expected to have five staff (1 District Water Officer -DWO, 2 Assistants, and 2 support staff), often had only two staff. The ban on recruitment of staff (had to get clearance from Ministry of Public Service) made the situation worse.
• Late releases of funds from Central Government: Districts largely depended on Central Government (CG) transfers for implementation of budgeted activities. Although there was some improvement in CG releases over the last five years, the late releases of funds affected the districts’ absorption capacity. In addition to late releases, the districts suffered from budget cuts; in some instances, Indicative Planning Figures (IPFs) could not be fully met.
• Lengthy district bureaucratic procedures: Requisition and disbursement of funds took a long time due to bureaucracies within the district; all requisitions had to be approved by the Chief Administrative Officer (CAO). This was worsened by the IFMS; that delayed the effecting of payments.

13
Budget and Service Delivery Monitoring Exercises
• Political interference in implementation: In many cases, politicians interfered with the implementation of activities, and this affected the absorption of funds.
14
Budget and Service Delivery Monitoring Exercises
3.0 EFFECTS OF PUBLIC FINANCIAL MANAGEMENT REFORMS ON LOCAL GOVERNMENT
3.1 Public Financial Management (PFM) Reforms
Over the last decade, Government undertook various PFM reforms as described below. The reforms focused mostly on ensuring basic fiduciary controls, typically in response to corruption cases and evidence of noncompliance.Integrated Finance Management System (IFMS): Introduced in 2004, IFMS mainly aimed at improving oversight and internal controls; improved cash management; better commitment & expenditure control; and ensuring more efficient and timely transaction processing. IFMS has improved predictability, transparency and accountability in the management of public funds.Output Budgeting Tool (OBT): This was introduced during FY 2008/09, and was intended to strengthening the link between the budget, results and policy objectives of Government; improving allocation and operational efficiency of public expenditure through focusing allocation on sectors that had the greatest impact in achieving government policy objectives; and Linking Financial Allocations with Outputs.Quarterly Cash limits and Release/Procurement: In 2009/10, MoFPED moved to quarterly cash limits and releases linked to the performance, procurement plans, work plans and cash limit projections.Performance Contracts: These were established during FY 2011/12. The Performance Contracts for both Central and Local Governments were tools for accountability of how public resources were linked to intended results and formed the structure for quarterly progress reporting, that was used for triggering releases and for physical monitoring by the Budget Monitoring and Accountability Unit (BMAU).Treasury single account and Straight through Processing of Salaries and Pensions (STP) and Electronic Funds Transfer (EFT): The STP and EFT systems of payment of pension and salaries was introduced to replace the use of cheques in a bid to eliminate fraudulent behavior; improve liquidity management; and reduce the transaction costs.Decentralization policy for salaries and pension: To address the concern that Accounting Officers (CAOs, TCs, and Heads of Institutions at CG) not being involved in clearance of payment of salary, pension, and gratuity leading to ghost staff, the payroll and payment was decentralised. Accounting Officers are lead accountable for any ghost payments. The MoFPED and MoPS are responsible for provision of support, oversight role and monitoring activities under this system.
15
Budget and Service Delivery Monitoring Exercises
Public Finance Management (PFM) Act 2015: The PFM Act, 2015 (as amended) governs budget process and budget execution and outlines the budget calendar which is consultative; starts in September and approved by 31st May. The PFM Act restricts the Supplementary expenditures to 3% without parliamentary approval and reallocations by MDAs & LGs restricted to 10% between budget lines. The PFM Act also requires that all Government revenues including non-tax revenue collected or generated and spent at source by institutions must be appropriated by Parliament.Programme Based Budgeting (PBB): In FY 2017/18, Government adopted the PBB in order to match the budget outputs, outcomes, measurable objectives, and performance measure for each programme. This led to the establishment of the Programme-based Budgeting System (PBS) that transformed the budget from output-based (OBT) to a more result and performance-based approach. The Third National Development Plan (NDP III) adopted a Program Planning Approach (PPA) comprising of eighteen programs that were to be aligned to PBB. The PBB provided an opportunity to strengthen the link between high-level outcomes and budgeting for service delivery.In order to implement the programme planning approach under the NDP III, during FY 2021/22, Financial Management Systems (Chart of Account, IFMS, IBPS, PBS, IPPS, Aid Management Platform, among others) were re-configured. Thus, the Chart of Accounts included new programmatic element for execution of the budget.Integrated Personnel and Payroll System (IPPS): One of the Government commitments under the Public Service Reform Programme (PRSP) was to strengthen accountability and controls by improving the management of the Public Sector workforce and enhancing payroll and pension management. In this regard, a modern and Integrated Personnel and Payroll System (IPPS) was introduced December 2010, under the leadership of the Ministry of Public Service (MoPS).Public Investment Management (PIM) Framework: To address the key constraints to PIM, in 2019, a system for planning and monitoring projects was introduced. The Development Committee (DC) in MoFPED vets all the new projects to ensure project alignment to Sector objectives and the National Development Plan. A new project approval framework introduced to gradually develop project ideas through the mandatory stages of the project cycle and include different levels of approval before a project enters the Public Investment Plan (PIP). Basic tools have been prepared to guide stakeholders in the appraisal of their projects.3 An Integrated Bank of Projects (IBP), which is an online depository of all information relating to public investments throughout
3 These include: (i) guidelines that outline the mandatory stages of the project cycle MDALGs must undertake to prepare their projects; (ii) a project preparation and appraisal manual introduced and disseminated to MDALGs; and (iii) national parameters including conversion factors critical for economic analysis
16
Budget and Service Delivery Monitoring Exercises
the project cycle, was established.Capacity building is on-going to create a critical mass of PIM experts at all levels of Government. In addition, a PIM Centre of Excellence (CoE) hosted by the School of Economics at Makerere University was to be established. The CoE was expected to train stakeholders in PIM (e.g. MDAs), as well as, generate knowledge and tools to support the strengthening of Uganda’s PIM systems.Electronic Government procurement system (E-GP): The implementation of E-GP started in 2020 to and will support Government to carry out electronic public procurement and disposal processes. The E-GP system promotes bidder participation and competitiveness; real time access to procurement information for planning; reduced cost of doing business; improved governance and accountability in public procurement; effective oversight of PPDA through online monitoring, and minimize human interaction reducing avenues for corruption. The pilot phase with funding from the World Bank commenced in July 2020 with European Dynamics system uploading procurement plans, and registration of bidders for 7 entities. Public Policy Executive Oversight Forum: Established during FY 2021/22 in line with the Article 99 of the Constitution of the Republic of Uganda, its aimed at managing results for programme/project interventions. This is comprised of a technical committed with officials of the Office of the President, Office of the Prime Minister, MoFPED, and MoPS. This is meant to address the update of good implementation practices to take lessons or learning from drivers of failure at all levels of programme implementation to aid the Executive to take informed decisions based on evidence of intervention results.Review of Chart of Accounts (COA): Following the implementation of the NDP III, during FY 2020/21, a comprehensive review of COA was undertaken with the objectives of removing duplications and overlaps in revenue and expenditure codes and alignment with the NDP III programmes. In revised COA, programmes replaced sectors and MTEF codes replaced with programme codes.Asset Management Strategy: This was developed to strengthen public asset management through enhances efficiency in operation and maintenance. All Accounting Officers are required to register all created assets in the Assets Management Module at IFMS. In addition, they are required to plan and budget for the right mix of assets; prepare a 3-year medium-term asset strategic plan (which includes acquisition, maintenance, replacement, and disposal plans) and annual asset management action plan.Independence of office of the Auditor General (OAG) reform: The OAG is the Supreme Audit Institution (SAI) of Uganda. The provisions of the Constitution of the Republic of Uganda (1995) as amended under Article 163, sets out the appointment, mandate, and removal of the Auditor General. The National Audit Act, 2008 provides the operational and financial independence for the
17
Budget and Service Delivery Monitoring Exercises
OAG. The Act in its totality takes supremacy over all existing Acts relating to the OAG, or to the functions and powers of the Auditor General and any Act in contradiction with the National Audit Act as modified to conform to the provisions of the Act. The Act gives the Auditor General right of access to documents and information relevant to the performance of their functions; and for other related matters in the exercise of these functions.Strengthening legislative oversight: In incurring expenditure of public funds, the Executive is required to prepare detailed sets of accounts and financial statements. These are audited by the Auditor-General and reports tabled in Parliament. The accountability cycle ends in Parliament with the review of the Public Accounts and the Auditor-General’s Reports, by the Oversight Accountability Committees of Parliament, namely the Public Account Committee (PAC), Committee on Statutory Authorities and State Enterprises (COSASE) and the Local Government Accounts Committees.Tax administration reform (e.g. e-Tax, TIN reform): Some of the recent tax administration reforms include: URA interfacing and sharing of information with other revenue authorities in the region using the regional Authorities Digital Data Exchange System (RADEX); implementation of Integrated Tax Administration System (e-tax) that provide online services to the taxpayer on 24-hour basis; enabling taxpayers to lodge their applications online through the web portal (www.ura.go.ug) as long as they have access to the internet; and computerizing tax processes which reduce the contact between taxpayers and tax officials.Aid and debt Management reforms: The Aid Management Platform is the Government’s official online database of aid-funded projects and programs in Uganda. It is for enhancing reporting and recording of aid information.Budget transparency reform: MFPED publishes several annual budget documentations4 as required by the PFM Act 2015. The publications are in hard copies while soft copies are posted on both the MFPED (www.finance.go.ug) and budget website (www.budget.go.ug). The publication of quarterly budget releases made in the print media has been instrumental in promoting budget transparency. However, the value of some of the documents is constrained by limited coverage of budget information and the bulk of the publications that undermine readability and comprehension (Republic of Uganda, 2018).
3.2 Impact of the Reforms on Service Delivery
Improved predictability of funds transferred to MDAs and LGs for budget execution: In-year resource allocation has improved through daily consolidation of all bank and cash balances, enabling more frequent and accurate accounts
4 The documents include: the Background to the Budget, The Budget Framework Papers, the Budget Speech, Ministerial Policy Statements, Charter of Fiscal Responsibility and the Draft and Approved Estimates of Revenue and Expenditure, the Public Investment Plan, and, and citizens’ Budget 2017/18.
18
Budget and Service Delivery Monitoring Exercises
reconciliation and reporting, that has had a positive impact on aggregate expenditure control.Improved orderliness of the budget process: Budget transparency has improved by allowing more time for LGs to prepare their budgets after the second budget call circular. The PFMA has also provided a stronger enabling framework for effective cash management by aligning budget execution with cash planning and ensuring releases are made in line with an annual cash flow plans.Performance information has improved with the progressive alignment of national and sector plans and budgets with Government priorities under the Programme-based budgeting. A certificate of compliance is produced annually by the National Planning Authority (NPA) to measure the level of compliance of budget and plans with the Second National Development Plan (NDP II).There was evidence of improvement against all the key service delivery indicators, including education enrollment, infant and maternal mortality rates, energy supply, and rural access to improved water supply. Nonetheless, in some cases, the improvements were below target. For example, the Maternal Mortality Ratio reduced from 438 per 100,000 (UDHS, 2011) to 336 per 100,000 (UDHS, 2016) live births, that is still far below the Health Sector Development Plan (HSDP) target of 121 per 100,000 live births by 20207. In the Education Sector, inadequate capitation grants and lack of resources for construction of vocational training centres in every district were sighted as challenges to the delivery of tertiary education targets (MoFPED, 2018).
3.3 Strengths and Weaknesses of PFM Reforms
The strength of the PFM reforms include: strengthening of policy framework for macroeconomic management; enhanced management and reporting of public expenditure; reduction in the number of ‘ghost’ workers, in particular, through the decentralisation of payroll and pensions management; improved policy-based budgeting through the PBB system; enhanced control and management of public funds; improved quality of financial reporting by MDAs and LGs; and enhanced scrutiny and oversight of collection and utilisation of public funds (MoFPED, 2018).However, there are still many challenges that include among others:Weakness in financial resource alignment to plans: The budget execution bottlenecks identified in the Health Sector included weak procurement processes; funds release mechanisms, delays in effecting payments and institutional weaknesses, such as the quality of the operations of the Finance Committee and Health Sector Technical Working group. A lack of understanding of core PFM systems e.g. Output Based BT, PBS and IFMS) was also reported, suggesting a lack of guidance, training and access at the level of vote controllers in the Health Sector (MoFPED, 2018).
19
Budget and Service Delivery Monitoring Exercises
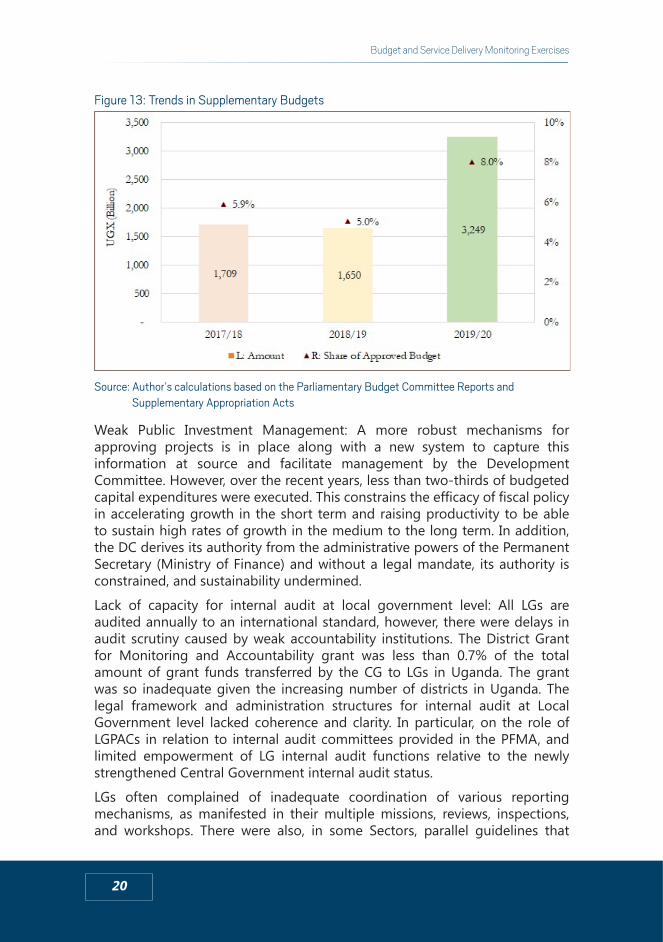
Weak inter-governmental fiscal transfers and performance information on results and impacts: Local Government fiscal transfers were insufficient and non-discretionary. Performance information did not cover resources received by delivery units and was based mostly on outputs rather than outcomes, making it difficult to link spending to results.Lack of information for tracking actual expenditures from externally funded projects: While progress had been made on tracking external financing for a few key projects, through the aid management system, there were delays in reporting. Some projects carried over balances from one financial year to the next that was not effectively monitored and captured as commitments in the preparation of budgets (MoFPED, 2018).Expenditure off the IFMS: The Auditor General’s report to Parliament for FY 2018/19 noted that UGX 439.7 billion was spent off the IFMS. Several Government entities send huge block figures outside the system after charging expenditure codes on the system; however, the ultimate expenditure could not be restricted to what was charged. Under the circumstances, it was difficult to ensure that the financial statements gave a true picture of what transpired and these funds were also exposed to a risk of misuse (OAG, 2019).Mischarge of Expenditure: The Auditor General’s report to Parliament for FY 2018/19 noted UGX 384.8 billion was charged by various entities on wrong expenditure codes. This practice leads to financial misreporting. Besides, this practice undermines the budgeting process and the intentions of the appropriating authority as funds are not fully utilised for the intended purposes (OAG, 2019).Fiscal indiscipline due to supplementary budgets: Frequent in-year adjustments and unreliability of cash releases due to supplementary budgets made it difficult for service delivery units to plan and execute budgets efficiently across the whole of Government. During the last three (3) financial years (FYs), in nominal amounts, the total Supplementary expenditure approved by Parliament had been increasing from UGX 1,709 billion (5.9% of the approved budget) in 2017/18 to UGX 3,249 billion (8.0% of the approved budget) in 2019/20 (see, Figure 14). Budget revision of over 5 percent of the approved budget since FY17/18, indicates that the assumptions underpinning Uganda’s budgeting projections were inadequate or unrealistic and reflected impunity of a number of MDAs.
20
Budget and Service Delivery Monitoring Exercises
Figure 13: Trends in Supplementary Budgets
Source: Author’s calculations based on the Parliamentary Budget Committee Reports and
Supplementary Appropriation Acts
Weak Public Investment Management: A more robust mechanisms for approving projects is in place along with a new system to capture this information at source and facilitate management by the Development Committee. However, over the recent years, less than two-thirds of budgeted capital expenditures were executed. This constrains the efficacy of fiscal policy in accelerating growth in the short term and raising productivity to be able to sustain high rates of growth in the medium to the long term. In addition, the DC derives its authority from the administrative powers of the Permanent Secretary (Ministry of Finance) and without a legal mandate, its authority is constrained, and sustainability undermined. Lack of capacity for internal audit at local government level: All LGs are audited annually to an international standard, however, there were delays in audit scrutiny caused by weak accountability institutions. The District Grant for Monitoring and Accountability grant was less than 0.7% of the total amount of grant funds transferred by the CG to LGs in Uganda. The grant was so inadequate given the increasing number of districts in Uganda. The legal framework and administration structures for internal audit at Local Government level lacked coherence and clarity. In particular, on the role of LGPACs in relation to internal audit committees provided in the PFMA, and limited empowerment of LG internal audit functions relative to the newly strengthened Central Government internal audit status.LGs often complained of inadequate coordination of various reporting mechanisms, as manifested in their multiple missions, reviews, inspections, and workshops. There were also, in some Sectors, parallel guidelines that
21
Budget and Service Delivery Monitoring Exercises
undermined the discretion, power, and downward accountability of the LGs insufficientThe creation of several non-viable public administrative units: The expansion of districts with diminished real value of resources did not provide adequate capacity for effective and efficient delivery of services. In particular, the squeeze on resources at Local Government level had particularly affected allocation of resources to key service delivery Sectors such as Health.Corruption, unethical behaviour and rent-seeking activities: While there were efforts to enhance Government’s response to corruption and unethical conduct through strengthening anti-corruption institutions’ investigations and the judiciary, there were still challenges. As long as the system of sanctions and rewards was ineffective, there would remain vulnerabilities in PFM functions and systems.Weak culture and demand for accountability by the citizens: Whilst there were efforts in improving demand for accountability such as through the regular participation of CSOs in monitoring service delivery, there still exited, lack of downward accountability to citizens’ that formed a continuous threat to the effectiveness of PFM reforms.
22
Budget and Service Delivery Monitoring Exercises
4.0 PERSPECTIVES OF USERS ON PUBLIC SERVICES
This sub-section presents findings from the BSDME for FY 2017/18 to FY 2019/20 carried out in the broader context of relevant government documents/policies. Specifically, these findings are reviews and summary findings of the following six reports: “Budget Transparency and Functionality of Road Maintenance Equipment in Uganda” (Okiira & Ayesigwa 2018); “Monitoring Local Government Budgets and Agricultural Extension Services in Uganda” Budget Monitoring Report Quarter 1 Financial Year 2017/18” (Kisaame et al 2018); “Monitoring Receipt of Health Grants and Health Service Delivery in Uganda for Quarter II, FY 2018/19” (Kisaame et al 2019); “Functionality of Value Addition Infrastructure in Uganda Budget Monitoring Report for Quarter 4 FY 2018/19” (Kisaame & Ayesigwa 2010); “Monitoring of Local Government Budgets and Road Transport Services in Quarter II FY 2019/20” (Kisaame & Ayesigwa 2020) “Budget and Service Delivery Monitoring Report in Quarter 4 2019/20” (ACODE 2020).
4.1 Perceptions on the Agriculture, Health, Roads, and Education Sectors
In this sub-section, a synthesis of the findings from the various rounds of monitoring is presented. These findings are across the four sectors of agriculture, education, health and roads that formed the focus for the monitoring exercises.
Agriculture SectorEfforts to improve agriculture though the budget allocated to the Sector were not commensurate to the number of people the Sector employs. Efforts towards value addition were steadily increasing through Uganda’s ardent implementation of several value addition infrastructure improvement initiatives over the past two decades such as the Community Agricultural infrastructure improvement programme (CAIIP). This had been implemented since 2006, and the reports indicated the presence of an increase in the types and quantities of value addition infrastructures. These included, but are not limited to, grain millers (maize, rice and hullers), cattle crushes, slaughter slabs, irrigation schemes and road-side markets.The report also indicates that 74% of the value addition infrastructures were functional and operational while 26% were not operational. For those that were not operational, the major challenges were due to limited supply of produce, high maintenance costs, limited knowledge and skills to operate the machinery, long distance from feeder communities, limited electricity/solar power supply, and faulty parts that could not easily be replaced. Farmers received numerous inputs that included pick axes, axes, spades, cows, oxen and ox ploughs. However, the low proportion of coffee planting materials distributed to farmers did not bond well with Government’s objective of
23
Budget and Service Delivery Monitoring Exercises
increasing coffee production. In FY 2016/17, Government launched the Coffee 2020 Road map with an objective of increasing coffee production to 20 million 60-kilogramme bags per annum (MoFPED, 2017). This objective is likely to remain unattainable with only 6% of coffee seedlings distributed to farmers.
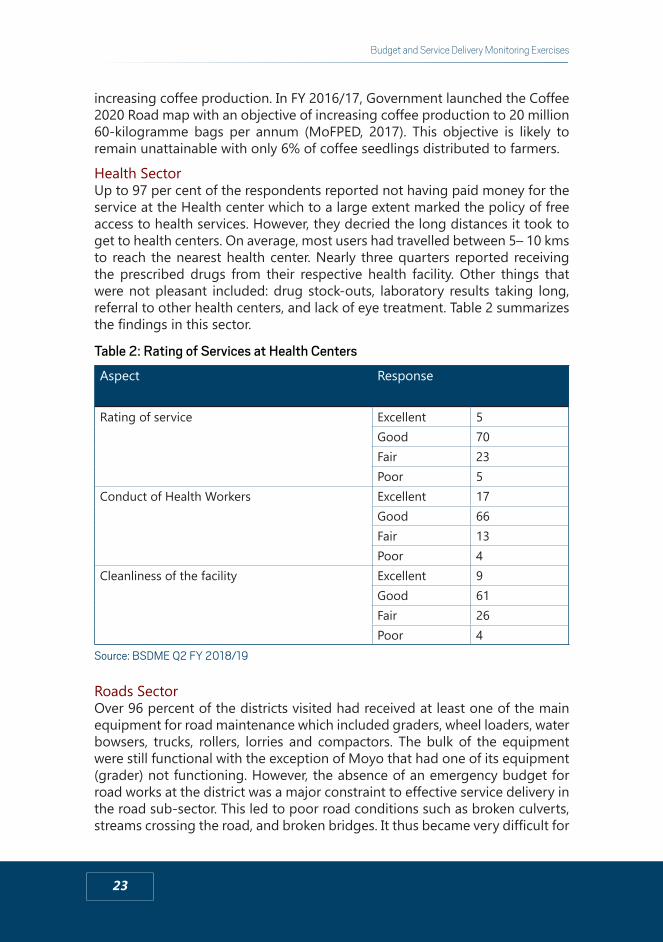
Health SectorUp to 97 per cent of the respondents reported not having paid money for the service at the Health center which to a large extent marked the policy of free access to health services. However, they decried the long distances it took to get to health centers. On average, most users had travelled between 5– 10 kms to reach the nearest health center. Nearly three quarters reported receiving the prescribed drugs from their respective health facility. Other things that were not pleasant included: drug stock-outs, laboratory results taking long, referral to other health centers, and lack of eye treatment. Table 2 summarizes the findings in this sector.
Table 2: Rating of Services at Health Centers
Aspect Response
Rating of service Excellent 5Good 70Fair 23Poor 5
Conduct of Health Workers Excellent 17Good 66Fair 13Poor 4
Cleanliness of the facility Excellent 9Good 61Fair 26Poor 4
Source: BSDME Q2 FY 2018/19
Roads SectorOver 96 percent of the districts visited had received at least one of the main equipment for road maintenance which included graders, wheel loaders, water bowsers, trucks, rollers, lorries and compactors. The bulk of the equipment were still functional with the exception of Moyo that had one of its equipment (grader) not functioning. However, the absence of an emergency budget for road works at the district was a major constraint to effective service delivery in the road sub-sector. This led to poor road conditions such as broken culverts, streams crossing the road, and broken bridges. It thus became very difficult for
24
Budget and Service Delivery Monitoring Exercises
people to travel from one area to another, hence, limiting their access to public services, such as, schools and health centres.
4.3 Challenges Faced in the Provision of Services
Late receipt of funds: Late receipt of funds at the district and sub-county level is one of the major challenges that impacts gravely on service delivery to the citizens. Majority of the administrative units reported to have received funds within an average period of 5 weeks which was fairly a long time given that MoFPED was committed to sending the funds by the 10th day of the quarter which is already two weeks into the quarter. Some of the districts, like Nebbi, reported that it took up-to 6 weeks for the funds to be received. This meant that Nebbi district lost half of the quarter as funds came with only 6 weeks left to the end of the quarter. This leads to expenditure challenges as the service delivery units would be expected to spend all the funds of that quarter before its end. This lead to procurement delays and award of contracts to incompetent contractors due to the limited time allocated to the procurement process (Kisaame & Ayesigwa 2020). Delayed disbursement of funds also often led to a low absorption rate of funds and poor/delayed service delivery. As such, the citizens don’t get effective services in fundamental Sectors such as roads and transports, health and production (agriculture and value addition).Timely receipt of funds at service delivery units is one of the challenges the Ministry of Finance, Planning and Economic Development has been grappling with and working to develop systems aimed at improving disbursement of funds (Kisaame et. al. 2018). Limited information to citizen: Local Government administrators hardly comply with their mandate stipulated by the Local Government’s Act 1997 to communicate Government policy and programs. Many districts do not publish budget estimates and performance denying access to details of approved budget not only to the citizens but also policy makers and heads of technical departments within the Local Governments.The display of budget releases on district and sub-county notice boards had become irregular and or totally missing in some Local Governments and service centres. The 2019/2020 report showed that only 46% of the service units adhered to display of information on Central Government transfers by service units for various stake holders to access. In addition, most of the sub-counties were not displaying fourth quarter or Q1 FY 2019/20 information. The level of conformity of sub-county headquarters remained low despite the several rounds of monitoring which had raised the same issue. Compliance with display of payroll information was worrying in sub counties standing at only 7% displaying. The district headquarters were faring above the average (52%) although it was also still too low. The posting irregularities were attributed to a number of reasons ranging from lack of sizable noticeboards and appropriate formats to simplify the information
25
Budget and Service Delivery Monitoring Exercises
to be displayed, the lack of incentives whatsoever to display budget releases since there were no sanctions of any kind for non-compliance. However, persons responsible to hang information on noticeboards also complained about people who unpin information from these notice boards.Poor attitudes of service providers: The conduct of some service providers, especially, health workers was reported as very poor and discouraging citizens from seeking certain services from Government facilities.Lack of service delivery Standards: Local Governments lacked service delivery standards. Only 5 out of 19 Sectors had service delivery standards. This, therefore, constrained inspection, supervision and monitoring of service delivery (ACODE, 2019).Inadequate feedback mechanisms to communities: While the planning guidelines provided for a feedback session to inform communities on the outcomes of the planning process, most LGs did not have clear feedback mechanisms. Most LGs had a tendency of simply delivering the services to communities without formally communicating to them. Without feedback and community involvement in service delivery, the communities increasingly become less interested in participating in the planning and budgeting processes.
4.4 Assessment of Accountability Mechanisms
Accountability entails procedures and processes by which one party provides a justification and is held responsible for its actions by another party that has an interest in the actions. There were three aspects of accountability: vertical, downward, and horizontal accountability as discussed below:
Vertical AccountabilityVertical accountability deals with accountability from LGs to the Central Government. The general role of the CG, through its various agencies, is to guide, inspect, monitor, and ensure compliance with legal provisions under the jurisdiction of each agency. Mechanisms for upward reporting include: financial and physical progress reports (general and sectoral); routine inspections conducted by Ministries, Departments, and Agencies; annual Local-Government Performance Assessments; external audits; and reports to the LG Public Accounts Committee (LGPAC).Vertical accountability is more of a compliance requirement where failure by LGs would lead into sanctions. The compliance of LGs was very high because there were in built incentives like those under the Annual Assessment of Minimum Conditions and Performance Measures for Local Governments by Ministry of Local Government (MoLG).5
5 The Inspectorate Division of the Ministry of Local Government undertakes an annual assessment of all LGs that focuses on measuring the extent to which they conform to the performance measurements and meet the minimum standards set by the Ministry.
26
Budget and Service Delivery Monitoring Exercises
LGs often complained of inadequate coordination of various reporting mechanisms, as manifested in multiple missions, reviews, inspections, and workshops. There were also in some Sectors parallel guidelines that undermined the discretion, power, and downward accountability of the LGs. These bureaucratic controls were also categorised to various degrees by inadequate capacity and corruption.
Horizontal AccountabilityHorizontal accountability deals with accountability between elected local leaders and local staff who execute the Government programmes. The elected leaders are mandated to monitor the performance of the technical staff in the LGs. The legal framework provides clear division of roles, LG Councils set policies and oversee the technical staff plan implementation. Elected leaders possess authority sufficient for them to hold the technical staff accountable. However, their effectiveness is constrained by lack the requisite capacity to perform their duties. For instance, the Output Budgeting Tool (OBT) reports seem to be too technical and need specialized understanding of its principals and techniques. In addition, District Councils lack financial resources to effectively monitor Government programmes. Furthermore, most LG staff (like CAOs, and DHOs) are employees of the CG thus report to their respective line Ministries. There are also many cases where elected leaders venture into direct implementation rather than overseeing the performance of technical staff, leading to conflict of interest.Given the above, it’s more likely that technocrats report to themselves through reports and verbal discussions. Programme and activity reports are shared amongst departments, though still on a limited basis since there are almost no incentives of sharing such reports and it is not mandatory. On the other hand, verbal discussions are held both formally and informally, as a mechanism of accountability. Formal forums for verbal discussions on programme and activity implementation include the mandatory Technical Planning Committee (TPC) meetings, weekly Senior Management meetings and the monthly Departmental meetings (though these are sometimes irregular depending on the strictness of the Heads of Department). The TPC and the Senior Management meetings are regular because the minutes of the meetings are used as part of the Annual Assessment Framework of the Performance of a LG done by the Ministry of Local Government (MoLG).
Downward AccountabilityDownward accountability at LG levels occurs mainly through the electoral process by which citizens choose their LG Council members and hold the Councils accountable to them. This is one of the most difficult aspects of accountability. There are various measures beyond elections that enhance downward accountability.First, citizens are officially encouraged to demand LGs and CSOs are supposed to help serve this purpose, and there are also provisions for petitions and
27
Budget and Service Delivery Monitoring Exercises
appeals by citizens.Second, the CG periodically provides information (in press and website) about fund releases to LGs. In addition, LGs (districts and sub-counties) are required to display financial allocations on their notice boards for the public to access.Third, at community level, there are service user committees that are supposed to hold public service providers accountable. These include: School Management Committees (SMC), Health Unit Management Committees (HUMC), and Water User Committees among others. Even though these user committees are expected to monitor public programmes, many of them are dysfunctional and ineffective in fulfilling their functions because of high levels of illiteracy, lack of requisite skills, and lack of incentives (i.e. allowances, transport).Fourth, there are multiple channels through which LGs gather information about citizen needs. These include consultations and participatory development planning and budgeting; allowing citizens to voice their views through local radio stations; and use of informal mechanisms and created spaces.Finally, the elected councillors at various levels are supposed to monitor service delivery and ensure accountability. However, many councillors are irresponsible as they lack seriousness in their work. A recent study by ACODE (2019) showed gross failure by the elected LG officials, especially, councillors to monitor government programmes. For instance, the report found that only 36% of female councillors and 45% of male councillors undertook more than one monitoring visit to service delivery units in a year. However, the down accountability measures mentioned above had a number of constraints. First, most people’s representatives (such as councillors) and citizens lacked technical capacity to hold their leaders accountable. The processes involved were sometimes compromised, and some were not legally binding.Second, the publication of information about CG transfers were mainly accessed and effectively used by only a few elites. Most citizens were not aware of this information, did not know how to use it, felt insufficiently empowered to use it, or felt nervous about the consequences of using it. To make matters worse, some Sub-county officials, displayed the information inside their offices, which was not easily accessible to ordinary people.Third, citizens’ sense of connection to LGs was somewhat undermined by the LG’s funding from the CG while the local people direct contribution to development of the LG was negligible. With deficiencies in service delivery, coupled with vote buying and corruption, the credibility of the LG was affected, thus undermining downward accountability.Finally, because of low civic education, many citizens lacked sufficient understanding of their rights and responsibilities.
28
Budget and Service Delivery Monitoring Exercises
5.0 CONCLUSION AND RECOMMENDATIONS5.1 Conclusion
The findings of this synthesis show that budget allocations to LGs are dominated by education and health followed by roads, agriculture and water social services provision. The absorption rate for funds increased from 92 % in 2017/18 to 95% in FY 2018/19 before dipping to 89% in 2019/20. The constraints to absorption of funds ranged from procurement and contract delays to late releases coupled with lengthy bureaucratic requisition procedures. Political interference was also citied. On the impact of PFM reforms the findings attest to greater predictability of funds, more order in the budget process and alignment with the NDP as well as greater budget transparency. However, some challenges remain including weak accountability and persistence of corruption, delays in transmission of funds, weak linkages between expenditure outputs and outcomes and limited discretion of LGs over allocated funds.
5.2 Recommendations
a. MoFPED should reduce on the number of LG transfers, through full implementation of the Fiscal Decentralization Strategy (FDS).
b. MoFPED needs to streamline the funds transfer systems so that service delivery units receive funds within the first week of any quarter.
c. MFPED, MDAs and LGs should explore production of simplified versions of the selected budget documents to make them more accessible to citizens, and where possible, to translate them into local languages to increase access to budget information to area councillors and other citizen groups.
d. The MoLG should strengthen the role of the District Council in Public Financial Management by clarifying the role of LGPACs in audit and reporting monitoring compliance.
e. LGs should monitor the utilisation of monies disbursed to ensure efficient funds allocation.
f. The Local Government Sector should work with the National Planning Authority (NPA) to ensure that service delivery standards are developed for improved service delivery.
g. LGs should incorporate feedback and accountability mechanism in plans, projects and implementation of the agreed priorities.
h. Local Government accounting officers should adopt higher levels of budget transparency to enhance access to budget information with the area Councilors; and allow effective engagement with the public in prioritization, revenue collection and resource allocations.
i. Local Governments must ensure mainstreaming budget transparency and start publishing budget appropriations and budget performance reports

29
Budget and Service Delivery Monitoring Exercises
in simplified versions. This is the basis for accountability activities, and thus its quality and accessibility is a key determinant of the success of accountability mechanisms.
j. MoFPED should develop the legal and regulatory framework to provide a sound basis for the overall PIM System and management of the project cycle.
30
Budget and Service Delivery Monitoring Exercises
REFERENCES
ACODE. (2019), Decentralisation; Trends, Achievements and the Way-forward for Local Governments in Uganda: Conference Report – Summary
ACODE. (2020), Budget and Service Delivery Monitoring Report in Quarter 4 2019/20
Bainomugisha, A. et al. (2020), The Local Government Councils Scorecard FY 2018/19. Policy Research Paper Series No. 96, 2020
Ggoobi, R. and Lukwago, D. (2020). Local Government Financing: An Analysis of the Draft National Budget Estimates for FY 2020/21 and Proposals for Re-allocation
Kisaame, E., K., & Ayesigwa, R. (2020). Functionality of Value Addition Infrastructure in Uganda Budget Monitoring Report for Quarter 4 FY 2018/19
Kisaame, E., K., & Ayesigwa, R. (2020), Monitoring of Local Government Budgets and Road Transport Services in Quarter II FY 2019/20
Kisaame, E., K., & Ayesigwa, R., & Okiira, J. (2018). Monitoring Local Government Budgets and Agricultural Extension Services in Uganda” Budget Monitoring Report Quarter 1 Financial Year 2017/18.
Kisaame, E., K., & Ayesigwa, R., & Okiira, J. (2019). Monitoring Receipt of Health Grants and Health Service Delivery in Uganda for Quarter II, FY 2018/19
MoFPED. (2018). Uganda Public Financial Management Reform Strategy (July 2018 – June 2023)
MoFPED. (2019). The Second Budget Call Circular on Finalisation of Detailed Budget Estimates And Ministerial Policy Statements For FY 2019-20
MoFPED. (2020). The Second Budget Call Circular on Finalization of Detailed Budget Estimates And Ministerial Policy Statements For FY 2020-21.
MoFPED. (2021). The Second Budget Call Circular on Finalization of Detailed Budget Estimates And Ministerial Policy Statements For FY 2021-22.
OAG. (2019). Report of the Auditor General to Parliament for the Financial Year Ended 30th June 2019.
Republic of Uganda. (2018). Uganda Budget Transparency and Accountability Strategy.
01
Budget and Service Delivery Monitoring Exercises
ANNEXES
Annex 1: Trends in District Budget and Spending
Sector 2017/18 2018/19 2019/20
Budg
et
Rele
ased
Spen
t
Budg
et
Rele
ased
Spen
t
Budg
et
Rele
ased
Spen
t
Agago 21.0 22.6 21.5 26.0 24.8 23.2 29.3 27.0 21.3Amuria 22.8 24.5 21.2 24.6 20.9 19.8 N/A N/A N/AAmuru 21.71 18.99 18.67 25.71 22.25 20.95 N/A N/A N/ABududa 19.18 19.27 18.92 22.67 21.89 21.49 N/A N/A N/ABuliisa 12.61 10.07 6.77 16.00 15.01 13.97 N/A N/A N/AGulu N/A N/A N/A 34 34 28 N/A N/A N/AHoima 28.83 29.04 28.56 25.58 23.43 22.07 26.67 25.14 23.93Jinja 39.09 36.81 33.48 47.98 46.86 44.23 48.20 48.34 47.26Kabarole 29.24 29.31 28.68 25.92 26.73 25.88 28.87 28.78 26.69Kamuli N/A N/A N/A 42 41 39 43 44 42Kanungu 30.91 30.28 29.93 37.00 35.45 34.17 40.98 43.27 41.20Lira 32.58 32.46 32.27 37.32 34.28 33.30 42.29 38.77 38.48Luweero 46.79 45.89 45.87 50.79 51.08 49.21 N/A N/A N/AMbale 40.86 39.36 39.32 47.11 45.42 45.31 N/A N/A N/AMbarara 33.89 33.82 31.70 37.81 36.43 32.98 24.96 25.22 24.16Moroto 14.40 12.94 11.76 20.07 14.94 13.06 22.80 15.77 15.06Moyo 23.55 22.73 22.73 33.71 33.64 31.30 N/A N/A N/AMpigi 24.84 24.18 29.53 28.35 27.58 27.13 32.24 29.63 29.25Mukono 36.47 36.27 36.27 42.24 41.37 40.48 45.88 45.80 45.20Nakapiripit 19.27 15.91 15.46 13.24 18.22 16.39 16.12 12.56 10.62Nebbi 26.15 24.31 22.99 31.63 30.23 29.16 34.43 30.51 28.34Ntungamo 42.67 38.07 35.00 47.79 80.66 78.21 N/A N/A N/ARukungiri 31.91 33.00 32.95 36.59 36.83 35.63 38.77 38.96 37.54Soroti 25.80 24.00 22.96 26.65 24.96 23.70 33.98 30.41 29.17Tororo 47.84 45.07 44.23 55.09 52.01 48.46 64.76 60.58 59.04Wakiso 72.05 61.91 61.90 69.55 80.73 75.07 81.65 77.46 75.39
02
Budget and Service Delivery Monitoring Exercises
Annex 2: Trends in District Agriculture Sector Budget and Spending
Sector 2017/18 2018/19 2019/20
Budg
et
Rele
ased
Spen
t
Budg
et
Rele
ased
Spen
t
Budg
et
Rele
ased
Spen
t
Agago 1.97 1.97 2.44 1.65 1.65 2.45 1.06 0.64 1.97Amuria 1.96 1.76 2.22 1.66 1.61 N/A N/A N/A 1.96Amuru 1.18 1.18 1.93 1.36 1.32 N/A N/A N/A 1.18Bududa 1.32 1.29 2.70 2.66 2.66 N/A N/A N/A 1.32Buliisa 0.40 0.15 0.81 0.79 0.79 N/A N/A N/A 0.40Gulu N/A N/A 2 2 1 N/A N/A N/A N/AHoima 0.97 0.97 1.44 0.87 0.87 3.08 1.73 1.25 0.97Jinja 0.93 0.93 1.44 1.40 1.37 1.51 1.43 1.43 0.93Kabarole 0.69 0.69 1.03 1.03 1.00 1.35 1.12 0.82 0.69Kamuli N/A N/A 2 2 1 2 2 2 -Kanungu 0.97 0.86 1.61 1.60 1.57 1.54 1.53 1.45 0.97Lira 1.55 1.54 1.95 1.84 1.72 3.08 1.78 1.71 1.55Luweero 0.82 0.82 1.83 1.77 1.66 N/A N/A N/A 0.82Mbale 0.64 0.64 1.57 1.54 1.54 N/A N/A N/A 0.64Mbarara 0.97 0.84 1.37 1.44 1.12 0.80 0.79 0.78 0.97Moroto 0.51 0.51 1.66 0.86 0.77 1.51 0.70 0.61 0.51Moyo 0.77 0.77 1.54 1.78 1.78 N/A N/A N/A 0.77Mpigi 0.86 0.86 1.39 1.10 1.10 2.50 1.09 1.09 0.86Mukono 0.83 0.83 2.18 2.21 2.21 2.33 2.30 2.29 0.83Nakapiripit 0.82 0.81 0.82 0.63 0.51 0.66 0.49 0.43 0.82Nebbi 1.12 1.18 3.56 1.78 1.78 3.87 1.90 1.82 1.12Ntungamo 0.80 0.67 3.64 1.41 1.27 N/A N/A N/A 0.80Rukungiri 0.77 0.78 1.13 1.11 1.10 1.19 1.17 1.17 0.77Soroti 0.69 0.39 1.71 1.36 1.05 2.96 1.48 1.46 0.69Tororo 2.98 2.86 3.16 3.04 2.85 4.96 3.50 3.45 2.98Wakiso 1.16 1.18 1.94 1.91 1.56 2.17 1.70 1.65 1.16
03
Budget and Service Delivery Monitoring Exercises
Annex 3: Trends in District Education Sector Budget and Spending
Sector 2017/18 2018/19 2019/20
Budg
et
Rele
ased
Spen
t
Budg
et
Rele
ased
Spen
t
Budg
et
Rele
ased
Spen
t
Agago 10.4 9.3 11.7 11.8 11.0 13.5 14.3 12.0 10.4Amuria 11.7 11.2 9.2 9.1 8.6 N/A N/A N/A 11.7Amuru 7.0 6.9 8.0 7.9 7.2 N/A N/A N/A 7.0Bududa 8.7 8.6 9.1 9.1 8.9 N/A N/A N/A 8.7Buliisa 3.1 1.6 4.1 4.1 4.0 N/A N/A N/A 3.1Gulu N/A N/A 13.9 13.8 10.2 N/A N/A N/A N/AHoima 13.4 13.1 8.1 8.1 7.3 8.6 8.9 8.2 13.4Jinja 17.5 17.4 21.4 21.4 19.5 22.1 21.7 21.2 17.5Kabarole 9.4 9.4 9.2 9.2 9.1 11.0 11.2 10.5 9.4Kamuli N/A N/A 20.7 20.6 19.8 21.1 22.0 21.4 -Kanungu 15.1 14.9 17.3 17.4 16.6 19.3 20.0 18.7 15.1Lira 15.8 15.7 17.0 17.0 16.2 17.5 18.6 18.6 15.8Luweero 27.5 27.5 30.1 30.0 29.3 N/A N/A N/A 27.5Mbale 18.0 18.0 20.3 20.3 20.3 N/A N/A N/A 18.0Mbarara 19.3 17.7 21.1 21.1 18.3 12.4 12.4 11.9 19.3Moroto 5.2 4.2 5.4 5.1 4.7 6.0 5.9 5.8 5.2Moyo 7.6 7.6 9.4 9.2 9.2 N/A N/A N/A 7.6Mpigi 12.0 12.0 13.8 13.8 13.5 14.6 14.4 14.0 12.0Mukono 20.4 20.4 22.5 22.5 21.7 24.2 25.5 24.9 20.4Nakapiripit 5.3 5.1 4.0 4.2 3.8 4.9 5.2 4.2 5.3Nebbi 8.9 8.2 10.8 10.4 10.1 12.4 13.0 12.1 8.9Ntungamo 21.7 21.7 23.2 23.2 22.4 N/A N/A N/A 21.7Rukungiri 18.4 18.4 19.3 19.9 19.2 20.9 21.4 20.7 18.4Soroti 9.5 9.4 11.2 11.2 11.0 12.0 12.6 12.1 9.5Tororo 19.8 19.5 23.1 23.0 21.2 24.1 24.0 23.3 19.8Wakiso 22.7 22.7 30.5 31.2 26.5 30.2 30.2 29.9 22.7
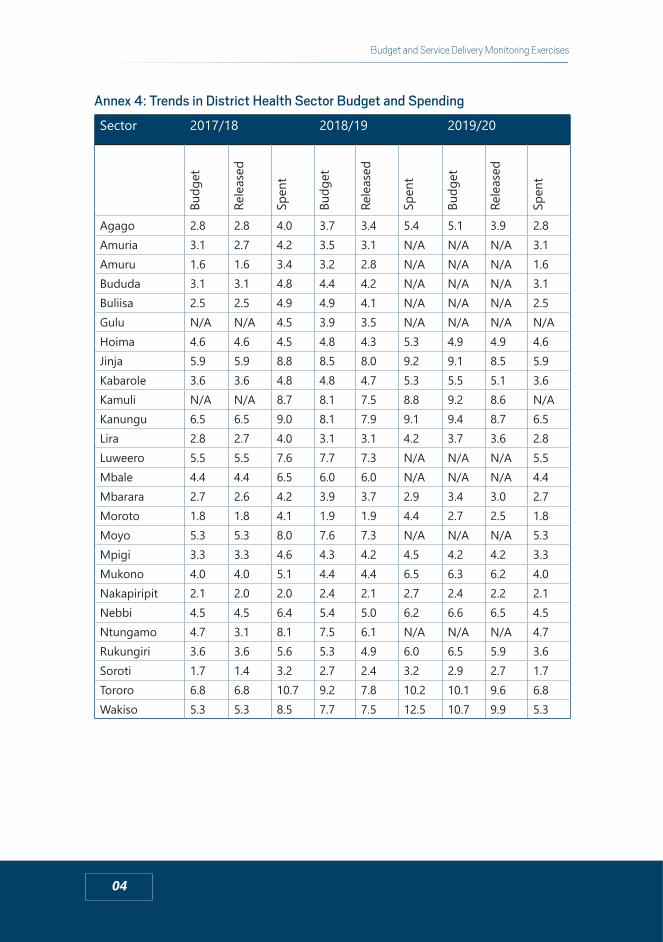
04
Budget and Service Delivery Monitoring Exercises
Annex 4: Trends in District Health Sector Budget and Spending
Sector 2017/18 2018/19 2019/20
Budg
et
Rele
ased
Spen
t
Budg
et
Rele
ased
Spen
t
Budg
et
Rele
ased
Spen
t
Agago 2.8 2.8 4.0 3.7 3.4 5.4 5.1 3.9 2.8Amuria 3.1 2.7 4.2 3.5 3.1 N/A N/A N/A 3.1Amuru 1.6 1.6 3.4 3.2 2.8 N/A N/A N/A 1.6Bududa 3.1 3.1 4.8 4.4 4.2 N/A N/A N/A 3.1Buliisa 2.5 2.5 4.9 4.9 4.1 N/A N/A N/A 2.5Gulu N/A N/A 4.5 3.9 3.5 N/A N/A N/A N/AHoima 4.6 4.6 4.5 4.8 4.3 5.3 4.9 4.9 4.6Jinja 5.9 5.9 8.8 8.5 8.0 9.2 9.1 8.5 5.9Kabarole 3.6 3.6 4.8 4.8 4.7 5.3 5.5 5.1 3.6Kamuli N/A N/A 8.7 8.1 7.5 8.8 9.2 8.6 N/AKanungu 6.5 6.5 9.0 8.1 7.9 9.1 9.4 8.7 6.5Lira 2.8 2.7 4.0 3.1 3.1 4.2 3.7 3.6 2.8Luweero 5.5 5.5 7.6 7.7 7.3 N/A N/A N/A 5.5Mbale 4.4 4.4 6.5 6.0 6.0 N/A N/A N/A 4.4Mbarara 2.7 2.6 4.2 3.9 3.7 2.9 3.4 3.0 2.7Moroto 1.8 1.8 4.1 1.9 1.9 4.4 2.7 2.5 1.8Moyo 5.3 5.3 8.0 7.6 7.3 N/A N/A N/A 5.3Mpigi 3.3 3.3 4.6 4.3 4.2 4.5 4.2 4.2 3.3Mukono 4.0 4.0 5.1 4.4 4.4 6.5 6.3 6.2 4.0Nakapiripit 2.1 2.0 2.0 2.4 2.1 2.7 2.4 2.2 2.1Nebbi 4.5 4.5 6.4 5.4 5.0 6.2 6.6 6.5 4.5Ntungamo 4.7 3.1 8.1 7.5 6.1 N/A N/A N/A 4.7Rukungiri 3.6 3.6 5.6 5.3 4.9 6.0 6.5 5.9 3.6Soroti 1.7 1.4 3.2 2.7 2.4 3.2 2.9 2.7 1.7Tororo 6.8 6.8 10.7 9.2 7.8 10.2 10.1 9.6 6.8Wakiso 5.3 5.3 8.5 7.7 7.5 12.5 10.7 9.9 5.3
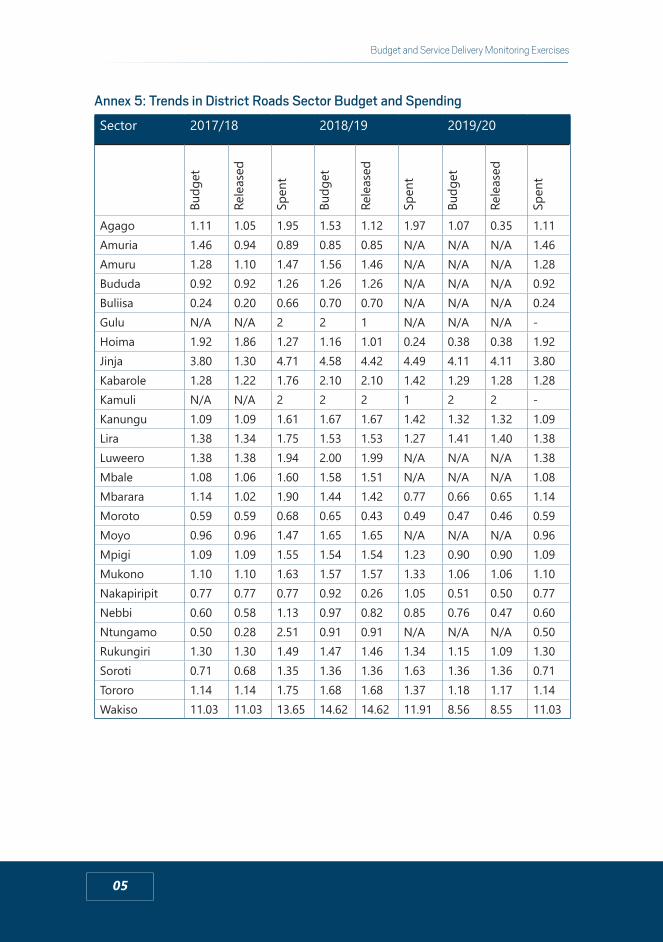
05
Budget and Service Delivery Monitoring Exercises
Annex 5: Trends in District Roads Sector Budget and Spending
Sector 2017/18 2018/19 2019/20
Budg
et
Rele
ased
Spen
t
Budg
et
Rele
ased
Spen
t
Budg
et
Rele
ased
Spen
t
Agago 1.11 1.05 1.95 1.53 1.12 1.97 1.07 0.35 1.11Amuria 1.46 0.94 0.89 0.85 0.85 N/A N/A N/A 1.46Amuru 1.28 1.10 1.47 1.56 1.46 N/A N/A N/A 1.28Bududa 0.92 0.92 1.26 1.26 1.26 N/A N/A N/A 0.92Buliisa 0.24 0.20 0.66 0.70 0.70 N/A N/A N/A 0.24Gulu N/A N/A 2 2 1 N/A N/A N/A -Hoima 1.92 1.86 1.27 1.16 1.01 0.24 0.38 0.38 1.92Jinja 3.80 1.30 4.71 4.58 4.42 4.49 4.11 4.11 3.80Kabarole 1.28 1.22 1.76 2.10 2.10 1.42 1.29 1.28 1.28Kamuli N/A N/A 2 2 2 1 2 2 -Kanungu 1.09 1.09 1.61 1.67 1.67 1.42 1.32 1.32 1.09Lira 1.38 1.34 1.75 1.53 1.53 1.27 1.41 1.40 1.38Luweero 1.38 1.38 1.94 2.00 1.99 N/A N/A N/A 1.38Mbale 1.08 1.06 1.60 1.58 1.51 N/A N/A N/A 1.08Mbarara 1.14 1.02 1.90 1.44 1.42 0.77 0.66 0.65 1.14Moroto 0.59 0.59 0.68 0.65 0.43 0.49 0.47 0.46 0.59Moyo 0.96 0.96 1.47 1.65 1.65 N/A N/A N/A 0.96Mpigi 1.09 1.09 1.55 1.54 1.54 1.23 0.90 0.90 1.09Mukono 1.10 1.10 1.63 1.57 1.57 1.33 1.06 1.06 1.10Nakapiripit 0.77 0.77 0.77 0.92 0.26 1.05 0.51 0.50 0.77Nebbi 0.60 0.58 1.13 0.97 0.82 0.85 0.76 0.47 0.60Ntungamo 0.50 0.28 2.51 0.91 0.91 N/A N/A N/A 0.50Rukungiri 1.30 1.30 1.49 1.47 1.46 1.34 1.15 1.09 1.30Soroti 0.71 0.68 1.35 1.36 1.36 1.63 1.36 1.36 0.71Tororo 1.14 1.14 1.75 1.68 1.68 1.37 1.18 1.17 1.14Wakiso 11.03 11.03 13.65 14.62 14.62 11.91 8.56 8.55 11.03
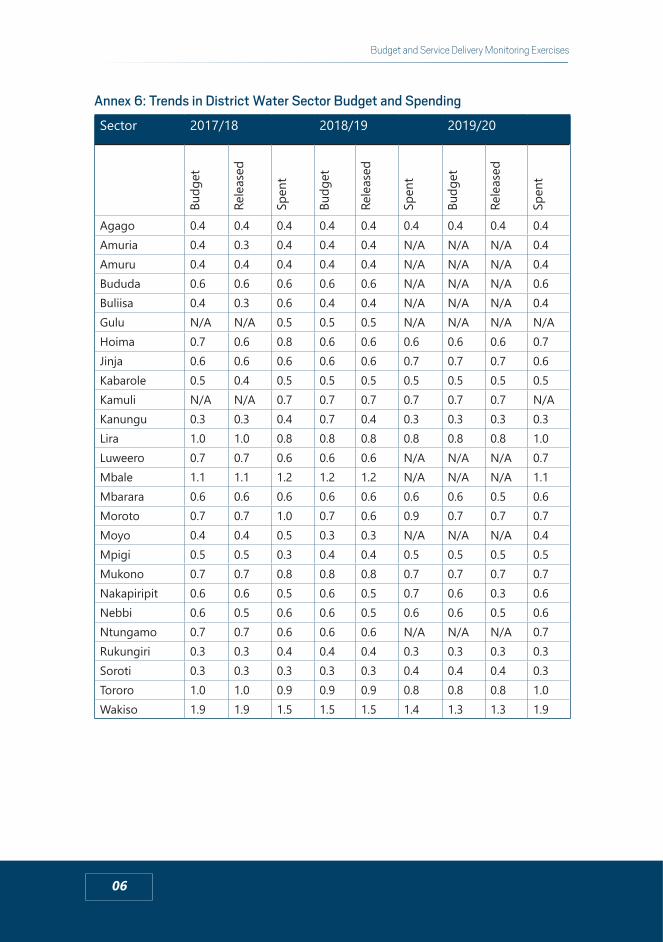
06
Budget and Service Delivery Monitoring Exercises
Annex 6: Trends in District Water Sector Budget and Spending
Sector 2017/18 2018/19 2019/20
Budg
et
Rele
ased
Spen
t
Budg
et
Rele
ased
Spen
t
Budg
et
Rele
ased
Spen
t
Agago 0.4 0.4 0.4 0.4 0.4 0.4 0.4 0.4 0.4Amuria 0.4 0.3 0.4 0.4 0.4 N/A N/A N/A 0.4Amuru 0.4 0.4 0.4 0.4 0.4 N/A N/A N/A 0.4Bududa 0.6 0.6 0.6 0.6 0.6 N/A N/A N/A 0.6Buliisa 0.4 0.3 0.6 0.4 0.4 N/A N/A N/A 0.4Gulu N/A N/A 0.5 0.5 0.5 N/A N/A N/A N/AHoima 0.7 0.6 0.8 0.6 0.6 0.6 0.6 0.6 0.7Jinja 0.6 0.6 0.6 0.6 0.6 0.7 0.7 0.7 0.6Kabarole 0.5 0.4 0.5 0.5 0.5 0.5 0.5 0.5 0.5Kamuli N/A N/A 0.7 0.7 0.7 0.7 0.7 0.7 N/AKanungu 0.3 0.3 0.4 0.7 0.4 0.3 0.3 0.3 0.3Lira 1.0 1.0 0.8 0.8 0.8 0.8 0.8 0.8 1.0Luweero 0.7 0.7 0.6 0.6 0.6 N/A N/A N/A 0.7Mbale 1.1 1.1 1.2 1.2 1.2 N/A N/A N/A 1.1Mbarara 0.6 0.6 0.6 0.6 0.6 0.6 0.6 0.5 0.6Moroto 0.7 0.7 1.0 0.7 0.6 0.9 0.7 0.7 0.7Moyo 0.4 0.4 0.5 0.3 0.3 N/A N/A N/A 0.4Mpigi 0.5 0.5 0.3 0.4 0.4 0.5 0.5 0.5 0.5Mukono 0.7 0.7 0.8 0.8 0.8 0.7 0.7 0.7 0.7Nakapiripit 0.6 0.6 0.5 0.6 0.5 0.7 0.6 0.3 0.6Nebbi 0.6 0.5 0.6 0.6 0.5 0.6 0.6 0.5 0.6Ntungamo 0.7 0.7 0.6 0.6 0.6 N/A N/A N/A 0.7Rukungiri 0.3 0.3 0.4 0.4 0.4 0.3 0.3 0.3 0.3Soroti 0.3 0.3 0.3 0.3 0.3 0.4 0.4 0.4 0.3Tororo 1.0 1.0 0.9 0.9 0.9 0.8 0.8 0.8 1.0Wakiso 1.9 1.9 1.5 1.5 1.5 1.4 1.3 1.3 1.9

Advocates Coalition for Development and Environment (ACODE)Plot 96, Kanjokya Street Kamwokya P. O. Box 29836, Kampala UGANDA Tel: +256 (0) 312812150 Email: [email protected]: www.acode-u.org
ABOUT ACODE
The Advocates Coalition for Development and Environment (ACODE) is an independent public policy research and advocacy think tank based in Uganda. ACODE’s work focuses on four programme areas: Economic Governance; Environment and Natural Resources Governance; Democracy, Peace and Security; Science, Technology and Innovation. For the last eight consecutive years, ACODE has been ranked as the best think tank in Uganda and one of the top 100 think tanks in Sub-Saharan Africa and globally in the Global Think Tanks Index Report published by the University of Pennsylvania’s Think Tanks and Civil Societies Program (TTCSP).