Embed Size (px)
Citation preview

Chapter 3 1©2005 Pearson Education, Inc.
Budget Constraints
� The Budget Line�Indicates all combinations of two
commodities for which total money spentequals total income
�We assume only 2 goods are consumed, sowe do not consider savings

Chapter 3 2©2005 Pearson Education, Inc.
The Budget Line
� Let F equal the amount of foodpurchased, and C is the amount ofclothing
�Price of food = PF and price ofclothing = PC
� Then PFF is the amount of money spenton food, and PCC is the amount of moneyspent on clothing

Chapter 3 3©2005 Pearson Education, Inc.
ICPFPCF =+
The Budget Line
� The budget line then can be written:
All income is allocated to food (F) and/or clothing(C)

Chapter 3 4©2005 Pearson Education, Inc.
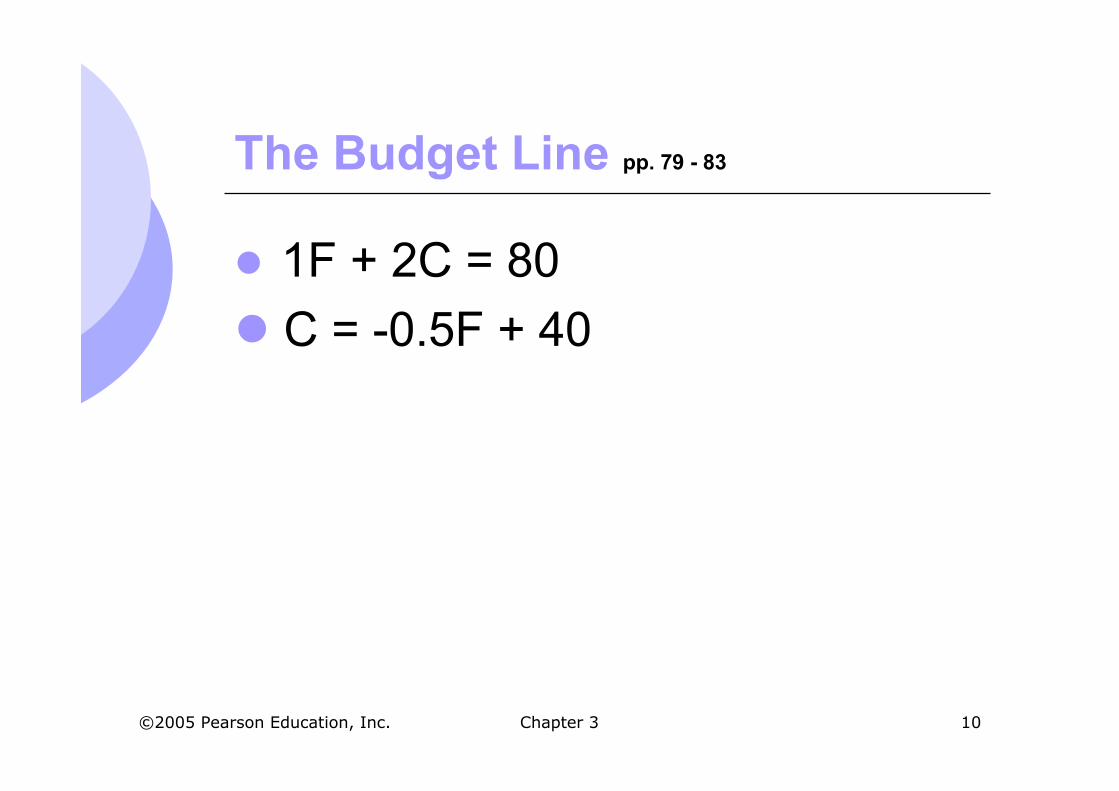
The Budget Line pp. 79 - 83
�Different choices of food and clothing canbe calculated that use all income�These choices can be graphed as the budget
line
�Example:�Assume income of $80/week, PF = $1 and PC
= $2

Chapter 3 5©2005 Pearson Education, Inc.
Budget Constraints pp. 79 - 83
$80080G
$801060E
$802040D
$803020B
$80400A
IncomeI = PFF + PCC
Clothing
PC = $2
Food
PF = $1
MarketBasket

Chapter 3 6©2005 Pearson Education, Inc.
Slope = ΔCΔF
= -12
= -PF
PC1F + 2C = 80
The Budget Line pp. 79 - 83
10
20
A
B
D
E
G
(I/PC) = 40
Food40 60 80 = (I/PF)20
10
20
30
0
Clothing

Chapter 3 7©2005 Pearson Education, Inc.
The Budget Line pp. 79 - 83
�As consumption moves along a budgetline from the intercept, the consumerspends less on one item and more on theother
� The slope of the line measures therelative cost of food and clothing
� The slope is the negative of the ratio ofthe prices of the two goods

Chapter 3 8©2005 Pearson Education, Inc.
The Budget Line pp. 79 - 83
� The slope indicates the rate at which thetwo goods can be substituted withoutchanging the amount of money spent
�We can rearrange the budget lineequation to make this more clear

Chapter 3 9©2005 Pearson Education, Inc.
The Budget Line pp. 79 - 83
YXP
P
P
I
YPXPI
YPXPI
Y
X
Y
YX
YX
=−
=−
+=
Chapter 3 10©2005 Pearson Education, Inc.
The Budget Line pp. 79 - 83
� 1F + 2C = 80
� C = -0.5F + 40

Chapter 3 11©2005 Pearson Education, Inc.
Budget Constraints pp. 79 - 83
� The Budget Line�The vertical intercept, I/PC, illustrates the
maximum amount of C that can bepurchased with income I
�The horizontal intercept, I/PF, illustrates themaximum amount of F that can bepurchased with income I

Chapter 3 12©2005 Pearson Education, Inc.
The Budget Line pp. 79 - 83
�As we know, income and prices canchange
�As incomes and prices change, there arechanges in budget lines
�We can show the effects of thesechanges on budget lines and consumerchoices

Chapter 3 13©2005 Pearson Education, Inc.
The Budget Line - Changes pp. 79 - 83
� The Effects of Changes in Income�An increase in income causes the budget
line to shift outward, parallel to the originalline (holding prices constant).
�Can buy more of both goods with moreincome
�How about when an income tax is raised?

Chapter 3 14©2005 Pearson Education, Inc.
The Budget Line - Changes pp. 79 - 83
An increase inincome shifts
the budget lineoutward
Food(units per week)
Clothing(units
per week)
80 120 16040
20
40
60
80
0
(I = $160)L2
(I = $80)L1
L3
(I =$40)
A decrease inincome shifts
the budget lineinward

Chapter 3 15©2005 Pearson Education, Inc.
The Budget Line - Changes pp. 79 - 83
� The Effects of Changes in Prices�If the price of one good increases, the
budget line shifts inward, pivoting from theother good’s intercept.
�If the price of food increases and you buyonly food (x-intercept), then you can’t buy asmuch food. The x-intercept shifts in.
�If you buy only clothing (y-intercept), you canbuy the same amount. No change in y-intercept.

Chapter 3 16©2005 Pearson Education, Inc.
The Budget Line - Changes pp. 79 - 83
� The Effects of Changes in Prices�If the price of one good decreases, the
budget line shifts outward, pivoting from theother good’s intercept.
�If the price of food decreases and you buyonly food (x-intercept), then you can buymore food. The x-intercept shifts out.
�If you buy only clothing (y-intercept), you canbuy the same amount. No change in y-intercept.

Chapter 3 17©2005 Pearson Education, Inc.
The Budget Line - Changes pp. 79 - 83
(PF = 1)
L1
An increase in theprice of food to$2.00 changesthe slope of thebudget line androtates it inward.L3
(PF = 2)(PF = 1/2)
L2
A decrease in theprice of food to$.50 changes
the slope of thebudget line and
rotates it outward.
40Food(units per week)
Clothing(units
per week)
80 120 160
40

Chapter 3 18©2005 Pearson Education, Inc.
The Budget Line - Changes pp. 79 - 83
� The Effects of Changes in Prices�If the two goods increase in price, but the
ratio of the two prices is unchanged, theslope will not change
�However, the budget line will shift inwardparallel to the original budget line
�Example: An increase in sales (Consumption)tax

Chapter 3 19©2005 Pearson Education, Inc.
The Budget Line - Changes pp. 79 - 83
� The Effects of Changes in Prices�If the two goods decrease in price, but the
ratio of the two prices is unchanged, theslope will not change
�However, the budget line will shift outwardparallel to the original budget line

Chapter 3 20©2005 Pearson Education, Inc.
Consumer Choice pp. 83 - 89
�Given preferences and budgetconstraints, how do consumers choosewhat to buy?
�Consumers choose a combination ofgoods that will maximize their satisfaction,given the limited budget available to them

Chapter 3 21©2005 Pearson Education, Inc.
Consumer Choice pp. 83 - 89
� The maximizing market basket mustsatisfy two conditions:
1. It must be located on the budget line� They spend all their income – more is better
2. It must give the consumer the mostpreferred combination of goods andservices

Chapter 3 22©2005 Pearson Education, Inc.
Consumer Choice pp. 83 - 89
�Graphically, we can see differentindifference curves of a consumerchoosing between clothing and food
�Remember that U3 > U2 > U1 for ourindifference curves
�Consumer wants to choose highest utilitywithin their budget

Chapter 3 23©2005 Pearson Education, Inc.
Consumer Choice pp. 83 - 89
U3
D
U2
C
Food (units per week)40 8020
Clothing(units per
week)
20
30
40
0
U1
A
B
•A, B, C on budget line•D highest utility but notaffordable•C highest affordableutility•Consumer chooses C

Chapter 3 24©2005 Pearson Education, Inc.
Consumer Choice pp. 83 - 89
�Consumer will choose highestindifference curve on budget line
� In previous graph, point C is where theindifference curve is just tangent to thebudget line
�Slope of the budget line equals the slopeof the indifference curve at this point

Chapter 3 25©2005 Pearson Education, Inc.
Consumer Choice pp. 83 - 89
�Recall, the slope of an indifference curveis:
F
CMRS
Δ
Δ−=
C
F
P
PSlope −=
Further, the slope of the budget line is:

Chapter 3 26©2005 Pearson Education, Inc.
Consumer Choice pp. 83 - 89
� Therefore, it can be said at consumer’soptimal consumption point,
C
F
P
PMRS =

Chapter 3 27©2005 Pearson Education, Inc.
Consumer Choice pp. 83 - 89
� It can be said that satisfaction ismaximized when marginal rate ofsubstitution (of F and C) is equal to theratio of the prices (of F and C)
�Note this is ONLY true at the optimalconsumption point

Chapter 3 28©2005 Pearson Education, Inc.
Consumer Choice pp. 83 - 89
� Optimal consumption point is where marginalbenefits equal marginal costs
� MB = MRS = benefit associated withconsumption of 1 more unit of food. Or, it showshow much you are willing to pay in units ofclothing for an additional unit of food (I.e., yoursubjective evaluation)
� MC = cost of additional unit of food�PF/PC (units of clothing you must give up in
exchange for an additional unit of food)

Chapter 3 29©2005 Pearson Education, Inc.
Consumer Choice pp. 83 - 89
� If MRS � PF/PC then individuals canreallocate basket to increase utility
� If MRS > PF/PC
�Will increase food and decrease clothing untilMRS = PF/PC
� If MRS < PF/PC
�Will increase clothing and decrease food untilMRS = PF/PC

Chapter 3 30©2005 Pearson Education, Inc.
Consumer Choice pp. 83 - 89
Food (units per week)
Clothing(units per
week)
40 8020
20
30
40
0
Point B does notmaximize satisfaction
because theMRS = -10/10 = 1
is greater than theprice ratio = 1/2
+10F U1
-10C
B

Chapter 3 31©2005 Pearson Education, Inc.
Consumer Choice:An Application Revisited pp. 83 - 89
�Consider two groups of consumers, eachwishing to spend $10,000 on the stylingand performance of a car
�Each group has different preferences

Chapter 3 32©2005 Pearson Education, Inc.
Consumer Choice:An Application Revisited pp. 83 - 89
�By finding the point of tangency betweena group’s indifference curve and thebudget constraint, auto companies cansee how much consumers value eachattribute

Chapter 3 33©2005 Pearson Education, Inc.
Consumer Choice:An Application Revisited pp. 83 - 89
Styling
Performance$10,000
$10,000 These consumerswant performance
worth $7000 and stylingworth $3000
$3,000
$7,000
Chapter 3 34©2005 Pearson Education, Inc.
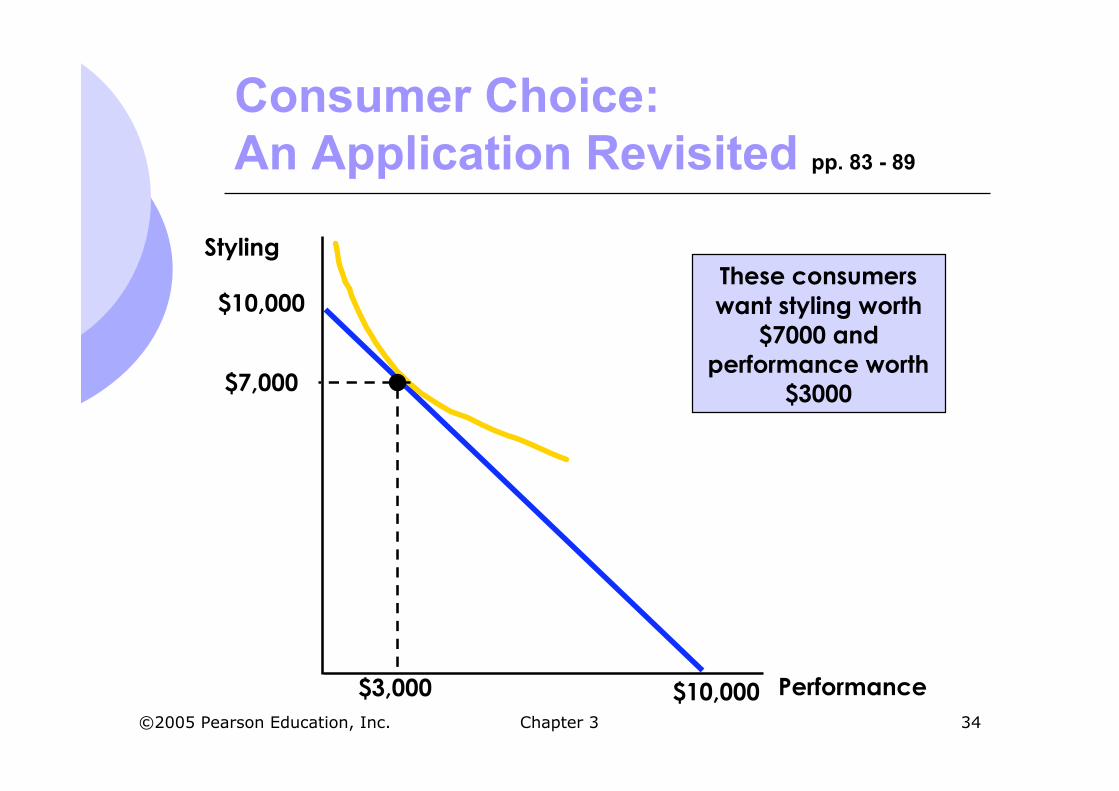
Consumer Choice:An Application Revisited pp. 83 - 89
These consumerswant styling worth
$7000 andperformance worth
$3000
$3,000
$7,000
Styling
$10,000
$10,000
Performance

Chapter 3 35©2005 Pearson Education, Inc.
Consumer Choice:An Application Revisited pp. 83 - 89
�Once a company knows preferences, itcan design a production and marketingplan
�Company can then make a sensiblestrategic business decision on how toallocate performance and styling on newcars

Chapter 3 36©2005 Pearson Education, Inc.
Consumer Choice pp. 83 - 89
�A corner solution exists if a consumerbuys in extremes, and buys all of onecategory of good and none of another�MRS is not necessarily equal to PA/PB

Chapter 3 37©2005 Pearson Education, Inc.
A Corner Solution pp. 83 - 89
Ice Cream (cup/month)
FrozenYogurt(cups
monthly)
B
A
U2 U3U1
A corner solutionexists at point B.

Chapter 3 38©2005 Pearson Education, Inc.
A Corner Solution pp. 83 - 89
� At point B, the MRS of ice cream for frozenyogurt is greater than the slope of the budgetline
� If the consumer could give up more frozenyogurt for ice cream, he would do so
� However, there is no more frozen yogurt to giveup
� Opposite is true if corner solution was at point A

Chapter 3 39©2005 Pearson Education, Inc.
A Corner Solution pp. 83 - 89
�When a corner solution arises, theconsumer’s MRS does not necessarilyequal the price ratio
� In this instance it can be said that:
YogurtFrozen
IceCream
P
PMRS ≥

Chapter 3 40©2005 Pearson Education, Inc.
A Corner Solution pp. 83 - 89
� If the MRS is, in fact, significantly greaterthan the price ratio, then a smalldecrease in the price of frozen yogurt willnot alter the consumer’s market basket