Embed Size (px)
Citation preview
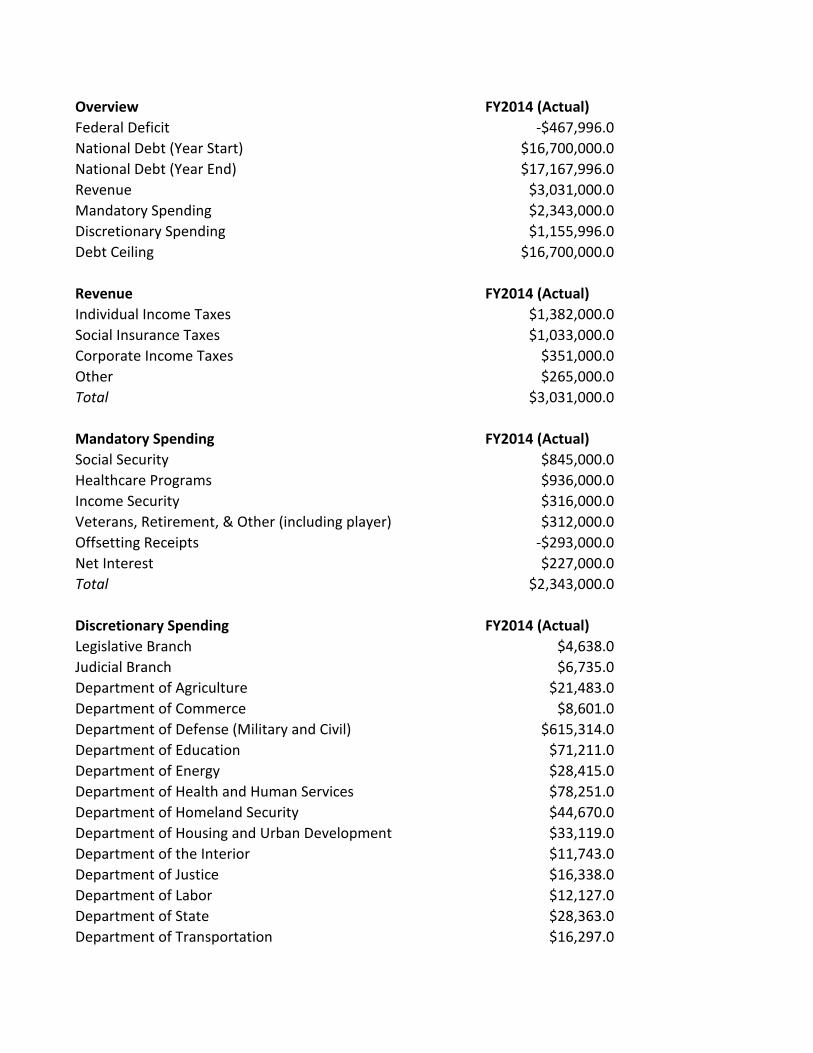
Overview FY2014 (Actual)
Federal Deficit -$467,996.0
National Debt (Year Start) $16,700,000.0
National Debt (Year End) $17,167,996.0
Revenue $3,031,000.0
Mandatory Spending $2,343,000.0
Discretionary Spending $1,155,996.0
Debt Ceiling $16,700,000.0
Revenue FY2014 (Actual)
Individual Income Taxes $1,382,000.0
Social Insurance Taxes $1,033,000.0
Corporate Income Taxes $351,000.0
Other $265,000.0
Total $3,031,000.0
Mandatory Spending FY2014 (Actual)
Social Security $845,000.0
Healthcare Programs $936,000.0
Income Security $316,000.0
Veterans, Retirement, & Other (including player) $312,000.0
Offsetting Receipts -$293,000.0
Net Interest $227,000.0
Total $2,343,000.0
Discretionary Spending FY2014 (Actual)
Legislative Branch $4,638.0
Judicial Branch $6,735.0
Department of Agriculture $21,483.0
Department of Commerce $8,601.0
Department of Defense (Military and Civil) $615,314.0
Department of Education $71,211.0
Department of Energy $28,415.0
Department of Health and Human Services $78,251.0
Department of Homeland Security $44,670.0
Department of Housing and Urban Development $33,119.0
Department of the Interior $11,743.0
Department of Justice $16,338.0
Department of Labor $12,127.0
Department of State $28,363.0
Department of Transportation $16,297.0
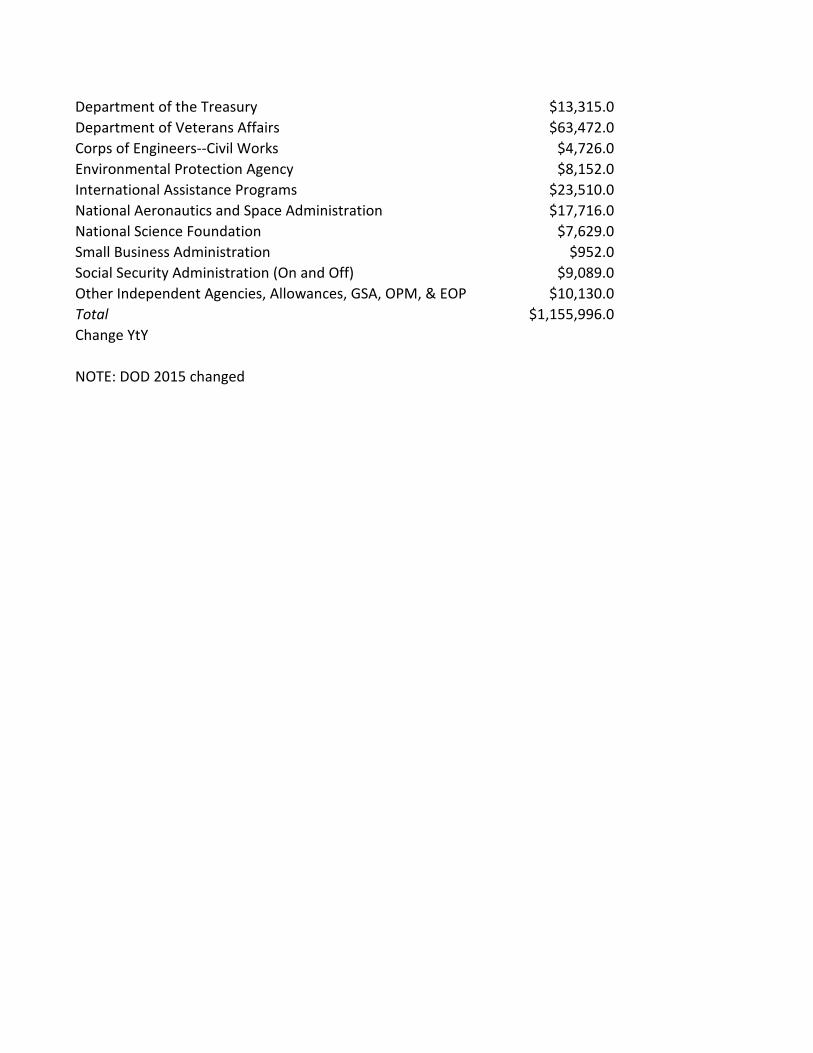
Department of the Treasury $13,315.0
Department of Veterans Affairs $63,472.0
Corps of Engineers--Civil Works $4,726.0
Environmental Protection Agency $8,152.0
International Assistance Programs $23,510.0
National Aeronautics and Space Administration $17,716.0
National Science Foundation $7,629.0
Small Business Administration $952.0
Social Security Administration (On and Off) $9,089.0
Other Independent Agencies, Allowances, GSA, OPM, & EOP $10,130.0
Total $1,155,996.0
Change YtY
NOTE: DOD 2015 changed

FY2015 (Actual) FY2016 (Actual) FY2017 (Actual) FY2018 (Projected)
-$479,758.3 -$583,305.7 -$923,954.1 -$1,271,892.4
$17,167,996.0 $17,647,754.3 $18,231,060.0 $19,155,014.1
$17,647,754.3 $18,231,060.0 $19,155,014.1 $20,426,906.5
$3,295,556.7 $3,464,440.1 $3,340,263.4 $3,340,020.8
$2,592,500.0 $2,898,189.8 $3,118,226.5 $3,461,538.2
$1,182,815.0 $1,149,556.0 $1,145,991.0 $1,150,375.0
$16,700,000.0 $18,500,000.0 $18,500,000.0 $21,000,000.0
FY2015 (Actual) FY2016 (Actual) FY2017 (Actual) FY2018 (Projected)
$1,545,000.0 $1,649,007.0 $1,630,988.0 $1,671,698.15
$1,071,000.0 $1,114,000.0 $1,094,761.0 $1,103,347.00
$392,556.7 $428,433.1 $412,514.4 $367,215.67
$287,000.0 $273,000.0 $202,000.0 $197,760.0
$3,295,556.7 $3,464,440.1 $3,340,263.4 $3,340,020.8
FY2015 (Actual) FY2016 (Actual) FY2017 (Actual) FY2018 (Projected)
$884,000.0 $931,000.0 $966,865.0 $1,028,099.6
$1,020,000.0 $1,134,000.0 $1,192,000.0 $1,233,000.0
$321,500.0 $349,000.0 $322,000.0 $348,000.0
$322,000.0 $393,189.8 $480,361.5 $615,438.6
-$221,000.0 -$232,000.0 -$243,000.0 -$254,000.0
$266,000.0 $323,000.0 $400,000.0 $491,000.0
$2,592,500.0 $2,898,189.8 $3,118,226.5 $3,461,538.2
FY2015 (Actual) FY2016 (Actual) FY2017 (Actual) FY2018 (Actual)
$4,760.0 $4,700.0 $4,700.0 $4,700.0
$6,913.0 $7,000.0 $7,000.0 $7,150.0
$23,148.0 $23,250.0 $23,250.0 $23,250.0
$9,107.0 $9,050.0 $9,050.0 $9,250.0
$601,889.0 $570,000.0 $570,000.0 $560,000.0
$71,897.0 $72,847.0 $73,000.0 $74,500.0
$28,284.0 $28,250.0 $28,250.0 $28,250.0
$83,900.0 $83,900.0 $83,900.0 $85,500.0
$39,734.0 $39,000.0 $39,000.0 $41,000.0
$33,869.0 $33,860.0 $33,860.0 $33,750.0
$12,131.0 $11,800.0 $11,200.0 $11,425.0
$28,756.0 $27,000.0 $27,000.0 $27,500.0
$12,312.0 $11,550.0 $11,550.0 $11,750.0
$27,223.0 $26,650.0 $26,650.0 $27,000.0
$17,191.0 $17,508.0 $17,650.0 $18,500.0
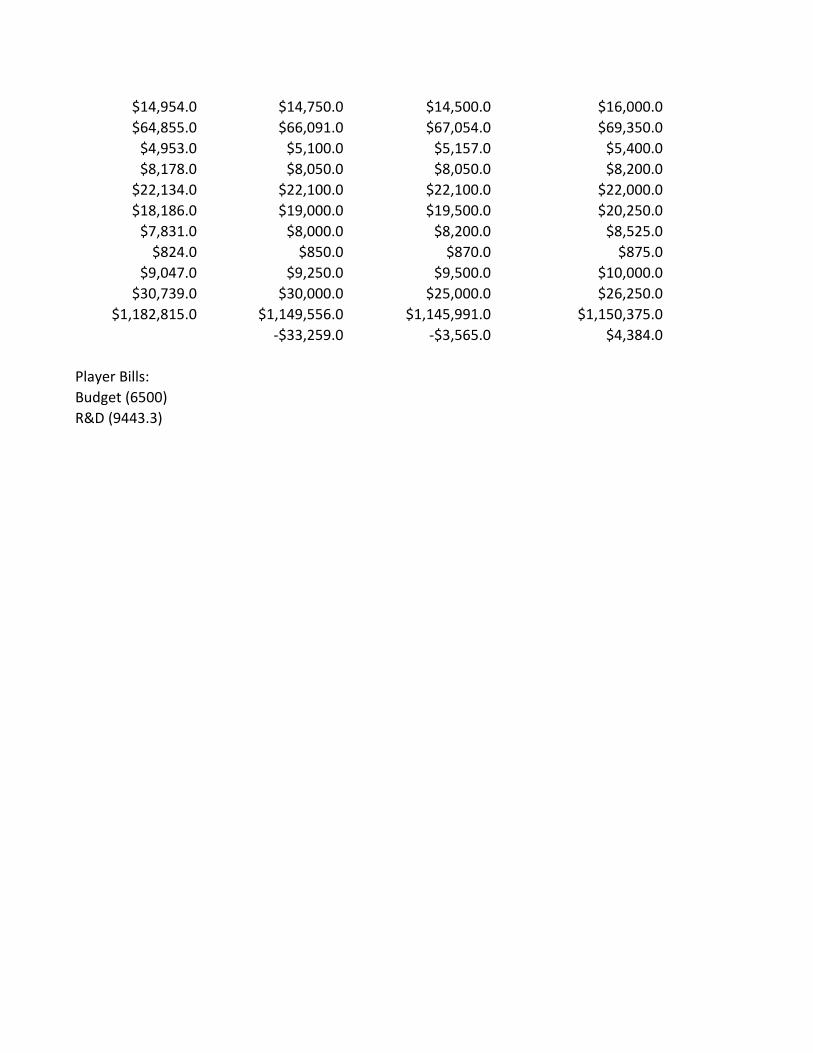
$14,954.0 $14,750.0 $14,500.0 $16,000.0
$64,855.0 $66,091.0 $67,054.0 $69,350.0
$4,953.0 $5,100.0 $5,157.0 $5,400.0
$8,178.0 $8,050.0 $8,050.0 $8,200.0
$22,134.0 $22,100.0 $22,100.0 $22,000.0
$18,186.0 $19,000.0 $19,500.0 $20,250.0
$7,831.0 $8,000.0 $8,200.0 $8,525.0
$824.0 $850.0 $870.0 $875.0
$9,047.0 $9,250.0 $9,500.0 $10,000.0
$30,739.0 $30,000.0 $25,000.0 $26,250.0
$1,182,815.0 $1,149,556.0 $1,145,991.0 $1,150,375.0
-$33,259.0 -$3,565.0 $4,384.0
Player Bills:
Budget (6500)
R&D (9443.3)
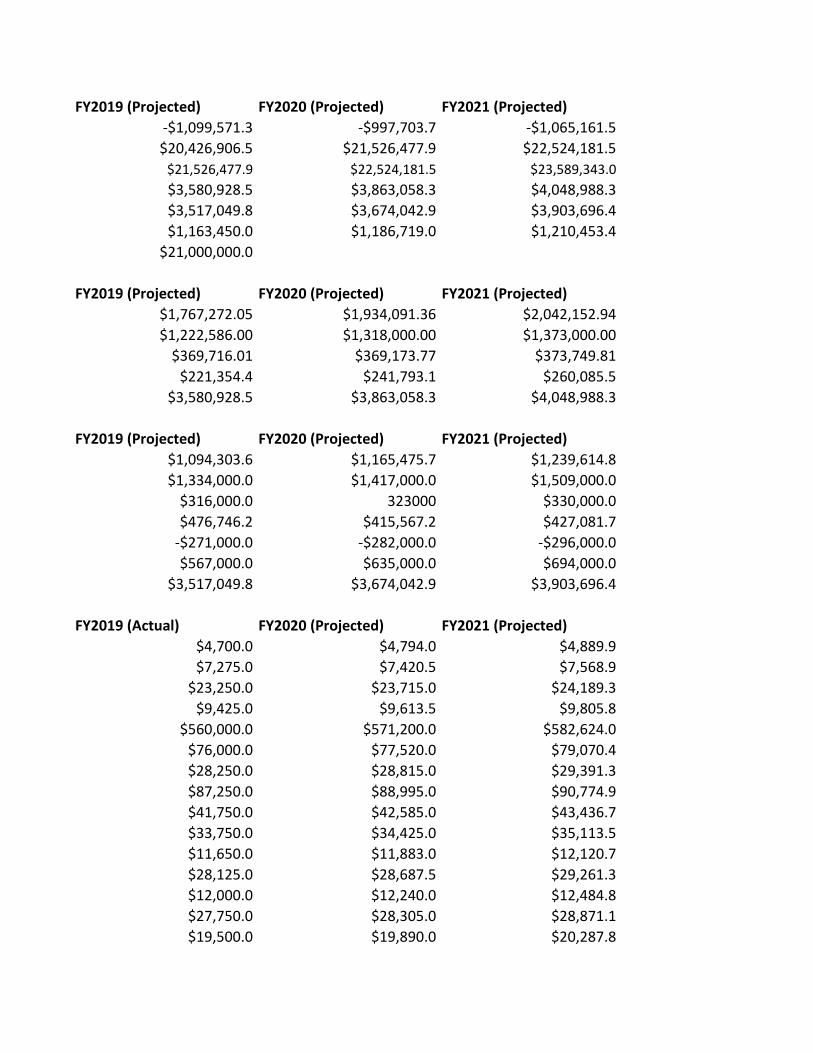
FY2019 (Projected) FY2020 (Projected) FY2021 (Projected)
-$1,099,571.3 -$997,703.7 -$1,065,161.5
$20,426,906.5 $21,526,477.9 $22,524,181.5
$21,526,477.9 $22,524,181.5 $23,589,343.0
$3,580,928.5 $3,863,058.3 $4,048,988.3
$3,517,049.8 $3,674,042.9 $3,903,696.4
$1,163,450.0 $1,186,719.0 $1,210,453.4
$21,000,000.0
FY2019 (Projected) FY2020 (Projected) FY2021 (Projected)
$1,767,272.05 $1,934,091.36 $2,042,152.94
$1,222,586.00 $1,318,000.00 $1,373,000.00
$369,716.01 $369,173.77 $373,749.81
$221,354.4 $241,793.1 $260,085.5
$3,580,928.5 $3,863,058.3 $4,048,988.3
FY2019 (Projected) FY2020 (Projected) FY2021 (Projected)
$1,094,303.6 $1,165,475.7 $1,239,614.8
$1,334,000.0 $1,417,000.0 $1,509,000.0
$316,000.0 323000 $330,000.0
$476,746.2 $415,567.2 $427,081.7
-$271,000.0 -$282,000.0 -$296,000.0
$567,000.0 $635,000.0 $694,000.0
$3,517,049.8 $3,674,042.9 $3,903,696.4
FY2019 (Actual) FY2020 (Projected) FY2021 (Projected)
$4,700.0 $4,794.0 $4,889.9
$7,275.0 $7,420.5 $7,568.9
$23,250.0 $23,715.0 $24,189.3
$9,425.0 $9,613.5 $9,805.8
$560,000.0 $571,200.0 $582,624.0
$76,000.0 $77,520.0 $79,070.4
$28,250.0 $28,815.0 $29,391.3
$87,250.0 $88,995.0 $90,774.9
$41,750.0 $42,585.0 $43,436.7
$33,750.0 $34,425.0 $35,113.5
$11,650.0 $11,883.0 $12,120.7
$28,125.0 $28,687.5 $29,261.3
$12,000.0 $12,240.0 $12,484.8
$27,750.0 $28,305.0 $28,871.1
$19,500.0 $19,890.0 $20,287.8
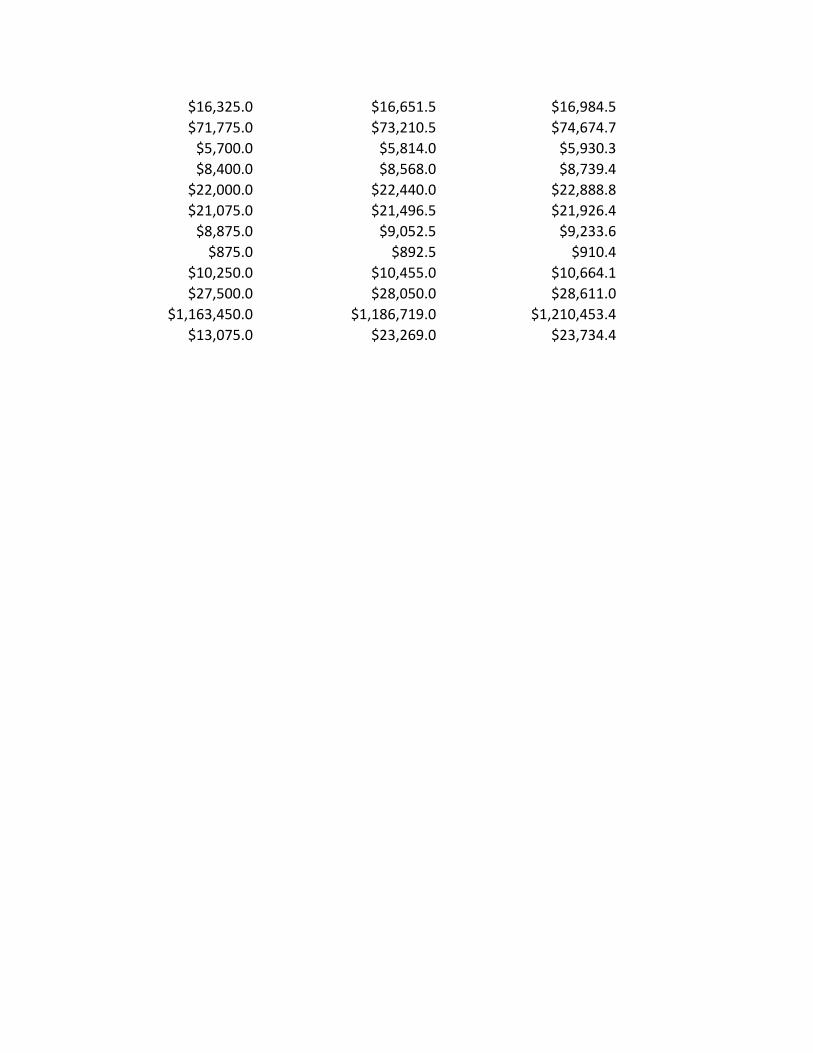
$16,325.0 $16,651.5 $16,984.5
$71,775.0 $73,210.5 $74,674.7
$5,700.0 $5,814.0 $5,930.3
$8,400.0 $8,568.0 $8,739.4
$22,000.0 $22,440.0 $22,888.8
$21,075.0 $21,496.5 $21,926.4
$8,875.0 $9,052.5 $9,233.6
$875.0 $892.5 $910.4
$10,250.0 $10,455.0 $10,664.1
$27,500.0 $28,050.0 $28,611.0
$1,163,450.0 $1,186,719.0 $1,210,453.4
$13,075.0 $23,269.0 $23,734.4
FY2022 (Projected) FY2023 (Projected) FY2024 (Projected)
-$1,171,572.1 -$1,174,660.5 -$1,170,868.6
$23,589,343.0 $24,760,915.1 $25,935,575.6
$24,760,915.1 $25,935,575.6 $27,106,444.2
$4,249,792.7 $4,459,347.9 $4,680,997.7
$4,186,702.3 $4,374,652.8 $4,567,323.5
$1,234,662.4 $1,259,355.7 $1,284,542.8
FY2022 (Projected) FY2023 (Projected) FY2024 (Projected)
$2,157,625.96 $2,279,347.90 $2,407,370.69
$1,433,000.00 $1,494,000.00 $1,558,000.00
$380,926.30 $392,071.66 $403,095.03
$278,240.4 $293,928.4 $312,532.0
$4,249,792.7 $4,459,347.9 $4,680,997.7
FY2022 (Projected) FY2023 (Projected) FY2024 (Projected)
$1,317,719.3 $1,398,788.1 $1,482,819.6
$1,640,000.0 $1,705,000.0 $1,770,000.0
$342,000.0 $344,000.0 $346,000.0
$444,983.0 $438,864.7 $435,503.8
-$313,000.0 -$330,000.0 -$343,000.0
$755,000.0 $818,000.0 $876,000.0
$4,186,702.3 $4,374,652.8 $4,567,323.5
FY2022 (Projected) FY2023 (Projected) FY2024 (Projected)
$4,987.7 $5,087.4 $5,189.2
$7,720.3 $7,874.7 $8,032.2
$24,673.1 $25,166.5 $25,669.9
$10,001.9 $10,201.9 $10,406.0
$594,276.5 $606,162.0 $618,285.2
$80,651.8 $82,264.8 $83,910.1
$29,979.1 $30,578.7 $31,190.3
$92,590.4 $94,442.2 $96,331.1
$44,305.4 $45,191.5 $46,095.4
$35,815.8 $36,532.1 $37,262.7
$12,363.1 $12,610.3 $12,862.5
$29,846.5 $30,443.4 $31,052.3
$12,734.5 $12,989.2 $13,249.0
$29,448.5 $30,037.5 $30,638.2
$20,693.6 $21,107.4 $21,529.6
$17,324.2 $17,670.7 $18,024.1
$76,168.2 $77,691.6 $79,245.4
$6,048.9 $6,169.9 $6,293.3
$8,914.1 $9,092.4 $9,274.3
$23,346.6 $23,813.5 $24,289.8
$22,365.0 $22,812.3 $23,268.5
$9,418.2 $9,606.6 $9,798.7
$928.6 $947.1 $966.1
$10,877.4 $11,094.9 $11,316.8
$29,183.2 $29,766.9 $30,362.2
$1,234,662.4 $1,259,355.7 $1,284,542.8
$24,209.1 $24,693.2 $25,187.1
GENERAL DIRECT SPENDING 2016 2017 2018
Ignore this line
SAVE 3 3 3
Home Foreclosure 280 280 280
Pathway to Citizenship 2000 2360 2407.2
DREAM Act 187 175 174
Affordable Gas Price 46100 46000 43240
STEM Act 1616 168 168
Reserve Small Business 3 4 4
HEARTS Ac 0.75 0.5 0.5
Pell Grant Expansion 0 13300 18800
Job Creation Efficient Manufacturing Act 0 270 0
Advancing America Act(2) 0 67239 111653
Democracy Day 0 0 40.5
CVHBMRPRA 0 4562 5109.44
Rape Survivor Child Custody Act 0 0 5
Hydropower Renewable Energy Development Act 0 0 350
Protecting Students from Sexual ... Act (Earmark) 0 0 14
Weekends Without Hunger Act 0 0 100
Nonprofit Energy Efficiency Act 0 0 50
Recidivism Reduction and Public Safety Act 0 0 0
Rural Broadband Access Grant Act 0 0 500
FARM Bill Extension (Continuing Resolution) 0 0 89250
Family Act 0 0 5000
Disarm Criminals and Protect Communities Act 0 0 116
Pell Grant Verification (Default Act) 0 0 -1000
Carried Interest Reform (Default Act) 0 0 1074
WIN P3 Act 0 0 9000
Mississippi River Navigation Sustainment Act 0 0 1100
0 0
0 0
0 0
0 0
0 0
TOTAL SPENDING 50189.75 134361.5 287438.64
UNEMPLOYMENT EXTENSION 26000 0 26000
INDIVIDUAL REVENUE 2016 2017 2018
SAVE -1467 -1186 -1741
Pathway to Citizenship 1500 1665 1848.15
DREAM Act -26 9 57
Child Tax Credit Restoration 0 -40000 -40200
College Affordability Act 0 -82500 -85800
Teacher Tax Deduction Enhancement Act 0 0 -300
Making Work Pay extension (Continuing Resolution) 0 0 -66166
Mortgage Interest Reform (Default Act) 0 0 5500
EITC Income Verification (Default Act) 0 0 8500
0 0
0 0
0 0
0 0
0 0
0 0
0 0
0 0
0 0
0 0
0 0
0 0
0 0
0 0
TOTAL 7 -122012 -178301.85
CORPORATE REVENUE 2016 2017 2018
NIB (CORP) 0 -5672.7 -5956.335
Innovative Sm. Bus. (CORP) -213.9 -223.5255 0
Bring Jobs Home Act -9 -9.405 0
R&D Expansion -10344 0 0
Advancing America Act(3) 0 -37382 -29101
Advancing America Act(4) 0 -12198 -12892
Advancing America Act(5) 0 9000 9200
Protecting Students from Sexual ... Act (R&D Perm.) 0 0 0
Protecting Students from Sexual ... Act (Bonus Dep.) 0 0 -50000
Protecting Students from Sexual ... Act (Film) 0 0 -85
Small Business Investment Promotion Act 0 0 0
Renewable Energy extension (Continuing Resolution) 0 0 -1499
Incentivising Offshore Wind Power Act 0 0 -1210
Help Entrepreneurs Create American Jobs Act 0 0 -700
Extending Job Creating Tax Credits Act 0 0 1459
0 0
0 0
0 0
0 0
TOTAL -10566.9 -46485.631 -90784.335
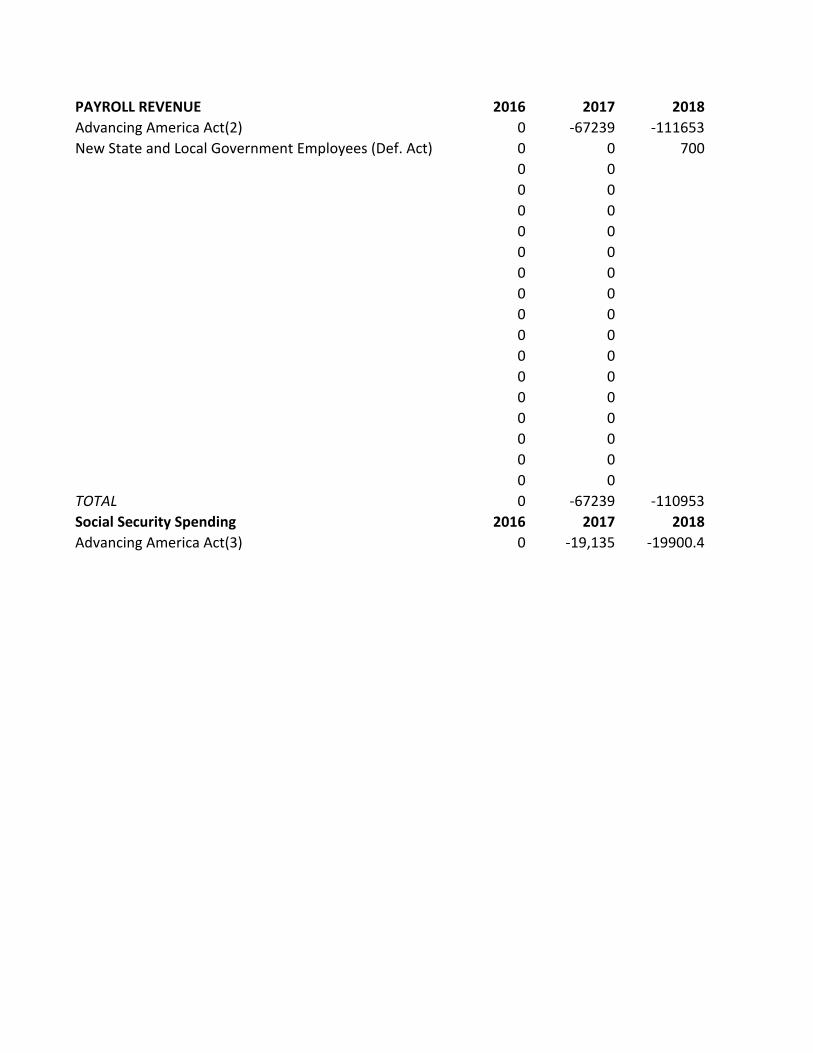
PAYROLL REVENUE 2016 2017 2018
Advancing America Act(2) 0 -67239 -111653
New State and Local Government Employees (Def. Act) 0 0 700
0 0
0 0
0 0
0 0
0 0
0 0
0 0
0 0
0 0
0 0
0 0
0 0
0 0
0 0
0 0
0 0
TOTAL 0 -67239 -110953
Social Security Spending 2016 2017 2018
Advancing America Act(3) 0 -19,135 -19900.4
2019 2020 2021 2022 2023 2024 2025
3 3 3 3 3 3 3
280 280 280 280 280 280 280
2455.344 2504.45088 2554.5399 2605.6307 2657.74331 2710.89818 2765.11614
221 262 281 322 355 354
40645.6 38206.864 35914.4522 33759.585 32071.6058 30468.0255 28944.6242
168 168 168 168 168 168 168
4 4 4 4 4 5 5
0 0 0 0 0 0 0
23600 0 0 0 0 0 0
0 0 0 0 0 0 0
44414 0 0 0 0 0 0
0 40.5 0 40.5 0 40.5 0
5722.5728 6409.28154 7178.39532 8039.80276 9004.57909 10085.1286 11295.344
5 5 5 5 0 0 0
350 350 350 350 350 350 350
0 0 0 0 0 0 0
100 0 0 0 0 0 0
50 50 0 0 0 0 0
0 TBD TBD TBD TBD TBD TBD
500 500 500 500 0 0 0
0 0 0 0 0 0 0
5000 5000 5000 5000 5000 5000 5000
0 0 0 0 0 0 0
-1000 -500 -500 -500 -500 -500 -500
1127.7 1184.085 1243.28925 1305.45371 1370.7264 1439.26272 1511.22585
0 0 0 0 0 0 0
1100 1100 1100 1100 1100 1100 1100
124746.217 55567.1814 54081.6766 52982.9722 51864.6546 51503.815 50922.3102
0 0 0 0 0 0 0
2019 2020 2021 2022 2023 2024 2025
-1799 -1884 -2021 -2157 -2302 -2459
2051.4465 2277.10562 2527.58723 2805.62183 3114.24023 3456.80665 3837.05539
94 114 131 153 178 203
-40401 -40603.005 -40806.02 -41010.05 -41215.1 -41421.176 -41628.282
-89232 -92801.28 -96513.331 -100373.86 -104388.82 -108564.37 -112906.95
-300 -300 0 0 0 0 0
-66166 0 0 0 0 0 0
11024.6 12788.536 14834.7018 17208.254 19961.5747 23155.4266 26860.2949
5000 4500 4000 4000 4000 4000 4000
-179727.95 -115908.64 -117847.06 -119374.04 -120652.1 -121629.31 -119837.88
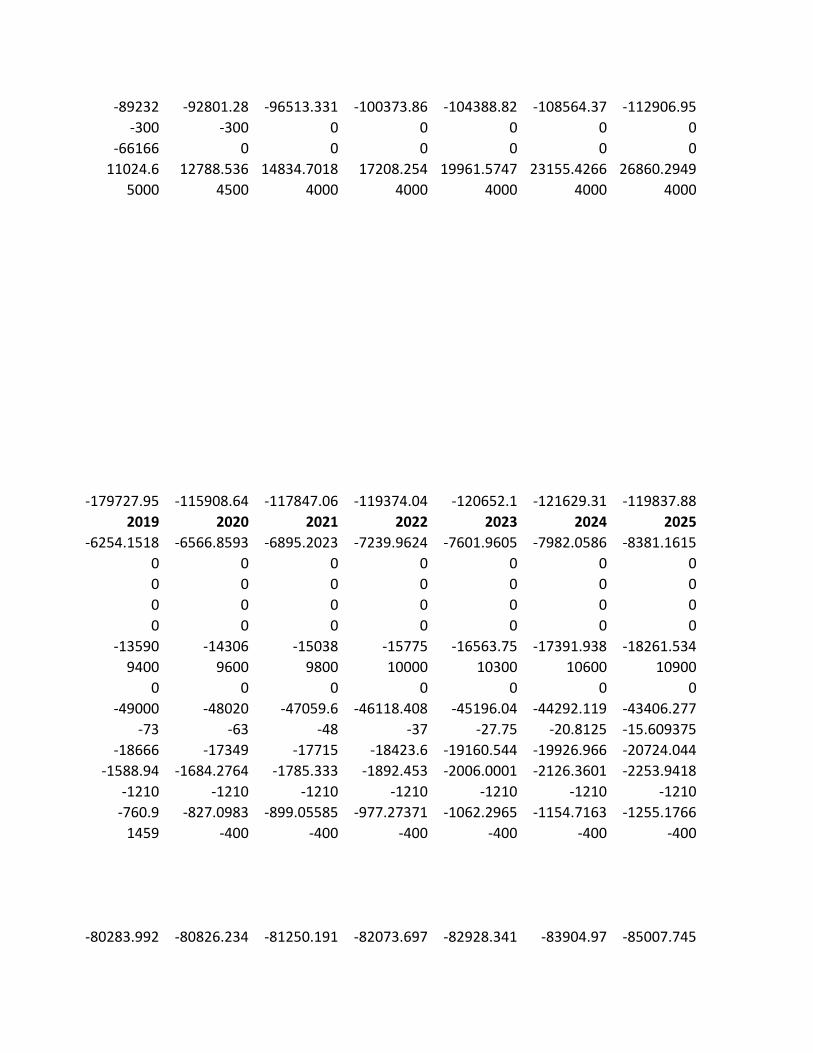
2019 2020 2021 2022 2023 2024 2025
-6254.1518 -6566.8593 -6895.2023 -7239.9624 -7601.9605 -7982.0586 -8381.1615
0 0 0 0 0 0 0
0 0 0 0 0 0 0
0 0 0 0 0 0 0
0 0 0 0 0 0 0
-13590 -14306 -15038 -15775 -16563.75 -17391.938 -18261.534
9400 9600 9800 10000 10300 10600 10900
0 0 0 0 0 0 0
-49000 -48020 -47059.6 -46118.408 -45196.04 -44292.119 -43406.277
-73 -63 -48 -37 -27.75 -20.8125 -15.609375
-18666 -17349 -17715 -18423.6 -19160.544 -19926.966 -20724.044
-1588.94 -1684.2764 -1785.333 -1892.453 -2006.0001 -2126.3601 -2253.9418
-1210 -1210 -1210 -1210 -1210 -1210 -1210
-760.9 -827.0983 -899.05585 -977.27371 -1062.2965 -1154.7163 -1255.1766
1459 -400 -400 -400 -400 -400 -400
-80283.992 -80826.234 -81250.191 -82073.697 -82928.341 -83904.97 -85007.745
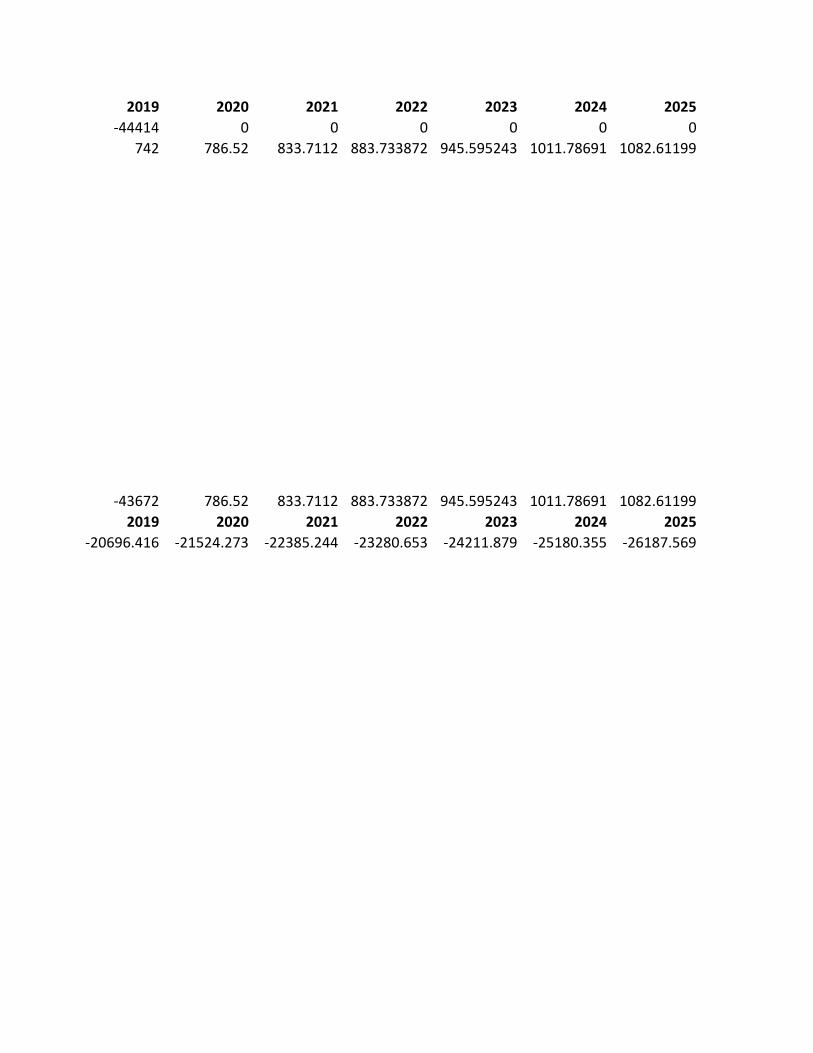
2019 2020 2021 2022 2023 2024 2025
-44414 0 0 0 0 0 0
742 786.52 833.7112 883.733872 945.595243 1011.78691 1082.61199
-43672 786.52 833.7112 883.733872 945.595243 1011.78691 1082.61199
2019 2020 2021 2022 2023 2024 2025
-20696.416 -21524.273 -22385.244 -23280.653 -24211.879 -25180.355 -26187.569
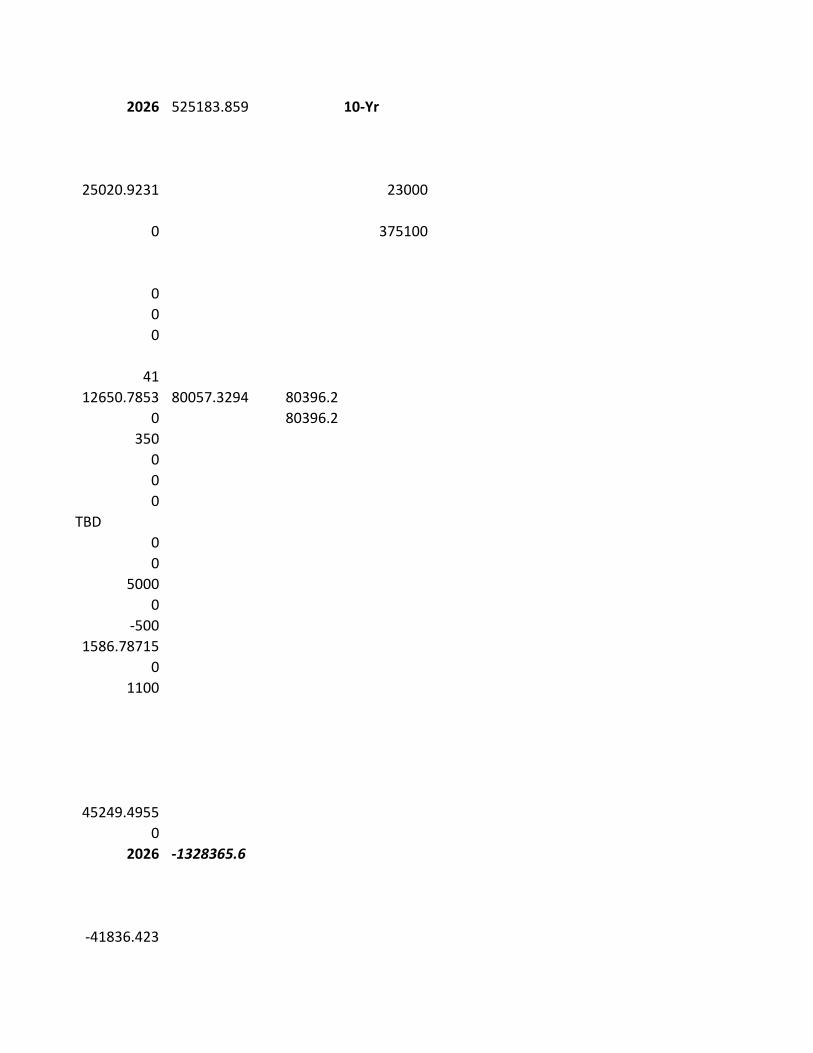
2026 525183.859 10-Yr
25020.9231 23000
0 375100
0
0
0
41
12650.7853 80057.3294 80396.2
0 80396.2
350
0
0
0
TBD
0
0
5000
0
-500
1586.78715
0
1100
45249.4955
0
2026 -1328365.6
-41836.423
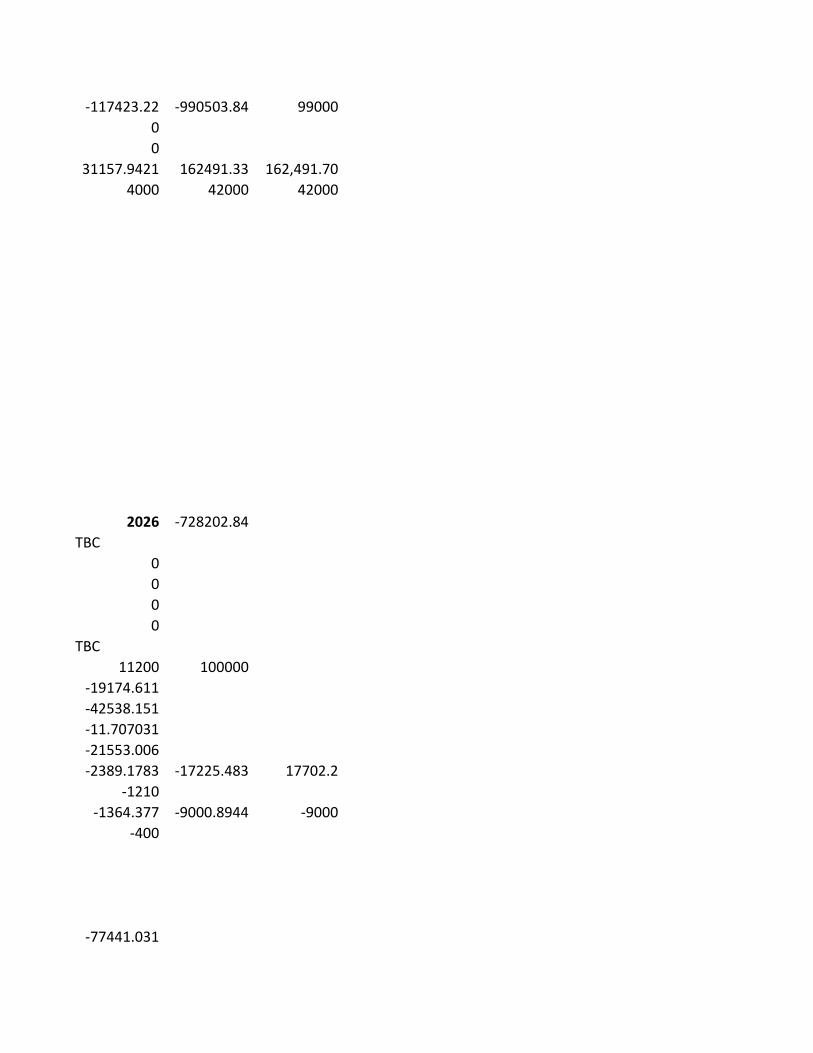
-117423.22 -990503.84 99000
0
0
31157.9421 162491.33 162,491.70
4000 42000 42000
2026 -728202.84
TBC
0
0
0
0
TBC
11200 100000
-19174.611
-42538.151
-11.707031
-21553.006
-2389.1783 -17225.483 17702.2
-1210
-1364.377 -9000.8944 -9000
-400
-77441.031
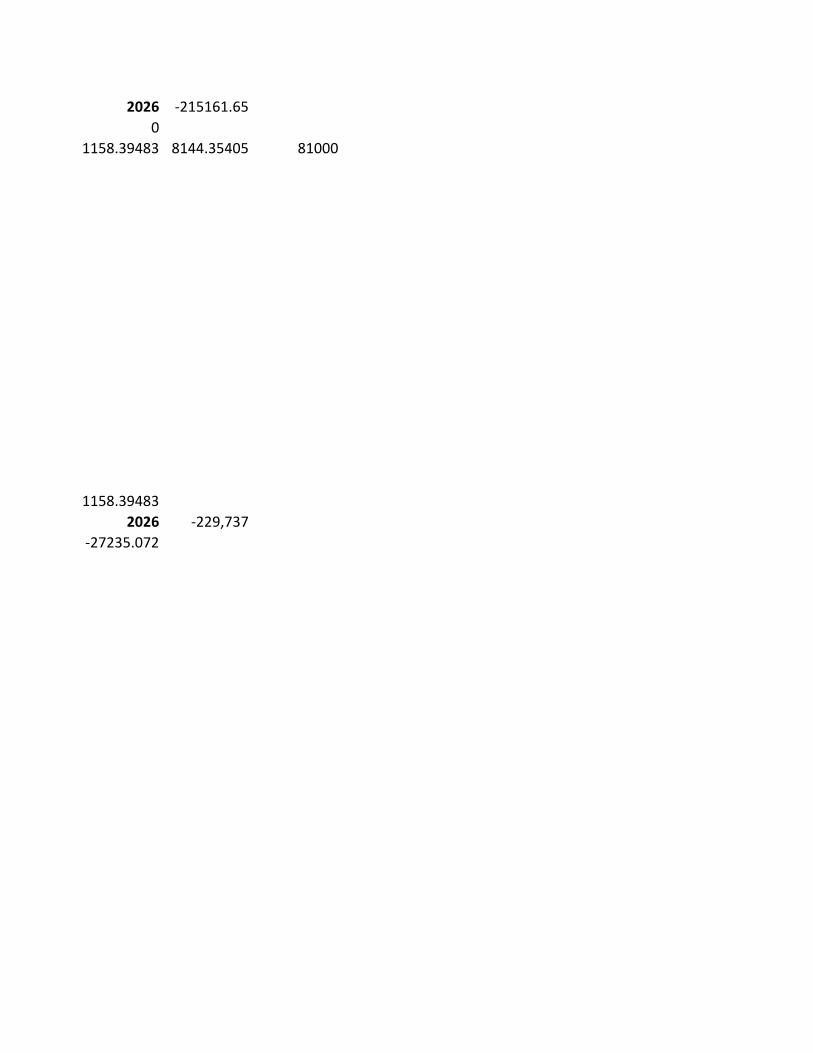
2026 -215161.65
0
1158.39483 8144.35405 81000
1158.39483
2026 -229,737
-27235.072
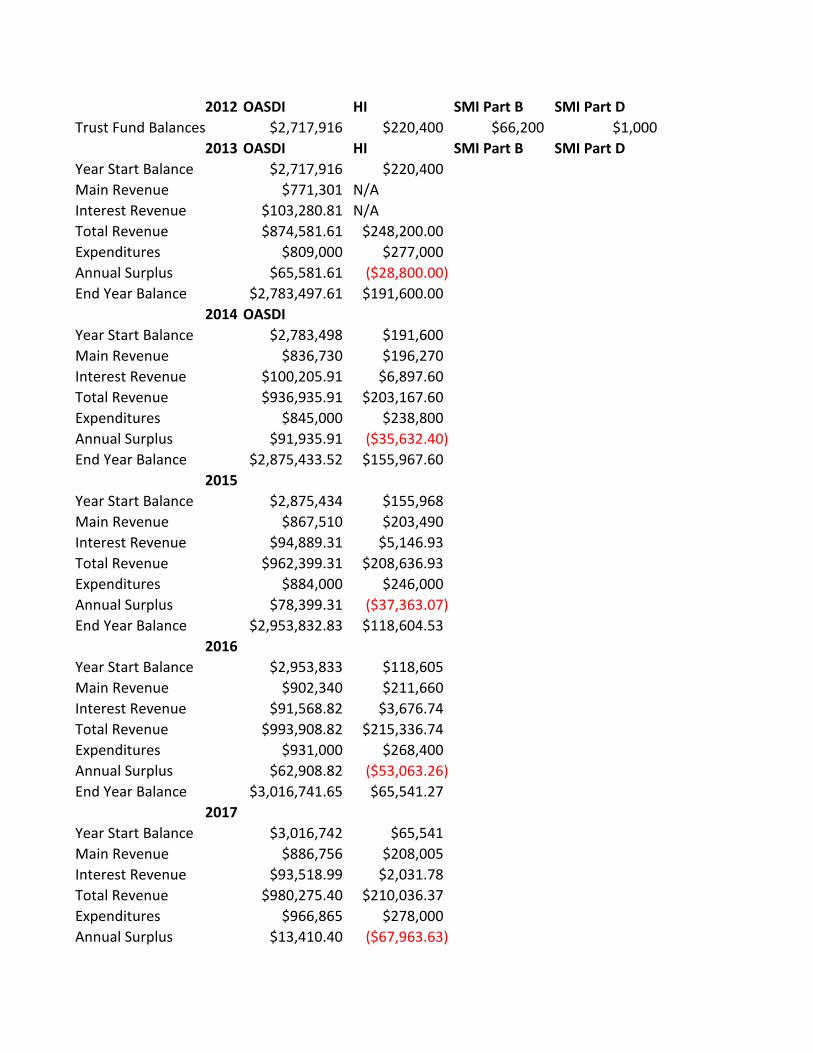
2012 OASDI HI SMI Part B SMI Part D
Trust Fund Balances $2,717,916 $220,400 $66,200 $1,000
2013 OASDI HI SMI Part B SMI Part D
Year Start Balance $2,717,916 $220,400
Main Revenue $771,301 N/A
Interest Revenue $103,280.81 N/A
Total Revenue $874,581.61 $248,200.00
Expenditures $809,000 $277,000
Annual Surplus $65,581.61 ($28,800.00)
End Year Balance $2,783,497.61 $191,600.00
2014 OASDI
Year Start Balance $2,783,498 $191,600
Main Revenue $836,730 $196,270
Interest Revenue $100,205.91 $6,897.60
Total Revenue $936,935.91 $203,167.60
Expenditures $845,000 $238,800
Annual Surplus $91,935.91 ($35,632.40)
End Year Balance $2,875,433.52 $155,967.60
2015
Year Start Balance $2,875,434 $155,968
Main Revenue $867,510 $203,490
Interest Revenue $94,889.31 $5,146.93
Total Revenue $962,399.31 $208,636.93
Expenditures $884,000 $246,000
Annual Surplus $78,399.31 ($37,363.07)
End Year Balance $2,953,832.83 $118,604.53
2016
Year Start Balance $2,953,833 $118,605
Main Revenue $902,340 $211,660
Interest Revenue $91,568.82 $3,676.74
Total Revenue $993,908.82 $215,336.74
Expenditures $931,000 $268,400
Annual Surplus $62,908.82 ($53,063.26)
End Year Balance $3,016,741.65 $65,541.27
2017
Year Start Balance $3,016,742 $65,541
Main Revenue $886,756 $208,005
Interest Revenue $93,518.99 $2,031.78
Total Revenue $980,275.40 $210,036.37
Expenditures $966,865 $278,000
Annual Surplus $13,410.40 ($67,963.63)
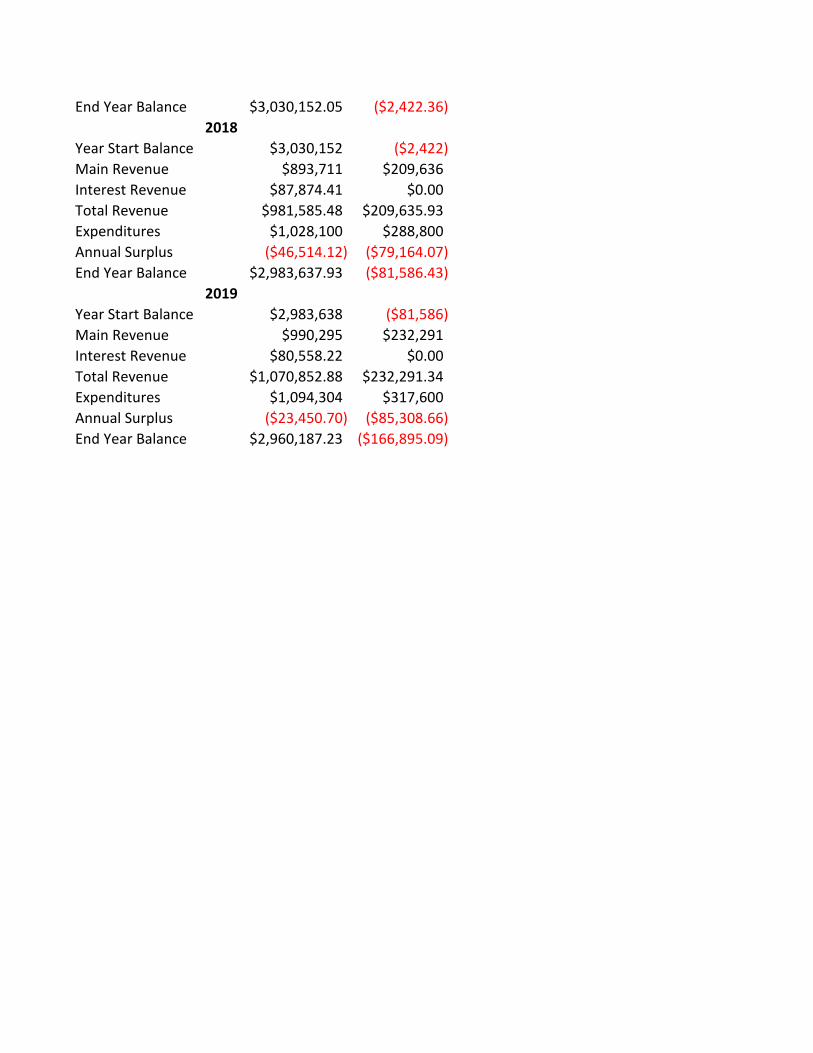
End Year Balance $3,030,152.05 ($2,422.36)
2018
Year Start Balance $3,030,152 ($2,422)
Main Revenue $893,711 $209,636
Interest Revenue $87,874.41 $0.00
Total Revenue $981,585.48 $209,635.93
Expenditures $1,028,100 $288,800
Annual Surplus ($46,514.12) ($79,164.07)
End Year Balance $2,983,637.93 ($81,586.43)
2019
Year Start Balance $2,983,638 ($81,586)
Main Revenue $990,295 $232,291
Interest Revenue $80,558.22 $0.00
Total Revenue $1,070,852.88 $232,291.34
Expenditures $1,094,304 $317,600
Annual Surplus ($23,450.70) ($85,308.66)
End Year Balance $2,960,187.23 ($166,895.09)
Variables
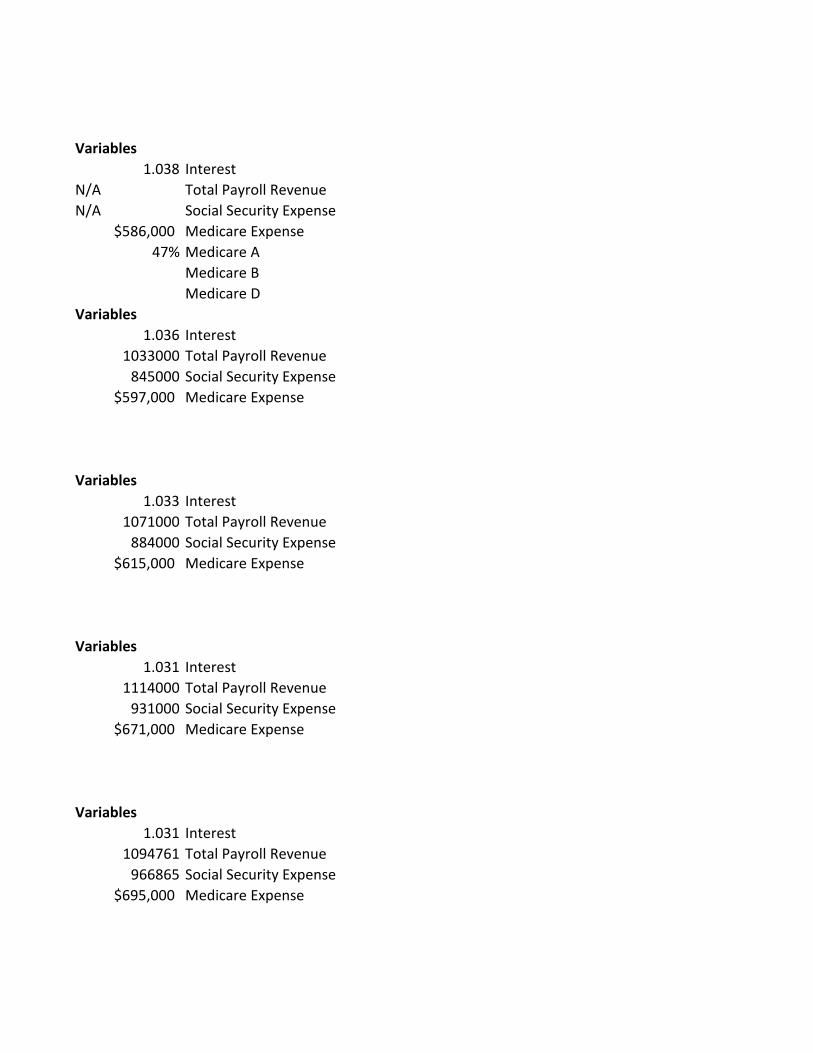
1.038 Interest
N/A Total Payroll Revenue
N/A Social Security Expense
$586,000 Medicare Expense
47% Medicare A
Medicare B
Medicare D
Variables
1.036 Interest
1033000 Total Payroll Revenue
845000 Social Security Expense
$597,000 Medicare Expense
Variables
1.033 Interest
1071000 Total Payroll Revenue
884000 Social Security Expense
$615,000 Medicare Expense
Variables
1.031 Interest
1114000 Total Payroll Revenue
931000 Social Security Expense
$671,000 Medicare Expense
Variables
1.031 Interest
1094761 Total Payroll Revenue
966865 Social Security Expense
$695,000 Medicare Expense
Variables
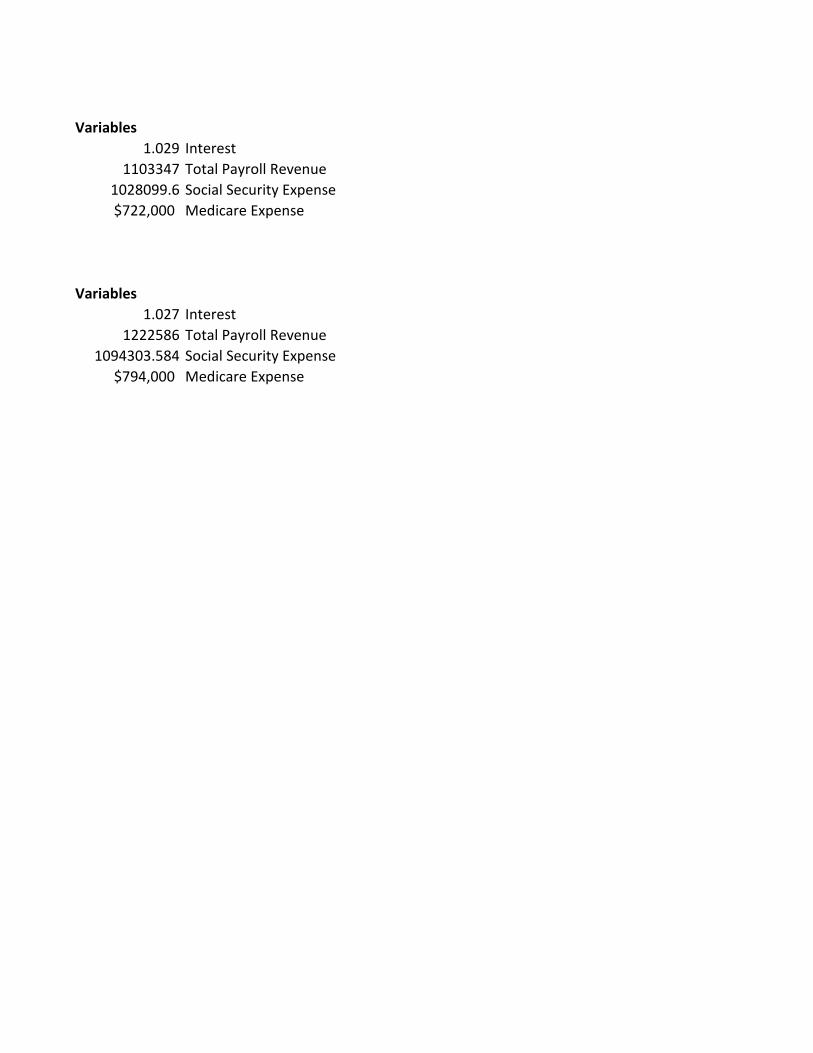
1.029 Interest
1103347 Total Payroll Revenue
1028099.6 Social Security Expense
$722,000 Medicare Expense
Variables
1.027 Interest
1222586 Total Payroll Revenue
1094303.584 Social Security Expense
$794,000 Medicare Expense
![BUDGET PREPARATION FOR SHS IN QUEZON CITYSHS-102]-Budget... · budget preparation for shs in quezon city ... qc school board secretariat. budget process for sef budget preparation](https://img.pdfslide.net/doc/110x75/5a9db4817f8b9a96438b9480/budget-preparation-for-shs-in-quezon-shs-102-budgetbudget-preparation-for-shs.jpg)