Embed Size (px)
Citation preview

R62I0001
Maryland Higher Education Commission
Note: Numbers may not sum to total due to rounding. For further information contact: Garret T. Halbach Phone: (410) 946-5530
Analysis of the FY 2016 Maryland Executive Budget, 2015 1
Operating Budget Data
($ in Thousands)
FY 14 FY 15 FY 16 FY 15-16 % Change
Actual Working Allowance Change Prior Year
General Fund $55,550 $56,915 $61,613 $4,698 8.3%
Deficiencies and Reductions 0 -600 -6,602 -6,002
Adjusted General Fund $55,550 $56,315 $55,011 -$1,304 -2.3%
Special Fund 13,315 18,677 8,215 -10,462 -56.0%
Deficiencies and Reductions 0 0 -6 -6
Adjusted Special Fund $13,315 $18,677 $8,209 -$10,468 -56.0%
Federal Fund 2,112 3,572 2,765 -807 -22.6%
Deficiencies and Reductions 0 0 -4 -4
Adjusted Federal Fund $2,112 $3,572 $2,761 -$811 -22.7%
Reimbursable Fund 220 321 346 25 7.7%
Adjusted Reimbursable Fund $220 $321 $346 $25 7.7%
Adjusted Grand Total $71,196 $78,885 $66,327 -$12,559 -15.9%
Note: The fiscal 2015 working appropriation reflects deficiencies and the Board of Public Works reductions to the extent
that they can be identified by program. The fiscal 2016 allowance reflects back of the bill and contingent reductions to the
extent that they can be identified by program.
After adjusting for contingent and back of the bill reductions, general funds decrease
approximately $1.3 million, or 2.3%, in the fiscal 2016 allowance. Special funds decrease by
$10.5 million, or 56.0%.
Overall, funds decrease approximately $12.6 million, or 15.9%.

R62I0001
Maryland Higher Education Commission
Analysis of the FY 2015 Maryland Executive Budget, 2014 2
The Board of Public Works cost containment in January 2015 included $600,000 for the
Regional Higher Education Centers, and $2.0 million attributed to the 2% across-the-board
reduction, which is not shown above. At this time, it is not known how this cost containment
will be achieved.
Personnel Data
FY 14 FY 15 FY 16 FY 15-16
Actual Working Allowance Change
Regular Positions
55.60
56.60
58.60
2.00
Contractual FTEs
7.34
13.00
6.83
-6.17
Total Personnel
62.94
69.60
65.43
-4.17
Vacancy Data: Regular Positions
Turnover and Necessary Vacancies, Excluding New
Positions
3.12
5.51%
Positions and Percentage Vacant as of 1/1/15
10.00
17.67%
The fiscal 2016 allowance includes 2.0 additional full-time regular positions, one is for
Workforce Investment Act initiatives with the Department of Labor, Licensing, and Regulation
(DLLR) and the other is 1.0 position from the Maryland State Department of Education (MSDE)
for the Maryland Higher Education Commission (MHEC) to work with the Maryland
Longitudinal Data System. This second position will be partly paid by reimbursable funds from
MSDE, which is the increase seen in the cover sheet. The allowance also shows the removal of
6.2 contractual positions involved with management of expired grants from the federal
government and the Lumina Foundation.
Positions shown here also staff MHEC’s Student Financial Assistance programs and the various
programs, such as the Cade formula, providing State support to community colleges.
In fiscal 2004, MHEC had 73.6 full-time regular positions. From 2004 to 2014, MHEC’s
regular positions decreased 18.0 positions, or about 25%. Over the same period, contractual
positions increased from 3.0 to 7.0.
As of January 1, 2015, the commission had 10.0 vacancies. Budgeted turnover for fiscal 2016
is 5.5%, or 3.1 positions. Since fiscal 2004, MHEC’s mid-fiscal year vacancy rate has
fluctuated greatly from a low of 4.2% in fiscal 2007 to a high of 21.8% in fiscal 2012. The
average over this time period is 10.8%.
R62I0001 – Maryland Higher Education Commission
Analysis of the FY 2016 Maryland Executive Budget, 2015 3
Analysis in Brief
Major Trends
Achievement Gap in Retention Rates Remains Large: The achievement gap in retention between all
students and Hispanic and African American students can be measured by using annual data from
MHEC. Overall, Hispanic students, probably due to small enrollment numbers, outperform all
students. However, African American students are retained at a significantly lower rate than all
students.
Achievement Gap in Graduation Rates Improves: Similar to retention rates, the achievement gap in
graduation rates for all students and Hispanic and African American students can be measured with
MHEC data. While Hispanic students continue to graduate at higher rates than all students in the
2006 cohort, the achievement gap of African American students has increased in the most recent cohort.
Issues
The Past and Future of MHEC: Recent cost containment is straining MHEC’s ability to meet its
statutory obligations. This issue will examine the idea of merging MHEC with MSDE to realize cost
savings for the State and to meet the original 1963 State Plan for Postsecondary Education.
Campus Sexual Misconduct Policies and MHEC: New federal regulations on sexual assault policies
take effect in summer 2015. This issue will review MHEC’s efforts to ensure that all campuses in the
State, public and private, will meet these new guidelines.
New Funding Guidelines Model Adopted: Since 1999, MHEC has evaluated State funding to public
four-year institutions by comparing Maryland schools to peers in other states. MHEC recently adopted
a new model that uses only institutions from competitor states, first recommended by the Commission
to Develop a Maryland Model for Funding Higher Education in 2008.
Nursing Support Program II Extended: A successful program to increase the capacity of nursing
programs in Maryland was supposed to phase out. However, a January 2015 decision continues the
program with workgroup recommended changes to ensure relevancy and effectiveness.
Progress Toward 55% Degree Attainment: MHEC reports that the State is on track to reach
55% degree attainment for Maryland adults in 2025.

R62I0001 – Maryland Higher Education Commission
Analysis of the FY 2016 Maryland Executive Budget, 2015 4
Recommended Actions
Funds
1. Add language indicating legislative intent on the transfer of
institutional grants.
2. Strike contingent language on the Sellinger program.
3. Add language to reallocate Sellinger funding in fiscal 2016.
4. Reduce Sellinger funding. $ 6,461,675
5. Add language restricting Office for Civil Rights Enhancement
Funding.
6. Adopt narrative requesting a report on Best Practices and Annual
Progress toward the 55% Completion Goal.
7. Adopt narrative requesting a report on Outcomes of Students
Participating in Access and Success Programs by Cohort.
8. Adopt narrative for a study on the future of MHEC.
Total Reductions $ 6,461,675
Updates
Historically Black Colleges and Universities’ Lawsuit Ruling Pending: A lawsuit filed in 2006
alleging that Maryland’s system of higher education remains segregated and in violation of the federal
equal opportunity laws received a finding of fact from the court. The court found that Maryland has
properly funded its historically black colleges and universities (HBCU) but violated law by duplicating
certain degree programs. The court ordered the State and plaintiffs to return to mediation.
Access and Success Outcomes: Annual narrative requests MHEC to report on outcomes of programs
using Access and Success programs funding. Considerable variation between campuses and declining
student participation makes comparisons difficult, but trends in graduation rates suggest one best
practice may not be working at Maryland’s HBCUs.
Renewable Energy Research Grants and Degree Programs: In fiscal 2014, MHEC made final awards
for research grants to support the implementation of offshore wind programs in Maryland. This update
will review the grants made and degree program proposals related to this effort.

R62I0001
Maryland Higher Education Commission
Analysis of the FY 2015 Maryland Executive Budget, 2014 5
Operating Budget Analysis
Program Description
The Maryland Higher Education Commission (MHEC) is the State’s coordinating body for the
University System of Maryland (USM), Morgan State University (MSU), St. Mary’s College of
Maryland (SMCM), 16 community colleges, the State’s independent colleges and universities, and
private career schools (PCS) and other for-profit institutions. MHEC’s mission is to ensure that
Maryland residents have access to a high quality, adequately funded, effectively managed, and capably
led system of postsecondary education. MHEC’s vision is to have all Maryland residents equally
prepared to be productive, socially engaged, and responsible members of a healthy economy. The
Secretary of Higher Education is the agency’s head and serves at the 12-member commission’s
pleasure.
MHEC’s key goals are as follows:
Maryland will enhance its array of postsecondary education institutions and programs, which
are recognized nationally and internationally for academic excellence, and more effectively
fulfill the evolving educational needs of its students, the State, and the nation.
Maryland will achieve a system of postsecondary education that advances the educational goals
of all by promoting and supporting access, affordability, and completion.
Maryland will ensure equitable opportunity for academic success and cultural competency for
Maryland’s population.
Maryland will seek to be a national leader in the exploration, development, and implementation
of creative and diverse education and training opportunities that will align with State goals,
increase student engagement, and improve learning outcomes and completion rates.
Maryland will stimulate economic growth, innovation, and vitality by supporting a
knowledge-based economy, especially through increasing education and training and promoting
the advancement and commercialization of research.
Maryland will create and support an open and collaborative environment of quality data use and
distribution that promotes constructive communication, effective policy analysis, informed
decisionmaking, and achievement of State goals.

R62I0001 – Maryland Higher Education Commission
Analysis of the FY 2015 Maryland Executive Budget, 2014 6
Performance Analysis: Managing for Results
MHEC has outlined several large policy goals in Maryland Ready, the 2013 to 2017 State Plan
for Postsecondary Education. MHEC aims to maintain and strengthen higher education institutions
and to ensure accessibility for Maryland’s diverse citizenry. Progress in these areas will help achieve
the State’s college completion agenda to increase degree attainment among Maryland adults to 55% by
2025. To improve outcomes for historically underserved or underrepresented groups, who represent a
growing portion of total student enrollment, MHEC works to reduce the achievement gap between
minority students and all students; award more degrees to minority students; and target degree growth
in high-demand areas.
1. Achievement Gap in Retention Rates Remains Large
Retention rates indicate how well Maryland’s students are progressing toward degree
attainment. Exhibit 1 shows the percentage point difference between the second-year retention rate
for all students and African American, Asian, and Hispanic students entering public four-year
institutions between 2002 and 2012. The years represent cohorts of first-time, full-time (FT/FT)
students entering in the fall semester, i.e., 2010 cohort reflects students enrolling in fall 2010, which is
academic year 2010-2011, or fiscal 2011. The exhibit shows that retention rates among Hispanic
students have remained above all students in most years, while Asian students outperform all students
in all years. The strong performance of Hispanic students is important because Hispanic students are
the fastest growing demographic, both as residents and as students, in Maryland. However, MHEC
attributes some of this performance to the overall low enrollment of Hispanic students in higher
education. Out of roughly 370,000 students across all Maryland institutions in fall 2012, only about
23,000, or 6%, were Hispanic. In this year, Hispanic student enrollment trailed Asian student
enrollment by only 150. So far, Hispanic students who do enroll are very well prepared for college
work; even with growing enrollment, the overall retention rate for Hispanic students, not shown in
Exhibit 1, from 2002 to 2012 has remained no lower than 79%.
The retention rate for African American students was fairly consistently 8.0 percentage points
below all students from 2002 to 2008, before dropping 2.0 percentage points and then jumping
4.0 percentage points in 2010. It then fell in the 2011 and 2012 cohorts, back to almost 8.0 percentage
points below all students. The percentage point gap between all students and African American
students in 2012, which is 7.4, is greater than the percentage point gap in the 2000 cohort (not shown
in Exhibit 1) , which was 6.6. The 2010 cohort had the highest reported retention rate for African
American students by at least 0.9 percentage points over all previous years, so it is important for MHEC
to ascertain what caused that increase. The Secretary should comment on what caused the increase
and how not to lose that momentum.
MHEC reports that the State’s college completion agenda will focus on enrolling and retaining
more students of all backgrounds and increasingly more nontraditional students who are not captured
in this exhibit because they do not enroll as FT/FT students. (Transfer students, who are also not

R62I0001 – Maryland Higher Education Commission
Analysis of the FY 2016 Maryland Executive Budget, 2015 7
Exhibit 1
Achievement Gap in Second-year Retention Rates 2002-2012 Cohorts
Source: Maryland Higher Education Commission, Enrollment and Degree Information Systems
captured in FT/FT data, represent another rapidly growing demographic on campuses.) Specific
strategies include redesigning courses in remedial and introductory classes, increasing summer bridge
programs, and reaching out to growing or underrepresented demographics, such as Hispanic students,
adult students, and military veterans.
2. Achievement Gap in Graduation Rates Improves
Retention rates foreshadow graduation rates, which represent the ultimate goal for most students
and reflect how effectively public four-year institutions in Maryland educate students. Exhibit 2 shows
the percentage difference between six-year graduation rates for the same student groups shown in
Exhibit 1. As data for six-year graduation rates by cohort necessarily lags two-year retention rates by
cohort, Exhibit 2 only shows cohort years 1997 to 2007.
-10%
-8%
-6%
-4%
-2%
0%
2%
4%
6%
8%
10%
2002 2003 2004 2005 2006 2007 2008 2009 2010 2011 2012
All Students African American Students Asian Students Hispanic Students

R62I0001 – Maryland Higher Education Commission
Analysis of the FY 2016 Maryland Executive Budget, 2015 8
Exhibit 2
Achievement Gap in Six-year Graduation Rates 1997-2007 Cohorts
Source: Maryland Higher Education Commission, Enrollment and Degree Information Systems
From 1997 to 2007, Hispanic students have graduated at similar or higher rates than all students
in 9 out of 11 years and were below all students in only 2 years. Asian students consistently graduate
about 10 percentage points higher than all students. The dip in the 2005 cohort’s retention rate shows
up as a slight decline in that cohort’s graduation rate. Given that Hispanic students displayed higher
retention beyond the 2006 cohort in Exhibit 1, the graduation rate for Hispanic students will likely
continue to outperform all students.
The achievement gap for African American students generally increased from the 1997 cohort
to the 2004 cohort, before decreasing in 2005 and 2006, while 2007 was unchanged. However, even
with some progress recently, the achievement gap in 2007 was 20.0 percentage points, compared to
only 15.2 percentage points in 1997. To ensure educational opportunity for Maryland’s diverse
citizenry, MHEC had set a cohort year 2007 (fiscal 2013) goal of reducing the six-year graduation rate
achievement gap to 18.0 percentage points. The new goal is to reduce the African American
-25%
-20%
-15%
-10%
-5%
0%
5%
10%
15%
1997 1998 1999 2000 2001 2002 2003 2004 2005 2006 2007
All Students Hispanic Students African American Students Asian Students

R62I0001 – Maryland Higher Education Commission
Analysis of the FY 2016 Maryland Executive Budget, 2015 9
achievement gap to below 16.0 percentage points by cohort year 2012 (fiscal 2018). This, however, is
not necessarily progress compared to where the State was with the 1997 cohort’s outcomes.
The achievement gap is also evident in the percent of bachelor’s and associate’s degrees
awarded to racial and ethnic minorities in Maryland, as shown in Exhibit 3. The fastest growing
segments of Maryland’s population are minorities, and the percent of associate’s degrees awarded to
minorities increased 5.0 percentage points between fiscal 2006 and the 2016 estimate to 36.1%. This
rate dropped to 29.1% in fiscal 2012 because of an unusually large number of students not classified
under any racial or ethnic category in that year. MHEC believes that the rate will increase again in
future fiscal years, surpassing 40.0% in the next decade. Meanwhile, the percentage of bachelor’s
degrees awarded to minority students was essentially flat from fiscal 2007 to 2011, before climbing to
34.4% in fiscal 2013, then flattening again. Overall, the data in the exhibit shows the rates appear to
move together, with the exception of associates degrees in 2012 and bachelor’s degrees in 2006. The
stagnant rates from fiscal 2007 to 2011 may be the effect of the recession, and MHEC believes minority
degree attainment will resume its upward climb as the economy improves and demographic trends
continue.
Exhibit 3
Bachelor’s and Associate’s Degrees
Awarded to Racial and Ethnic Minorities
Fiscal 2006-2016 Est.
Source: Governor’s Budget Books, Fiscal 2006-2016; Maryland Higher Education Commission, Databook 2015
25%
27%
29%
31%
33%
35%
37%
39%
2006 2007 2008 2009 2010 2011 2012 2013 2014 2015 Est. 2016 Est.
Two-year Degrees Four-year Degrees

R62I0001 – Maryland Higher Education Commission
Analysis of the FY 2016 Maryland Executive Budget, 2015 10
Fiscal 2015 Actions
On January 7, 2015, the Board of Public Works (BPW) implemented a 2% across-the-board
reduction in general funds as fiscal 2015 cost containment. The agency’s share of the reduction was
$2,059,900, as shown in Exhibit 4. This reduction could be a serious problem for MHEC because the
agency is primarily a grant pass-through organization, so there simply is not much to reduce in MHEC
given that the administrative budget for salaries and other necessary office functions amount to about
$6.0 million. The January BPW reduction also reduced regional higher education center (RHEC)
support by $0.6 million. These actions followed a prior BPW reduction in July 2014 of $52,000 for
administrative travel and $3.0 million for Sellinger aid. MHEC has not shared with the Department of
Legislative Services (DLS) how it will distribute the cost containment without ceasing operations or
cutting into other programs, such as financial aid. There is also a contingent transfer of $1.7 million
from the fund balance of the Health Personnel Shortage Incentive Grant to the general fund.
The Secretary of Higher Education should comment on how MHEC will absorb $2 million
in cost containment.
In addition, there is one more ongoing budget concern at MHEC. There are two outstanding
general fund liabilities identified by the Office of Legislative Audits totaling $3.4 million:
$2.7 million for the Community College Statewide and Health Manpower Grant, and
$0.7 million for Community College Fringe Benefits.
No deficiency has been provided for these items in the fiscal 2016 allowance, and these have remained
unpaid to the local community colleges since fiscal 2012. More details on these two liabilities will be
provided in the Aid to Community Colleges budget analysis.

R62I0001 – Maryland Higher Education Commission
Analysis of the FY 2016 Maryland Executive Budget, 2015 11
Exhibit 4
Fiscal 2015 Reconciliation ($ in Thousands)
Action Description
General
Fund
Special
Fund
Federal
Fund
Reimb.
Fund Total
Legislative Appropriation with Budget
Amendments
$60,213 $18,431 $3,572 $321 $82,537
July BPW
-3,298 246 0 0 -3,052
Working Appropriation
$56,915 $18,677 $3,572 $321 $79,485
January BPW (RHECs grant)
-600 0 0 0 -600
January BPW
Across the
Board
MHEC’s budget received a 2%
across-the-board reduction,
$2,060,000. It is not known how
the amount will be allocated
across the agency.
0 0 0
Total Actions Since January 2015
-$600 $0 $0 $0 -$600
Adjusted Working Appropriation $56,315 $18,677 $3,572 $321 $78,885
BPW: Board of Public Works
MHEC: Maryland Higher Education Commission
RHEC: Regional Higher Education Center
Source: Department of Legislative Services
Fiscal 2016 Actions
Proposed Budget
As shown in Exhibit 5, after all contingent and back of the bill reductions, the fiscal 2016
allowance decreases MHEC’s overall budget $12.6 million, or 15.9%. General funds are reduced by
the contingent reduction to Sellinger aid for independent institutions, while special funds decrease due
to the budgeted phasing out of the Nursing Support Program (NSP) II. This program is discussed
further in Issue 3 of this analysis. Special funds also decline due to a realignment of the Health
Personnel Shortage Incentive Grant (HPSIG) expenditures with available revenue.

R62I0001 – Maryland Higher Education Commission
Analysis of the FY 2016 Maryland Executive Budget, 2015 12
Exhibit 5
Proposed Budget Maryland Higher Education Commission
($ in Thousands)
How Much It Grows:
General
Fund
Special
Fund
Federal
Fund
Reimb.
Fund
Total
Fiscal 2014 Actual $55,550 $13,315 $2,112 $220 $71,196
Fiscal 2015 Working Appropriation 56,315 18,677 3,572 321 78,885
Fiscal 2016 Allowance 55,011 8,209 2,761 346 66,327
Fiscal 2015-2016 Amt. Change -$1,304 -$10,468 -$811 $25 -$12,559
Fiscal 2015-2016 Percent Change -2.3% -56.0% -22.7% 7.7% -15.9%
Where It Goes:
Personnel Expenses
2.0 new positions ........................................................................................................... $154
Increments and other compensation (prior to cost containment) ................................... 105
Employee and retiree health insurance .......................................................................... 94
Social Security contributions ......................................................................................... 12
Retirement contributions and workers’ compensation ................................................... -5
Turnover adjustments ..................................................................................................... -16
Reclassifications and leave payout ................................................................................ -20
Section 21: Abolition of employee increments ............................................................. -68
Section 20: 2% pay reduction ....................................................................................... -82
Other Changes
Mandated increase to Sellinger Formula ....................................................................... 6,462
Regional Higher Education Center Funding .................................................................. 200
Conclusion of Credit When It’s Due Grant ................................................................... -137
Other Adjustments ......................................................................................................... -175
Reductions in Federal Institutional Grants ..................................................................... -870
Health Personnel Shortage Incentive Grant realignment ............................................... -1,250
Transfer of St. Mary’s College of Maryland Stabilization Grant .................................. -1,500
Sellinger contingent reduction ....................................................................................... -6,462
Phase out of Nursing Support Program II ...................................................................... -9,000
Total -$12,559
Note: Numbers may not sum to total due to rounding. The fiscal 2015 working appropriation reflects deficiencies and the
Board of Public Works reductions to the extent that they can be identified by program. The fiscal 2016 allowance reflects
back of the bill and contingent reductions to the extent that they can be identified by program.

R62I0001 – Maryland Higher Education Commission
Analysis of the FY 2016 Maryland Executive Budget, 2015 13
Exhibit 5 shows several other changes within MHEC’s operations and programs. The largest
general fund increase in the budget is $6.5 million for Sellinger aid, but after a proposed reduction
Sellinger is flat funded in fiscal 2016 at the fiscal 2014 and 2015 amount. There is also a small increase
of $0.2 million for personnel changes mostly related to 2 new positions described previously. The
permanent transfer of the SMCM Stabilization Grant first provided in fiscal 2015 to that institution also
decreases general funds.
Cost Containment
In fiscal 2016, the Administration has implemented several across-the-board reductions. This
includes a general 2% reduction, elimination of employee increments, and a 2% pay reduction.
MHEC’s share of these reductions is $2,068,000 for the general 2% reduction, $68,182 for the removed
increments, and $82,000 for the removal of cost-of-living adjustments (COLA). Similar to the
fiscal 2015 cost containment, MHEC has not shared with DLS how these reductions will be distributed
and if this will be in a similar manner to the fiscal 2015 reductions.
Joseph A. Sellinger Formula Exhibit 6 shows how total Sellinger aid is appropriated using the statutory formula – the
per-student general fund support at certain public four-year institutions is multiplied by a percentage
set in statute. The Budget Reconciliation and Financing Act (BRFA) of 2014 sets this percentage for
fiscal 2016 at 9.6%. Per full-time equivalent student (FTES) support increases to $1,097, or $79 more
per student than in fiscal 2015. This amount is then multiplied by independent college and university
enrollments, which grew by only seven students in the most recent audited data, in fiscal 2014. The
Sellinger appropriation grows to $47.9 million in 2016, an increase of $3.4 million, or 7.8%. The
growth is nearly entirely driven by an increase in State support to public four-year institutions.
However, the BRFA of 2015 includes a contingent reduction of $6,461,675 that sets the
Sellinger Formula at $41,422,240 in fiscal 2016 but does not change the out-year percentages of the
formula in any way. The rounded equivalent percentage that could have achieved the same result by
modifying the formula is 8.9%. Sellinger aid peaked at $56.1 million in fiscal 2008 and has declined
by $14.7 million, or just over 25%, in fiscal 2016. Part of this is due to slower than anticipated growth
in the funding percentage in statute and partly due to Sellinger being frequently reduced through cost
containment beginning during the economic recession.

R62I0001 – Maryland Higher Education Commission
Analysis of the FY 2016 Maryland Executive Budget, 2015 14
Exhibit 6
Sellinger Aid Formula Fiscal 2015-2016
2015
Appropriation
2016
Allowance Change $ Change %
Per FTES General Funds Per Selected
Public Institutions* $10,826 $11,425 $599 5.5%
Statutory Sellinger Percentage 9.4% 9.6%
General Funds* 1,018 1,097 79 7.8%
Projected Independent Enrollment 43,650 43,657 7 0.0%
Sellinger Appropriation $44,422,240 $47,883,915 $3,461,675 7.8%
After Cost Containment $41,422,240 $41,422,240 $0 0.0%
FTES: full-time equivalent student
* This is based on the allowance without any subsequent changes.
Source: Governor’s Budget Book, Fiscal 2016; Department of Legislative Services
Exhibit 7 shows the per institution allocation of the fiscal 2016 allowance and BRFA allocation.
In flat funding Sellinger aid through the BRFA, the Administration froze all fiscal 2015 institutional
allotments. However, if newer audited enrollments from fiscal 2014 are used, the per-institution
appropriation changes due to enrollment changes at individual institutions, like Washington Adventist
University. Although, as will be mentioned next, the BRFA practically severs the link between
Sellinger aid and aid to public four-year institutions in Maryland, it would still be possible to allocate
aid based on enrollment.
DLS concurs with the reduction to Sellinger aid in fiscal 2016, but recommends that such
aid be distributed by enrollment, rather than the prior year per-institution appropriation as
specified in the BRFA of 2015. This would require an amendment to the BRFA.
Section 13 of the BRFA of 2015 also contains a mandated relief provision that applies generally
to all mandated funding programs in the State but is then also repeated specifically for Sellinger aid
and the John A. Cade funding formula for local community colleges. This mandated relief provision
restricts growth in funding formulas to the lesser of the formula currently in statute or the growth of
general fund revenues less one percentage point. As shown in Exhibit 8, this would have a significant
impact upon Sellinger aid, especially in fiscal 2021. Because Sellinger aid resets every year, that is,
the prior year has no direct impact on the next year’s funding formula, the growth restriction becomes
very pronounced. Overall, from fiscal 2017 through 2020, DLS estimates that Sellinger aid would
receive $48.8 million less than the statutory formula would provide. By fiscal 2021, Sellinger aid
would effectively receive 7.8% of the projected public four-year per-student funding instead of the

R62I0001 – Maryland Higher Education Commission
Analysis of the FY 2016 Maryland Executive Budget, 2015 15
Exhibit 7
Sellinger Aid Formula Fiscal 2016
Institution Allowance
BRFA of
2015
Formula
Allocation
Formula vs.
BRFA
Capitol College $536,784 $497,379 $464,348 -$33,031
College of Notre Dame 1,641,643 1,460,006 1,420,113 -39,893
Washington Adventist University 832,048 834,640 719,767 -114,873
Goucher College 1,909,926 1,638,923 1,652,191 13,268
Hood College 1,793,487 1,542,917 1,551,466 8,549
The Johns Hopkins University 21,291,393 18,108,588 18,418,235 309,647
Loyola College 5,627,202 4,792,569 4,867,842 75,273
Maryland Institute College of Art 2,442,695 2,040,049 2,113,066 73,017
McDaniel College 2,542,429 2,184,320 2,199,342 15,022
Mount St. Mary’s College 2,104,249 1,754,630 1,820,292 65,662
St. John’s College 616,852 548,433 533,611 -14,822
Sojourner-Douglass College 671,989 855,898 581,307 -274,591
Stevenson University 4,148,722 3,653,834 3,588,874 -64,960
Washington College 1,724,497 1,510,054 1,491,786 -18,268
Total $47,883,915 $41,422,240 $41,422,240
BRFA: Budget Reconciliation and Financing Act
Source: Department of Budget and Management; Department of Legislative Services
15.5% statutory percentage. The Governor could, however, choose to appropriate more funding in any
particular fiscal year but would not be required to do so. This would effectively sever the link between
the funding for the public institutions and independent institutions, which has been strongly supported
by the General Assembly, the Commission to Develop a Maryland Model for Funding Higher
Education, and the institutions themselves. It should be noted that the current statutory percentage is
scheduled to increase from 11.1% to 15.5% in fiscal 2021, resulting in an estimated $30.0 million
increase in Sellinger aid that year based on current projections.

R62I0001 – Maryland Higher Education Commission
Analysis of the FY 2016 Maryland Executive Budget, 2015 16
Exhibit 8
Sellinger Formula Mandate vs. BRFA Mandate Relief Fiscal 2016-2021
2016 2017 2018 2019 2020 2021 Formula Mandate $41,422,240 $49,296,546 $54,261,095 $58,785,545 $63,610,524 $93,564,962
BRFA Relief 41,422,240 42,664,907 43,816,860 44,737,014 45,989,650 47,154,721
Difference -$6,631,639 -$10,444,235 -$14,048,531 -$17,620,874 -$46,410,241
BRFA: Budget Reconciliation and Financing Act of 2015, Section 13
Source: Department of Legislative Services
Independent Institutions
With the closure of National Labor College at the end of the 2013-2014 academic year, the
Maryland Independent College and University Association (MICUA) now represents all 14 institutions
receiving Sellinger aid. MICUA reports that, since 1973, the State has distributed over $1 billion
through the Sellinger program. MICUA has a stated goal for member institutions to use at least 70%
of Sellinger funding for need-based financial aid for Maryland residents. In fiscal 2014, 89% of funding
was used this way, an increase of 3 percentage points over the prior year. Sellinger aid accounts for
about 6% of all financial aid given out by MICUA institutions, or about a quarter of nonfederal aid.
Sellinger funding not used for aid allows some flexibility for private institutions to meet other State
priorities, such as teacher education; nursing; science, technology, engineering and mathematics; and
diversity goals. Since fiscal 2008, in fulfillment of General Assembly requirements, MICUA
institutions have reported annually on promoting cultural diversity.
Sojourner-Douglass College (SDC), one of the smallest MICUA members by student headcount
enrollment, expects to hear from the Middle States Commission on Higher Education in spring 2015
as to whether it will remain accredited. Should it lose accreditation, the school would likely close due
to ineligibility to receive federal financial aid. If this occurs, Sellinger aid to SDC in fiscal 2016,
totaling $0.9 million per the BRFA of 2015 or $0.7 million per the DLS recommendation, would not
be disbursed and would revert to the general fund.

R62I0001 – Maryland Higher Education Commission
Analysis of the FY 2016 Maryland Executive Budget, 2015 17
Educational Grants
The Educational Grants Program provides financial assistance to State, local, and private
entities to enrich the quality of higher education within the goals defined by Maryland Ready.
Exhibit 9 shows educational grant appropriations for fiscal 2015 and 2016. MHEC reported that the
fiscal 2015 working numbers for federal funds in the budget book are incorrect, so the exhibit below
reflects MHEC’s corrections. The total amount of federal funding, $3.1 million, is the same.
Exhibit 9
Maryland Higher Education Commission Educational Grants Fiscal 2015-2016
2015
Working
2016
Allowance
$
Difference
%
Difference
Programs
Federal Funds
Improving Teacher Quality $1,430,000 $1,000,000 -$430,000 -30.1%
College Access Challenge Grant Program 1,600,000 1,200,000 -400,000 -25.0%
John R. Justice Grant 70,000 30,000 -40,000 -57.1%
Subtotal $3,100,000 $2,230,000 -$870,000 -28.1%
General Funds
Complete College Maryland $250,000 $250,000 $0 0.0%
OCR Enhancement Funds 4,900,000 4,900,000 0 0.0%
Washington Center for Internships and
Academic Seminars 175,000 175,000 0 0.0%
UMB – Wellmobile 285,250 285,250 0 0.0%
Regional Higher Education Centers 1,950,000 2,150,000 200,000 10.3%
St. Mary’s College of Maryland
Stabilization Grant 1,500,000 0 -1,500,000 -100.0%
Subtotal $9,060,250 $7,760,250 -$1,300,000 -14.3%
Special Funds
Credit When It’s Due (USA Funds) $136,605 $0 -$136,605 -100.0%
Total $12,296,855 $9,990,250 -$2,306,605 -18.8%
UMB: University of Maryland, Baltimore
OCR: Office for Civil Rights
Note: The 2015 working reflects a Board of Public Works reduction to Regional Higher Education Center funding. The
Maryland Higher Education Commission reports different numbers for fiscal 2015.
Source: Governor’s Budget Books, Fiscal 2016; Maryland Higher Education Commission

R62I0001 – Maryland Higher Education Commission
Analysis of the FY 2016 Maryland Executive Budget, 2015 18
Decreases in fiscal 2016 reflect the conclusion of the Credit When It’s Due grant in fiscal 2015
and a loss of nearly $0.9 million in federal grants, mostly in Improving Teacher Quality and the College
Access Challenge Grant Program. Although MHEC received the funds in the past, the newest award
for Gaining Early Awareness and Readiness for Undergraduate Programs (GEAR UP) for $2.2 million
in fiscal 2016, is budgeted within the Maryland State Department of Education (MSDE). Maryland
will use MHEC’s College Preparation Intervention Program as matching funds for GEAR UP’s
six-year grant to support college preparation, access, and outreach initiatives.
General funds for educational grants decline by $1.3 million due to the permanent transfer of
the $1.5 million SMCM Stabilization Grant to that college and an increase of $0.2 million for non-USM
RHEC. This 2016 RHEC funding is still below the 2014 appropriation and the fiscal 2015 legislative
appropriation of $2.6 million, which was reduced by $600,000 by BPW in July 2015. None of the other
four general funds grants change in the allowance. At $7.8 million in fiscal 2016, general funds for
MHEC’s education grants are down over 50% from an all-time high in fiscal 2006 of $16.4 million.
Recently, DLS became aware of two issues affecting two general fund grant programs. First, for
both the Office for Civil Rights (OCR) enhancement funds and the SMCM Stabilization Grant, funds
are disbursed to State institutions outside of the budget amendment process. This has been occurring
for many years. While the OCR funding is annually restricted by the legislature pending a report on
its proposed uses, there is never actually confirmation that the funding is disbursed through the budget
system. In a similar manner, it was unclear to DLS when the SMCM Stabilization Grant was actually
sent to the respective college. Second, for the same two programs, it appears that funding may be
double counted. For example, the 2015 working number in the Governor’s Budget Books shows
$1.5 million for the SMCM grant in MHEC’s educational grants (shown in Exhibit 9) and as current
unrestricted revenue for SMCM.
DLS recommends budget bill language that general fund grant disbursements made
directly to State institutions of higher education be transferred only through budget amendment
so that the budget system does not double count the grants in the working appropriation and
properly shows the total State support going to the institutions.
Regional Higher Education Centers
Exhibit 10 also shows the allocation of funding for USM and non-USM RHECs in fiscal 2016.
MHEC’s non-USM RHEC funding strategy is for each RHEC to receive $200,000 in base funding and
then to allocate the remainder by FTES enrolled in 2+2 and upper division coursework at each RHEC.
For non-USM RHECs, funding was flat in fiscal 2015 and then reduced $0.6 million by BPW. This
means the RHECs will redivide a smaller amount of funding based upon changes in enrollment.
Overall, the audited fiscal 2014 enrollments used in the 2016 formula declined by about 199 FTES, or
22.3%. The University Center RHEC receives the largest increase in State support, growing by almost
$60,000, or 15.7%. Despite the increase over the reduced amount in fiscal 2015, Arundel Mills RHEC
still loses some State support, $2,000, in fiscal 2016. The allowance funds non-USM RHECs at
$3,108 per FTES versus $2,189 in the working appropriation.

R62I0001 – Maryland Higher Education Commission
Analysis of the FY 2016 Maryland Executive Budget, 2015 19
Exhibit 10
State Support for RHECs Fiscal 2015-2016
Non-USM RHECs
Adjusted
2015
% of
FTES 2016
% of
FTES
$ Change
2015-2016
% Change
2015-2016
AACC RHEC at
Arundel Mills $292,193 12.3% $290,088 9.5% -$2,105 -0.7%
Eastern Shore
Higher Education 281,172 10.8% 321,206 12.8% 40,034 14.2%
University Center* 360,223 21.4% 416,842 22.8% 56,619 15.7%
Laurel College 247,201 6.3% 281,561 8.6% 34,360 13.9%
Southern Maryland 488,662 38.5% 527,529 34.5% 38,867 8.0%
Waldorf 280,549 10.7% 312,774 11.9% 32,225 11.5%
Total All Non-USM
RHECs $1,950,000 100.0% $2,150,000 100.0% $200,000 10.3%
USM RHECs
Universities of Shady
Grove $7,738,525 $8,689,532 $951,007 12.3%
USM at Hagerstown 1,831,703 1,865,038 33,335 1.8%
Total USM RHECs $9,570,228 $10,554,570 $984,342 10.3%
AACC: Anne Arundel Community College
FTES: full-time equivalent student RHEC: Regional Higher Education Center USM: University System of Maryland
*Formerly called the Higher Education and Applied Technology (HEAT) Center (in Harford County).
Source: Maryland Higher Education Commission
Despite the recent decline in enrollment, the intent of RHECs is to expand access to higher
education in geographically underserved areas of the State that are not near public four-year institutions.
However, not all RHECs are created or funded equally. In total, the two USM RHECs receive about
$8.4 million more in State support than the six non-USM RHECs.
In summer 2014, MHEC released two regional higher education assessments to determine needs
in Frederick County and in Northeastern Maryland. Both studies used $120,000 restricted funds in the
fiscal 2014 budget for that purpose. The Frederick RHEC report conducted a market review, solicited
stakeholder input, and conducted a gap analysis of degree programs. The greatest need, and thus reason
for establishing a new RHEC, fell into two categories. One category consists of medical scientists and

R62I0001 – Maryland Higher Education Commission
Analysis of the FY 2016 Maryland Executive Budget, 2015 20
health care professionals, while the other category is made up of civil engineers, engineering technicians,
and information technology (IT) professionals. HB 37/SB 25 of the 2015 legislative session to rename
the proposed Frederick RHEC to be the Frederick Center for Research and Education in Science and
Technology (FREST) as recommended by the study. However, if the center is approved by MHEC, it
would likely first receive funding in fiscal 2017.
The Northeastern Maryland study group was focused on updating the postsecondary education
programs at the existing University Center (formerly called the Higher Education and Applied
Technology Center), as well as how to take advantage of the nearby Aberdeen Proving Grounds (APG),
which produces a strong regional demand for well-educated workers. The report concluded that there
needs to be a better regional strategy involving communications and marketing between local businesses,
APG leadership, and the University Center. For example, the University Center has started a new
cybersecurity program in coordination with APG, but this should be extended to other in-demand degree
programs.
Health Professional Shortage Incentive Grants
HPSIG is one of the two main health-related grant programs operated by MHEC. It is funded
by 12% of the fees collected by the Maryland Board of Physicians, which are transferred to MHEC
toward the end of every fiscal year. Half of the funds received go to a Loan Assistance Repayment
Program for Physicians and Physician Assistants budgeted within MHEC’s Student Financial
Assistance, and the other half goes to HPSIG. These funds are then distributed to postsecondary
institutions to enhance or expand approved academic programs in health occupations experiencing
personnel shortages in Maryland. If the Governor does not budget $500,000 for the program, then
MHEC is to collect the revenue from the Board of Physicians. Since its first round of awards in
fiscal 1992, no general funds have ever been appropriated for this program.
The Department of Health and Mental Hygiene (DHMH) annually approves the list of health
personnel shortage areas based on health care occupational projections produced by the Department of
Labor, Licensing, and Regulation (DLLR) and certified the following health personnel shortage areas
for the fiscal 2014 funding round:
Family Practice Physician;
Pediatrician;
Pharmacist;
Physical Therapist
R62I0001 – Maryland Higher Education Commission
Analysis of the FY 2016 Maryland Executive Budget, 2015 21
Occupational Therapist;
Licensed Practical Nurse; and
Laboratory Technician.
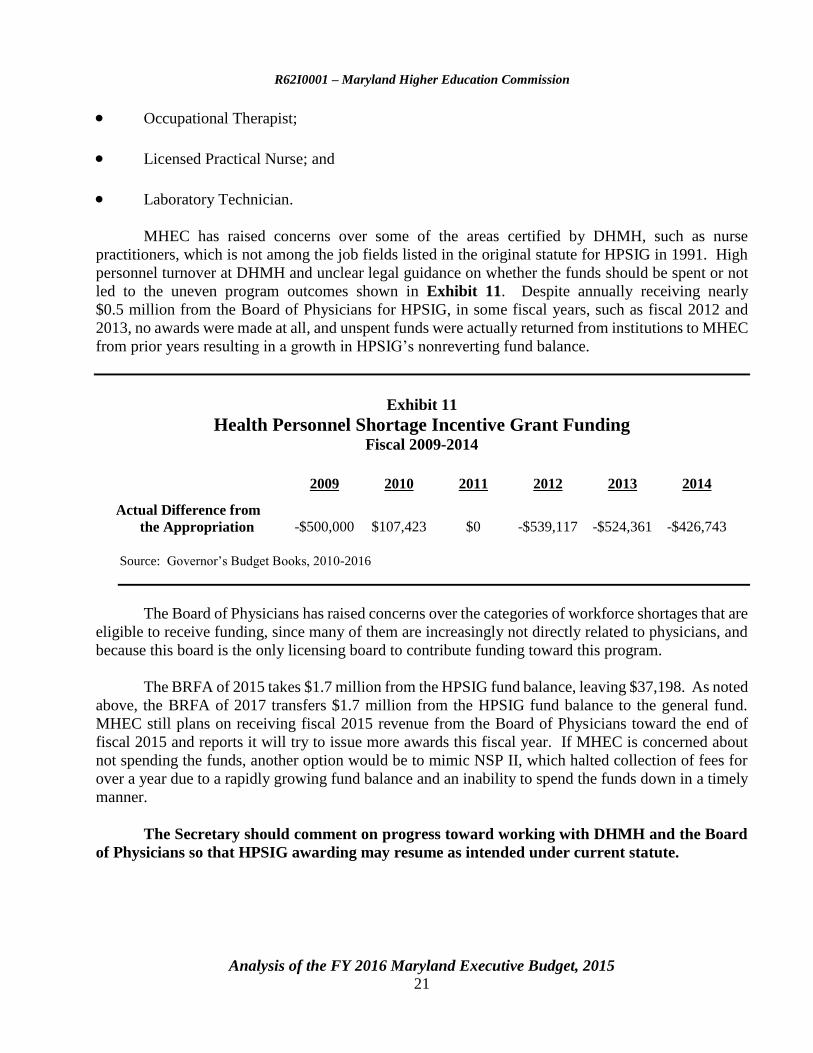
MHEC has raised concerns over some of the areas certified by DHMH, such as nurse
practitioners, which is not among the job fields listed in the original statute for HPSIG in 1991. High
personnel turnover at DHMH and unclear legal guidance on whether the funds should be spent or not
led to the uneven program outcomes shown in Exhibit 11. Despite annually receiving nearly
$0.5 million from the Board of Physicians for HPSIG, in some fiscal years, such as fiscal 2012 and
2013, no awards were made at all, and unspent funds were actually returned from institutions to MHEC
from prior years resulting in a growth in HPSIG’s nonreverting fund balance.
Exhibit 11
Health Personnel Shortage Incentive Grant Funding Fiscal 2009-2014
2009 2010 2011 2012 2013 2014
Actual Difference from
the Appropriation -$500,000 $107,423 $0 -$539,117 -$524,361 -$426,743
Source: Governor’s Budget Books, 2010-2016
The Board of Physicians has raised concerns over the categories of workforce shortages that are
eligible to receive funding, since many of them are increasingly not directly related to physicians, and
because this board is the only licensing board to contribute funding toward this program.
The BRFA of 2015 takes $1.7 million from the HPSIG fund balance, leaving $37,198. As noted
above, the BRFA of 2017 transfers $1.7 million from the HPSIG fund balance to the general fund.
MHEC still plans on receiving fiscal 2015 revenue from the Board of Physicians toward the end of
fiscal 2015 and reports it will try to issue more awards this fiscal year. If MHEC is concerned about
not spending the funds, another option would be to mimic NSP II, which halted collection of fees for
over a year due to a rapidly growing fund balance and an inability to spend the funds down in a timely
manner.
The Secretary should comment on progress toward working with DHMH and the Board
of Physicians so that HPSIG awarding may resume as intended under current statute.

R62I0001 – Maryland Higher Education Commission
Analysis of the FY 2016 Maryland Executive Budget, 2015 22
Issues
1. The Past and Future of MHEC
MHEC is not an executive agency of the State, like, for example, MSDE. Rather, it is an
ongoing executive commission funded by the State. It can trace its origins back to 1963, with the
creation of the Advisory Council on Higher Education (Chapter 41 of 1963). This was the
recommendation of the 1961 Commission for the Expansion of Public Higher Education in Maryland,
which, also at the same time, recommended a new USM campus that became the University of
Maryland Baltimore County. For comparison, this was a century after the precursor to MSDE was
established. The original 1963 plan called for MHEC’s precursor to be made up of representatives
from USM, the State colleges (merged into USM in 1988), and MSDE. In addition, this original plan
called for a Division of Higher Education within MSDE to assist MSDE and the State Superintendent
of Schools in exercising their (then) responsibilities in the field of higher education. Following several
name changes, the Advisory Council on Higher Education gained its current name of MHEC at the
same time as the alignment of USM institutions (Chapter 246 of 1988) and also gained the institutional
authorization power originally envisioned for MSDE. In 1991, when the State Board for Community
Colleges was abolished, its functions transferred to MHEC.
MHEC is responsible for coordinating the overall growth and development of postsecondary
education in Maryland to ensure that higher education activities serve the State’s interest. The
commission provides statewide oversight by establishing and updating the State Plan for
Postsecondary Education every four years and approving new academic programs, RHECs, and
two- and four-year public and private institutions to operate in the State. For each public campus, the
commission approves mission statements and recommends funding levels and priorities among
institutions, in keeping with the State Plan for Postsecondary Education. The commission also
oversees academic matters; administers State support for community colleges, private institutions, and
State student financial aid programs; and upon request by a local government, makes a recommendation
to the Governor concerning the establishment of a new community college. MHEC also conducts
research and produces official State data on graduation and retention rates and enrollment projections,
which are used by DLS and the Department of Budget and Management (DBM) for capital planning.
Without such coordination, each segment would be left to act in its own interest, at significant potential
cost to the State.
The commission itself has a chairman, and there is also a Secretary of Higher Education
appointed by the Governor from a list of three names recommended by the commission. The
commission has several advisory councils and staffed offices.
Advisory Councils
Faculty;
Students;

R62I0001 – Maryland Higher Education Commission
Analysis of the FY 2016 Maryland Executive Budget, 2015 23
Financial Assistance; and
Private Career Schools.
Staffed Offices
Academic Affairs;
Research, Planning, and Policy Analysis;
Student Financial Assistance;
IT; and
Finance.
Over the past decade, MHEC has seen a significant reduction in its personnel and budget, and
in 2011, it was relocated from a rented office space in Annapolis to three different floors of the
Nancy Grasmick Building in downtown Baltimore City, the headquarters of MSDE. At that time, there
was a proposal to merge MHEC and MSDE, but it did not move forward.
Over the same time period, MHEC has frequently struggled to keep up with required and
requested reports. For example, the 2013 State Plan for Postsecondary Education, one of the most
critical publications from MHEC, was about nine months late. Items from the Joint Chairmen’s Report
(JCR) are often late, requiring extensions of due dates from the budget committees. The Report on
Students with Disabilities was extended three times. In the 2014 JCR, reports on redesign classes and
progress toward the 55% completion goal, both due in December 2014, were both at least two months
late. Part of this struggle to produce research reports is the fact that offices within MHEC have not
been fully staffed for many years. In the past year alone, MHEC has had one Secretary, two Acting
Secretaries, and lost its director of research, director of grants, and director of financial aid.
With a new Administration, a new Secretary, and a challenging budget for MHEC to work with,
now may be the time to consider significantly changing the operations of MHEC. A small, specialized
State unit of government has been merged into larger units of government in the past, so there is
precedent for continued discussion of what the most productive relationship between MHEC and
MSDE is. For example, during the economic recession in the early 2000s, the Office of Smart Growth
was absorbed into the Maryland Department of Planning and the Governor’s Workforce Investment
Board was merged into DLLR. In both cases, a specialized group was merged into an agency with a
similar, but broader, mission. Bringing higher education coordination under a larger existing agency,
such as MSDE, would achieve administrative efficiencies in areas such as IT, administration, and
human resources, while protecting the critical staff, funding, and leadership resources that support
MHEC’s mission to coordinate postsecondary activities in Maryland. Perhaps most importantly, this
structure would improve coordination between the primary, secondary, and higher education segments,

R62I0001 – Maryland Higher Education Commission
Analysis of the FY 2016 Maryland Executive Budget, 2015 24
already underway with varying success through the efforts of the Governor’s Prekindergarden-20
(P-20) Council and co-location of MSDE and MHEC.
In addition, the federal government and competitor states Massachusetts, New York, and
Pennsylvania organize higher education coordination under a state Department of Education rather than
as an autonomous coordinating body. In Massachusetts, higher education is one of several departments
organized under a Secretary of Education. New York and Pennsylvania have a single state board for
primary, secondary, and higher education. Proposals to reorganize higher education coordination under
a larger state department of education have also been put to Washington State in recent years. In 2011,
New Jersey abolished the New Jersey Commission on Higher Education and transferred all powers and
duties to the Secretary of Higher Education.
Given the co-location of both MHEC and MSDE, DLS recommends that MHEC work
with MSDE and other higher education stakeholders to create recommendations on the
organizational structure of MHEC, which should include considering whether MHEC should
become an office within MSDE, an equal partner with MSDE within a new State-level P-20
agency, or whether MHEC should retain its current form.
2. Campus Sexual Misconduct Policies and MHEC
MHEC has had statutory responsibility (Section 11-601 of the Education Article) since 1993 to
review sexual assault policies and how those policies should be posted and distributed in Maryland.
This includes the right to file criminal charges, designation of the nearest hospital, etc. MHEC must
also periodically review and make changes to institutional policies to ensure that higher education
institutions in Maryland are in compliance with federal regulations and are adopting best practices.
In summer 2014, MHEC began requesting all institutions’ sexual assault policies. By
January 2015, MHEC had reviewed all the policies of the public and independent institutions in the
State to ensure that all are in compliance with federal Title IX. This is a part of the Education
Amendments of 1972, which prohibits discrimination on the basis of sex in all education programs that
receive federal financial assistance. A related but distinct federal law from Title IX is the Jeanne Clery
Disclosure of Campus Security Policy and Campus Crime Statistics (Clery) Act of 1990. This requires
all universities to submit, at the beginning of every federal fiscal year (October 1), an Annual Security
Report (ASR) providing specific crime statistics, maintain a public crime log that covers the campus
and certain areas adjacent to campus, and meet several other requirements.
MHEC has requested that each institution revise its policies consistent with OCR best practices.
One concern that has arisen out of this process is the ease of access that USM has to the State’s Office
of the Attorney General (OAG). While these two entities worked together closely to resolve the issue
at USM institutions, the State’s community colleges generally do not have the same level of access to
the Attorney General’s Office. This is because public four-year institutions all have assigned OAG
counsel from the State and may also have in-house counsel, whereas the community colleges share
MHEC’s OAG counsels. Additional information on the update to the USM policy is provided in the

R62I0001 – Maryland Higher Education Commission
Analysis of the FY 2016 Maryland Executive Budget, 2015 25
USM Overview budget analysis. The OAG has recommended that all Maryland institutions should
adopt misconduct policies similar to USM’s.
In addition to reviewing policies, MHEC, in conjunction with the Maryland Association of
Community Colleges (MACC), held an all-day workshop for community colleges on sexual violence
in January 2015. This covered definitions of key terms, case studies of campus policies, and reporting
and adjudicating procedures. Maryland’s criminal code does not specifically define some terms
frequently used in Title IX and Clery discussions, such as sexual assault, domestic violence, dating
violence, or consent, so the workshop was able to assist community colleges in meeting federal intent.
This was very beneficial to smaller campuses, namely community colleges, who do not necessarily
have full-time legal representation on staff. This ensures that new policies are more inclusive and will
bring institutions into compliance with the next round of federal regulations, which take effect in
summer 2015. These changes expand rights afforded to campus survivors of sexual assault, expand
reporting for such incidents, and require institutions to provide certain training programs. It also
expands the types of crimes covered in the ASR and requires institutions to report the number of
withheld crime statistics. Finally, complicating implementation of sexual assault policies has been
compliance with the Family Education Rights and Privacy Act (FERPA), which governs access to
education records but allows disclosure of criminal conduct. Online federal resources provide materials
explaining how institutions are to comply with Title IX, the Clery Act, and FERPA. While MICUA
institutions were not included in this directly, Goucher College did provide resources and examples for
the two-year sector.
The Secretary and Director of MACC should comment on the outcomes of the sexual
assault policy workshop with the community colleges.
This MHEC review of Title IX and Clery policies coincides with an increase in federal
Department of Justice (DOJ) investigations into Title IX compliance nationwide. As of January 2015,
the following Maryland institutions are under investigation by the OCR within the U.S. Department of
Education (ED):
Frostburg State University as of September 18, 2013;
MSU as of June 26, 2014; and
The Johns Hopkins University as of August 8, 2014.
Every state bordering Maryland, as well as the District of Columbia, has institutions under
investigation, including 5 in Virginia and 7 in Pennsylvania. Of the 94 current investigations, nearly
all are at residential four-year institutions. Cases investigated are individual, hence, some campuses
have more than one ongoing OCR investigation.
Exhibit 12 shows campus crime statistics for sexual assault and aggravated assault for all years
currently available from ED. Overall, during this time period reported cases of aggravated assault

R62I0001 – Maryland Higher Education Commission
Analysis of the FY 2016 Maryland Executive Budget, 2015 26
Exhibit 12
Reported Aggravated and Sexual Assault Crimes in Maryland Reporting Years 2001-2013
MICUA: Maryland Independent College and University Association
Note: Includes crimes whose locations were reported as “campus” and “noncampus.” Educational sectors not shown
accounted for no more than one sexual assault and three aggravated assaults in any given reporting year and so are excluded
from this exhibit.
Source: U.S. Department of Education, Campus Safety and Security Data Analysis Cutting Tool
dropped from 80 cases or more per year down to less than half in 2011 through 2013. Meanwhile,
reported cases of sexual assault at Maryland campuses increased rapidly from 2010 through 2013,
especially at MICUA institutions. Whether this represents an increase in the incidence of sexual
assaults or an improvement in reporting crimes cannot be determined from this data.
0
10
20
30
40
50
60
70
80
90
100
2001 2002 2003 2004 2005 2006 2007 2008 2009 2010 2011 2012 2013
Sexual Assault Cases at Public Two-year Institutions
Sexual Assault Cases at MICUA
Sexual Assault Cases at Public Four-year Institutions
Total Aggravated Assault
R62I0001 – Maryland Higher Education Commission
Analysis of the FY 2016 Maryland Executive Budget, 2015 27
In September 2014, California passed a “Yes Means Yes” bill, upending the prior “No Means
No” standard used to determine consent in sexual relations. While codifying human sexual behavior
is not without complexity, the California measure requires “affirmative consent” and lists situations in
which a person cannot legally give consent. HB 138 in the current legislative session proposes a similar
policy for all Maryland institutions.
The Secretary, Director of MACC, and President of MICUA should comment on any next
steps for Maryland institutions to come into compliance with federal regulations on sexual assault
policies and any role MHEC may play in the near future to facilitate compliance for any
postsecondary education institution in Maryland.
3. New Funding Guidelines Model Adopted
In 1999, MHEC developed guidelines for operating funding for the public four-year higher
education institutions by identifying peer institutions that are similar to each Maryland institution in
size, program mix, enrollment composition, and other characteristics. After this selection process, the
financial characteristics of the peer institutions are analyzed to determine the resources available per
FTES. The overall goal has been to fund Maryland’s institutions at the seventy-fifth percentile of their
current peer institutions. Operating funds for SMCM are not evaluated through this process because
the college receives funding through a statutory formula.
In 2001, the commission staff, in consultation with representatives from USM, DLS, DBM, and
MSU, reviewed the funding guidelines process and established criteria for periodically updating peer
groups and for making adjustments to an institution’s peer group that is not in the normal cycle. The
MHEC schedule calls for an update every three to four years, with the opportunity for reevaluation of
any institution’s peer group when requested by the Maryland public college or university. In 2006, the
Commission to Develop the Maryland Model for Funding Higher Education (Funding Commission)
spent two years studying the levels, models, and policies for State funding provided to colleges and
universities and for student financial assistance. At the conclusion of this study in 2008, the Funding
Commission made several recommendations for modification of State higher education funding
policies such as setting State funding of public four-year institutions at the seventy-fifth percentile of
funding per student of a group of comparable institutions (“peers”) residing in states with which
Maryland principally competes for employers. These 10 states are referred to as Maryland’s competitor
states: California, Massachusetts, Minnesota, North Carolina, New Jersey, New York, Ohio,
Pennsylvania, Virginia, and Washington. Additionally, for historically black colleges and universities
(HBCU) the funding goal is raised to the eightieth percentile in recognition of the additional resources
needed for HBCUs to compete with other public institutions. This method is called the Competitor
State Funding Guideline Model.
The peer institutions selected for each Maryland school have similar academic scope,
comparable size, and a somewhat similar student financial profile and are reflected in each institution’s
Carnegie Classification. For the University of Maryland, College Park, an Association of American
Universities (AAU) school, other AAU schools in the competitor states have been used; and for
University of Maryland, Baltimore, other institutions within the Carnegie Classification of Special

R62I0001 – Maryland Higher Education Commission
Analysis of the FY 2016 Maryland Executive Budget, 2015 28
Focus Institutions – Medical Schools and Medical Centers and research institutions with medical
schools or freestanding medical centers have been selected. To recognize that institutions can change
Carnegie Classifications over time as they offer new programs and award new degrees, MHEC will
continue with the established schedule for an update to the peer groups every three to four years and
reevaluation of any institution’s peer group when requested by the Maryland public college or the
university.
The funding guideline for each institution is calculated by determining the
seventy-fifth percentile of the sum of State appropriation and tuition and fee revenue per FTES of the
competitor state peer institutions. The resulting per student rate is multiplied by the institution’s
projected enrollment to determine the recommended resources. Projected institutional tuition and fee
revenue is then subtracted from the recommended resources. The remainder represents the State
investment. The reason for selecting the seventy-fifth percentile reflects the commitment to raise
Maryland’s public colleges and universities into the upper quartile of other public colleges and
universities.
The Competitor State Funding Guideline information for each institution, as determined by the
peer groups recommended by the funding commission in 2008, is provided in Exhibit 13. Overall,
total State attainment was 76.5% in fiscal 2015 but declines to 70.8% in fiscal 2016, although neither
years reflect cost containment so the percentages will change. HBCUs as a group meet their goal of
eightieth percentile funding in both years, but the traditionally white institutions as a group do not meet
their seventy-fifth percentile goal in either year. The University of Maryland University College
(UMUC) has the lowest funding attainment in both years, below 54.0%, while Coppin State University
(CSU) has the highest in both years, over 125%. Coincidentally, UMUC and CSU are the only
institutions to see their funding attainment percentage improve in the unadjusted 2016 allowance. All
of these percentages will likely decrease given cost containment actions in the fiscal 2016 budget bill.
In April 2014, MHEC voted to adopt the competitor states model described previously, which
replaces the prior system of using institutional peers selected from throughout the country. The
Secretary should comment on how MHEC will use the funding guideline model with DBM given
the fiscal challenges facing the State. The Secretary should also comment on whether the funding
guidelines should be used by the General Assembly to inform budget decisions this legislative
session.

R62I0001 – Maryland Higher Education Commission
Analysis of the FY 2016 Maryland Executive Budget, 2015 29
Exhibit 13
Competitor State Funding Guidelines Fiscal 2015 and 2016
Institution 2015 2016 Change
Bowie State University 94.7% 87.3% -7.4%
Coppin State University 125.6% 126.0% 0.3%
Frostburg State University 85.5% 83.5% -2.0%
Salisbury University 70.0% 69.5% -0.5%
Towson University 64.8% 59.3% -5.5%
University of Baltimore 66.4% 62.8% -3.6%
University of Maryland, Baltimore 71.7% 66.1% -5.6%
University of Maryland Baltimore County 61.7% 57.6% -4.1%
University of Maryland Center for Environmental Science 82.8% 79.2% -3.6%
University of Maryland, College Park 80.4% 72.9% -7.5%
University of Maryland Eastern Shore 85.4% 76.3% -9.1%
University of Maryland University College1 53.3% 53.7% 0.4%
University System of Maryland (USM) Office
USM Total 76.1% 70.6% -5.5%
Morgan State University 81.3% 74.7% -6.6%
Total 76.5% 70.8% -5.6%
Historically Black Colleges and Universities 91.4% 84.8% -6.7%
Traditionally White Institutions 72.7% 67.3% -5.4% 1 University of Maryland University College calculations use only Maryland enrollment and statewide tuition revenue.
Note: This exhibit does not adjust numbers for cost containment in Maryland in either fiscal year.
Source: Maryland Higher Education Commission
4. Nursing Support Program II Extended
In 2006, at the request of the General Assembly, MHEC and the Maryland Board of Nursing
completed the Maryland Nursing Program Capacity Study. This stated Maryland would need over
62,000 registered nurses (RN) in 2012 and nearly 75,000 in 2016. The report predicted a shortage of
11,000 to 20,000 RNs in Maryland in 2012 without any new policies. The primary finding was that
the NSP I, a hospital-based initiative, was not sufficiently increasing the number of licensed nurses in
Maryland. This led directly to the creation of the NSP II, which is designed to increase the capacity of
Maryland’s nursing programs to produce more qualified nurses. Eligible programs can use funding to
support degree programs leading to an associate’s (RN), bachelor’s (Bachelor in Science of Nursing,
(BSN)), master’s, postgraduate certificates, or doctoral degrees. Since fiscal 2006, NSP II has
distributed about $91.4 million as follows:

R62I0001 – Maryland Higher Education Commission
Analysis of the FY 2016 Maryland Executive Budget, 2015 30
Competitive Institutional Grants ($63.4 Million): Between July 1, 2005, and July 1, 2014,
109 multi-year grants were awarded to 15 community colleges and 11 universities. Currently,
41 projects have concluded, and 68 are ongoing, some of which will not wrap up until
fiscal 2017. MHEC estimates 27% of nursing degree growth over the past decade is attributable
to these grants.
Scholarships and Grants ($19.1 Million): Almost 700 students are expected to complete
degree or postgraduate certificate programs to become nursing faculty and are required to fulfill
service obligations in Maryland.
New Nursing Faculty Fellowships ($4.1 Million): Since fiscal 2007, 245 new nursing faculty
have been supported for up to three years. Over 40% of these fellowships went to
underrepresented groups in the field of nursing, including African Americans and men.
Nurse Educator Doctoral Grants ($0.6 Million): Almost 30 doctoral nursing students have
received funding to assist in dissertation research and other scholarly projects.
The remaining $4.2 million is mostly dedicated to go out as scholarships and grants in
fiscal 2015 through 2018.
Funding for NSP II came from a 0.1% assessment on a hospital’s gross patient revenue over a
10-year period that is scheduled to end June 30, 2015. Legislation enacted in 2006 (Chapter 221)
created a nonlapsing special fund for NSP II revenues so that funds may be carried forward to future
fiscal years. The hospital fee was suspended for 23 months from February 2009 to January 2011 due
to higher than anticipated revenue and lower than anticipated initial proposals.
Exhibit 14 shows the number of master’s and doctoral degrees awarded in nursing in Maryland
from fiscal 2005 to 2014, as well as the total number of nursing graduates produced each year. Since
the first round of NSP II grants in fiscal 2006 to 2014, the number of master’s and doctoral degrees
awarded per year in nursing has increased 178.0%, from 243 to 675. This far exceeds MHEC’s original
goal of 350 graduates by 2013. The new goal set by MHEC is now to maintain 600 graduates a year
through 2018. Additionally, while all nursing degrees increased about 14.5% over the four-year period
of 2005 to 2009, it grew by 34.0% over the next five-year period, 2009 to 2014. Assuming some lag
between when NSP II funding could train more nursing faculty and when those nursing faculty could
then grow Maryland’s nursing programs, it does seem likely that NSP II had some effect in increasing
total nursing graduates in Maryland beginning in 2009. Impressively, despite the rapid growth in
nursing degrees, the National Council Licensure Examination pass rate in 2013 was 86.0%, down only
1 percentage point since 2005. These graduates are themselves qualified to teach RN and BSN
programs. However, in fiscal 2012, the program began to prioritize doctoral degrees as these are
increasingly preferred for nursing faculty, even at the community college level.

R62I0001 – Maryland Higher Education Commission
Analysis of the FY 2016 Maryland Executive Budget, 2015 31
Exhibit 14
Nursing Degrees Produced Fiscal 2005-2016 Est.
Source: Maryland Higher Education Commission
The anticipated final round of new competitive grants was awarded in fiscal 2014, with the last
round of statewide initiatives scheduled to be awarded in fiscal 2015. Fiscal 2018 would be the NSP II’s
last year of operation, and the program was expected to close with no fund balance or carry forward
funds. However, in January 2015, the Health Services Cost Review Commission (HSCRC)
unanimously agreed to a five-year extension of the NSP II contingent on a workgroup providing
recommendations to direct the next phase. The extension was supported by the Maryland Hospital
Association and the Maryland Nurses Association, as well as numerous educational institutions. With
this extension, there will be no pause in revenue collection, and new awards will be made in 2016. Part
of the workgroup’s recommendations will likely address concerns that arose from the most recent
federal Health Resources and Services Administration data, which reveals that Maryland will have a
deficit of nurses in 2025, whereas all of Maryland’s neighboring states do not. This raises the
possibility that NSP II has been successful at increasing Maryland’s output of nurses but that the
graduates may not be staying in Maryland for employment.
The Secretary and Executive Director of HSCRC should comment on how MHEC can be
sure Maryland hospitals are not simply paying for the training of nurses bound for other states.
303
243
329349 344
430
505
572595
675694
741
2,615 2,6972,810
2,993 2,9933,217
3,429
3,748
4,097 4,016 4,058
4,094
0
500
1,000
1,500
2,000
2,500
3,000
3,500
4,000
4,500
0
100
200
300
400
500
600
700
800
2005 2006 2007 2008 2009 2010 2011 2012 2013 2014 2015
Est.
2016
Est.
All N
ursin
g D
egrees
Gra
du
ate
Nu
rsin
g P
rog
ram
s
Graduate Nursing Degrees All Nursing Degrees

R62I0001 – Maryland Higher Education Commission
Analysis of the FY 2016 Maryland Executive Budget, 2015 32
5. Progress Toward 55% Degree Attainment
In February 2015, MHEC submitted a JCR that was due in December 2014 updating the State’s
progress toward the 55% degree completion goal by 2025. MHEC updated the 2012 model with new
demographic and employment information. In 2012, Maryland’s degree attainment was 44.7%, or
1.4 million Marylanders with a higher education credential of an associate’s degree or higher. The
estimate for Maryland put the target in 2025 at 3.3 million Marylanders to meet the goal given
population growth. Accounting for population growth and mortality, Maryland needs to produce
approximately 925,000 degrees between 2010 and 2025 and then sustain that level in the future.
The independent sector’s projections have been complicated by the closure of several
institutions recently, but about 105,000 of these degrees will come from private, nonprofit institutions,
while the remainder will come from the public sector. MHEC notes that enrollment growth will not
carry the State to the 2025 target as even the most generous high school graduate forecasts used by
MHEC only project 1.6% growth, while the federal government forecasts just 0.2% growth for
Maryland. For this reason, MHEC has erred on the side of conservatism with this model. For example,
it excludes out-of-state institutions.
Exhibit 15 shows the actual degrees produced and targets for the community colleges and
public four-year institutions. Both sectors surpassed their respective goals in all years of data in
MHEC’s report. This raises an issue of whether the degree production goals were set too low in the
model.
MHEC suggests best practices to institutions that will assist the State in maintaining progress
on the 55% goal. First, MHEC recommends increasing enrollment of additional high school students
and adult students through dual enrollment high school programs and simplified admissions processes,
respectively. Second, institutions should retain and graduate more existing students, which is more
efficient than having to enroll more in the first place. This would involve improving academic supports
and supporting the redesign of introductory courses. Third, MHEC recommends reducing the
achievement gap between all students and minority students through targeted advising, student mentors,
and financial literacy efforts.
To support these practices, MHEC held its second Statewide College Completion conference
in November 2014. MHEC suggests the best policy approach going forward may be to encourage
efforts by institutions through competitions and other incentives and to encourage further research into
problems of student persistence and departure from the classroom.
The Secretary should comment on whether UMUC should be shown separately as a sector
in future analyses due to the different mission and enrollment size of that institution.

R62I0001 – Maryland Higher Education Commission
Analysis of the FY 2016 Maryland Executive Budget, 2015 33
Exhibit 15
55% Degree Attainment Goals by Sector Fiscal 2010-2014
Source: Maryland Higher Education Commission
0
5,000
10,000
15,000
20,000
25,000
30,000
2010 2011 2012 2013 2014
Community Colleges Target Community Colleges Actual
Four-years Target Four-years Actual

R62I0001 – Maryland Higher Education Commission
Analysis of the FY 2016 Maryland Executive Budget, 2015 34
Recommended Actions
1. Add the following language:
, provided that it is the intent of the General Assembly that institutional grants to a public
four-year institution should be transferred only by budget amendment to that institution.
Explanation: This action provides greater clarity to the General Assembly on when an
institution receives an institutional grant from the Maryland Higher Education Commission and
also prevents funds from being double counted in the working appropriation.
2. Strike the following language to the general fund appropriation:
, provided that this appropriation shall be reduced by $6,461,675 contingent upon the
enactment of legislation reducing the required appropriation for aid to non-public institutions
of higher education
Explanation: This language is not necessary for the General Assembly to reduce the
appropriation.
3. Add the following language to the general fund appropriation:
, provided that funding in the Sellinger Program in fiscal 2016 should be distributed by the
most recent audited enrollment figures.
Explanation: This reruns the Sellinger formula based on enrollment rather than being frozen
at the prior year’s numbers.
Amount
Reduction
4. Reduce Sellinger formula funding. $ 6,461,675 GF
5. Add the following language to the general fund appropriation:
, provided that $4,900,000 in general funds designated to enhance the State’s four historically
black colleges and universities may not be expended until the Maryland Higher Education
Commission submits a report to the budget committees outlining how the funds will be spent.
The budget committees shall have 45 days to review and comment on the report. Funds
restricted pending receipt of a report may not be transferred by budget amendment or otherwise
to any other purpose and shall revert to the General Fund if the report is not submitted to the
budget committees.

R62I0001 – Maryland Higher Education Commission
Analysis of the FY 2016 Maryland Executive Budget, 2015 35
Explanation: This annual language restricts the expenditure of funds until the commission
reports to the budget committees on the plans for spending funds designated to enhance the
State’s four historically black colleges and universities (HBCU).
Information Request
HBCU enhancement
expenditure report
Author
Maryland Higher Education
Commission
Due Date
July 1, 2015
6. Adopt the following narrative:
Report on Best Practices and Annual Progress Toward the 55% Completion Goal: The
committees understand that in order to meet the State’s goal to have at least 55% of Maryland’s
residents age 25 to 64 holding at least one degree credential by 2025, accurate and timely
information on degree progression and best practices is needed to ensure that the State is on
track to meet the goal. The committees request that the Maryland Higher Education
Commission (MHEC) annually collect and analyze student- and transcript-level data on
progression, graduation, and other relevant metrics from each public institution of higher
education, including community colleges and regional higher education centers. MHEC should
submit a report by December 15 each year that analyzes the data and shows each institution’s
progress toward the State and institutional goals in 2025. The report should also include a
summary of best practices and findings on the effectiveness of institutions’ programs, as well
as any concerns regarding lack of progress or best practices that are not being implemented by
institutions.
In addition, the committees request that MHEC, on behalf of the Governor and
General Assembly and in collaboration with the Governor’s Prekindergarten-20 Council,
convene a biennial Summit on Completion that provides a forum for representatives of all
segments of education (including K-12), economic and workforce development, and other
stakeholders to share best practices on college completion that are underway in Maryland and
hear from experts on best practices in other states that may be replicated in Maryland. A
summary of the summit should be included in the annual report on best practices and progress
toward the 55% goal.
Information Request
Report on best practices and
progress toward 55%
completion goal
Author
MHEC
Due Date
December 15, 2015, and each
year thereafter

R62I0001 – Maryland Higher Education Commission
Analysis of the FY 2016 Maryland Executive Budget, 2015 36
7. Adopt the following narrative:
Report on Outcomes of Students Participating in Access and Success Programs by
Cohort: The committees understand that as part of the State’s agreement with the federal
Office for Civil Rights, the State has provided annual funding to Maryland’s public historically
black colleges and universities (HBCU) to improve retention and graduation rates. From
fiscal 2001 to 2006, the funds were budgeted through the Maryland Higher Education
Commission (MHEC) and released after each HBCU submitted proposals to MHEC outlining
how the funds would be spent in the coming year. Beginning in fiscal 2007, Access and Success
funds were appropriated directly to HBCUs. The committees request that MHEC collect
progression, retention, and graduation data from each public HBCU on all students
participating in the Access and Success program in fiscal 2015. Data should be analyzed and
presented by institution and program. Data should include the throughput completion rate in
credit-bearing coursework for required remedial classes and graduation rates. The report
should include a summary of fiscal 2015 programs supported by Access and Success funds and
a statement from each institution on how findings from the 2014 report have been used to
inform and improve programs and student services supported by Access and Success funds.
The report shall be submitted by October 15, 2015, and every year thereafter.
Information Request
Report on the fiscal 2015
outcomes by cohort of
students participating in
Access and Success programs
Author
MHEC
Due Date
October 15, 2015, and
annually thereafter
8. Adopt the following narrative:
Future of the Maryland Higher Education Commission: With changes in leadership at the
Maryland Higher Education Commission (MHEC) and a continued effort to maximize State
resources across all agencies in times of limited State support, the committees believe it is an
appropriate time for MHEC to reexamine the current structure of MHEC and to develop
recommendations to improve the higher education coordination, monitoring, and reporting
body in Maryland. MHEC should work with the Maryland State Department of Education
(MSDE), the University System of Maryland (USM), and representatives from the community
colleges and independent institutions to consider and make recommendations, including the
following options: (1) that MHEC should become an office within MSDE; (2) that MHEC
should be an equal partner with MSDE within a new State-level prekindergarten-20 agency; or
that (3) MHEC should retain its current form. The authors of this report are encouraged to
think broadly and to explore, at a minimum, sharing administrative resources to generate cost
efficiencies for MHEC and MSDE and to reduce redundancies. The authors should also
consider agency models used in other states, and to note whether ideas from prior State
commissions such as the 1963 Curlett Report or 1999 Larson Report have been implemented
or addressed.

R62I0001 – Maryland Higher Education Commission
Analysis of the FY 2016 Maryland Executive Budget, 2015 37
Information Request
Report on the Role, Structure,
and Future of MHEC
Authors
MHEC
MSDE
USM
Maryland Association of
Community Colleges
Maryland Independent
College and University
Association
Due Date
December 15, 2015
Total General Fund Reductions $ 6,461,675

R62I0001 – Maryland Higher Education Commission
Analysis of the FY 2016 Maryland Executive Budget, 2015 38
Updates
1. Historically Black Colleges and Universities’ Lawsuit Ruling Pending
In 2006, the Coalition for Equity and Excellence in Maryland Higher Education, Inc. brought
suit against the State for alleged violations of the Civil Rights Act of 1964 and the Equal Protection
Clause of the U.S. Constitution – both of which protect against discrimination on the basis of race,
color, or national origin. In the coalition’s lawsuit, three policies of the Maryland system of higher
education allegedly traceable to the prior de jure system were at issue: (1) limited institutional
missions; (2) operational funding deficiencies; and (3) unnecessary program duplication. In
October 2013, the court did not find that mission-related policies or practices or current operational
funding were traceable to the de jure era; however, the court did find that the State has failed to
eliminate unnecessary program duplication for Maryland’s HBCUs and that this policy is traceable to
the de jure era.
The court concluded that the coalition proved that unnecessary program duplication continues
and is a policy traceable to prior de jure segregation in Maryland higher education. The court, applying
the law established by the Supreme Court in United States v. Fordice, 505 U.S. 717 (1992), defined
unnecessary duplication as the offering by two or more institutions of the same nonessential or noncore
programs; nonbasic liberal arts and sciences course work at the bachelor’s level; and all duplication at
the master’s level and above. The court cited MHEC’s decision to approve a joint University of
Baltimore/Towson University Master of Business Administration program, despite the objections of
MSU in 2005 as an example of how the State has failed to prevent additional unnecessary duplication.
Despite the findings of fact and conclusions of law included in the memorandum, the court has
deferred entry of judgment pending mediation or further proceedings, if necessary, to establish a
remedy. The case was referred back for mediation with a court-appointed judge as mediator. As a
promising starting point, the court, quoting the coalition’s expert, suggests that each HBCU “should
develop programmatic niches of areas or areas of excellence in at least two high-demand clusters within
the next three to four years.” The niche areas identified by the court include Green Sustainability
Studies, Computer Sciences, Aging Studies, and Health Care Facilities Management. Additionally, the
court’s coalition’s expert court said it is likely that transfers or merging of programs will be necessary.
If mediation is unsuccessful, then one or more of the parties may request an immediate appeal under
the Federal Rules of Civil Procedure.
Negotiations are ongoing, but in the event they are not successful, the court has set a briefing
schedule for proposed remedies beginning at the end of April 2015.
2. Access and Success Outcomes
Access and Success funds (A&S) have been provided since fiscal 2001 to improve student
retention and graduation rates at HBCUs. Annual committee narrative since fiscal 2010 requires
MHEC to collect and analyze progression, retention, and graduation data by cohort to evaluate the

R62I0001 – Maryland Higher Education Commission
Analysis of the FY 2016 Maryland Executive Budget, 2015 39
impact of A&S programs across HBCUs. Despite the A&S funding, concerns continue over declining
retention and graduation rates at HBCUs, and, in particular, the progression of students into
credit-bearing coursework and their graduation rates.
The 2014 Report on Outcomes of Students Participating in Access and Success Programs by
Cohort used 10 indicators to compare A&S students to the general first-year student population.
Overall, there is considerable variation in performance, but many A&S students, particularly in the
summer bridge programs, outperform other first-year students, although the strong performance varies
from school to school. At Bowie State University (BSU), participants earn six to eight more credits in
the first year and maintain comparable grade point averages (GPA). Unfortunately, A&S students at
BSU actually had a four-year graduation rate half that of regular students in fall 2008 and 2010 cohorts.
This indicates that while A&S may get some students on track for the first year, the effect does not last
long enough to improve, let alone maintain, on-time graduation rates.
Other anomalies include the fact that A&S students at CSU are less likely to complete
developmental math than their peers, despite the extra support services provided, in the last
three cohorts. In the fall 2012 cohort, the gap was 17 percentage points, while in fall 2011 and 2013,
the rates were only 1 percentage point lower. Additionally, CSU’s summer bridge program
participation fell from about 250 students in fall 2011 to only 110 students in fall 2013. CSU’s A&S
students, however, have consistently higher GPAs than other students.
At MSU, A&S summer bridge participation fell from 42 in fall 2011 to only 20 in fall 2013.
Additionally, the bridge students were about 30 percentage points less likely to participate in
developmental education, so it is not clear if this funding is actually making college more accessible.
The MSU A&S students consistently earn three to seven additional credits in the first year and have
significantly higher GPAs. Despite this, the on-time four-year graduation rate remains in the single
digits.
The University of Maryland Eastern Shore (UMES) does not offer any summer bridge and
instead focuses on broad programs intended to promote retention and progression across much of the
student body (about one-third to half in total, depending on the year). As shown in Exhibit 16, UMES’
four-year graduation rate of 17% is the only one of the HBCUs to break 10% for students served by
A&S funding. While UMES’ A&S students’ throughput completion rates were sometimes worse than
their peers, they earned more credits and had higher GPAs, indicating that they persisted, even when
they were not initially on time to graduation in the first year of studies. UMES’ rate is comparable to
the State average for African American students in the 2010 cohort.
The key difference between UMES and the other three institutions is that UMES does not fund
a bridge program. Given that the three bridge programs operating each focus on a different population
and none of them have greatly improved students outcomes, whether summer bridges remain a best
practice for Maryland schools becomes an issue. MHEC did conclude its report with “Campuses should
make every effort to extend the reach of their Access and Success programs, to ensure the greatest
number of students is able to access the variety of series support by these funds.”

R62I0001 – Maryland Higher Education Commission
Analysis of the FY 2016 Maryland Executive Budget, 2015 40
Exhibit 16
Four-year Graduation Rates at HBCUs 2008 and 2010 cohorts
UMES BSU CSU MSU
State
Average**
A&S All Others A&S All Others A&S All Others A&S All Others
2010 Cohort 17.2% 15.5% 6.3% 12.0% 6.1% 6.0% 9.1% 9.2% *
2008 Cohort 18.2% 19.2% 3.8% 7.8% * * 7.9% 11.8% 18.1%
A&S: Access and Success
BSU: Bowie State University
CSU: Coppin State University
HBCU: Historically Black Colleges and Universities
MSU: Morgan State University
UMES: University of Maryland Eastern Shore
*Data not available.
** For first-time, full-time African American students.
Source: Maryland Higher Education Commission, Access and Success, 2014 Report
3. Renewable Energy Research Grants and Degree Programs
The 2012 merger between the energy firms Exelon and Constellation Energy provided certain
funds available to “support research and development in wind energy applications.” A one-time research
funding opportunity was made available to Maryland’s public higher education institutions for research
related to the development of offshore wind (OSW) energy in Maryland. The BRFA of 2013 requires
this money to be appropriated through acts of the General Assembly or the State budget bill, except that
in fiscal 2013, it could be appropriated by budget amendment with approval of the Legislative Policy
Committee and the budget committees. MHEC, with assistance from the Maryland Energy
Administration (MEA), functions as the grant manager, but funding will pass straight from Exelon to the
awarded institutions, so this funding does not appear with the other educational grants in Exhibit 9.
Exhibit 17 shows the grants that MHEC and MEA approved for four institutions in fiscal 2014.
About $1 million remains that had previously been awarded in fiscal 2013. The overall goal is to raise
the prominence of Maryland institutions in OSW energy and related research.

R62I0001 – Maryland Higher Education Commission
Analysis of the FY 2016 Maryland Executive Budget, 2015 41
Exhibit 17
Offshore Wind Research Grants Fiscal 2014
Institution Project Title Award
MSU Foundation Anchorages for OSW Turbines in Deep Water
Using Composite Materials
$265,000
UMBC OSW Turbine Foundation Design and Optimization toward
Effective Deployment of OSW Turbines in Maryland
300,630
UMCP Stochastic Life Cycle Cost and ROI Modeling to Support
Cost Avoidance Business Cases for OSW Operation and
Maintenance
260,000
UMES Management Strategy to Produce Cost Effective OSW
Power
120,000
Total $945,630
Fiscal 2013 Awards Made $1,054,370
Total Grant Amount $2,000,000
MSU: Morgan State University
OSW: offshore wind
ROI: return on investment
UMBC: University of Maryland Baltimore County
UMCP: University of Maryland, College Park
UMES: University of Maryland Eastern Shore
Source: Maryland Higher Education Commission
Additionally, new renewable energy degree programs will be developed at community colleges
and HBCUs in Maryland. This follows in the footsteps of prior statewide efforts at building academic
and workforce leadership through development of biotechnology, nursing, and cybersecurity programs.
The Maryland Offshore Wind Energy Act (Chapter 3 of 2013) created the Clean Energy Technical
Education Task Force. The task force was supported by MHEC and MEA and issued a report in
June 2014 on its mandate to study programs and course offerings currently offered in clean energy and
to identify areas where more course offerings should be made at community colleges. The final report
made four recommendations:

R62I0001 – Maryland Higher Education Commission
Analysis of the FY 2016 Maryland Executive Budget, 2015 42
Focus on supply chain and logistics management.
Develop partnerships in marine operations and maintenance, safety, seamanship; and explore
workforce development at the Port of Baltimore.
Develop and fund a Renewable Energy Affinity Group to match industry needs to educational
entities that can help meet those needs.
Incentivize community college renewable energy associate degree, certificate, continuing
education, and/or training program development, through a competitive grant program jointly
managed by MHEC and MEA.
Funding to enact these recommendations is not included in the fiscal 2016 allowance.
The same legislation also established a Clean Energy Program Task Force to study academic
degree opportunities for HBCUs, both terminal degrees and certificate programs. This task force
produced six interlinked recommendations that included funding new faculty at the HBCUs to create
new master’s degree programs that would feed into new doctoral programs on other HBCU campuses.
While the final recommendation would restrict a portion of the Maryland E-Nnovation Fund for
HBCUs, this would still presumably depend on HBCUs procuring matching funds. Additionally, since
the E-Nnovation’s special fund source is expected to decline in out-years, this may not be the most
stable source of funding to use for faculty positions.

R62I0001 – Maryland Higher Education Commission
Analysis of the FY 2016 Maryland Executive Budget, 2015 43
Appendix 1
Current and Prior Year Budgets
Fiscal 2014
Legislative
Appropriation $55,799 $16,902 $3,615 $118 $76,434
Deficiency
Appropriation -203 0 0 0 -203
Budget
Amendments 86 499 0 170 755
Reversions and
Cancellations -132 -4,086 -1,503 -68 -5,790
Actual
Expenditures $55,550 $13,315 $2,112 $220 $71,196
Fiscal 2015
Legislative
Appropriation $60,176 $18,210 $3,570 $0 $187 $82,143
Cost
Containment -3,298 0 0 0 -3,298
Budget
Amendments 37 467 2 134 639
Working
Appropriation $56,915 $18,677 $3,572 $321 $79,485
Current and Prior Year Budgets
Fund FundFund
Reimb.
Fund Total
($ in Thousands)
Maryland Higher Education Commission
General Special Federal
Note: Numbers may not sum to total due to rounding. The fiscal 2015 working appropriation does not include January 2015
Board of Public Works reductions and deficiencies.
R6
2I0
0.0
1 –
Ma
rylan
d H
igh
er Ed
uca
tion
Co
mm
ission
Appen
dix
1

R62I0001 – Maryland Higher Education Commission
Analysis of the FY 2016 Maryland Executive Budget, 2015 44
Fiscal 2014
The fiscal 2014 legislative appropriation for MHEC was reduced by $5.2 million. Deficiency
appropriations decreased general funds by $203,000.
Budget amendments added $755,000: general funds increased $68,000, special funds
$4,000, and federal funds $4,000 to support the COLA and salary increments; special funds also
increased $500,000 due to an ongoing, but unspent, Credit When It’s Due grant being moved to
fiscal 2014 from the prior year; and reimbursable funds increased by $170,000 to fund a memorandum
of understanding for a new Adult Learning position to coordinate between MHEC and DLLR under
the Workforce Investment Act (WIA).
Reversions and cancellations totaled $5.8 million. Of this:
$132,000 in general funds reverted due to a change in scope and timeline for a large IT project
that MHEC is working on with guidance from other State agencies;
$4.1 million in special funds were canceled. Of that amount, $3.9 million is fund balance from
the NSP II and other health grants that MHEC will carry forward to fiscal 2015 because
application reviews were not completed or funds were returned. The remainder represents about
$140,000 in reduced income from online program registration fees;
$1.5 million in federal funds were cancelled due to staff departures from MHEC’s federal
programs, as well as funds returned to MHEC due to lower than anticipated grant project costs.
Some funds are eligible to be reissued within grant periods that extend into the next fiscal year;
and $68,000 in reimbursable funds were cancelled due to lower WIA charges.
Fiscal 2015
To date in fiscal 2015, cost containment actions by BPW decreased general funds by a total of
$3.3 million by reducing Sellinger aid by $3.0 million, cutting operating expenses by $52,000, and
transferring $246,000 in administrative positions to a program fee providing special funds.
General funds increased about $37,000, special funds by $3,000, and federal funds by $2,000 to
account for the fiscal 2015 COLA. Special funds increased $463,000 due to an ongoing, but unspent,
Credit When It’s Due grant being moved to fiscal year 2015 from the prior year.

An
alysis o
f the F
Y 2
016 M
aryla
nd E
xecu
tive Bu
dget, 2
015
45
Object/Fund Difference Report
Maryland Higher Education Commission
FY 15
FY 14 Working FY 16 FY 15 - FY 16 Percent
Object/Fund Actual Appropriation Allowance Amount Change Change
Positions
01 Regular 55.60 56.60 58.60 2.00 3.5%
02 Contractual 7.34 13.00 6.83 -6.17 -47.5%
Total Positions 62.94 69.60 65.43 -4.17 -6.0%
Objects
01 Salaries and Wages $ 4,543,120 $ 5,196,891 $ 5,520,029 $ 323,138 6.2%
02 Technical and Spec. Fees 432,546 722,879 455,149 -267,730 -37.0%
03 Communication 55,822 36,602 67,311 30,709 83.9%
04 Travel 61,785 49,650 53,044 3,394 6.8%
07 Motor Vehicles 67,932 76,420 58,620 -17,800 -23.3%
08 Contractual Services 935,036 549,505 427,365 -122,140 -22.2%
09 Supplies and Materials 23,544 16,269 11,600 -4,669 -28.7%
10 Equipment – Replacement 27,738 7,500 12,250 4,750 63.3%
11 Equipment – Additional 0 2,480 2,500 20 0.8%
12 Grants, Subsidies, and Contributions 64,581,648 72,414,967 65,917,069 -6,497,898 -9.0%
13 Fixed Charges 466,578 412,198 413,728 1,530 0.4%
Total Objects $ 71,195,749 $ 79,485,361 $ 72,938,665 -$ 6,546,696 -8.2%
Funds
01 General Fund $ 55,549,691 $ 56,915,057 $ 61,612,902 $ 4,697,845 8.3%
03 Special Fund 13,314,763 18,676,852 8,214,856 -10,461,996 -56.0%
05 Federal Fund 2,111,540 3,572,013 2,764,634 -807,379 -22.6%
09 Reimbursable Fund 219,755 321,439 346,273 24,834 7.7%
Total Funds $ 71,195,749 $ 79,485,361 $ 72,938,665 -$ 6,546,696 -8.2%
Note: The fiscal 2015 working appropriation does not include January 2015 Board of Public Works reductions and deficiencies. The
fiscal 2016 allowance does not reflect contingent or across-the-board reductions.
R6
2I0
00
1 –
Ma
rylan
d H
igh
er Ed
uca
tion
Co
mm
ission
Appen
dix
2

An
alysis o
f the F
Y 2
016 M
aryla
nd E
xecu
tive Bu
dget, 2
015
46
Fiscal Summary
Maryland Higher Education Commission
FY 14 FY 15 FY 16 FY 15 - FY 16
Program/Unit Actual Wrk Approp Allowance Change % Change
01 General Administration $ 6,445,470 $ 6,929,345 $ 7,042,910 $ 113,565 1.6%
02 College Prep/Intervention Program 750,000 750,000 750,000 0 0%
03 Joseph A. Sellinger Program 41,291,975 41,422,240 47,883,915 6,461,675 15.6%
07 Educational Grants 9,954,337 12,896,855 9,990,250 -2,906,605 -22.5%
34 Major Information Technology Development
Projects
200,622 0 0 0 0%
38 Nurse Support Program II 11,980,088 15,486,921 6,521,590 -8,965,331 -57.9%
39 Health Personnel Shortage Incentive Grant
Program
573,257 2,000,000 750,000 -1,250,000 -62.5%
Total Expenditures $ 71,195,749 $ 79,485,361 $ 72,938,665 -$ 6,546,696 -8.2%
General Fund $ 55,549,691 $ 56,915,057 $ 61,612,902 $ 4,697,845 8.3%
Special Fund 13,314,763 18,676,852 8,214,856 -10,461,996 -56.0%
Federal Fund 2,111,540 3,572,013 2,764,634 -807,379 -22.6%
Total Appropriations $ 70,975,994 $ 79,163,922 $ 72,592,392 -$ 6,571,530 -8.3%
Reimbursable Fund $ 219,755 $ 321,439 $ 346,273 $ 24,834 7.7%
Total Funds $ 71,195,749 $ 79,485,361 $ 72,938,665 -$ 6,546,696 -8.2%
Note: The fiscal 2015 working appropriation does not include January 2015 Board of Public Works reductions and deficiencies. The
fiscal 2016 allowance does not reflect contingent or across-the-board reductions.
R6
2I0
00
1 –
Ma
rylan
d H
igh
er Ed
uca
tion
Co
mm
ission
Appen
dix
3