Embed Size (px)
Citation preview

Budgeting and control of the mechanical noise in the International LinearCollider final focus system
D. Tshilumba,1 M. Oriunno,2 T. Markiewicz,2 and C. Collette11Université Libre de Bruxelles, BEAMS Department, 50 F.D. Roosevelt Avenue, 1050 Brussels, Belgium2SLAC National Accelerator Laboratory, 2575 Sand Hill Road, Menlo Park, California 94025, USA
(Received 26 December 2013; published 11 June 2014)
In this paper, we present a simplified vibration model of the silicon detector (SiD), where the finaldoublet (QD0) is captured inside the detector and the penultimate magnet (QF1) is inside the machinetunnel. Ground motion spectra measured at the detector hall at SLAC have been used together with aspectrum of the technical noise on the detector. The model predicts that the maximum level of rms (rootmean square) vibration seen by QD0 is well below the capture range of the interaction point (IP) feedbacksystem available in the ILC. With the addition of an active stabilization system on QD0, it is also possible toget closer to the stability requirements of the compact linear collider (CLIC). These results can haveimportant implications for CLIC.
DOI: 10.1103/PhysRevSTAB.17.062801 PACS numbers: 45.80.+r, 46.40.Ff
I. INTRODUCTION
Ground motion and mechanical vibration can be majorsources of luminosity loss at the final focus system (FFS) offuture linear colliders, where the beams are nanometric andare required to be stable to better than a fraction of their size[1]. Reliable vibration models are therefore needed duringthe design process to establish the effectiveness of thesupporting scheme to be adopted to protect the FFS fromexternal vibration sources [2].The beam structure of an ILC [3] bunch train (1312
bunches spaced by 554 ns) allows for an intratrain feedbacksystem that measures the beam-beam deflection and drivesa correction kicker. The sensitivity to jitter is therebyincreased from the beam size (∼7 nm) to the capture rangeof the feedback system (∼1 um), which is set by thestrength of the beam-beam deflection and the resolutionof the beam position monitor (BPM) that measures theresulting displacement. The smaller the jitter is betweenbunch trains, the fewer number of bunches required to bringthe beams into collision. The goal in the ILC has been tokeep the incoming jitter to less than 200 nm, where theresultant luminosity loss is calculated to be less than4% [4].For the CLIC [5–7] beam structure intratrain feedback is
less efficient and a combination of a careful design of thesupport structures with an active stabilization system isrequired [8–10], in combination with a repositioningsystem [11] and a preisolator [12]. The CLIC final doubletis required to be as stable as 0.15 nm above 4 Hz [5]. The
requirement of maximizing the luminosity leads to opticalschemes with the final doublet very close to the IP (∼4 m),captured in the innermost part of the forward region of thedetector, which adversely affects the so-called “push-pull”operation mode where two detectors need to quickly(in a few days) swap their position on the IP after each(∼1 month long) data run. The silicon detector (SiD)detector [13] at the ILC has developed a support scheme
FIG. 1. Artist’s view of the ILC SiD. The QF1 cryostat ispictured in green and is supported by the tunnel floor (which, forclarity, is not drawn). The QD0 cryostat is contained within thegray support tube visible in the cutaway of the iron door. Thesetwo magnet assemblies are connected by a ∼2 m piece ofbeampipe housing, on the input beam leg, the feedback system’sstripline kicker (which appears in black).
Published by the American Physical Society under the terms ofthe Creative Commons Attribution 3.0 License. Further distri-bution of this work must maintain attribution to the author(s) andthe published article’s title, journal citation, and DOI.
PHYSICAL REVIEW SPECIAL TOPICS - ACCELERATORS AND BEAMS 17, 062801 (2014)
1098-4402=14=17(6)=062801(9) 062801-1 Published by the American Physical Society
for the FFS which allows both the reduction of themechanical vibrations and a “fast” push-pull positionexchange [14]. If coupled with an active stabilizationsystem [15], this design can be applied effectively alsoto CLIC, where the IP feedback system is not as efficient. Inthe SiD scheme the QD0 quadrupole cryostat is supporteddirectly on the iron of the flux return “door” and thereforemoves with the detector, while the QF1 magnet cryostat isstationary in the machine tunnel (Fig. 1). In order toevaluate the level of vibration seen by the QD0 and theQF1 we developed in MATLAB a linear vibration modelwith lump mass and springs, which represent the funda-mental parts of the detector. The state variables are thevertical degrees of freedom and the input variables arethe ground vibrations and the detector noise generated bythe technical systems on the detector. A closed loopanalysis has been implemented to study the effects ofthe active stabilization. The paper is organized as follows.Section II presents the numerical model of the final focus,including the model of the beams, Sec. III presents theseismic response obtained with new measurements on site.Section IV studies the influence of two important para-meters on the response, i.e. the stiffness of the ground andthe amount of technical noise. Section V shows anobjective figure of the benefit of quadrupole vibration
isolation in a noisy environment, and Sec. VI draws theconclusions.
II. DESCRIPTION OF THE MODEL
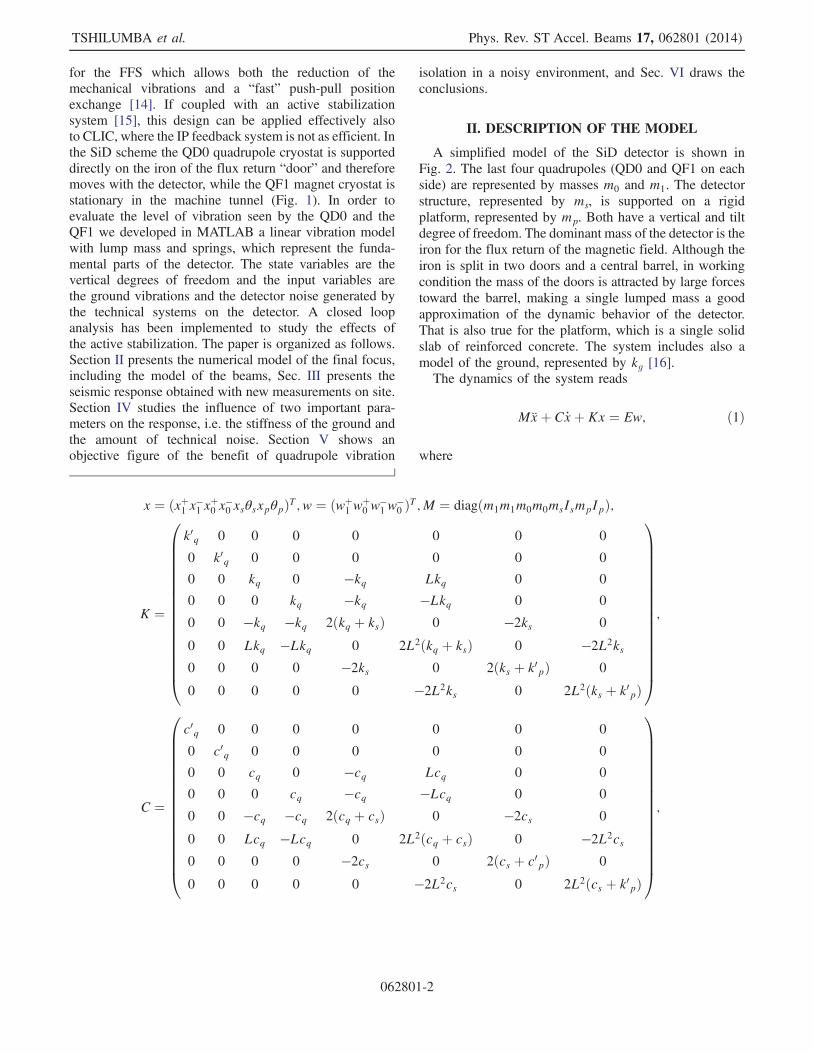
A simplified model of the SiD detector is shown inFig. 2. The last four quadrupoles (QD0 and QF1 on eachside) are represented by masses m0 and m1. The detectorstructure, represented by ms, is supported on a rigidplatform, represented by mp. Both have a vertical and tiltdegree of freedom. The dominant mass of the detector is theiron for the flux return of the magnetic field. Although theiron is split in two doors and a central barrel, in workingcondition the mass of the doors is attracted by large forcestoward the barrel, making a single lumped mass a goodapproximation of the dynamic behavior of the detector.That is also true for the platform, which is a single solidslab of reinforced concrete. The system includes also amodel of the ground, represented by kg [16].The dynamics of the system reads
Mxþ C_xþ Kx ¼ Ew; ð1Þ
where
x ¼ ðxþ1 x−1 xþ0 x−0 xsθsxpθpÞT; w ¼ ðwþ1 w
þ0 w
−1 w
−0 ÞT;M ¼ diagðm1m1m0m0msIsmpIpÞ;
K ¼
0BBBBBBBBBBBBBBBB@
k0q 0 0 0 0 0 0 0
0 k0q 0 0 0 0 0 0
0 0 kq 0 −kq Lkq 0 0
0 0 0 kq −kq −Lkq 0 0
0 0 −kq −kq 2ðkq þ ksÞ 0 −2ks 0
0 0 Lkq −Lkq 0 2L2ðkq þ ksÞ 0 −2L2ks0 0 0 0 −2ks 0 2ðks þ k0pÞ 0
0 0 0 0 0 −2L2ks 0 2L2ðks þ k0pÞ
1CCCCCCCCCCCCCCCCA
;
C ¼
0BBBBBBBBBBBBBBBB@
c0q 0 0 0 0 0 0 0
0 c0q 0 0 0 0 0 0
0 0 cq 0 −cq Lcq 0 0
0 0 0 cq −cq −Lcq 0 0
0 0 −cq −cq 2ðcq þ csÞ 0 −2cs 0
0 0 Lcq −Lcq 0 2L2ðcq þ csÞ 0 −2L2cs0 0 0 0 −2cs 0 2ðcs þ c0pÞ 0
0 0 0 0 0 −2L2cs 0 2L2ðcs þ k0pÞ
1CCCCCCCCCCCCCCCCA
;
TSHILUMBA et al. Phys. Rev. ST Accel. Beams 17, 062801 (2014)
062801-2

E ¼
0BBBBBBBBBB@
k0q þ sc0q 0 0 0
0 0 0 k0q þ sc0q0 0 0 0
0 0 0 0
0 0 0 0
0 0 0 0
0 k0p þ sc0p k0p þ sc0p 0
0 −Lðk0p þ sc0pÞ Lðk0p þ sc0pÞ 0
1CCCCCCCCCCA; k0p ¼ kpkg
kp þ kg; c0p ¼ cpcg
cp þ cg;
k0q ¼kqkg
kq þ kg; c0q ¼
cqcgcq þ cg
.
Dashpots are added in parallel with each spring, usingthe same subscripts as the stiffness. They are not shown forthe clarity of Fig. 2 but are taken into account in all of thecalculations. M is the mass matrix, C is the dampingmatrix, K is the stiffness matrix, w is the vector of groundmotion, and E is the matrix of excitations.The parameter values listed in Table I were calculated as
follows: mass and inertia properties have been calculatedby design software. The stiffness parameters wereestimated with a simplified finite element model of thesingle parts. Based on our experience, we have assumed adamping ratio of 5%, which is a typical value for such astructure. This assumption led to the coefficients mentionedin Table I. The values of L0 and L1, along with the detailedbaseline design of the SiD can be found in [17].From the dynamic equation above, we can calculate the
matrix of the transfer function as
HðsÞ ¼ ðMs2 þ Csþ KÞ−1E;where s is the Laplace variable. The magnitudes of thetransfer functions from the ground to the quadrupoles are
shown in Fig. 3. We see on the figure that the quality factorof the four peaks below 30 Hz is about 10, i.e. that themodal damping is around 5%.In the model described in Fig. 2, the beam-beam offset at
the interaction point y, in the thin lens approximation, is
y ¼ C0ðxþ0 − x−0 Þ þ C1ðxþ1 − x−1 Þ;
where C0 is the transport matrix element from QD0 to theIP, C0 ¼ KðQD0Þ � LengthðQD0Þ � DLðQD0 − IPÞ andwhere C1 is the transport matrix element from QF1 toQD0 times that from QD0 to the IP,
C1 ¼ C0 � KðQF1Þ � LengthðQF1Þ � DLðQF1 − QD0Þ:
Here K(QF1) and K(QD0) are the beam-momentumnormalized curvatures in 1=m2 from the optics decks.Using the notation described above, y can be expressed as
y ¼ Rx;
FIG. 2. Lumped mass model of the ILC final focus with the SiD configuration.
BUDGETING AND CONTROL OF THE … Phys. Rev. ST Accel. Beams 17, 062801 (2014)
062801-3

where R ¼ ½C1 − C1C0 − C00000�, C0 ¼ 1.27, and C1 ¼−0.466 [18].
III. SEISMIC RESPONSE
From (1), we can calculate the matrix of power spectraldensities as
SxðωÞ ¼ HSwðωÞH�;
where � represents the conjugate transposed operator and ωis the angular frequency. The power spectral density of thebeam-beam offset is given by [19]
SyðωÞ ¼ ðRHÞSwðωÞðRHÞ�:
The matrix of excitations SwðωÞ is given by
SwðωÞ ¼
0BB@
Φwþ1
Φwþ1wþ0
Φwþ1w−0
Φwþ1w−1
… Φwþ0
Φwþ0w−0
Φwþ0w−1
… … Φw−0
Φw−0w−1
SYM … … Φw−1
1CCA;
where Φ is the power spectral density (PSD) of the quantityin subscript [if two quantities appear in the subscript, itrepresents the cross PSD (CPSD) between the two quan-tities]. From Φ, the integrated (downwards) root meansquare (rms) value, noted σðωÞ, is defined as
σðωÞ ¼
ffiffiffiffiffiffiffiffiffiffiffiffiffiffiffiffiffiffiffiffiffiffiffiZþ∞
ω
ΦðωÞdω
vuuut .
100
101
102
−1
−0.5
0
0.5
1
Frequency (Hz)
Re(
γ )
(−
)
Re[γw
0
+ w
1
+]
Re[γw
0
+ w
0
−]
Re[γw
0
+ w
1
−];
Re[γw
1
+ w
1
−]
FIG. 4. Real part of the correlation between the ground motionsat the support locations.
100
101
102
10−4
10−2
100
102
Frequency (Hz)
Tra
nsm
issi
bilit
y (−
)
x−1/w−
1
x+1/w+
1
x−0/w−
0
x+0/w+
0
FIG. 3. Transfer functions between the ground and thequadrupoles.
TABLE I. Numerical values of the parameters.
Variable Value Units
m1 1; 00Eþ 03 (Kg)m0 1; 00Eþ 03 (Kg)ms 8; 00Eþ 06 (Kg)mp 3; 49Eþ 06 (Kg)Is 1; 34Eþ 08 (Kgm2)Ip 1; 21Eþ 08 (Kgm2)kq 1; 00Eþ 09 (N=m)kg 1; 00Eþ 11 (N=m)kp 3; 48Eþ 10 (N=m)ks 3; 16Eþ 10 (N=m)cq 1; 41Eþ 05 (Ns=m)cg 5Eþ 06 (Ns=m)cp 1; 15Eþ 07 (Ns=m)cs 6; 28Eþ 04 (Ns=m)L0 10 (m)L1 6 (m)L 5 (m)
100
101
102
−1
−0.5
0
0.5
1
Frequency (Hz)
Im
( γ
) (−
)
Im[γw
0
+ w
1
+]
Im[γw
0
+ w
0
−]
Im[γw
0
+ w
1
−]
Im[γw
1
+ w
1
−]
FIG. 5. Imaginary part of the correlation between the groundmotions at the support locations.
TSHILUMBA et al. Phys. Rev. ST Accel. Beams 17, 062801 (2014)
062801-4

The ground motion spectra which have been used for thesimulations were measured at the SLAC Large Detector(SLD) hall. As the system is symmetrical, we will assumeΦwþ
1¼ Φw−
1; Φwþ
0¼ Φw−
0; Φwþ
1wþ0¼ Φw−
0w−1; Φwþ
1w−0¼
Φwþ0w−1; Φwþ
1w−0¼ Φwþ
1w−1; Φwþ
1w−0¼ Φwþ
1wþ0. The real and
imaginary parts of the normalized spectral densities areshown in Figs. 4 and 5 [20].It has been found that the new measurements correlate
well with previous campaigns (see [21] and the referencestherein). Figure 6 shows the power spectral densities of thequadrupoles displacements (Φxþ
0, Φxþ
1) and the beam-beam
offset (Φdy). Figure 7 shows the corresponding integratedrms values.
IV. PARAMETER VARIATION
In addition to any fast intratrain feedback, all linearcolliders incorporate a “slow” feedback system to controlvibration or drift at lower frequencies. The machinebunch train repetition frequency, 5 Hz for the ILC, sets
the scale at which the slow feedback system can correctpotentially larger drifts. For the ILC, in order to keep theluminosity loss to less than 4%, the jitter between thebunch trains, σy, should not exceed 200 nm [4]. For thisreason, we will study the effect of two importantparameters (the ground stiffness and the technical noise)on σy at 5 Hz.
A. Effect of the ground stiffness
The ground stiffness kg is a parameter of significantimportance. The lower the ground stiffness value is, themore relevant the role of the QF1 doublet is in the beam-beam jitter at the interaction point.When the kg parmeter value is low (e.g. kg ¼ 3e8N=m),
the first peaks of resonance of the QD0 transmissibility areshifted to the left, which leads to substantial isolation at5 Hz. In that scenario, the limiting factor for the luminosityquality is the stability of the QF1 doublet. Alternativelywhen the ground stiffness is high (e.g. kg ¼ 1e11N=m), theresonance frequency of QD0 is larger, which compromises
100
101
102
10−12
10−10
10−8
10−6
Rm
s di
spla
cem
ent (
m)
Frequency (Hz)
σx
0
+
σdy
σw
0
+
σx
1
+
FIG. 8. Integrated rms for kg ¼ 3e8N=m.
100
101
102
10−12
10−10
10−8
10−6
Rm
s di
spla
cem
ent (
m)
Frequency (Hz)
σx
0
+
σdy
σw
0
+
σx
1
+
FIG. 9. Integrated rms for kg ¼ 1e11N=m.
100
101
102
10−12
10−10
10−8
10−6
Rm
s m
otio
n (m
)
Frequency (Hz)
σx
0
+
σdy
σw
0
+
σx
1
+
FIG. 7. Integrated rms without technical noise.
100
101
102
10−25
10−20
10−15
Frequency (Hz)
PS
D m
otio
n (m
2 /H
z)
Φx
0
+
Φdy
Φw
1
+
Φx
1
+
FIG. 6. Power spectral densities of the seismic response,without technical noise.
BUDGETING AND CONTROL OF THE … Phys. Rev. ST Accel. Beams 17, 062801 (2014)
062801-5

the isolation. In that scenario, the beam-beam jitter ismainly determined by the QD0 doublet stability. Figures 8and 9 show a comparison of both scenarios.
B. Effect of the technical noise
The technical noise includes various types of incoherentenvironmental disturbances (electronics, ventilation, cool-ing, etc.). In this study, it is represented by random forces.Even though cross-correlation may exist between theseforces, we prefer to adopt a conservative approach andneglect all cross-correlations. Two models have beenconsidered.In the first one, used to model the disturbances applied
on the detector mass ms (Fþ and F− in Fig. 2), the PSD ofthe force is decreasing at low frequency as
ΦFþ ¼ ΦF− ¼ N0f2
1þ ð ff0Þ4;
where f is the frequency and N0 and f0 are parameters. N0
is the amplitude of the noise and f0 is the corner frequency[18]. It is assumed that Fþ and F− are not correlated, i.e.that their cross PSD is equal to zero. We take N0 ¼10−2ðN2=Hz3Þ and f0 ¼ 21ðHzÞ. Using these values,the rms value integrated over the whole frequency rangeis σFþ ¼ σF− ¼ 10ðNÞ, which is a reasonable assumption,based on our personal experience and previous measure-ment campaigns [19,20].The second model is used to model the disturbances
applied directly on the quadrupoles. The PSD of the typicalwhite noise describing vibrations coming from watercooling, ventilation, and acoustic noise is given by
ΦF2¼ N02
1þ ð ff02Þ2 ;
where f is the frequency, N02 ¼ 0.75ðN2
HzÞ, andf02 ¼ 35ðHzÞ. N02 is the amplitude, and f02 is the phase.Both models are shown in Fig. 10.In order to evaluate the acceptable level of technical
noise, we have calculated the beam-beam offset for variousamplitudes of the disturbing force, ranging from N02 ¼0.75ðN2
HzÞ to N02 ¼ 2.5ðN2
HzÞ (i.e. a variation of the rms valuefrom σF2;min ¼ 0.02N to σF2;max ¼ 11N). The same com-ment holds for the choice of the value of N02 and f02 as forthe choice of N0 and f0.Figure 11 shows a quadratic evolution of σy at 5 Hz as a
function of the amplitude of the technical noise σF2 appliedon the QD0 doublet, which is cooled by superfluid heliumII. The maximum expected amplitude range for helium II is∼10 N rms and the corresponding σy is 50 nm, well belowthe 200 nm capture range of the IP feedback system.
V. DOUBLETS VIBRATION ISOLATION
A. Passive isolation
In order to investigate the effect of the isolation of theQF1s on σx1 and σy, we consider a small value of F2, i.e.σF2;min ¼ 0.02N. Then, we decrease resonance frequencyfQF1 of the QF1 by decreasing the stiffness below QF1. AsfQF1 decreases, the passive isolation of the QF1 increases,and at some point both the QD0 and the QF1 contribute toσy by the same amount.The results of the simulations for which fQF1 ¼ 2 Hz,
fQF1 ¼ 7 Hz, and fQF1 ¼ 150 Hz are shown in Figs. 12,13, and 14, respectively.Figure 15 shows the evolution of the rms value of the
beam-beam offset integrated down to 5 Hz, σy;5Hz, as afunction of the resonance frequency of QF1 on its supportstiffness.
100
101
102
10−4
10−2
100
102
104
Frequency (Hz)
PS
D te
chni
cal n
oise
(N
2 /H
z)
ΦF
ΦF2
FIG. 10. Power spectral densities of the two technical noiseassumptions.ΦF is the technical noise applied on the detector andΦF2 is the technical noise applied on QD0.
0 2 4 6 8 10 122
2.5
3
3.5
4
4.5
5
5.5x 10
−8
Rms noise on QD0 (N)
Rm
s B
eam
−be
am o
ffset
at I
P (
m)
FIG. 11. Evolution of the beam-beam offset at the interactionpoint σy at 5 Hz as a function of the amplitude of the technicalnoise on QD0.
TSHILUMBA et al. Phys. Rev. ST Accel. Beams 17, 062801 (2014)
062801-6

For high values of fQF1 (i.e fQF1 ≥ 20 Hz), the stiffnessk0q is so significant that the response σx1 follows exactly theexcitation σw1 at low frequency. In that case σx1 is one orderof magnitude smaller than σx0 at 5 Hz. Therefore the beam-beam offset at 5 Hz is essentially independent of fQF1 (thecurve in Fig. 15 is flat above 20 Hz).For low values of fQF1 (i.e fQF1 ≤ 3 Hz), the stiffness k0q
is so low that some isolation with regard to σw1 is alreadyintroduced to the response σx1 of the QF1 at 5 Hz. As aresult σx1 is at least 2 orders of magnitude smaller than σx0at 5 Hz. Consequently the beam-beam offset at 5 Hz isindependent of fQF1 (the curve in Fig. 15 is flatbelow 3 Hz).For intermediate values of fQF1 (i.e. 3 Hz ≤ fQF1 ≤
20 Hz), σx1 and σx0 have the same order of magnitudeat 5 Hz. In that case the beam-beam offset at 5 Hz issensitive to the isolation of the QF1.
B. Active isolation
In this section, we study the capability of an activeisolation of the quadrupoles on the beam-beam offset. The
strategy chosen for the active isolation is based on inertialfeedback, where the absolute displacement of each quadru-pole is measured with an inertial sensor, filtered by acontroller, and fed back in individual actuators located inparallel with each spring of stiffness kq. All inertial sensorsare assumed identical: they are made up of one d.o.f.oscillator, with a typical resonance of 2 Hz, and thepercentage of damping is 0.3 [22]. These values are typicalof commercial geophones. In order to achieve the bestcompromise between isolation from ground vibrations androbustness to external disturbances (the technical noise), westart with an intermediate configuration where the reso-nance frequencies of the quadrupoles have been decreasedat 15 Hz. For this, the stiffness value of the link betweenQF1 and the ground has been modified to kq ¼ 1e7N=m.This configuration corresponds typically to a big massplaced on a rubber layer in series with a piezoelectricactuator [23]. Figure 16 shows the transfer functionsbetween the ground and the quadrupoles when the feedbackcontrol is turned off and on. The same controller is appliedto the four feedback loops: a lag at low frequency and a leadat high frequency. This controller is written
FIG. 13. Transfer functions and integrated rms values of thequadrupoles response for fQF1 ¼ 7Hz with σF2 ¼ 0.02N.
FIG. 12. Transfer functions and integrated rms values of thequadrupoles response for fQF1 ¼ 2Hz with σF2 ¼ 0.02N.
BUDGETING AND CONTROL OF THE … Phys. Rev. ST Accel. Beams 17, 062801 (2014)
062801-7
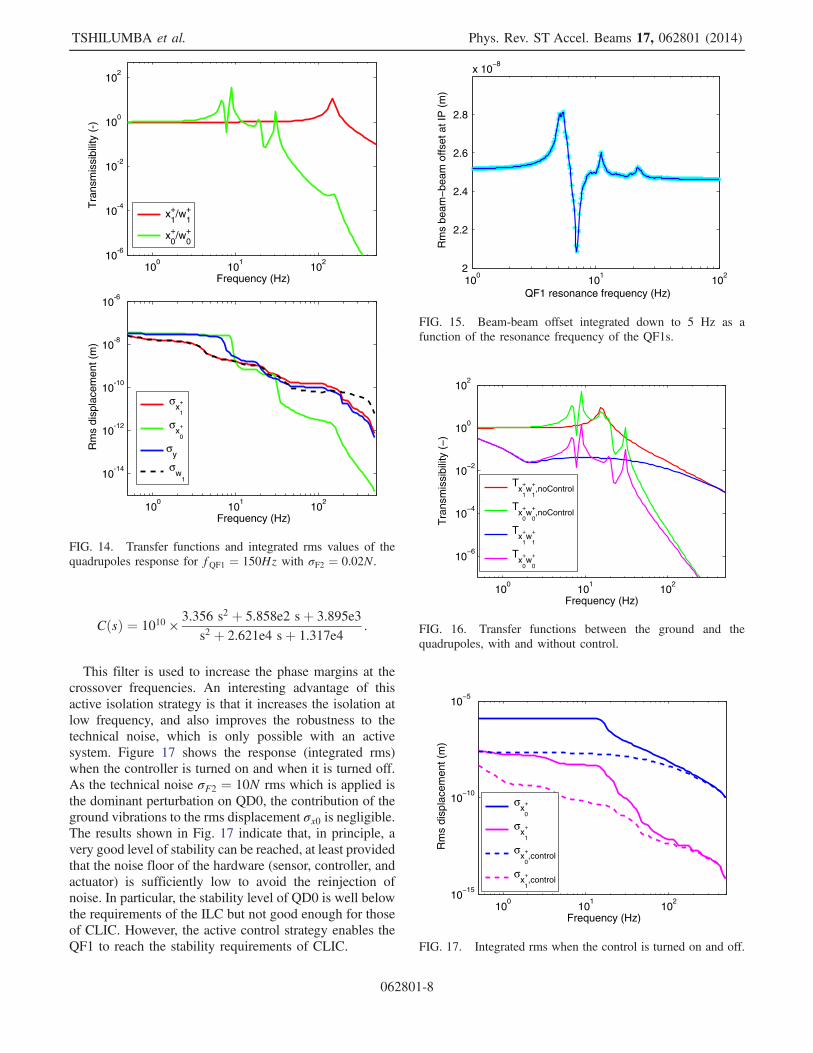
CðsÞ ¼ 1010 ×3.356 s2 þ 5.858e2 sþ 3.895e3
s2 þ 2.621e4 sþ 1.317e4:
This filter is used to increase the phase margins at thecrossover frequencies. An interesting advantage of thisactive isolation strategy is that it increases the isolation atlow frequency, and also improves the robustness to thetechnical noise, which is only possible with an activesystem. Figure 17 shows the response (integrated rms)when the controller is turned on and when it is turned off.As the technical noise σF2 ¼ 10N rms which is applied isthe dominant perturbation on QD0, the contribution of theground vibrations to the rms displacement σx0 is negligible.The results shown in Fig. 17 indicate that, in principle, avery good level of stability can be reached, at least providedthat the noise floor of the hardware (sensor, controller, andactuator) is sufficiently low to avoid the reinjection ofnoise. In particular, the stability level of QD0 is well belowthe requirements of the ILC but not good enough for thoseof CLIC. However, the active control strategy enables theQF1 to reach the stability requirements of CLIC.
100
101
102
10−6
10−4
10−2
100
102
Frequency (Hz)
Tra
nsm
issi
bilit
y (−
)
Tx
+
1w
+
1,noControl
Tx
+
0w
+
0,noControl
Tx
+
1w
+
1
Tx
+
0w
+
0
FIG. 16. Transfer functions between the ground and thequadrupoles, with and without control.
100
101
102
10−15
10−10
10−5
Rm
s di
spla
cem
ent (
m)
Frequency (Hz)
σx
0
+
σx
1
+
σx
0
+,control
σx
1
+,control
FIG. 17. Integrated rms when the control is turned on and off.
FIG. 14. Transfer functions and integrated rms values of thequadrupoles response for fQF1 ¼ 150Hz with σF2 ¼ 0.02N.
100
101
102
2
2.2
2.4
2.6
2.8
x 10−8
QF1 resonance frequency (Hz)
Rm
s be
am−
beam
offs
et a
t IP
(m
)
FIG. 15. Beam-beam offset integrated down to 5 Hz as afunction of the resonance frequency of the QF1s.
TSHILUMBA et al. Phys. Rev. ST Accel. Beams 17, 062801 (2014)
062801-8
VI. CONCLUSION
We developed a simplified vibration model of the SiDdetector, where the QD0 doublet is captured inside thedetector and the QF1 magnet is inside the machine tunnel.Ground motion spectra measured at the SLD detector hallat SLAC have been used together with a conservativespectrum of the technical noise on the detector. Theobjective is to identify the important parameters, and makean assessment of their impact on the beam jitter at the IP,especially in the presence of technical noise. It has beenfound that the stiffness of the ground, the level of technicalnoise, and the dynamics of the QF1s play a significant role.Using the chosen set of parameters, the model predicts thatthe maximum level of rms vibration seen by QD0 is wellbelow the target value for 4% luminosity loss of the IPfeedback system available in the ILC. However this level ofvibration is still too high for CLIC. With the addition of anactive stabilization system, it has been shown that it ispossible for QF1 to reach the stability requirements ofCLIC. These preliminary conclusions need to be confirmedby a more realistic finite element model of the SiD,including more complex geometries, inertia, and flexibil-ities. The models of the technical noise need also to becorrelated with experimental measurements, which areplanned in the near future.
ACKNOWLEDGMENTS
This research has been funded by the Brussels capitalregion under the program “Brains back to Brussels.” Theauthors also gratefully acknowledge Paul Marty for his helpwith the numerical simulations. The comments of thereviewers have significantly contributed to improve thequality of the manuscript.
[1] A. Seryi, M. Breidenbach, and J. Frisch, in Proceedings ofthe 20th International Linac Conference, LINAC-2000,Monterey, CA (SLAC, Menlo Park, CA, 2000).
[2] A. Seryi, Nucl. Instrum. Methods Phys. Res., Sect. A 623,23 (2010).
[3] The ILC TDR, Vol. 4 (Detectors), Sec. 7.4.5, 2013 [http://www.linearcollider.org/ILC/Publications/Technical‑Design‑Report].
[4] P. N. Burrows, D. R. Bett, N. Blaskovic Kraljevic, G. B.Christian, M. R. Davis, Y. I. Kim, C. Perry, R. J. Apsimon,B. Constance, and A. Gerbershagen, Proceedings of the4th International Particle Accelerator Conference,IPAC-2013, Shanghai, China, 2013 (JACoW, Shanghai,China, 2013).
[5] CLIC Conceptual Design Report, CERN-2012-007,Geneva, Switzerland, 2012.
[6] J. P. Delahaye, in Proceedings of the International ParticleAccelerator Conference, Kyoto, Japan (ICR, Kyoto,2010).
[7] F. Simon, Phys. Procedia 37, 63 (2012).[8] C. Collette, D. Tshilumba, L. Fueyo-Rosa, and I.
Romanescu, Rev. Sci. Instrum. 84, 023302 (2013).[9] C. Collette, S. Janssens, and D. Tshilumba, Nucl. Instrum.
Methods Phys. Res., Sect. A 684, 7 (2012).[10] R. Le Breton, G. Deleglise, J. Allibe, A. Badel, G. Balik, B.
Caron, and A. Jeremie, Sens. Actuators A 204, 97(2013).
[11] F. Lackner, K. Artoos, C. Collette, H. Mainaud Durand, C.Hauviller, J. Kemppinen, and R. Leuxe, Proceedings of the6th International Workshop on Mechanical EngineeringDesign of Synchrotron Radiation Equipment and Instru-mentation (MEDSI00), Oxford, United Kingdom, 2010(Cambridge University Press, Cambridge, England, 2011).
[12] A. Gaddi, H. Gerwig, N. Siegrist, and F. Ramos, TechnicalReport EDMS n1098581, 2010.
[13] H. Aihara et al., arXiv:0911.0006.[14] B. Parker, A. Mikhailichenko, K. Buesser, J. Hauptman, T.
Tauchi, P. Burrows, T. Markiewicz, M. Oriunno, and A.Seryi, Technical Report EuCARD-CON-2009-026,2009.
[15] J. Frisch, A. Chang, V. Decker, E. Doyle, L. Eriksson, L.Hendrickson, T. Himel, T. Markiewicz, R. Partidge, and A.Seryi, Proceedings of the 22nd International LinearCollider Conference, LINAC-2004, Lübeck, Germany,2004 [http://accelconf.web.cern.ch/accelconf/l04/PAPERS/THP35.PDF].
[16] K. Bertsche, J. W. Amann, T. W. Markiewicz, M. Oriunno,A. Weidemann, and G. White, Proceedings of the 3rdInternational Particle Accelerator Conference, IPAC-2012, New Orleans, LA (IEEE, Piscataway, NJ, 2012),TUPPR047; , Report No. SLAC-PUB-15027, 2012.
[17] T. Behnke, J. Brau, P. Burrows, J. Fuster, M. Peskin, M.Stanitzki, Y. Sugimoto, S. Yamada, and H. Yamamoto,International Linear Collider Technical Design Report,Vol. 4, No. ILC-REPORT-040, 2013.
[18] Glen White, SLAC (private communication).[19] C. Collette, K. Artoos, M. Guinchard, and C. Hauviller,
Phys. Rev. ST Accel. Beams 13, 072801 (2010).[20] K. Bertsche and A. Weidemann, “Geophone Measure-
ments on SLD,” SiD MDI Meeting, 2010.[21] A. Sery, and O. Napoly, Phys. Rev. E 53, 5323 (1996).[22] C. Collette, P. Fernandez-Carmona, S. Janssens, K. Artoos,
M. Guinchard, C. Hauviller, and A. Preumont, BSSA,102,1289 (2012).
[23] C. Collette, S. Janssens, K. Artoos, Recent Patents onMechanical Engineering 4, 212 (2011) [http://www.ingentaconnect.com/content/ben/meng/2011/00000004/00000003/art00002;jsessionid=deoslq9h0bmm8.alice.
BUDGETING AND CONTROL OF THE … Phys. Rev. ST Accel. Beams 17, 062801 (2014)
062801-9