Embed Size (px)
Citation preview

Contacts in Lima: Contacts in NY: Carlos Galvez, Chief Financial Officer Barbara Cano (511) 419 2540 (646) 452 2334
[email protected] Daniel Dominguez, Manager of Financial Planning and Investor Relations (511) 419 2591 / [email protected] Rodrigo Echecopar, Investor Relations Coordinator (511) 419 2609 / [email protected] Company Website: www.buenaventura.pe/ir
Buenaventura Announces Fourth Quarter and
Twelve Month 2016 Results
Lima, Peru, February 28, 2017 – Compañia de Minas Buenaventura S.A.A. (“Buenaventura” or “the Company”) (NYSE: BVN; Lima Stock Exchange: BUE.LM), Peru’s largest publicly-traded
precious metals mining company, today announced results for the fourth quarter (4Q16) and
twelve-month (FY16) periods ended December 31, 2016. All figures have been prepared in accordance with IFRS (International Financial Reporting Standards) on a non-GAAP basis and are
stated in U.S. dollars (US$).
Fourth Quarter 2016 Highlights:
In 4Q16, EBITDA from direct operations was US$80.4 million compared to US$19.6 million
reported in 4Q15. Adjusted EBITDA (including associated companies) increased 126% (US$ 176.8 million) in 4Q16, compared to the US$ 78.4 million in 4Q15.
All in Sustaining Cost (AISC*) decreased 11% in 4Q16 (US$ 846/oz), compared to 4Q15 (US$
953/oz).
Full year 2016 attributable production was 627k gold ounces and 24.7 million silver ounces,
compared to 745k gold ounces and 22.1 million silver ounces in 2015. Positive results in explorations, especially in the Orcopampa Mine (See appendix 4).
Net income in 4Q16 was negative US$ 405.9 million mainly due to a US$422.5 million non-
cash adjustments from Yanacocha (attributable to Buenaventura).
Tambomayo produced its first doré bar in December 2016. Full plant capacity is expected by
2Q17. Buenaventura´s Net debt/EBITDA ratio has been reduced to 1.74x, in line with guidance.
Important improvement at El Brocal. Good operating results.
In line with Buenaventura´s dividend policy, a dividend payment of US$ 0.057 per share/ADS
will be declared.
Financial Highlights (in millions of US$, except EPS figures):
4Q16 4Q15 Var% FY16 FY15 Var%
Total Revenues 287.1 235.1 22% 1,068.8 929.5 15%
Operating Profit 24.8 -43.5 N.A. 132.2 -136.9 N.A.
EBITDA Direct Operations
80.4 19.6 309% 333.3 99.8 234%
Adjusted EBITDA (Inc Associates)
176.8 78.4 126% 645.2 371.6 74%
Net Income -405.9 -292.6 39% -323.5 -317.2 2%
EPS** -1.60 -1.15 39% -1.27 -1.25 2%
(*) See Appendix 5 (**) as of December 31, 2016 Buenaventura had a weighted average number of shares outstanding of 254,186,867.
Compañía de Minas Buenaventura S.A.A.
Fourth Quarter and Twelve-Month 2016 Results Page 2 of 26
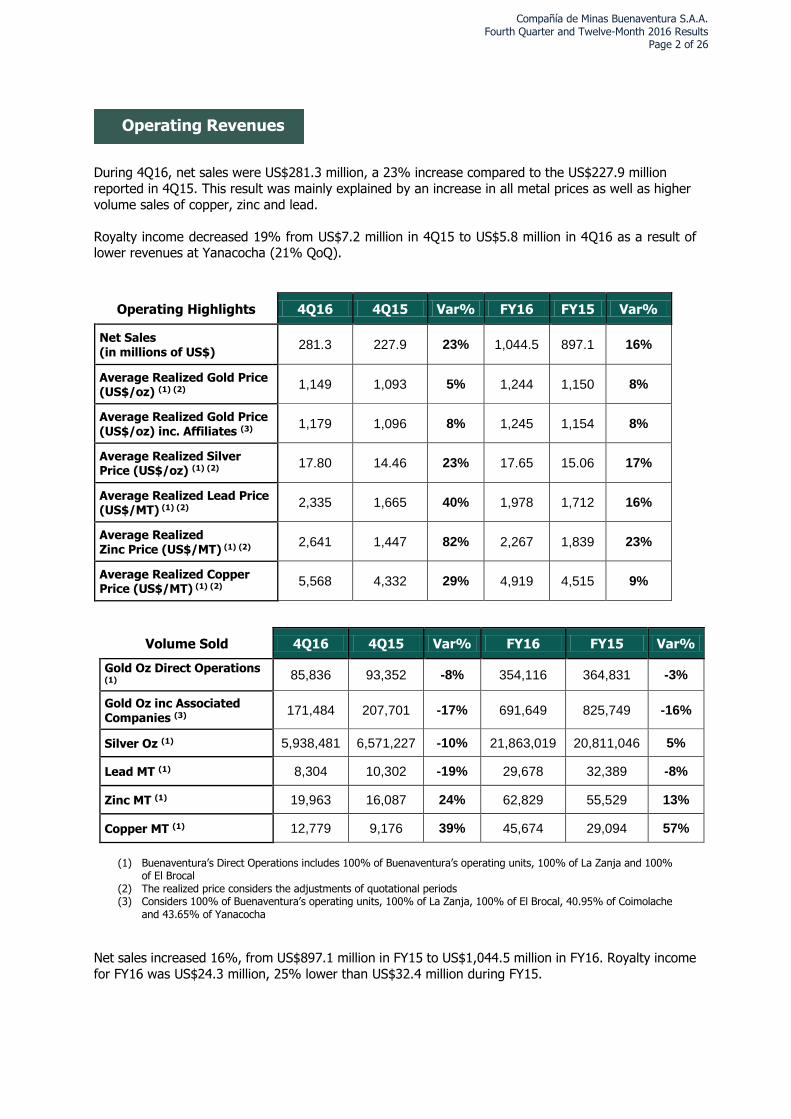
During 4Q16, net sales were US$281.3 million, a 23% increase compared to the US$227.9 million
reported in 4Q15. This result was mainly explained by an increase in all metal prices as well as higher
volume sales of copper, zinc and lead.
Royalty income decreased 19% from US$7.2 million in 4Q15 to US$5.8 million in 4Q16 as a result of lower revenues at Yanacocha (21% QoQ).
Operating Highlights 4Q16 4Q15 Var% FY16 FY15 Var%
Net Sales (in millions of US$)
281.3 227.9 23% 1,044.5 897.1 16%
Average Realized Gold Price (US$/oz) (1) (2)
1,149 1,093 5% 1,244 1,150 8%
Average Realized Gold Price (US$/oz) inc. Affiliates (3)
1,179 1,096 8% 1,245 1,154 8%
Average Realized Silver Price (US$/oz) (1) (2)
17.80 14.46 23% 17.65 15.06 17%
Average Realized Lead Price (US$/MT) (1) (2)
2,335 1,665 40% 1,978 1,712 16%
Average Realized Zinc Price (US$/MT) (1) (2)
2,641 1,447 82% 2,267 1,839 23%
Average Realized Copper Price (US$/MT) (1) (2)
5,568 4,332 29% 4,919 4,515 9%
Volume Sold 4Q16 4Q15 Var% FY16 FY15 Var%
Gold Oz Direct Operations (1)
85,836 93,352 -8% 354,116 364,831 -3%
Gold Oz inc Associated
Companies (3) 171,484 207,701 -17% 691,649 825,749 -16%
Silver Oz (1) 5,938,481 6,571,227 -10% 21,863,019 20,811,046 5%
Lead MT (1) 8,304 10,302 -19% 29,678 32,389 -8%
Zinc MT (1) 19,963 16,087 24% 62,829 55,529 13%
Copper MT (1) 12,779 9,176 39% 45,674 29,094 57%
(1) Buenaventura’s Direct Operations includes 100% of Buenaventura’s operating units, 100% of La Zanja and 100%
of El Brocal (2) The realized price considers the adjustments of quotational periods (3) Considers 100% of Buenaventura’s operating units, 100% of La Zanja, 100% of El Brocal, 40.95% of Coimolache
and 43.65% of Yanacocha
Net sales increased 16%, from US$897.1 million in FY15 to US$1,044.5 million in FY16. Royalty income
for FY16 was US$24.3 million, 25% lower than US$32.4 million during FY15.
Operating Revenues

Compañía de Minas Buenaventura S.A.A.
Fourth Quarter and Twelve-Month 2016 Results Page 3 of 26
In 4Q16, Buenaventura’s gold equity production from direct operations was 68,268, 4% lower
compared to the figure reported in 4Q15 (70,910 gold ounces). Gold production including associated
companies in 4Q16 was 159,212 ounces, 13% lower than the amount reported in the same period 2015. This decline is explained by a decrease in production from Yanacocha. Zinc and Copper equity
production were higher during 4Q16 compared to 4Q15 mainly as a result of higher production coming from El Brocal.
Buenaventura´s gold equity production from direct operations in FY16 was in line compared to the figure reported in FY15. Silver equity production from direct operations in FY16 was 11% higher
compared to FY15, this was mainly due to higher production coming from the Uchuchacua (16% YoY) and Mallay (27% YoY) mines. Buenaventura´s Zinc equity production increased 18% in FY16
compared to FY15. This increment is explained by higher production from the Uchuchacua mine
(27% YoY), Mallay mine (14% YoY) and El Brocal (8% YoY). Buenaventura´s copper production increased 65% in FY15 compared to FY15 due to higher production from El Brocal (53% YoY).
(1) Buenaventura’s Direct Operations includes 100% of Buenaventura’s operating units, 53.06% of La Zanja and 61.32% of El Brocal
(2) Considers 100% of Buenaventura’s operating units, 100% of La Zanja and 100% of El Brocal
Equity Production 4Q16 4Q15 Var% FY16 FY15 Var%
Gold Oz Direct Operations(1) 68,268 70,910 -4% 281,086 286,178 -2%
Gold Oz including Associated Companies
159,212 182,247 -13% 627,434 744,800 -16%
Silver Oz Direct Operations(1) 6,109,374 6,201,646 -1% 23,448,833 21,194,300 11%
Silver Oz including Associated Companies
6,382,558 6,506,921 -2% 24,672,571 22,131,806 11%
Lead MT 7,396 8,779 -16% 28,531 28,412 0%
Zinc MT 15,646 12,642 24% 51,465 43,694 18%
Copper MT Direct Operations(1) 8,218 5,034 63% 29,195 17,674 65%
Copper MT including Associated Companies
34,222 23,757 44% 127,584 66,032 93%
Consolidated Production 4Q16 4Q15 Var% FY16 FY15 Var%
Gold Oz(2) 86,803 90,490 -4% 356,367 357,570 0%
Silver Oz(2) 6,624,276 6,786,872 -2% 24,648,761 23,035,110 7%
Lead MT(2) 9,174 11,924 -23% 33,850 37,135 -9%
Zinc MT(2) 23,896 19,975 20% 75,075 68,240 10%
Copper MT(2) 13,929 9,244 51% 49,460 32,400 53%
Production and Operating Costs

Compañía de Minas Buenaventura S.A.A.
Fourth Quarter and Twelve-Month 2016 Results Page 4 of 26
Orcopampa (100% owned by Buenaventura)
Production
4Q16 4Q15 Var% FY16 FY15 Var%
Gold Oz 45,973 48,606 -5% 191,102 204,629 -7%
Silver Oz 199,509 170,254 17% 692,318 562,795 23%
Cost Applicable to Sales
4Q16 4Q15 Var% FY16 FY15 Var%
Gold US$/Oz 772 682 13% 704 678 4%
Gold production at Orcopampa decreased 5% in 4Q16 (compared to 4Q15) mainly due to lower ore
treated and lower ore grade (see Appendix 2). Cost Applicable to Sales (CAS) in 4Q16 (772 US$/Oz) increased 13% compared to 4Q15 (682 US$/Oz), mainly due to lower volume sold (12% QoQ) and
higher exploration efforts from the Pucara, Pucarina and Lucia areas.
Gold production guidance for 2017 is 180k – 190k ounces.
Uchucchacua (100% owned by Buenaventura)
Production
4Q16 4Q15 Var% FY16 FY15 Var%
Silver Oz 4,042,722 4,118,509 -2% 16,212,746 13,919,922 16%
Zinc MT 1,662 1,602 4% 7,227 5,692 27%
Lead MT 2,855 2,565 11% 10,724 8,433 27%
Cost Applicable to Sales
4Q16 4Q15 Var% FY16 FY15 Var%
Silver US$/Oz 11.53 12.82 -10% 11.03 13.93 -21%
Silver production in 4Q16 was in line with the figure reported in 4Q15. In FY16, silver production increased 16% compared to FY15, mainly due to more ore treated (16% YoY) (see Appendix 2).
Cost Applicable to Sales (CAS) in 4Q16 decreased 10% compared to 4Q15, an improvement primarily explained by i) increasing efficiencies as a result of massive mining using the bench & fill
method and ii) lower commercial deductions.
Silver production guidance for 2017 is 16.0 million – 17.0 million ounces.
Mallay (100% owned by Buenaventura)
Production
4Q16 4Q15 Var% FY16 FY15 Var%
Silver Oz 374,756 357,236 5% 1,627,246 1,285,361 27%
Zinc MT 2,326 2,407 -3% 10,463 9,173 14%
Lead MT 1,476 1,841 -20% 7,383 7,193 3%
Cost Applicable to Sales
4Q16 4Q15 Var% FY16 FY15 Var%
Silver US$/Oz 13.48 13.77 -2% 12.78 13.90 -8%
Silver production in 4Q16 increased 5% compared to 4Q15, mainly due to more ore treated). In FY16, silver production increased 16% compared to FY15, explained by more ore treated (29%
YoY) (see Appendix 2).

Compañía de Minas Buenaventura S.A.A.
Fourth Quarter and Twelve-Month 2016 Results Page 5 of 26
Cost Applicable to Sales (CAS) in 4Q16 was in line with the figure reported in 4Q15.
Silver production guidance for 2017 is 1.5 million – 1.7 million ounces.
Julcani (100% owned by Buenaventura)
Production
4Q16 4Q15 Var% FY16 FY15 Var%
Silver Oz 790,618 868,662 -9% 3,264,420 3,266,453 0%
Cost Applicable to Sales
4Q16 4Q15 Var% FY16 FY15 Var%
Silver US$/Oz 12.50 11.32 10% 11.62 12.30 -6%
Silver production in 4Q16 was 9% lower compared to 4Q15, mainly due to lower ore grades. FY16
production was 3,264,420 in line with FY15. Cost Applicable to Sales (CAS) in 4Q16 was 10% higher than 4Q15, primarily explained by lower volume sold.
Silver production guidance for 2017 is 3.0 million – 3.4 million ounces.
La Zanja (53.06% owned by Buenaventura)
Production
4Q16 4Q15 Var % FY16 FY15 Var %
Gold Oz 32,739 37,709 -13% 139,724 141,071 -1%
Silver Oz 58,279 89,111 -35% 217,292 331,080 -34%
Cost Applicable to Sales
4Q16 4Q15 Var % FY16 FY15 Var %
Gold US$/Oz 730 517 41% 607 753 -19%
Gold production in 4Q16 decreased 13% compared to 4Q15. CAS in 4Q16 increased 41% compared
to 3Q15, primarily due to i) less volume sold ii) more hauling expenses.
Gold production guidance for 2017 is 115k – 125k ounces.
Tantahuatay (40.10% owned by Buenaventura)
Production
4Q16 4Q15 Var % FY16 FY15 Var %
Gold Oz 39,926 47,697 -16% 150,816 144,782 4%
Silver Oz 123,786 281,440 -56% 711,337 879,832 -19%
Cost Applicable to Sales
4Q16 4Q15 Var % FY16 FY15 Var %
Gold US$/Oz 534 388 38% 492 489 1%
Gold production in 4Q16 decreased 16% compared to the figure reported in 4Q15. CAS in 4Q16 increased 38% compared to 4Q15 mainly due to lower volume sold and higher exploration
expenses.
Gold production guidance for 2017 is 145k – 155k ounces

Compañía de Minas Buenaventura S.A.A.
Fourth Quarter and Twelve-Month 2016 Results Page 6 of 26
El Brocal (61.32% owned by Buenaventura)
Production
4Q16 4Q15 Var % FY16 FY15 Var %
Copper MT 13,858 9,165 51% 49,170 32,061 53%
Zinc MT 19,908 15,966 25% 57,385 53,319 8%
Silver Oz 1,158,392 1,183,101 -2% 2,634,739 3,669,500 -28%
Cost Applicable to Sales
4Q16 4Q15 Var % FY16 FY15 Var %
Copper US$/Lb 1.97 2.47 -20% 2.11 2.41 -13%
Zinc US$/Lb 0.84 0.65 28% 0.82 0.73 13%
During 4Q16, copper production increased 51% compared to 4Q15 and 53% in FY16 compared to
FY15 due to a higher ore volume treated and ore grade. In 4Q16 zinc production increased 25% compared to 4Q15 and 8% in FY16 compared to FY15 as a result of higher ore treated and ore
grade.
In 4Q16, zinc Cost Applicable to sales (CAS) increased 28% compared to 4Q15 mainly due to lower silver by-product contribution and a higher stripping ratio (9.4 in 4Q16 compared to 4.5 in 4Q16).
Copper CAS in 4Q16 decreased 20% compared to 4Q15 mainly explained by more volume sold due
to better ore grades and better commercial terms.
Zinc production guidance for 2017 is 70k – 80k MT, while copper production guidance for 2017 is 55k – 65k MT.
General and administrative expenses in 4Q16 were US$23.6 million, 8% lower compared to the US$25.6 million in 4Q15 mainly due to lower insurance expenses (65% QoQ). For FY16, the expense
was US$81.7 million (US$84.4 million in FY15).
Exploration costs in non-operating areas during 4Q16 were US$11.8 million compared with US$5.0 million in 4Q15. During the period, Buenaventura’s main exploration efforts were focused on the
San Gabriel project (US$5.15 million), the Tambomayo project (US$2.30 million), and Marcapunta Norte (US$0.41 million). For FY16, the expense was US$26.6 million (US$30.6 million in FY15).
During 4Q16, Buenaventura’s share in associated companies was negative US$402.5 million, compared to negative US$235.0 million reported in 4Q15, composed by:
General and Administrative Expenses
Share in Associated Companies
Exploration in Non-Operating Areas

Compañía de Minas Buenaventura S.A.A.
Fourth Quarter and Twelve-Month 2016 Results Page 7 of 26
YANACOCHA
At Yanacocha (43.65% owned by Buenaventura), during 4Q16, gold production was 171,675
ounces, 19% lower than 4Q15 production (211,256 ounces). For FY16, gold production was 654,934 ounces, 29% lower than 917,690 ounces in FY15.
Gold production guidance at Yanacocha for 2017 is 530k – 560k ounces.
In 4Q16, Yanacocha reported a net loss of US$988.6 million, this includes a US$889.4 million non-cash impairment (US$ 388.2 million attributable to Buenaventura) and a US$ 78.5 million non-cash
reclamation provision (US$ 34.3 million attributable to Buenaventura), compared to a net loss of US$547.4 million reported in 4Q15.
CAS in 4Q16 was US$829/oz, 11% higher than the US$747/oz reported in 4Q15 mainly due to lower volume sold (158,227 gold ounces in 4Q16 vs 216,733 gold ounces in 4Q15).
Quecher Main (oxide deposit) is expected to extend the life of the Yanacocha operation to 2025
with an average annual production of approximately 200,000 gold ounces per year between 2020
and 2025. The estimated CAPEX of the project is $275 and $325 million. A project decision is expected in 2H17.
Studies are in process for Yanacocha sulfides. The project added 2 million ounces to resources.
Capital expenditures at Yanacocha were US$20.4 million in 4Q16, while for FY16 total capital
expenditures were US$83.1 million.
CERRO VERDE
At Cerro Verde (19.58% owned by Buenaventura), during 4Q16 copper production was 132,814 MT
(26,005 MT attributable to Buenaventura), a 39% increase compared to 4Q15 (95,619 MT and
18,722 MT attributable to Buenaventura). For FY16, copper production was 502,495 MT (98,388 MT attributable to Buenaventura).
During 4Q16, Cerro Verde reported a net income of US$114.9 million compared to net loss of
US$13.2 million in 4Q15. This increase was primarily due to: i) higher volumes sold and ii) higher
realized price (US$2.72/Lb in 4Q16 compared to US$2.07/Lb). For FY16, net income was US$340.9 million (compared to US$33.8 million in FY15).
Capital expenditures at Cerro Verde were US$72.2 million in 4Q16, while for FY16 was US$421.6
million.
Syndicated Loan (US$1.8B): US$400 million have been prepaid. It is expected to be fully paid by
2018, depending on copper prices.
Copper production guidance at Cerro Verde for 2017 is 500k MT – 550k MT.
Share in the Result of Associates (in millions of US$)
4Q16 4Q15 Var % FY16 FY15 Var %
Cerro Verde 22.5 -3.6 N.A. 66.8 6.5 924%
Coimolache 6.5 7.5 -14% 23.5 16.6 42%
Yanacocha -431.5 -238.9 81% -455.6 -196.5 132%
Total -402.5 -235.0 71% -365.3 -173.4 111%

Compañía de Minas Buenaventura S.A.A.
Fourth Quarter and Twelve-Month 2016 Results Page 8 of 26
COIMOLACHE (Tantahuatay operation)
At Coimolache (40.10% owned by Buenaventura), attributable contribution to net income in 4Q16
was US$6.5 million (US$7.5 million in 4Q15). For FY16, the contribution was US$23.5 million, compared to US$16.6 million reported in FY15.
The Tambomayo Project (100% ownership)
The first doré bar was produced in December 2016.
Working on Ramp-up, full capacity expected by 2Q17.
2017 Production Guidance of 120 – 150 Au Oz.
Total CAPEX: US$ 362 million.
The San Gabriel Project (100% ownership) Updating the economic model with 2016 exploration results.
Approval of the Environmental Impact Assessment (EIA) expected by 1H17.
Project decision for next stage is expected in 1H17.
During 2H17 basic and detailed engineering will be delivered.
During the February 28, 2017 Board meeting, the Directors passed the following resolution:
To call for the Annual Shareholders Meeting to be held on March 28, with the following items
to be proposed for approval:
a. Approval of the Annual Report as of December 31, 2016 b. Approval of the Financial Statements as of December 31, 2016
c. Appointment of Ernst and Young (Paredes, Zaldivar, Burga y Asociados) as External Auditors for fiscal year 2017.
d. Declaration of cash dividend of US$ 0.057 per share or ADS, payable on May 2, 2017.
e. Election of the new members of the board for the period 2017 – 2019. ***
Project Development and Exploration
Other

Compañía de Minas Buenaventura S.A.A.
Fourth Quarter and Twelve-Month 2016 Results Page 9 of 26
Company Description
Compañía de Minas Buenaventura S.A.A. is Peru’s largest, publicly traded, precious metals company
and a major holder of mining rights in Peru. The Company is engaged in the mining, processing, development and exploration of gold and silver and other metals via wholly owned mines as well
as through its participation in joint exploration projects.
Buenaventura currently operates several mines in Peru (Orcopampa*, Uchucchacua*, Mallay*,
Julcani*, El Brocal, La Zanja and Coimolache and is developing the Tambomayo project.
The Company owns 43.65% of Minera Yanacocha S.R.L (a partnership with Newmont Mining
Corporation), an important precious metal producer; 19.58% of Sociedad Minera Cerro Verde, an important Peruvian copper producer.
For a printed version of the Company’s 2015 Form 20-F, please contact the investor relations
contacts on page 1 of this report, or download the PDF format file from the Company’s web site at
www.buenaventura.com.
(*) Operations wholly owned by Buenaventura Note on Forward-Looking Statements
This press release may contain forward-looking information (as defined in the U.S. Private Securities Litigation Reform Act of 1995) that involve risks and uncertainties, including those concerning the Company’s, Yanacocha’s and Cerro Verde’s costs and expenses, results of exploration, the continued improving efficiency of operations, prevailing market prices of gold, silver, copper and other metals mined, the success of joint ventures, estimates of future explorations, development and production, subsidiaries’ plans for capital expenditures, estimates of reserves and Peruvian political, economic, social and legal developments. These forward-looking statements reflect the Company’s view with respect to the Company’s, Yanacocha’s and Cerro Verde’s future financial performance. Actual results could differ materially from those projected in the forward-looking statements as a result of a variety of factors discussed elsewhere in this Press Release.
**Tables to follow**
APPENDIX 1
Equity Participation in Subsidiaries and Associates (as of Decemberr 31, 2016)
BVN Operating
Equity % Mines / Business
El Molle Verde S.A.C* 100.00 Trapiche Project
Minera La Zanja S.A* 53.06 La Zanja
Sociedad Minera El Brocal S.A.A* 61.32 Colquijirca and Marcapunta
Compañía Minera Coimolache S.A ** 40.10 Tantahuatay
Minera Yanacocha S.R.L ** 43.65 Yanacocha
Sociedad Minera Cerro Verde S.A.A ** 19.58 Cerro Verde
Processadora Industrial Rio Seco S.A* 100.00 Rio Seco chemical plant
Consorcio Energético de Huancavelica S.A* 100.00 Energy – Huanza Hydroelectrical plant
Buenaventura Ingenieros S.A* 100.00 Engineering Consultant
(*)Consolidates (**) Equity Accounting

Compañía de Minas Buenaventura S.A.A.
Fourth Quarter and Twelve-Month 2016 Results Page 10 of 26
APPENDIX 2
4Q16 4Q15 % FY16 FY15 %
Mining Unit Operating Results
Orcopampa Ore Milled DMT 113,723 120,878 -6% 464,366 458,222 1%
Ore Grade OZ/MT 0.41 0.42 -3% 0.41 0.46 -12%
Recovery Rate % 97.3% 93.9% 4% 96.3% 95.3% 1%
Ounces Produced* 45,973 48,606 -5% 191,102 204,629 -7%
Mining Unit Operating Results
La Zanja Ounces Produced 32,739 37,709 -13% 139,724 141,071 -1%
Tantahuatay Ounces Produced 39,926 47,697 -16% 150,816 144,782 4%
4Q16 4Q15 % FY16 FY15 %
Mining Unit Operating Results
Uchucchacua Ore Milled DMT 324,291 318,219 2% 1,267,752 1,121,474 13%
Ore Grade OZ/MT 14.82 15.38 -4% 15.23 14.80 3%
Recovery Rate % 84.1% 84.2% 0% 83.9% 83.9% 0%
Ounces Produced 4,042,722 4,118,509 -2% 16,212,746 13,919,922 16%
Julcani Ore Milled DMT 42,440 45,024 -6% 173,865 177,948 -2%
Ore Grade OZ/MT 19.23 20.06 -4% 19.51 19.22 2%
Recovery Rate % 96.9% 96.2% 1% 96.3% 95.5% 1%
Ounces Produced 790,618 868,662 -9% 3,264,420 3,266,453 0%
Mallay Ore Milled DMT 51,613 42,812 21% 204,035 158,124 29%
Ore Grade OZ/MT 7.66 8.93 -14% 8.49 8.66 -2%
Recovery Rate % 94.7% 93.4% 1% 93.9% 93.8% 0%
Ounces Produced 374,756 357,236 5% 1,627,246 1,285,361 27%
Mining Unit Operating Results
Colquijirca Ounces Produced 897,695 1,030,199 -13% 1,835,242 2,811,391 -35%
4Q16 4Q15 % FY16 FY15 %
Mining Unit Operating Results
Uchucchacua Ore Milled DMT 324,291 318,219 2% 1,267,752 1,121,474 13%
Ore Grade % 1.20% 1.04% 15% 1.17% 1.05% 11%
Recovery Rate % 42.4% 48.0% -12% 48.8% 48.2% 1%
MT Produced 1,662 1,602 4% 7,227 5,693 27%
Mallay Ore Milled DMT 51,613 42,812 21% 204,035 158,123 29%
Ore Grade % 5.03% 6.51% -23% 5.79% 6.60% -12%
Recovery Rate % 89.6% 86.3% 4% 88.3% 87.9% 0%
MT Produced 2,326 2,407 -3% 10,463 9,172 14%
Mining Unit Operating Results
Colquijirca MT Produced 19,908 15,966 25% 57,385 53,319 8%
Open Pit
GOLD PRODUCTION
Underground
Open Pit
SILVER PRODUCTION
Open Pit
ZINC PRODUCTION
Underground
Underground
Compañía de Minas Buenaventura S.A.A.
Fourth Quarter and Twelve-Month 2016 Results Page 11 of 26
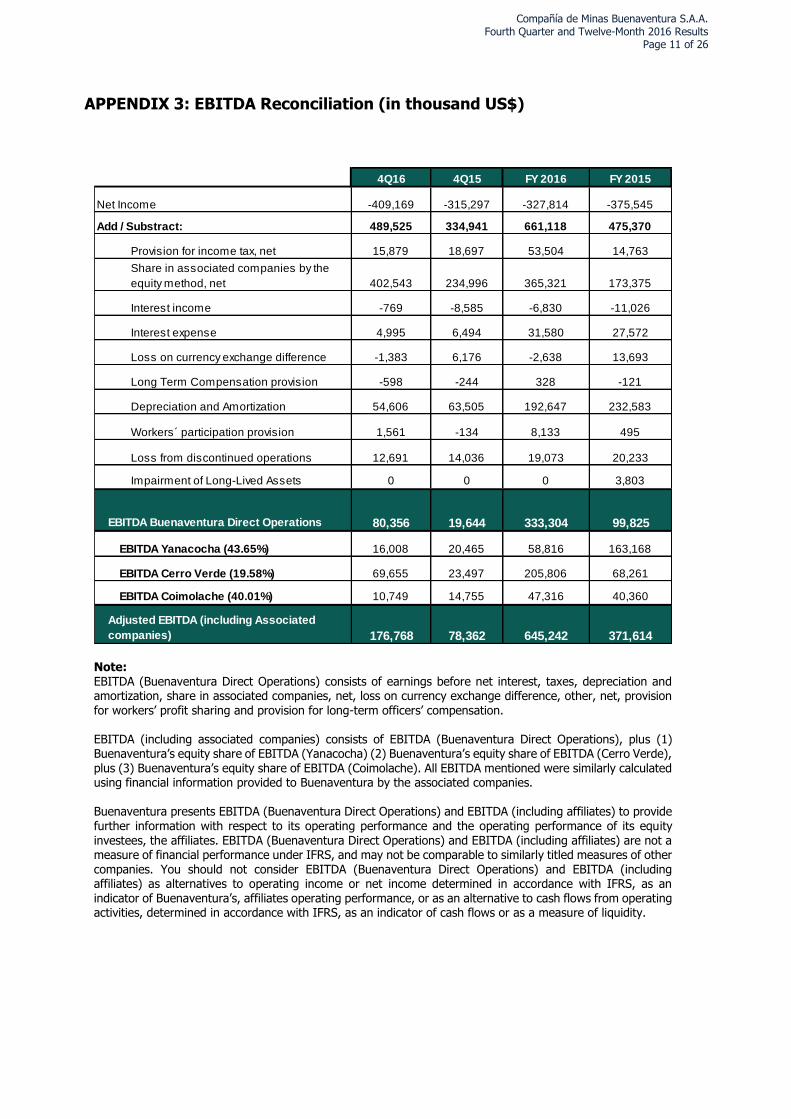
APPENDIX 3: EBITDA Reconciliation (in thousand US$)
Note: EBITDA (Buenaventura Direct Operations) consists of earnings before net interest, taxes, depreciation and amortization, share in associated companies, net, loss on currency exchange difference, other, net, provision
for workers’ profit sharing and provision for long-term officers’ compensation. EBITDA (including associated companies) consists of EBITDA (Buenaventura Direct Operations), plus (1) Buenaventura’s equity share of EBITDA (Yanacocha) (2) Buenaventura’s equity share of EBITDA (Cerro Verde), plus (3) Buenaventura’s equity share of EBITDA (Coimolache). All EBITDA mentioned were similarly calculated using financial information provided to Buenaventura by the associated companies. Buenaventura presents EBITDA (Buenaventura Direct Operations) and EBITDA (including affiliates) to provide further information with respect to its operating performance and the operating performance of its equity investees, the affiliates. EBITDA (Buenaventura Direct Operations) and EBITDA (including affiliates) are not a measure of financial performance under IFRS, and may not be comparable to similarly titled measures of other companies. You should not consider EBITDA (Buenaventura Direct Operations) and EBITDA (including affiliates) as alternatives to operating income or net income determined in accordance with IFRS, as an indicator of Buenaventura’s, affiliates operating performance, or as an alternative to cash flows from operating activities, determined in accordance with IFRS, as an indicator of cash flows or as a measure of liquidity.
4Q16 4Q15 FY 2016 FY 2015
Net Income -409,169 -315,297 -327,814 -375,545
Add / Substract: 489,525 334,941 661,118 475,370
Provision for income tax, net 15,879 18,697 53,504 14,763
Share in associated companies by the
equity method, net 402,543 234,996 365,321 173,375
Interest income -769 -8,585 -6,830 -11,026
Interest expense 4,995 6,494 31,580 27,572
Loss on currency exchange difference -1,383 6,176 -2,638 13,693
Long Term Compensation provision -598 -244 328 -121
Depreciation and Amortization 54,606 63,505 192,647 232,583
Workers´ participation provision 1,561 -134 8,133 495
Loss from discontinued operations 12,691 14,036 19,073 20,233
Impairment of Long-Lived Assets 0 0 0 3,803
EBITDA Buenaventura Direct Operations 80,356 19,644 333,304 99,825
EBITDA Yanacocha (43.65%) 16,008 20,465 58,816 163,168
EBITDA Cerro Verde (19.58%) 69,655 23,497 205,806 68,261
EBITDA Coimolache (40.01%) 10,749 14,755 47,316 40,360
Adjusted EBITDA (including Associated
companies) 176,768 78,362 645,242 371,614
Compañía de Minas Buenaventura S.A.A.
Fourth Quarter and Twelve-Month 2016 Results Page 12 of 26
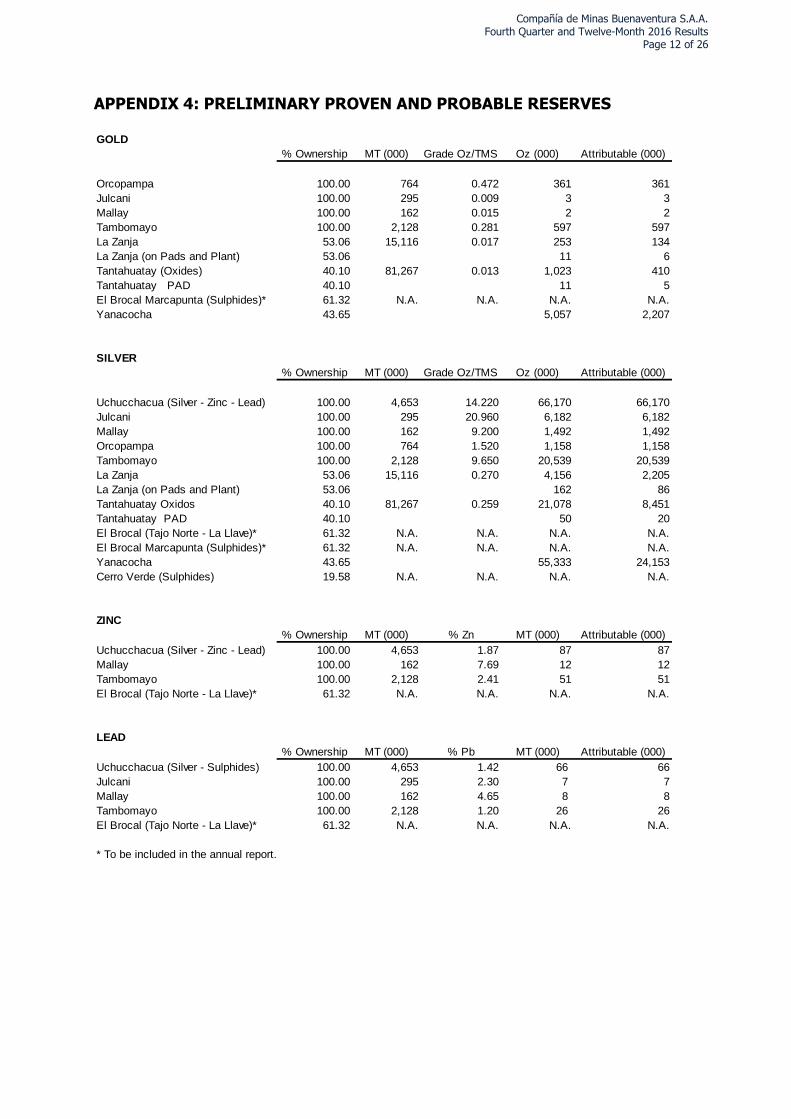
APPENDIX 4: PRELIMINARY PROVEN AND PROBABLE RESERVES
GOLD
% Ownership MT (000) Grade Oz/TMS Oz (000) Attributable (000)
Orcopampa 100.00 764 0.472 361 361
Julcani 100.00 295 0.009 3 3
Mallay 100.00 162 0.015 2 2
Tambomayo 100.00 2,128 0.281 597 597
La Zanja 53.06 15,116 0.017 253 134
La Zanja (on Pads and Plant) 53.06 11 6
Tantahuatay (Oxides) 40.10 81,267 0.013 1,023 410
Tantahuatay PAD 40.10 11 5
El Brocal Marcapunta (Sulphides)* 61.32 N.A. N.A. N.A. N.A.
Yanacocha 43.65 5,057 2,207
SILVER
% Ownership MT (000) Grade Oz/TMS Oz (000) Attributable (000)
Uchucchacua (Silver - Zinc - Lead) 100.00 4,653 14.220 66,170 66,170
Julcani 100.00 295 20.960 6,182 6,182
Mallay 100.00 162 9.200 1,492 1,492
Orcopampa 100.00 764 1.520 1,158 1,158
Tambomayo 100.00 2,128 9.650 20,539 20,539
La Zanja 53.06 15,116 0.270 4,156 2,205
La Zanja (on Pads and Plant) 53.06 162 86
Tantahuatay Oxidos 40.10 81,267 0.259 21,078 8,451
Tantahuatay PAD 40.10 50 20
El Brocal (Tajo Norte - La Llave)* 61.32 N.A. N.A. N.A. N.A.
El Brocal Marcapunta (Sulphides)* 61.32 N.A. N.A. N.A. N.A.
Yanacocha 43.65 55,333 24,153
Cerro Verde (Sulphides) 19.58 N.A. N.A. N.A. N.A.
ZINC
% Ownership MT (000) % Zn MT (000) Attributable (000)
Uchucchacua (Silver - Zinc - Lead) 100.00 4,653 1.87 87 87
Mallay 100.00 162 7.69 12 12
Tambomayo 100.00 2,128 2.41 51 51
El Brocal (Tajo Norte - La Llave)* 61.32 N.A. N.A. N.A. N.A.
LEAD
% Ownership MT (000) % Pb MT (000) Attributable (000)
Uchucchacua (Silver - Sulphides) 100.00 4,653 1.42 66 66
Julcani 100.00 295 2.30 7 7
Mallay 100.00 162 4.65 8 8
Tambomayo 100.00 2,128 1.20 26 26
El Brocal (Tajo Norte - La Llave)* 61.32 N.A. N.A. N.A. N.A.
* To be included in the annual report.

Compañía de Minas Buenaventura S.A.A.
Fourth Quarter and Twelve-Month 2016 Results Page 13 of 26
COPPER
% Ownership MT (000) % Cu MT (000) Attributable (000)
Julcani 100.00 295 0.49 1 1
El Brocal Marcapunta (Sulphides)* 61.32 N.A. N.A. N.A. N.A.
Cerro Verde (Sulphides)* 19.58 N.A. N.A. N.A. N.A.
Cerro Verde (Oxides)* 19.58 N.A. N.A. N.A. N.A.
MOLYBDENUM
% Ownership MT (000) % Mo Oz (000) Attributable (000)
Cerro Verde (Sulphides)* 19.58 N.A. N.A. N.A. N.A.
Prices used for Reserves calculation:
Gold 1,250 US$/Oz - Silver 19 US$/Oz - Zinc 2,100 US$/MT - Lead 1,800 US$/MT - Copper 5,000 US$/MT
* To be included in the annual report.

Compañía de Minas Buenaventura S.A.A.
Fourth Quarter and Twelve-Month 2016 Results Page 14 of 26
APPENDIX 5: COST APPLICABLE TO SALES RECONCILIATION Reconciliation of Costs Applicable to Sales and Cost Applicable to Sales per Unit Sold
Cost applicable to sales consists of cost of sales, excluding depreciation and amortization, plus selling expenses. Cost applicable to sales per unit sold for each mine consists of cost applicable to sales for a particular metal produced at a given mine divided by the volume of such metal produced at such mine in the specified period. We note that cost applicable to sales is not directly comparable to the cash operating cost figures disclosed in previously furnished earnings releases.
Cost applicable to sales and Cost applicable to sales per unit of mineral sold are not measures of financial performance under IFRS, and may not be comparable to similarly titled measures of other companies. We consider Cost applicable to sales and Cost applicable to sales per unit of mineral sold to be key measures in managing and evaluating our operating performance. These measures are widely reported in the precious metals industry as a benchmark for performance, but do not have standardized meanings. You should not consider Cost applicable to sales or Cost applicable to sales per unit of mineral sold as alternatives to cost of sales determined in accordance with IFRS, as indicators of our operating performance. Cost applicable to sales and Cost applicable to sales per unit of mineral sold are calculated without adjusting for by-product revenue amounts.
The tables below set forth (i) a reconciliation of consolidated Cost of sales, excluding depreciation and amortization to consolidated Cost applicable to sales, (ii) reconciliations of the components of Cost applicable to sales (by mine and mineral) to the corresponding consolidated line items set forth on our consolidated statements of profit or loss for the three and nine months ended September 30, 2015 and 2016, and (iii) reconciliations of Cost of sales, excluding depreciation and amortization to Cost applicable to sales for each of our mining units. The amounts set forth in Cost applicable to sales and Cost applicable to sales per unit sold for each mine and mineral indicated in the tables below can be reconciled to the amounts set forth on our
consolidated statements of profit or loss for the three and nine months ended September 30, 2015 and 2016 by reference to the reconciliations of Cost of sales, excluding depreciation and amortization (by mine and mineral), Selling Expenses (by mine and metal) expenses and Exploration in units in operations (by mine and mineral) to consolidated Cost of sales, excluding depreciation and amortization, consolidated Selling Expenses and consolidated Exploration in units in operations expenses, respectively, set forth below.

Compañía de Minas Buenaventura S.A.A.
Fourth Quarter and Twelve-Month 2016 Results Page 15 of 26
Set forth below is a reconciliation of consolidated Cost of sales, excluding depreciation and amortization,
to consolidated Cost applicable to sales:
Add:
Consolidated Exploration in units in operation
Consolidated Commercial deductions
Consolidated Selling expenses
Consolidated Cost applicable to sales
Set forth below is a reconciliation of Cost of sales, excluding depreciation and amortization
(by mine and mineral) to consolidated Cost of sales:
Cost of sales by mine and mineral
Julcani, Gold
Julcani, Silver
Julcani, Lead
Julcani, Copper
Mallay, Gold
Mallay, Silver
Mallay, Lead
Mallay, Zinc
Orcopampa, Gold
Orcopampa, Silver
Orcopampa, Copper
Uchucchacua, Gold
Uchucchacua, Silver
Uchucchacua, Lead
Uchucchacua, Zinc
La Zanja, Gold
La Zanja, Silver
El Brocal, Gold
El Brocal, Silver
El Brocal, Lead
El Brocal, Zinc
El Brocal, Copper
Non Mining Units
Consolidated Cost of sales, excluding depreciation
and amortization
Julcani, Gold
Julcani, Silver
Julcani, Lead
Julcani, Copper
Mallay, Gold
Mallay, Silver
Mallay, Lead
Mallay, Zinc
Orcopampa, Gold
Orcopampa, Silver
Orcopampa, Copper 45 0
Uchucchacua, Gold 38 6
Uchucchacua, Silver
Uchucchacua, Lead
Uchucchacua, Zinc
La Zanja, Gold
La Zanja, Silver
El Brocal, Gold
El Brocal, Silver
El Brocal, Lead
El Brocal, Zinc
El Brocal, Copper
Non Mining Units
Consolidated Exploration expenses in units in operation
0 0 0 0
29,943 23,691 96,149 89,699
0 0 0 0
0 0 0 0
0 0 0 0
0 0 0 0
13 0 12 1
0 0 0 0
452 267 1,308 1,100
487 6 591 41
28,292 25,160
657 442 1,769 1,449
34 0
19 2
8,589 8,075
13,701 9,680 42,985 40,344
710 328 2,081 1,360
517 542 1,765 1,990
816 532 2,633 2,399
21 60 183 77
893 902 3,379 3,073
257 190 934 956
13 21 42 121
0 4 8 25
2,764 2,641 10,086 11,597
2016 2015 2016 2015
Exploration expenses in units in operation by mine and
mineral(in thousands of US$)
137,021 145,874 508,566 573,102
Set forth below is a reconciliation of Exploration expenses in units in operation (by mine and mineral) to consolidated Exploration expenses in
mining units:
For the 3 months ended December 31 For the 12 months ended December 31
2,886 5,678 11,237 38,435
22,826 22,449 92,224 68,711
3,024 5,641 9,878 15,244
14,093 10,475 45,506 42,157
1,539 1,759 6,773 4,258
4,161 7,066 12,161 21,024
25,017 19,179 89,816 105,795
652 454 1,787 3,213
1,927 1,714 5,763 6,356
1,324 1,038 4,262 4,825
56 7 123 25
25,190 31,325 92,188 110,351
1,108 877 4,271 3,512
54 0 92 0
2,095 1,317 7,371 6,256
21,376 25,886 88,213 104,204
2,292 2,234 9,461 8,014
1,327 1,343 4,943 5,190
26 53 83 242
53 148 512 201
5,485 6,739 20,032 23,134
510 484 1,855 1,906
2016 2015 2016 2015
(in thousands of US$)
0 9 15 49
246,158 237,227 870,861 878,311
For the 3 months ended December 31 For the 12 months ended December 31
73,107 60,998 244,413 196,145
6,087 6,664 21,733 19,365
29,943 23,691 96,149 89,699
(in thousands of US$)
Consolidated Cost of sales excluding depreciation and
amortization137,021 145,874 508,566 573,102
For the 3 months ended December 31 For the 12 months ended December 31
2016 2015 2016 2015

Compañía de Minas Buenaventura S.A.A.
Fourth Quarter and Twelve-Month 2016 Results Page 16 of 26
Set forth below is a reconciliation of Commercial Deductions in units in operation (by mine and mineral)
to consolidated Commercial deductions:
Julcani, Gold
Julcani, Silver
Julcani, Lead
Julcani, Copper
Mallay, Gold 60 192 89
Mallay, Silver
Mallay, Lead
Mallay, Zinc
Orcopampa, Gold
Orcopampa, Silver
Orcopampa, Copper 21 0
Uchucchacua, Gold 46 7
Uchucchacua, Silver
Uchucchacua, Lead
Uchucchacua, Zinc
La Zanja, Gold
La Zanja, Silver
El Brocal, Gold
El Brocal, Silver
El Brocal, Lead
El Brocal, Zinc
El Brocal, Copper
Non Mining Units
Consolidated Commercial deductions in units in
operation
Set forth below is a reconciliation of Selling expenses (by mine and mineral) to consolidated
Selling expenses:
Selling expenses by mine and mineral
Julcani, Gold
Julcani, Silver
Julcani, Lead
Julcani, Copper
Mallay, Gold
Mallay, Silver
Mallay, Lead
Mallay, Zinc
Orcopampa, Gold
Orcopampa, Silver
Orcopampa, Copper 0
Uchucchacua, Gold 1
Uchucchacua, Silver
Uchucchacua, Lead
Uchucchacua, Zinc
La Zanja, Gold
La Zanja, Silver
El Brocal, Gold
El Brocal, Silver
El Brocal, Lead
El Brocal, Zinc
El Brocal, Copper
Non Mining Units
Consolidated Selling expenses
867 886 2,278 2,220
6,087 6,664 21,733 19,365
809 799 2,815 2,522
1,310 1,713 5,704 4,110
239 539 752 1,258
174 431 611 912
7 6 21 36
88 134 419 255
60 35 193 141
251 244 1,032 1,171
1,136 1,060 4,173 3,225
87 58 261 186
1 0 1
3 0 6
454 190 1,024 823
24 6 50 28
78 98 344 376
124 96 512 453
3 11 36 15
136 163 658 580
20 13 71 79
1 1 3 10
(in thousands of US$)
0 0 1 2
216 180 770 963
For the 3 months ended December 31 For the 12 months ended December 31
2016 2015 2016 2015
0 0 0 0
73,107 60,998 244,413 196,145
16,196 6,903 39,944 24,622
31,330 25,762 114,012 81,479
3,876 3,992 9,971 13,583
2,072 2,269 5,490 6,669
2 6 15 18
2,487 1,925 9,028 4,847
1,805 1,499 6,006 5,457
112 53 293 194
37,877 37,753
727 675 2,348 2,161
12 0
19 2
9,552 12,517
164 55 496 255
67 0 149 0
668 735 2,471 2,655
1,587 1,158 5,796 4,313
5 17 25 81
26
1,167 1,216 4,745 4,098
1,129 2,007 5,021 7,258
104 144 465 591
Commercial Deductions in units in operation by mine and
mineral(in thousands of US$)
0 3 3 14
For the 3 months ended December 31 For the 12 months ended December 31
2016 2015 2016 2015

Contacts in Lima: Contacts in NY: Carlos Galvez, Chief Financial Officer Barbara Cano (511) 419 2540 (646) 452 2334
[email protected] Daniel Dominguez, Manager of Financial Planning and Investor Relations (511) 419 2591 / [email protected] Rodrigo Echecopar, Investor Relations Coordinator (511) 419 2609 / [email protected] Company Website: www.buenaventura.pe/ir
GOLD (OZ) SILVER (OZ) LEAD (MT) ZINC (MT) COPPER (MT) TOTAL GOLD (OZ) SILVER (OZ) LEAD (MT) ZINC (MT) COPPER (MT) TOTAL GOLD (OZ) SILVER (OZ) LEAD (MT) ZINC (MT) COPPER (MT) TOTAL GOLD (OZ) SILVER (OZ) LEAD (MT) ZINC (MT) COPPER (MT) TOTAL
Cost of Sales (without D&A) (US$000) 0 5,485 510 - 26 6,022 9 6,739 484 - 53 7,285 Cost of Sales (without D&A) (US$000) 15 20,032 1,855 - 83 21,985 49 23,134 1,906 - 242 25,332
Add: Add:
Exploration Expenses (US$000) 0 2,764 257 - 13 3,034 4 2,641 190 - 21 2,855 Exploration Expenses (US$000) 8 10,086 934 - 42 11,069 25 11,597 956 - 121 12,699
Commercial Deductions (US$000) -0 1,129 104 - 5 1,237 3 2,007 144 - 17 2,171 Commercial Deductions (US$000) 3 5,021 465 - 25 5,514 14 7,258 591 - 81 7,944
Sell ing Expenses (US$000) 0 216 20 - 1 237 0 180 13 - 1 195 Sell ing Expenses (US$000) 1 770 71 - 3 845 2 963 79 - 10 1,055
Cost Applicable to Sales (US$000) 0 9,594 891 - 45 10,530 16 11,567 832 - 92 12,506 Cost Applicable to Sales (US$000) 27 35,908 3,325 - 153 39,413 90 42,953 3,533 - 454 47,030
Divide: Divide:
Volume Sold 1 767,334 587 - 17 Not Applicable 18 1,022,162 674 - 26 Not Applicable Volume Sold 32 3,090,967 2,679 - 54 Not Applicable 94 3,493,166 2,478 - 103 No Aplicable
CAS 515 12.50 1,517 - 2,630 Not Applicable 870 11.32 1,233 - 3,543 Not Applicable CAS 825 11.62 1,241 - 2,837 No Applicable 955 12.30 1,425 - 4,416 No Applicable
GOLD (OZ) SILVER (OZ) LEAD (MT) ZINC (MT) COPPER (MT) TOTAL GOLD (OZ) SILVER (OZ) LEAD (MT) ZINC (MT) COPPER (MT) TOTAL GOLD (OZ) SILVER (OZ) LEAD (MT) ZINC (MT) COPPER (MT) TOTAL GOLD (OZ) SILVER (OZ) LEAD (MT) ZINC (MT) COPPER (MT) TOTAL
Cost of Sales (without D&A) (US$000) 53 2,292 1,327 2,095 - 5,767 148 2,234 1,343 1,317 - 5,041 Cost of Sales (without D&A) (US$000) 512 9,461 4,943 7,371 - 22,287 201 8,014 5,190 6,256 - 19,660
Add: Add:
Exploration Expenses (US$000) 21 893 517 816 - 2,247 60 902 542 532 - 2,035 Exploration Expenses (US$000) 183 3,379 1,765 2,633 - 7,960 77 3,073 1,990 2,399 - 7,539
Commercial Deductions (US$000) 26 1,167 668 1,587 - 3,447 60 1,216 735 1,158 - 3,168 Commercial Deductions (US$000) 192 4,745 2,471 5,796 - 13,204 89 4,098 2,655 4,313 - 11,155
Sell ing Expenses (US$000) 3 136 78 124 - 341 11 163 98 96 - 367 Sell ing Expenses (US$000) 36 658 344 512 - 1,549 15 580 376 453 - 1,424
Cost Applicable to Sales (US$000) 103 4,487 2,590 4,622 - 11,802 278 4,514 2,717 3,102 - 10,611 Cost Applicable to Sales (US$000) 923 18,242 9,523 16,312 - 45,000 381 15,765 10,211 13,421 - 39,778
Divide: Divide:
Volume Sold 109 332,930 1,360 1,925 - Not Applicable 292 327,697 1,765 1,981 - Not Applicable Volume Sold 1,041 1,426,986 6,775 8,728 - Not Applicable 396 1,134,528 6,612 7,482 - Not Applicable
CAS 950 13.48 1,905 2,400 - Not Applicable 954 13.77 1,540 1,566 - Not Applicable CAS 886 12.78 1,406 1,869 - No Applicable 960 13.90 1,544 1,794 - No Applicable
GOLD (OZ) SILVER (OZ) LEAD (MT) ZINC (MT) COPPER (MT) TOTAL GOLD (OZ) SILVER (OZ) LEAD (MT) ZINC (MT) COPPER (MT) TOTAL GOLD (OZ) SILVER (OZ) LEAD (MT) ZINC (MT) COPPER (MT) TOTAL GOLD (OZ) SILVER (OZ) LEAD (MT) ZINC (MT) COPPER (MT) TOTAL
Cost of Sales (without D&A) (US$000) 21,376 1,108 - - 54 22,537 25,886 877 - - - 26,763 Cost of Sales (without D&A) (US$000) 88,213 4,271 - - 92 92,576 104,204 3,512 - - - 107,716
Add: - Add:
Exploration Expenses (US$000) 13,701 710 - - 34 14,445 9,680 328 - - - 10,008 Exploration Expenses (US$000) 42,985 2,081 - - 45 45,111 40,344 1,360 - - - 41,704
Commercial Deductions (US$000) 164 67 - - 12 243 55 - - - - 55 Commercial Deductions (US$000) 496 149 - - 21 667 255 0 - - - 255
Sell ing Expenses (US$000) 454 24 - - 1 479 190 6 - - - 196 Sell ing Expenses (US$000) 1,024 50 - - 1 1,075 823 28 - - - 851
Cost Applicable to Sales (US$000) 35,694 1,908 - - 102 37,704 35,810 1,212 - - - 37,022 Cost Applicable to Sales (US$000) 132,718 6,552 - - 159 139,429 145,626 4,900 - - - 150,526
Divide: Divide:
Volume Sold 46,239 156,126 - - 24 Not Applicable 52,488 139,557 - - - Not Applicable Volume Sold 188,511 680,708 - - 48 Not Applicable 214,821 555,314 - - - Not Applicable
CAS 772 12.22 - - 4,244 Not Applicable 682 8.68 - - - Not Applicable CAS 704 9.62 - - 3,305 No Applicable 678 8.82 - - - No Applicable
GOLD (OZ) SILVER (OZ) LEAD (MT) ZINC (MT) COPPER (MT) TOTAL GOLD (OZ) SILVER (OZ) LEAD (MT) ZINC (MT) COPPER (MT) TOTAL GOLD (OZ) SILVER (OZ) LEAD (MT) ZINC (MT) COPPER (MT) TOTAL GOLD (OZ) SILVER (OZ) LEAD (MT) ZINC (MT) COPPER (MT) TOTAL
Cost of Sales (without D&A) (US$000) 56 25,190 1,927 1,324 - 28,497 7 31,325 1,714 1,038 - 34,084 Cost of Sales (without D&A) (US$000) 123 92,188 5,763 4,262 - 102,336 25 110,351 6,356 4,825 - 121,557
Add: Add:
Exploration Expenses (US$000) 19 8,589 657 452 - 9,717 2 8,075 442 267 - 8,786 Exploration Expenses (US$000) 38 28,292 1,769 1,308 - 31,406 6 25,160 1,449 1,100 - 27,715
Commercial Deductions (US$000) 19 9,552 727 1,805 - 12,103 2 12,517 675 1,499 - 14,694 Commercial Deductions (US$000) 46 37,877 2,348 6,006 - 46,277 7 37,753 2,161 5,457 - 45,379
Sell ing Expenses (US$000) 3 1,136 87 60 - 1,285 0 1,060 58 35 - 1,153 Sell ing Expenses (US$000) 6 4,173 261 193 - 4,632 1 3,225 186 141 - 3,552
Cost Applicable to Sales (US$000) 97 44,467 3,398 3,641 - 51,602 11 52,977 2,890 2,839 - 58,718 Cost Applicable to Sales (US$000) 212 162,529 10,140 11,770 - 184,651 39 176,490 10,152 11,523 - 198,203
Divide: Divide:
Volume Sold 127 3,856,346 2,218 1,254 - Not Applicable 12 4,132,034 1,993 1,520 - Not Applicable Volume Sold 279 14,739,128 8,350 5,295 - Not Applicable 38 12,666,673 6,560 4,750 - Not Applicable
CAS 763 11.53 1,532 2,903 - No Applicable 920 12.82 1,450 1,868 - No Applicable CAS 758 11.03 1,214 2,223 - No Applicable 1,014 13.93 1,548 2,426 - No Applicable
UCHUCCHACUA UCHUCCHACUA 4Q 2016 4Q 2015 FY 2016 FY 2015
ORCOPAMPA ORCOPAMPA 4Q 2016 4Q 2015 FY 2016 FY 2015
MALLAY MALLAY 4Q 2016 4Q 2015 FY 2016 FY 2015
JULCANI JULCANI 4Q 2016 4Q 2015 FY 2016 FY 2015

Compañía de Minas Buenaventura S.A.A.
Fourth Quarter and Twelve-Month 2016 Results Page 18 of 26
GOLD (OZ) SILVER (OZ) LEAD (MT) ZINC (MT) COPPER (MT) TOTAL GOLD (OZ) SILVER (OZ) LEAD (MT) ZINC (MT) COPPER (MT) TOTAL GOLD (OZ) SILVER (OZ) LEAD (MT) ZINC (MT) COPPER (MT) TOTAL GOLD (OZ) SILVER (OZ) LEAD (MT) ZINC (MT) COPPER (MT) TOTAL
Cost of Sales (without D&A) (US$000) 25,017 652 - - - 25,669 19,179 454 - - - 19,633 Cost of Sales (without D&A) (US$000) 89,816 1,787 - - - 91,603 105,795 3,213 - - - 109,008
Add: Add:
Exploration Expenses (US$000) 487 13 - - - 500 6 0 - - - 6 Exploration Expenses (US$000) 591 12 - - - 603 41 1 - - - 42
Commercial Deductions (US$000) 112 2 - - - 114 53 6 - - - 59 Commercial Deductions (US$000) 293 15 - - - 307 194 18 - - - 212
Sell ing Expenses (US$000) 251 7 - - - 258 244 6 - - - 250 Sell ing Expenses (US$000) 1,032 21 - - - 1,053 1,171 36 - - - 1,207
Cost Applicable to Sales (US$000) 25,868 673 - - - 26,541 19,482 466 - - - 19,948 Cost Applicable to Sales (US$000) 91,732 1,835 - - - 93,566 107,201 3,268 - - - 110,469
Divide: Divide:
Volume Sold 35,430 62,569 - - - Not Applicable 37,706 68,585 - - - Not Applicable Volume Sold 151,189 229,055 - - - Not Applicable 142,299 324,151 - - - Not Applicable
CAS 730 10.76 - - - Not Applicable 517 6.79 - - - Not Applicable CAS 607 8.01 - - - No Applicable 753 10.08 - - - Not Applicable
GOLD (OZ) SILVER (OZ) LEAD (MT) ZINC (MT) COPPER (MT) TOTAL GOLD (OZ) SILVER (OZ) LEAD (MT) ZINC (MT) COPPER (MT) TOTAL GOLD (OZ) SILVER (OZ) LEAD (MT) ZINC (MT) COPPER (MT) TOTAL GOLD (OZ) SILVER (OZ) LEAD (MT) ZINC (MT) COPPER (MT) TOTAL
Cost of Sales (without D&A) (US$000) 1,539 4,161 3,024 14,093 22,826 45,643 1,759 7,066 5,641 10,475 22,449 47,390 Cost of Sales (without D&A) (US$000) 6,773 12,161 9,878 45,506 92,224 166,542 4,258 21,024 15,244 42,157 68,711 151,394
Add: Add:
Exploration Expenses (US$000) - - - - - - - - - - - - Exploration Expenses (US$000) - - - - - - - - - - - -
Commercial Deductions (US$000) 2,487 3,876 2,072 16,196 31,330 55,962 1,925 3,992 2,269 6,903 25,762 40,851 Commercial Deductions (US$000) 9,028 9,971 5,490 39,944 114,012 178,444 4,847 13,583 6,669 24,622 81,479 131,200
Sell ing Expenses (US$000) 88 239 174 809 1,310 2,620 134 539 431 799 1,713 3,617 Sell ing Expenses (US$000) 419 752 611 2,815 5,704 10,301 255 1,258 912 2,522 4,110 9,056
Cost Applicable to Sales (US$000) 4,115 8,276 5,270 31,098 55,466 104,225 3,818 11,597 8,340 18,177 49,924 91,858 Cost Applicable to Sales (US$000) 16,220 22,884 15,979 88,265 211,940 355,287 9,359 35,865 22,826 69,301 154,300 291,650
Divide: Divide:
Volume Sold 3,931 763,176 4,138 16,784 12,738 Not Applicable 2,835 881,192 5,870 12,586 9,150 Not Applicable Volume Sold 13,062 1,696,176 11,874 48,806 45,572 Not Applicable 7,181 2,637,215 16,739 43,297 28,991 Not Applicable
CAS 1,047 10.84 1,273 1,853 4,354 Not Applicable 1,347 13.16 1,421 1,444 5,456 Not Applicable CAS 1,242 13.49 1,346 1,808 4,651 No Applicable 1,303 13.60 1,364 1,601 5,322 Not Applicable
GOLD (OZ) SILVER (OZ) LEAD (MT) ZINC (MT) COPPER (MT) TOTAL GOLD (OZ) SILVER (OZ) LEAD (MT) ZINC (MT) COPPER (MT) TOTAL GOLD (OZ) SILVER (OZ) LEAD (MT) ZINC (MT) COPPER (MT) TOTAL GOLD (OZ) SILVER (OZ) LEAD (MT) ZINC (MT) COPPER (MT) TOTAL
Cost of Sales (without D&A) (US$000) - - - - - 2,886 - - - - - 5,678 Cost of Sales (without D&A) (US$000) - - - - - 11,237 - - - - - 38,435
Add: Add:
Sell ing Expenses (US$000) - - - - - 867 - - - - - 886 Sell ing Expenses (US$000) - - - - - 2,278 - - - - - 2,220
Total (US$000) - - - - - 3,753 - - - - - 6,564 Total (US$000) - - - - - 13,515 - - - - - 40,655
GOLD (OZ) SILVER (OZ) LEAD (MT) ZINC (MT) COPPER (MT) TOTAL GOLD (OZ) SILVER (OZ) LEAD (MT) ZINC (MT) COPPER (MT) TOTAL GOLD (OZ) SILVER (OZ) LEAD (MT) ZINC (MT) COPPER (MT) TOTAL GOLD (OZ) SILVER (OZ) LEAD (MT) ZINC (MT) COPPER (MT) TOTAL
Cost of Sales (without D&A) (US$000) 48,042 38,887 6,788 17,512 22,906 137,021 46,987 48,695 9,182 12,829 22,502 145,874 Cost of Sales (without D&A) (US$000) 185,451 139,900 22,439 57,140 92,399 508,566 214,531 169,249 28,697 53,238 68,953 573,102
Add: Add:
Exploration Expenses (US$000) 14,228 12,969 1,431 1,268 48 29,943 9,751 11,946 1,174 799 21 23,691 Exploration Expenses (US$000) 43,804 43,849 4,468 3,941 87 96,149 40,493 41,191 4,395 3,499 121 89,699
Commercial Deductions (US$000) 2,808 15,793 3,571 19,588 31,347 73,107 2,098 19,738 3,824 9,560 25,778 60,998 Commercial Deductions (US$000) 10,058 57,778 10,774 51,746 114,058 244,413 5,405 62,711 12,077 34,392 81,560 196,145
Sell ing Expenses (US$000) 800 1,756 359 993 1,312 6,087 579 1,954 599 930 1,715 6,664 Sell ing Expenses (US$000) 2,517 6,422 1,287 3,520 5,709 21,733 2,267 6,089 1,553 3,116 4,120 19,365
Cost Applicable to Sales (US$000) 65,877 69,406 12,149 39,361 55,613 246,158 59,416 82,333 14,779 24,119 50,016 237,227 Cost Applicable to Sales (US$000) 241,831 247,949 38,968 116,346 212,252 870,861 262,696 279,240 46,721 94,245 154,754 878,311
Divide: Divide:
Volume Sold 85,836 5,938,481 8,304 19,963 12,779 Not Applicable 93,352 6,571,227 10,302 16,087 9,176 Not Applicable Volume Sold 354,116 21,863,019 29,678 62,829 45,674 Not Applicable 364,831 20,811,046 32,389 55,529 29,094 Not Applicable
CAS 767 11.69 1,463 1,972 4,352 Not Applicable 636 12.53 1,434 1,499 5,451 Not Applicable CAS 683 11.34 1,313 1,852 4,647 Not Applicable 720 13.42 1,443 1,697 5,319 Not Applicable
GOLD (OZ) SILVER (OZ) LEAD (MT) ZINC (MT) COPPER (MT) TOTAL GOLD (OZ) SILVER (OZ) LEAD (MT) ZINC (MT) COPPER (MT) TOTAL GOLD (OZ) SILVER (OZ) LEAD (MT) ZINC (MT) COPPER (MT) TOTAL GOLD (OZ) SILVER (OZ) LEAD (MT) ZINC (MT) COPPER (MT) TOTAL
Cost of Sales (without D&A) (US$000) 15,769 686 - - - 16,455 16,925 1,368 - - - 18,292 Cost of Sales (without D&A) (US$000) 58,809 3,886 - - - 62,695 55,952 4,576 - - - 60,527
Add: Add:
Exploration Expenses (US$000) 6,001 261 - - - 6,262 1,578 128 - - - 1,706 Exploration Expenses (US$000) 12,804 846 - - - 13,650 12,598 1,030 - - - 13,628
Commercial Deductions (US$000) 40 2 - - - 41 267 30 - - - 298 Commercial Deductions (US$000) 474 42 - - - 516 776 71 - - - 847
Sell ing Expenses (US$000) 306 13 - - - 319 381 31 - - - 412 Sell ing Expenses (US$000) 1,058 70 - - - 1,128 1,028 84 - - - 1,112
Cost Applicable to Sales (US$000) 22,116 962 - - - 23,077 19,151 1,556 - - - 20,708 Cost Applicable to Sales (US$000) 73,145 4,844 - - - 77,989 70,353 5,761 - - - 76,114
Divide: Divide:
Volume Sold 41,454 129,123 - - - Not Applicable 49,363 294,995 - - - Not Applicable Volume Sold 148,781 721,891 - - - Not Applicable 143,791 874,271 - - - Not Applicable
CAS 534 7.45 - - - Not Applicable 388 5.28 - - - Not Applicable CAS 492 6.71 - - - No Applicable 489 6.59 - - - Not Applicable
COIMOLACHE COIMOLACHE 4Q 2016 4Q 2015 FY 2016 FY 2015
BUENAVENTURA CONSOLIDATED BUENAVENTURA CONSOLIDATED 4Q 2016 4Q 2015 FY 2016 FY 2015
NON MINING COMPANIES NON MINING COMPANIES 4Q 2016 4Q 2015 FY 2016 FY 2015
BROCAL BROCAL 4Q 2016 4Q 2015 FY 2016 FY 2015
LA ZANJA LA ZANJA 4Q 2016 4Q 2015 FY 2016 FY 2015

Compañía de Minas Buenaventura S.A.A.
Fourth Quarter and Twelve-Month 2016 Results Page 19 of 26
APPENDIX 6: ALL-IN SUSTAINING COST
All-in Sustaining Cost for 4Q16
Au Ounces Sold BVN 81,622
Au Ounces bought from La Zanja -35,147
Au Ounces Sold Net 46,475 34,505 41,454 81,405
Income Statement & Cash Flow US$ 000' US$/Oz Au US$ 000' US$/Oz Au US$ 000' US$/Oz Au US$ 000' US$/Oz Au
Cost of Sales3 68,722 1,479 26,510 768 16,455 397 89,386 1,098
Exploration in Operating Units 29,443 634 3,076 89 6,262 151 33,586 413
Royalties 4,325 93 0 0 0 0 4,325 53
Comercial Deductions4 17,032 366 551 16 41 1 17,341 213
Selling Expenses 2,394 52 205 6 319 8 2,631 32
Administrative Expenses5 12,215 263 338 10 2,345 57 13,335 164
Other Expenses 0 0 2,143 62 1,742 42 1,836 23
Other Incomes -5,093 -110 -4,513 -131 -2,818 -68 -8,618 -106
Administrative charges 0 0 1,539 45 514 12 1,023 13
Sustaining Capex6 21,117 454 3,098 90 8,581 207 26,201 322
By-product Credit -110,761 -2,383 -1,063 -31 -2,149 -52 -112,187 -1,378
All-in Sustaining Cost 39,394 848 31,883 924 31,293 755 68,858 846
*All-in Sustaining Cost does not include: Depreciation and Amortization, Stoppage of mining units, Exploration in non-operating areas.
Notes:
1. Non-consolidated financial statements for Compañia De Minas Buenaventura S.A.A.
2. Considers 100% from Compañia De Minas Buenaventura S.A.A., 53.06% from La Zanja and 40.095% from Tantahuatay.
3. For Buenaventura does not consider purchase of concentrate from La Zanja.
4. For all metals produced.
5. For Buenaventura, does not consider management services charged to subsidiaries.
6. Sustaining Capex + Growth Capex equals Acquisitions of mining concessions, development costs, property, plant and equipment.
4Q16 4Q16 4Q16 4Q16
Buenaventura1 La Zanja Tantahuatay Attributable 2
4Q16 4Q16 4Q16 4Q16

Compañía de Minas Buenaventura S.A.A.
Fourth Quarter and Twelve-Month 2016 Results Page 20 of 26
All-in Sustaining Cost for 4Q15
Au Ounces Sold BVN 90,462
Au Ounces bought from La Zanja -37,652
Au Ounces Sold Net 52,810 37,847 49,363 92,684
Income Statement & Cash Flow US$ 000' US$/Oz Au US$ 000' US$/Oz Au US$ 000' US$/Oz Au US$ 000' US$/Oz Au
Cost of Sales3 78,768 1,492 19,617 518 18,292 371 96,511 1,041
Exploration in Operating Units 25,492 483 549 15 1,706 35 26,467 286
Royalties 5,041 95 0 0 0 0 5,041 54
Comercial Deductions4 20,088 380 873 23 298 6 20,671 223
Selling Expenses 1,913 36 254 7 411 8 2,212 24
Administrative Expenses5 11,481 217 1,051 28 821 17 12,368 133
Other Expenses 0 0 4,018 106 1,502 30 2,734 30
Other Incomes -2,898 -55 -5,638 -149 -2,249 -46 -6,791 -73
Other administrative charges 0 0 2,718 72 564 11 1,668 18
Sustaining Capex6 16,209 307 1,592 42 15,865 321 23,414 253
By-product Credit -93,749 -1,775 -977 -26 -4,346 -88 -96,010 -1,036
All-in Sustaining Cost 62,345 1,181 24,057 636 32,864 666 88,286 953
*All-in Sustaining Cost does not include: Depreciation and Amortization, Stoppage of mining units, Exploration in non-operating areas.
Notes:
1. Non-consolidated financial statements for Compañia De Minas Buenaventura S.A.A. (Does not consider El Brocal)
2. Considers 100% from Compañia De Minas Buenaventura S.A.A., 53.06% from La Zanja and 40.095% from Tantahuatay.
3. For Buenaventura does not consider purchase of concentrate from La Zanja.
4. For all metals produced.
5. For Buenaventura, does not consider management services charged to subsidiaries. For La Zanja does not consider US$ 3.8 MM Impairment.
6. Sustaining Capex + Growth Capex equals Acquisitions of mining concessions, development costs, property, plant and equipment.
4Q15
Buenaventura1 La Zanja Tantahuatay Attributable Production2
4Q15 4Q15 4Q15 4Q15
4Q15 4Q15 4Q15

Compañía de Minas Buenaventura S.A.A.
Fourth Quarter and Twelve-Month 2016 Results Page 21 of 26
All-in Sustaining Cost for FY16
Au Ounces Sold BVN 340,879
Au Ounces bought from La Zanja -150,145
Au Ounces Sold Net 190,735 142,207 148,781 325,844
Income Statement & Cash Flow US$ 000' US$/Oz Au US$ 000' US$/Oz Au US$ 000' US$/Oz Au US$ 000' US$/Oz Au
Cost of Sales3 272,452 1,428 86,514 608 62,695 421 343,494 1,054
Exploration in Operating Units 95,546 501 5,222 37 13,650 92 103,790 319
Royalties 19,824 104 0 0 0 0 19,824 61
Comercial Deductions4 65,663 344 3,163 22 516 3 67,548 207
Selling Expenses 8,216 43 937 7 1,128 8 9,165 28
Administrative Expenses5 49,286 258 1,979 14 4,144 28 51,998 160
Other Expenses 0 0 8,721 61 6,583 44 7,267 22
Other Incomes -10,255 -54 -17,258 -121 -8,710 -59 -22,904 -70
Administrative charges 0 0 4,301 30 1,372 9 2,832 9
Sustaining Capex6 54,930 288 14,995 105 27,064 182 73,738 226
By-product Credit -419,793 -2,201 -3,864 -27 -12,418 -83 -426,822 -1,310
All-in Sustaining Cost 135,870 712 104,709 736 96,023 645 229,929 706
*All-in Sustaining Cost does not include: Depreciation and Amortization, Stoppage of mining units, Exploration in non-operating areas.
Notes:
1. Non-consolidated financial statements for Compañia De Minas Buenaventura S.A.A.
2. Considers 100% from Compañia De Minas Buenaventura S.A.A., 53.06% from La Zanja and 40.095% from Tantahuatay.
3. For Buenaventura does not consider purchase of concentrate from La Zanja.
4. For all metals produced.
5. For Buenaventura, does not consider management services charged to subsidiaries.
6. Sustaining Capex + Growth Capex equals Acquisitions of mining concessions, development costs, property, plant and equipment.
FY16 FY16 FY16 FY16
Buenaventura1 La Zanja Tantahuatay Attributable 2
FY16 FY16 FY16 FY16

Compañía de Minas Buenaventura S.A.A.
Fourth Quarter and Twelve-Month 2016 Results Page 22 of 26
All-in Sustaining Cost for FY15
Au Ounces Sold BVN 373,548
Au Ounces bought from La Zanja -142,129
Au Ounces Sold Net 231,419 138,465 143,791 362,541
Income Statement & Cash Flow US$ 000' US$/Oz Au US$ 000' US$/Oz Au US$ 000' US$/Oz Au US$ 000' US$/Oz Au
Cost of Sales3 307,709 1,330 106,749 771 60,527 421 388,619 1,072
Exploration in Operating Units 91,548 396 8,995 65 13,628 95 101,785 281
Royalties 21,942 95 0 0 0 0 21,942 61
Comercial Deductions4 64,799 280 3,367 24 847 6 66,925 185
Selling Expenses 7,001 30 1,207 9 1,112 8 8,087 22
Administrative Expenses5 47,125 204 2,251 16 2,185 15 49,195 136
Other Expenses 0 0 14,174 102 7,136 50 10,382 29
Other Incomes -6,881 -30 -21,676 -157 -9,270 -64 -22,099 -61
Other administrative charges 0 0 8,190 59 1,369 10 4,894 14
Sustaining Capex6 38,861 168 27,615 199 48,509 337 72,964 201
By-product Credit -320,485 -1,385 -4,947 -36 -13,468 -94 -328,510 -906
All-in Sustaining Cost 251,619 1,087 145,926 1,054 112,575 783 374,184 1,032
*All-in Sustaining Cost does not include: Depreciation and Amortization, Stoppage of mining units, Exploration in non-operating areas.
Notes:
1. Non-consolidated financial statements for Compañia De Minas Buenaventura S.A.A. (Does not consider El Brocal)
2. Considers 100% from Compañia De Minas Buenaventura S.A.A., 53.06% from La Zanja and 40.095% from Tantahuatay.
3. For Buenaventura does not consider purchase of concentrate from La Zanja.
4. For all metals produced.
5. For Buenaventura, does not consider management services charged to subsidiaries. For La Zanja does not consider US$ 3.8 MM Impairment.
6. Sustaining Capex + Growth Capex equals Acquisitions of mining concessions, development costs, property, plant and equipment.
FY15 FY15 FY15 FY15
Buenaventura1 La Zanja Coimolache Attributable Production2
FY15 FY15 FY15 FY15

Compañía de Minas Buenaventura S.A.A.
Fourth Quarter and Twelve-Month 2016 Results Page 23 of 26
APPENDIX 7
Compañía de Minas Buenaventura S.A.A. and Subsidiaries
Consolidated Statement of Financial Position
As of December 31, 2016 and December 31, 2015
2,016 2,015
Assets US$(000) US$(000)
Current assets
Cash and cash equivalents 80,544 78,519
Trade and other accounts receivable, net 269,089 219,862
Income tax credit 19,956 45,919
Prepaid expenses 11,392 8,231
Inventory, net 120,947 101,473
501,928 454,004
Assets classified as held for sale - 15,592
501,928 469,596
Non-current assets
Trade and other receivables, net 166,048 162,567
Long-term inventory 14,027 26,029
Long-term income tax credit 3,660 -
Investment in associates 1,536,607 2,043,983
Mining concessions, development costs, property, plant and equipment, net 1,960,025 1,747,624
Investment properties, net 10,089 10,719
Deferred income tax asset, net 25,881 41,574
Prepaid expenses 30,431 29,235
Other assets 17,719 15,854
3,764,487 4,077,585
Total assets 4,266,415 4,547,181
Liabilities and shareholders’ equity, net
Current liabilities
Bank loans 55,000 285,302
Trade and other payables 273,440 247,114
Provisions 62,502 49,829
Income tax payable 8,686 2,444
Embedded derivatives for sale of concentrate, net 1,524 1,694
Financial obligations 40,110 33,394
Hedge derivative financial instruments 3,863 10,643
445,125 630,420
Liabilities directly associated with assets classified as held for sale - 20,611
445,125 651,031
Non-current liabilities
Trade and other payables 15,982 15,057
Provisions 174,190 141,885
Financial obligations 552,232 320,316
Contingent consideration liability 19,343 16,994
Deferred income tax liability, net 12,330 12,662
774,077 506,914
Total liabilities 1,219,202 1,157,945
Shareholders’ equity, net
Capital stock 750,497 750,497
Investment shares 791 1,396
Additional paid-in capital 218,450 219,055
Legal reserve 162,744 162,714
Other reserves 269 269
Retained earnings 1,690,123 2,024,895
Other reserves of equity (1,783) 2,240
Shareholders’ equity, net attributable to owners of the parent 2,821,091 3,161,066
Non-controlling interest 226,122 228,170
Total shareholders’ equity, net 3,047,213 3,389,236
Total liabilities and shareholders’ equity, net 4,266,415 4,547,181

Compañía de Minas Buenaventura S.A.A.
Fourth Quarter and Twelve-Month 2016 Results Page 24 of 26
Compañía de Minas Buenaventura S.A.A. and Subsidiaries
Consolidated Statement of Income
For the three and twelve month periods ended December 31, 2016 and 2015
2,016 2,015 2,016 2,015
US$(000) US$(000) US$(000) US$(000)
Continuing operations
Operating income
Net sales of goods 269,360 219,766 1,015,670 846,269
Net sales of services 11,923 8,141 28,782 50,839
Royalty income 5,846 7,214 24,339 32,414
Total operating income 287,129 235,121 1,068,791 929,522
Operating costs
Cost of sales, without considering depreciation and amortization (134,618) (132,580) (497,812) (513,490)
Cost of services, without considering depreciation and amortization (2,403) (13,294) (10,754) (59,612)
Exploration in operating units (29,943) (23,691) (96,149) (89,699)
Depreciation and amortization (54,606) (63,505) (192,647) (232,583)
Mining royalties (7,236) (5,344) (27,611) (27,188)
Total operating costs (228,806) (238,414) (824,973) (922,572)
Gross profit (loss) 58,323 (3,293) 243,818 6,950
Operating expenses, net
Administrative expenses (23,644) (25,566) (81,692) (84,372)
Exploration in non-operating areas (11,765) (4,950) (26,589) (30,610)
Selling expenses (6,087) (6,664) (21,733) (19,365)
Provision for impairment of long-lived assets - - - (3,803)
Other, net 7,960 (3,010) 18,392 (5,735)
Total operating expenses, net (33,536) (40,190) (111,622) (143,885)
Operating profit (loss) 24,787 (43,483) 132,196 (136,935)
Other income (expense), net
Share in the results of associates under equity method (402,543) (234,996) (365,321) (173,375)
Financial costs (4,995) (6,494) (31,580) (27,572)
Net gain (loss) from currency exchange difference 1,383 (6,176) 2,638 (13,693)
Financial income 769 8,585 6,830 11,026
Total other income, net (405,386) (239,081) (387,433) (203,614)
Profit (loss) before income tax (380,599) (282,564) (255,237) (340,549)
Current income tax (7,085) (3,666) (39,444) (14,222)
Deferred income tax (8,794) (15,031) (14,060) (541)
Profit (loss) from continuing operations (396,478) (301,261) (308,741) (355,312)
Discontinued operations
Loss from discontinued operations (12,691) (14,036) (19,073) (20,233)
Net loss (409,169) (315,297) (327,814) (375,545)
Attributable to:
Owners of the parent (405,864) (292,554) (323,492) (317,210)
Non-controlling interest (3,305) (22,743) (4,322) (58,335)
(409,169) (315,297) (327,814) (375,545)
Basic and diluted loss per share attributable to
equity holders of the parent, stated in U.S. dollars (1.60) (1.15) (1.27) (1.25)
Weighted average number of shares outstanding
(common and investment), in units 254,186,867 254,186,867 254,186,867 254,186,867
For the three month period
ended December, 31
For the twelve month period
ended December, 31

Compañía de Minas Buenaventura S.A.A.
Fourth Quarter and Twelve-Month 2016 Results Page 25 of 26
Compañía de Minas Buenaventura S.A.A. and Subsidiaries
Consolidated Statement of Cash FlowsFor the three and twelve month periods ended December 31, 2016 and 2015
2016 2015 2016 2015
US$(000) US$(000) US$(000) US$(000)
Operating activities
Proceeds from sales 325,469 243,306 1,003,422 965,273
Proceeds from dividends 2,414 1,916 142,340 6,691
Value Added Tax recovered 11,939 6,908 117,661 81,692
Royalty received 5,974 10,017 25,961 38,983
Interest received 374 1,153 2,140 3,650
Payments to suppliers and third-parties (155,803) (173,546) (672,419) (727,017)
Payments to employees (32,894) (47,409) (138,113) (175,329)
Payments of interest (15,197) (4,235) (34,138) (21,518)
Payments of mining royalties (4,643) (5,429) (20,052) (22,836)
Payment of income taxes (21,235) (4,943) (35,401) (22,330)
Net cash and cash equivalents provided by operating activities 116,398 27,738 391,401 127,259
Investing activities
Proceeds from sales of mining concessions, property, plant and equipment 1,529 2,892 7,180 5,481
Acquisitions of mining concessions, development costs, property, plant and equipment (127,170) (44,759) (366,834) (211,286)
Loans granted to associates - (104,000) - (124,800)
Loans granted to third parties - (829) - (829)
Payments for acquisitions of other assets (5,222) (10,238) (5,222) (10,238)
Proceeds from loan to third parties - (141) - -
Opening of time deposits - 7,350 - -
Net cash and cash equivalents used in investing activities (130,863) (149,725) (364,876) (341,672)
Financing activities
Proceeds from financial obligations - (9,704) 275,210 296
Proceeds from bank loans 24,649 104,503 200,500 344,503
Payments of bank loans (27,197) - (442,957) (90,000)
Payments of financial obligations (8,296) (21) (33,476) (29,891)
Dividends paid to controlling interest (7,612) 70 (7,621) -
Dividends paid to non-controlling interest (1,691) (2,440) (7,400) (10,488)
Acquisition of non-controlling interest - - (5,459) -
Increase of restricted bank accounts 1,924 - (2,087) -
Repurchase of treasury shares - - (1,210) -
Net cash and cash equivalents provided by (used in) financing activities (18,223) 92,408 (24,500) 214,420
Net increase (decrease) in cash and cash equivalents during the period (32,688) (29,579) 2,025 7
Cash and cash equivalents at the beginning of the period 113,232 108,098 78,519 78,512
Cash and cash equivalents at period-end 80,544 78,519 80,544 78,519
For the three month period
ended December, 31
For the twelve month period
ended December, 31

Compañía de Minas Buenaventura S.A.A.
Fourth Quarter and Twelve-Month 2016 Results Page 26 of 26
2016 2015 2016 2015
US$(000) US$(000) US$(000) US$(000)
Reconciliation of net profit to cash and cash equivalents provided
by operating activities
Net loss (409,169) (315,297) (327,814) (375,545)
Plus (less):
Depreciation and amortization 54,606 63,505 192,647 232,583
Reversal (provision) for impairment loss of inventories (2,941) (973) (12,086) 12,737
Net loss (gain) on sales of mining concessions, property, plant and equipment (9,252) (14,060) (7,180) (440)
Net loss (gain) from currency exchange difference (1,383) 6,176 (2,638) 13,693
Provision for impairment of long–lived assets - - 2,043 11,255
Accretion expense of provision for closure of mining units and exploration projects 2,258 412 5,068 3,343
Net share in results of associates 402,543 234,996 365,321 173,375
Loss attributable to non-controlling interest 3,305 22,743 4,322 58,335
Deferred income tax expense (income) 8,794 15,031 14,060 541
Provision for estimated fair value of embedded derivatives related to concentrate 3,807 (732) (5,491) (7,079)
sales and adjustments on open liquidations
Hedge derivative instruments 3,745 - 3,745 -
Other net 3,816 (508) (596) (30,111)
Net changes in operating assets and liabilities:
Decrease (increase) in operating assets -
Trade and other accounts receivable 31,225 (125,467) (37,010) (73,497)
Inventories 13,214 58,592 6,437 70,248
Income tax credit (1,917) 2,437 22,303 7,827
Prepaid expenses (4,361) (27,727) (7,476) (20,485)
Increase (decrease) in operating liabilities -
Trade and other accounts payable 19,324 25,779 41,232 (9,431)
Income tax payable 6,242 (165) 6,242 (1,112)
Provisions (9,872) 81,080 (14,068) 54,331
Proceeds from dividends 2,414 1,916 142,340 6,691
Net cash and cash equivalents provided by operating activities 116,398 27,738 391,401 127,259
For the three month period
ended December, 31
For the twelve month period
ended December, 31