Embed Size (px)
Citation preview
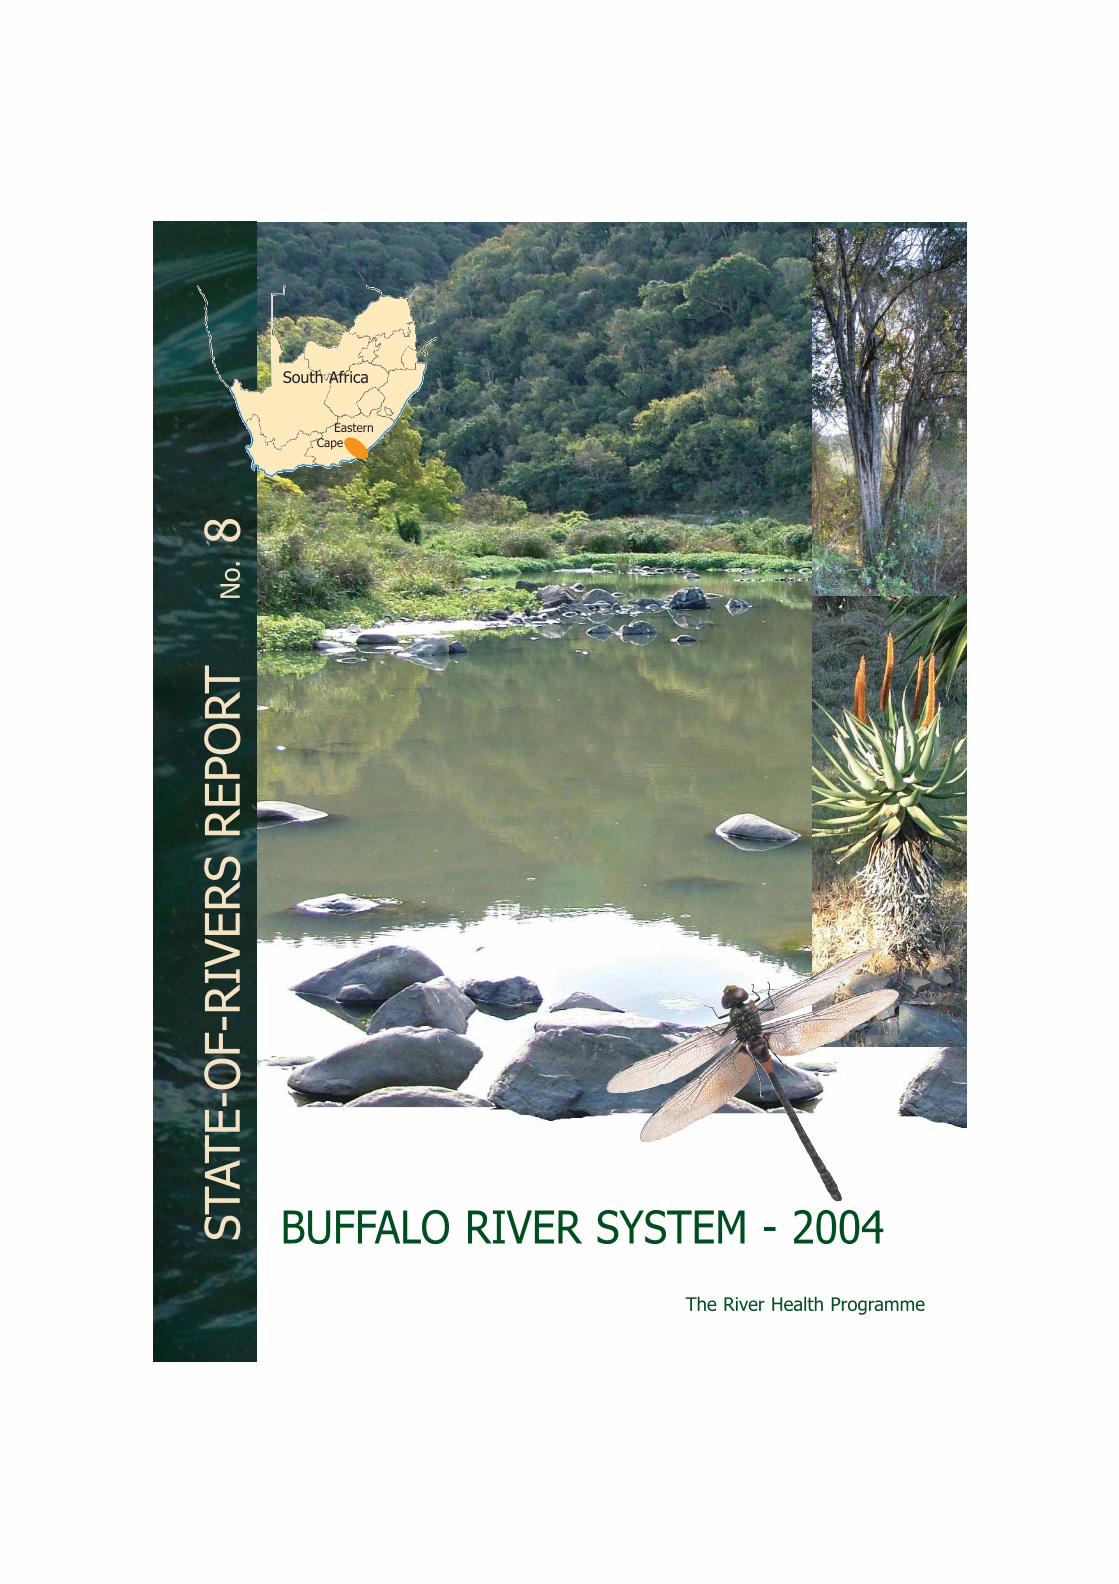
The River Health Programme
BUFFALO RIVER SYSTEM - 2004STAT
E-O
F-RIV
ERS
REP
ORT
No.
8
South Africa
EasternCape
FOREWORD
Contributing OrganisationsDepartment of Water Affairs and Forestry (DWAF)Department of Environmental Affairs and Tourism (DEAT)Water Research Commission (WRC)Eastern Cape Department of HealthCoastal and Environmental Services (CES)Amatola Water BoardBuffalo City MunicipalityRhodes UniversityUnilever Centre for Environmental Water Quality (UCEWQ)University of TranskeiBorder TechnikonNational Ports AuthorityDown to EarthCSIR Environmentek[list to be completed and finalised]
Financial Assistance Norwegian Agency for Development Cooperation
ContributorsWilma Strydom (CSIR - State-of-River Report reporting coordinator, text, photographs, graphic design); Pumza Gasa-Lubelwana (DWAF - co-ordinator,text); Lindela Tshwete (RQS - co-ordinator, text, surveys); Dr Patsy Scherman(CES - technical team leader, habitat, SASS, review); Dr Nikite Muller (UCEWQ- invertebrate and water quality specialist, text, review, photographs);Andrew Gordon (UCEWQ - fish specialist, review); Russell Chalmers (CES -fish specialist); Leanne du Preez (Rhodes University - geomorphology,review); Debbie Reyhardt (Down-to-Earth-Landscape - riparian vegetation,habitat); Dr Anton Bok (Anton Bok Aquatic Consulants - fish, review); Dr A RPalmer (Albany Museum); Stephen Keet (Stephen Keet Associates - riparianvegetation specialist); Carriot Kameni (DWAF - forestry, riparian vegetation);Pumza Maseti (UCEWQ - invertebrate and fish specialist); Pumza Kaleni(DWAF - data, water quality text); Nosisa Gwegwana (DWAF - data, waterquality text); Gordon Branston (EC Dept. of Health - water quality, harbour);Des Schultz (Buffalo City Municipality - water quality); Eric Qonya (DEAT -fish, wetlands); Dineke Vink (CSIR - maps); Dr Mandy Uys (Laughing Waters -river rehabilitation specialist, habitat); Gwendoline Sgwabe (DWAF - forestry);Nellie Ndulana (NPA - governance text); Ernita van Wyk (CSIR - governancetext); Japie Buckle (Working for Water - wetlands); Mmabatho Mampane(DWAF - support); Dr Neels Kleynhans (RQS - river habitat, review); JanineAdams (UPE - estuaries); Lindelwa Ndonga (Amatola Water Board - text);Thando Ntozakhe (Unitra - text); Malixole Soviti (Unitra - text); Eugene SihleNgcobo (Border Technicon - text); Paul Vorwerk (CES - fish specialist); MikeSilberbauer (RQS - text); Pete Ashton (CSIR - review); Carin van Ginkel (RQS- review); Bonani Madikizela (RQS - review); Dr Rudi Pretorius (DEAT - review);Dr Steve Mitchell (WRC - review); Mbangi Nephumbada (DWAF - review).
I am pleased to introduce this first State of Rivers Report for the Eastern Cape:A report on the ecological assessment of the Buffalo River.
The Eastern Cape's natural beauty, unique estuaries and rivers, extensive coastlines,its cultural diversity and history, and its varied wildlife and abundant renewable andnon-renewable resources, all contribute to its attraction. This report aims to raiseawareness and understanding of the current state of one of our important rivers,the impacts on it and what actions we can take to improve it. Its goal is also toempower people at local level to take ownership of their rivers. This will assist the people of the Eastern Caperegion to evaluate resource development issues with due consideration for the environment and conservation.Eastern Cape rivers have a rich potential and their sustainable development for food production, ecotourism,and commercial activities rely on them being kept healthy and protected.
The National Aquatic Ecosystem Biomonitoring Programme (called River Health Programme) was initiated ten yearsago, in 1994. It is therefore by no coincidence that when the country and the Department of Water Affairs andForestry celebrate a decade under democratic government, the RHP is also looking back at its humble beginning.Prior to promulgation of the National Water Act (Act No. 36 of 1998) River Health was not a key requirement.The Programme has received huge voluntary support from various non-government organisations, such as SouthAfrican National Parks, the Universities and Water Boards and provincial government.
The programme is currently being re-designed to be in line with the current legislation and will be expanded tolink up with wetlands and estuaries monitoring initiatives.
This report is the product of the collaboration of a diverse group of scientists, researchers and organisationsthat have contributed time, energy and ideas towards its compilation. Results are based on surveys conductedduring 2002 - 2003 and presented in the Buffalo River Technical Report.
Sustainable development requires a new level of environmental literacy in the Eastern Cape. This report aims tomake knowledge of aquatic resources more widely available, so that informed decision-making can occur, alsohoping that whoever reads it will apply the knowledge to the benefit of this river and the future development ofthis Catchment.
(MS) B P SONJICA MPMINISTER OF WATER AFFAIRS AND FORESTRY
CONTENT
Summary 2River Health Programme Background 4Indices Used in this Report 6River Health Categories 8Overview of the Buffalo River Catchment 10Buffalo River Headwaters 14Major Tributaries to the Buffalo River 18Buffalo River Upstream of Laing Dam 22The Buffalo River on the Coastal Plain 26The Lower Buffalo River, Estuary and Harbour 30Fish Species in the Buffalo River 34Some Plant Species Along the Buffalo River 35Glossary 36Further Reading 37The River Health Programme in the Eastern Cape:
Organisational Arrangements 38Challenges and Opportunities 40Management Guidelines 41
Suggested Citation:River Health Programme (2004). State-of-Rivers Report: Buffalo River System.Department of Water Affairs and ForestryPretoriaISBN No: 0-620-33052-X
October 2004
2
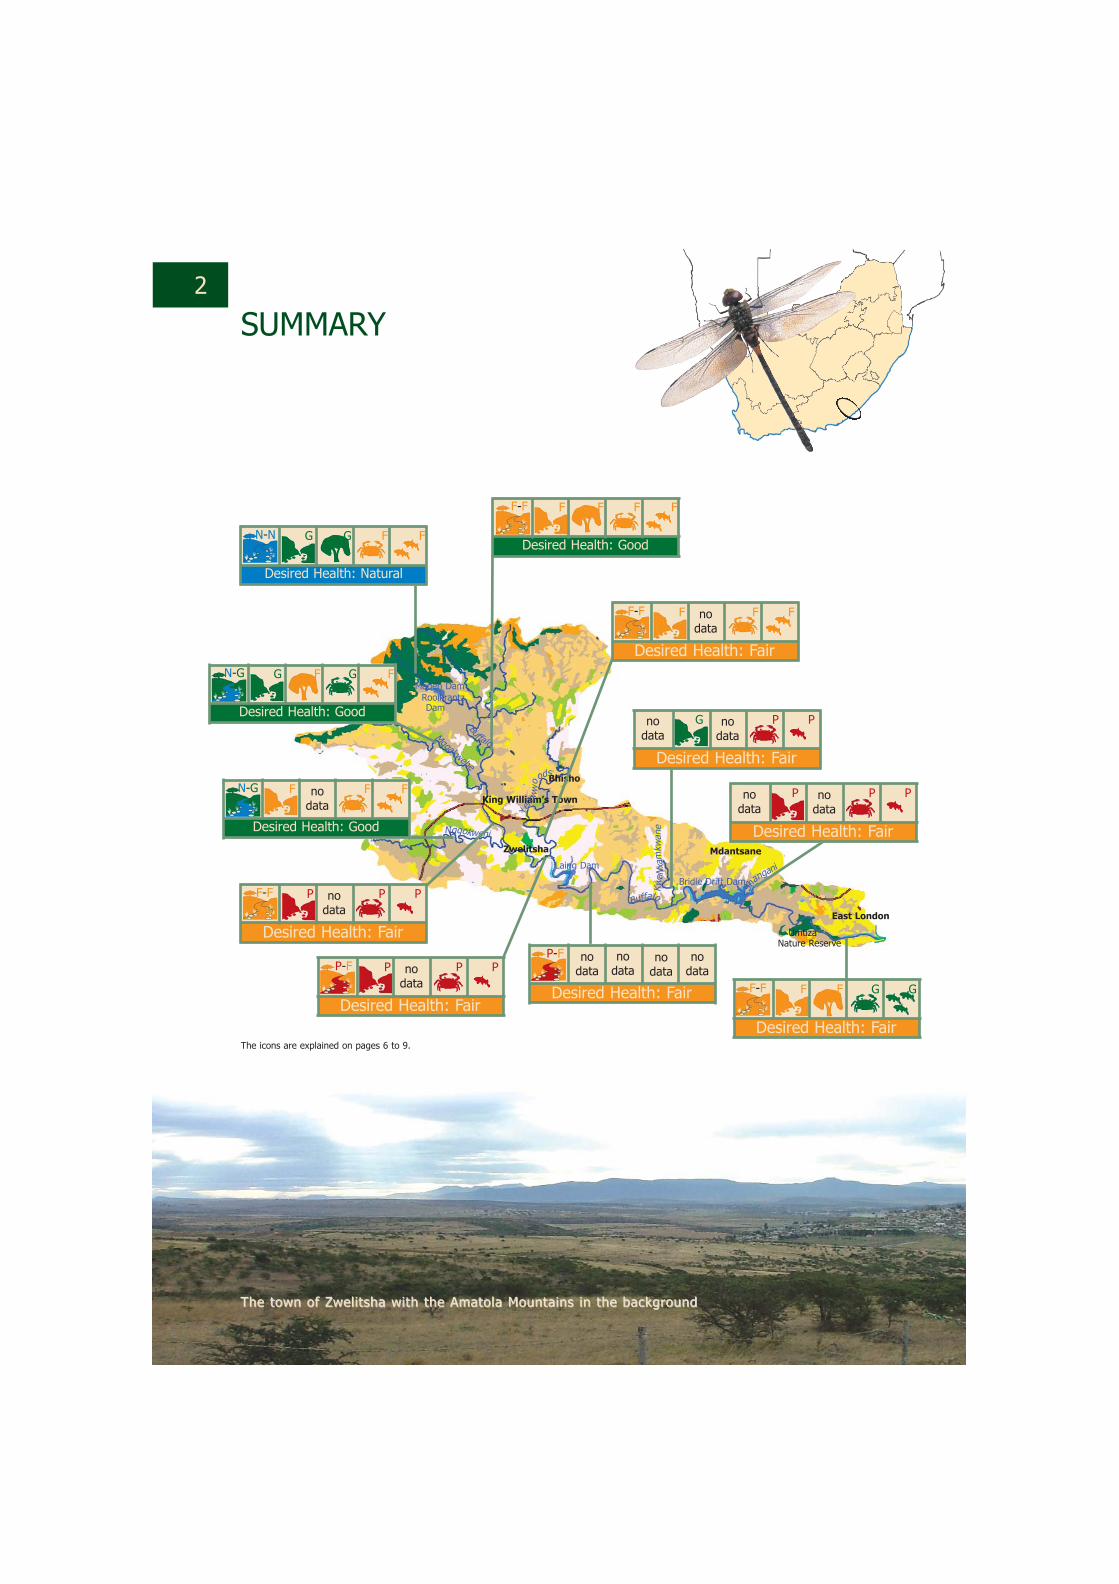
SUMMARY
Desired Health: Good
F-F F F F F
Desired Health: Fair
F-F F Fnodata
Desired Health: Natural
N-N G G F F
Desired Health: Good
N-G G F G F
F
East London
Zwelitsha
Bhisho
King William’s Town
Buffalo
Ngqokweni
Mgqakwebe
Maden DamRooikrantz
Laing Dam
Bridle Drift Dam
Mdantsane
UmtizaNature Reserve
Yello
ww
oods
Dam
Desired Health: Good
N-G F F Fnodata
Desired Health: Fair
F-F P Pnodata
P
Desired Health: Fair
P-F P Pnodata
P
Desired Health: Fair
P-F nodata
Desired Health: Fair
G Pnodata
Pnodata
nodata
nodata
nodata
KwaN
xam
kwan
e Desired Health: Fair
P Pnodata
Pnodata
Shangani
Desired Health: Fair
F-F F GGF
Buffalo
The icons are explained on pages 6 to 9.
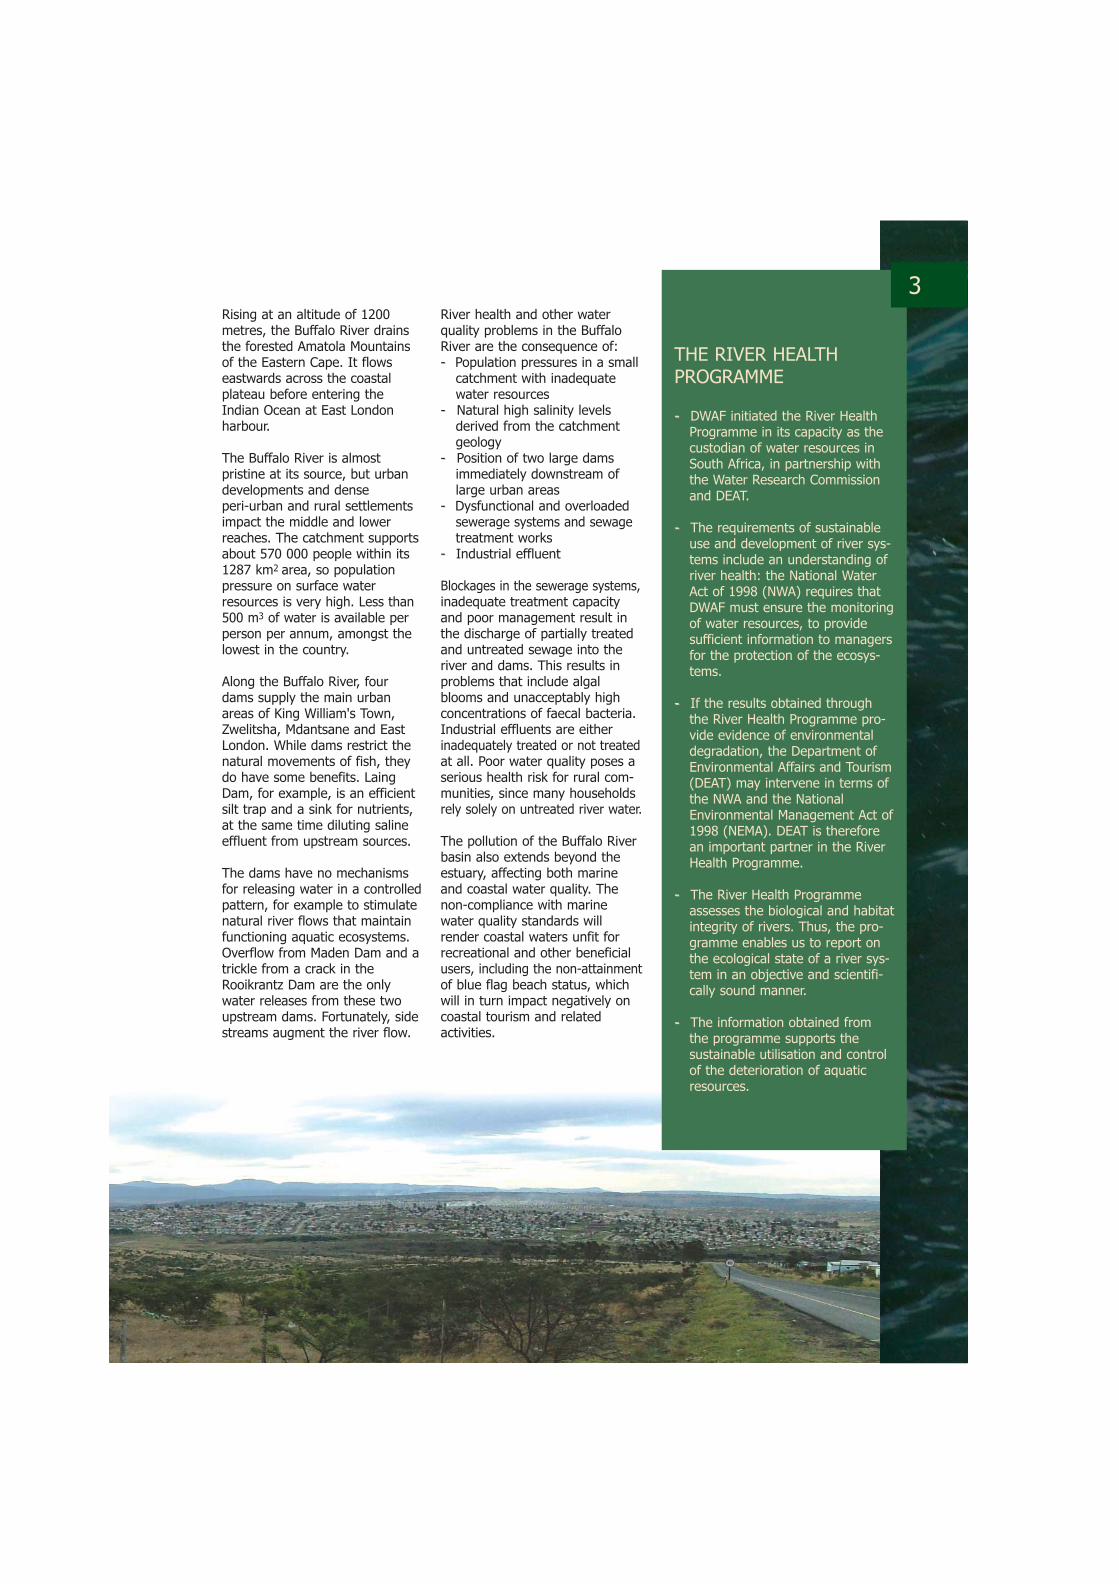
TThhee ttoowwnn ooff ZZwweell ii ttsshhaa wwiitthh tthhee AAmmaattoollaa MMoouunnttaaiinnss iinn tthhee bbaacckkggrroouunndd
River health and other water quality problems in the BuffaloRiver are the consequence of:-- Population pressures in a small
catchment with inadequatewater resources
- - Natural high salinity levelsderived from the catchmentgeology
- - Position of two large damsimmediately downstream oflarge urban areas
-- Dysfunctional and overloadedsewerage systems and sewagetreatment works
- - Industrial effluent
Blockages in the sewerage systems,inadequate treatment capacityand poor management result inthe discharge of partially treatedand untreated sewage into theriver and dams. This results inproblems that include algalblooms and unacceptably highconcentrations of faecal bacteria.Industrial effluents are eitherinadequately treated or not treatedat all. Poor water quality poses aserious health risk for rural com-munities, since many householdsrely solely on untreated river water.
The pollution of the Buffalo Riverbasin also extends beyond theestuary, affecting both marineand coastal water quality. Thenon-compliance with marinewater quality standards will render coastal waters unfit forrecreational and other beneficialusers, including the non-attainmentof blue flag beach status, whichwill in turn impact negatively oncoastal tourism and related activities.
THE RIVER HEALTHPROGRAMME
- - DWAF initiated the River HealthProgramme in its capacity as thecustodian of water resources inSouth Africa, in partnership withthe Water Research Commissionand DEAT.
- - The requirements of sustainableuse and development of river sys-tems include an understanding ofriver health: the National WaterAct of 1998 (NWA) requires thatDWAF must ensure the monitoringof water resources, to providesufficient information to managersfor the protection of the ecosys-tems.
- - If the results obtained throughthe River Health Programme pro-vide evidence of environmentaldegradation, the Department ofEnvironmental Affairs and Tourism(DEAT) may intervene in terms ofthe NWA and the NationalEnvironmental Management Act of1998 (NEMA). DEAT is thereforean important partner in the RiverHealth Programme.
- - The River Health Programmeassesses the biological and habitatintegrity of rivers. Thus, the pro-gramme enables us to report onthe ecological state of a river sys-tem in an objective and scientifi-cally sound manner.
- - The information obtained fromthe programme supports the sustainable utilisation and controlof the deterioration of aquaticresources.
3Rising at an altitude of 1200metres, the Buffalo River drainsthe forested Amatola Mountainsof the Eastern Cape. It flowseastwards across the coastalplateau before entering theIndian Ocean at East Londonharbour.
The Buffalo River is almost pristine at its source, but urbandevelopments and dense peri-urban and rural settlementsimpact the middle and lowerreaches. The catchment supportsabout 570 000 people within its 1287 km2 area, so populationpressure on surface waterresources is very high. Less than500 m3 of water is available perperson per annum, amongst thelowest in the country.
Along the Buffalo River, fourdams supply the main urbanareas of King William's Town,Zwelitsha, Mdantsane and EastLondon. While dams restrict thenatural movements of fish, theydo have some benefits. LaingDam, for example, is an efficientsilt trap and a sink for nutrients,at the same time diluting salineeffluent from upstream sources.
The dams have no mechanismsfor releasing water in a controlledpattern, for example to stimulatenatural river flows that maintainfunctioning aquatic ecosystems.Overflow from Maden Dam and atrickle from a crack in theRooikrantz Dam are the onlywater releases from these twoupstream dams. Fortunately, sidestreams augment the river flow.
4
RIVER HEALTH PROGRAMME BACKGROUNDAn old and well-proven manage-ment principle states, "If you can'tmeasure it, you can't manage it".This applies as much to waterresource management as to man-aging any other human endeavour.The National Water Act (Act No.36 of 1998) (NWA) recognises theprinciple explicitly in Chapter 14,which requires the monitoring ofwater resource quality to be anintegral part of water resourcemanagement. The NWA mandatesthe Minister of Water Affairs andForestry to establish national systems that monitor, record,assess and disseminate informationregarding, amongst many otherthings, the quality of waterresources. The National WaterResources Strategy (NWRS)emphasises this imperative in itsPart 6 on monitoring and informa-tion systems and Part 9 regardingfinancial implications.
The National Aquatic EcosystemBiomonitoring Programme(NAEBP) was launched in 1994.Since the NAEBP focussed largelyon riverine ecosystems, the shortername, River Health Programme(RHP), was adopted. However, theoriginal broader focus of the moni-toring programme remains valid,namely to monitor the ecologicalhealth of all aquatic ecosystemsthat fall under the custodianship ofthe Department of Water Affairsand Forestry.
South Africa's national water policyhas, as its central objective, theequitable, efficient and sustainableuse of our water resources. TheNWA and the NWRS both recognisethat the best way to achieve thisis to manage aquatic ecosystemsat the catchment scale throughjoint participation by all interestedparties. The RHP supports thismanagement process by providingmanagement information neededby water resource managers andother stakeholders involved inwater management decisions.Although the initial emphasis is onriverine ecosystems, the programmewill eventually expand to includeother aquatic ecosystems such aswetlands and estuaries.
The RHP focuses on the biologicalattributes of a river that serve asindicators of ecological health. Abiomonitoring programme goesbeyond the classic approach ofmonitoring only physical andchemical water quality and gener-ates information on the overallhealth of an aquatic ecosystem.
Aquatic communities, which includefish, riparian vegetation and aquaticinvertebrate fauna, adapt to a certainrange of environmental conditions.These organisms and communitiesintegrate, respond to and reflectthe effects of multiple disturbancesthat occur in aquatic ecosystemsover extended periods of time.Examples of such stressors include
habitat alteration, water abstraction,water pollution, creation of barriersthat alter stream flow and theintroduction of alien species.Whereas monitoring of chemicalattributes alone is insufficient todetect the cumulative effects ofmultiple stressors impacting on anaquatic ecosystem over time,biolological communities provide adirect, integrated measure of theecological integrity of their river. Ifhealthy biological communitiesinhabit a river, the river as a wholeis ecologically resilient andhealthy.
The RHP has the overall goal ofdelivering the ecological informa-tion required to support the rationalmanagement of river systems (andlater, a broader range of aquaticecosystems). The RHP is designedto develop the capacity and infor-mation base required to enableDWAF and other role players toreport on the ecological state ofSouth Africa's river systems, in anobjective and scientifically soundmanner. The information productsgenerated by the RHP assist indistinguishing between aquaticecosystems exposed to sustainableutilisation and those experiencingecological deterioration. Riverhealth monitoring also provides abaseline for subsequent audits ofmanagement strategies andactions implemented to maintainor improve the ecological status ofaquatic ecosystems.

The Department of Water Affairsand Forestry is the custodian of allwater resources in South Africaand, together with the Departmentof Environmental Affairs andTourism and the Water ResearchCommission, launched the RiverHealth Programme in 1994 togather information on the health ofSouth Africa's river systems. At aprovincial level, partnerships andcollaborations are establishedthrough a network of interestedand enthusiastic stakeholders whowork together to ensure that bio-monitoring is undertaken and thatresults are disseminated widely toa range of interested parties.
5
A number of water resourcequality monitoring programmesexist in DWAF and several otherinstitutions involved in waterresources management. DWAFhas therefore embarked on anew approach to align data col-lection, processing and dissemi-nation, while focussing on theneeds of the users of the infor-mation. A strategic frameworkfor national water resourcequality monitoring programmesoutlines the requirements andthe need for integration andstandardisation of terminologyacross various levels and scales.All monitoring efforts around thecountry will be faced with thechallenge of integration in orderto provide meaningful interpre-tations to decision-makers. National monitoring will be over-seen by DWAF’s Policy andRegulation branch.
Catchment Management Agencies(CMAs) (or DWAF Regional Officesas their current substitutes orfuture partners) and other localmanagement institutions are likelyto assume primary responsibilityfor the following types of monitor-ing programmes:
-- Status and trend monitoring oflocal catchments to evaluate theachievement of the Reserve andResource Quality Objectives.
-- Assessing compliance of waterusers regarding water licenceconditions or general authorisa-tions.
- - Assessing impacts of proposedwater uses for the purpose ofissuing water use licenses ordesigning other water manage-ment interventions.
-- Process control monitoring, e.g.for water releases from a reser-voir.
For example, water boards andlocal authorities would assumeprimary responsibility for monitor-ing:
-- The quality of their intakewater and effluent dischargefor process control purposes aswell as the outflow from indus-tries.
-- Status and trends of localaquifer systems under controlof the Water User Associations.
-- Water use of all legal waterusers.
Read DWAF's StrategicFramework for National WaterResource Quality MonitoringProgrammes for more information in thisregard. (Obtainable from DWAF, Pretoria.http://www.dwaf.gov.za/iwqs/wrmais/ )
MONITORING SYSTEMS
6
INDICES USED IN THIS REPORT
An indicator is a measure ofsome variable of interest. In thiscase it is related to the environ-mental management of ourrivers, by which the ecologicalstatus of the river is determined,changes and trends of the rivercan be tracked, and effectivenessof responses measured.
If management of our rivers is to
Based on the above, the RiverHealth Programme uses indices orcomposite indicators to report onthe current state of the river, thecauses of change, the desired stateof the river, and makes recommen-dations for managing river systems.
In addition to the indicators usedduring monitoring, flow and waterquality data are needed to interpretbiological information.
be effective, there must be indica-tors that can:- - discern changes and trends- - provide early warning of emerg-
ing problems and - - provide an understanding of the
ecosystem processes
Several key indicators may becombined together to form anindex.
Index of Habitat Integrity (IHI)
The availability and diversity ofhabitats are major determinants ofthe biota that will be found in aspecific ecosystem. Knowledge ofhabitat quality is important in anoverall assessment of ecosystemhealth. The IHI assesses theimpact of disturbances such aswater abstraction, flow regulation
and river channel modification onthe riparian zone and in-streamhabitats. The IHI icon shows theriver and river bank which arecolour-coded according to thestate of the in-stream and riparianhabitat, respectively.
Geomorphological Index (GI)
Geomorphological processes formthe physical template upon whichecosystems exist and function.
The geomorphological indexassesses river channel conditionand channel stability. The channelcondition is based on the channel
impacts evident in a river reach,e.g. weirs, bridges or dams, andthe type of channel, e.g. bedrockor alluvial. Channel stability isbased on the potential for erosionof the riverbanks and bed.
State of the Environment (SOE) reporting arosefrom the United Nations Conference onEnvironment and Development (UNCED) in Rio deJaneiro in 1992. SOE reporting provides environ-mental information for decision-making at all levelsof administration, from local to international. State-of-Rivers (SoR) reports supply the river componentof this knowledge base.(continued on facing page)
STATE OF ENVIRONMENTREPORTING
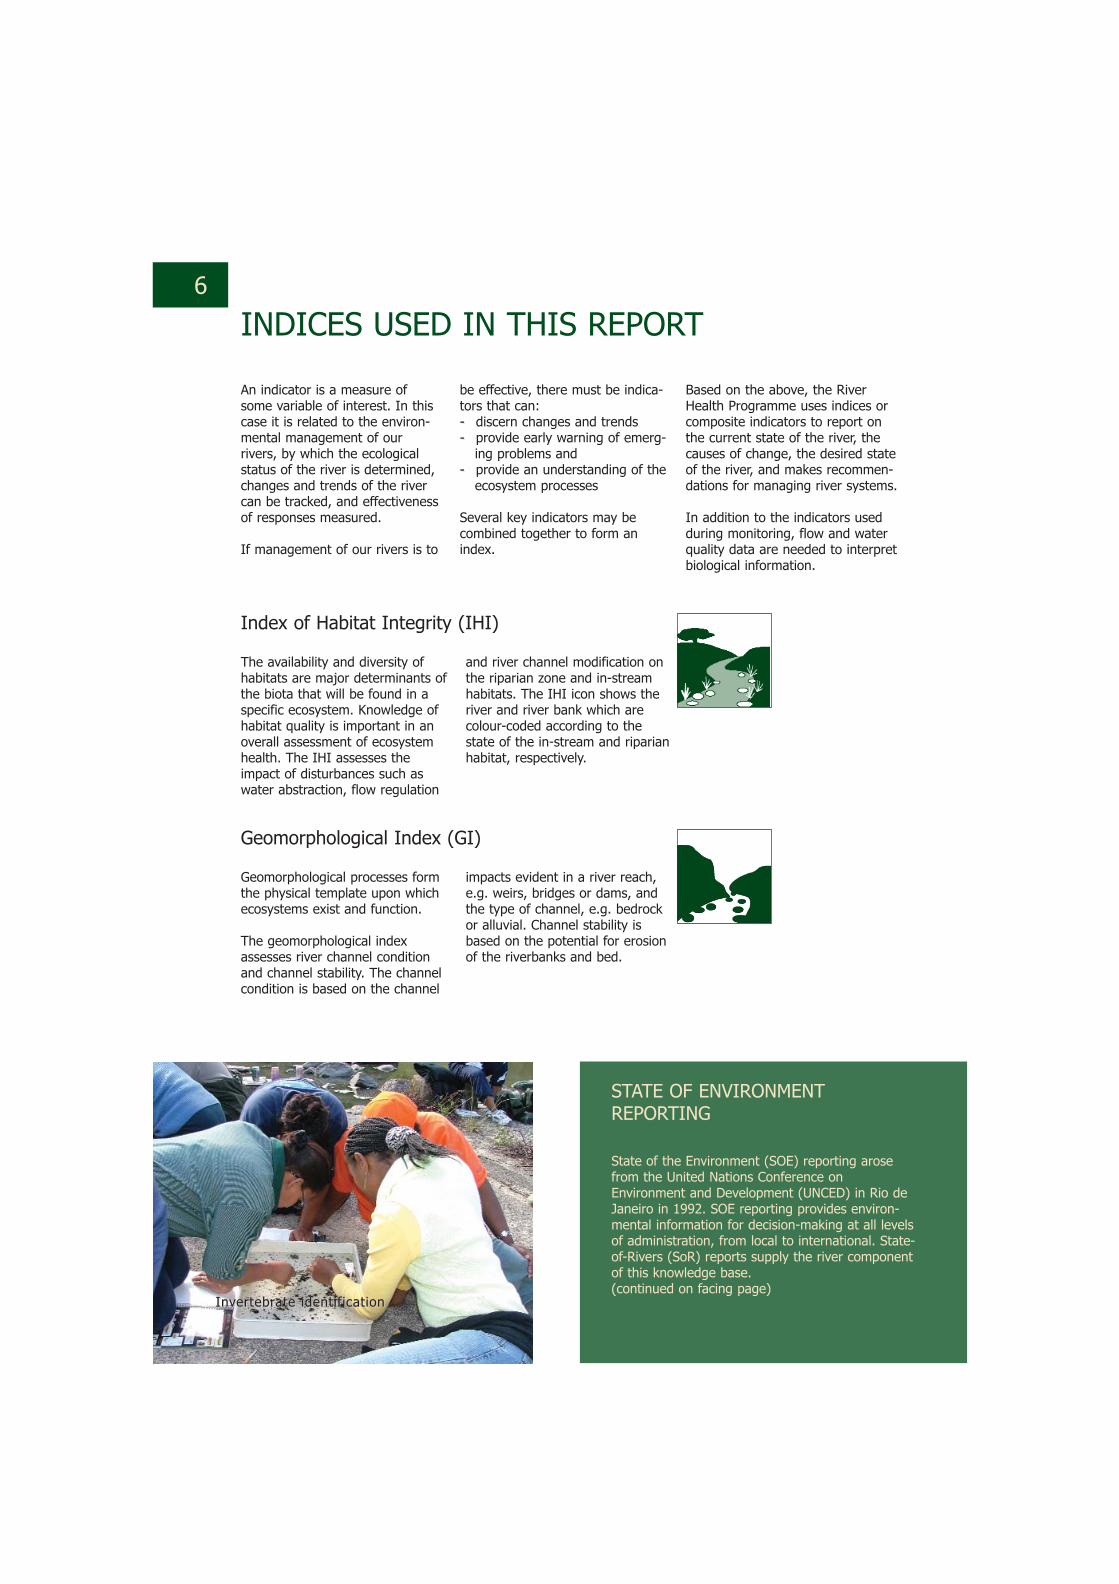
IInnvveerrtteebbrraattee iiddeenntt ii ff iiccaatt iioonn
Fish Assemblage Integrity Index (FAII)
Fish live longer than invertebratesand are more mobile, so they aregood indicators of longer-termchanges in a river reach. TheFAII assesses fish assemblages inhomogenous fish habitat seg-ments within the reach of a river.
The result of theFAII is expressed as a ratio ofobserved conditionsversus theoretical near-natural conditions.
South African Scoring System (SASS)
Aquatic invertebrates are sensi-tive to changes in water qualityand habitat in their immediatesurroundings. Their life cyclesare short, so changes in thecomposition and structure ofaquatic invertebrate communitiesare often the first signs ofchange in overall river condition.
The SASS is basedon the presence offamilies of aquaticinvertebrate fauna and their sensi-tivity to water quality changes.SASS results include an index scoreand the average score per taxon(ASPT).
Riparian Vegetation Index (RVI)
The plants growing near or onthe banks of rivers and streamsmake up the riparian vegetation.Riparian vegetation is adapted tothe occasional periods of inunda-tion that occur in the riparianarea, as well as the specific soiland microclimate conditionsassociated with rivers. Riparianvegetation is usually more bio-logically diverse than that of surrounding areas, and is impor-tant for the ecological functioningof the river.
The RVI determinesthe status of riparianvegetation withinriver reaches and isbased on a number of criteria. Theseinclude species composition, structureand extent of cover, presence ofjuvenile indigenous riparian species,cover of invasive alien vegetation,and human influences, such as veg-etation removal and construction.The Eastern Cape RHP team devel-oped a modified index to assessriparian vegetation, the IntegratedRiparian Vegetation Index (IRVI).
SOE reports:
-- Provide information for better management of sus-tainable development
-- Compare the environmental performances of differentareas
-- Increase public awareness of the environment anddevelopment
-- Empower individuals and organisations to improvetheir environment and quality of life
(continued on next page)
7
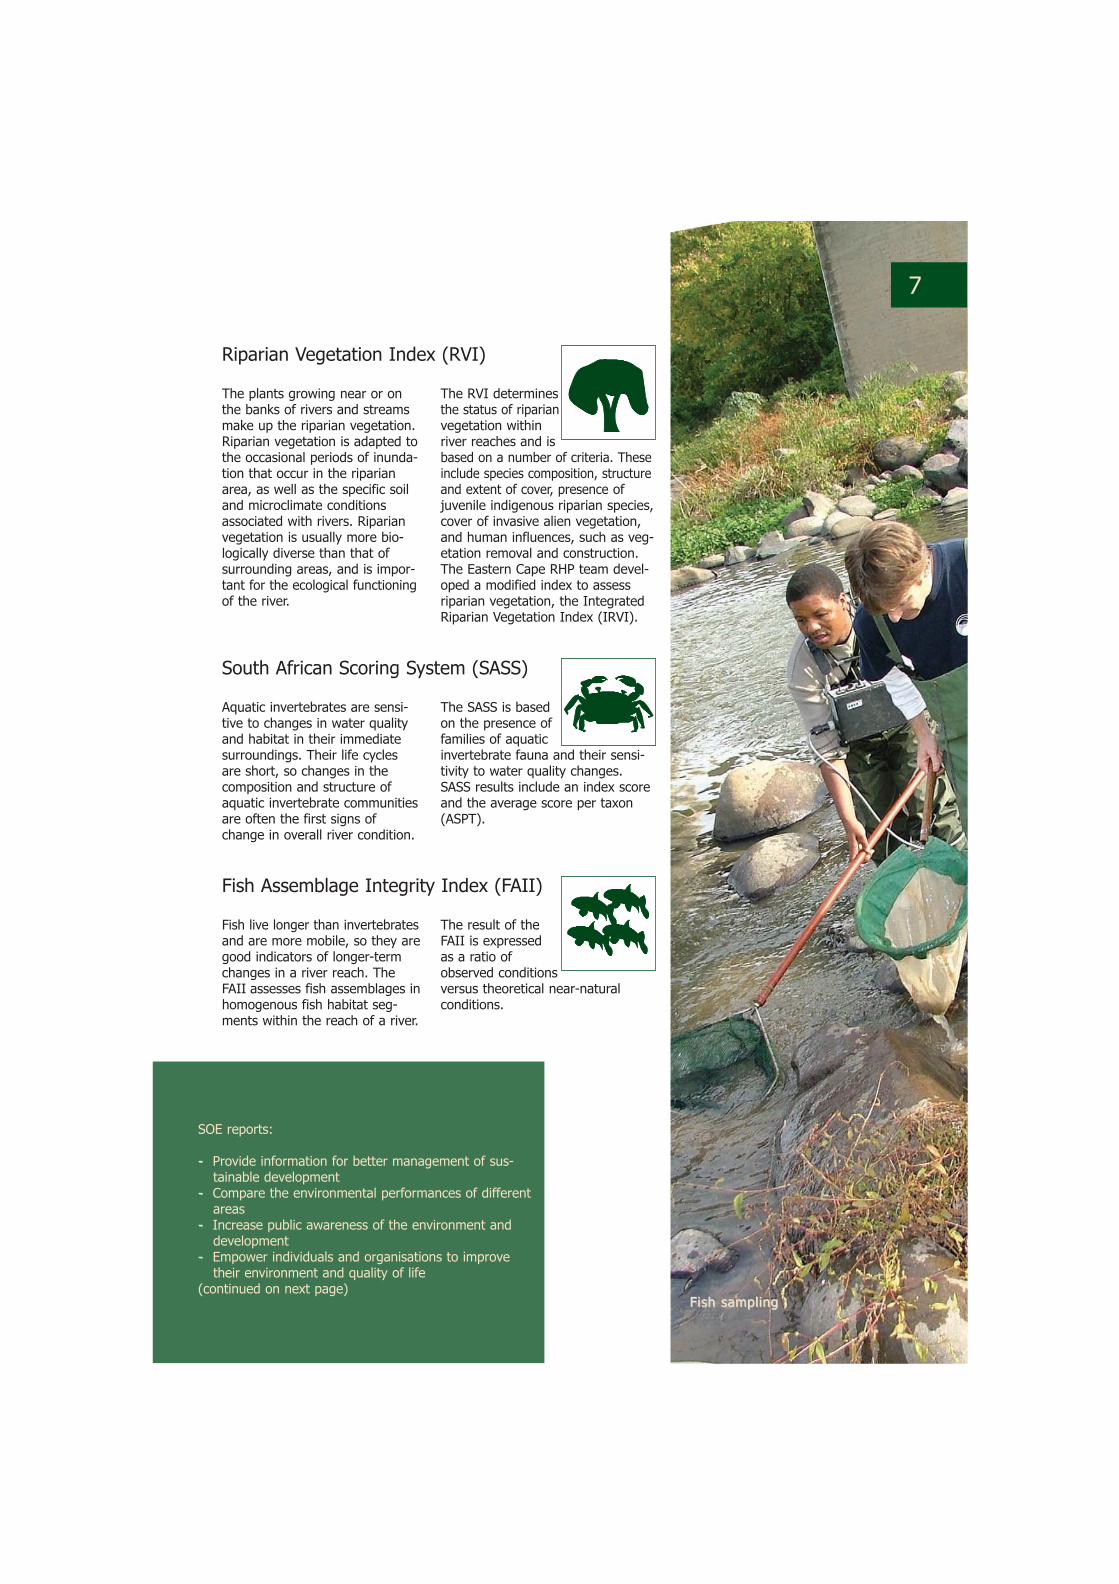
FFiisshh ssaammppll iinngg

8
RIVER HEALTH CATEGORIES
STATE OF ENVIRONMENT REPORTING (CONTINUED)
SOE reports use a philosophybased on cause and effect, knownas the “Driving force-Pressure-State-Impact-Response” frame-work. This describes the humanactivities that create pressures onthe environment, the current stateand trends in environmental condi-tions, the consequences for sus-tainability and human livelihoods,and the policies and actions inplace to manage the environment.This way of presenting informationis comprehensive and easy tounderstand, especially if specificindicators represent changes inpressures, states and responses.
State of Environment reportsanswer questions such as:
-- How are the condition and func-tioning of the environmentchanging?
-- What is causing these changes?-- What are the consequences of
these changes?-- What is our response and are
our actions effective?-- What more can we do to
improve river health and, there-fore, the quality and flow ofaquatic goods and services fromwhich people benefit?
The identification of common linkagesin the SA National SOE Report sup-ports alignment and future harmonywith other environmental tools. Twothemes deal with water issues:-- The “Inland Water Theme”
addresses specific FreshwaterEcosystem Integrity Issues,including Riparian Vegetation,Aquatic macro-invertebrate com-position, Fish Communitgy Healthand Aquatic Habitat Integrity
-- The “National Marine, Coastal andEstuarine Environment” addressesseveral Resource Quality Issuesfor which indicators have beendeveloped (Estuarine Health Index,
Once river health indices aremeasured, they need to be inter-preted within a framework thatallows comparison of the health ofmonitoring sites and even riversystems.
The results obtained by applyingthe biological and habitat indicesduring river surveys provide theinformation that determines thehealth of the river. A river healthcategorisation system is used forstandardisation purposes, allowingcomparison of the health of differ-ent river systems.
Each of the river health categories(facing page) is associated with alevel of ecosystem health. Theecosystem health is linked to the
potential of a river system to offera particular range of ecosystemservices. A ‘fair’ or ‘poor’ river mayhave lost its potential for mostuses, e.g. tourism, conservationand even agriculture. It might,however be acceptable for a riverto be ‘fair’ if a higher socio-eco-nomic return is deemed moreimportant than the loss of someuses. This trade-off should beagreed upon by all involved stake-holders, as long as sustainable useand ecosystem function are notcompromised.
The present health of a river is ameasure of the ecological state ofthe river when surveyed, classifiedaccording to the river health classesshown opposite. The diagrambelow portray present health.
The desired health of a river is thebest possible future ecological statebased on ecological considerations,sustainable development and management actions. The diagrambelow portray desired health.
Desired Health
9
Pollutant Loading entering theSea, Blue Flag Beaches,Concentration of Heavy Metals inSediments and Biological Tissues)
The RHP has built on the SOEexperience and has developed theSoR report layout for providinginformation on the ecological stateof rivers.
The SoR process consists of rivermonitoring, data analysis andinformation dissemination to man-agers and decision makers. TheSoR thus provides ecologicallysound management informationwhile also informing and educatingpeople about the health andimportance of their rivers.
RHP information is available asraw data, in interpreted report format or as posters. Eventually theRHP will cover all of South Africa'smajor river systems. The RHP willalso revisit rivers periodically inorder to provide information onlong-term trends in the health ofriver systems.
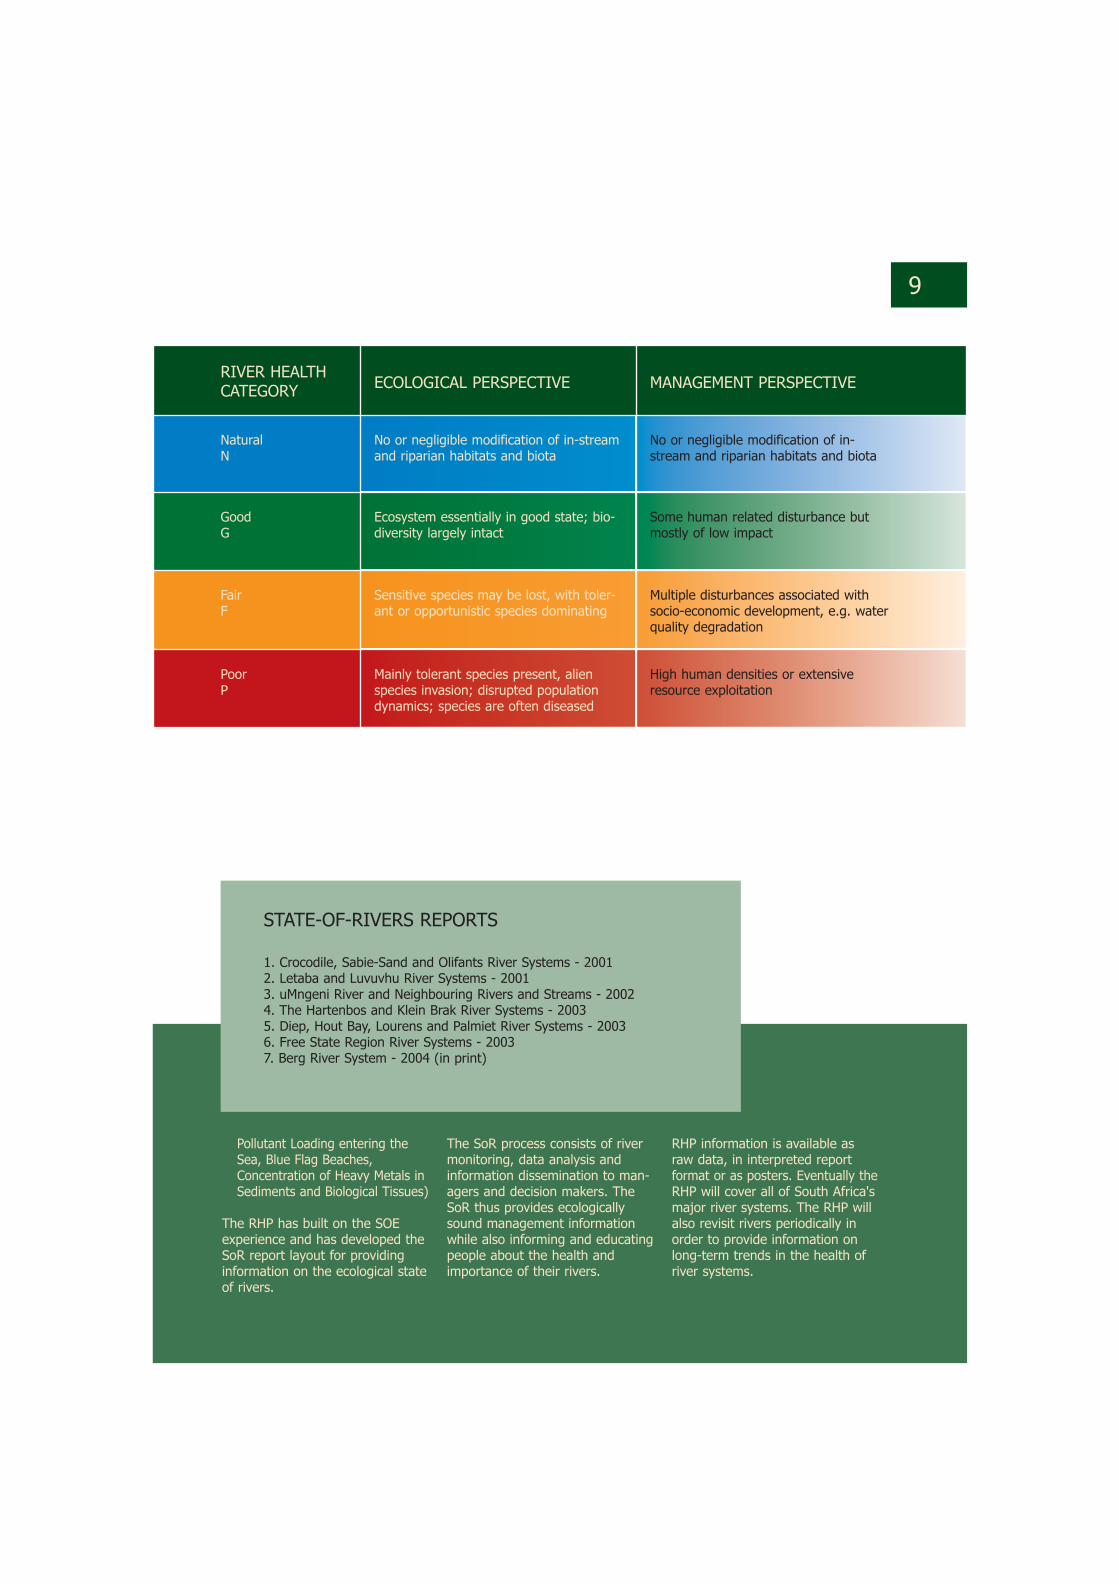
RIVER HEALTHCATEGORY ECOLOGICAL PERSPECTIVE MANAGEMENT PERSPECTIVE
NaturalN
No or negligible modification of in-streamand riparian habitats and biota
No or negligible modification of in-stream and riparian habitats and biota
GoodG
Ecosystem essentially in good state; bio-diversity largely intact
Some human related disturbance butmostly of low impact
FairF
Sensitive species may be lost, with toler-ant or opportunistic species dominating
Multiple disturbances associated withsocio-economic development, e.g. waterquality degradation
PoorP
Mainly tolerant species present, alienspecies invasion; disrupted populationdynamics; species are often diseased
High human densities or extensiveresource exploitation
STATE-OF-RIVERS REPORTS
1. Crocodile, Sabie-Sand and Olifants River Systems - 20012. Letaba and Luvuvhu River Systems - 20013. uMngeni River and Neighbouring Rivers and Streams - 20024. The Hartenbos and Klein Brak River Systems - 20035. Diep, Hout Bay, Lourens and Palmiet River Systems - 20036. Free State Region River Systems - 20037. Berg River System - 2004 (in print)
10
OVERVIEW OF THE BUFFALO RIVER CATCHMENT
Terrain
The Buffalo River has its source inthe seeps and sponges of theAmatola Mountains at an altitude of1200 m. The river is 126 kilometreslong and drains a catchment of1287 square kilometres.
From its source, the river descendsthrough indigenous forest in adeeply-incised channel, flanked byrock cliffs up to 120 metres high.The quality of these headwaters isgood.
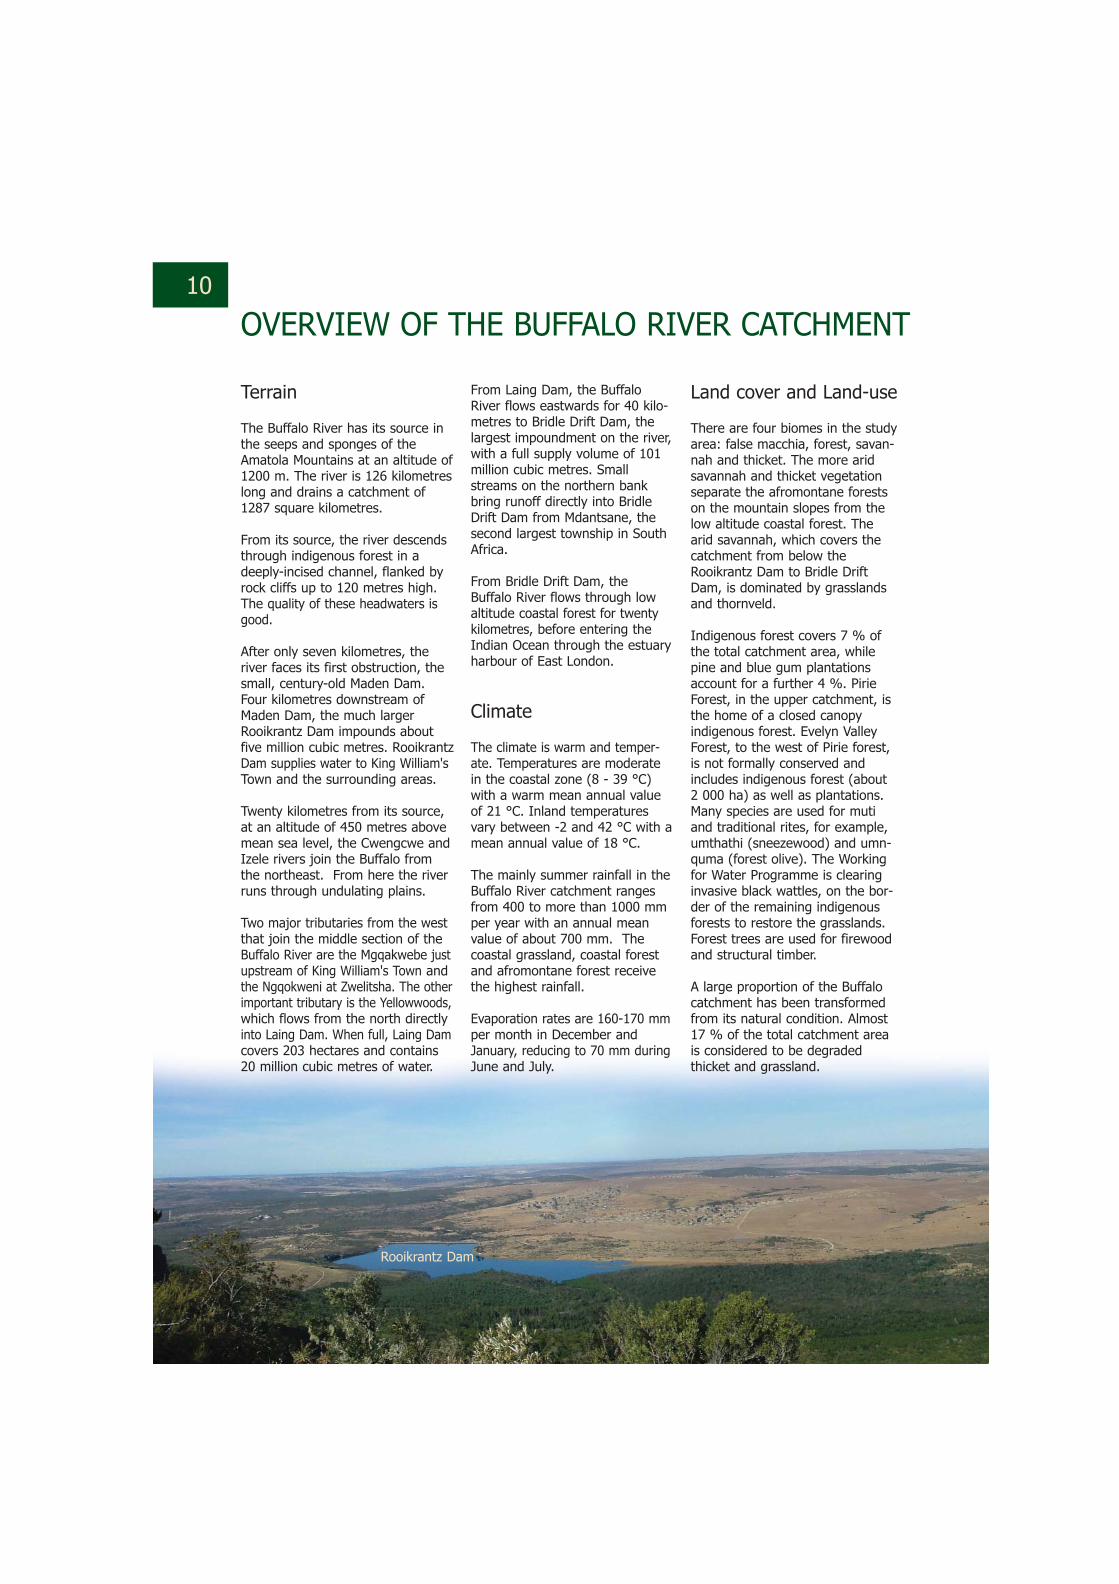
After only seven kilometres, theriver faces its first obstruction, thesmall, century-old Maden Dam.Four kilometres downstream ofMaden Dam, the much largerRooikrantz Dam impounds aboutfive million cubic metres. RooikrantzDam supplies water to King William'sTown and the surrounding areas.
Twenty kilometres from its source,at an altitude of 450 metres abovemean sea level, the Cwengcwe andIzele rivers join the Buffalo fromthe northeast. From here the riverruns through undulating plains.
Two major tributaries from the westthat join the middle section of theBuffalo River are the Mgqakwebe justupstream of King William's Town andthe Ngqokweni at Zwelitsha. The otherimportant tributary is the Yellowwoods,which flows from the north directlyinto Laing Dam. When full, Laing Damcovers 203 hectares and contains20 million cubic metres of water.
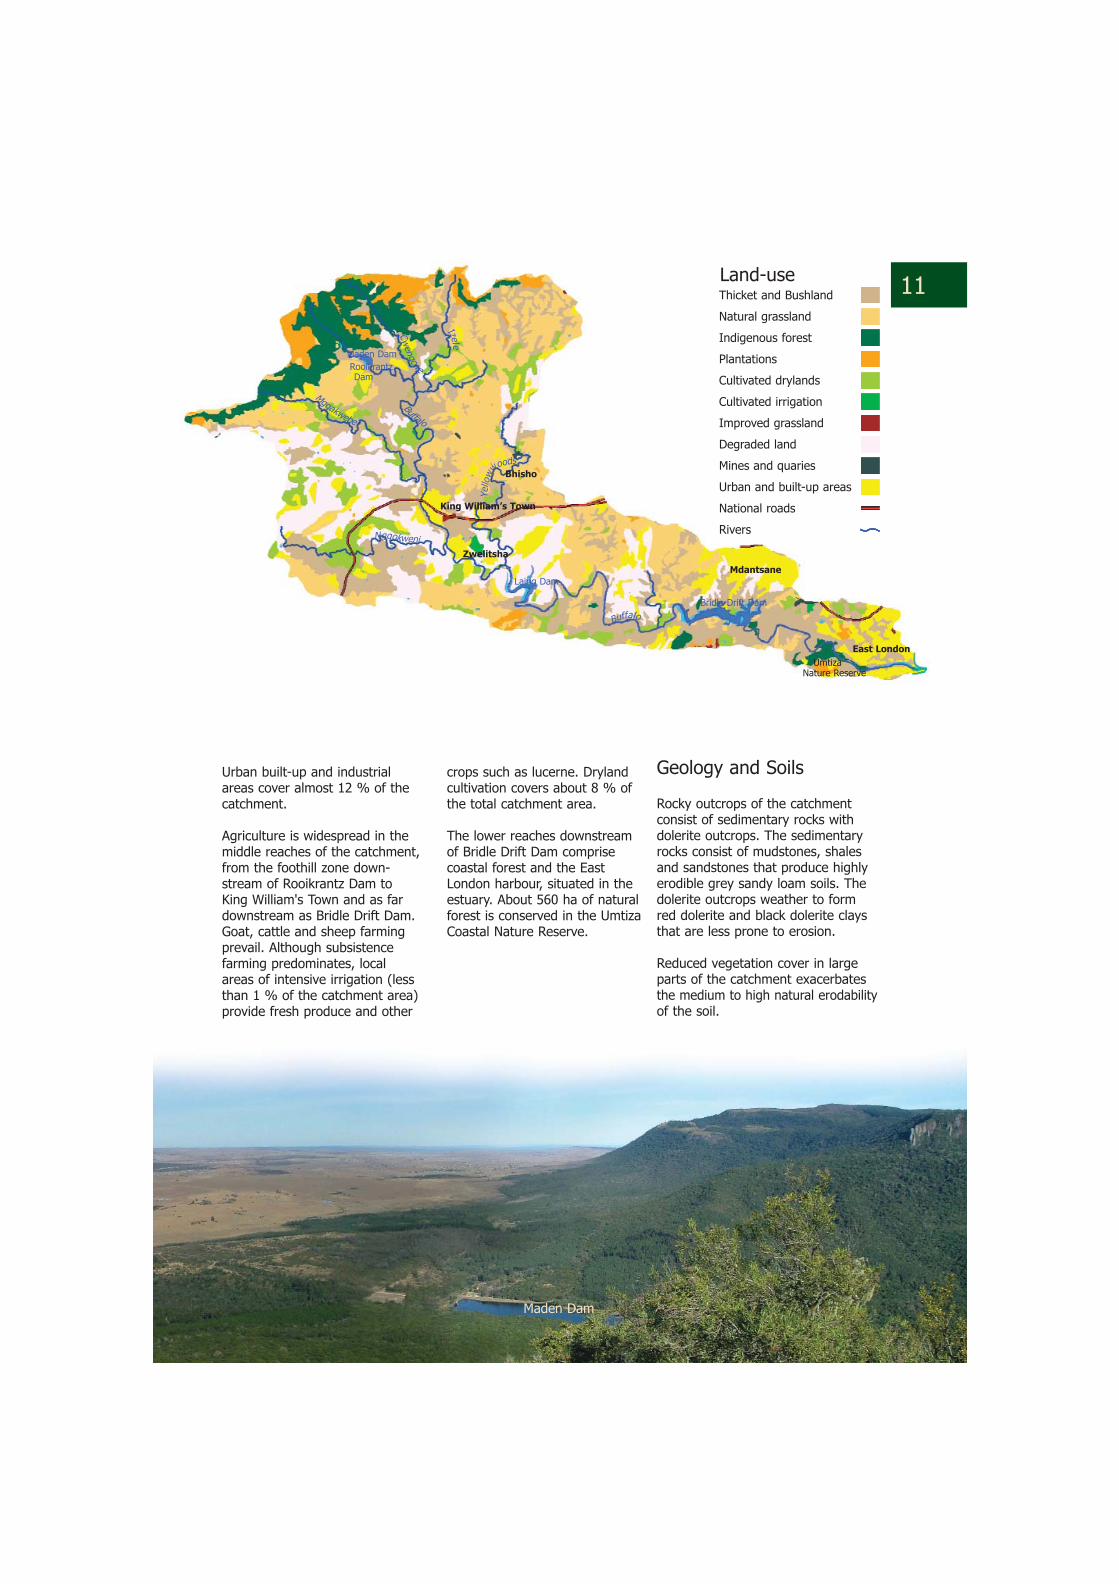
Land cover and Land-use
There are four biomes in the studyarea: false macchia, forest, savan-nah and thicket. The more aridsavannah and thicket vegetationseparate the afromontane forestson the mountain slopes from thelow altitude coastal forest. Thearid savannah, which covers thecatchment from below theRooikrantz Dam to Bridle DriftDam, is dominated by grasslandsand thornveld.
Indigenous forest covers 7 % ofthe total catchment area, whilepine and blue gum plantationsaccount for a further 4 %. PirieForest, in the upper catchment, isthe home of a closed canopyindigenous forest. Evelyn ValleyForest, to the west of Pirie forest,is not formally conserved andincludes indigenous forest (about2 000 ha) as well as plantations.Many species are used for mutiand traditional rites, for example,umthathi (sneezewood) and umn-quma (forest olive). The Workingfor Water Programme is clearinginvasive black wattles, on the bor-der of the remaining indigenousforests to restore the grasslands.Forest trees are used for firewoodand structural timber.
A large proportion of the Buffalocatchment has been transformedfrom its natural condition. Almost17 % of the total catchment areais considered to be degradedthicket and grassland.
From Laing Dam, the BuffaloRiver flows eastwards for 40 kilo-metres to Bridle Drift Dam, thelargest impoundment on the river,with a full supply volume of 101million cubic metres. Smallstreams on the northern bankbring runoff directly into BridleDrift Dam from Mdantsane, thesecond largest township in SouthAfrica.
From Bridle Drift Dam, theBuffalo River flows through lowaltitude coastal forest for twentykilometres, before entering theIndian Ocean through the estuaryharbour of East London.
Climate
The climate is warm and temper-ate. Temperatures are moderatein the coastal zone (8 - 39 °C)with a warm mean annual valueof 21 °C. Inland temperaturesvary between -2 and 42 °C with amean annual value of 18 °C.
The mainly summer rainfall in theBuffalo River catchment rangesfrom 400 to more than 1000 mmper year with an annual meanvalue of about 700 mm. Thecoastal grassland, coastal forestand afromontane forest receivethe highest rainfall.
Evaporation rates are 160-170 mmper month in December andJanuary, reducing to 70 mm duringJune and July.
Rooikrantz Dam
Geology and Soils
Rocky outcrops of the catchmentconsist of sedimentary rocks withdolerite outcrops. The sedimentaryrocks consist of mudstones, shalesand sandstones that produce highlyerodible grey sandy loam soils. Thedolerite outcrops weather to formred dolerite and black dolerite claysthat are less prone to erosion.
Reduced vegetation cover in largeparts of the catchment exacerbatesthe medium to high natural erodabilityof the soil.
crops such as lucerne. Drylandcultivation covers about 8 % ofthe total catchment area.
The lower reaches downstreamof Bridle Drift Dam comprisecoastal forest and the EastLondon harbour, situated in theestuary. About 560 ha of naturalforest is conserved in the UmtizaCoastal Nature Reserve.
Urban built-up and industrialareas cover almost 12 % of thecatchment.
Agriculture is widespread in themiddle reaches of the catchment,from the foothill zone down-stream of Rooikrantz Dam toKing William's Town and as fardownstream as Bridle Drift Dam.Goat, cattle and sheep farmingprevail. Although subsistencefarming predominates, localareas of intensive irrigation (lessthan 1 % of the catchment area)provide fresh produce and other
11Thicket and Bushland
Natural grassland
Indigenous forest
Plantations
Cultivated drylands
Cultivated irrigation
Improved grassland
Degraded land
Mines and quaries
Urban and built-up areas
National roads
Rivers
East London
Zwelitsha
Bhisho
King William’s Town
Buffalo
Ngqokweni
Mgqakwebe
Cwengcwe
Izele
Maden DamRooikrantz
Laing Dam
Bridle Drift Dam
Mdantsane
UmtizaNature Reserve
Yello
w
woods
Dam
Buffalo
Land-use
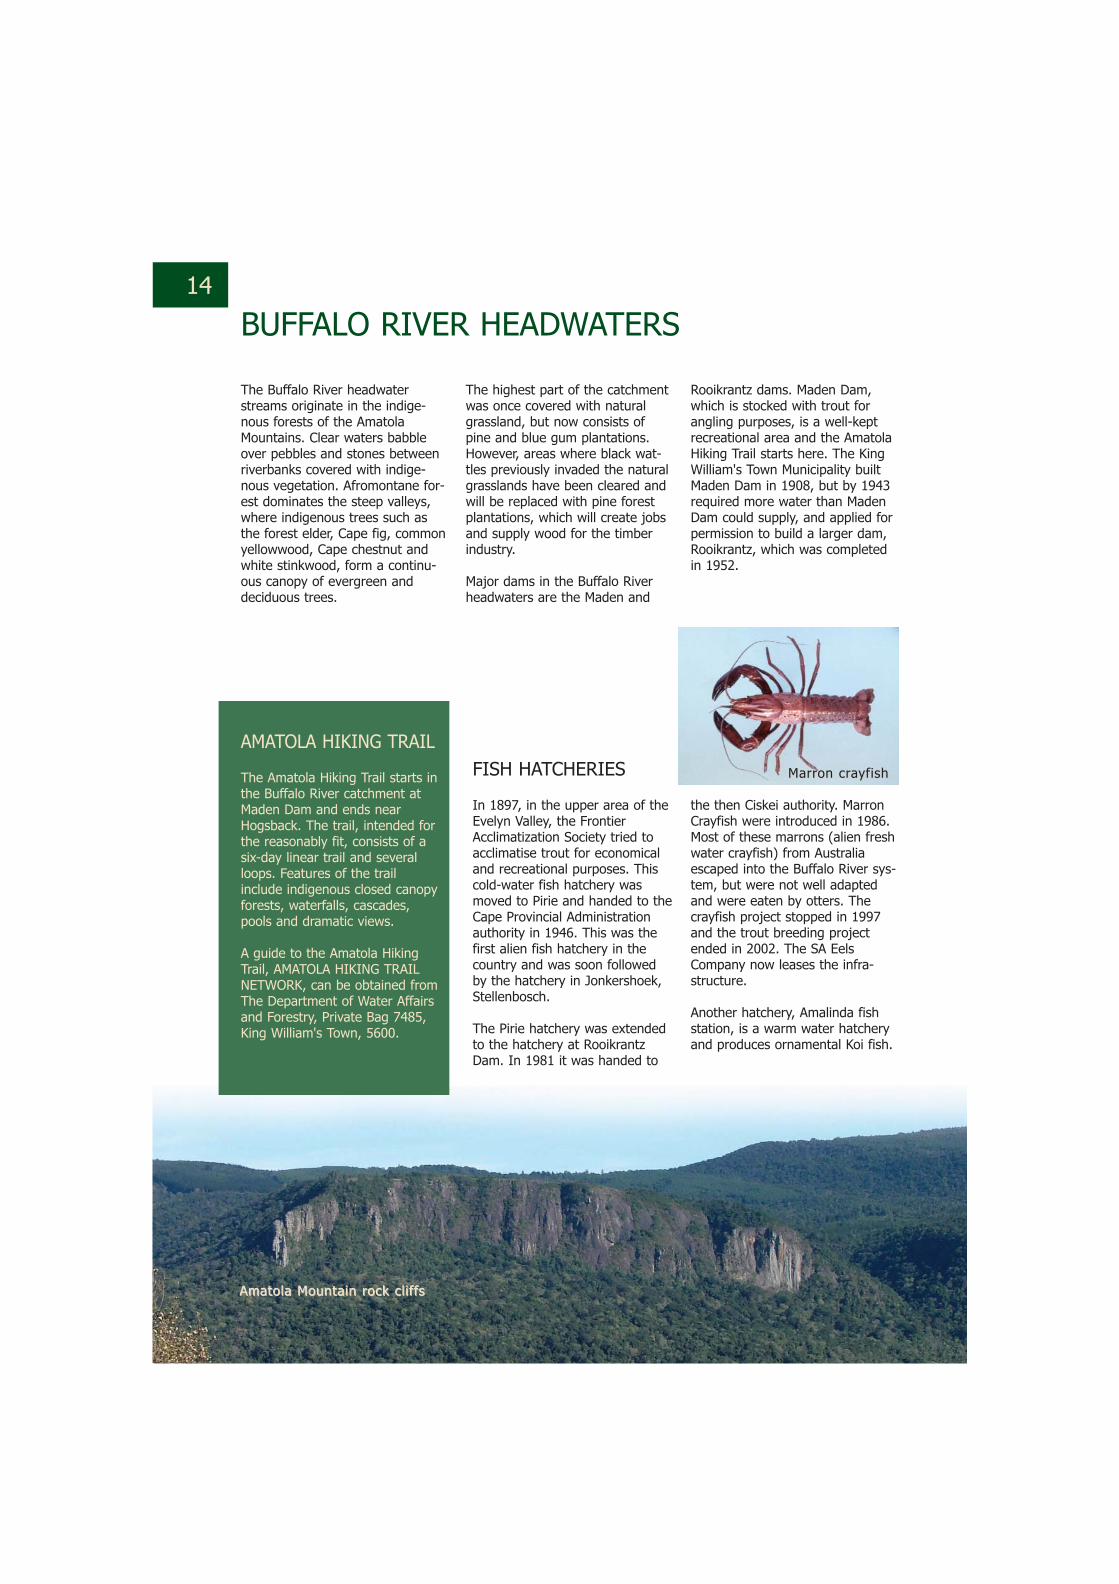
Maden Dam

12
OVERVIEW (CONTINUED)
Social Profile
The Buffalo catchment, with approxi-mately 570 000 inhabitants, has one of the highest population densities inthe Eastern Cape (440 persons persquare kilometre), although more than a third of the people live in low-density rural areas (Census 2001).The population density is highest in the middle and lower reaches of thecatchment (as much as 1 000 peopleper square kilometre). The largesttowns are East London, Bhisho, KingWilliam's Town, Zwelitsha andMdantsane.
Expanding townships put pressure on water and waste systems, whichcannot cope with the demand:
Economic Profile and Education
The Buffalo River catchment lacks significantexploitable mineral resources.The coastal zone is commercially important fortourism, fishing and related activities. It alsofulfils critical functions as spawning grounds,nurseries and feeding grounds for fish andmarine organisms. The value to tourism is esti-mated at more than R300 million per year inthe Buffalo City Municipal area. According tothe Buffalo City Municipality Master Plan surveydata, 72 % of all visitors identified the beachesas the most enjoyed facility in the area. If thepopular beaches could obtain Blue Flag Beachstatus it would further promote tourism in thearea (see page 33).
Community, social and personal services arethe main source of employment:
Type of Water Supply Percentage ofPopulation
Clean piped water in the house 30 %
Standpipe in the yard 30 %
Standpipe within 200 metres 18 %
Standpipe further than 200 metres 16 %
Boreholes, springs, rain tanks, dams,pools or rivers
6 %
Type of Sanitation
Flush toilet 64 %
Pit latrine (ventilated and unventilated) 25 %
Bucket, Chemical toilet and Septic tank 3 %
None 8 %
Employment Sector Percentage ofPopulation
Community, social and personalservices
28.2 %
Manufacturing 17.8 %
Trade 15.4 %
Private households 8.6 %
Financial, insurance, real estate andbusiness services
8.4 %
Construction 4.7 %
Transport and communication 4.3 %
Agriculture, forestry and fishing 2.0 %
Other and undefined 10.6 %

13
Amatola Water Transfer Scheme
The Buffalo River catchment is a densely populatedregion as a result of several historical socio-politicalfactors. The demand on water resources due to thehigh population had already approached totalexploitation in the early 1980s. Solutions includedthe Amatola Water Transfer Scheme and thereclaiming of water from sewage effluent. TheAmatola inter-basin scheme transfers water fromthe Wriggleswade Dam to KwaNkwebu River, anupper branch of the Yellowwoods tributary to theBuffalo River. Wriggleswade Dam is situated on theKubusi River, a tributary to the Great Kei River, tothe northwest of the Buffalo Catchment. Water ispresently transferred about once in five years dur-ing exceptionally dry spells. This transfer schemewill be used more frequently as the population andhence demand increases.
While two thirds of the inhabitants of work-ing age (15 to 65 years) have no formalincome, half of them consider themselvesto be unemployed. Less than 10 % eithercannot find work or choose not to work.Almost 50 % of men and 43 % of womenare either fully employed or studying. Themean income of those who are employed isabout R32 000 per year. More than 70 %of the population with income earn lessthan this mean annual. Although there isno big gender difference in the numbers ofthose unemployed, the mean annualincome of women is almost R7 000 lessthan that of men.
Interestingly, more women than men arenow obtaining a tertiary education.
Level of Education Percentage ofPopulation
Tertiary 5 %
Grade 6 to 12 44 %
Grade 1 to 5 34 %
None 17 %
14
BUFFALO RIVER HEADWATERS
The Buffalo River headwaterstreams originate in the indige-nous forests of the AmatolaMountains. Clear waters babbleover pebbles and stones betweenriverbanks covered with indige-nous vegetation. Afromontane for-est dominates the steep valleys,where indigenous trees such asthe forest elder, Cape fig, commonyellowwood, Cape chestnut andwhite stinkwood, form a continu-ous canopy of evergreen anddeciduous trees.
The highest part of the catchmentwas once covered with naturalgrassland, but now consists ofpine and blue gum plantations.However, areas where black wat-tles previously invaded the naturalgrasslands have been cleared andwill be replaced with pine forestplantations, which will create jobsand supply wood for the timberindustry.
Major dams in the Buffalo Riverheadwaters are the Maden and
Rooikrantz dams. Maden Dam,which is stocked with trout forangling purposes, is a well-keptrecreational area and the AmatolaHiking Trail starts here. The KingWilliam's Town Municipality builtMaden Dam in 1908, but by 1943required more water than MadenDam could supply, and applied forpermission to build a larger dam,Rooikrantz, which was completedin 1952.
FISH HATCHERIES
In 1897, in the upper area of theEvelyn Valley, the FrontierAcclimatization Society tried toacclimatise trout for economicaland recreational purposes. Thiscold-water fish hatchery wasmoved to Pirie and handed to theCape Provincial Administrationauthority in 1946. This was thefirst alien fish hatchery in thecountry and was soon followedby the hatchery in Jonkershoek,Stellenbosch.
The Pirie hatchery was extendedto the hatchery at RooikrantzDam. In 1981 it was handed to
the then Ciskei authority. MarronCrayfish were introduced in 1986.Most of these marrons (alien freshwater crayfish) from Australiaescaped into the Buffalo River sys-tem, but were not well adaptedand were eaten by otters. Thecrayfish project stopped in 1997and the trout breeding projectended in 2002. The SA EelsCompany now leases the infra-structure.
Another hatchery, Amalinda fishstation, is a warm water hatcheryand produces ornamental Koi fish.
AMATOLA HIKING TRAIL
The Amatola Hiking Trail starts inthe Buffalo River catchment atMaden Dam and ends nearHogsback. The trail, intended forthe reasonably fit, consists of asix-day linear trail and severalloops. Features of the trailinclude indigenous closed canopyforests, waterfalls, cascades,pools and dramatic views.
A guide to the Amatola HikingTrail, AMATOLA HIKING TRAILNETWORK, can be obtained fromThe Department of Water Affairsand Forestry, Private Bag 7485,King William's Town, 5600.
AAmmaattoollaa MMoouunnttaaiinn rroocckk ccll ii ff ffss
MMaarrrroonn ccrraayyff iisshh

15
WETLANDS
The riparian zone is thearea along a river bank.The four main wetlandtypes in the Buffalo Riverriparian zone are seep,floodplain, marsh and pan.
-- Seeps: 31 are present;14 at crests and 12 atmid slope areas. Several of these havebeen damaged or destroyed by forestry or by alien vegetation, which has a drying effect.
-- Floodplains: 21 are present of which 19 are on the valley floor. Several floodplains occur along the YellowwoodsRiver. They have dried out and werepreviously used as a farmland.
-- Marshes: Two at the mid slope areas.-- Pans: Two on the plains. -- Besides the four wetland types, a small
number of springs were encountered.
Management Suggestions
The landowners need to rehabilitate the seeps byremoving alien vegetation and pine plantations and dealing with the erosion problem caused by over-grazing.
SSeep weteep wet land land
FFllooooddppllaaiinn
16
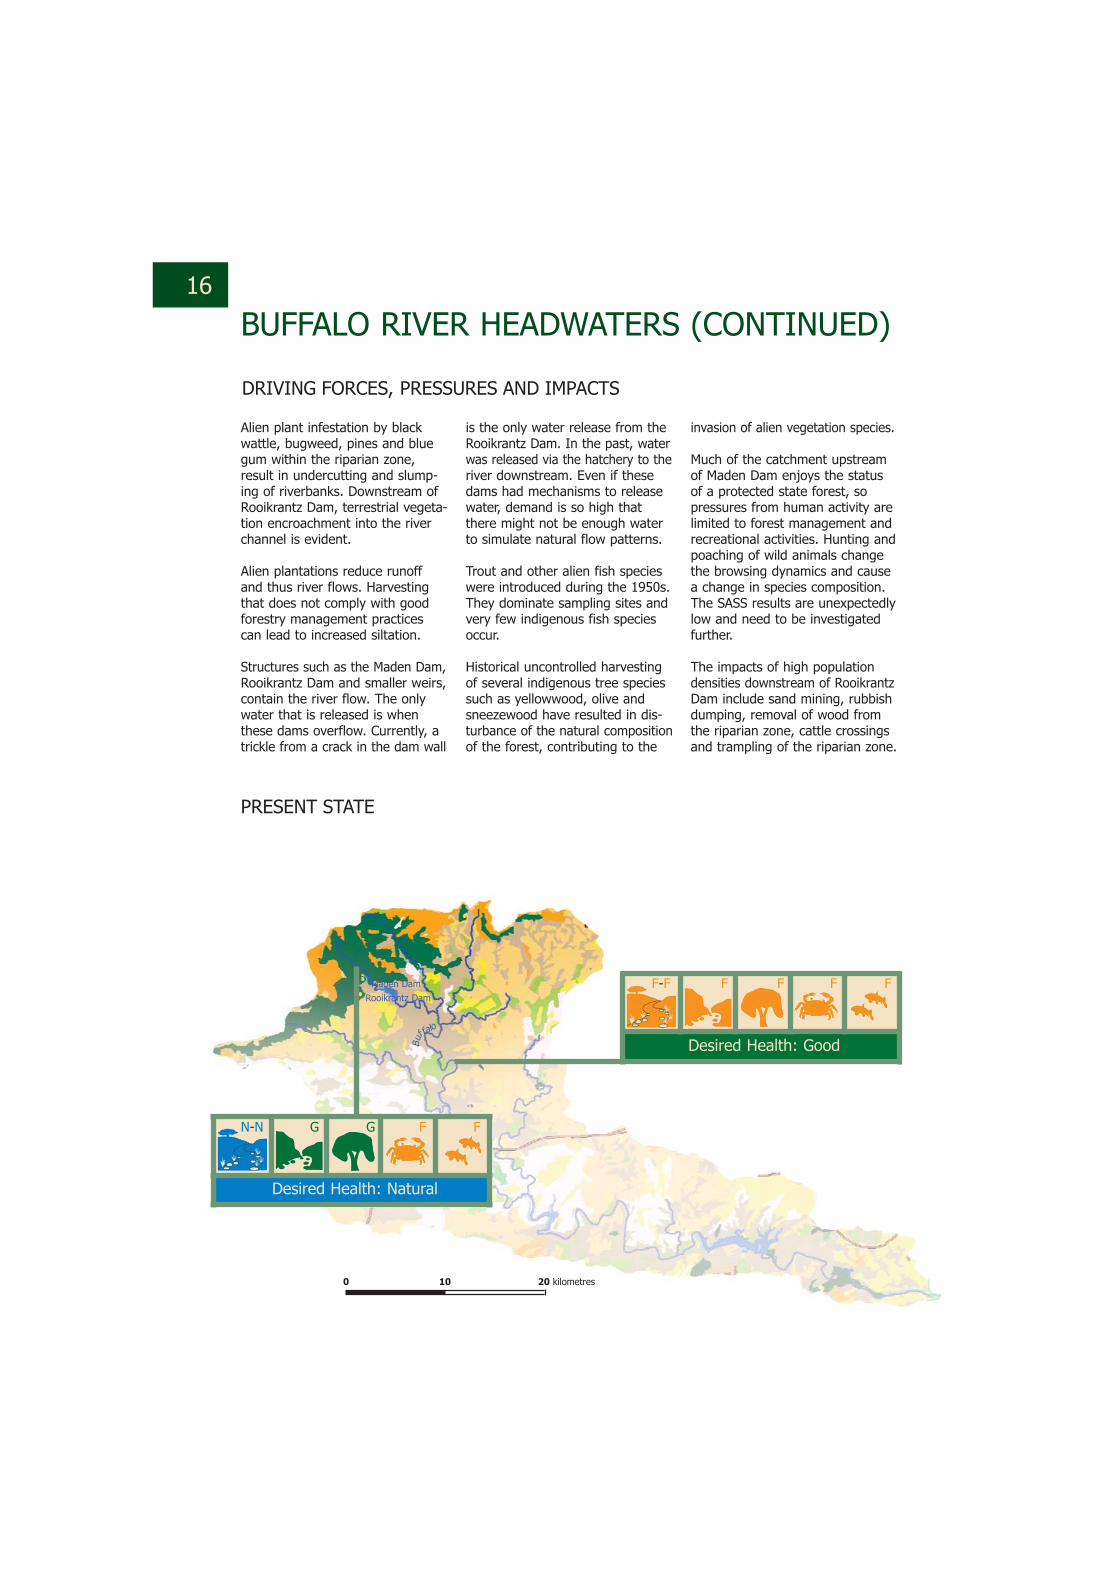
BUFFALO RIVER HEADWATERS (CONTINUED)
Alien plant infestation by blackwattle, bugweed, pines and bluegum within the riparian zone,result in undercutting and slump-ing of riverbanks. Downstream ofRooikrantz Dam, terrestrial vegeta-tion encroachment into the riverchannel is evident.
Alien plantations reduce runoffand thus river flows. Harvestingthat does not comply with goodforestry management practicescan lead to increased siltation.
Structures such as the Maden Dam,Rooikrantz Dam and smaller weirs,contain the river flow. The onlywater that is released is whenthese dams overflow. Currently, atrickle from a crack in the dam wall
Desired Health: Natural
Desired Health: Good
is the only water release from theRooikrantz Dam. In the past, waterwas released via the hatchery to theriver downstream. Even if thesedams had mechanisms to releasewater, demand is so high thatthere might not be enough waterto simulate natural flow patterns.
Trout and other alien fish specieswere introduced during the 1950s.They dominate sampling sites andvery few indigenous fish speciesoccur.
Historical uncontrolled harvestingof several indigenous tree speciessuch as yellowwood, olive andsneezewood have resulted in dis-turbance of the natural compositionof the forest, contributing to the
invasion of alien vegetation species.
Much of the catchment upstreamof Maden Dam enjoys the statusof a protected state forest, sopressures from human activity arelimited to forest management andrecreational activities. Hunting andpoaching of wild animals changethe browsing dynamics and causea change in species composition.The SASS results are unexpectedlylow and need to be investigatedfurther.
The impacts of high populationdensities downstream of RooikrantzDam include sand mining, rubbishdumping, removal of wood fromthe riparian zone, cattle crossingsand trampling of the riparian zone.
DRIVING FORCES, PRESSURES AND IMPACTS
PRESENT STATE
F-F F F F F
N-N G G F F
Maden DamRooikrantz Dam
Bu
ffalo
0 10 20 kilometres
Prevent further encroachment ofalien species into the riparian zone
Apply measures for sensitive man-agement of the indigenous forest
Rehabilite the wetlands by remov-ing alien vegetation and adheringto buffer zones when establishingplantations
Determine through toxicity testingwhy the SASS (invertebrate) scoresdo not reflect the otherwise pristineconditions above Maden Dam
17
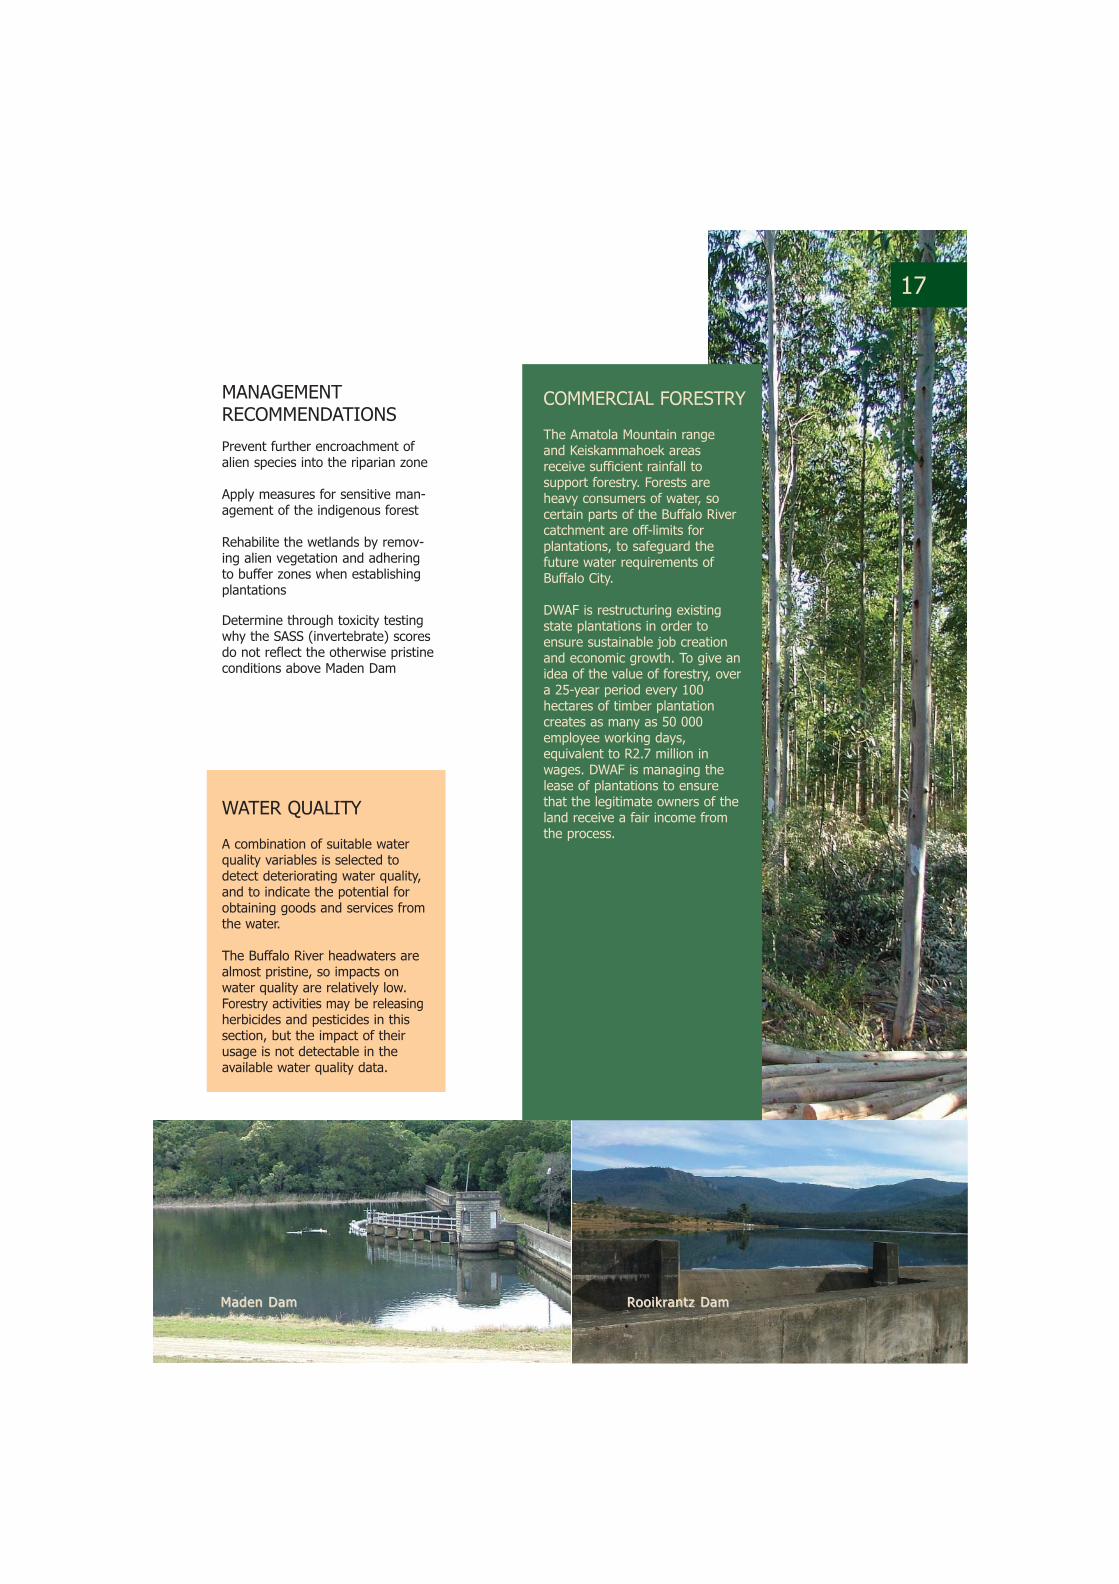
COMMERCIAL FORESTRY
The Amatola Mountain range and Keiskammahoek areasreceive sufficient rainfall to support forestry. Forests areheavy consumers of water, socertain parts of the Buffalo River catchment are off-limits for plantations, to safeguard thefuture water requirements ofBuffalo City.
DWAF is restructuring existingstate plantations in order toensure sustainable job creationand economic growth. To give anidea of the value of forestry, overa 25-year period every 100hectares of timber plantation creates as many as 50 000employee working days, equivalent to R2.7 million inwages. DWAF is managing thelease of plantations to ensurethat the legitimate owners of theland receive a fair income fromthe process.
MANAGEMENTRECOMMENDATIONS
WATER QUALITY
A combination of suitable waterquality variables is selected todetect deteriorating water quality,and to indicate the potential forobtaining goods and services fromthe water.
The Buffalo River headwaters arealmost pristine, so impacts onwater quality are relatively low.Forestry activities may be releasingherbicides and pesticides in thissection, but the impact of theirusage is not detectable in theavailable water quality data.
MMaaddeenn DDaamm RRooooiikkrraannttzz DDaamm
18
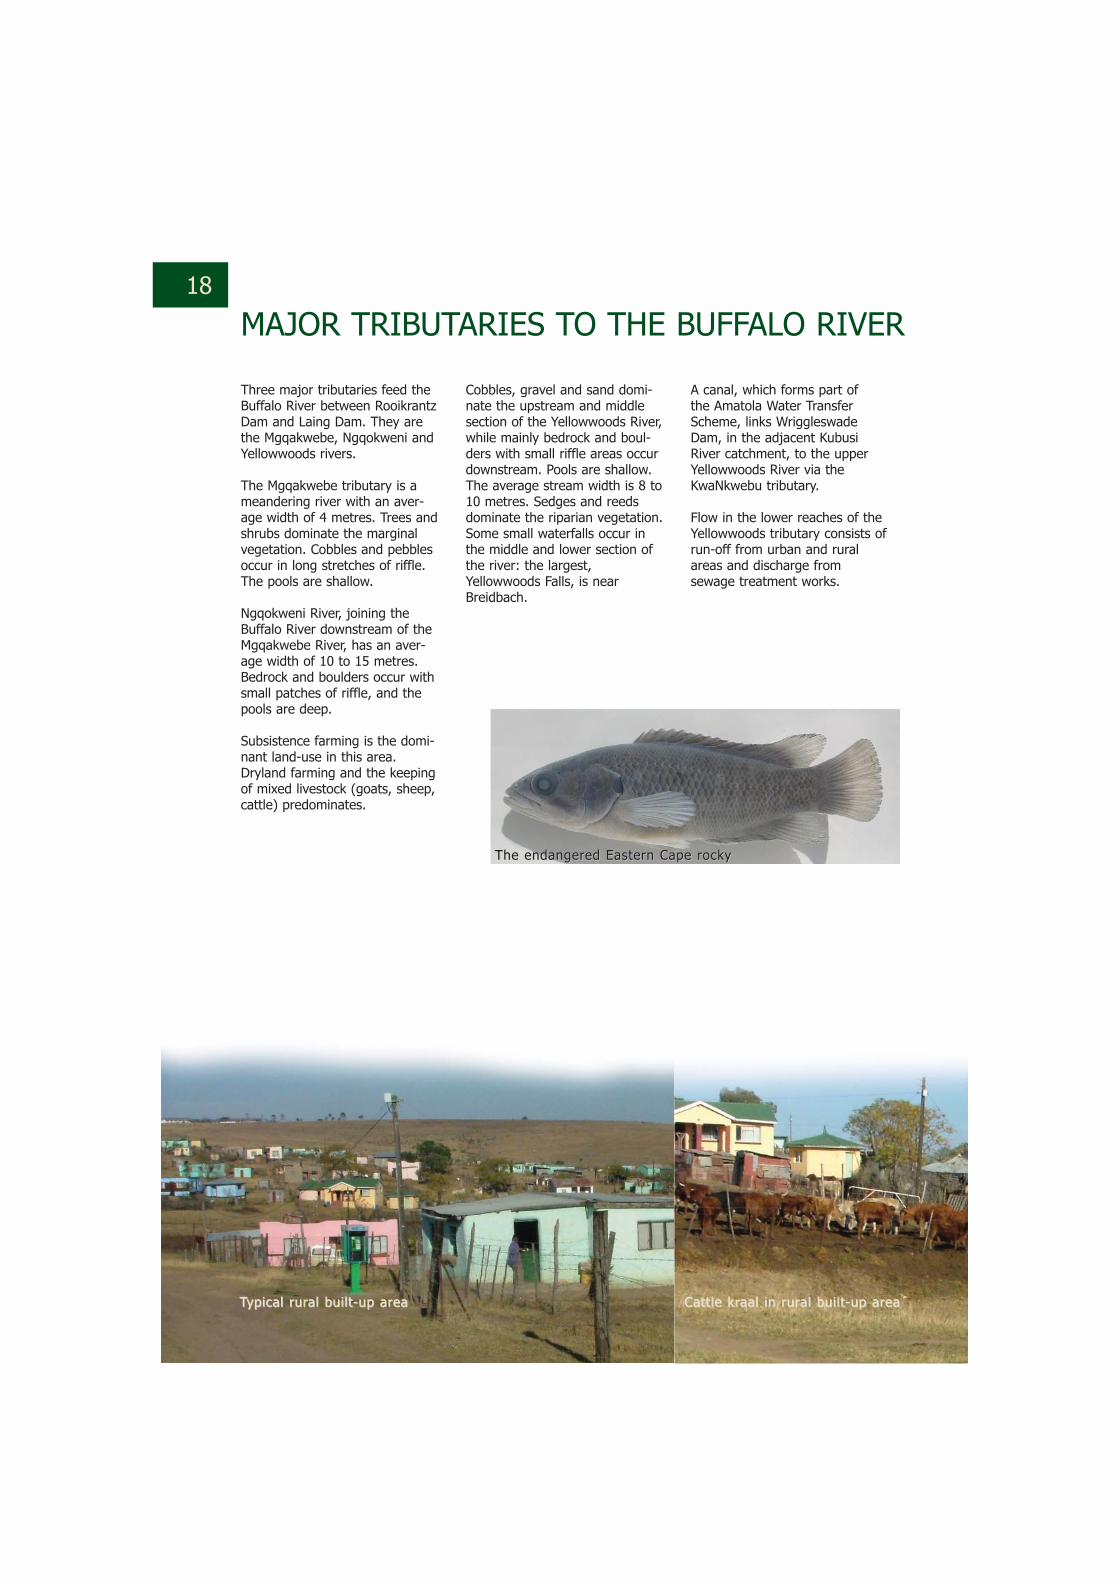
MAJOR TRIBUTARIES TO THE BUFFALO RIVER
Three major tributaries feed theBuffalo River between RooikrantzDam and Laing Dam. They arethe Mgqakwebe, Ngqokweni andYellowwoods rivers.
The Mgqakwebe tributary is ameandering river with an aver-age width of 4 metres. Trees andshrubs dominate the marginalvegetation. Cobbles and pebblesoccur in long stretches of riffle.The pools are shallow.
Ngqokweni River, joining theBuffalo River downstream of theMgqakwebe River, has an aver-age width of 10 to 15 metres.Bedrock and boulders occur withsmall patches of riffle, and thepools are deep.
Subsistence farming is the domi-nant land-use in this area.Dryland farming and the keepingof mixed livestock (goats, sheep,cattle) predominates.
Cobbles, gravel and sand domi-nate the upstream and middlesection of the Yellowwoods River,while mainly bedrock and boul-ders with small riffle areas occurdownstream. Pools are shallow.The average stream width is 8 to10 metres. Sedges and reedsdominate the riparian vegetation.Some small waterfalls occur inthe middle and lower section ofthe river: the largest,Yellowwoods Falls, is nearBreidbach.
A canal, which forms part of the Amatola Water TransferScheme, links WriggleswadeDam, in the adjacent KubusiRiver catchment, to the upperYellowwoods River via theKwaNkwebu tributary.
Flow in the lower reaches of theYellowwoods tributary consists ofrun-off from urban and ruralareas and discharge fromsewage treatment works.
CCaatttt llee kkrraaaall iinn rruurraall bbuuii ll tt--uupp aarreeaaTTyyppiiccaall rruurraall bbuuii ll tt--uupp aarreeaa
TThhee eennddaannggeerreedd EEaasstteerrnn CCaappee rroocckkyy
19
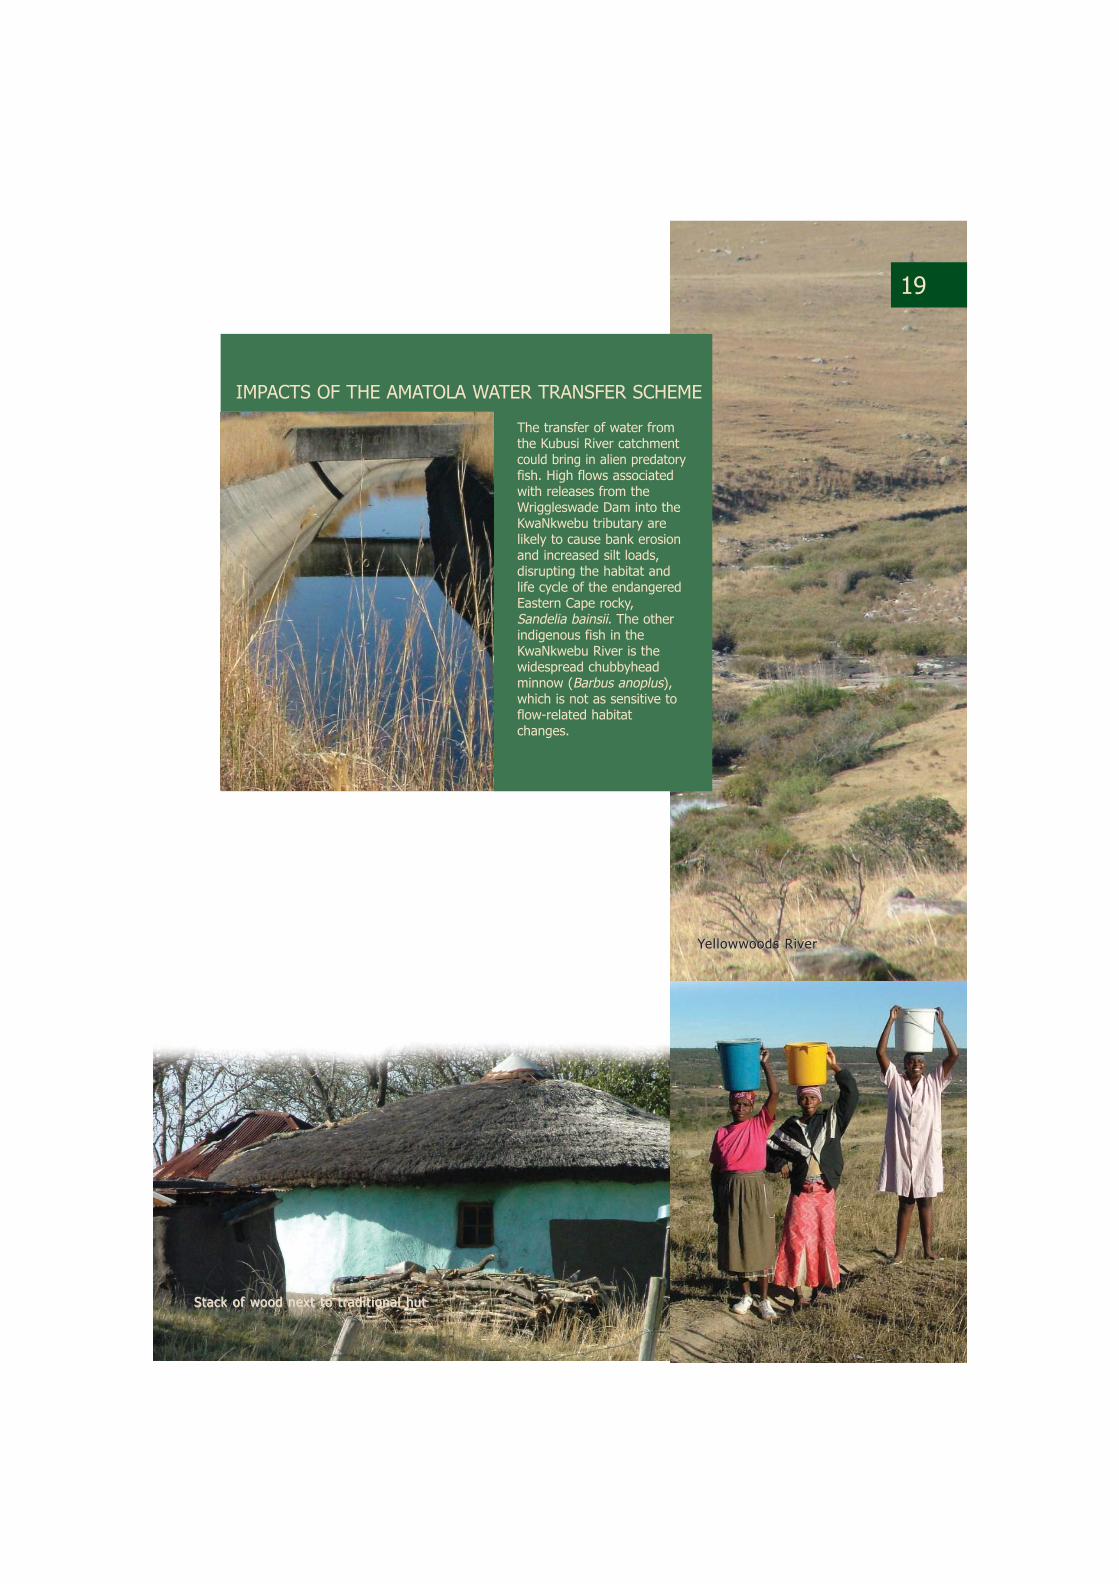
The transfer of water fromthe Kubusi River catchmentcould bring in alien predatoryfish. High flows associatedwith releases from theWriggleswade Dam into theKwaNkwebu tributary arelikely to cause bank erosionand increased silt loads, disrupting the habitat andlife cycle of the endangeredEastern Cape rocky,Sandelia bainsii. The otherindigenous fish in theKwaNkwebu River is thewidespread chubbyheadminnow (Barbus anoplus),which is not as sensitive toflow-related habitatchanges.
IMPACTS OF THE AMATOLA WATER TRANSFER SCHEME
SSttaacckk ooff wwoooodd nneexxtt ttoo ttrraaddii tt iioonnaall hhuutt
YYeell lloowwwwooooddss RRiivveerr
20
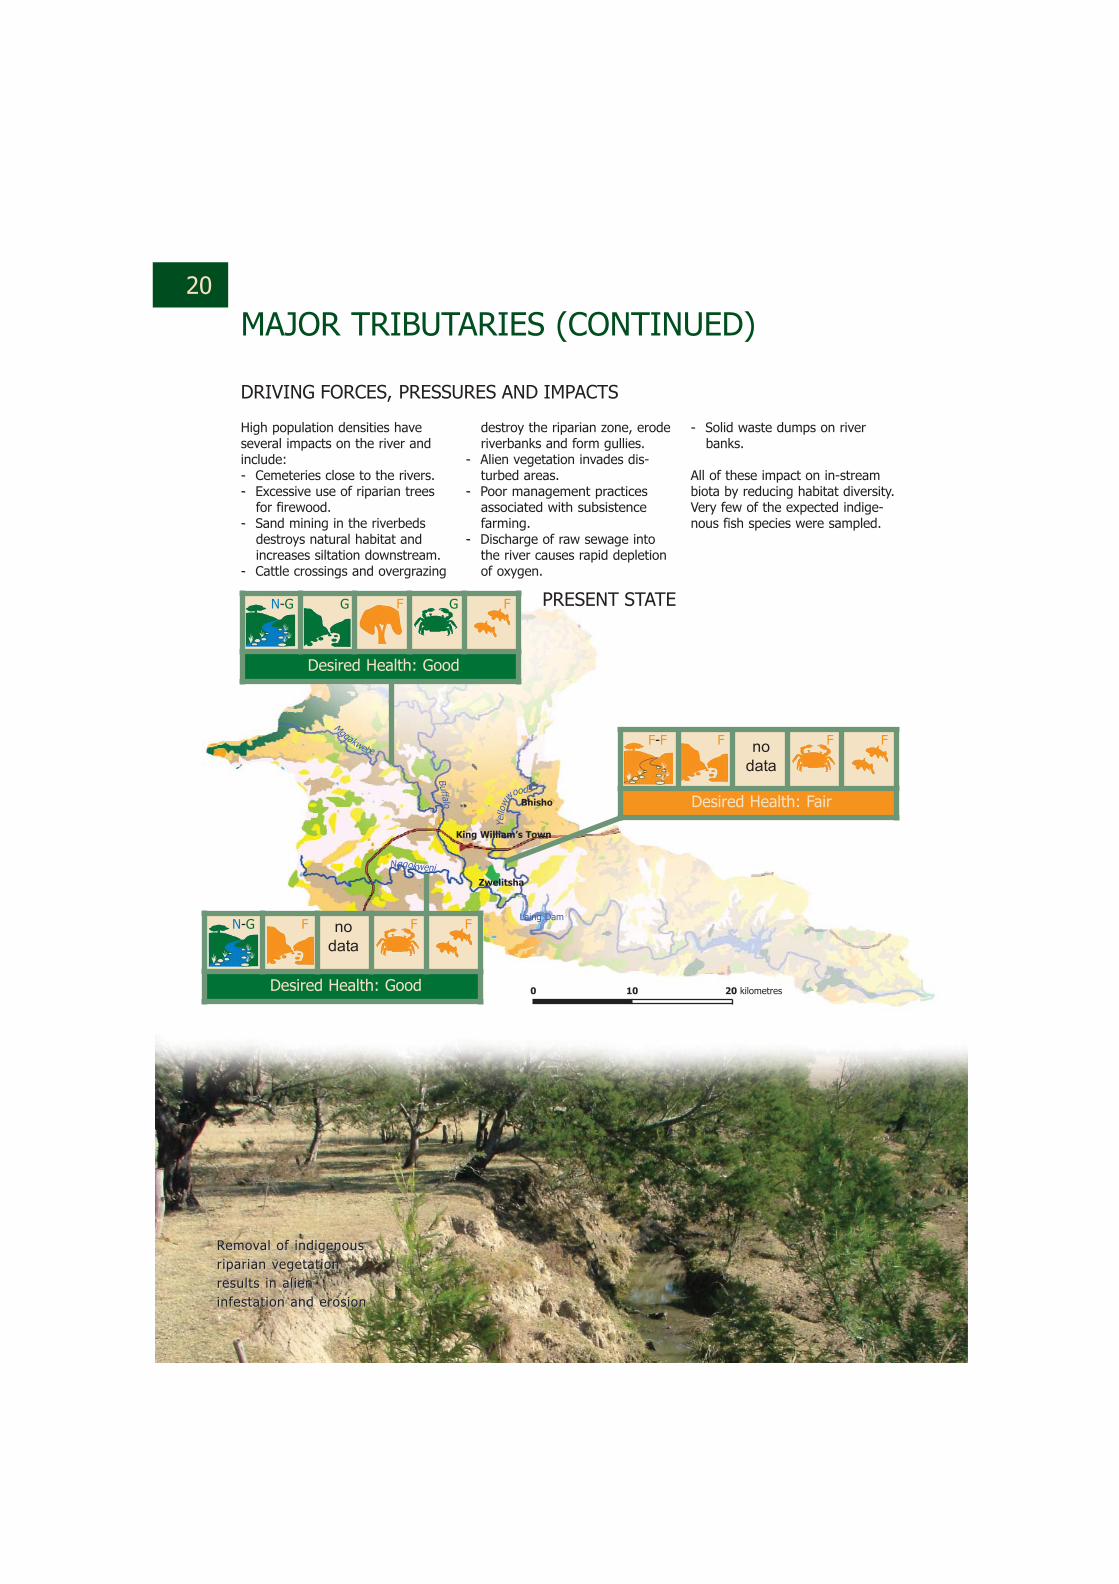
MAJOR TRIBUTARIES (CONTINUED)
destroy the riparian zone, eroderiverbanks and form gullies.
-- Alien vegetation invades dis-turbed areas.
-- Poor management practicesassociated with subsistencefarming.
-- Discharge of raw sewage intothe river causes rapid depletionof oxygen.
DRIVING FORCES, PRESSURES AND IMPACTS
PRESENT STATE
High population densities haveseveral impacts on the river andinclude: -- Cemeteries close to the rivers.-- Excessive use of riparian trees
for firewood. -- Sand mining in the riverbeds
destroys natural habitat andincreases siltation downstream.
-- Cattle crossings and overgrazing
Desired Health: Good
Desired Health: Good
Desired Health: Fair
-- Solid waste dumps on riverbanks.
All of these impact on in-streambiota by reducing habitat diversity.Very few of the expected indige-nous fish species were sampled.
N-G G F G F
F-F F F F
N-G F F F
Zwelitsha
Bhisho
King William’s Town
Ngqokweni
Mgqakwebe
Yello
w
woods
Buffalo
Laing Dam
nodata
nodata
0 10 20 kilometres
RReemmoovvaall ooff iinnddiiggeennoouussrr iippaarr iiaann vveeggeettaatt iioonnrreessuull ttss iinn aall iieenniinnffeessttaatt iioonn aanndd eerroossiioonn
MANAGEMENTRECOMMENDATIONS
Establish an alien vegetation control pro-gramme, especially around theMgqwakwebe River
Restore river banks that have collapsed oreroded
Work with the land care management programme, Working for Water programmesand others in the environmental educationof the local community
Monitor agricultural practices and educatesubsistence farmers about sustainablegrazing practices
Educate local communities in the sustainable use of plants and the detrimental effects of removing ofriparian vegetation
Improve management of sewagetreatment works and improveinfrastructure to control waterquality impacts
Monitor impacts and trends ofnutrient levels
21
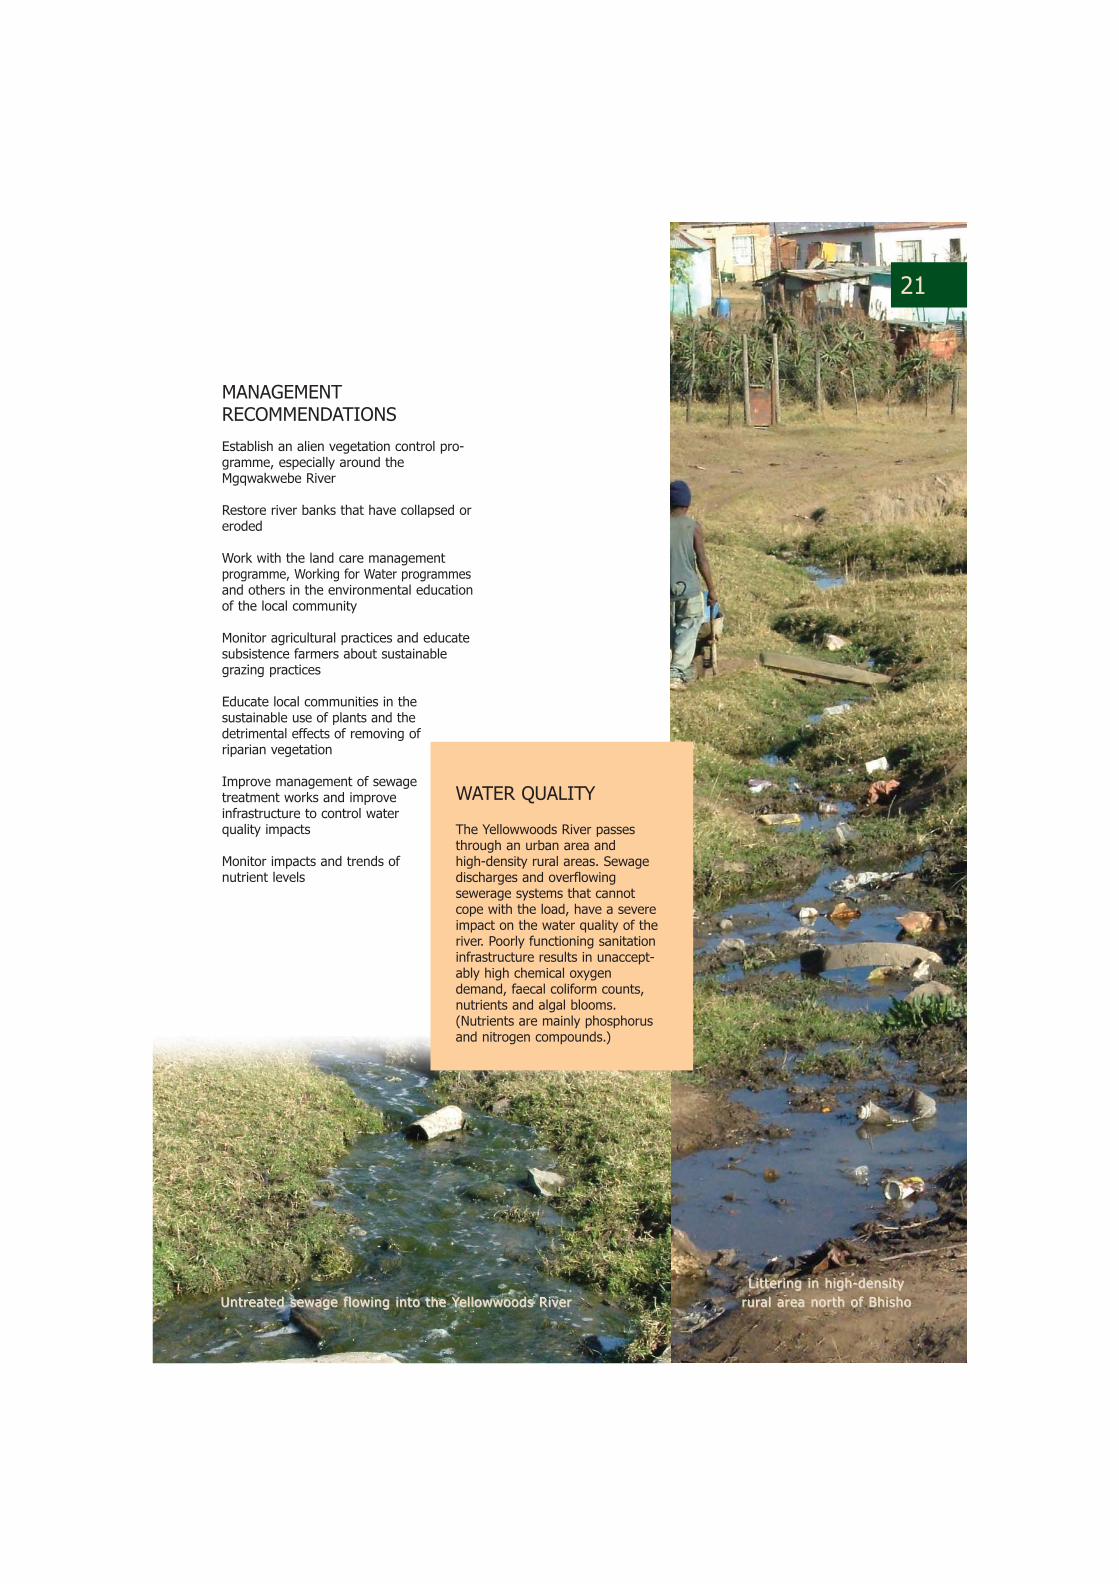
WATER QUALITY
The Yellowwoods River passesthrough an urban area and high-density rural areas. Sewagedischarges and overflowing sewerage systems that cannotcope with the load, have a severeimpact on the water quality of theriver. Poorly functioning sanitationinfrastructure results in unaccept-ably high chemical oxygendemand, faecal coliform counts,nutrients and algal blooms.(Nutrients are mainly phosphorusand nitrogen compounds.)
UUnnttrreeaatteedd sseewwaaggee ff lloowwiinngg iinnttoo tthhee YYeell lloowwwwooooddss RRiivveerr rruurraall aarreeaa nnoorrtthh ooff BBhhiisshhooLLii tttteerr iinngg iinn hhiigghh--ddeennssii ttyy
22
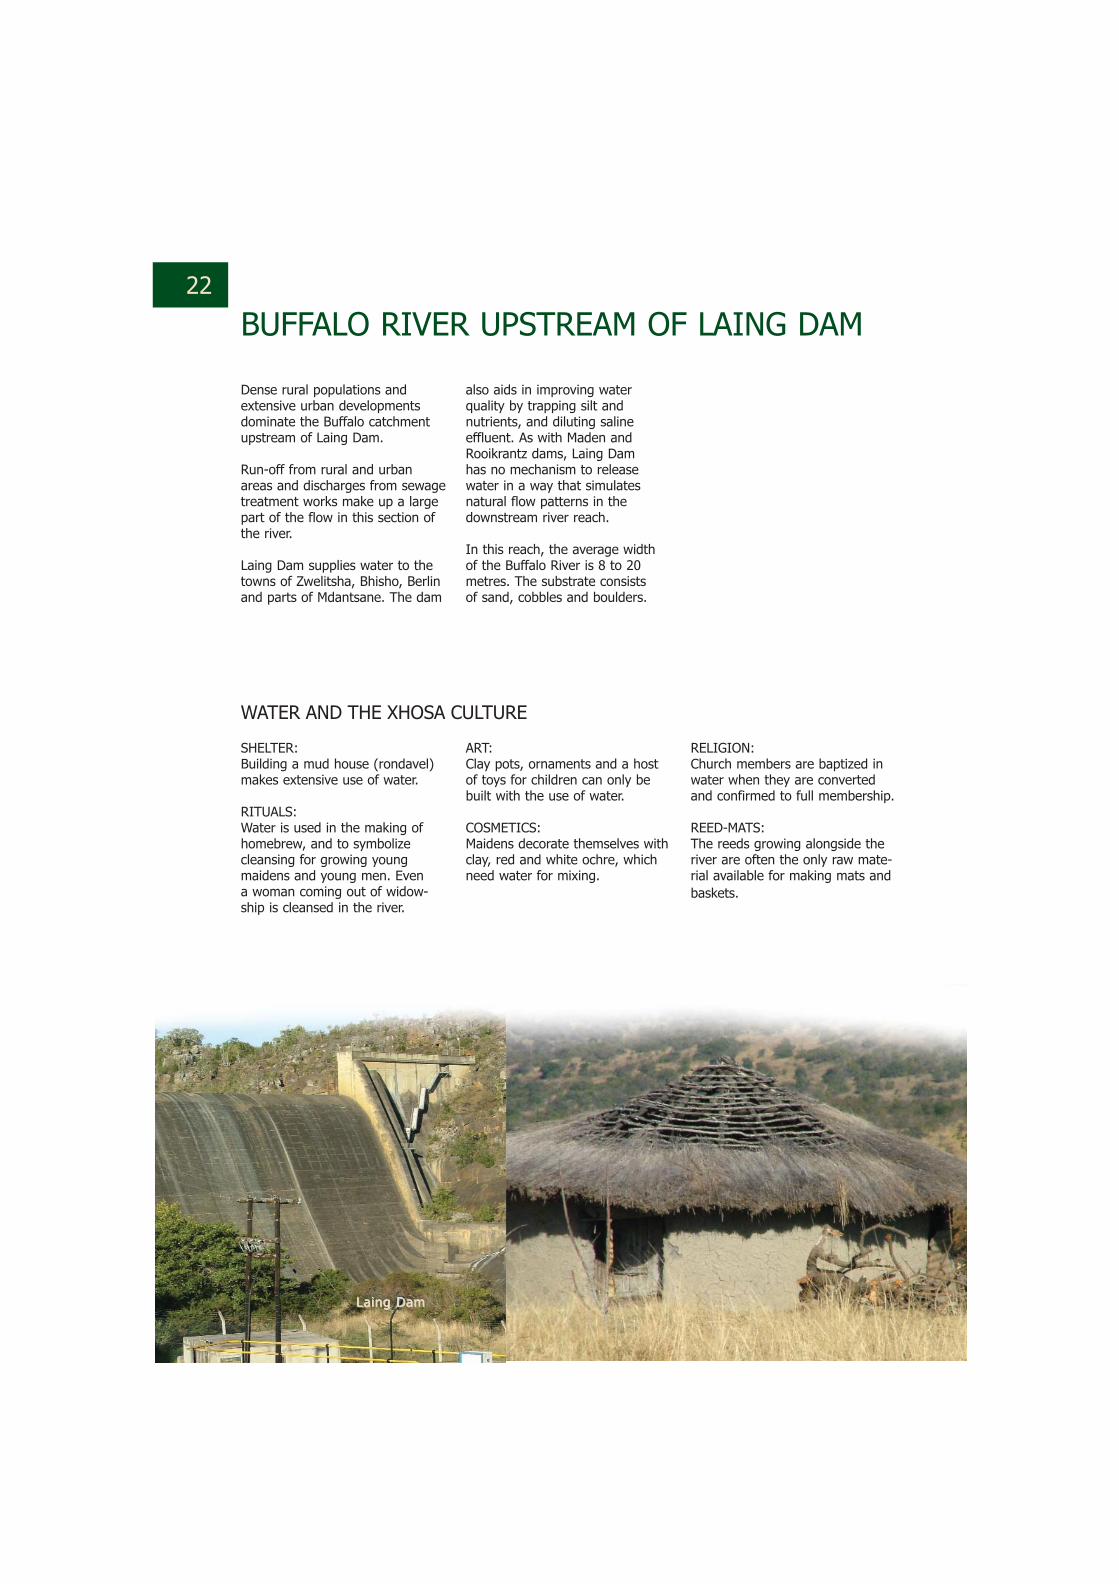
BUFFALO RIVER UPSTREAM OF LAING DAM
Dense rural populations andextensive urban developmentsdominate the Buffalo catchmentupstream of Laing Dam.
Run-off from rural and urbanareas and discharges from sewagetreatment works make up a largepart of the flow in this section ofthe river.
Laing Dam supplies water to thetowns of Zwelitsha, Bhisho, Berlinand parts of Mdantsane. The dam
also aids in improving waterquality by trapping silt andnutrients, and diluting salineeffluent. As with Maden andRooikrantz dams, Laing Damhas no mechanism to releasewater in a way that simulatesnatural flow patterns in thedownstream river reach.
In this reach, the average widthof the Buffalo River is 8 to 20metres. The substrate consistsof sand, cobbles and boulders.
SHELTER:Building a mud house (rondavel)makes extensive use of water.
RITUALS:Water is used in the making ofhomebrew, and to symbolizecleansing for growing young maidens and young men. Even a woman coming out of widow-ship is cleansed in the river.
RELIGION:Church members are baptized inwater when they are convertedand confirmed to full membership.
REED-MATS:The reeds growing alongside theriver are often the only raw mate-rial available for making mats andbaskets.
ART:Clay pots, ornaments and a hostof toys for children can only bebuilt with the use of water.
COSMETICS:Maidens decorate themselves withclay, red and white ochre, whichneed water for mixing.
WATER AND THE XHOSA CULTURE
LLaaiinngg DDaamm
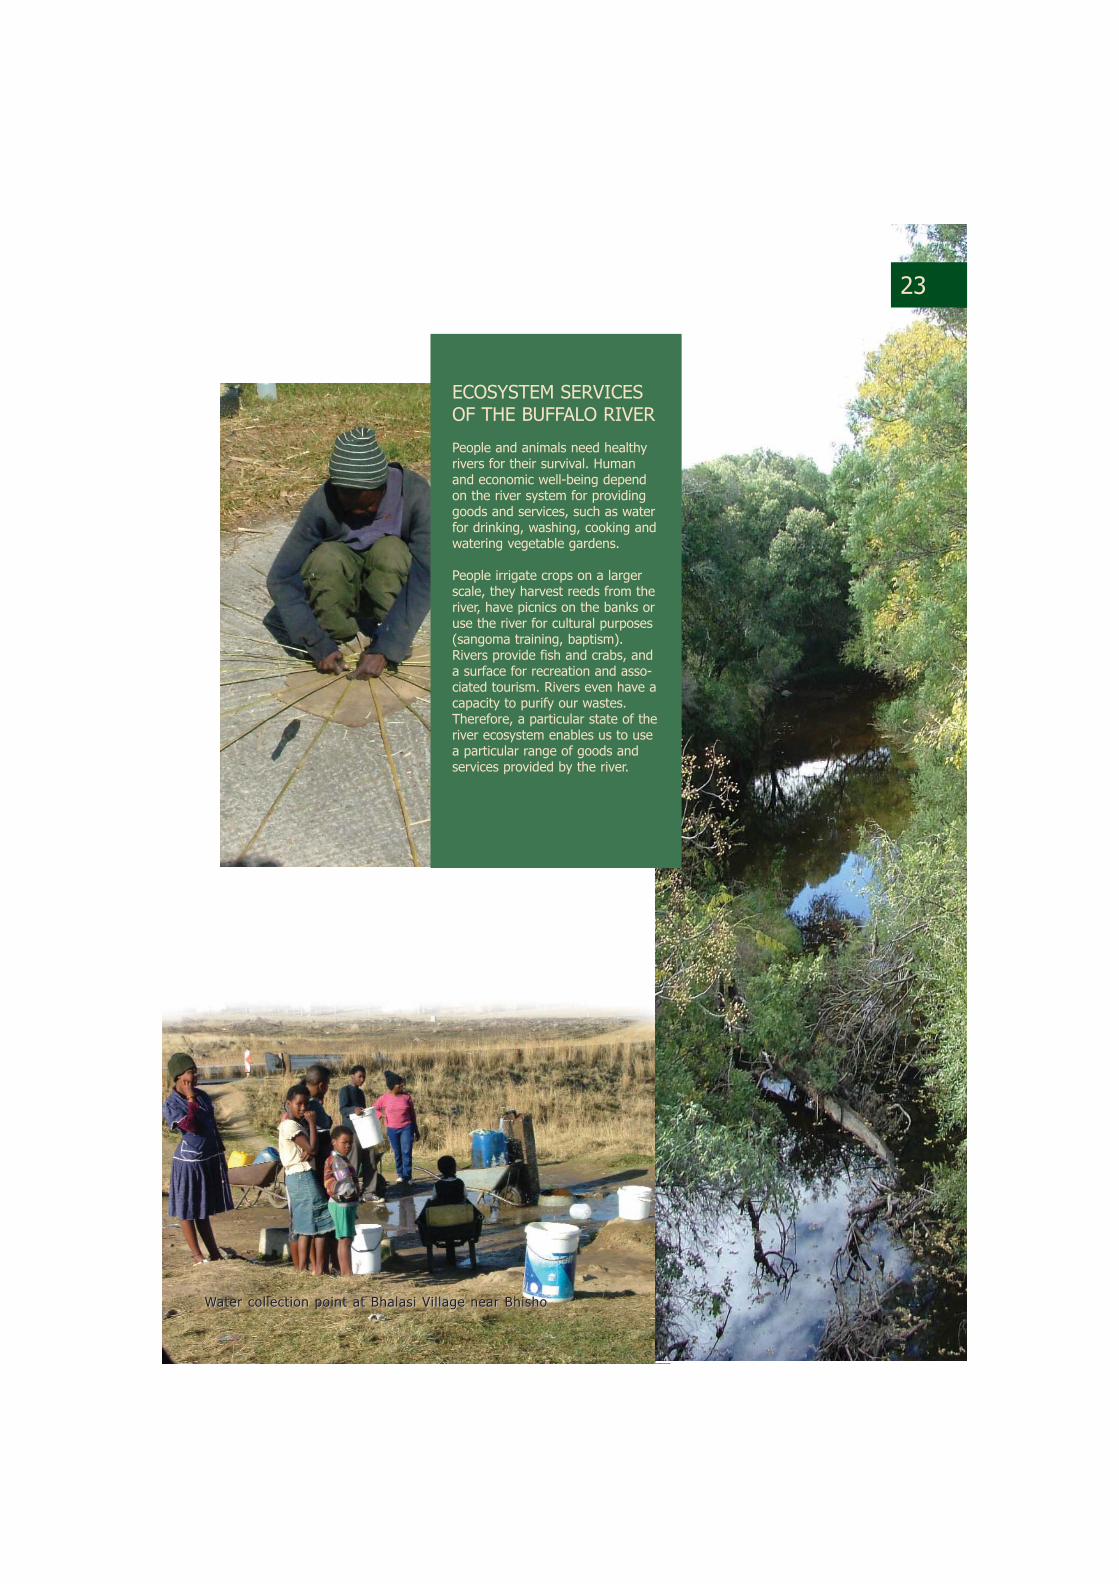
People and animals need healthyrivers for their survival. Humanand economic well-being dependon the river system for providinggoods and services, such as waterfor drinking, washing, cooking andwatering vegetable gardens.
People irrigate crops on a largerscale, they harvest reeds from theriver, have picnics on the banks oruse the river for cultural purposes(sangoma training, baptism).Rivers provide fish and crabs, anda surface for recreation and asso-ciated tourism. Rivers even have acapacity to purify our wastes.Therefore, a particular state of theriver ecosystem enables us to usea particular range of goods andservices provided by the river.
ECOSYSTEM SERVICESOF THE BUFFALO RIVER
23
WWaatteerr ccooll lleecctt iioonn ppooiinntt aatt BBhhaallaassii VVii ll llaaggee nneeaarr BBhhiisshhoo
24
BUFFALO RIVER UPSTREAM OF LAING DAM (CONT.)
DRIVING FORCES, PRESSURES AND IMPACTS
Desired Health: Fair
Desired Health: Fair
PRESENT STATE
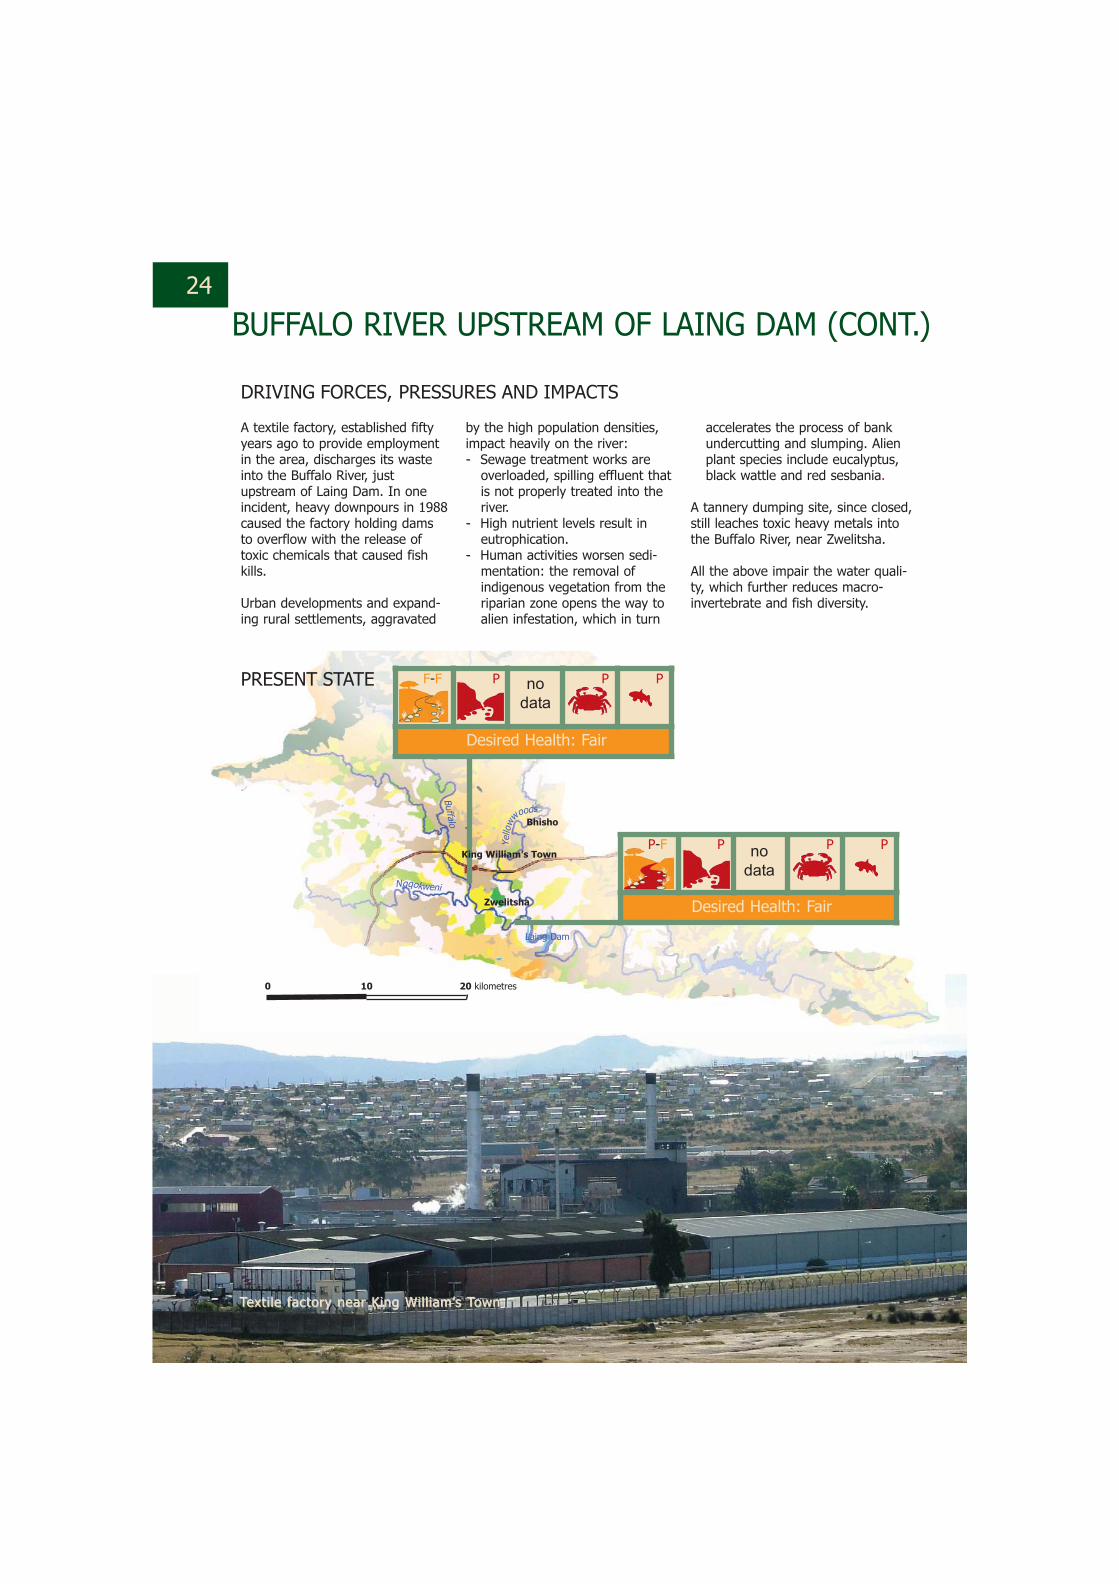
by the high population densities,impact heavily on the river: -- Sewage treatment works are
overloaded, spilling effluent thatis not properly treated into theriver.
-- High nutrient levels result ineutrophication.
-- Human activities worsen sedi-mentation: the removal ofindigenous vegetation from theriparian zone opens the way toalien infestation, which in turn
A textile factory, established fiftyyears ago to provide employmentin the area, discharges its wasteinto the Buffalo River, justupstream of Laing Dam. In oneincident, heavy downpours in 1988caused the factory holding damsto overflow with the release oftoxic chemicals that caused fishkills.
Urban developments and expand-ing rural settlements, aggravated
accelerates the process of bankundercutting and slumping. Alienplant species include eucalyptus,black wattle and red sesbania.
A tannery dumping site, since closed,still leaches toxic heavy metals intothe Buffalo River, near Zwelitsha.
All the above impair the water quali-ty, which further reduces macro-invertebrate and fish diversity.
F-F P P P
P-F P P P
Zwelitsha
Bhisho
King William’s Town
Ngqokweni
Yello
w
woods
Buffalo
Laing Dam
nodata
nodata
0 10 20 kilometres
TTeexxtt ii llee ffaaccttoorryy nneeaarr KKiinngg WWii ll ll iiaamm’’ss TToowwnn
MANAGEMENTRECOMMENDATIONS
Establish an alien vegetation control programme
Restore river banks that have collapsed or eroded
Work with land care managementprogramme, Working for Waterprogrammes and others in theenvironmental education ofthe local community
Monitor and manage agri-cultural practices
Educate local residents inthe sustainable use of plantsand the detrimental effects ofremoval of riparian vegetation
Monitor and manageeutrophication impacts andnutrient loads
Monitor industrial discharges
Continue improving thesewage treatment works andthe management thereof
WATER QUALITY
This section of the Buffalo Riverpasses through urban and denselypopulated rural areas. The majorimpacts are caused by treatedsewage discharges, textile indus-try effluent and overflowing sew-erage systems from overcrowdedtownships. Sewage works do notcomply with the Department ofWater Affairs and Forestry generalstandards for discharge. Raw andpartially treated sewage enteringthe river causes unacceptablyhigh chemical oxygen demandvalues, faecal coliform counts andnutrient concentrations.
High nutrient concentrations leadto eutrophication with excessivegrowth of aquatic plants, nuisancealgae and cyanobacteria. Algalblooms are a serious problem inLaing Dam as they prevent lightpenetration through the water,thereby preventing natural reduc-tion of iron and manganese andcausing treatment problems forthe Amatola Water Board.Moreover, cyanobacteria producetoxins that are expensive toremove with normal treatmentprocesses and are a health hazardto water consumers.
The textile industry present in thissection of the river contributes tothe high salt concentrations in theMlakalaka Stream, which entersthe Buffalo River above Laing Dam.
25
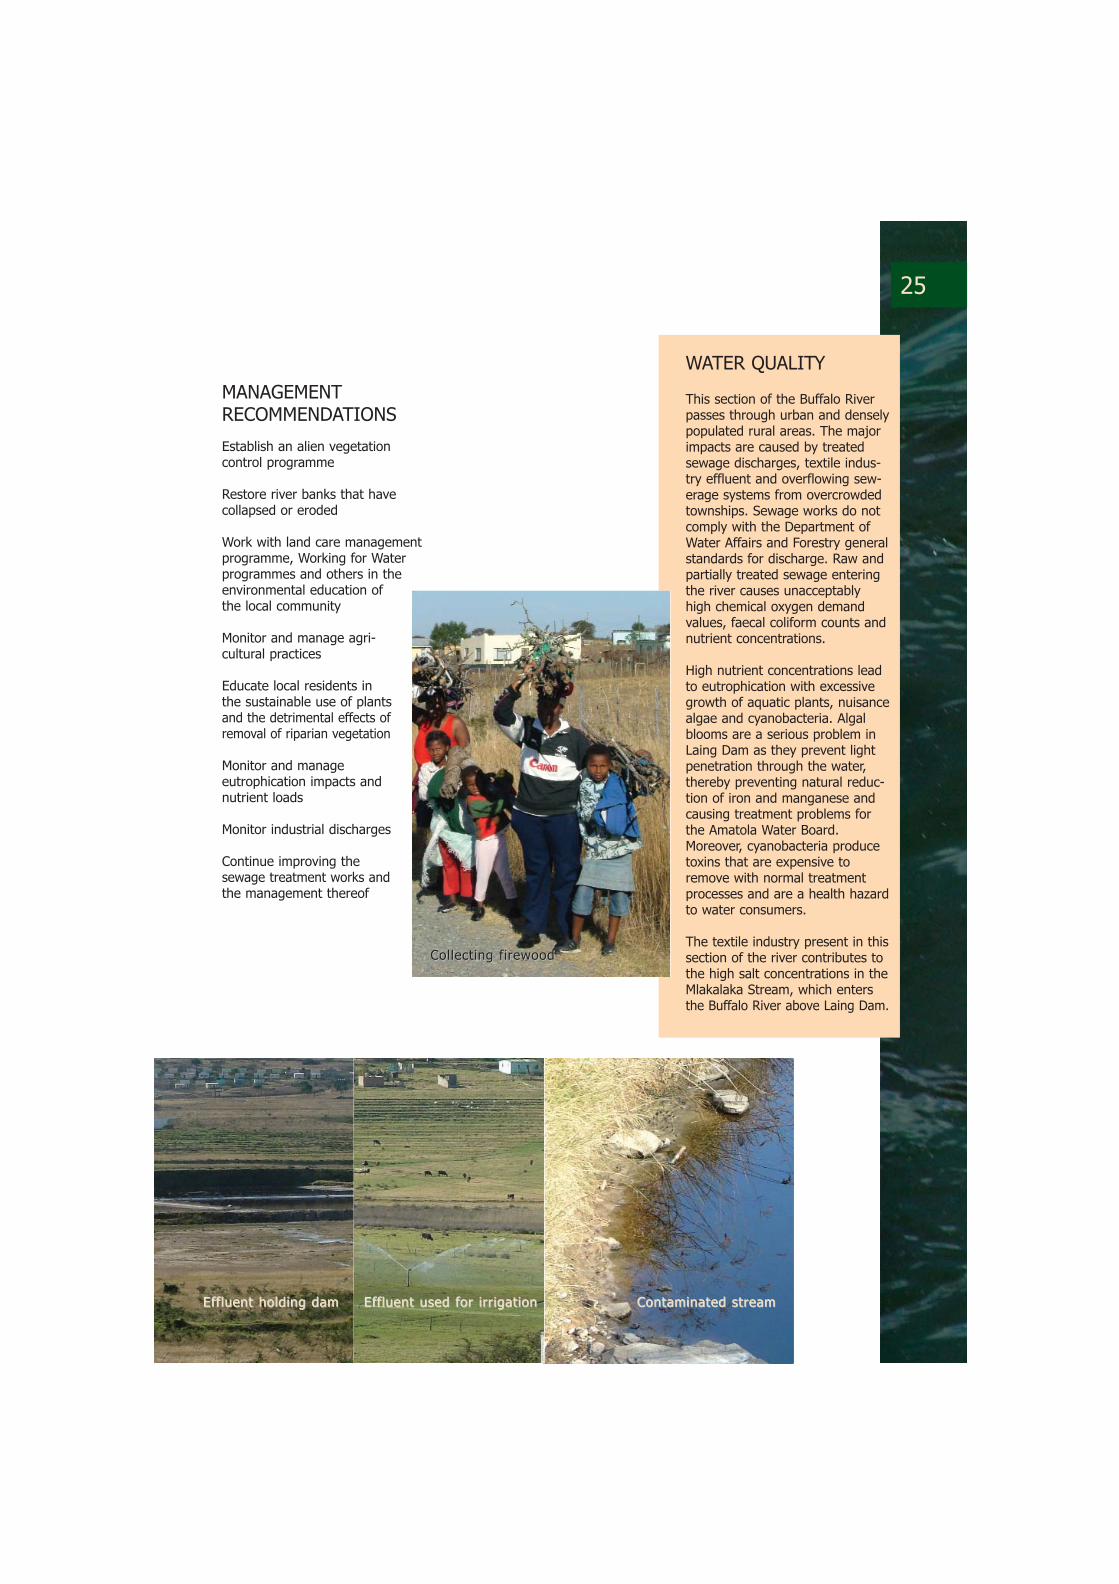
EEffff lluueenntt hhoollddiinngg ddaamm EEffff lluueenntt uusseedd ffoorr ii rrrr iiggaatt iioonn CCoonnttaammiinnaatteedd ssttrreeaamm
CCooll lleecctt iinngg ff ii rreewwoooodd
26
THE BUFFALO RIVER ON THE COASTAL PLAIN
this catchment that can releasewater when it is not overflowing,so that flow can be maintaineddownstream.
Shangani Stream collects the over-flow from the Potsdam sewageworks to the west of Mdantsaneand discharges it into the BridleDrift Dam.
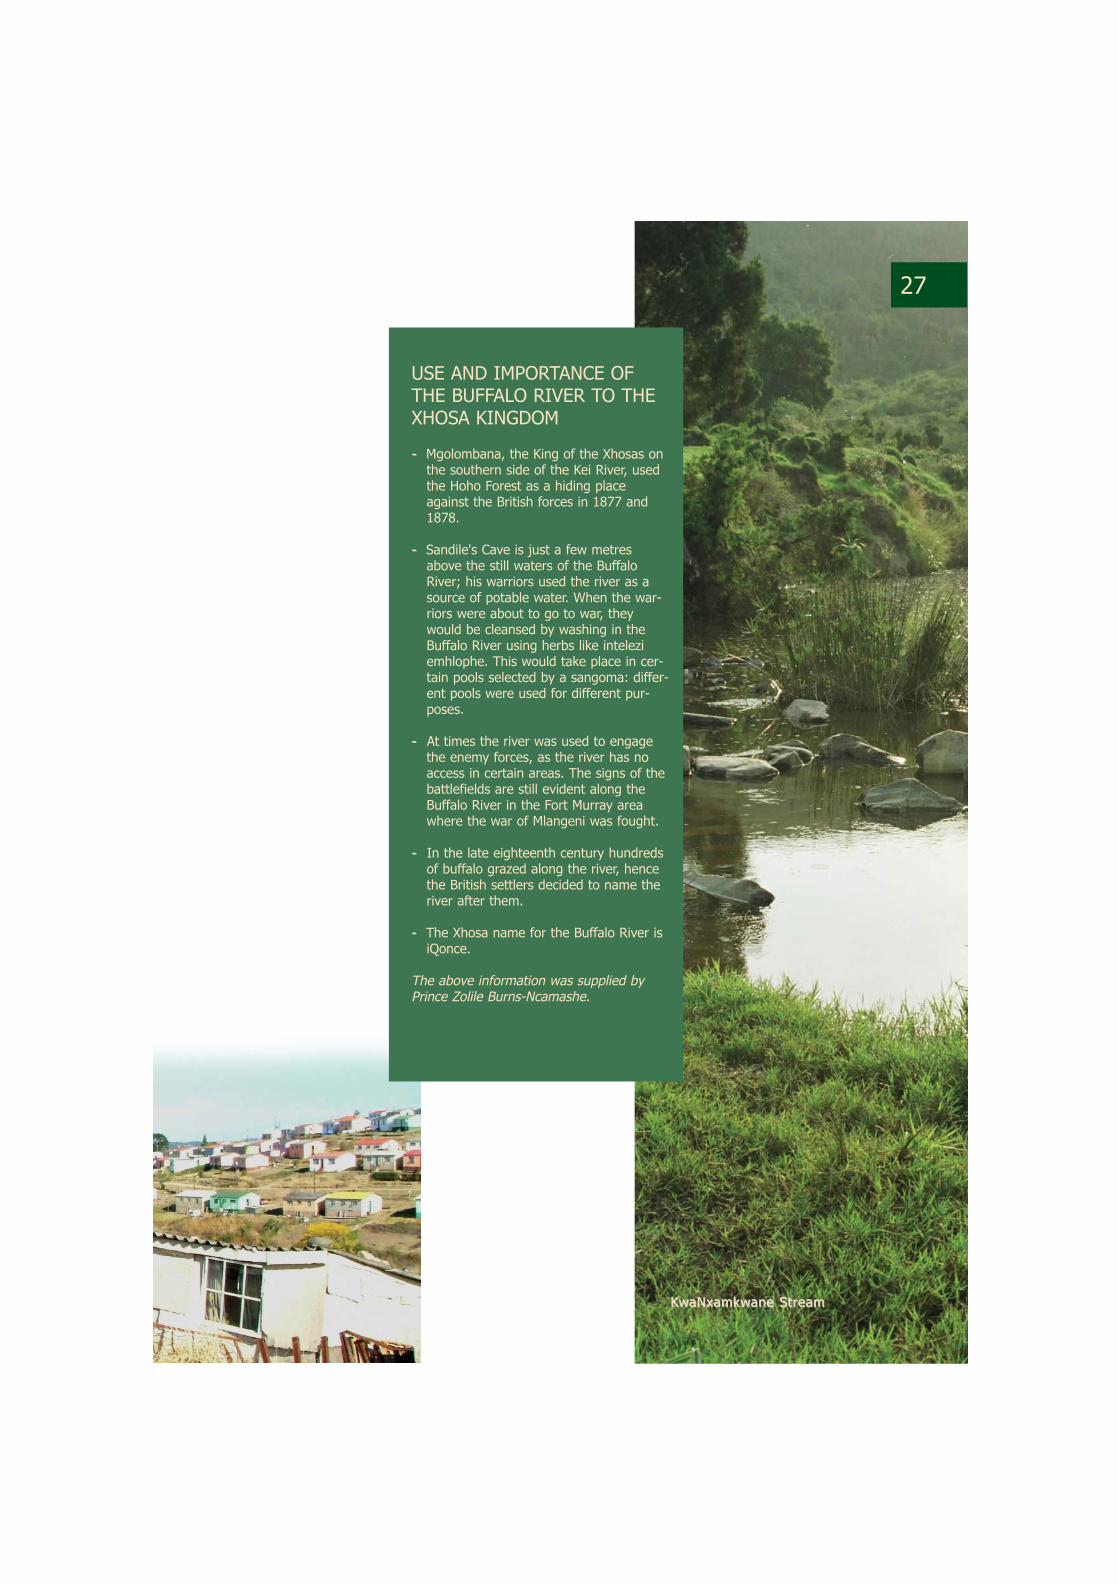
KwaNxamkwane Stream, with an
average width of 4 to 6 metres,joins the Buffalo River nearPotsdam. Grass and sedges dominate the marginal vegetation.
The catchment area to the northof the Buffalo River between LaingDam and Bridle Drift Dam, is characterised by natural grasslandand thicket, interspersed by largebuilt-up areas and extensive areasof degraded land.
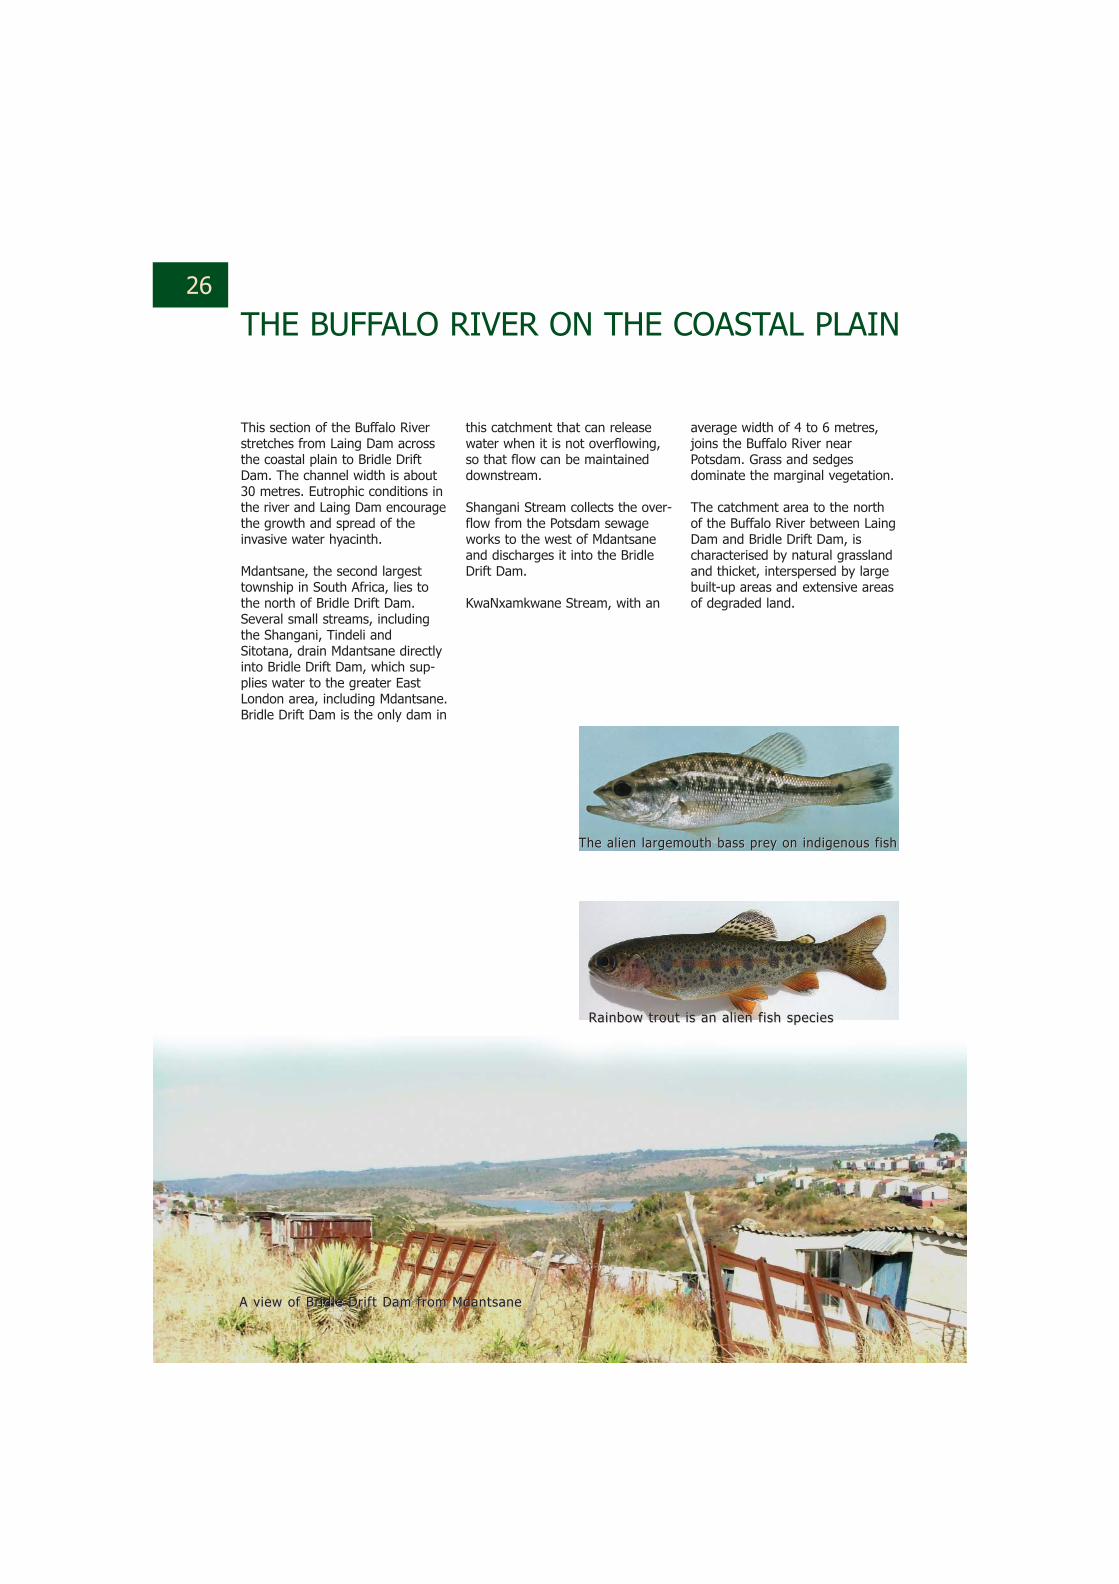
This section of the Buffalo Riverstretches from Laing Dam acrossthe coastal plain to Bridle DriftDam. The channel width is about30 metres. Eutrophic conditions inthe river and Laing Dam encouragethe growth and spread of theinvasive water hyacinth.
Mdantsane, the second largesttownship in South Africa, lies tothe north of Bridle Drift Dam.Several small streams, includingthe Shangani, Tindeli andSitotana, drain Mdantsane directlyinto Bridle Drift Dam, which sup-plies water to the greater EastLondon area, including Mdantsane.Bridle Drift Dam is the only dam in
AA vviieeww ooff BBrr iiddllee DDrr ii ff tt DDaamm ffrroomm MMddaannttssaannee
TThhee aall iieenn llaarrggeemmoouutthh bbaassss pprreeyy oonn iinnddiiggeennoouuss ff iisshh
RRaaiinnbbooww ttrroouutt iiss aann aall iieenn ff iisshh ssppeecciieess
27
USE AND IMPORTANCE OFTHE BUFFALO RIVER TO THEXHOSA KINGDOM
-- Mgolombana, the King of the Xhosas onthe southern side of the Kei River, usedthe Hoho Forest as a hiding placeagainst the British forces in 1877 and1878.
-- Sandile's Cave is just a few metresabove the still waters of the BuffaloRiver; his warriors used the river as asource of potable water. When the war-riors were about to go to war, theywould be cleansed by washing in theBuffalo River using herbs like inteleziemhlophe. This would take place in cer-tain pools selected by a sangoma: differ-ent pools were used for different pur-poses.
- - At times the river was used to engagethe enemy forces, as the river has noaccess in certain areas. The signs of thebattlefields are still evident along theBuffalo River in the Fort Murray areawhere the war of Mlangeni was fought.
- - In the late eighteenth century hundredsof buffalo grazed along the river, hencethe British settlers decided to name theriver after them.
-- The Xhosa name for the Buffalo River isiQonce.
The above information was supplied byPrince Zolile Burns-Ncamashe.
KKwwaaNNxxaammkkwwaannee SSttrreeaamm
28
THE BUFFALO RIVER ON THE COASTAL PLAIN(CONTINUED)
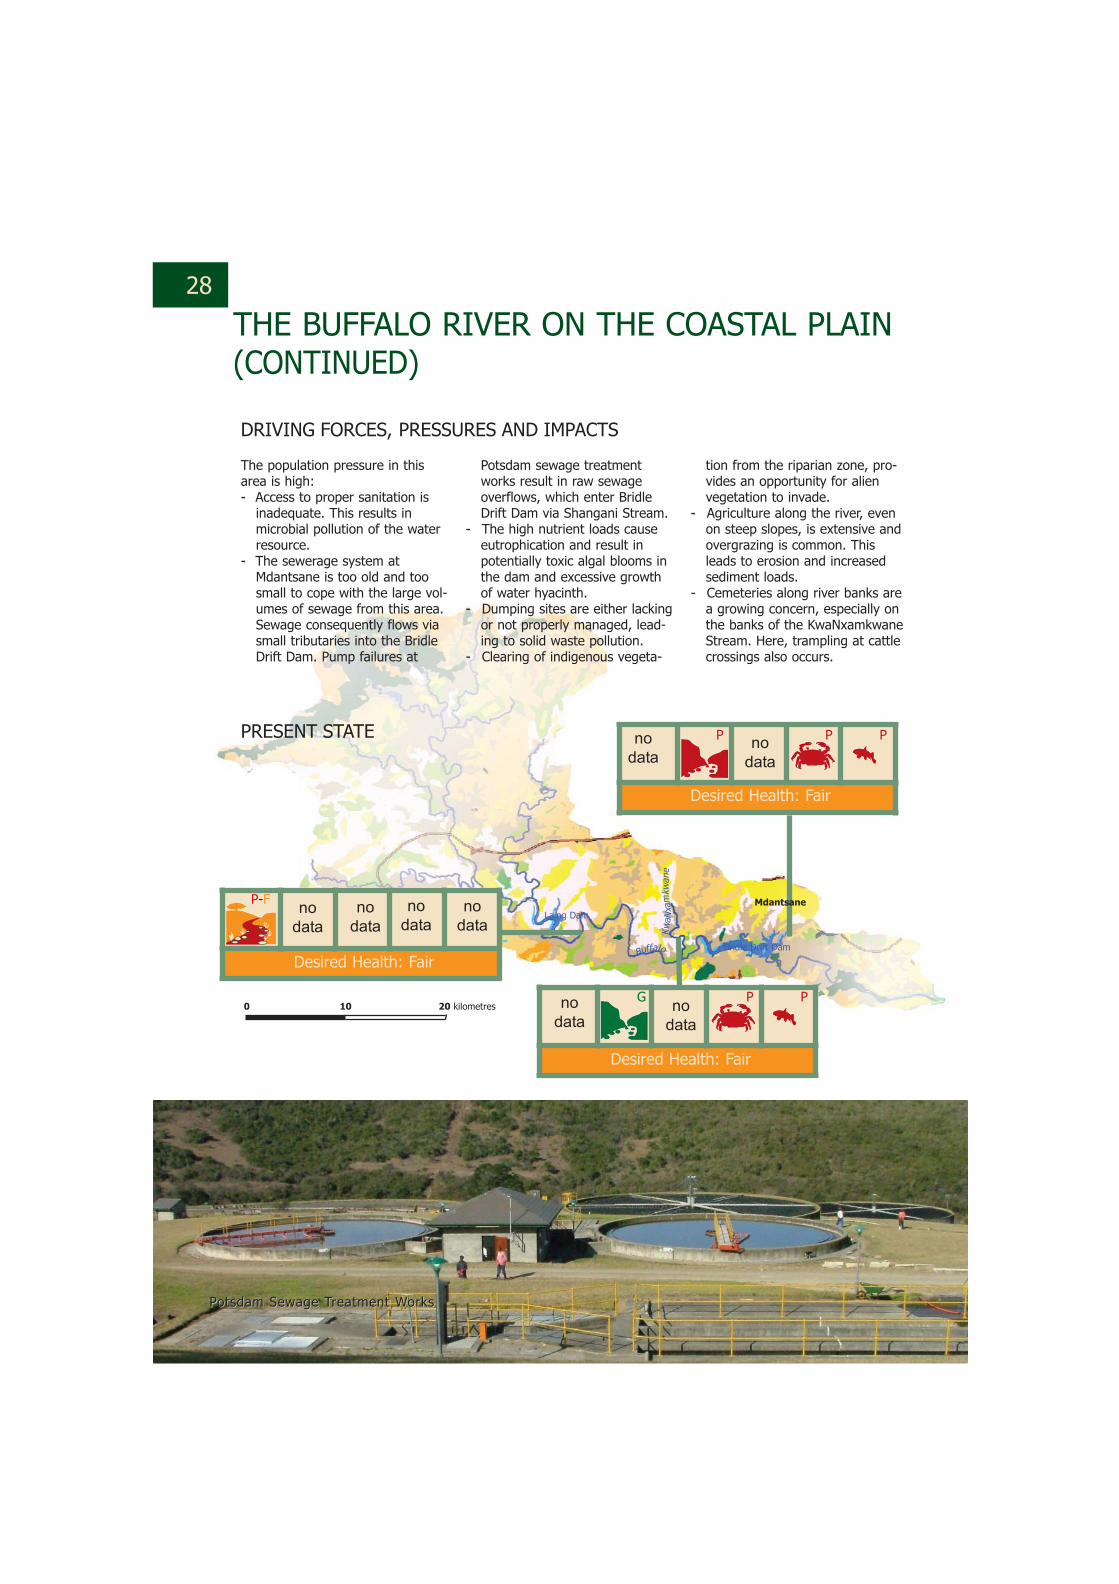
The population pressure in thisarea is high: -- Access to proper sanitation is
inadequate. This results inmicrobial pollution of the waterresource.
-- The sewerage system atMdantsane is too old and toosmall to cope with the large vol-umes of sewage from this area.Sewage consequently flows viasmall tributaries into the BridleDrift Dam. Pump failures at
DRIVING FORCES, PRESSURES AND IMPACTS
PRESENT STATE
Potsdam sewage treatmentworks result in raw sewageoverflows, which enter BridleDrift Dam via Shangani Stream.
- - The high nutrient loads causeeutrophication and result inpotentially toxic algal blooms inthe dam and excessive growthof water hyacinth.
- - Dumping sites are either lackingor not properly managed, lead-ing to solid waste pollution.
- - Clearing of indigenous vegeta-
tion from the riparian zone, pro-vides an opportunity for alienvegetation to invade.
- - Agriculture along the river, evenon steep slopes, is extensive andovergrazing is common. Thisleads to erosion and increasedsediment loads.
- - Cemeteries along river banks area growing concern, especially onthe banks of the KwaNxamkwaneStream. Here, trampling at cattlecrossings also occurs.
Desired Health: Fair
Desired Health: Fair
Desired Health: Fair
P P P
G P P
P-F
Buffalo
Laing Dam
Bridle Drift Dam
Mdantsane
PPoottssddaamm SSeewwaaggee TTrreeaattmmeenntt WWoorrkkss
KwaN
xam
kwan
e
nodata
nodata
nodata
nodata
nodata
nodata
nodata
nodata
0 10 20 kilometres
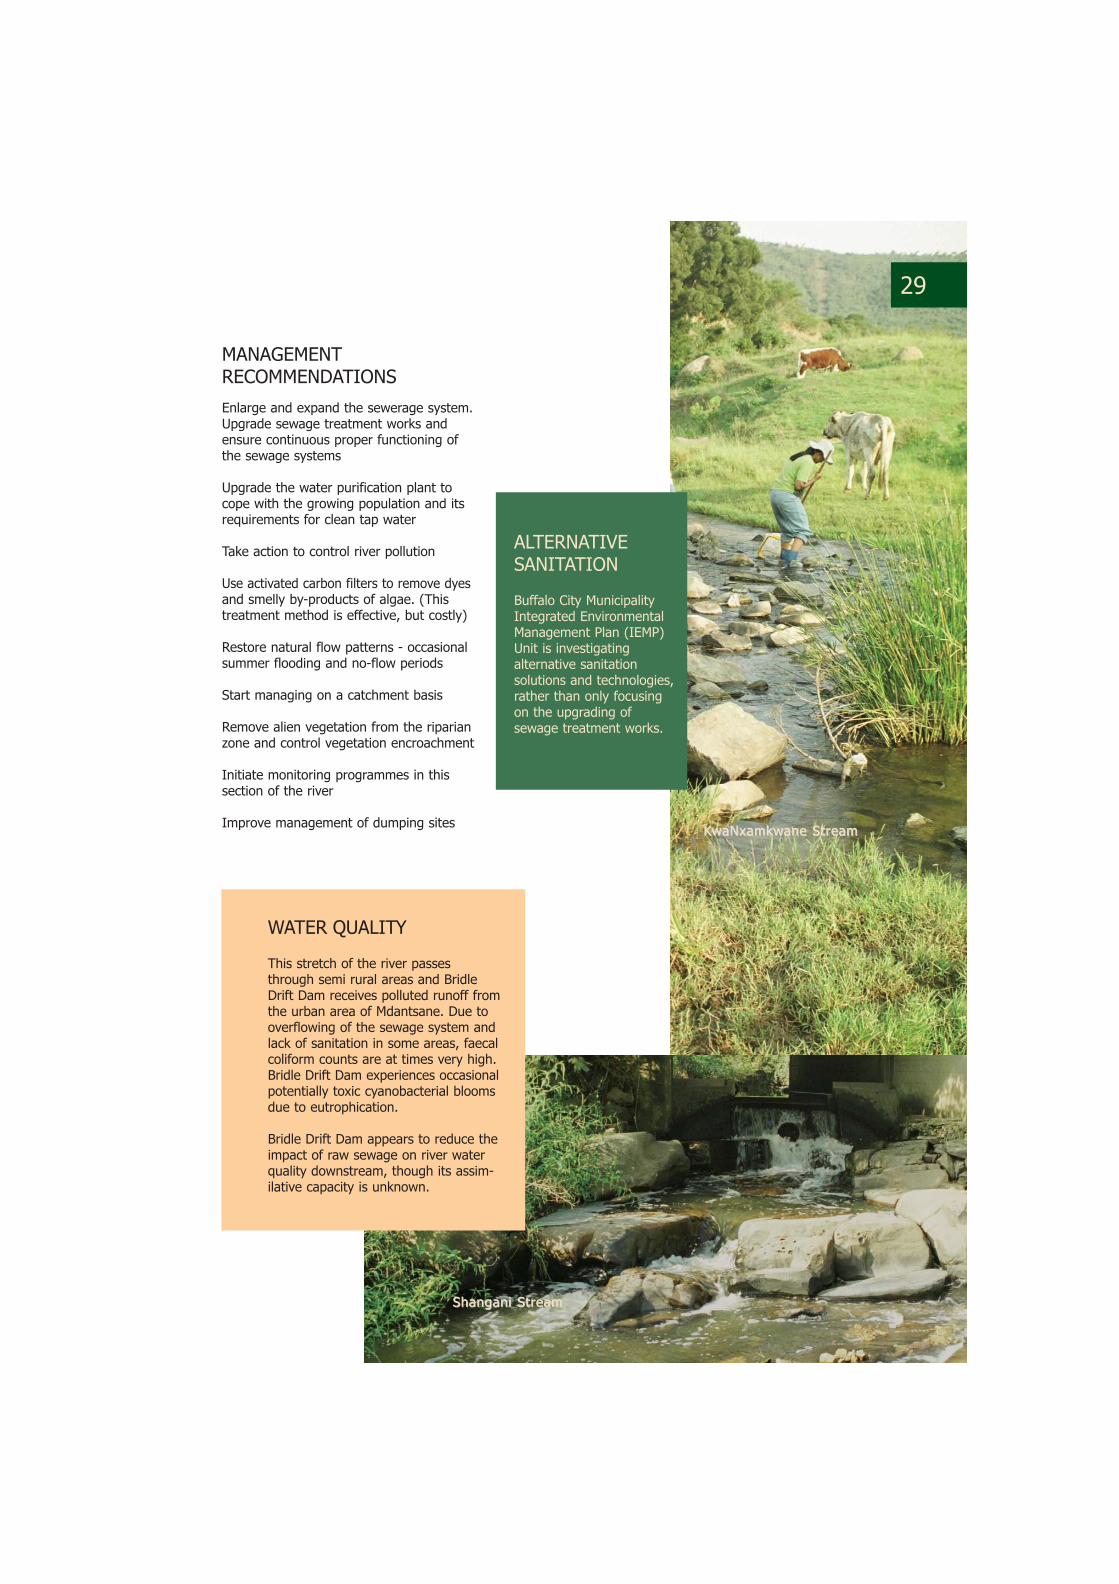
Enlarge and expand the sewerage system.Upgrade sewage treatment works andensure continuous proper functioning ofthe sewage systems
Upgrade the water purification plant tocope with the growing population and itsrequirements for clean tap water
Take action to control river pollution
Use activated carbon filters to remove dyesand smelly by-products of algae. (Thistreatment method is effective, but costly)
Restore natural flow patterns - occasionalsummer flooding and no-flow periods
Start managing on a catchment basis
Remove alien vegetation from the riparianzone and control vegetation encroachment
Initiate monitoring programmes in thissection of the river
Improve management of dumping sites
MANAGEMENTRECOMMENDATIONS
29
WATER QUALITY
This stretch of the river passesthrough semi rural areas and BridleDrift Dam receives polluted runoff fromthe urban area of Mdantsane. Due tooverflowing of the sewage system andlack of sanitation in some areas, faecalcoliform counts are at times very high.Bridle Drift Dam experiences occasionalpotentially toxic cyanobacterial bloomsdue to eutrophication.
Bridle Drift Dam appears to reduce theimpact of raw sewage on river waterquality downstream, though its assim-ilative capacity is unknown.
SShhaannggaannii SSttrreeaamm
KKwwaaNNxxaammkkwwaannee SSttrreeaamm
ALTERNATIVESANITATION
Buffalo City MunicipalityIntegrated EnvironmentalManagement Plan (IEMP)Unit is investigating alternative sanitation solutions and technologies,rather than only focusingon the upgrading ofsewage treatment works.

30
THE LOWER BUFFALO RIVER, ESTUARY ANDHARBOUR
Downstream of Bridle Drift Dam,the Buffalo River forms a wideincised channel with numerousbedrock intrusions and vegetatedislands. The average width of theriver channel is between 40 and50 metres. Bedrock predominateswith few cobbles. Although somealien invasion occurs, river banksare stable as a result of goodindigenous vegetation cover.
A natural gorge limits access tothe Umtiza Nature Reserve sohuman impacts are low. This
560 ha reserve conserves theUmtiza listeriana, a tree found inthis area only. It is also home ofthe Samango monkey, tree dassieand the rare African finfoot.
Because rivers have a self-cleans-ing nature (ability to recover natu-rally), it is important to protectnatural ecosystem functioning. Anexample where a river restoreditself is at the Umtiza NatureReserve where anthropogenicimpacts are low and the riverhealth improves downstream over
Every water resource has an assimilativecapacity in which it can tolerate a certainamount of pollutants without having adetrimental impact to its users.
Rivers provide habitats for a range ofplants, animals and microbes which assistin the natural process of breaking downwastes (including anthropogenic waste):some plants and microbes take up thewastes and are able to break them down,some animals eat the plants, some animalseat each other and some animals eat thebroken-down plants and animals. In thisway, rivers are able to clean themselves.
NATURAL CLEANSING PROCESS
Under natural conditions, the riverprocesses are able to cope easilywith minimal amounts of waste discharged into the river. Whenincreased amounts of waste are discharged to the river and changesare made to the structure of theriver, these natural processes canno longer cope because of changesin the numbers and kinds of animals and plants, and changes inhabitat. The breakdown processescan no longer take place and thestructure and functions of the riverchange.
a relatively short distance. Theresult is that high diversity of rea-sonably sensitive organisms arefound.
The Buffalo City Municipalitycoastline provides a unique habitatfor marine, shellfish and coastalwildlife.
Local inhabitants use this sectionof the river for cultural rites.
UUmmttiizzaa ttrreeee
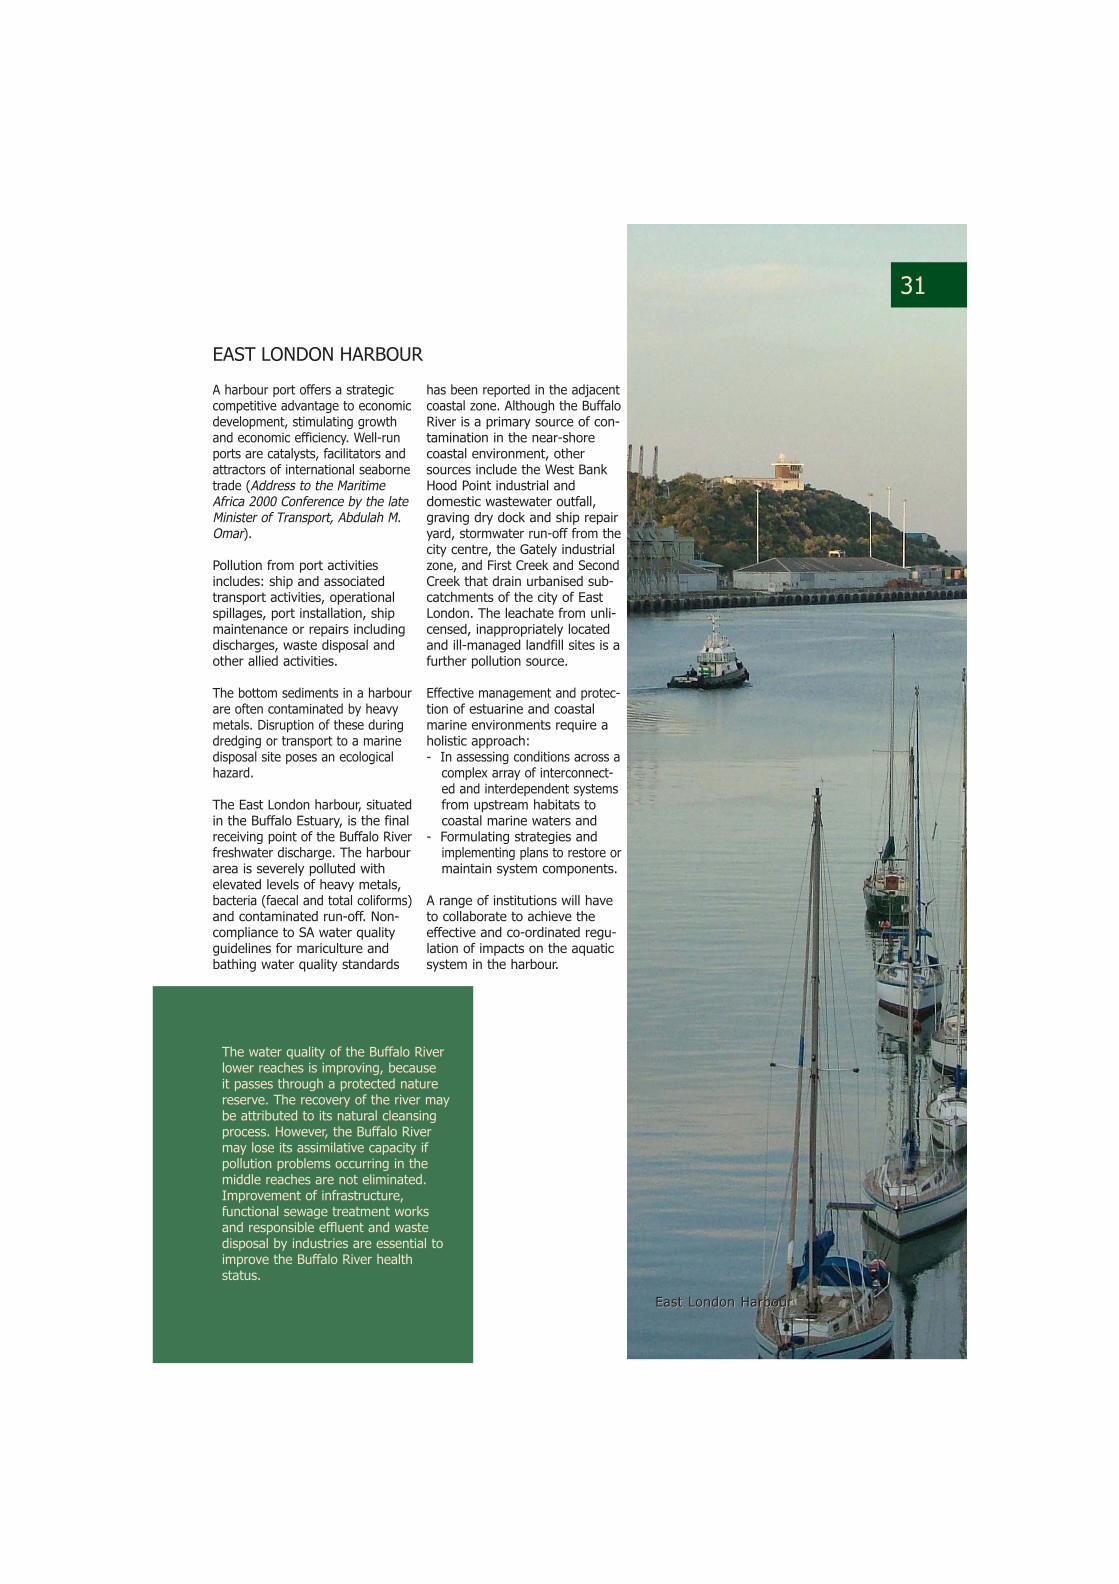
A harbour port offers a strategiccompetitive advantage to economicdevelopment, stimulating growthand economic efficiency. Well-runports are catalysts, facilitators andattractors of international seabornetrade (Address to the MaritimeAfrica 2000 Conference by the lateMinister of Transport, Abdulah M.Omar).
Pollution from port activitiesincludes: ship and associatedtransport activities, operationalspillages, port installation, shipmaintenance or repairs includingdischarges, waste disposal andother allied activities.
The bottom sediments in a harbourare often contaminated by heavymetals. Disruption of these duringdredging or transport to a marinedisposal site poses an ecologicalhazard.
The East London harbour, situatedin the Buffalo Estuary, is the finalreceiving point of the Buffalo Riverfreshwater discharge. The harbourarea is severely polluted with elevated levels of heavy metals,bacteria (faecal and total coliforms)and contaminated run-off. Non-compliance to SA water qualityguidelines for mariculture andbathing water quality standards
has been reported in the adjacentcoastal zone. Although the BuffaloRiver is a primary source of con-tamination in the near-shorecoastal environment, othersources include the West BankHood Point industrial anddomestic wastewater outfall,graving dry dock and ship repairyard, stormwater run-off from thecity centre, the Gately industrialzone, and First Creek and SecondCreek that drain urbanised sub-catchments of the city of EastLondon. The leachate from unli-censed, inappropriately locatedand ill-managed landfill sites is afurther pollution source.
Effective management and protec-tion of estuarine and coastalmarine environments require aholistic approach: -- In assessing conditions across a
complex array of interconnect-ed and interdependent systemsfrom upstream habitats tocoastal marine waters and
-- Formulating strategies andimplementing plans to restore ormaintain system components.
A range of institutions will haveto collaborate to achieve theeffective and co-ordinated regu-lation of impacts on the aquaticsystem in the harbour.
EAST LONDON HARBOUR
31
The water quality of the Buffalo Riverlower reaches is improving, because it passes through a protected naturereserve. The recovery of the river maybe attributed to its natural cleansingprocess. However, the Buffalo Rivermay lose its assimilative capacity ifpollution problems occurring in themiddle reaches are not eliminated.Improvement of infrastructure, functional sewage treatment worksand responsible effluent and wastedisposal by industries are essential toimprove the Buffalo River health status.
EEaasstt LLoonnddoonn HHaarrbboouurr

32
THE LOWER BUFFALO RIVER, ESTUARY ANDHARBOUR (CONTINUED)
Encroachment of alien weedspecies such as castor oil plant,ink berry, syringa, cactus vine andballoon vine.
Removal of plant material from theforest.
petrochemical industries con-taminates Gately Stream.
-- Second Creek waste disposalsite leaches directly into theestuary.
-- The Central Sewage TreatmentWorks (Amalinda) is overloadedand releases effluent that is notproperly treated.
Desired Health: Fair
DRIVING FORCES, PRESSURES AND IMPACTS
PRESENT STATE
Industrial development results inthe loss of terrestrial and aquatichabitats and the consequentdecline in biodiversity (fauna andflora).
Pollution output of industries ishigh, leading to water contamina-tion. Examples are:
-- Discharge of effluent from
F-F F F G G
East London
Buffalo
Bridle Drift Dam
Mdantsane
UmtizaNature Reserve
0 10 20 kilometres
WATER QUALITY
Previous heavy metal sedimentsurveys demonstrate that theupper harbour sites and theinner harbour area in the centralsector downstream of the shiprepair and storm water inflowsare the most contaminatedzones in the port.

MANAGEMENTRECOMMENDATIONS
Ensure adherence to the EnvironmentalManagement Plan for the East LondonIndustrial Development Zone
Arrange for the removal of alien vegetationalong the river banks by Working for Water
Control aquatic alien plants. Since theriver acts as a conduit for the down-stream dispersal of seeds, these plantsmust also be controlled upstream
Continue with the upgrading of thesewage treatment works
Conduct environmental awareness programmes to educate the public andschool children
THE BUFFALO RIVER ANDMARINE POLLUTION
Contaminants enter estuarine andocean waters via five primary path-ways: -- riverine inputs -- non-point source runoff from land-- direct pipeline discharges -- discharges and dumping from
ships -- atmospheric deposition
The most common human-generated wastes in estuarineand coastal marine environmentsworldwide are dredged spoils,sewage, and industrial andmunicipal discharges. Thesewastes generally contain a widerange of pollutants, notablyheavy metals, petroleum hydrocarbons, polycyclic aromatic hydrocarbons, chlorinated hydrocarbons, litter and other substances.
33
ESTUARIES
An estuary is the meeting placebetween a river and the sea. It is adynamic and complex ecosystem, withvarying levels of saline, brackish andfresh water. Estuaries are influenced by both marine and terrestrial environments. They support a uniquelyadapted but varying biodiversity.
The 6.5 km Buffalo estuary covers 98 ha and is about 4.7 m deep. Theharbour breakwaters keep the systempermanently open. Dredging has deep-ened the channel, removing the tidalflood delta and changing the character-istics of the estuary.
Fish, birds and botanical characteristicsare used to determine estuary health.A total of 23 fish species were sampledduring 1997. Five of these speciesbreed in estuaries and the young of 16species depend on estuaries. The natu-rally steep banks with little availableintertidal and floodplain habitat, as wellas the harbour construction, contributeto the low botanical diversity in theestuary (only 9 plant species wereidentified). Birdlife is sparse due tolong-term human influence.
High faecal coliform counts render thewater unsuitable for human contact.High nitrate and phosphate concentra-tions cause excessive algal growth.Raised heavy metal concentrationswere detected.
The overall state of the estuary is fairto poor.
The main threats posed by humanactivities to estuarine biodiversity inSouth Africa are: -- reduction in freshwater flows - - sedimentation due to soil erosion-- eutrophication - - residential and industrial develop-
ment - - road and rail construction across
estuaries - - fixing/stabilisation of mouths and - - pollution.
EAST LONDON
Gonubie
Beacon Bay
Cove Rock
Sunrise-on-sea
very polluted
polluted
COASTLINE AND DEGREEOF POLLUTION
34
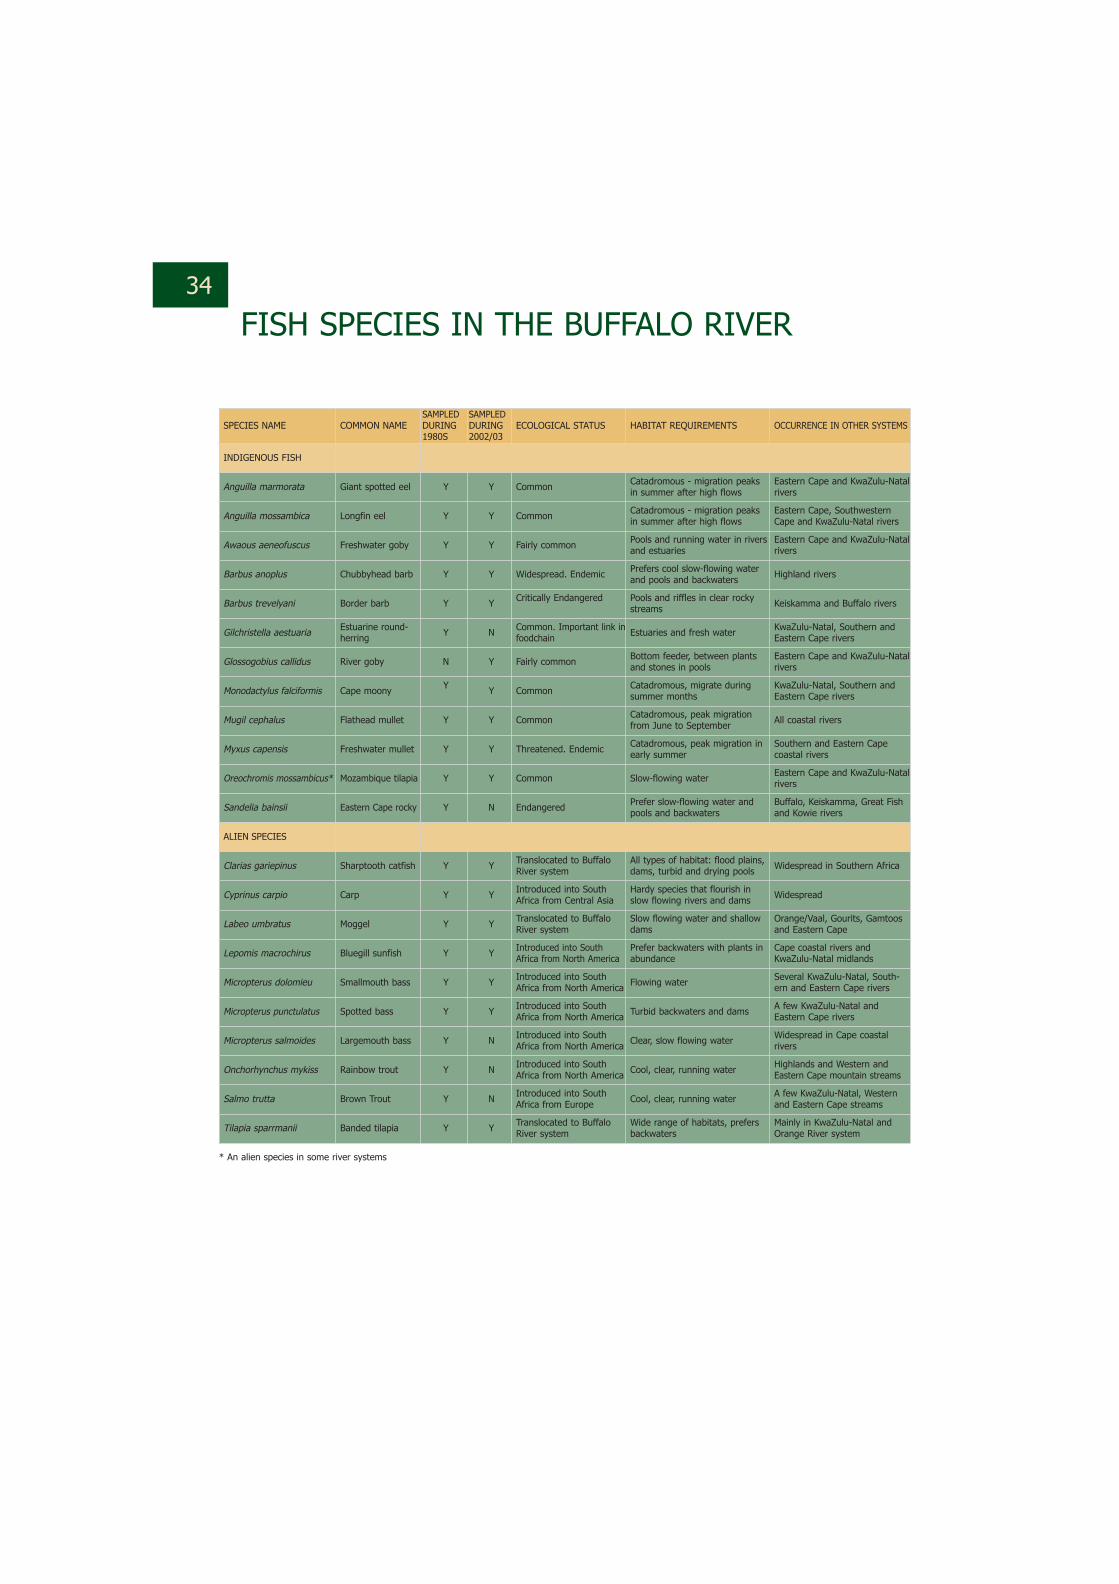
FISH SPECIES IN THE BUFFALO RIVER
SPECIES NAME COMMON NAMESAMPLEDDURING1980S
SAMPLEDDURING2002/03
ECOLOGICAL STATUS HABITAT REQUIREMENTS OCCURRENCE IN OTHER SYSTEMS
INDIGENOUS FISH
Anguilla marmorata Giant spotted eel Y Y Common Catadromous - migration peaksin summer after high flows
Eastern Cape and KwaZulu-Natalrivers
Anguilla mossambica Longfin eel Y Y Common Catadromous - migration peaksin summer after high flows
Eastern Cape, SouthwesternCape and KwaZulu-Natal rivers
Awaous aeneofuscus Freshwater goby Y Y Fairly common Pools and running water in riversand estuaries
Eastern Cape and KwaZulu-Natalrivers
Barbus anoplus Chubbyhead barb Y Y Widespread. Endemic Prefers cool slow-flowing waterand pools and backwaters Highland rivers
Barbus trevelyani Border barb Y Y Critically Endangered Pools and riffles in clear rockystreams Keiskamma and Buffalo rivers
Gilchristella aestuaria Estuarine round-herring Y N Common. Important link in
foodchain Estuaries and fresh water KwaZulu-Natal, Southern andEastern Cape rivers
Glossogobius callidus River goby N Y Fairly common Bottom feeder, between plantsand stones in pools
Eastern Cape and KwaZulu-Natalrivers
Monodactylus falciformis Cape moony Y Y Common Catadromous, migrate duringsummer months
KwaZulu-Natal, Southern andEastern Cape rivers
Mugil cephalus Flathead mullet Y Y Common Catadromous, peak migrationfrom June to September All coastal rivers
Myxus capensis Freshwater mullet Y Y Threatened. Endemic Catadromous, peak migration inearly summer
Southern and Eastern Capecoastal rivers
Oreochromis mossambicus* Mozambique tilapia Y Y Common Slow-flowing water Eastern Cape and KwaZulu-Natalrivers
Sandelia bainsii Eastern Cape rocky Y N Endangered Prefer slow-flowing water andpools and backwaters
Buffalo, Keiskamma, Great Fishand Kowie rivers
ALIEN SPECIES
Clarias gariepinus Sharptooth catfish Y Y Translocated to BuffaloRiver system
All types of habitat: flood plains,dams, turbid and drying pools Widespread in Southern Africa
Cyprinus carpio Carp Y Y Introduced into SouthAfrica from Central Asia
Hardy species that flourish inslow flowing rivers and dams Widespread
Labeo umbratus Moggel Y Y Translocated to BuffaloRiver system
Slow flowing water and shallowdams
Orange/Vaal, Gourits, Gamtoosand Eastern Cape
Lepomis macrochirus Bluegill sunfish Y Y Introduced into SouthAfrica from North America
Prefer backwaters with plants inabundance
Cape coastal rivers andKwaZulu-Natal midlands
Micropterus dolomieu Smallmouth bass Y Y Introduced into SouthAfrica from North America Flowing water Several KwaZulu-Natal, South-
ern and Eastern Cape rivers
Micropterus punctulatus Spotted bass Y Y Introduced into SouthAfrica from North America Turbid backwaters and dams A few KwaZulu-Natal and
Eastern Cape rivers
Micropterus salmoides Largemouth bass Y N Introduced into SouthAfrica from North America Clear, slow flowing water Widespread in Cape coastal
rivers
Onchorhynchus mykiss Rainbow trout Y N Introduced into SouthAfrica from North America Cool, clear, running water Highlands and Western and
Eastern Cape mountain streams
Salmo trutta Brown Trout Y N Introduced into SouthAfrica from Europe Cool, clear, running water A few KwaZulu-Natal, Western
and Eastern Cape streams
Tilapia sparrmanii Banded tilapia Y Y Translocated to BuffaloRiver system
Wide range of habitats, prefersbackwaters
Mainly in KwaZulu-Natal andOrange River system
* An alien species in some river systems
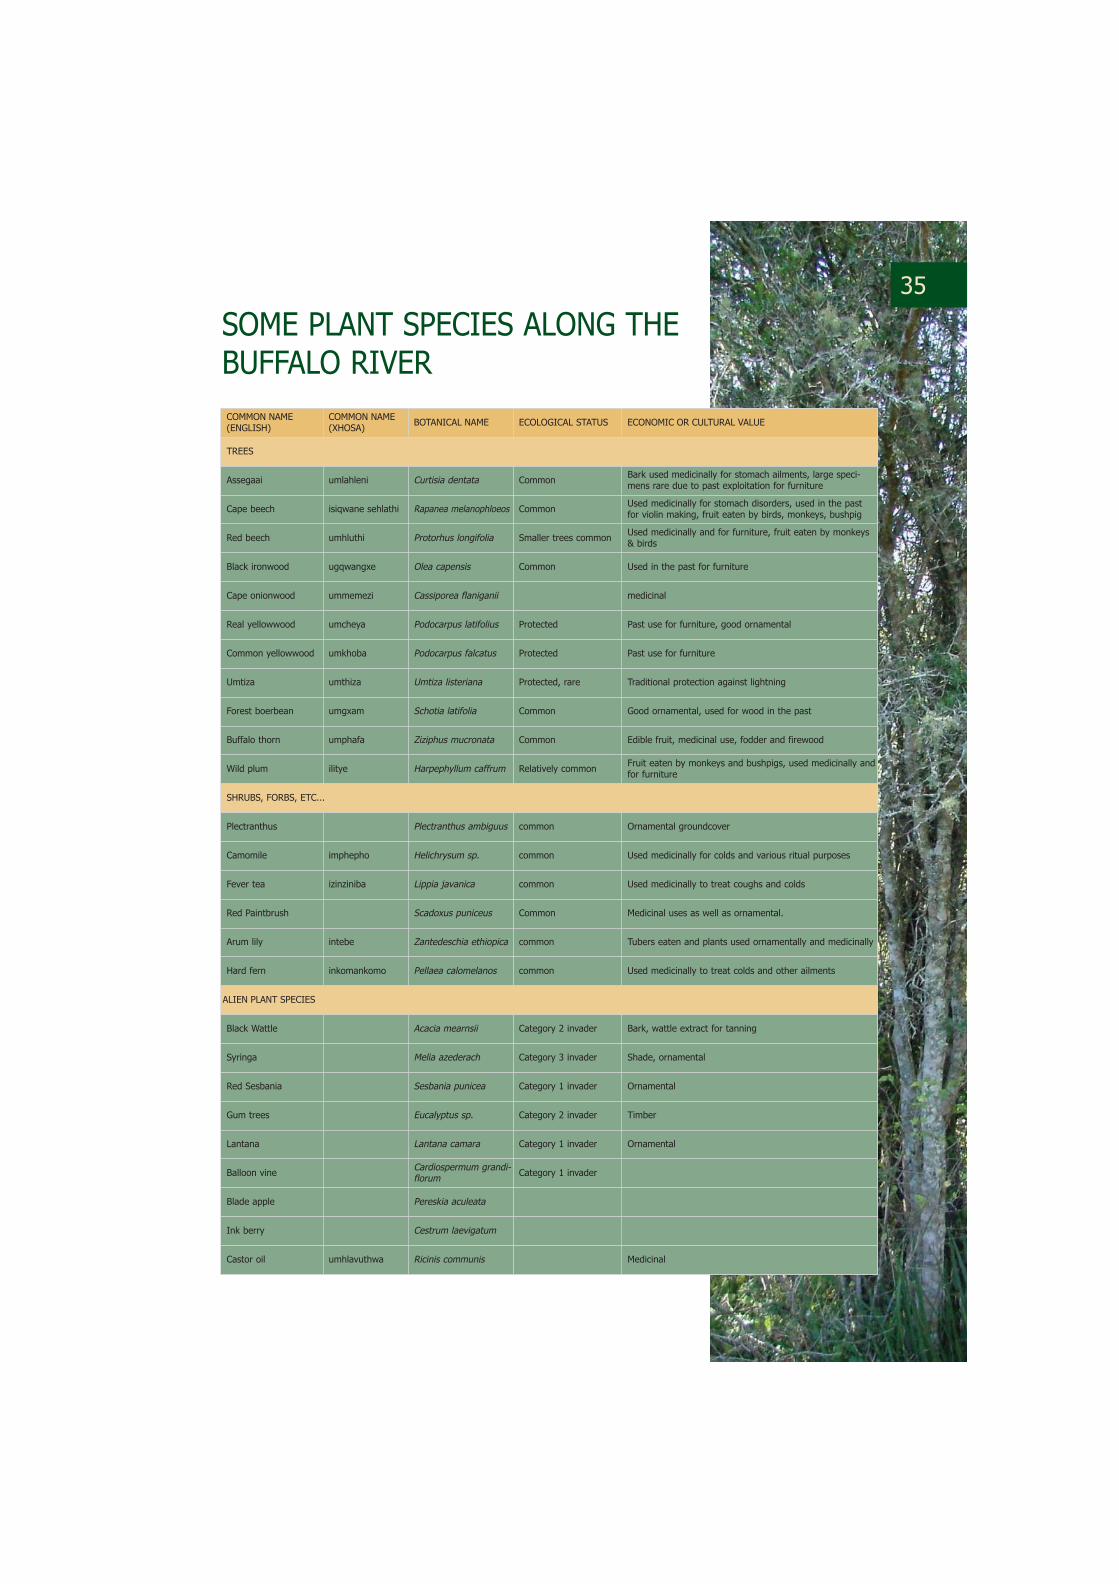
COMMON NAME(ENGLISH)
COMMON NAME(XHOSA) BOTANICAL NAME ECOLOGICAL STATUS ECONOMIC OR CULTURAL VALUE
TREES
Assegaai umlahleni Curtisia dentata Common Bark used medicinally for stomach ailments, large speci-mens rare due to past exploitation for furniture
Cape beech isiqwane sehlathi Rapanea melanophloeos Common Used medicinally for stomach disorders, used in the pastfor violin making, fruit eaten by birds, monkeys, bushpig
Red beech umhluthi Protorhus longifolia Smaller trees common Used medicinally and for furniture, fruit eaten by monkeys& birds
Black ironwood ugqwangxe Olea capensis Common Used in the past for furniture
Cape onionwood ummemezi Cassiporea flaniganii medicinal
Real yellowwood umcheya Podocarpus latifolius Protected Past use for furniture, good ornamental
Common yellowwood umkhoba Podocarpus falcatus Protected Past use for furniture
Umtiza umthiza Umtiza listeriana Protected, rare Traditional protection against lightning
Forest boerbean umgxam Schotia latifolia Common Good ornamental, used for wood in the past
Buffalo thorn umphafa Ziziphus mucronata Common Edible fruit, medicinal use, fodder and firewood
Wild plum ilitye Harpephyllum caffrum Relatively common Fruit eaten by monkeys and bushpigs, used medicinally andfor furniture
SHRUBS, FORBS, ETC...
Plectranthus Plectranthus ambiguus common Ornamental groundcover
Camomile imphepho Helichrysum sp. common Used medicinally for colds and various ritual purposes
Fever tea izinziniba Lippia javanica common Used medicinally to treat coughs and colds
Red Paintbrush Scadoxus puniceus Common Medicinal uses as well as ornamental.
Arum lily intebe Zantedeschia ethiopica common Tubers eaten and plants used ornamentally and medicinally
Hard fern inkomankomo Pellaea calomelanos common Used medicinally to treat colds and other ailments
ALIEN PLANT SPECIES
Black Wattle Acacia mearnsii Category 2 invader Bark, wattle extract for tanning
Syringa Melia azederach Category 3 invader Shade, ornamental
Red Sesbania Sesbania punicea Category 1 invader Ornamental
Gum trees Eucalyptus sp. Category 2 invader Timber
Lantana Lantana camara Category 1 invader Ornamental
Balloon vine Cardiospermum grandi-florum Category 1 invader
Blade apple Pereskia aculeata
Ink berry Cestrum laevigatum
Castor oil umhlavuthwa Ricinis communis Medicinal
35
SOME PLANT SPECIES ALONG THE BUFFALO RIVER
36
GLOSSARYAlien species Fauna and flora introduced inten-tionally or by accident into a coun-try or (eco)region that is not partof their natural range Not all alienspecies are invasive or undesirable.
AnthropogenicCaused or produced by humanactivities.
Aquatic biomonitoring The monitoring of the condition oforganisms in rivers, wetlands andlakes in order to gauge the overallquality of the aquatic environment.
Aquatic invertebrates A broad collective term for theinsects, larvae, crustacea andother small animal life inhabitingrivers and lakes: "invertebrate"means "lacking a backbone" andexcludes amphibians, fish, birds,mammals and reptiles.
Biodiversity The structure, composition, andfunctions of living organisms, andthe ecological complexity of habi-tats in which they occur. Itincludes the richness, abundance,and variability of plant and animalspecies and communities and theecological processes that link themwith one another.
Biota Living plants and animals.
Buffalo CityThe megacity of Bhisho, EastLondon, King William's Town andMdantsane.
Buffer ZoneA buffer strip on the outer edge ofthe riparian zone is required toprotect the habitat and the waterresource. A minimum of 20 m isrequired depending on the type ofland-use, the sensitivity of thehabitat and the scarcity of thewater resource.
CatadromousA catadromous fish (such as theeel) lives most of its life in freshwater and breeds at sea. The larvae
and juveniles then migrateupstream. After a number of years,the adults migrate downstreamagain to breed at sea. Theirmigratory life history makes thesefish vulnerable to man-inducedchanges in river flow, becausedams, weirs and low flows preventor interrupt migration.(Anadromous fish, such as NorthAmerican salmon, start off in freshwater, live in the sea, and returnto rivers to breed.)
Desired health The envisioned ecological state ofthe river, determined by consider-ing the ecological importance andsensitivity of the specific riverecosystems.
Ecological sensitivity The ability of a specific ecosystemto tolerate disturbances and torecover from certain impacts. Lackof sensitivity, however, does notalways imply the ability to recover.
Ecologically sound Maintaining the integrity of inter-relations between living things andtheir surroundings.
Ecosystem A natural system in which livingorganisms interact with their sur-roundings through the processesof production, consumption anddecomposition: an aquatic ecosys-tem could range in scale from apuddle of water to a whole lake.
Environmental flow require-ment (EFR) The flow (quality and quantity)needed to maintain a river in apre-determined state of health.
EutrophicationThe natural process of nutrientenrichment (from rocks that aregradually weathered and dissolvedin runoff from the surroundingcatchment). It is greatly accelerat-ed by human impacts such assewage and fertiliser. Abnormallyhigh nutrient loads cause eutrophi-cation and algal blooms. When theblooms decay and settle in a dam,
the bottom layer becomes depletedof oxygen.
Fauna The collective term for animals liv-ing in a particular area.
Flora The collective term for plants grow-ing in a particular area.
Geomorphology The study of the structure of physi-cal features of the earth especiallyin relation to the underlying geo-logical structure.
Indigenous species Fauna and flora occurring naturallyin an area.
In-stream Within the river channel.
Marine pollution The introduction by human activi-ties, directly or indirectly, of sub-stances or energy into the marineenvironment, resulting in deleteri-ous effects that harm livingresources, are hazardous to humanhealth, hinder marine activitiesincluding fisheries, impair the quali-ty of seawater, and cause a reduc-tion of amenities.
Present health A measure of the present ecologicalstate of the river during the time ofthe River Health Programme survey.This is expressed as a river healthcategory that reflects how muchthe river has changed from its nat-ural state.
Riparian habitat Refers to the habitat on both banksof the river.
Riparian zone The area adjacent to a river orwater body that forms part of theriver ecosystem. The riparian zoneplays an essential role in the func-tioning of the river ecosystem. It ischaracterised by frequent inunda-tion or sufficient flooding to sup-port vegetation that is distinct fromthe surrounding area.
FURTHER READING37
Avis, Carter & Logie. (2004). Summary Report of the Proposed Marine Pipeline Wastewater TreatmentFacility at Hood Point on the West Bank of East London. Buffalo City Municipality. East London.
Buffalo City Municipality. (2002) Integrated Development Plan.
Davies & Day (1998). Vanishing Waters. UCT Press.
DWAF (2004). Operational Policy for the disposal of land-derived water containing waste to the MarineEnvironment of South Africa. DWAF in collaboration with CSIR. Stellenbosch.
DWAF (2004). Strategic Framework for National Water Resource Quality Monitoring Programmes by DC Grobler and M Ntsaba. Report No. N/0000/REQ0204. ISBN 0-621-35069-9. Resource Quality Services,Department of Water Affairs and Forestry, Pretoria, South Africa.
Fatoki, O.S., Mathabatha, S. (2001). An assessment of heavy metal pollution in the East London and PortElizabeth harbours. Water SA, 27(2).
Haigh, EH, Bosman, LR, Jones, RR, Illgner, PM (2004). Inventory of the wetlands in selected Eastern Capecatchments. Report for the Department of Water Affairs and Forestry, Eastern Cape, South Africa.
Hart, R.C. and Bartel, R. E. (1983). Water Quality in the Buffalo River. In: Institute of Water PollutionControl (IWPC) Biennial Conference, East London. CSIR, Stellenbosch.
Kennish, M.J. (1996). Practical Handbook of Estuarine and Marine Pollution. Institute of Marine and CoastalSciences. Rutgers University. CRC Press, Boca Raton, Florida, USA.
Kennish, M.J. (1999). Estuary Restoration and Maintenance: The National Estuary Program. Institute ofMarine and Coastal Sciences. Rutgers University. CRC Press, Boca Raton, Florida, USA.
Low, A.B. and Rebelo, A.G. (1998). Vegetation of South Africa, Lesotho and Swaziland. Department ofEnvironmental Affairs and Tourism, Pretoria.
National State of the Environment Report: South Africahttp://www.ngo.grida.no/soesa/nsoer/issues/water/state3.htm
O'Keeffe, J.H., Van Ginkel, C.E., Hughes, D.A., Hill, T.R., Ashton, P.J. (1996). A Situation Analysis of WaterQuality in the Catchment of the Buffalo River, Eastern Cape, with Special Emphasis on the Impacts of LowCost, High-Density Urban Development on Water Quality. Volumes I and II. WRC Report No 405/1/96.
Rowntree, K.M. and Wadeson, R.A. (1999). A Hierarchial Geomorphological Model for the Classification ofSelected South African Rivers. WRC Report No 497/1/99. Water Research Commission, Pretoria.
Scherman, P-A., Muller, W. J., Gordon, A., Reynhardt, D., du Preez, L. and Chalmers, R. 2004. Buffalo RiverTechnical Report: Draft Report prepared for DWAF, King William's Town.
Sediment Assessment Campaign (2003) for the Port of East London. CSIR. Congella.
Skelton, P.H. (1993). Freshwater Fishes of Southern Africa. Southern Book Publishers, Halfway House.
The Eastern Cape Coastal Management Program (2004). Summary Report. Coastal & EnvironmentalServices, EnviroFish and MBB Consulting Services. Grahamstown.
Tow, M. (1981). Physico-chemical Limnology of Bridle Drift, Laing and Nahoon Dams. Joint NIWR (CSIR),WRC, East London Municipality Report. CSIR, Pretoria.
Turpie, J. (2002). Draft Report: The current state of protection and health of estuarine biodiversity in SouthAfrica, with emphasis on the Eastern Cape Estuaries. Institute of Natural Resources. WRC Report in press.
Walmsley, R.D., Walmsley, J.J., and Breytenbach, R. (1999). An overview of water quality management ofSouth Africa's major port-catchment systems. WRC No. 794/1/99. Water Research Commission, Pretoria.
Zokufa, T.S. (2001). Tolerance of Selected Riverine Indigenous Macroinvertebrates from the Buffalo Riverand Sabie River to Complex Saline Kraft and Textile Effluents. MSc Thesis, Rhodes University. Grahamstown.
38
THE RHP IN THE EASTERN CAPE: ORGANISATIONAL ARRANGEMENTS
EASTERN CAPE TEAM
The DWAF: Eastern Cape RegionalOffice leads the RHP in theprovince and interacts with variousrole players. Many new relation-ships are emerging in response topolicy requirements for greaterintegration and co-operation inenvironmental planning and man-agement. These developments arealso affected by a rapidly changinginstitutional environment, with theestablishment of new institutionssuch as catchment forums, WaterUser Associations and CatchmentManagement Agencies.
The River Health team already hasstrong research partners in univer-sities and consultancies. The teamplans to broaden these links toinclude other research bodies. TheRiver Health team maintains an
information exchange relationshipwith Amatola Water Board and iseager to link with local catchmentforums as they develop.
Emerging partners in local government include the provincialDept. of Health, provincial Dept. of Education, provincial DEAT andBuffalo City Municipality. TheNational Ports Authority (NPA) andprovincial Dept. of Agriculture arepotentially strong partners for themedium and long term, providingspecialist perspectives.
The Eastern Cape team alsoregards other provincial RiverHealth teams as potential partners(in particular their neighbours:Western Cape, Kwazulu-Natal andthe Free State teams), to shareexperience as part of strengtheningtheir River Health knowledge base.
DEVELOPMENT OF THERHP IN THE EASTERNCAPE
The Institute for Water Research(IWR) at Rhodes University spear-headed the introduction of a RiverHealth Programme (RHP) in theEastern Cape in 1996. The pro-gramme finally took off in 2002 withfinancial assistance from thenational RHP. The leadership of theprogramme was based at Coastaland Environmental Services (CES) atthe time and was handed over tothe Eastern Cape Regional Office ofDWAF in 2004: the University, CESand various consultants continue toprovide technical strength to theprovincial team. The challengeahead will be to expand the teamand to strengthen the team's capaci-ty to take the programme forward.
The NPA, a para-statal organisa-tion, is responsible for the use andmanagement of the Port of EastLondon. Its tasks include monitor-ing its own impacts on the estuaryand the cumulative impacts ofupstream activities. Activities thatwould promote better co-ordina-tion of, and understanding of,catchment-based impacts include: - Briefing sessions where the RHP
presents river health results.These would encourage discus-sion around the relationshipbetween river health, estuaryhealth and marine health.
- Establishment of a catchmentforum to define a commonobjective for the catchment.With a common objective, par-ticipants will better understand
their responsibilities towardshealthier riverine, estuary andmarine systems.
The link between the NPA and theEastern Cape RHP holds muchpotential for DWAF: Eastern CapeRegion and DEAT to show that gov-ernment departments can worktogether in areas such as wise allo-cation of water use authorisations.
STRATEGIC PARTNERSHIP EXAMPLESTHE RHP, DEPARTMENT OF HEALTH (ENVIRONMENTAL HEALTH) AND BUFFALO CITY IEMP (POLLUTION CONTROL)
The Department of Health is respon-sible for identifying pollution sourcesthat may affect human health. Riverhealth results reflect a river's inte-grated ecological response to numer-ous catchment-based activities. Theprovincial River Health Programme,the Department of Health and thelocal municipality therefore need toexplore meaningful linkages betweentheir goals and systems. Already, theIDPs of both Buffalo City Municipality
and Amatole District Municipality linkwith Buffalo River issues.
Preliminary areas where theDepartment of Health (EnvironmentalHealth) and Buffalo City Municipality(Pollution Control) can make use ofRiver Health results include:- An additional layer of information
to help decide whether or not thestate of the resource will impactnegatively on human health.
- Strengthen confidence aroundcause-and-effect relationshipsrelating to observed river healthstate and trends, using pollutionmonitoring results.
- Local government's IntegratedEnvironmental ManagementPlanning and IntegratedDevelopment Planning process.
- Capitalising on joint awarenessprogrammes.
THE RHP AND NATIONAL PORTS AUTHORITY (NPA)
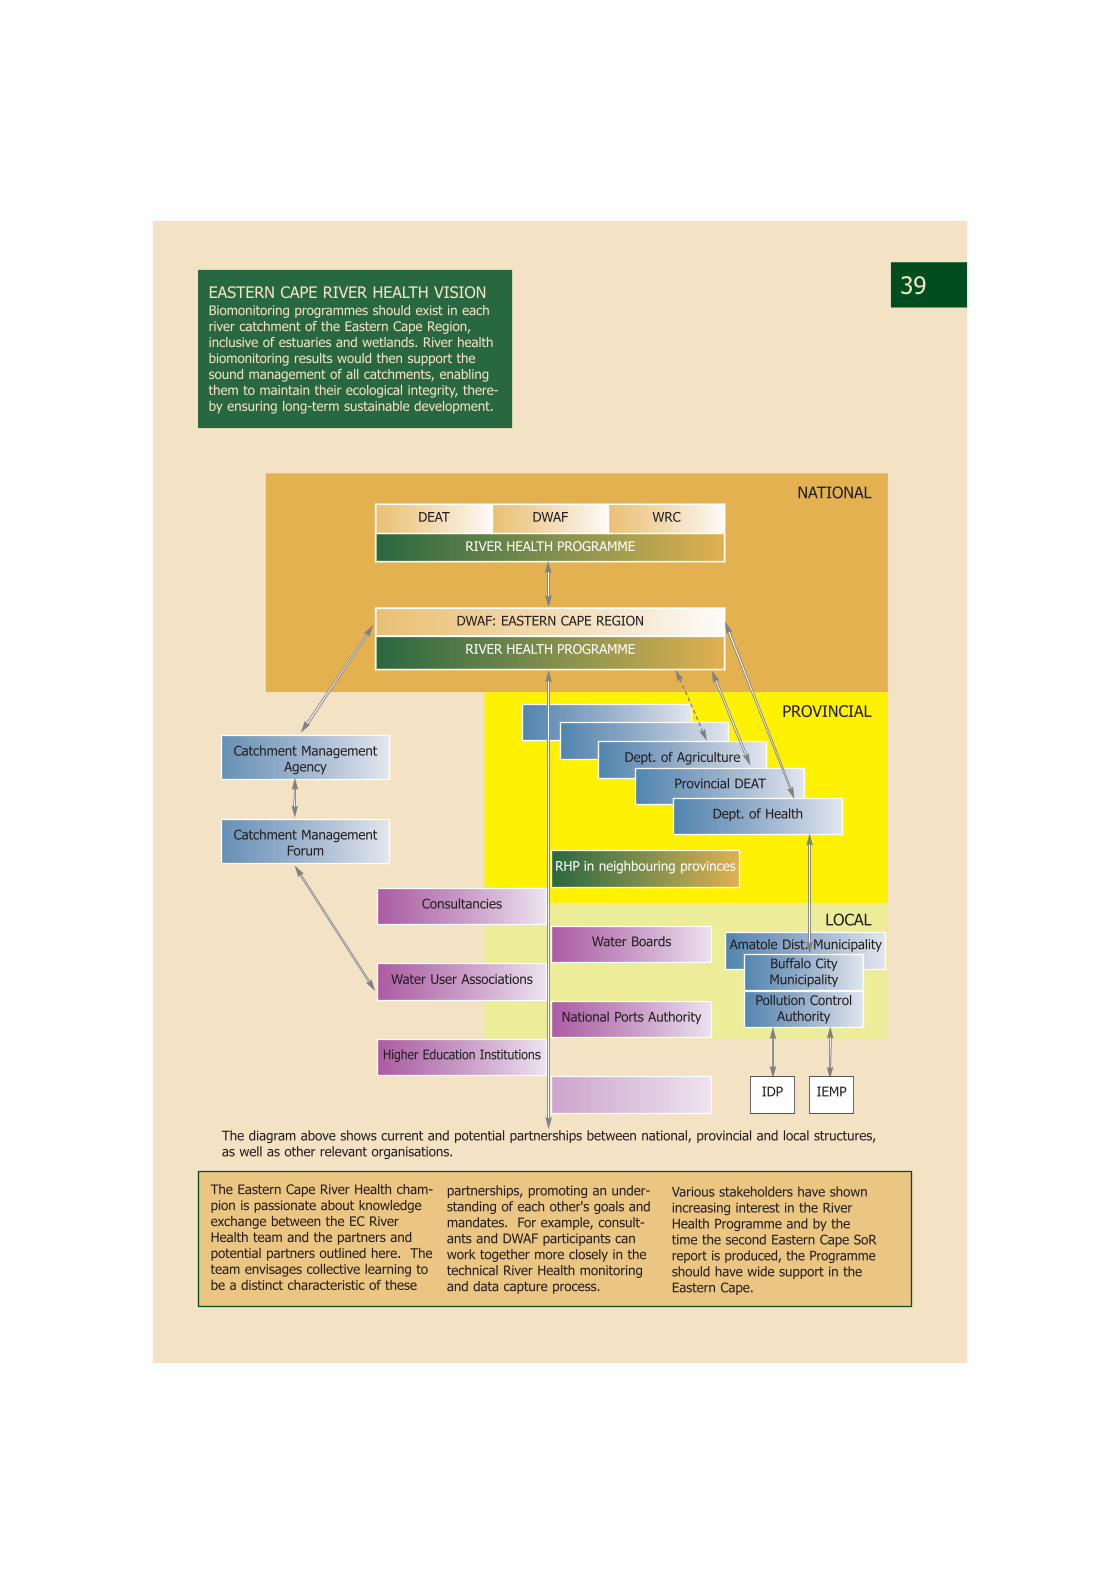
39
DEAT DWAF WRC
RIVER HEALTH PROGRAMME
DWAF: EASTERN CAPE REGION
RIVER HEALTH PROGRAMME
NATIONAL
PROVINCIAL
LOCAL
Dept. of Agriculture
Provincial DEAT
Dept. of Health
RHP in neighbouring provinces
Consultancies
Water Boards
Pollution ControlAuthority
Amatole Dist. Municipality
Higher Education Institutions
National Ports Authority
Water User Associations
Catchment ManagementAgency
Catchment ManagementForum
EASTERN CAPE RIVER HEALTH VISIONBiomonitoring programmes should exist in eachriver catchment of the Eastern Cape Region,inclusive of estuaries and wetlands. River healthbiomonitoring results would then support thesound management of all catchments, enablingthem to maintain their ecological integrity, there-by ensuring long-term sustainable development.
IDP IEMP
The Eastern Cape River Health cham-pion is passionate about knowledgeexchange between the EC RiverHealth team and the partners andpotential partners outlined here. Theteam envisages collective learning tobe a distinct characteristic of these
partnerships, promoting an under-standing of each other's goals andmandates. For example, consult-ants and DWAF participants canwork together more closely in thetechnical River Health monitoringand data capture process.
Various stakeholders have shownincreasing interest in the RiverHealth Programme and by thetime the second Eastern Cape SoRreport is produced, the Programmeshould have wide support in theEastern Cape.
Buffalo CityMunicipality
The diagram above shows current and potential partnerships between national, provincial and local structures,as well as other relevant organisations.
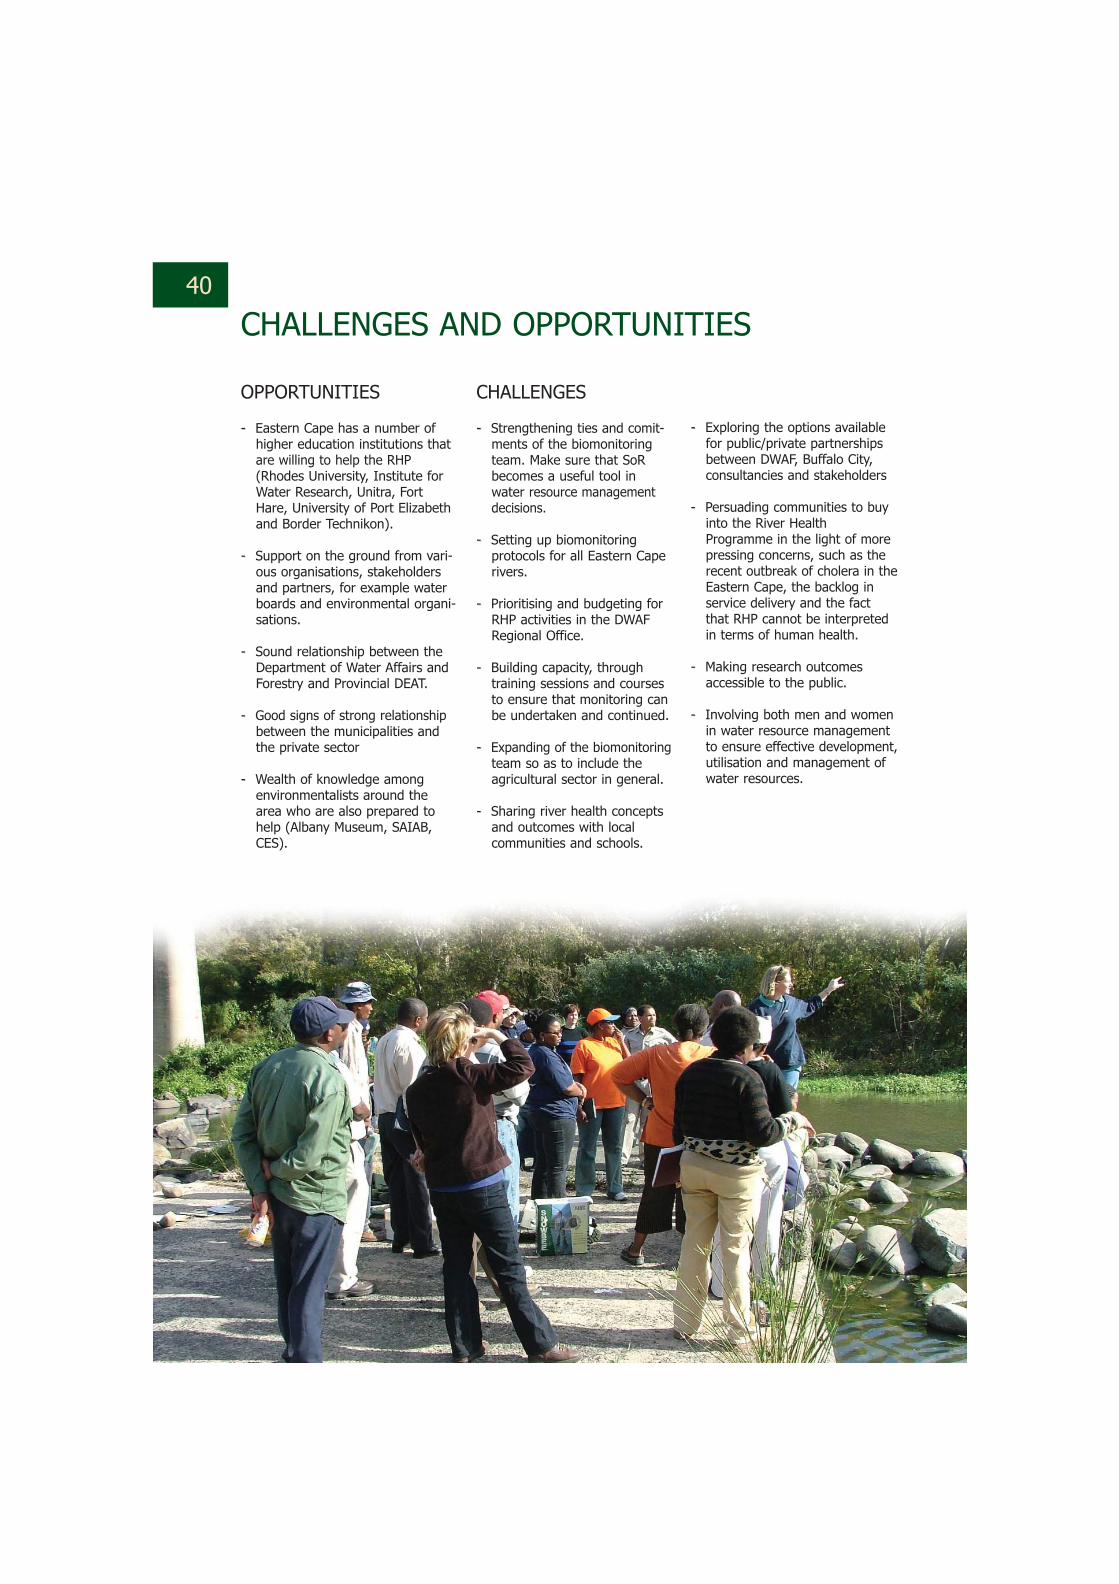
40
CHALLENGES AND OPPORTUNITIES
OPPORTUNITIES
-- Eastern Cape has a number of higher education institutions thatare willing to help the RHP(Rhodes University, Institute forWater Research, Unitra, FortHare, University of Port Elizabethand Border Technikon).
-- Support on the ground from vari-ous organisations, stakeholdersand partners, for example waterboards and environmental organi-sations.
-- Sound relationship between theDepartment of Water Affairs andForestry and Provincial DEAT.
-- Good signs of strong relationshipbetween the municipalities andthe private sector
-- Wealth of knowledge amongenvironmentalists around thearea who are also prepared tohelp (Albany Museum, SAIAB,CES).
CHALLENGES
-- Strengthening ties and comit-ments of the biomonitoringteam. Make sure that SoRbecomes a useful tool inwater resource managementdecisions.
-- Setting up biomonitoring protocols for all Eastern Caperivers.
-- Prioritising and budgeting forRHP activities in the DWAFRegional Office.
-- Building capacity, throughtraining sessions and coursesto ensure that monitoring canbe undertaken and continued.
-- Expanding of the biomonitoringteam so as to include theagricultural sector in general.
-- Sharing river health conceptsand outcomes with local communities and schools.
-- Exploring the options availablefor public/private partnershipsbetween DWAF, Buffalo City,consultancies and stakeholders
-- Persuading communities to buyinto the River HealthProgramme in the light of morepressing concerns, such as therecent outbreak of cholera in theEastern Cape, the backlog inservice delivery and the factthat RHP cannot be interpretedin terms of human health.
-- Making research outcomesaccessible to the public.
-- Involving both men and womenin water resource managementto ensure effective development,utilisation and management ofwater resources.
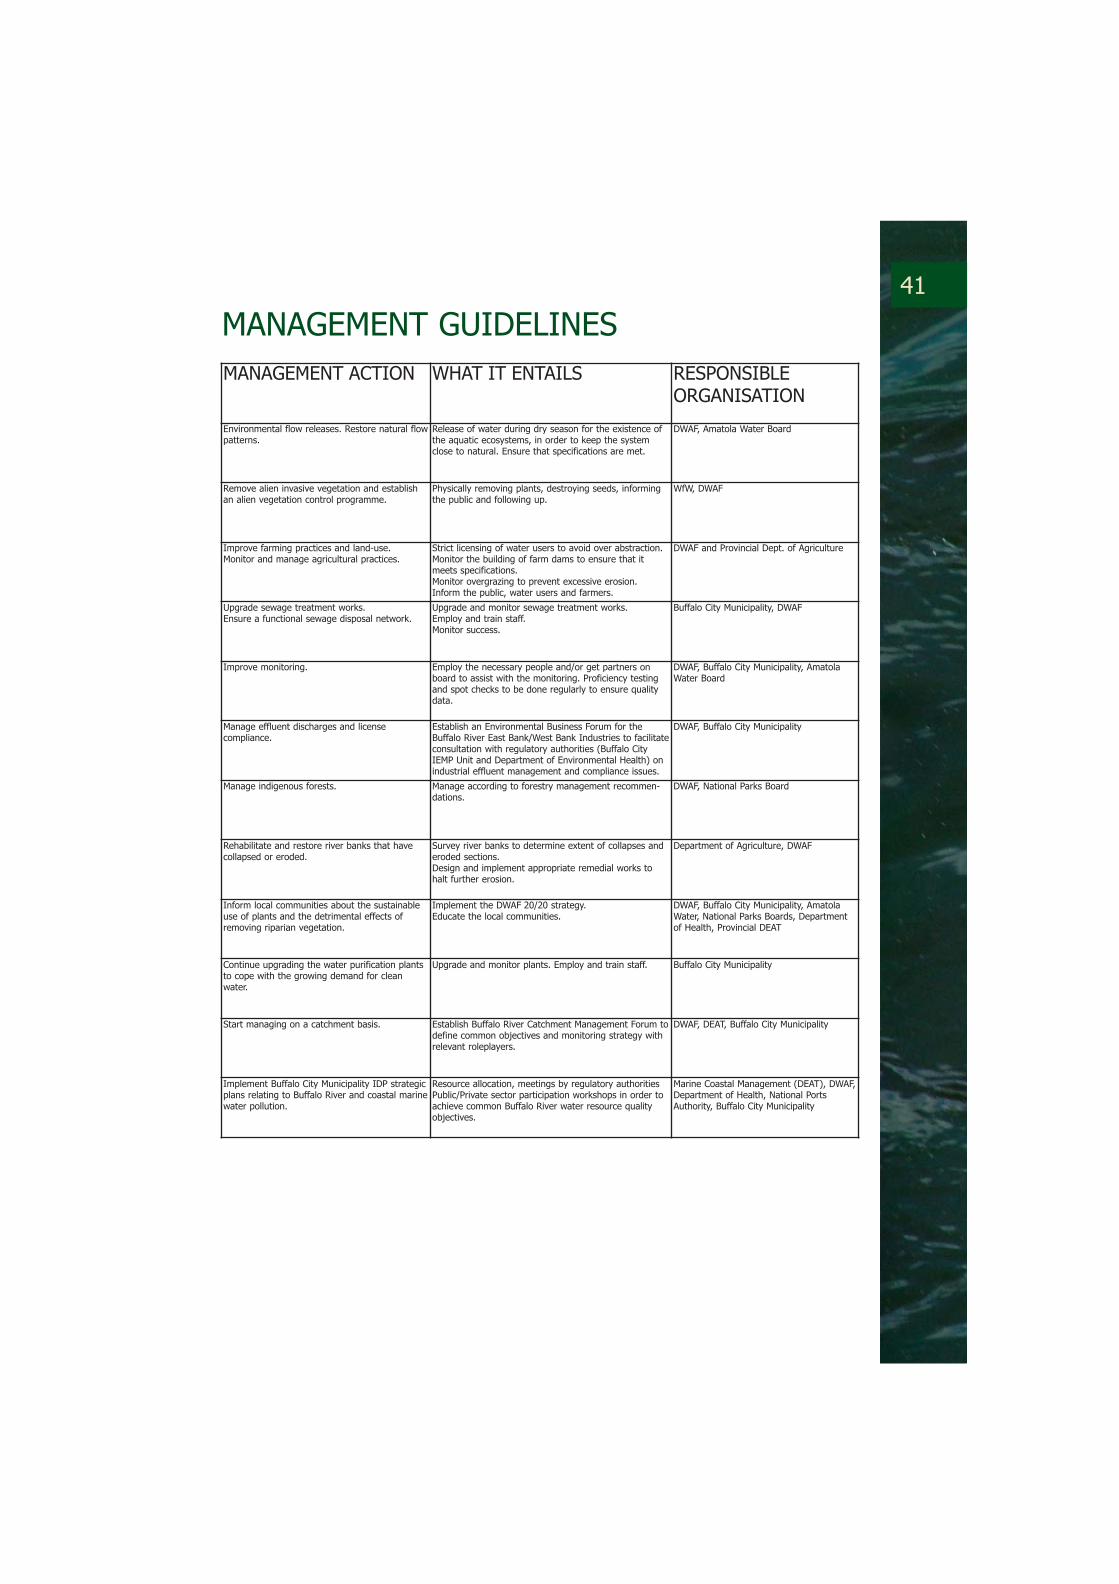
41
MANAGEMENT ACTION WHAT IT ENTAILS RESPONSIBLEORGANISATION
Environmental flow releases. Restore natural flowpatterns.
Release of water during dry season for the existence ofthe aquatic ecosystems, in order to keep the systemclose to natural. Ensure that specifications are met.
DWAF, Amatola Water Board
Remove alien invasive vegetation and establishan alien vegetation control programme.
Physically removing plants, destroying seeds, informingthe public and following up.
WfW, DWAF
Improve farming practices and land-use.Monitor and manage agricultural practices.
Strict licensing of water users to avoid over abstraction.Monitor the building of farm dams to ensure that itmeets specifications. Monitor overgrazing to prevent excessive erosion.Inform the public, water users and farmers.
DWAF and Provincial Dept. of Agriculture
Upgrade sewage treatment works.Ensure a functional sewage disposal network.
Upgrade and monitor sewage treatment works.Employ and train staff.Monitor success.
Buffalo City Municipality, DWAF
Improve monitoring. Employ the necessary people and/or get partners onboard to assist with the monitoring. Proficiency testingand spot checks to be done regularly to ensure qualitydata.
DWAF, Buffalo City Municipality, AmatolaWater Board
Manage effluent discharges and license compliance.
Establish an Environmental Business Forum for theBuffalo River East Bank/West Bank Industries to facilitateconsultation with regulatory authorities (Buffalo CityIEMP Unit and Department of Environmental Health) onindustrial effluent management and compliance issues.
DWAF, Buffalo City Municipality
Manage indigenous forests. Manage according to forestry management recommen-dations.
DWAF, National Parks Board
Rehabilitate and restore river banks that havecollapsed or eroded.
Survey river banks to determine extent of collapses anderoded sections.Design and implement appropriate remedial works tohalt further erosion.
Department of Agriculture, DWAF
Inform local communities about the sustainableuse of plants and the detrimental effects ofremoving riparian vegetation.
Implement the DWAF 20/20 strategy.Educate the local communities.
DWAF, Buffalo City Municipality, AmatolaWater, National Parks Boards, Departmentof Health, Provincial DEAT
Continue upgrading the water purification plantsto cope with the growing demand for cleanwater.
Upgrade and monitor plants. Employ and train staff. Buffalo City Municipality
Start managing on a catchment basis. Establish Buffalo River Catchment Management Forum todefine common objectives and monitoring strategy withrelevant roleplayers.
DWAF, DEAT, Buffalo City Municipality
Implement Buffalo City Municipality IDP strategicplans relating to Buffalo River and coastal marinewater pollution.
Resource allocation, meetings by regulatory authoritiesPublic/Private sector participation workshops in order toachieve common Buffalo River water resource qualityobjectives.
Marine Coastal Management (DEAT), DWAF,Department of Health, National PortsAuthority, Buffalo City Municipality
MANAGEMENT GUIDELINES

DEPARTMENT: WATER AFFAIRS AND FORESTRY DEPARTMENT: ENVIRONMENTAL AFFAIRS AND TOURISMWater Research Commission
http://www.csir.co.za/rhp/
![[XLS]icmsweb.justice.gov.zaicmsweb.justice.gov.za/master/maseti/pmb/pmb_estates16a.xls · Web viewGOBA 03/03VERULAM 11671/2003 DOFO BERTINA 18 Jun 2002 5355/2002 CONSTANCE JABULILE](https://img.pdfslide.net/doc/110x75/5ac18f9f7f8b9a5a4e8d49eb/xls-viewgoba-0303verulam-116712003-dofo-bertina-18-jun-2002-53552002-constance.jpg)

![Smjernice Guidelines155 smjernice za higijenu ruku u zdravstvenim ustanovama guidelines on hand hygiene in health care institutions smilja kaleni], ana budimir, zrinka bo[njak, lorena](https://img.pdfslide.net/doc/110x75/606375b17209417ea40878f3/smjernice-155-smjernice-za-higijenu-ruku-u-zdravstvenim-ustanovama-guidelines-on.jpg)


![[XLS]icmsweb.justice.gov.zaicmsweb.justice.gov.za/master/maseti/pta/pta_insolve10.xls · Web viewSELLO MASHAO RASETHABA 447 082 398 7613 TLABO, IGNATIUS MAENETJA 868 21 Sep 2004 07](https://img.pdfslide.net/doc/110x75/5b06f1157f8b9ad1768d6ff0/xls-viewsello-mashao-rasethaba-447-082-398-7613-tlabo-ignatius-maenetja-868-21.jpg)


![ИЗДАЊЕ ШУМАДИЈСКЕ ЕПАРХИЈЕ 5/2012 › ... › kalenic5,2012.pdf5, 2012 4 KALENI] забрањено за јело – није била смоква, као](https://img.pdfslide.net/doc/110x75/5f0f9f6d7e708231d4451471/-oe-52012-a-a-kalenic52012pdf.jpg)


![DWAF Water By-laws Water By-laws.pdf · PAGE 4 [DRAFT VERSION] DWAF MODEL WATER SERVICES BY-LAWS PAGE 4 Building Regulations and Building Standards, 1977 (Act No 103 of 1977) as amended;](https://img.pdfslide.net/doc/110x75/5ae52c407f8b9ae1578bf548/dwaf-water-by-water-by-lawspdfpage-4-draft-version-dwaf-model-water-services.jpg)