Embed Size (px)
Citation preview

1
Buffett’sAssetAllocationAdvice:TakeIt…WithaTwist
JavierEstradaIESEBusinessSchool,DepartmentofFinance,Av.Pearson21,08034Barcelona,Spain
Tel:+34932534200,Fax:+34932534343,Email:[email protected]
AbstractOneofthemostimportantdecisionsretireesneedtomakeistheassetallocationoftheirportfolios.Theycanhaveastaticoradynamicallocation,andsimplicityusuallyfavorstheformer.WarrenBuffettrecentlyaddedanothervoteforstaticallocationsbyrevealingthathehadadvisedatrusteetosplitthebequesthiswifewillreceive90%instocksand10%inshort‐termbonds.Theevidencediscussedhereshowsthat,relativetootherstaticallocations,a90/10splithasaverylowfailurerateandprovidesinvestorswithverygoodupsidepotentialanddownsideprotection.Theevidencealsoshowsthattwominortwiststothe90/10splitresultintwoverysimpledynamicstrategieswithevenbetterupsidepotentialanddownsideprotection.
November,2015
1.Introduction
Retirees need to carefully balance the risk of spending too much and outliving their
savingswiththeriskofspendingtoo littleand lowering their lifestyleunnecessarily.The two
maintoolstheycanusetoavoidfallingoneithersideofthecliffaretheportfolio’swithdrawal
rate and asset allocation. Regarding the latter, in his 2013 letter to Berkshire Hathaway
shareholders,WarrenBuffettdiscussedthesimpleadvicehegavetothetrusteethatwillmanage
thebequesthiswifewillreceive:
“WhatIadvisehereisessentiallyidenticaltocertaininstructionsI’velaidoutinmywill.One bequestprovides that cashwill be delivered toa trustee formywife’sbenefit…Myadvicetothetrusteecouldnotbemoresimple:Put10%ofthecashinshort‐termgovernmentbondsand90% inavery low‐costS&P500 index fund.(IsuggestVanguard’s.)Ibelievethetrust’slong‐termresultsfromthispolicywillbesuperiortothoseattainedbymostinvestors–whetherpensionfunds,institutionsorindividuals–whoemployhigh‐feemanagers.”(Page20)
Buffettdoessuggestinhisletterthatinvestorsshouldfollowasimpleapproach,passively
investinginabroadly‐diversified,low‐costportfolio;hedoesnotsuggestorimply,however,that
investorsshouldhavea90/10stock/bondallocation.Andyethiscommentbegsthequestion:Is
theassetallocationBuffettadvisedforhiswifeappropriateforotherinvestors?Ifyes,why?If
not,whynot?
IwouldliketothankJackRaderforhiscomments.JavierZazurcaandDavidTamayoprovidedvaluableresearchassistance.Theviewsexpressedbelowandanyerrorsthatmayremainareentirelymyown.
2
AnobviousdistinctionbetweenBuffett’swifeandtheaverageinvestorquicklycomesto
mind.Theaverageinvestorneedstoimplementanassetallocationthatcarefullybalancesthetwo
risksalreadymentioned,overspendingandunderspending.Buffett’swife,however,islikelyto
receiveanestegglargeenoughsothatshewillnothavetoworryabouteitherrisk.Putdifferently,
justaboutanyassetallocationwillenableBuffett’swifetolivecomfortablyandstilloutliveher
portfolio,whichisnotthecaseformostinvestors.
Thatsaid,thisarticleevaluatesthemeritsofthe90/10allocationthatBuffettadvisedfor
hiswife,relativetootherstaticallocationswithdifferentstock/bondproportions,forinvestors
atlarge.Furthermore,itexplorestwominortwiststothe90/10allocation,onethataccountsfor
thebehaviorofthestockmarket,andtheotherthataccountsfortherelativebehaviorofthestock
andbondmarkets.
Inanutshell,theevidencediscussedheresuggeststhat,besideshavingaverylowfailure
rate,the90/10allocationresultsinaninterestingmiddlegroundbetweentheupsidepotential
ofmoreaggressive staticallocationsand thedownsideprotectionofmoreconservativestatic
allocations.Perhapsmoreinterestingly,theminortwistsconsideredresult intwoverysimple
dynamicstrategiesthatincreaseboththeupsidepotentialandthedownsideprotectionofthe
90/10allocationsuggestedbyBuffett.
Therestofthearticleisorganizedasfollows.Section2discussesinmoredetailtheissue
at stake; section3 discusses the evidence, first considering several static strategies, and then
consideringtwosimpletwiststothe90/10allocation;andsection4providesanassessment.
2.TheIssue
Aretiree’spropermanagementofhisnesteggrequiresacarefulbalancingoftwofinancial
risks.Ontheonehand,theretireemayspendtoomuchandoutlivehissavings;ontheotherhand,
the retireemay unnecessarily lower his lifestyle and end upwith an unintended bequest. A
massiveliteratureonsustainableretirementportfoliosultimatelyseekstoguideretireesonhow
toproperly balance these risks. It iswidelyacknowledged thatBengen (1994) is the seminal
articlethatinspiredthevastamountofresearchproducedonthistopic.
Bengen (1994) pioneered the idea of considering withdrawal rates over all possible
historicalrolling(overlapping)periods.Heaimedtofindhowmanyyearsaportfoliowouldhave
lasted given an initial withdrawal rate and subsequent inflation‐adjusted withdrawals,
performingtheevaluationatthebeginningofeveryyearstartingin1926.1Givena50‐50stock‐
1Theinitialwithdrawalrateisdefinedastheinitialwithdrawalrelativetothevalueoftheportfolioatthebeginningofretirement.Unlessotherwisestated,inthisliteraturea‘withdrawalrate’typicallyreferstotheinitialwithdrawalrate,implicitlyassumingsubsequentinflation‐adjustedwithdrawals.Notethatthisimpliesthatthecurrentwithdrawalrate(thewithdrawalrelativetothevalueoftheportfolioatanypointintime)canfluctuatewidelyovertime.
3
bondallocationhefoundthata3%withdrawalratewouldhaveneverexhaustedaportfolioin
lessthan50years,anda4%withdrawalratewouldhaveneverexhaustedaportfolioinlessthan
33years.Hecalleda5%withdrawalrate‘risky’andwithdrawalrates6%orhigher‘gambling’
becausetheywouldhaveexhaustedaportfoliomuchsoonerovermanyhistoricalperiods.He
alsocalledthe4%withdrawalrate‘safe’becauseitneverexhaustedaportfolioinlessthan30
years,whichhethoughtofastheminimumrequirementofportfoliolongevity.Thiswastheorigin
ofthewell‐knownandwidely‐used‘4%rule.’
2.1.SomeRelevantDifferences
Thevast literature spannedbyBengen (1994)doesnotofferaconsensus regarding a
sustainable withdrawal rate for retirees. This is the case because different articles consider
different methodologies, time periods, assets, asset allocations, acceptable failure rates, and
retirementperiods,tonamebutsomedifferences,andthereforereachverydifferentconclusions
both on the sustainability of the 4% withdrawal rate and on the specific withdrawal rate
recommendedtoretirees.
Mostofthearticlesintheliteraturerelyononeoftwomethodologies,historicalrolling
(overlapping) periods andMonte Carlo (or bootstrapping) simulations. Bengen (1994, 1996,
1997)andCooleyetal(1998)areearlyapplicationsofthefirstmethodology;Pye(2000)and
Ameriksetal (2001)areearlyapplicationsof thesecond.Cooleyetal (2003b) compareboth
approaches and find that their results and recommendations sometimes are similar and
sometimesdiffer.Theydonottakesidesonwhichmethodologyisbetterandultimatelyargue
thatwhicheverapproachhappenstomoreaccuratelyreflectthe(unknown)distributionoffuture
returnswillproducethemoreplausibleresultsandrecommendations.
Thearticlesintheliteraturealsodifferintheassetstheyconsider.Althoughmostarticles
focusonstocksandbonds,differenttypesofstocksandbondsanddifferentassetclasseswere
introduced over time. Bengen (1997) considers small‐cap stocks; Pye (2000) considers TIPS;
Cooleyetal(2003a)considerinternational(EAFE)stocks;Guyton(2004)considersvaluestocks;
andCassaday(2006)considersrealestateandcommodities.
Animportantaspect,whichdifferswidelyacrossthearticlesintheliterature,isthefailure
rateconsideredtobeacceptabletoaretiree.Inotherwords,differentwithdrawalratesimply
differentprobabilitiesof portfoliodepletionbefore the endof the retirementperiod, someof
whicharetireemayfindacceptableandsomeofwhichhemaynot.Ononeextreme,Cooleyetal
(2003b,2011)arguethata25%failurerateisreasonable;ontheother,Terry(2003)arguesthat
failure rates 5%or higher are unacceptable. Spitzer et al (2007) plot a relationship between
withdrawalratesandfailureratesandhighlightthata4%withdrawalratecanbethoughtofas
safeaslongasa6%probabilityoffailureisacceptable.
4
Theretirementperiodsconsideredintheliteraturealsovarywidely.Although30years
seemstobeby far themostwidely‐usedalternative(andtheoneusedin thisarticle),onone
extremeCooleyetal(2005)focusonafive‐yearperiod,andontheotherBlanchettandFrank
(2009)considerupto50years.Somearticlestakeadifferentapproachandbasetheexpected
retirementperiodonmortalitytables,suchasMilevskyandRobinson(2005),StoutandMitchell
(2006),andSheikhetal(2014).
Finally,manyarticlesintheliteratureconsideraninitialwithdrawalrateandsubsequent
inflation‐adjustedwithdrawals,suchasBengen(1994,1996),whopioneeredtheapproach.Many
other articles, however, consider a wide variety of dynamic withdrawal rules, most of them
dependingonportfolioperformance.Someaddsimple floors and ceilings to thewithdrawals,
suchasBengen(2001)andJaconettietal(2013);someaddmorecomplexfloorsandceilings,
suchasGuytonandKlinger(2006)andStout(2008);2somemakeperiodicre‐evaluationsoflife
expectancy(Dusetal,2005),theprobabilityoffailure(BlanchettandFrank,2009),orseveral
variables(Sheikhetal,2014);andsomelinkthewithdrawalratetofundamentalvariablessuch
asthecyclically‐adjustedP/Eratio(Kitces,2008;Pfau,2011;andKitcesandPfau,2014).
2.2.TheEvolutionofAssetAllocationDuringRetirement
Mostofthearticlesintheliteratureconsiderdifferentassetallocations.Inhispioneering
article,forexample,Bengen(1994)basesmostofhisdiscussionona50‐50stock‐bondallocation
butalsoconsidersportfolioswith0%,25%,75%,and100%instocks(andtherestinbonds).
Considering different asset allocations, however, is different from considering how the asset
allocationshouldevolveduringretirement,whichisthefocusofthisarticle.3Threepossibilities
areconsideredhere,namely,declining‐equity(DE)strategies,rising‐equity(RE)strategies,and
staticstrategies.
Bengen(1994)doesnotexplicitlyconsidertheevolutionoftheassetallocationduring
retirement, but he does recommend a 50‐75%exposure to stocks and argues that it “can be
maintained throughout retirement.” Bengen (1996), in turn, explicitly considerswhether the
assetallocationshouldbeadjustedduringtheretirementperiod.Moreprecisely,heconsiders
annualreductionsintheallocationtostocksbetween0.5%and3%;findsanegativerelationship
betweentherateofdecreaseoftheallocationtostocksandsustainablewithdrawalrates;and
2Itisfarfromclearthatmorecomplexrulesimproveuponsimplerones.Infact,someofthecomplexrulesinthe literatureseemtobemeticulouslydesignedtoworkwell(orbetterthansimpleralternatives) insample.Thisoverfittingofthedataoftenleadstopoorbehavioroutofsample.3Thearticlesthatconsiderdifferentassetallocations,butnotitsevolutionduringtheretirementperiod,tendtoagreethatahigherexposuretostocksismorelikelytosupportahigherwithdrawalrate.Earlyrecommendations, such asCooley et al (1998), suggest an exposure to stocks of at least 50%;Bengen(1994)recommendsa50‐75%exposure,andMilevskyetal(1997)arguethatmanyretireeswouldbenefitfroma70‐100%exposure.
5
ultimatelyrecommendstophasedowntheexposuretostocksattheannualrateof1%(asthe
‘ageinbonds’rulewould).Sheikhetal(2014)alsorecommendaDEstrategy,andthereforean
increasingly‐conservativeportfolio,duringretirement.
Unsurprisingly,noteverybodyagreeswiththisrecommendation.Infact,somearguejust
theoppositeandrecommendanREstrategy.SpitzerandSingh(2006,2007)suggestthatretirees
shouldfirstmakewithdrawalsfromthebondportionoftheirportfolios,andstartwithdrawing
fromstocks only afterbonds are depleted. This recommendationwould gradually reduce the
exposuretobondsintheportfolio,thusimplyinganREglidepathandanincreasinglyaggressive
portfolio.PfauandKitces(2014)explicitlycompareDEandREstrategiesduringretirementand
findthatthelatter,whichtheyrecommend,exposeretireestoalowerprobabilityoffailure.
An intermediate possibility is a static or constant‐equity strategy. Blanchett (2007)
considers several types of rising/declining/static‐equity strategies; finds that despite their
simplicitystaticallocationsare“remarkablyefficient”distributionstrategies;andconcludesthat
a60‐40stock‐bondallocationislikelytobeoptimalformostretirees.Cohenetal(2010)argue
thatforanygivenDEstrategy,astaticstrategywithahigherrisk‐adjustedreturncanbecreated
and ultimately recommend a 32‐68 stock‐bond static allocation for retirees. Kitces and Pfau
(2014)alsoconsiderseveraltypesofrising/declining/static‐equitystrategiesandfindthata60‐
40stock‐bondallocationisnearlyoptimalinmostsituations.Theresultsdiscussedinthenext
section also yield support both to static strategies in general and (the all‐equity strategy
notwithstanding)toa60‐40stock‐bondallocationinparticular.
Afinalpossibilityisastrategyinwhichtheexposuretostocksneitherdeclinesorrisesat
apredeterminedratenordoes it remainsconstant; rather, theassetallocation isdynamically
adjusted depending on the value of some observable (technical or fundamental) variable.
Garrison et al (2010), for example, use a 12‐month moving average of large‐cap stocks to
determinewhetheraportfolioshouldbefullyinvestedinbondsorstocks.Pfau(2012),inturn,
uses thecyclically‐adjustedP/Eratio todeterminewhether the exposure to stocks shouldbe
25%,50%,or75%,with the rest invested inbonds.Botharticles findsupport for adynamic,
valuation‐basedassetallocationapproach.
Needlesstosay,bothstaticanddynamicstrategieshaveprosandcons.Staticstrategies
aresimpleandrequirelittleinformation.However,theymaygetincreasinglydifficultforretirees
tomaintainiftheallocationisaggressive(thinka90/10splitforan70‐yearoldindividualwitha
modest portfolio) and ignore valuation considerations even in extreme situations (think
December,1999).
Dynamicstrategies,ontheotherhand,seemto‘feelright’inthesensethattheymayget
progressivelymoreconservative(thinktheage‐in‐bondsrule)ortakevaluationconsiderations
intoaccount, thusaiming toavoidhighexposure toovervaluedassets.However, theymaybe
6
difficultforretireestoimplementandrequireinformationaboutvaluationthatretireesmaynot
haveorunderstand.
Bothstaticanddynamicstrategiesareconsideredinthisarticle.Amongtheformer,eight
assetallocationswithvaryingstock/bondproportionsareevaluated,withspecialattentiontothe
90/10split suggestedbyBuffett.Among the latter, twominor (valuation‐based) twists to the
90/10allocationareevaluatedandcomparedtoboththe90/10andthe60/40allocations;the
firsttwistfocusesonthevaluationofthestockmarketandthesecondontherelativevaluation
ofthestockandbondmarkets.
Importantly,thetwodynamictwistsconsideredinthisarticlearetrivialtoimplement.
Retireesonlyneedinformationabouttheperformanceofstocks,orthatofstocksandbonds,over
thepreviousyear,whichispubliclyandwidelyavailable.Retireesdonotneedtoknowtoolsof
fundamentalanalysis(suchastheP/EorCAPE)ortechnicalanalysis(suchasmovingaverages
orcharts),nordotheyneedtomakejudgementsonthevaluationofstocksandbonds.
3.Evidence
ThissectiondiscussestheevidenceasitappliestotheUSmarketoverthe115‐yearperiod
between 1900 and2014. The first part discusses the data andmethodology; the secondpart
evaluatesstaticstrategies;andthethirdpartevaluatestwosimpledynamictwiststothe90/10
allocation.
3.1.DataandMethodology
TheanalysisisbasedonthetwoassetclassessuggestedbyBuffett,stocksandshort‐term
government bonds (US Treasury bills), both represented by Dimson‐Marsh‐Staunton indices,
describedindetailinDimsonetal(2002,2015).Returnsareannual,adjustedbyinflation,and
account for capital gains/losses and cash flows. Over the 1900‐2014 period considered here
stocks and bonds hadmean annual compound (real) returns of 6.5% and 0.9%,with annual
volatilityof20.0%and4.6%.
BecauseBuffettdoesnotintendtorecommendthe90/10allocationtoallinvestorsand
isthereforesketchyondetails,afewassumptionswillbemadetoevaluatetheperformanceof
this strategy. It will be assumed, first, that Buffett suggests tomaintain the 90/10 allocation
constantovertime;second,thatinordertomaintainthe90/10allocationconstanttheportfolio
isrebalancedonceayear;andthird,thattheannualwithdrawalismadeproportionaltotheasset
allocation, which implies withdrawing 90% from stocks and 10% from bonds. The last two
assumptions,annualrebalancingandproportionalwithdrawals,willbeappliedtoalltheother
staticstrategiesconsidered.Thesecondassumption,annualrebalancing,willalsobeappliedto
thetwodynamictwiststothe90/10allocation.
7
The analysis is based on a $1,000 nest egg at the beginning of retirement, an initial
withdrawalof4%ofthenestegg,subsequentwithdrawalsannuallyadjustedbyinflation,anda
30‐year retirementperiod.At thebeginningof eachyear the annualwithdrawal ismade, the
portfolioisthenrebalanced(shouldthestrategycallforrebalancing)tothetargetallocationfor
theyear,andthenitcompoundsattheobservedreturnofstocksandbondsforthatyear.This
processisrepeatedatthebeginningofeachyearduringthe30‐yearretirementperiod,attheend
ofwhichtheportfoliohasaterminalwealthorbequestthatmaybepositiveor0.Thefirst30‐
yearretirementperiodconsideredis1900‐1929andthelastoneis1985‐2014,foratotalof86
rolling(overlapping)periods.
Theanalysisfocusesonthefailurerate,aswellasontheupsidepotentialanddownside
protectionprovidedbythestrategiesconsidered.Thefailurerateisdefinedastheproportionof
the86 retirementperiods considered inwhich theportfoliowasdepletedbefore30 years; if
history is any guide, this failure rate should be a good proxy for the expected probability of
portfolio failure. Both upside potential and downside protection are assessed from the
distributionofterminalwealthorbequest,whichresultsfromaggregatingthe86wealthlevels
attheendofeachofthe86periodsconsidered.
3.2.StaticStrategies
ThefirststepinordertoassessBuffett’sadviceistoconsiderseveralstaticstock/bond
allocationsthatcanbecomparedtothe90/10allocationsuggestedbyBuffett.Tothatpurpose,
Exhibit1reportstheresultsforeightstaticstrategieswithstock/bondallocationsrangingfrom
100/0to30/70,inallcasesrebalancedannuallytothestatedproportions.Theanalysisofupside
potentialanddownsideprotectionfollowsalongthelinessuggestedbyEstrada(2014a,2014b,
2014c,2016).
Thestrategies thatcall forequityholdingsbetween100%and40%havevery similar
failurerates,nothigherthan3.5%.Onlywhentheproportionofstocksisatorbelow30%the
failurerateincreasesconsiderably,inallcasesabove10%.4Althoughtherearevariedopinions
regardingwhatisanacceptablefailurerate,mostpractitionersseemtoagreethatfailurerates
below5%shouldbeviewedasacceptablebymostretirees.Inshort,althoughthe60/40strategy
neverfailed,the100/0and40/60failed3.5%ofthetime,andBuffett’s90/10failed2.3%ofthe
time,theredoesnotseemtobeasubstantialdifferenceinthefailureratesofportfoliosholding
atleast40%instocks.
4Astheexhibitshows,the30/70strategyhasafailurerateof12.8%.Strategieswithlowerproportionofstocks(20‐80,10‐90,and0‐100)havesubstantiallyhigherfailurerates(25.6%,43.0%,67.4%)andareneitherreportedintheexhibitnorfurtherconsideredintheanalysis.
8
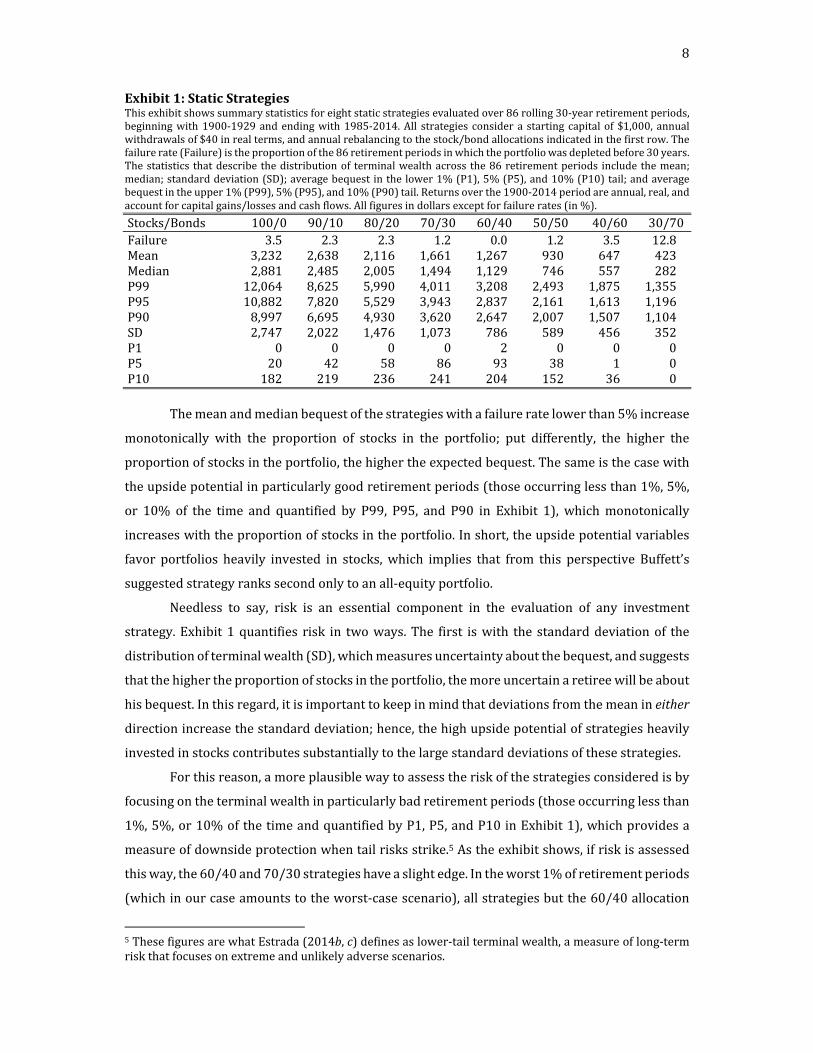
Exhibit1:StaticStrategiesThisexhibitshowssummarystatisticsforeightstaticstrategiesevaluatedover86rolling30‐yearretirementperiods,beginningwith1900‐1929andendingwith1985‐2014.All strategies considera starting capitalof $1,000, annualwithdrawalsof$40inrealterms,andannualrebalancingtothestock/bondallocationsindicatedinthefirstrow.Thefailurerate(Failure)istheproportionofthe86retirementperiodsinwhichtheportfoliowasdepletedbefore30years.Thestatistics thatdescribe thedistributionof terminalwealthacross the86retirementperiods include themean;median;standarddeviation(SD);averagebequestinthelower1%(P1),5%(P5),and10%(P10)tail;andaveragebequestintheupper1%(P99),5%(P95),and10%(P90)tail.Returnsoverthe1900‐2014periodareannual,real,andaccountforcapitalgains/lossesandcashflows.Allfiguresindollarsexceptforfailurerates(in%).
Stocks/Bonds 100/0 90/10 80/20 70/30 60/40 50/50 40/60 30/70Failure 3.5 2.3 2.3 1.2 0.0 1.2 3.5 12.8Mean 3,232 2,638 2,116 1,661 1,267 930 647 423Median 2,881 2,485 2,005 1,494 1,129 746 557 282P99 12,064 8,625 5,990 4,011 3,208 2,493 1,875 1,355P95 10,882 7,820 5,529 3,943 2,837 2,161 1,613 1,196P90 8,997 6,695 4,930 3,620 2,647 2,007 1,507 1,104SD 2,747 2,022 1,476 1,073 786 589 456 352P1 0 0 0 0 2 0 0 0P5 20 42 58 86 93 38 1 0P10 182 219 236 241 204 152 36 0 Themeanandmedianbequestofthestrategieswithafailureratelowerthan5%increase
monotonically with the proportion of stocks in the portfolio; put differently, the higher the
proportionofstocksintheportfolio,thehighertheexpectedbequest.Thesameisthecasewith
theupsidepotentialinparticularlygoodretirementperiods(thoseoccurringlessthan1%,5%,
or 10% of the time and quantified by P99, P95, and P90 in Exhibit 1), whichmonotonically
increaseswiththeproportionofstocksintheportfolio.Inshort,theupsidepotentialvariables
favor portfolios heavily invested in stocks,which implies that from this perspective Buffett’s
suggestedstrategyrankssecondonlytoanall‐equityportfolio.
Needless to say, risk is an essential component in the evaluation of any investment
strategy.Exhibit1quantifies risk in twoways.The first iswith the standarddeviationof the
distributionofterminalwealth(SD),whichmeasuresuncertaintyaboutthebequest,andsuggests
thatthehighertheproportionofstocksintheportfolio,themoreuncertainaretireewillbeabout
hisbequest.Inthisregard,itisimportanttokeepinmindthatdeviationsfromthemeanineither
directionincreasethestandarddeviation;hence,thehighupsidepotentialofstrategiesheavily
investedinstockscontributessubstantiallytothelargestandarddeviationsofthesestrategies.
Forthisreason,amoreplausiblewaytoassesstheriskofthestrategiesconsideredisby
focusingontheterminalwealthinparticularlybadretirementperiods(thoseoccurringlessthan
1%,5%,or10%ofthetimeandquantifiedbyP1,P5,andP10inExhibit1),whichprovidesa
measureofdownsideprotectionwhentailrisksstrike.5Astheexhibitshows,ifriskisassessed
thisway,the60/40and70/30strategieshaveaslightedge.Intheworst1%ofretirementperiods
(whichinourcaseamountstotheworst‐casescenario),allstrategiesbutthe60/40allocation
5ThesefiguresarewhatEstrada(2014b,c)definesaslower‐tailterminalwealth,ameasureoflong‐termriskthatfocusesonextremeandunlikelyadversescenarios.
9
fail; in the worst 5% of retirement periods, the 60/40 allocation yields the highest terminal
wealth; and in theworst 10% of retirement periods, the 70/30 allocation yields the highest
terminalwealth.
Importantly, the90/10strategysuggestedbyBuffettdoesnotperformmuchworsein
termsofdownsideprotection.Toputthefiguresaboveinperspective,recallthattheanalysisis
performed in real terms and that the annual withdrawal is $40. Hence, in the worst 5% of
retirementperiods(P5),the90/10allocationunderperformsthe60/40splitbyjustabitmore
thanthevalueofoneannualwithdrawal(whichfollowsfromcomparing$42to$93);andinthe
worst10%ofretirementperiods(P10),the90/10allocationunderperformsthe70/30splitby
justabitmorethanthevalueofhalfanannualwithdrawal(comparing$219to$241).
Inshort,then,asfarasstaticstrategiesisconcerned,Buffett’ssuggestedallocationhasa
very low(althoughnot the lowest) failurerate;averyhigh (althoughnot thehighest)upside
potential;andprovidesverygood(butnotthebest)downsideprotectionwhentailrisksstrike.
Putdifferently,Buffett’ssuggestedallocationseemstoprovideamiddlegroundbetweenthebest‐
performing strategy (100/0) in terms of upside potential and the best‐performing strategies
(60/40and70/30)intermsofdownsideprotection.
3.3.TweakingBuffett’sAdvice
TheevidencediscussedsofarsuggeststhatBuffett’sadviceis(perhapsunsurprisingly)
bothsoundandsimpleenoughforanyretireetoimplement,atleastasfarasstaticstrategiesis
concerned.Thatsaid,itmaybeworthexploringtwominordynamictwists,bothofwhicharevery
simpletoimplement.
Thefirsttwist(T1)relatestheannualwithdrawaltothebehaviorofthestockmarketin
thepreviousyear.Moreprecisely,ifstockshavegoneup,theretireetakestheannualwithdrawal
fromstocksandthenrebalancestheportfoliobacktothe90/10allocation;ifstockshavegone
down,theretireetakestheannualwithdrawalfrombondsanddoesnotrebalancetheportfolio.
Thesecondtwist(T2)relatestheannualwithdrawaltotherelativebehaviorofthestock
andbondmarketsinthepreviousyear.Moreprecisely,ifthereturnofstockshasbeenhigher
thanthatofbonds,theretireetakestheannualwithdrawalfromstocksandthenrebalancesthe
portfoliobacktothe90/10allocation;ifthereturnofstockshasbeenlowerthanthatofbonds,
theretireetakestheannualwithdrawalfrombondsanddoesnotrebalancetheportfolio.
Thesedynamictwistsaimtoavoidwithdrawingfromstockswhenthesehavegonedown
(T1)orperformedworsethanbonds(T2).Fromthisperspective,theyareinspiredinthebucket
approachwidelydiscussedbyChristineBenzinseveralMorningstararticles,andareultimately
basedontheconceptofmeanreversioninstocks.Withdrawingfrombondswhenstockshave
performedbadly,inabsoluteorrelativeterms,buysthetimethatstocksneedtosoonerorlater
10
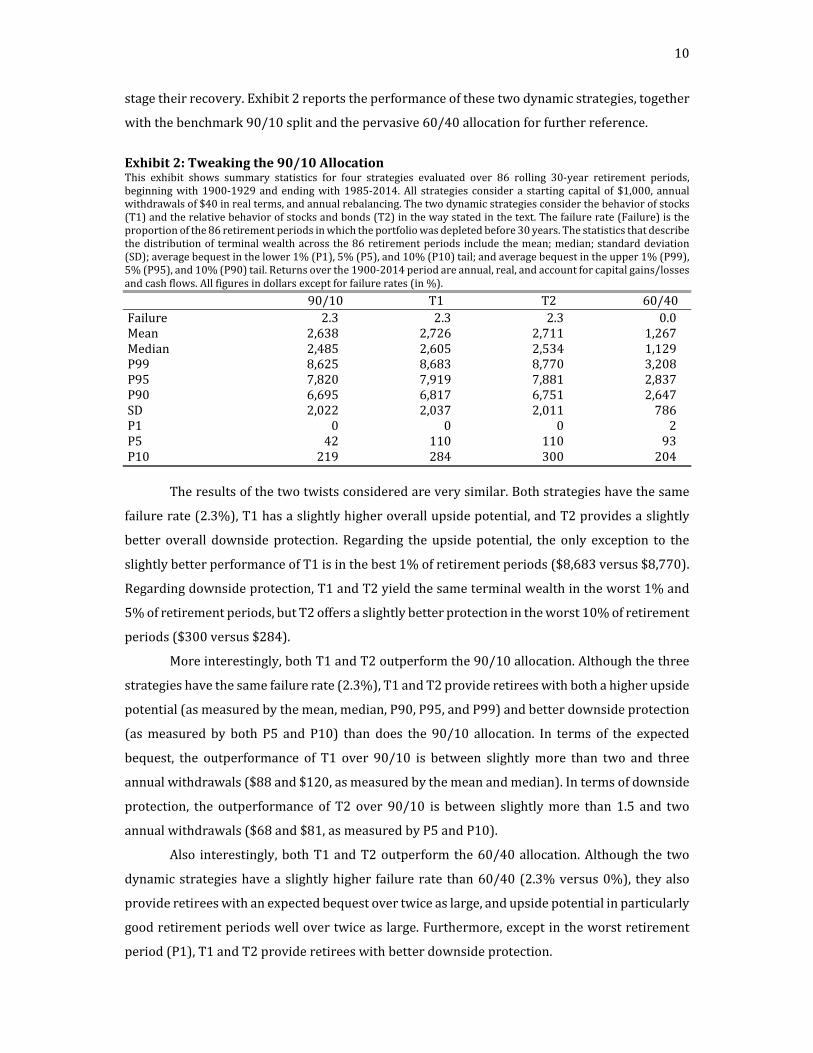
stagetheirrecovery.Exhibit2reportstheperformanceofthesetwodynamicstrategies,together
withthebenchmark90/10splitandthepervasive60/40allocationforfurtherreference.
Exhibit2:Tweakingthe90/10AllocationThis exhibit shows summary statistics for four strategies evaluated over 86 rolling 30‐year retirement periods,beginningwith1900‐1929andendingwith1985‐2014.All strategies considera starting capitalof $1,000, annualwithdrawalsof$40inrealterms,andannualrebalancing.Thetwodynamicstrategiesconsiderthebehaviorofstocks(T1)andtherelativebehaviorofstocksandbonds(T2)inthewaystatedinthetext.Thefailurerate(Failure)istheproportionofthe86retirementperiodsinwhichtheportfoliowasdepletedbefore30years.Thestatisticsthatdescribethedistributionofterminalwealthacrossthe86retirementperiodsincludethemean;median;standarddeviation(SD);averagebequestinthelower1%(P1),5%(P5),and10%(P10)tail;andaveragebequestintheupper1%(P99),5%(P95),and10%(P90)tail.Returnsoverthe1900‐2014periodareannual,real,andaccountforcapitalgains/lossesandcashflows.Allfiguresindollarsexceptforfailurerates(in%).
90/10 T1 T2 60/40Failure 2.3 2.3 2.3 0.0Mean 2,638 2,726 2,711 1,267Median 2,485 2,605 2,534 1,129P99 8,625 8,683 8,770 3,208P95 7,820 7,919 7,881 2,837P90 6,695 6,817 6,751 2,647SD 2,022 2,037 2,011 786P1 0 0 0 2P5 42 110 110 93P10 219 284 300 204 Theresultsofthetwotwistsconsideredareverysimilar.Bothstrategieshavethesame
failurerate(2.3%),T1hasaslightlyhigheroverallupsidepotential,andT2providesaslightly
better overall downside protection. Regarding theupsidepotential, the only exception to the
slightlybetterperformanceofT1isinthebest1%ofretirementperiods($8,683versus$8,770).
Regardingdownsideprotection,T1andT2yieldthesameterminalwealthintheworst1%and
5%ofretirementperiods,butT2offersaslightlybetterprotectionintheworst10%ofretirement
periods($300versus$284).
Moreinterestingly,bothT1andT2outperformthe90/10allocation.Althoughthethree
strategieshavethesamefailurerate(2.3%),T1andT2provideretireeswithbothahigherupside
potential(asmeasuredbythemean,median,P90,P95,andP99)andbetterdownsideprotection
(asmeasured by both P5 andP10) than does the 90/10 allocation. In terms of the expected
bequest, the outperformance of T1 over 90/10 is between slightlymore than two and three
annualwithdrawals($88and$120,asmeasuredbythemeanandmedian).Intermsofdownside
protection, the outperformance of T2 over 90/10 is between slightlymore than 1.5 and two
annualwithdrawals($68and$81,asmeasuredbyP5andP10).
Also interestingly,bothT1andT2outperformthe60/40allocation.Although the two
dynamicstrategieshaveaslightlyhigher failurerate than60/40(2.3%versus0%), theyalso
provideretireeswithanexpectedbequestovertwiceaslarge,andupsidepotentialinparticularly
goodretirementperiodswellovertwiceaslarge.Furthermore,exceptintheworstretirement
period(P1),T1andT2provideretireeswithbetterdownsideprotection.
11
Finally,althoughitcanhardlybearguedthatobservingtheperformanceofthestockand
bondmarkets is challenging, it is in fact simpler to justobserve theperformanceof thestock
market(which,ingeneral,ismorereadilyavailablethanthatofthebondmarket).Thus,giventhe
verysimilarperformanceofthetwotwistsconsidered,T1,whichonlyrequirestoobservethe
performanceofstocks,maybeviewedashavingaslightedgeoverT2,whichrequirestoobserve
theperformanceofbothstocksandbonds.
4.Assessment
Thereisamassiveliteraturethatdiscussestwoofthemostimportantfinancialdecisions
retireesneedtomake,namely,thewithdrawalrateandtheassetallocationoftheirportfolios.
This article focused on the latter, and more specifically on the performance of the 90/10
allocationWarrenBuffettadvisedatrusteetoimplementforthebequesthiswifewillreceive.
This 90/10 allocation was evaluated first relative to other static strategies, and then
relative to twoverysimple,dynamic,valuation‐basedstrategies.Eachof the latteronlyadda
minor twist to theallocationsuggestedbyBuffett,basedon theperformanceof stocksor the
relativeperformanceofstocksandbonds.
Whencomparedtootherstaticallocations,the90/10splitsuggestedbyBuffettperforms
wellintermsofthefailurerate,upsidepotential,anddownsideprotection.Infact,itprovidesan
interestingmiddlegroundbetweentheupsidepotentialofmoreaggressivestaticallocationsand
thedownsideprotectionofmoreconservativestaticallocations.Putdifferently,Buffett’sadvice
provestobe(unsurprisingly)notonlysimplebutalsosound.
Thatsaid,thetwosimpletwistsconsideredhereimproveboththeupsidepotentialand
thedownsideprotectionof the90/10allocation.These two twists require retireesneither to
collectvastamountsofinformationnortomakeanyvaluationjudgmentsbutonlytoobservethe
performanceof thestockmarket,or the relativeperformanceof thestockandbondmarkets.
Eitherway,retireescan,withlittleeffort, improveupontheresultsofthe90/10allocation.In
fact,becausetheperformanceofthetwotwistsconsideredissosimilar,retireesmaywanttolean
towards the first one (T1) and simply adjust their asset allocation according to theobserved
performanceofstocks.
Buffett’sassetallocationadviceissoundandsimple,andyetmanyretireesmaybalkat
thethoughtofholdingsuchanaggressiveportfolio.Ifthatisthecase,thetwotwistsconsidered
here may help a little, but probably not enough. However, those retirees that find a 90/10
portfolioacceptablearelikelytofindthatwithaninsignificantadditionaleffort,observingthe
performanceofstocksandimplementingthefirsttwistdiscussed,theyarelikelytoimprovethe
performanceoftheirportfolios.
12
ReferencesAmeriks,John,RobertVeres,andMarkWarshawsky(2001).“MakingRetirementIncomeLastaLifetime.”JournalofFinancialPlanning,December,60‐76.Bengen, William (1994). “Determining Withdrawal Rates Using Historical Data.” Journal ofFinancialPlanning,October,171‐180.Bengen,William(1996).“AssetAllocationforaLifetime.”JournalofFinancialPlanning,August,58‐67.Bengen,William (1997). “Conserving Client PortfoliosDuringRetirement, Part III.” Journal ofFinancialPlanning,December,84‐97.Bengen,William (2001). “Conserving Client PortfoliosDuringRetirement, Part IV.” Journal ofFinancialPlanning,May,110‐119.Blanchett,David(2007).“DynamicAllocationStrategiesforDistributionPortfolios:DeterminingtheOptimalDistributionGlidePath.”JournalofFinancialPlanning,December,68‐81.Blanchett,David,andLarryFrank(2009). “ADynamicandAdaptiveApproachtoDistributionPlanningandMonitoring.”JournalofFinancialPlanning,April,52‐66.Cassaday, Stephan (2006). “DIESEL: A System for Generating Cash Flow During Retirement.”JournalofFinancialPlanning,September,50‐65.Cohen,Josh,GrantGardner,andYuan‐AnFan(2010).“ShouldTargetDateFundGlidePathsBeManaged‘To’or‘Through’Retirement?”RussellResearch,April,1‐7.Cooley, Philip, Carl Hubbard, and Daniel Walz (1998). “Retirement Savings: Choosing aWithdrawal Rate That Is Sustainable.” Journal of the American Association of IndividualInvestors,February,16‐21.Cooley, Philip, Carl Hubbard, and Daniel Walz (2003a). “Does International DiversificationIncrease the SustainableWithdrawal Rates from Retirement Portfolios?” Journal of FinancialPlanning,January,74‐80.Cooley,Philip,CarlHubbard,andDanielWalz(2003b).“AComparativeAnalysisofRetirementPortfolioSuccessRates:SimulationVersusOverlappingPeriods.”FinancialServicesReview,12,115‐128.Cooley,Philip,CarlHubbard,andDanielWalz(2005). “RetirementWithdrawals:WhatRate IsSafe When Time Is Short and Uncertain.” Journal of the American Association of IndividualInvestors,January,4‐9.Cooley,Philip,CarlHubbard,andDanielWalz(2011).“PortfolioSuccessRates:WheretoDrawtheLine.”JournalofFinancialPlanning,April,48‐60.Dimson,Elroy,PaulMarsh,andMikeStaunton(2002).TriumphoftheOptimists–101YearsofInvestmentReturns.PrincetonUniversityPress.Dimson,Elroy,PaulMarsh,andMikeStaunton(2015).“CreditSuisseGlobalInvestmentReturnsYearbook2015.”CreditSuisse,February.
13
Dus,Ivica,RaimondMaurer,andOliviaMitchell(2005).“BettingonDeathandCapitalMarketsinRetirement: A Shortfall Risk Analysis of Life Annuities Versus Phased Withdrawal Plans.”FinancialServicesReview,14,169‐196.Estrada, Javier (2014a). “The Glidepath Illusion: An International Perspective.” Journal ofPortfolioManagement,Summer,52‐64.Estrada,Javier(2014b).“RethinkingRisk.”JournalofAssetManagement,15,4,239‐259.Estrada, Javier (2014c). “Rethinking Risk (II): The Size and Value Effects.” Journal ofWealthManagement,Winter,78‐83.Estrada, Javier (2016). “The Retirement Glidepath: An International Perspective.” Journal ofInvesting,forthcoming.Garrison, Michael, Carlos Sera, and Jeffrey Cribbs (2010). “A Simple Dynamic Strategy forPortfoliosTakingWithdrawals:TheCaseforUsinga12‐MonthSimpleMovingAverage.”JournalofFinancialPlanning,February,51‐61.Guyton, Jonathan (2004). “DecisionRulesandPortfolioManagement forRetirees: Is the ‘Safe’InitialWithdrawalRateTooSafe?”JournalofFinancialPlanning,October,54‐62.Guyton,Jonathan,andWilliamKlinger(2006).“DecisionRulesandMaximumInitialWithdrawalRates.”JournalofFinancialPlanning,March,48‐58.Jaconetti,Colleen,FrancisKinniry,andMichaelDiJoseph(2013).“AMoreDynamicApproachToSpendingForInvestorsinRetirement.”VanguardResearch,October,1‐12.Kitces,Michael(2008).“ResolvingtheParadox:IstheSafeWithdrawalRateSometimesTooSafe.”TheKitcesReport,May,1‐13.Kitces,Michael,andWadePfau(2014).“RetirementRisk,EquityGlidepaths,andValuation‐BasedAssetAllocation.”Workingpaper.Milevsky,Moshe,andChrisRobinson(2005).“ASustainableSpendingRateWithoutSimulation.”FinancialAnalystsJournal,November/December,89‐100.Milevsky,Moshe,KwokHo,andChrisRobinson(1997).“AssetAllocationViatheConditionalFirstExit Time or How To Avoid Outliving Your Money.” Review of Quantitative Finance andAccounting,9,53‐70.Pfau,Wade(2011).“CanWePredicttheSustainableWithdrawalRateforNewRetirees?”JournalofFinancialPlanning,August,40‐47.Pfau,Wade (2012). “WithdrawalRates, SavingsRates, andValuation‐BasedAsset Allocation.”JournalofFinancialPlanning,April,34‐40.Pfau,Wade, andMichaelKitces (2014). “ReducingRetirementRiskwithaRisingEquityGlidePath.”JournalofFinancialPlanning,January,38‐48.Pye,Gordon (2000). “Sustainable InvestmentWithdrawals.” Journal ofPortfolioManagement,Summer,73‐83.
14
Sheikh,Abdullah,KatherineRoy,andAnneLester(2014).“Breakingthe4%Rule.DynamicallyAdapting Asset Allocation and Withdrawal Rates To Make the Most of Retirement Assets.”JPMorgan,RetirementInsights,February,1‐32.Spitzer, John, and Sandeep Singh (2006). “Extending Retirement Payouts by Optimizing theSequenceofWithdrawals.”JournalofFinancialPlanning,April,52‐61.Spitzer, John, and Sandeep Singh (2007). “Is Rebalancing a Portfolio During RetirementNecessary?”JournalofFinancialPlanning,June,46‐57.Spitzer,John,JeffreyStrieter,andSandeepSingh(2007).“GuidelinesforWithdrawalRatesandPortfolioSafetyDuringRetirement.”JournalofFinancialPlanning,October,52‐59.Stout, Gene (2008). “Stochastic Optimization of Retirement Portfolio Asset Allocations andWithdrawals.”FinancialServicesReview,17,1‐15.Stout, Gene, and JohnMitchell (2006). “Dynamic RetirementWithdrawal Planning.” FinancialServicesReview,15,117‐131.Terry,Rory(2003).“TheRelationBetweenPortfolioCompositionandSustainableWithdrawalRates.”JournalofFinancialPlanning,May,64‐78.