Embed Size (px)
Citation preview
14Page Name
PROFILES
BUILDING A BETTER BUSINESS PROCESS
How Splunk Software is Used to Provide Real-time Visibility into Sales and Marketing Data
Use Cases
• Marketing Analytics & Reporting • Improving Operational Efficiencies
PROFILES
15Building a Better Business Process
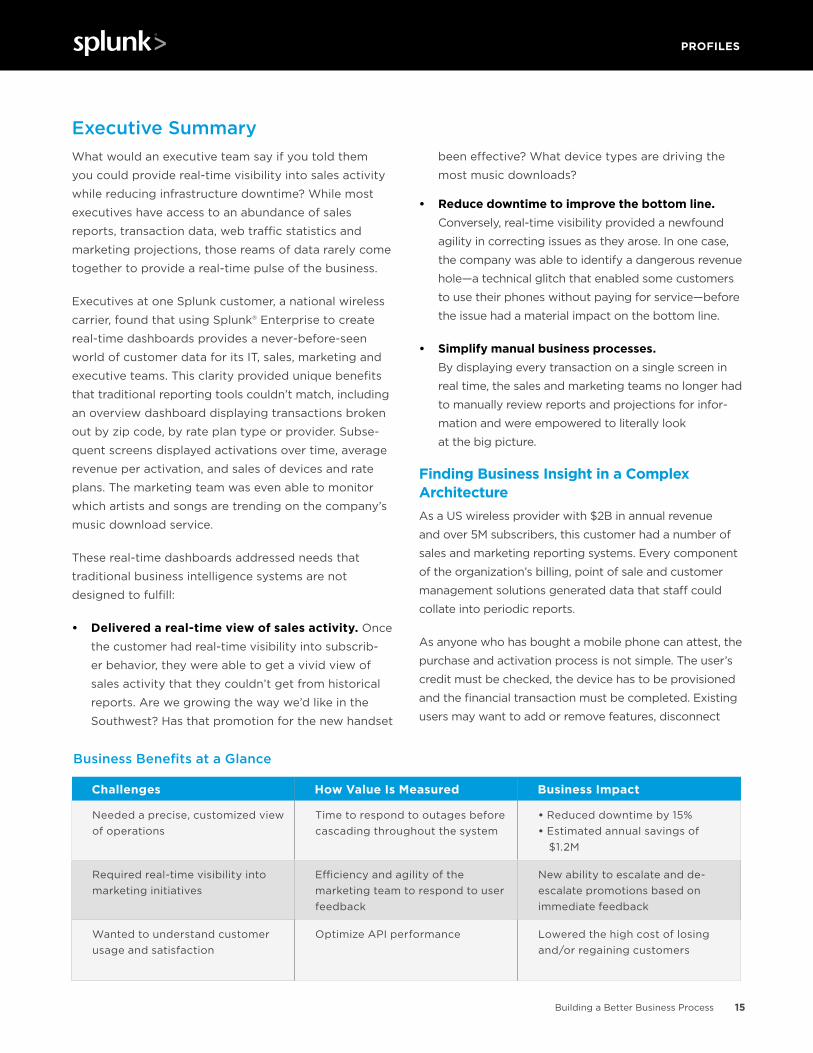
Challenges How Value Is Measured Business Impact
Needed a precise, customized view of operations
Time to respond to outages before cascading throughout the system
• Reduced downtime by 15%• Estimated annual savings of
$1.2M
Required real-time visibility into marketing initiatives
Efficiency and agility of the marketing team to respond to user feedback
New ability to escalate and de-escalate promotions based on immediate feedback
Wanted to understand customer usage and satisfaction
Optimize API performance Lowered the high cost of losing and/or regaining customers
Business Benefits at a Glance
Executive SummaryWhat would an executive team say if you told them
you could provide real-time visibility into sales activity
while reducing infrastructure downtime? While most
executives have access to an abundance of sales
reports, transaction data, web traffic statistics and
marketing projections, those reams of data rarely come
together to provide a real-time pulse of the business.
Executives at one Splunk customer, a national wireless
carrier, found that using Splunk® Enterprise to create
real-time dashboards provides a never-before-seen
world of customer data for its IT, sales, marketing and
executive teams. This clarity provided unique benefits
that traditional reporting tools couldn’t match, including
an overview dashboard displaying transactions broken
out by zip code, by rate plan type or provider. Subse-
quent screens displayed activations over time, average
revenue per activation, and sales of devices and rate
plans. The marketing team was even able to monitor
which artists and songs are trending on the company’s
music download service.
These real-time dashboards addressed needs that
traditional business intelligence systems are not
designed to fulfill:
• Delivered a real-time view of sales activity. Once
the customer had real-time visibility into subscrib-
er behavior, they were able to get a vivid view of
sales activity that they couldn’t get from historical
reports. Are we growing the way we’d like in the
Southwest? Has that promotion for the new handset
been effective? What device types are driving the
most music downloads?
• Reduce downtime to improve the bottom line. Conversely, real-time visibility provided a newfound
agility in correcting issues as they arose. In one case,
the company was able to identify a dangerous revenue
hole—a technical glitch that enabled some customers
to use their phones without paying for service—before
the issue had a material impact on the bottom line.
• Simplify manual business processes. By displaying every transaction on a single screen in
real time, the sales and marketing teams no longer had
to manually review reports and projections for infor-
mation and were empowered to literally look
at the big picture.
Finding Business Insight in a Complex ArchitectureAs a US wireless provider with $2B in annual revenue
and over 5M subscribers, this customer had a number of
sales and marketing reporting systems. Every component
of the organization’s billing, point of sale and customer
management solutions generated data that staff could
collate into periodic reports.
As anyone who has bought a mobile phone can attest, the
purchase and activation process is not simple. The user’s
credit must be checked, the device has to be provisioned
and the financial transaction must be completed. Existing
users may want to add or remove features, disconnect
PROFILES
16Building a Better Business Process
other phones or change rate plans. In the case of this
wireless provider, the process was complicated further
by the desire to supply a variety of rate plans and net-
work providers for subscribers.
Needless to say, the resulting transaction architecture
was extremely complex, comprising hundreds of APIs
executing dozens of business processes between both
proprietary and third-party billing systems.
The customer had invested in a middleware system
that coordinated and collated these transactions from
various point of sale and billing systems and passed
the information to its internal reporting systems as well
as its customer-facing website. This middleware acted
as the hub for the entire enterprise and thus was ripe
for analysis.
Traditional BI and the Constraints of Non-traditional Use CasesBusiness intelligence systems serve a traditional report-
ing function in this organization. Batch-oriented reports
and dashboards delivered on a daily, weekly, monthly
or quarterly schedule provide the organization with
snapshot views across a variety of areas such as sales,
marketing and merchandising. These systems, however,
imposed serious limitations.
Reliance on batch reporting hinders agility. Reporting
in batch mode impacts the pace and thus the quality
of decision making.
Relying on data that’s a few hours old can create doubt.
Has that special promotion kicked in since these numbers
were pulled? Do people in that region of the country
shop less on Fridays than those in other regions? In
many cases, circumstances can change by the time a
report has been produced.
Database schemas are designed to support only specific upfront queries. When an executive does find
a glimmer of insight in a report and asks a follow-up
question, analysts face major challenges in quickly
providing the answer. In this scenario, the data is either
too difficult to correlate or simply not in the system.
Traditional business intelligence tools rely on databases,
and databases rely on tables with strictly defined rows
and columns. Within this structure, relationships in
the data that might not seem important at the time of
schema definition can often be critical to understanding
a specific business opportunity. For example, under-
standing the relationship between a transaction type
and the location of a store can significantly help exec-
utives understand the business impact. All of those re-
lationships must be considered in advance when using
systems that require upfront definition via a schema.
In addition to these limitations, the customer’s combi-
nation of off-the-shelf and homegrown systems used
to cobble together its sales and marketing picture was
very costly to maintain. Keeping the homegrown
systems functioning properly, for example, demanded
staff to manage databases and modify schemas.
Ultimately, the company’s business intelligence
systems failed to provide real-time insights into its
customers and operations and were expensive to
deploy and operate.
The Splunk Solution: Real-time Monitoring and AnalyticsWhen the director of application operations learned
of Splunk Enterprise and its ability to index and analyze
large volumes of unstructured data, he used the solution
to tap into the middleware’s JMS messaging system—
the clearinghouse for every transaction. In his words,
“It was just 20 minutes of development work” to write a
rule that simply copied those messages into a file.
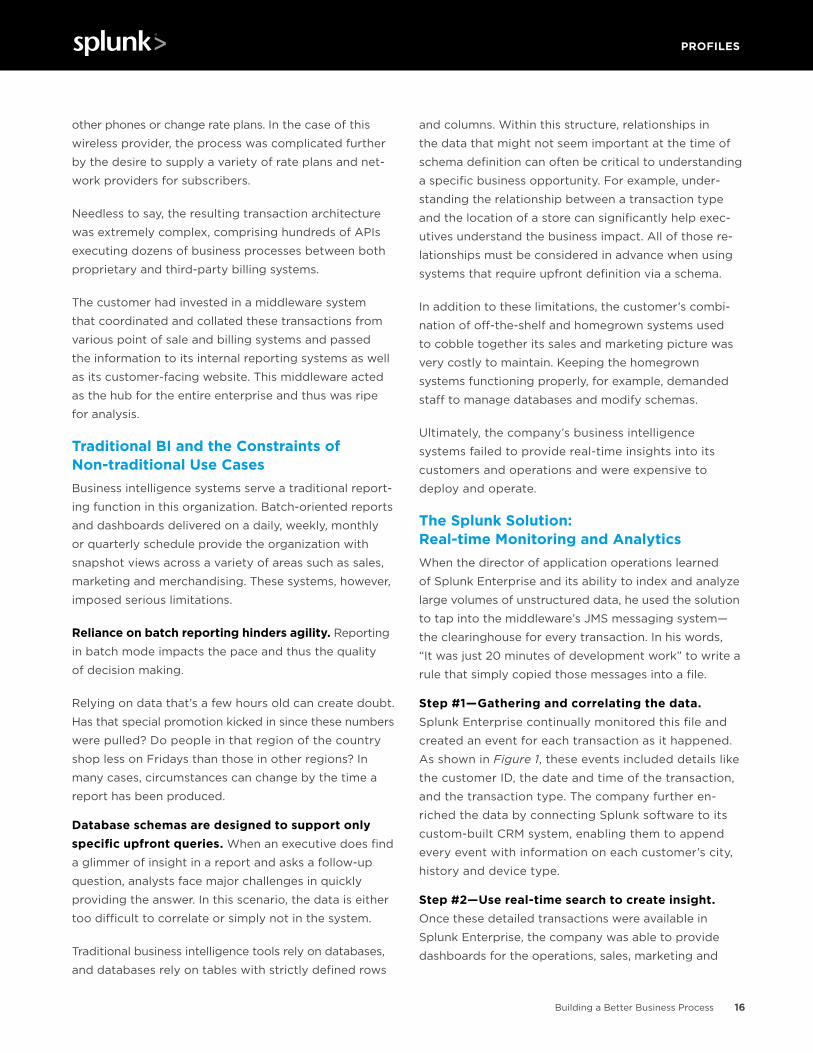
Step #1—Gathering and correlating the data. Splunk Enterprise continually monitored this file and
created an event for each transaction as it happened.
As shown in Figure 1, these events included details like
the customer ID, the date and time of the transaction,
and the transaction type. The company further en-
riched the data by connecting Splunk software to its
custom-built CRM system, enabling them to append
every event with information on each customer’s city,
history and device type.
Step #2—Use real-time search to create insight. Once these detailed transactions were available in
Splunk Enterprise, the company was able to provide
dashboards for the operations, sales, marketing and
PROFILES
17Building a Better Business Process
customer care divisions. Each set of dashboards drew
from the same data, but provided each group with an
individual lens of relevant metrics.
The company’s executives immediately recognized the
value of real-time searches in filling a critical gap in the
sales and marketing teams’ ability to monitor incoming
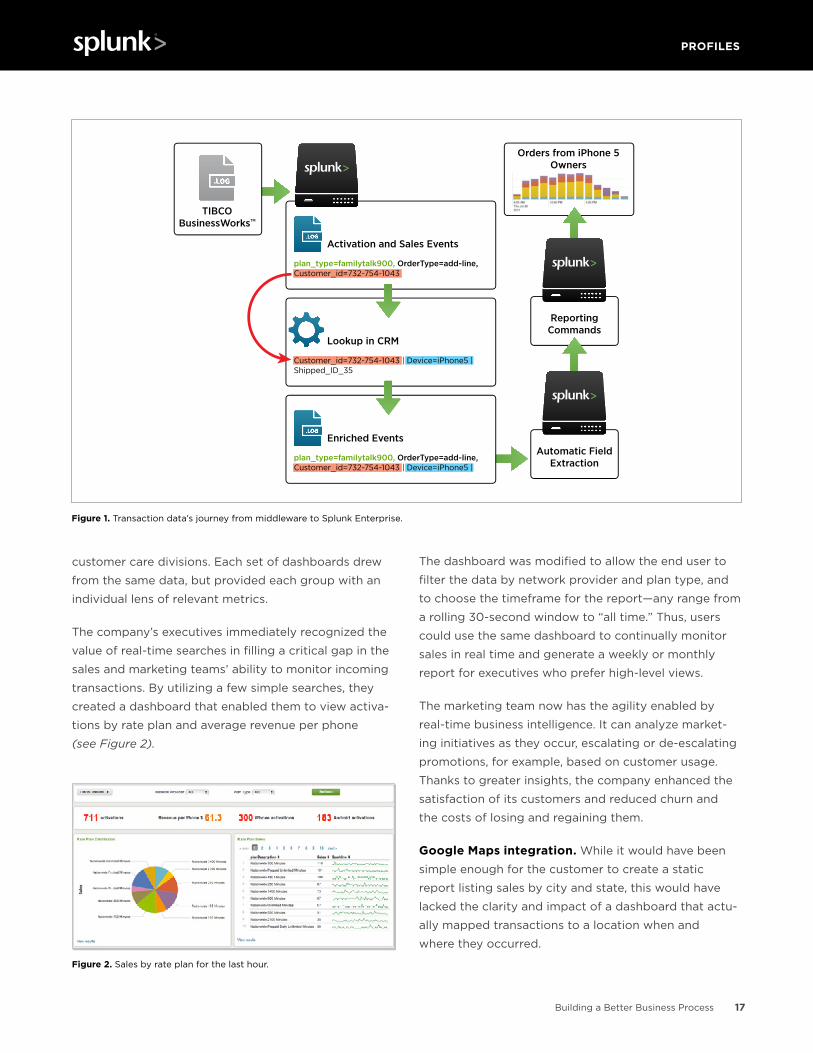
transactions. By utilizing a few simple searches, they
created a dashboard that enabled them to view activa-
tions by rate plan and average revenue per phone
(see Figure 2).
The dashboard was modified to allow the end user to
filter the data by network provider and plan type, and
to choose the timeframe for the report—any range from
a rolling 30-second window to “all time.” Thus, users
could use the same dashboard to continually monitor
sales in real time and generate a weekly or monthly
report for executives who prefer high-level views.
The marketing team now has the agility enabled by
real-time business intelligence. It can analyze market-
ing initiatives as they occur, escalating or de-escalating
promotions, for example, based on customer usage.
Thanks to greater insights, the company enhanced the
satisfaction of its customers and reduced churn and
the costs of losing and regaining them.
Google Maps integration. While it would have been
simple enough for the customer to create a static
report listing sales by city and state, this would have
lacked the clarity and impact of a dashboard that actu-
ally mapped transactions to a location when and
where they occurred.
Figure 2. Sales by rate plan for the last hour.
Orders from iPhone 5 Owners
Reporting Commands
Enriched Events
Lookup in CRM
Customer_id=732-754-1043 | Device=iPhone5 |Shipped_ID_35
TIBCO BusinessWorksTM
Automatic Field Extraction
Activation and Sales Events
plan_type=familytalk900, OrderType=add-line, Customer_id=732-754-1043
plan_type=familytalk900, OrderType=add-line, Customer_id=732-754-1043 | Device=iPhone5 |
Figure 1. Transaction data’s journey from middleware to Splunk Enterprise.
PROFILES
18Building a Better Business Process
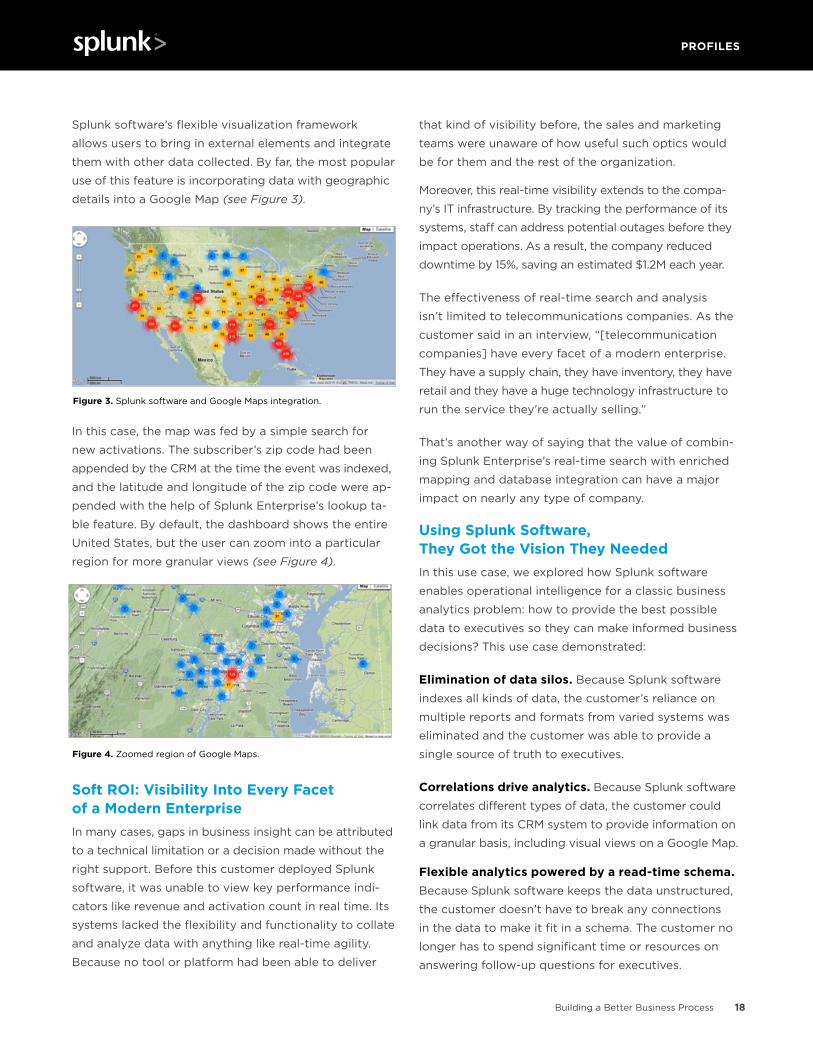
Splunk software’s flexible visualization framework
allows users to bring in external elements and integrate
them with other data collected. By far, the most popular
use of this feature is incorporating data with geographic
details into a Google Map (see Figure 3).
In this case, the map was fed by a simple search for
new activations. The subscriber’s zip code had been
appended by the CRM at the time the event was indexed,
and the latitude and longitude of the zip code were ap-
pended with the help of Splunk Enterprise’s lookup ta-
ble feature. By default, the dashboard shows the entire
United States, but the user can zoom into a particular
region for more granular views (see Figure 4).
Figure 3. Splunk software and Google Maps integration.
Figure 4. Zoomed region of Google Maps.
Soft ROI: Visibility Into Every Facet of a Modern EnterpriseIn many cases, gaps in business insight can be attributed
to a technical limitation or a decision made without the
right support. Before this customer deployed Splunk
software, it was unable to view key performance indi-
cators like revenue and activation count in real time. Its
systems lacked the flexibility and functionality to collate
and analyze data with anything like real-time agility.
Because no tool or platform had been able to deliver
that kind of visibility before, the sales and marketing
teams were unaware of how useful such optics would
be for them and the rest of the organization.
Moreover, this real-time visibility extends to the compa-
ny’s IT infrastructure. By tracking the performance of its
systems, staff can address potential outages before they
impact operations. As a result, the company reduced
downtime by 15%, saving an estimated $1.2M each year.
The effectiveness of real-time search and analysis
isn’t limited to telecommunications companies. As the
customer said in an interview, “[telecommunication
companies] have every facet of a modern enterprise.
They have a supply chain, they have inventory, they have
retail and they have a huge technology infrastructure to
run the service they’re actually selling.”
That’s another way of saying that the value of combin-
ing Splunk Enterprise’s real-time search with enriched
mapping and database integration can have a major
impact on nearly any type of company.
Using Splunk Software, They Got the Vision They NeededIn this use case, we explored how Splunk software
enables operational intelligence for a classic business
analytics problem: how to provide the best possible
data to executives so they can make informed business
decisions? This use case demonstrated:
Elimination of data silos. Because Splunk software
indexes all kinds of data, the customer’s reliance on
multiple reports and formats from varied systems was
eliminated and the customer was able to provide a
single source of truth to executives.
Correlations drive analytics. Because Splunk software
correlates different types of data, the customer could
link data from its CRM system to provide information on
a granular basis, including visual views on a Google Map.
Flexible analytics powered by a read-time schema. Because Splunk software keeps the data unstructured,
the customer doesn’t have to break any connections
in the data to make it fit in a schema. The customer no
longer has to spend significant time or resources on
answering follow-up questions for executives.