Embed Size (px)
Citation preview

Building A Fraud Building A Fraud Detection ModelDetection ModelBy Dr. Arthur L. By Dr. Arthur L.
DryverDryverEmail: Email: [email protected]@gmail.com
URL:URL: http://http://as.nida.ac.th/~dryveras.nida.ac.th/~dryver
National Institute of National Institute of Development Development
Administration (NIDA)Administration (NIDA)August 11August 11thth 2005 2005

First, Who Am I?First, Who Am I? Work Experience:Work Experience:
I am a lecturer at NIDA within the School of Applied I am a lecturer at NIDA within the School of Applied Statistics and I also teach in the School of Business Statistics and I also teach in the School of Business Administration. I started working at NIDA in October 2003.Administration. I started working at NIDA in October 2003.
I worked in the US for 4 yrs within consulting. Companies I I worked in the US for 4 yrs within consulting. Companies I worked for:worked for:
Experian, AnaBus, and PricewaterhouseCoopers (PwC)Experian, AnaBus, and PricewaterhouseCoopers (PwC) While working as a consultant I performed analyses on data from While working as a consultant I performed analyses on data from
various industries. various industries. For several projects I had to work with multiple files with For several projects I had to work with multiple files with
over a million records.over a million records. At Experian I had to create fraud detection models for At Experian I had to create fraud detection models for
clients. clients.
EducationEducation The Pennsylvania State UniversityThe Pennsylvania State University
Ph.D. in Statistics 1999Ph.D. in Statistics 1999 Dissertation Topic: Adaptive Sampling StrategiesDissertation Topic: Adaptive Sampling Strategies
Rice University Rice University BA in Mathematical Sciences/Statistics 1993BA in Mathematical Sciences/Statistics 1993

Data MiningData Mining
General statements about General statements about data mining.data mining.

Overview Of Data MiningOverview Of Data Mining
Unfortunately, there is not only one Unfortunately, there is not only one way to look at data mining, and the way to look at data mining, and the differences among the data mining differences among the data mining literature highlight this fact.literature highlight this fact.
I will give you my overview for a I will give you my overview for a typical project.typical project.
The Data The Technique The Presentation

1.1. What data do you have and can the data What data do you have and can the data answer the questions you have?answer the questions you have?
1.1. Do you have the data necessary to answer your Do you have the data necessary to answer your questions. questions.
2.2. Note: The data that you have to use partially Note: The data that you have to use partially determines the technique you will use for data determines the technique you will use for data analysis.analysis.
2.2. Garbage In Garbage Out (G.I.G.O.)Garbage In Garbage Out (G.I.G.O.)1.1. This is very important. What it means: You cannot This is very important. What it means: You cannot
expect to get good, reliable results with bad data.expect to get good, reliable results with bad data.
2.2. In other words: If the data is not good, not In other words: If the data is not good, not accurate, not reliable, etc. you cannot trust the accurate, not reliable, etc. you cannot trust the results.results.
The Data
The DataThe Data

The TechniqueThe Technique
There are many data mining techniques.There are many data mining techniques.1.1. There is often more than one technique that There is often more than one technique that
can be used to answer the same question.can be used to answer the same question.1.1. The results from the different techniques often do The results from the different techniques often do
not differ as much as one might believe.not differ as much as one might believe.
2.2. The technique is partially determined by the data The technique is partially determined by the data you have.you have.
2.2. Many techniques within the data mining Many techniques within the data mining literature can also be found within standard literature can also be found within standard statistics text books.statistics text books.
Data mining and statistics are both used to analyze Data mining and statistics are both used to analyze data in order to gain useful information.data in order to gain useful information.
The Technique

The PresentationThe Presentation The presentation is a very important part of data The presentation is a very important part of data
mining. Sometimes it can be the most important part of mining. Sometimes it can be the most important part of data mining.data mining.
1.1. A good presentation should support the findings not just A good presentation should support the findings not just mention the findings.mention the findings.
1.1. The supporting statistics, and graphs within the presentation can The supporting statistics, and graphs within the presentation can help people understand or confuse people.help people understand or confuse people.
2.2. Management will often rely on the presentation to understand the Management will often rely on the presentation to understand the findings from data mining.findings from data mining.1.1. Management needs to trust the findings, if the findings are presented Management needs to trust the findings, if the findings are presented
poorly, it is difficult to trust the findings.poorly, it is difficult to trust the findings.2.2. A poor presentation can even cause projects to fail. Management will A poor presentation can even cause projects to fail. Management will
not implement what they do not trust nor understand.not implement what they do not trust nor understand.
2.2. Unfortunately, many statisticians and computer scientists are Unfortunately, many statisticians and computer scientists are lacking in this critical area. lacking in this critical area.
They tend to merely look at the results and the numbers in the They tend to merely look at the results and the numbers in the computer output. computer output.
This makes many data analysis projects not as successful as they This makes many data analysis projects not as successful as they should be.should be. The poor presentation, explanation often leaves management unclear on The poor presentation, explanation often leaves management unclear on
how to understand and proceed with the findings from the project.how to understand and proceed with the findings from the project.
The Presentation

Building A Fraud Building A Fraud Detection ModelDetection Model
One project that uses data One project that uses data mining.mining.

What is Fraud?What is Fraud? Fraud:Fraud:
““A deception deliberately practiced in order to secure unfair A deception deliberately practiced in order to secure unfair or unlawful gain.” (Dictionary.com)or unlawful gain.” (Dictionary.com)
There are different types of fraud committed within There are different types of fraud committed within the credit industry. the credit industry.
The type of fraud we want to model determines the The type of fraud we want to model determines the data needed.data needed. This presentation will focus on the typical application credit This presentation will focus on the typical application credit
card fraud. card fraud. This will be defined as someone pretending to be someone else This will be defined as someone pretending to be someone else
in order to obtain credit and never pays. in order to obtain credit and never pays. We We will not coverwill not cover bust out fraud. bust out fraud.
Bust out fraud is when an individual fraudulently obtains credit. Bust out fraud is when an individual fraudulently obtains credit. The individual is a good customer for a period of time to obtain The individual is a good customer for a period of time to obtain higher levels of credit. When the credit is limit is high the individual higher levels of credit. When the credit is limit is high the individual will borrow the maximum amount possible and then not repay.will borrow the maximum amount possible and then not repay.
We We will not cover will not cover other types of fraud as well.other types of fraud as well. Should you have questions on any type of fraud please feel free to Should you have questions on any type of fraud please feel free to
ask after the presentation. ask after the presentation.
The Data
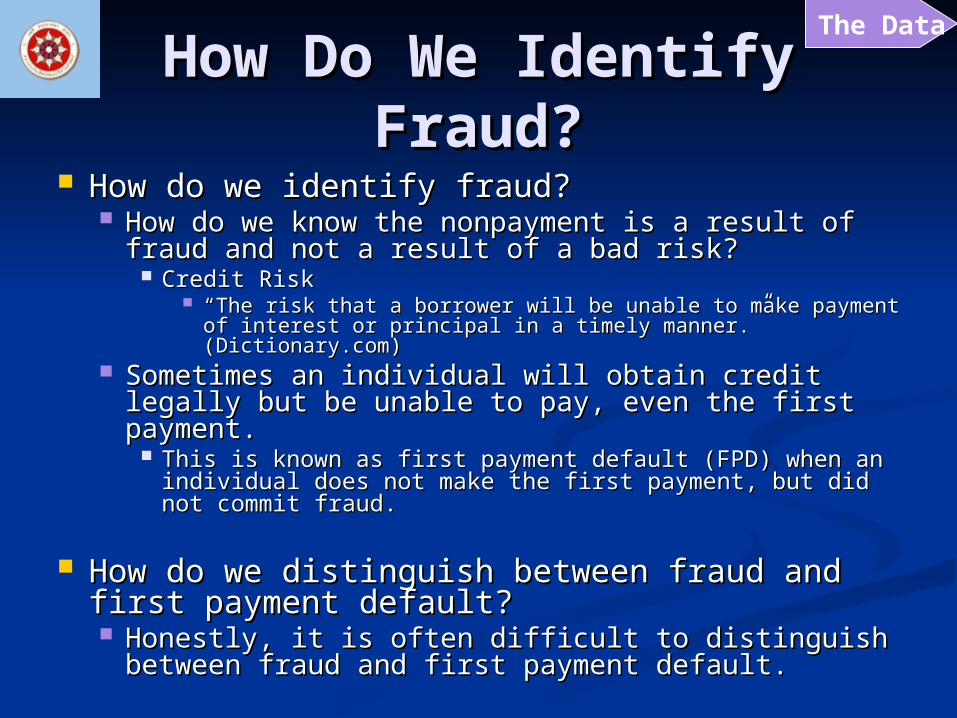
How Do We Identify How Do We Identify Fraud?Fraud?
How do we identify fraud?How do we identify fraud? How do we know the nonpayment is a result of How do we know the nonpayment is a result of
fraud and not a result of a bad risk?fraud and not a result of a bad risk? Credit RiskCredit Risk
““The risk that a borrower will be unable to make payment The risk that a borrower will be unable to make payment of interest or principal in a timely manner.” of interest or principal in a timely manner.” (Dictionary.com)(Dictionary.com)
Sometimes an individual will obtain credit legally Sometimes an individual will obtain credit legally but be unable to pay, even the first payment.but be unable to pay, even the first payment.
This is known as first payment default (FPD) when an This is known as first payment default (FPD) when an individual does not make the first payment, but did not individual does not make the first payment, but did not commit fraud.commit fraud.
How do we distinguish between fraud and How do we distinguish between fraud and first payment default?first payment default? Honestly, it is often difficult to distinguish Honestly, it is often difficult to distinguish
between fraud and first payment default.between fraud and first payment default.
The Data

Fraud Vs. RiskFraud Vs. Risk
Fraud and risk are trying to answer Fraud and risk are trying to answer two very different questions.two very different questions. As a result the data required to answer As a result the data required to answer
these questions differs as well.these questions differs as well. For fraud we desire identification data and For fraud we desire identification data and
credit information.credit information. Even the date of the data desired is different.Even the date of the data desired is different.
The most recent data is desired for fraud.The most recent data is desired for fraud.
For risk we desire prior credit information.For risk we desire prior credit information. Even the date of the data desired is different.Even the date of the data desired is different.
The flag (Good/Bad) should be present date, but the The flag (Good/Bad) should be present date, but the independent variables should be dated 6 to 12 independent variables should be dated 6 to 12 months prior.months prior.
The Data

Creating A Good Statistical Creating A Good Statistical ModelModel
Many techniques used to create a good Many techniques used to create a good statistical model are useful to create a fraud statistical model are useful to create a fraud detection model.detection model.
A good statistical model starts with good data.A good statistical model starts with good data.1.1. Again the old saying garbage in garbage out Again the old saying garbage in garbage out
(G.I.G.O.)(G.I.G.O.) What is my point with this statement: What is my point with this statement:
The message is that if the data collected is not good that the The message is that if the data collected is not good that the model is not expected to be good. model is not expected to be good.
Why is this of concern in fraud detection models?Why is this of concern in fraud detection models?1.1. We need to distinguish between fraud and first payment We need to distinguish between fraud and first payment
default. If we combine fraud with FPD it is like trying to create default. If we combine fraud with FPD it is like trying to create a single model to determine risk and fraud. a single model to determine risk and fraud. This can be done but it will create a model that does not This can be done but it will create a model that does not
work well on either risk or fraud. It is better to create two work well on either risk or fraud. It is better to create two separate models instead.separate models instead.
2.2. We need our independent data to also be accurate. We need our independent data to also be accurate. If our database determines the application contains If our database determines the application contains
incorrect information, it is important that this is not an incorrect information, it is important that this is not an error within the database.error within the database.
The Data

Why Create Separate Why Create Separate ModelsModels
Why not create a single model to eliminate all potential bad Why not create a single model to eliminate all potential bad clients?clients?
Why separate FPD from fraud in the data?Why separate FPD from fraud in the data? Why not a single model to identify fraud and risk together?Why not a single model to identify fraud and risk together?
Benefits of Creating Two ModelsBenefits of Creating Two Models1.1. Clearly identify which factors are indicators of fraud and which are Clearly identify which factors are indicators of fraud and which are
representative of risk.representative of risk.1.1. A large part of good model building is understanding why a variable A large part of good model building is understanding why a variable
belongs in the model. This is very difficult to do when you build a model belongs in the model. This is very difficult to do when you build a model to answer multiple issues, such as fraud and risk together.to answer multiple issues, such as fraud and risk together.1.1. Only with a lot of model building experience on fraud and risk separately would Only with a lot of model building experience on fraud and risk separately would
you be confident in statements about the variables.you be confident in statements about the variables.2.2. Some variables may be driven by both fraud and risk, but determining which, Some variables may be driven by both fraud and risk, but determining which,
fraud or risk, had a stronger influence on the variable selection would be fraud or risk, had a stronger influence on the variable selection would be difficult.difficult.
2.2. The losses due to fraud and risk are not the same. The losses due to fraud and risk are not the same. 3.3. The number of observations of fraud is often much lower than that of The number of observations of fraud is often much lower than that of
risk. Typical models built on risk use 10,000 observations of “bads” risk. Typical models built on risk use 10,000 observations of “bads” due to risk. Often it is difficult to obtain even 1,000 “bads” due to due to risk. Often it is difficult to obtain even 1,000 “bads” due to fraud.fraud.
1.1. Creating a model using 500 “bads” from fraud and 9,500 “bads” from risk Creating a model using 500 “bads” from fraud and 9,500 “bads” from risk would create a model that focuses on risk. would create a model that focuses on risk.
2.2. Creating a model using 500 “bads” from fraud and 500 “bads” from risk Creating a model using 500 “bads” from fraud and 500 “bads” from risk just to keep the numbers from fraud and risk equal is also not a good just to keep the numbers from fraud and risk equal is also not a good solution. solution.
The Data

Separating Fraud and Separating Fraud and FPDFPD
As stated earlier it is important to differentiate As stated earlier it is important to differentiate between FPD and fraud when building a fraud between FPD and fraud when building a fraud detection model.detection model.
In addition, we would remove the FPD data from the In addition, we would remove the FPD data from the model building process. model building process. In truth some FPD are probably unidentified fraud. In truth some FPD are probably unidentified fraud. If we treat FPD as non-fraud when building the model we If we treat FPD as non-fraud when building the model we
would have some frauds listed as both fraud and as non-fraud.would have some frauds listed as both fraud and as non-fraud. This is very bad to have when building a model.This is very bad to have when building a model.
The statistical model will contain variables to differentiate The statistical model will contain variables to differentiate between frauds and non-frauds. between frauds and non-frauds.
This will be more difficult to create if many frauds are labeled as non-This will be more difficult to create if many frauds are labeled as non-frauds.frauds.
The Data

Data RequiredData Required
Some of the data needed for fraud detection is Some of the data needed for fraud detection is different from that of risk.different from that of risk. Important data on fraud detection tends to be Important data on fraud detection tends to be
identification information. identification information. In the application for credit identification information is In the application for credit identification information is
collected. collected. The identification information is then comparable to a large The identification information is then comparable to a large
database containing people’s identification information. database containing people’s identification information. Difference between the identification information from the Difference between the identification information from the
application and that of the database are signs of potential application and that of the database are signs of potential fraud.fraud.
When building a risk model, identification information When building a risk model, identification information is not needed. With a risk model, it is believed the is not needed. With a risk model, it is believed the person is who he say he is, but the concern is that he person is who he say he is, but the concern is that he will not repay money borrowed.will not repay money borrowed.
The Data

Know The Data You HaveKnow The Data You Have Know your data.Know your data.
What is the percent of success in the dependent (fraud) What is the percent of success in the dependent (fraud) variable?variable?
What are the values of the independent data?What are the values of the independent data? Min, Max, Mean, Median. Min, Max, Mean, Median. Default valuesDefault values, are there any? How will you handle , are there any? How will you handle
these values?these values? Example of a default value: Age unknown given a value of Example of a default value: Age unknown given a value of
zero in the data.zero in the data. OutliersOutliers – do they exist? How will you handle these – do they exist? How will you handle these
values? values? The handling of outliers will depend on how you will use your model. The handling of outliers will depend on how you will use your model.
In practice often “capping” is used. Example, any number greater In practice often “capping” is used. Example, any number greater than the 99than the 99thth percentile is set equal to the 99 percentile is set equal to the 99thth percentile. percentile.
As with normal linear regression it is risky to extrapolate to values of As with normal linear regression it is risky to extrapolate to values of the independent variable that weren’t used in the model development.the independent variable that weren’t used in the model development.
The Data

What Technique To Use What Technique To Use To Detect Fraud? To Detect Fraud?
Honestly as stated earlier there is more than Honestly as stated earlier there is more than one way to build a model to detect fraud.one way to build a model to detect fraud. The standard at my old company was logistic The standard at my old company was logistic
regression.regression. Logistic regression is used when there is a binary Logistic regression is used when there is a binary
response variable, such as fraud.response variable, such as fraud. Binary response means there areBinary response means there are two possible outcomes. In two possible outcomes. In
our case fraud and not fraud.our case fraud and not fraud. Other possible techniques include decision trees and Other possible techniques include decision trees and
neural networks.neural networks. We felt and from some investigation that there was not an We felt and from some investigation that there was not an
advantage to the other techniques.advantage to the other techniques. In business: “Time is money”. In data mining we often do In business: “Time is money”. In data mining we often do
not have enough time to try all three and compare results. not have enough time to try all three and compare results. On a few projects though we compared results of other On a few projects though we compared results of other
techniques to logistic regression. There was no evidence techniques to logistic regression. There was no evidence that the other techniques were better than logistic that the other techniques were better than logistic regression.regression.
The Technique

Creating a Logistic Regression Creating a Logistic Regression ModelModel
Create an Estimation and Validation Sample. Create an Estimation and Validation Sample. This step is very important when creating a model to be This step is very important when creating a model to be
used in the future.used in the future. Validity – “The extent to which a measurement is Validity – “The extent to which a measurement is
measuring what was intended.” – Dictionary of measuring what was intended.” – Dictionary of Statistics B.S. Everitt. In other words does the model Statistics B.S. Everitt. In other words does the model truly differentiate between success and failure?truly differentiate between success and failure?
What is an Estimation and Validation Sample?What is an Estimation and Validation Sample? How many people have heard of a validation sample?How many people have heard of a validation sample? Oddly enough it was not covered much in graduate school, Oddly enough it was not covered much in graduate school,
more briefly mentioned.more briefly mentioned. A validation sample is necessary when building a model to A validation sample is necessary when building a model to
be used in practice.be used in practice. Validations are discussed much more greatly in fields that Validations are discussed much more greatly in fields that
apply statistics.apply statistics.
The Technique

Creating a Logistic Regression Creating a Logistic Regression ModelModel
What is an Estimation and Validation What is an Estimation and Validation Sample - continued?Sample - continued? Estimation sample - The sample used to determine Estimation sample - The sample used to determine
the parameters in the model.the parameters in the model. Validation sample – The sample used to determine Validation sample – The sample used to determine
if the model produces consistent results. Will it if the model produces consistent results. Will it perform well in practice, on another set of data? perform well in practice, on another set of data? The validation sample is another set of data used The validation sample is another set of data used to answer investigate this question.to answer investigate this question.
Note: If the data is biased in general then the Note: If the data is biased in general then the validation sample will not help in determining this. validation sample will not help in determining this. Example:Example:
No women in all your data. It is not possible to know what No women in all your data. It is not possible to know what will happen when the model is applied to all people. The will happen when the model is applied to all people. The validation sample has the same limitation as the estimation validation sample has the same limitation as the estimation sample, thus the validation sample is not informative here.sample, thus the validation sample is not informative here.
The Technique

Creating a Logistic Regression Creating a Logistic Regression ModelModel
Now that we know what an estimation and validation Now that we know what an estimation and validation sample is how do we create them?sample is how do we create them?
The easiest sampling method is simple random sampling.The easiest sampling method is simple random sampling. A more commonly used sampling design is stratified sampling.A more commonly used sampling design is stratified sampling.
Stratify your population into 2 groups, successes and failures.Stratify your population into 2 groups, successes and failures. When ample data is available sample 10,000 successes and When ample data is available sample 10,000 successes and
10,000 failures for the estimation and another 10,000 10,000 failures for the estimation and another 10,000 successes and 10,000 failures for the validation. Keep track successes and 10,000 failures for the validation. Keep track of proportion of successes in your population relative to the of proportion of successes in your population relative to the number of successes sampled. Do the same for failures.number of successes sampled. Do the same for failures.
Often there is not enough data, often you will not have 10,000 Often there is not enough data, often you will not have 10,000 frauds. Usually one group will have a lot and another group frauds. Usually one group will have a lot and another group will have very few. For the group with a lot you need not will have very few. For the group with a lot you need not sample beyond 10,000. This is an opinion, and it depends in sample beyond 10,000. This is an opinion, and it depends in part on how many variables you plan to use in your model.part on how many variables you plan to use in your model. In my opinion when data is rare, small in quantity:In my opinion when data is rare, small in quantity:
I create a larger estimation sample than validation sample. I create a larger estimation sample than validation sample. Personal preference, haven’t read anything but it is preferred Personal preference, haven’t read anything but it is preferred in practice.in practice.
The Technique

Creating a Logistic Regression Creating a Logistic Regression ModelModel
Many people feel with modern computers sampling Many people feel with modern computers sampling is not needed. Sampling is still needed:is not needed. Sampling is still needed:
1.1. Without sampling you would only have an estimation Without sampling you would only have an estimation sample and no validation sample.sample and no validation sample.
2.2. When dealing with millions of records, sampling can When dealing with millions of records, sampling can greatly aid in the speed of the analysis. greatly aid in the speed of the analysis.
1.1. Note: Many companies do not even have the latest and Note: Many companies do not even have the latest and greatest in terms of computers. Many consultants work on greatest in terms of computers. Many consultants work on their laptops, etc.their laptops, etc.
3.3. Ultimately, when the model finished it is run on the entire Ultimately, when the model finished it is run on the entire dataset.dataset.
The Technique

Variable SelectionVariable Selection
Variable Selection:Variable Selection: Often in practice we use brute force to create a model.Often in practice we use brute force to create a model.
Example: We have 500 variables or more and then try all in the Example: We have 500 variables or more and then try all in the model.model.
We use Stepwise Logistic Regression to eliminate most of We use Stepwise Logistic Regression to eliminate most of the variables and determine the best 15-20 or so most the variables and determine the best 15-20 or so most important variables.important variables.
Stepwise logistic regression is standard in most common Stepwise logistic regression is standard in most common software packages. software packages.
Honestly, in SAS for the speed we use a procedure called Honestly, in SAS for the speed we use a procedure called StepDisc first to come up with the first top 60 variables and StepDisc first to come up with the first top 60 variables and then do Stepwise Logistic Regression.then do Stepwise Logistic Regression.
Investigate the variables selected do they make sense.Investigate the variables selected do they make sense. For example: A mismatch with zip code on the application and For example: A mismatch with zip code on the application and
zip code in the database should have a positive relationship zip code in the database should have a positive relationship with the presence of fraud. A negative relationship would with the presence of fraud. A negative relationship would make us question the results.make us question the results.
The Technique

How Good Is the How Good Is the ModelModel How do we know if the model is a good How do we know if the model is a good
predictive model, or does it need more work?predictive model, or does it need more work? First what is good?First what is good?
Does the model distinguish/separate between the two Does the model distinguish/separate between the two groups (logistic 2 categories)groups (logistic 2 categories)
How do we tell if it is good?How do we tell if it is good? Does the model validate well?Does the model validate well? Do the statistics to test the model appear similar on the Do the statistics to test the model appear similar on the
estimation and validation samplesestimation and validation samples Most important of all: Does the model Most important of all: Does the model
distinguish/separate between the two groups (logistic 2 distinguish/separate between the two groups (logistic 2 categories)categories)
We will see what happens if we remove or change We will see what happens if we remove or change some of the less important variables in the model some of the less important variables in the model and compare results.and compare results.
We will cover ways to determine how good the We will cover ways to determine how good the model created is in the following slides.model created is in the following slides.
The Technique

How Good Is The How Good Is The Model:Model:
The KS StatisticThe KS Statistic What is the KS statistic?What is the KS statistic? It is the Kolmogorov-Smirnov two sample methodIt is the Kolmogorov-Smirnov two sample method ““A distribution free method that tests for any difference between A distribution free method that tests for any difference between
population probability distributions. The test is based on the population probability distributions. The test is based on the maximum absolute difference between the cumulative maximum absolute difference between the cumulative distribution functions of the samples from each population” – distribution functions of the samples from each population” – Dictionary of Statistics B.S. EverittDictionary of Statistics B.S. Everitt
A common statistic used to understand the predictive power of a A common statistic used to understand the predictive power of a model.model.
How does it work?How does it work? Two cumulative distribution functions can be created, one from Two cumulative distribution functions can be created, one from
the successes and one from the failures. From logistic regression the successes and one from the failures. From logistic regression we estimate the probability of success and the probability of we estimate the probability of success and the probability of failure. Consider the probabilities of failure as the “random failure. Consider the probabilities of failure as the “random variable” then from this we can create two cumulative variable” then from this we can create two cumulative distribution functions one for the successes and one for the distribution functions one for the successes and one for the failures. failures.
This will be illustrated on the next slide.This will be illustrated on the next slide.
The Technique

The KS StatisticThe KS Statistic
Score Category Good Loans Frauds10 10 109 10 108 10 107 10 106 10 105 10 104 10 103 10 102 10 101 10 10
Total 100 100
1st what is the KS statistic?
2nd does it look like this logistic model is predictive? Take a minute or two to think about this question.
A 10 is the lowest
probability of fraud and a 1 is
the highest probability of
fraud.
The Technique
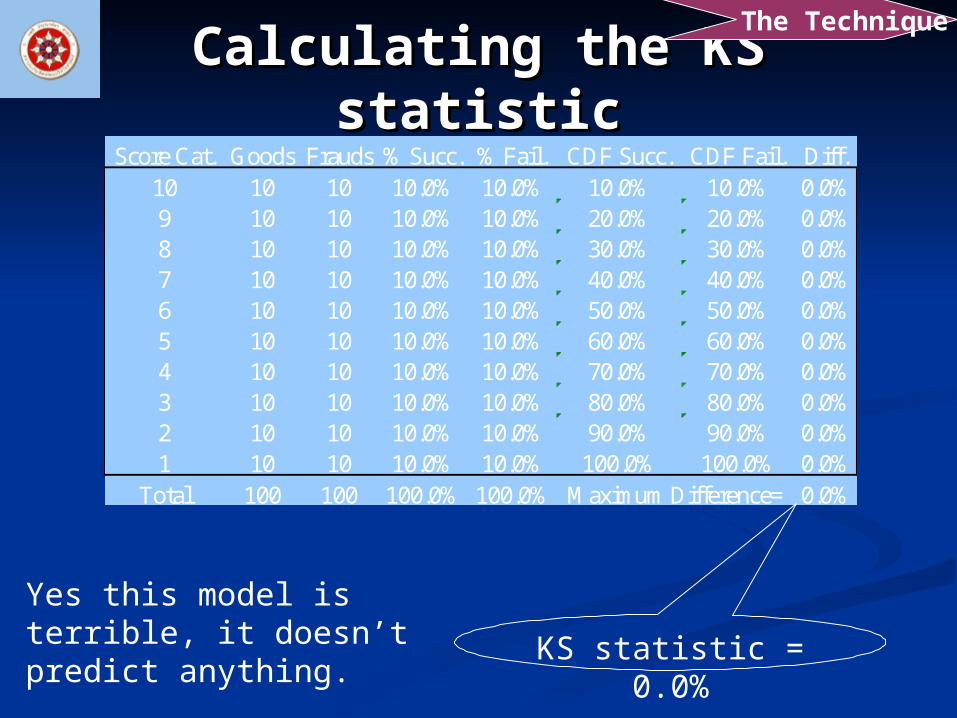
Calculating the KS statisticCalculating the KS statisticScore Cat. Goods Frauds % Succ. % Fail. CDF Succ. CDF Fail. Diff.
10 10 10 10.0% 10.0% 10.0% 10.0% 0.0%9 10 10 10.0% 10.0% 20.0% 20.0% 0.0%8 10 10 10.0% 10.0% 30.0% 30.0% 0.0%7 10 10 10.0% 10.0% 40.0% 40.0% 0.0%6 10 10 10.0% 10.0% 50.0% 50.0% 0.0%5 10 10 10.0% 10.0% 60.0% 60.0% 0.0%4 10 10 10.0% 10.0% 70.0% 70.0% 0.0%3 10 10 10.0% 10.0% 80.0% 80.0% 0.0%2 10 10 10.0% 10.0% 90.0% 90.0% 0.0%1 10 10 10.0% 10.0% 100.0% 100.0% 0.0%
Total 100 100 100.0% 100.0% 0.0%Maximum Difference=
KS statistic = 0.0%
Yes this model is terrible, it doesn’t predict anything.
The Technique

Example of a Non Example of a Non Predictive ModelPredictive Model
Credit Scores Total Number Cumulative Number of Number of Cumumalitive Cumumalitive TheCategory of Loans Percent Good Loans Frauds Percent Good Loans Percent Frauds Difference
10 200,000 10% 192,000 8,000 10.0% 10.0% 0.00%9 200,000 20% 192,000 8,000 20.0% 20.0% 0.00%8 200,000 30% 192,000 8,000 30.0% 30.0% 0.00%7 200,000 40% 192,000 8,000 40.0% 40.0% 0.00%6 200,000 50% 192,000 8,000 50.0% 50.0% 0.00%5 200,000 60% 192,000 8,000 60.0% 60.0% 0.00%4 200,000 70% 192,000 8,000 70.0% 70.0% 0.00%3 200,000 80% 192,000 8,000 80.0% 80.0% 0.00%2 200,000 90% 192,000 8,000 90.0% 90.0% 0.00%1 200,000 100% 192,000 8,000 100.0% 100.0% 0.00%
Total 2,000,000 1,920,000 80,000 0.00%K-S statistic = Maximum Difference =
Below is another example of a non predictive model using more realistic numbers. This data
assumes a 4% fraud rate.
The Technique

The KS StatisticThe KS Statistic
Score Category Good loans Frauds10 31 09 25 18 17 27 10 56 6 65 5 64 3 73 2 102 1 201 0 43
Total 100 100
Let us try again.
Does it look like this logistic model is predictive?
The Technique

The KS StatisticThe KS Statistic
Score Category Good loans Frauds10 31 09 25 18 17 27 10 56 6 65 5 64 3 73 2 102 1 201 0 43
Total 100 100
It does look predictiveA total 83 good
loans out of 100, 83%, were placed
into score categories 10-7.
A total 73 frauds out of 100, 73%, were placed into
score categories 3-1.
The Technique

Calculating theCalculating the KS KS StatisticStatistic
Score Cat Good Fraud % Succ. % Fail. CDF Succ. CDF Fail. Diff.10 31 0 31.0% 0.0% 31.0% 0.0% 31.00%9 25 1 25.0% 1.0% 56.0% 1.0% 55.00%8 17 2 17.0% 2.0% 73.0% 3.0% 70.00%7 10 5 10.0% 5.0% 83.0% 8.0% 75.00%6 6 6 6.0% 6.0% 89.0% 14.0% 75.00%5 5 6 5.0% 6.0% 94.0% 20.0% 74.00%4 3 7 3.0% 7.0% 97.0% 27.0% 70.00%3 2 10 2.0% 10.0% 99.0% 37.0% 62.00%2 1 20 1.0% 20.0% 100.0% 57.0% 43.00%1 0 43 0.0% 43.0% 100.0% 100.0% 0.00%
Total 100 100 100.0% 100.0% 75.00%Maximum Difference=
KS statistic = 75.0%
This is a very good model. You can see this, you don’t even need the KS statistic. This is an example of how important presentation is for understanding. The way in which we display the data allows us to quickly understand the predictive power of the model.
The Technique

How is it Applied?How is it Applied?
Great, so now what? How do we apply this? Take a minute to think.
Score Cat Good Fraud % Succ. % Fail. CDF Succ. CDF Fail. Diff.10 31 0 31.0% 0.0% 31.0% 0.0% 31.00%9 25 1 25.0% 1.0% 56.0% 1.0% 55.00%8 17 2 17.0% 2.0% 73.0% 3.0% 70.00%7 10 5 10.0% 5.0% 83.0% 8.0% 75.00%6 6 6 6.0% 6.0% 89.0% 14.0% 75.00%5 5 6 5.0% 6.0% 94.0% 20.0% 74.00%4 3 7 3.0% 7.0% 97.0% 27.0% 70.00%3 2 10 2.0% 10.0% 99.0% 37.0% 62.00%2 1 20 1.0% 20.0% 100.0% 57.0% 43.00%1 0 43 0.0% 43.0% 100.0% 100.0% 0.00%
Total 100 100 100.0% 100.0% 75.00%Maximum Difference=
The Technique

How is it Applied?How is it Applied?
Imagine the rejecting of all loan applicants that are placed into score category 1. You would eliminate 43% of the frauds and not loose a single good loan.
Score Cat Good Fraud % Succ. % Fail. CDF Succ. CDF Fail. Diff.10 31 0 31.0% 0.0% 31.0% 0.0% 31.00%9 25 1 25.0% 1.0% 56.0% 1.0% 55.00%8 17 2 17.0% 2.0% 73.0% 3.0% 70.00%7 10 5 10.0% 5.0% 83.0% 8.0% 75.00%6 6 6 6.0% 6.0% 89.0% 14.0% 75.00%5 5 6 5.0% 6.0% 94.0% 20.0% 74.00%4 3 7 3.0% 7.0% 97.0% 27.0% 70.00%3 2 10 2.0% 10.0% 99.0% 37.0% 62.00%2 1 20 1.0% 20.0% 100.0% 57.0% 43.00%1 0 43 0.0% 43.0% 100.0% 100.0% 0.00%
Total 100 100 100.0% 100.0% 75.00%Maximum Difference=
The Technique

How is it Applied?How is it Applied?Score Cat Good Fraud Cum Succ. Cum Fail.
Cum Odds
10 31 0 31 0 Inf
9 25 1 56 1 56.0
8 17 2 73 3 24.3
7 10 5 83 8 10.4
6 6 6 89 14 6.4
5 5 6 94 20 4.7
4 3 7 97 27 3.6
3 2 10 99 37 2.7
2 1 20 100 57 1.8
1 0 43 100 100 1.0
Total 100 100
An Estimate of odds
#
#
goododds
frauds
Interpret Cum Odds
Think about what it means when we cut off the bottom 21.5% in terms of the odds and our example on fraud.
The Technique

The PresentationThe Presentation A key to understanding is presentation. How do A key to understanding is presentation. How do
we view our results.we view our results. Visualization and presentation is very important.Visualization and presentation is very important.
It is important to know your audience.It is important to know your audience. Your audience determines how you will present what Your audience determines how you will present what
you learn from the logistic regression model.you learn from the logistic regression model. Senior management in a business is not interested in a Senior management in a business is not interested in a
theoretical data mining discussion. S/he is interested in theoretical data mining discussion. S/he is interested in how your fraud detection model will help the company.how your fraud detection model will help the company.
A fellow statistician would need less visualization as A fellow statistician would need less visualization as they already understand, but in my opinion a nice they already understand, but in my opinion a nice presentation of results can only help.presentation of results can only help.
We will next cover how to look at the variables We will next cover how to look at the variables that enter into your model.that enter into your model. This is very important for gaining trust in your work.This is very important for gaining trust in your work.
The Presentation

How Do We View the How Do We View the Independent Variables in Independent Variables in
the Model?the Model? It is important to interpret the variable in the It is important to interpret the variable in the model and then look at the variable model and then look at the variable individually compared to the dependent individually compared to the dependent variable.variable. Often the variable when viewed in the model might have Often the variable when viewed in the model might have
the opposite relationship with the dependent variable the opposite relationship with the dependent variable than it does when looked at separately.than it does when looked at separately.
This can result from multicollinearity.This can result from multicollinearity. Multicollinearity will not be covered.Multicollinearity will not be covered.
Often when creating a model, it is good to Often when creating a model, it is good to think about the variables that enter into the think about the variables that enter into the model and why they are entered. You may be model and why they are entered. You may be asked to explain why you choose to keep a asked to explain why you choose to keep a certain variable and use it in the model.certain variable and use it in the model. One way to investigate the independent variable’s One way to investigate the independent variable’s
relationship with the dependent variable is in the same relationship with the dependent variable is in the same way as when investigating the model.way as when investigating the model.
The Presentation
Sample Partial Sample Partial Presentation Of A Presentation Of A Fraud Detection Fraud Detection
ModelModelIncluded is only an Included is only an explanation of variables in explanation of variables in
the model and model the model and model validation.validation.
The Presentation

Most Important Factors For Most Important Factors For Detecting FraudDetecting Fraud
The Presentation
Relationship With Fraud The Variable+ Number of inquiries for credit in the past 6 months - Driver License Number Match- Zip Code Match- Age of Applicant- Gender
Etc. Etc.

Number Of Inquiries For Credit In The Past 6 Number Of Inquiries For Credit In The Past 6 MonthsMonths
The Presentation
0
3
Av
era
ge
Nu
mb
er
Of
Inq
uir
ies
Fraud 2.01
Good 1.43
This slide is showing that people with more inquiries (applications) for credit are more likely to be a victim of fraud. Perhaps some
of the inquiries for credit were made by someone attempting to commit fraud and not
the actual individual.

Number Of Inquiries For Credit In The Past 6 Number Of Inquiries For Credit In The Past 6 MonthsMonths
The Presentation
0
15
30
45
Pe
rce
nt
Of
Pe
op
le
Fraud 25 20 20 15 10 6 4
Good 35 25 20 10 5 3 2
0 1 2 3 4 5 6+
This slide is showing the same information as the previous slide. This slide is more
informative, but many people will think the previous slide is better and easier to
understand.Know your audience (who you present
to)!

Percent Match and Mismatch Percent Match and Mismatch Database On Driver License Database On Driver License
NumberNumber
The Presentation
0%
20%
40%
60%
80%
100%
Fraud 90% 10%
Good 96% 4%
Match MisMatch
People who are committing fraud are more likely to write
a driver license number on the application different from
the database you have.

Percent Match and Mismatch Percent Match and Mismatch Database On Zip CodeDatabase On Zip Code
The Presentation
0%
20%
40%
60%
80%
100%
Fraud 95% 5%
Good 98% 2%
Match MisMatch
People who are committing fraud are more likely to write a
zip code on the application different from the database you
have.

Average Age Of ApplicantAverage Age Of ApplicantThe Presentation
0
15
30
45
Av
era
ge
Ag
e In
Ye
ars
Fraud 31.5
Good 35.4
1
Younger people are more often victims of fraud.

Gender Of ApplicantGender Of ApplicantThe Presentation
0.00%
5.00%
Pe
rce
nt
Of
Ge
nd
er
Fraud 3.50% 4.50%
Male Female
Females are more often victims of fraud.

Gender Of ApplicantGender Of ApplicantThe Presentation
0.00%
100.00%
Pe
rce
nt
Of
Ge
nd
er
Fraud 3.50% 4.50%
Good 96.50% 95.50%
Male Female
Again there is more than one way to present the same thing.
Know your audience (who you present to)!
An More GraphsAn More Graphs
Those simple graphs would be Those simple graphs would be produced for all variables in the produced for all variables in the model.model.
The Presentation

Understanding The Fraud Understanding The Fraud Detection Model Detection Model
PerformancePerformanceCredit Scores Total Number Cumulative Number of Number of Cumulative
Category of Loans Percent Good Loans Frauds Odds
10 200,000 10% 196,596 3,404 57.89 200,000 20% 196,170 3,830 54.38 200,000 30% 195,745 4,255 51.27 200,000 40% 194,894 5,106 47.26 200,000 50% 194,043 5,957 43.35 200,000 60% 193,617 6,383 40.54 200,000 70% 192,766 7,234 37.73 200,000 80% 191,489 8,511 34.82 200,000 90% 190,213 9,787 32.01 200,000 100% 174,468 25,532 24.0
Total 2,000,000 1,920,000 80,000
The Presentation
By refusing the bottom 10% of applicants you can reduce fraud by
32% (25,532/80,000)
This Model has a KS of 25.82.
By refusing the bottom 10% you would have 32 good loans to
one fraud, before 24 good loans to one fraud.
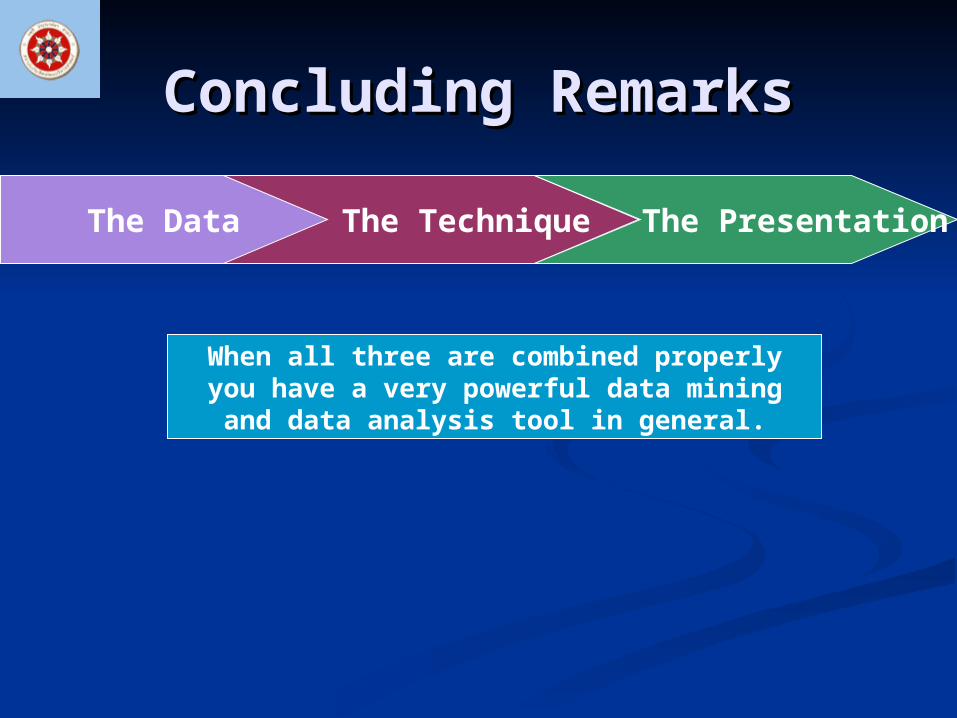
Concluding RemarksConcluding Remarks
The Data The Technique The Presentation
When all three are combined properly you have a very powerful data mining and
data analysis tool in general.